Embed Size (px)
Citation preview
MONTRÉAL 2014
REPORT
REPORT BY THE SECOND CAEPNOISE TECHNOLOGY INDEPENDENTEXPERT PANEL
NOVEL AIRCRAFT-NOISE TECHNOLOGYREVIEW AND MEDIUM- AND LONG-TERMNOISE REDUCTION GOALS
INTERNATIONAL CIVIL
AVIATION ORGANIZATION
Doc 10017


MONTRÉAL 2014
REPORT
REPORT BY THE SECOND CAEPNOISE TECHNOLOGY INDEPENDENTEXPERT PANEL
NOVEL AIRCRAFT-NOISE TECHNOLOGYREVIEW AND MEDIUM- AND LONG-TERMNOISE REDUCTION GOALS
INTERNATIONAL CIVIL
AVIATION ORGANIZATION
Doc 10017

Published in English by the INTERNATIONAL CIVIL AVIATION ORGANIZATION 999 University Street, Montréal, Quebec, Canada H3C 5H7 For ordering information and for a complete listing of sales agents and booksellers, please go to the ICAO website at www.icao.int Doc 10017, Report by the Second CAEP Noise Technology Independent Expert Panel: Novel Aircraft-Noise Technology Review and Medium- and Long-Term Noise Reduction Goals Order Number: 10017 ISBN 978-92-9249-401-8 © ICAO 2014 All rights reserved. No part of this publication may be reproduced, stored in a retrieval system or transmitted in any form or by any means, without prior permission in writing from the International Civil Aviation Organization.

Novel Aircraft Noise Technology Review
and Medium and Long Term Noise Reduction Goals
Report to CAEP by the CAEP Noise Technology Independent Expert Panel (IEP2)
Authors Magdy Adib – ECAA, Egypt
Fernando Catalano – University of San Paulo, Brazil Jim Hileman – FAA, USA
Dennis Huff – NASA, USA Takeshi Ito – JAXA, Japan
Alain Joselzon – Consultant, France Yuri Khaletskiy – CIAM, Russia
Ulf Michel – Consultant, Germany Luc Mongeau – McGill University, Canada
Brian J. Tester – Southampton University, UK

Page 2 of 182
Glossary .............................................................................................................................. 5 1. Executive Summary ........................................................................................................ 7
1.1 Introduction ........................................................................................................... 7 1.2 Background ........................................................................................................... 8 1.3 Remit ..................................................................................................................... 8 1.4 Aircraft Category Selection and Considerations ................................................... 8 1.5 Selection of Reference Aircraft ............................................................................ 9 1.6 Novel aircraft and engine concepts (IEP2 Tasks 1 & 2) ....................................... 9 1.7 Pilot Studies ........................................................................................................ 12 1.8 Environmental efficiency and other economic trade-offs (IEP2 Task 3) ........... 12 1.9 Conclusions & Recommendations ...................................................................... 13 1.9.0 Update of BPR projections and Noise Reduction Technology, Mid and Long term (IEP2 Task 4) .................................................................................................... 13 1.9.1 Mid Term – Year 2018 → 2020 ...................................................................... 17 1.9.2 Long Term – Year 2028 → 2030 ..................................................................... 17 1.9.3 Noise Reduction Benefit Goal Uncertainty ..................................................... 23 1.9.4 Final Noise Reduction Goal Recommendations Summary ............................. 25 1.9.5 Comparison with Research Programme Goals ................................................ 30 1.9.6 Benefits to Alternative Operations for Novel Aircraft .................................... 32 1.9.7 En route noise .................................................................................................. 32
2. Introduction ................................................................................................................... 35 2.1 Background ............................................................................................................. 35
2.1.1 IEP2 Novel Concepts ....................................................................................... 35 2.2 Remit ....................................................................................................................... 36 2.3 Conduct of the IE Review ....................................................................................... 36 2.4 Terms of Reference ................................................................................................. 36
2.4.1 IEP2 Tasks ....................................................................................................... 36 2.5 Additional Guidance ............................................................................................... 37
3. Scope of report .............................................................................................................. 38 3.1 IEP Report Preparation Preliminary Work ............................................................. 38 3.2 Goal Metrics ............................................................................................................ 38 3.3 Component Technology Classification ................................................................... 38 3.4 Noise Reduction Technology Primary Focus ......................................................... 38
4. Policy overview ............................................................................................................ 39 5. Research & Technology Assessment ............................................................................ 42
5.1 Noise Reduction Technologies – Medium Term .................................................... 42 5.1.1 Fan .................................................................................................................... 42 5.1.2 Jet ..................................................................................................................... 44 5.1.3 Airframe ........................................................................................................... 46 5.1.4 Core .................................................................................................................. 49 5.1.5 Nacelle & Liners .............................................................................................. 52
5.2 Noise Reduction Technologies – Long Term ......................................................... 54 5.2.1 Fan .................................................................................................................... 54 5.2.2 Jet ..................................................................................................................... 57 5.2.3 Airframe ........................................................................................................... 58 5.2.4 Core .................................................................................................................. 59 5.2.5 Nacelle & Liners .............................................................................................. 61
6. Noise reduction prospects ............................................................................................. 62 6.1 Aircraft Category Selection and Engine Bypass Ratio Projections ........................ 62
6.1.1 Aircraft Category Selection ............................................................................. 62

Page 3 of 182
6.1.1.1 IEP2 Review ................................................................................................. 63 6.1.2 Engine Bypass Ratio Projections ..................................................................... 64 6.1.3 IEP2 Engine Bypass Ratio Projections ............................................................ 65
6.2 Pilot Studies ............................................................................................................ 68 6.2.1 Introduction ...................................................................................................... 68 6.2.2 Pilot Study Specification .................................................................................. 69 6.2.2.1 IEP2 Update of Noise Reduction Technologies, Mid and Long term .......... 71 6.2.3 Pilot Study Results ........................................................................................... 73 6.2.4 Summary of Pilot Study Noise Reduction Technology results ....................... 77 6.2.5 IEP2 noise data sources (NASA, Boeing ERA & Lockheed ERA, MIT, NACRE) .................................................................................................................... 77
6.3 Assessment of noise reduction trends with bypass ratio (BPR) and Noise Reduction Technology (NRT) for conventional wing and tube configurations ............................. 88
6.3.1 Bypass Ratio Effects Methodology ................................................................. 88 6.3.2 Short/Medium Range Class ............................................................................. 88 6.3.2.1 IEP2 Short/Medium Range Class ................................................................. 89 6.3.3 Long Range Class ............................................................................................ 94 6.3.3.1 IEP2 Long Range Class ................................................................................ 94
6.4 Novel Engine & Airframe Concepts ..................................................................... 101 6.4.1 Propulsions Systems ...................................................................................... 101 6.4.2 Aircraft Systems ............................................................................................. 101 6.4.3 High-Wing Aircraft ........................................................................................ 103 6.4.4 ‗Functionally Silent‘ Aircraft Concept .......................................................... 104 6.4.5 IEP2 Novel aircraft and engine concepts ....................................................... 104
7. Recommended noise reduction goals .......................................................................... 107 7.1 Mid Term – Year 20182020 ............................................................................. 107
7.1.1 IEP2 Uncertainty Analysis ............................................................................. 109 7.2 Long Term – Year 2028 ........................................................................................ 109
7.1.2 IEP2 Long term - 2030 .................................................................................. 110 7.3 Medium and Long Term Summary ....................................................................... 111
7.3.1 IEP2 Final Noise Reduction Goal Recommendations ................................... 116 7.4 Comparison between IEP Targets and Research Goals ........................................ 121
7.4.1 IEP2 Comparison with Research Programme Goals ..................................... 125 8. Other considerations ................................................................................................... 127
8.1 Trade-offs .............................................................................................................. 127 8.1.1 Environmental efficiency and other economic trade-offs (IEP2 Task 3) ...... 128
8.2 Noise Abatement Operational Procedures ............................................................ 129 8.2.1 Benefits to Alternative Operations for Novel Aircraft (IEP2) ....................... 132
9. IEP2 En Route noise ................................................................................................... 133 10. References ................................................................................................................. 135
10.1 References – 2nd Aircraft Noise Technology Workshop Presentations, September 26, 2008 ....................................................................................................................... 135 10.2 References – Noise Technology Independent Experts Review Presentations, September 29-October 1, 2008 ................................................................................... 135 10.3 Independent Expert Panel Additional References .............................................. 135 10.4 IEP2 Additional References ................................................................................ 136
Appendix A ..................................................................................................................... 138 Assessment of noise reduction trends with bypass ratio (BPR) and Noise Reduction Technology (NRT) at each certification point ................................................................ 138
A.1 Noise Reduction at Approach .............................................................................. 138
Page 4 of 182
A.2 Noise Reduction at Flyover .................................................................................. 139 A.3 Noise Reduction at Lateral ................................................................................... 139 A.4 IEP2 Updates ........................................................................................................ 140
Appendix B ..................................................................................................................... 159 Uncertainty Estimates for Noise Reduction Goals ......................................................... 159
B.1 Engine Cycle Change Effects Uncertainties – Mid Term .................................... 159 B.2 Noise Reduction Technology Benefit Uncertainties – Mid Term ........................ 160 B.3 Combined Uncertainties in Cycle Change and NRT Benefit ............................... 161 B.4 Long-Term Cumulative Noise Benefit Uncertainty ............................................. 161 B.5 Noise Goal Uncertainty Assessment Summary ................................................... 162
Appendix C Reference Aircraft Selection – MTOM effect on Cumulative EPNL re: Chapter 4 ......................................................................................................................... 163 Appendix D ..................................................................................................................... 168 IEP2 Review of Novel Aircraft Concepts ....................................................................... 168
D.1 Introduction ...................................................................................................... 168 D.2 Definition of the configurations ....................................................................... 168 D.1.1 Conventional Tube and Wing Aircraft .......................................................... 168 D.1.2 Novel Tube and Wing Aircraft ..................................................................... 171 D.1.3 Tail-Less Aircraft .......................................................................................... 175 D.1.4 Engine Concepts ........................................................................................... 177
D.2. Selection of preferred configuration ................................................................... 178 Corrigenda (IEP1 only) ................................................................................................... 180 Corrigenda (IEP2 only) ................................................................................................... 182

Page 5 of 182
Glossary
ACARE Advisory Council for Aviation Research and Innovation in Europe
ADP Advanced ducted propulsor ANOPP Aircraft NOise Prediction Program AST Advanced Subsonic Technology program ATC Air traffic control ATF Advanced turbofan Axxx Airbus BPR Bypass ratio BPD Best Practices Database BWB Blended Wing Body Bxxx Boeing CAEP Committee on aviation environmental protection CDA Continuous decent approach CFD Computational Fluid Dynamics CLEEN Continuous Lower Energy, Emissions and Noise program CMC Ceramic Matrix Composite CNA Common Nozzle Assembly CRJ Canadair Regional Jet CROR CRTF
Counter rotating open rotor Counter rotating turbofan
Cum Cumulative noise (sum of the three certification levels in EPNdB), used to characterize noise margin vs. standards
DDF Direct drive fan dBA Unit of noise measurement in decibels with frequency
weighting A EASA European Aviation Safety Agency EIS Entry Into Service EPNdB Unit of the effective perceived noise level on a decibel scale EPNL Effective perceived noise level ERA Environmentally Responsive Aviation project FL Flight Level FMS Flight Management System GASP General Aviation Synthesis Program GDF Geared ducted fan GE General Electric GTF Geared turbofan HBPR High Bypass ratio IATA International Air Transport Association ICAO International Civil Aviation Organization ICCAIA International Coordinating Council of Aerospace Industries
Associations IEP Independent expert panel IER Independent expert review ILS Instrument Landing System LDI Lean direct injection LDMF Long Duct Mixed Flow (nacelle) LM Lockheed Martin

Page 6 of 182
LR2 Long range twin jets LR4 Long range quad jets LT Long term LTO Landing takeoff operations MODTF Modelling and Database Task Force MIT Massachusetts Institute of Technology MTOM Maximum takeoff mass MT Mid term NACRE New Aircraft Concepts REsearch NAP Noise Abatement operational Procedure NASA National Aeronautics and Space Administration NextGen Next Generation Air Transportation System NOx Nitrogen oxide NRT Noise reduction technology OPR (Engine) overall pressure ratio P&W/PWA Pratt and Whitney/Pratt & Whitney Aircraft PAS Propeller Analysis System QAT Quiet Aircraft Technology project QTD Quiet Technology Demonstrator RF Realization factor RJ Regional jets ROSAS Research on silent aircraft concepts project RR Rolls-Royce SA Single aisle SFW Subsonic Fixed Wing project SPL Sound Pressure Level SMR2 Short-medium range jets T/O Takeoff TA Twin aisle TAPS Twin annular premixing swirler TRL Technology readiness level TS Technology Scenario TSFC Total specific fuel consumption TSN Technology Scenario for Noise TTG Technology task group UDF Unducted fan UHB Ultra-high bypass (ratio) V2 Minimum safe airspeed VITAL EnVIronmTALly Friendly Aero Engines WG Working group WP Working Paper
Page 7 of 182
1. Executive Summary
1.1 Introduction This report summarizes the findings from a second Independent Expert Panel (IEP) review on aircraft noise. In the main body of the report, information from the first review is retained in black text for reference and new information from the second review has been appended at the end of the appropriate section in shaded text. In this section only the new information is summarised and is also shaded to be consistent with the main body of the report. The terminology used to distinguish the two reviews and panels are: IER or IER1 – First Independent Expert Review for CAEP/8 IEP or IEP1 – First Independent Expert Panel for first review
IER2 – Second Independent Expert Review for CAEP/9 IEP2 – Second Independent Expert Panel for second review
During the first review (IER1) the panel (IEP1) was asked not to consider novel aircraft concepts such as the Open Rotor or Blended Wing Body that were considered premature. A second review (IER2) was requested at the CAEP/8 meeting (Montreal, 1-12 February 2010) to evaluate new technological advances with implications for aircraft noise reduction (e.g. open rotor, geared turbofans, blended wing body, etc.) to align with goal dates of 2020 (mid term) and 2030 (long term), as well as coordinate the technical approach with other panels of independent experts. A formal review was held on November 28-29, 2012 in Farmington, Connecticut, USA. The second review panel (IEP2) consisted of the following members who were nominated and approved by the Steering Group and WG1:
Magdy Adib – ECAA, Egypt Fernando Catalano – University of San Paulo, Brazil Jim Hileman – FAA, USA Dennis Huff – NASA, USA Takeshi Ito – JAXA, Japan Alain Joselzon – Consultant, France Yuri Khaletskiy – CIAM, Russia Ulf Michel – Consultant, Germany Luc Mongeau – McGill University, Canada Brian J. Tester – Southampton University, UK
Dennis Huff was selected to chair the Panel, and Brian Tester and Ulf Michel were elected to be co-chairs. The IER2 focused on novel aircraft concepts with emphasis on open rotors and higher bypass ratio turbofans. Background presentations were given on the Independent Expert process, results from the IEP1 review, and an overview from a Fuel Burn IEP that completed a report in 2010 including novel aircraft concepts. ICCAIA members provided updates on research goals and technologies for noise reduction, ducted and un-ducted engine systems, and the realization factor that was used in the first review. A pilot

Page 8 of 182
study was presented for the open rotor. A request was made to include large turboprops in the IEP2 review, for which a pilot study was presented at a subsequent meeting on February 8-9, 2012. This meeting was held using a WebEx where people from the IEP2 and WG1 participated from several locations including Cologne (Germany), Cleveland (USA), and Montreal (Canada). An interim report was presented by the IEP2. Interim reports were also given by the IEP2 at a WG1 meeting on April 18, 2012 in Norrkoping, Sweden, and at a Steering Group meeting on July 11, 2012 in St. Petersburg, Russia. This executive summary reports key findings of the IEP2 after review of material presented by ICCAIA, the Fuel Burn IEP, and several organizations developing and evaluating novel aircraft concepts. While many of the findings from the IEP1 are still relevant, several of the noise reduction goals have been modified based on new information, particularly for the long term 2030 goals.
1.2 Background In addition to reducing aircraft noise, it is desirable to reduce the fuel burn and emissions. Novel concepts such as the open rotor have been shown to reduce fuel burn and carbon dioxide emissions below modern turbofan engines. These concepts were not considered during IER1 since there was not enough information available to conduct a thorough review. Over the past few years, model scale data have been obtained in several facilities in Europe and the United States. One of the primary objectives of IER2 is to evaluate novel concepts that can be certified by 2030, and comment on expected noise levels relative to advanced conventional turbofan and turboprop powered aircraft.
1.3 Remit The Independent Expert Panel (IEP2) was directed to carry out the following, per CAEP-Memo/80, Attachment A, dated January 21, 2011: Task 1 - Summarize the status of new technological advances (novel aircraft and engine concepts) (e.g., open rotor, geared turbofan, blended wing body, etc.) that can be brought to market within 10 years from the date of the review, as well as the 20-year prospects suggested by research progress, without disclosing commercially sensitive information; Task 2 - Assess the possibility of noise reduction for each technology (novel aircraft and engine concepts); Task 3 - Comment on the environmental efficiency, and other economic tradeoffs resulting from adopting the candidate technologies; and Task 4 - Recommend updated mid-term and long-term technology goals for reducing aircraft noise relative to the defined baseline, also considering an improved definition of the realization factor when applied to noise technology development.
1.4 Aircraft Category Selection and Considerations For the second review, the same aircraft categories were used with emphasis on the small/medium range twin and the long range twin since advanced study information was available and new aircraft/engine development are expected by 2030. The aircraft categories are defined as:
Page 9 of 182
1. Regional Jets (RJ) 2. Short-Medium Range Jets (SMR2) 3. Long Range Twin Jets (LR2) 4. Long Range Quad Jets (LR4)
Two new engine concepts were included in these studies; one called ―open rotor‖ and another called ―geared turbofan.‖ For the open rotor engines, only counter-rotating blades were considered and have been designated ―CROR‖ to distinguish the concept from single rotation turboprops. The geared turbofan is abbreviated ―GTF‖ and refers to ultra-high bypass (UHB) ratio turbofan engines. There was also interest in large turboprop aircraft with weights ranging from 35 to 53 tonnes, and seat classes ranging from 100 to 170, respectively. The IEP2 added large turboprops as a separate category for evaluating noise reduction technologies and projecting noise levels for future aircraft.
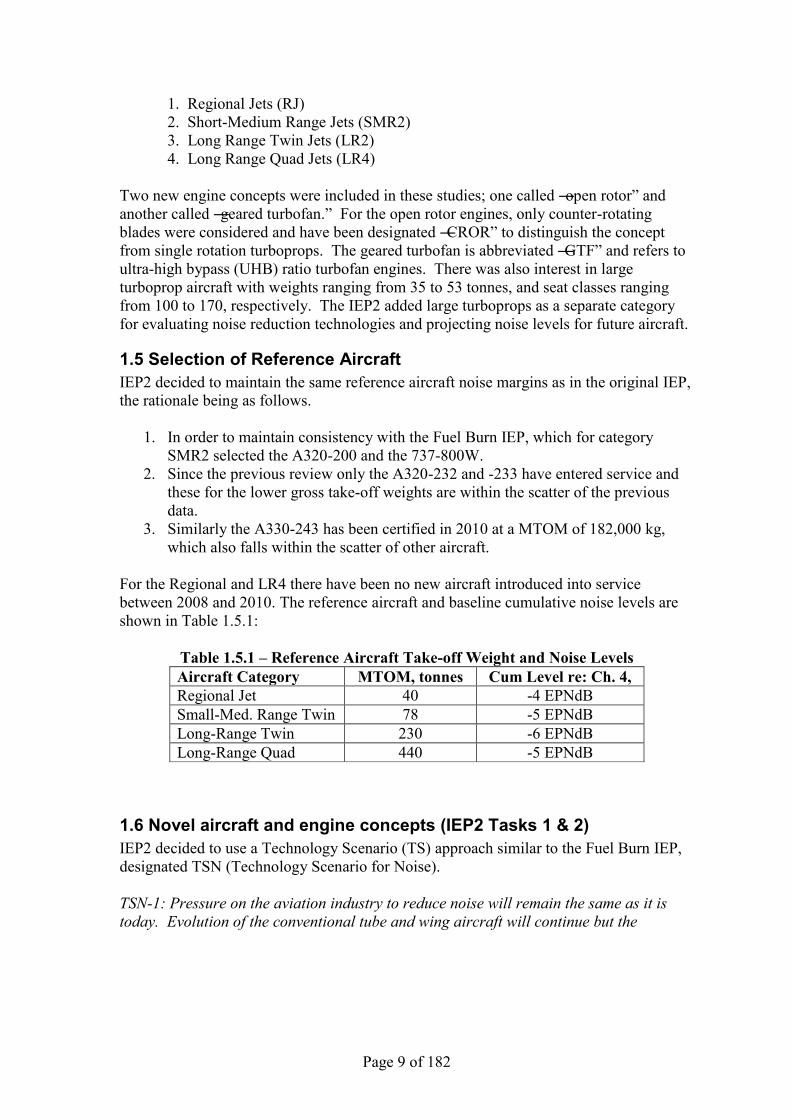
1.5 Selection of Reference Aircraft IEP2 decided to maintain the same reference aircraft noise margins as in the original IEP, the rationale being as follows.
1. In order to maintain consistency with the Fuel Burn IEP, which for category SMR2 selected the A320-200 and the 737-800W.
2. Since the previous review only the A320-232 and -233 have entered service and these for the lower gross take-off weights are within the scatter of the previous data.
3. Similarly the A330-243 has been certified in 2010 at a MTOM of 182,000 kg, which also falls within the scatter of other aircraft.
For the Regional and LR4 there have been no new aircraft introduced into service between 2008 and 2010. The reference aircraft and baseline cumulative noise levels are shown in Table 1.5.1:
Table 1.5.1 – Reference Aircraft Take-off Weight and Noise Levels Aircraft Category MTOM, tonnes Cum Level re: Ch. 4, Regional Jet 40 -4 EPNdB Small-Med. Range Twin 78 -5 EPNdB Long-Range Twin 230 -6 EPNdB Long-Range Quad 440 -5 EPNdB
1.6 Novel aircraft and engine concepts (IEP2 Tasks 1 & 2) IEP2 decided to use a Technology Scenario (TS) approach similar to the Fuel Burn IEP, designated TSN (Technology Scenario for Noise). TSN-1: Pressure on the aviation industry to reduce noise will remain the same as it is today. Evolution of the conventional tube and wing aircraft will continue but the
Page 10 of 182
pressure will be insufficient to launch any unconventional noise-driven aircraft concepts to higher Technology Readiness Level (TRL1).
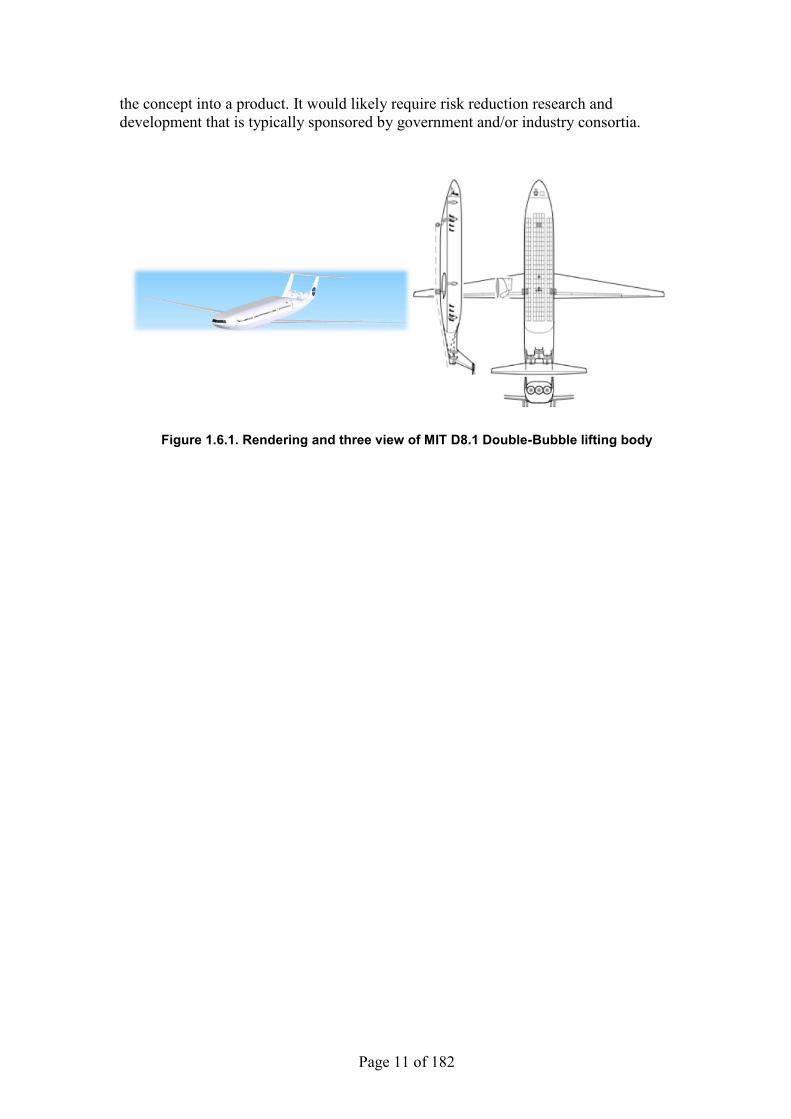
TSN-2: Increased pressure to reduce noise, but balanced with reduced fuel burn and reduced emissions. Noise reduction would be a primary design objective that may require unconventional aircraft concepts, such as those that incorporate engine noise shielding. Based on the IER2 and other open sources of information, it appears that most if not all novel concepts have been evaluated against a reference aircraft and mission corresponding to either the Short-medium range twin (SMR2) aircraft or the Long-range twin (LR2) aircraft. The current IEP2 review therefore focused on these two classes of aircraft. It is worth outlining first the rationale of the geared turbofan engine since it has become a common factor in many of the advanced designs aimed at low fuel burn, low noise and emissions. The geared turbofan (GTF) technology allows the fan to be operated at lower speed and the low-pressure turbine and low-pressure compressor at higher speeds. This reduces the number of stages required in the compressor and turbine, reducing engine weight and part count and maintenance costs. However, the weight benefit is partly offset by the weight of the required gearbox. The lower fan speed and lower pressure ratio improves fan efficiency and has a noise benefit. The higher turbine and compressor speeds increase the frequencies of compressor and turbine tones, which are strongly attenuated in the atmosphere. The GTF enables a minimum fuel-burn at higher bypass ratios, thus realising the associated increased propulsive efficiency. The counter-rotating open rotor (CROR) allows for even higher propulsive efficiencies by removing the duct and using counter-rotating blades to recover the swirl as the air passes through the engine. The tip speeds of the blades are lower than the fan speeds in turbofans, so the diameter of the engine needs to be larger to provide sufficient thrust. This concept was first investigated in the 1980‘s by General Electric and was called the Unducted Fan (UDF). There has been renewed interest in the concept over recent years due to the fuel burn and emissions reduction potential, but the noise levels are higher. Significant progress has been made to reduce the noise levels due to research efforts in Europe and the United States. The IEP2 concluded that in addition to the geared turbofan and open rotor, only a concept proposed by MIT called the ―D8.1 Double-Bubble‖ could be developed and brought into service by 2030 (see Figure 1.6.1) under TSN-2. The reasons for this are that the higher risk technology with higher risk, namely the integration of the fuselage and the propulsion system, is under study with wind tunnel testing as well as computational simulations. This work is being carried out by the MIT team under the US NASA N+3 Phase II contract. There were no technologies identified that could not be developed by 2030 although certification of the aft mounted engines would need to be addressed. The concept would require financial commitment and there are no current plans to develop 1 The two TRL levels mainly used in this report are 6 & 8: TRL6 – large scale validation of technologies in a relevant environment (i.e. flight test demonstrators, static engine tests, large wind tunnel tests). TRL8 – product noise certification tests
Page 11 of 182
the concept into a product. It would likely require risk reduction research and development that is typically sponsored by government and/or industry consortia.
Figure 1.6.1. Rendering and three view of MIT D8.1 Double-Bubble lifting body
Page 12 of 182
1.7 Pilot Studies The sources of noise data identified by IEP2 for the novel aircraft and engine concepts include Open Rotor data from the IER2 and NASA/GE, UHB data from NASA, Boeing ERA, Lockheed ERA, and MIT, with supporting information on shielding of tail mounted Open Rotor and UHB engines from NACRE. NASA conducted studies for the IEP2 comparing UHB and Open Rotor engine concepts for SMR2 aircraft. ICCAIA provided data for Open Rotor and large turboprops. In addition to these sources of information, IEP2 has conducted its own pilot studies of UHB turbofan and turboprop powered aircraft, as outlined below. IEP2 Pilot Study The IEP2 conducted its own pilot study of UHB engine powered conventional tube & wing aircraft in both the SMR2 and LR2 categories, by correlating existing noise certification data at each certification point, using an appropriate selection of the controlling physical parameters. Using these correlations the noise margins of UHB powered conventional tube & wing aircraft has been predicted over a range of BPR from just under 11 to nearly 18, for the SMR2 and LR2 categories and are included in charts described in section 1.9. Large Turboprop Study – IEP2 Assessment of Growth Q400 The IEP2 investigated the noise reduction potential for large turboprop aircraft. Turboprops are more fuel efficient than turbofans and there is a desire to use them on larger aircraft. ICCAIA presented results from a pilot study that investigated the noise levels for larger versions of turboprop aircraft. A baseline aircraft for the study was a Bombardier Q400 (EIS 2001, 72-79 passenger, 30 tonne MTOW) with a PW150A engine and a 6-bladed Dowty propeller. A possible new application is a 45 tonne MTOW turboprop that could be at TRL 8 by 2020. Noise reduction technologies included increasing the number of the propeller blades to eight, decreasing the propeller tip speed, and improving the engine inlet/compressor design. The IEP2 conducted independent studies of propeller noise and estimated the overall cumulative noise levels expected for larger turboprops. Open Rotor Study Similar to large turboprops, aircraft with open rotor engines can be significantly more fuel efficient than turbofans. The IEP2 used information from ICCAIA and NASA to evaluate open rotor noise. Only counter-rotating (CROR) blade concepts were considered for aircraft applications within the SMR2 category. Model scale wind tunnel data were used to assess the acoustic and aerodynamic performance. The results were used in a systems analysis study by NASA to compare CROR and UHB engines on SMR2 aircraft. ICCAIA used similar data to predict the CROR noise for aft mounted engines. Details about the studies and the results are described in section 6.2.5.
1.8 Environmental efficiency and other economic trade-offs (IEP2 Task 3) Trade-offs are intrinsic to aero-engines and aircraft design optimization processes. In particular, environmental trade-offs (Noise/NOx/CO2), linked to physical principles and associated with fuel efficiency, are major drivers for optimizing the aircraft/propulsion system design and configuration. This is combined with other general trade-offs, including other major areas (e.g. operations, regulations, research).

Page 13 of 182
This omnipresence of trade-offs is evidenced by the multiple key integration issues associated with the NRT‘s, by multiple interdependencies within and between design features and technologies. It is the case when comparing the relative advantages of GTF (geared turbofan), UHB (Ultra High Bypass) engine or open rotor engines, in terms of noise and fuel burn/emissions. On any combination of engine, nacelle and powerplant installation features, benefits and penalties must be weighed in terms of noise, fuel consumption/CO2 emissions, NOx emissions, weight and costs. Any product design must of course remain consistent with all major requirements, safety remaining on top as an overarching one. Environmental and economic trade-offs are very challenging to apprehend and analyse, due to complex, ―remote and entangled‖ features, evolving issues, and the lack of unique, universal criteria. Yet, it is crucial to make progress in understanding quantitative trade-offs for optimizing solutions based on selected criteria, and for perpetuating environmental benefits. This implies extensive analyses specific to each case. The novel configurations presented in Appendix D show that it may be possible to achieve significant gains in multiple areas of environmental efficiency, but additional research and development is required to reduce the risks associated with these designs. In the context of ICAO noise technology goals setting, trade-offs between noise and fuel efficiency/emissions raise a particular challenge, especially when dealing with the little explored territory of novel configurations where uncertainty bands are unavoidably large. Nevertheless, because of the very intrinsic nature of environmental and economic trade-offs within all aero-engine and aircraft design optimization processes, the studies used and the results contained in this report, including noise technology related goals, integrate and reflect to some extent the combined effect of multidimensional underlying trade-offs.
1.9 Conclusions & Recommendations The following summarizes the conclusions and recommendations arrived at by the IEP2, relative to the above CAEP-requested remit for the Panel.
1.9.0 Update of BPR projections and Noise Reduction Technology, Mid and Long term (IEP2 Task 4) The IEP1 report concluded that there are two major approaches to reducing aircraft noise that can contribute to both Mid-term and Long-term noise reduction goals, for conventional ‗tube and wing‘ aircraft with conventional turbofan propulsion. These are: (1) advanced noise reduction design features or Noise Reduction Technology (NRT) for the various components of both the propulsion system and the airframe, and (2) advances in propulsion system design which normally require increased Bypass Ratio (BPR) and therefore lower exhaust velocities. Based on the assessment presented at the IER2 and other considerations, the list of noise reduction technologies originally developed by the IEP1 has been updated and included in section 6.2.2.1.

Page 14 of 182
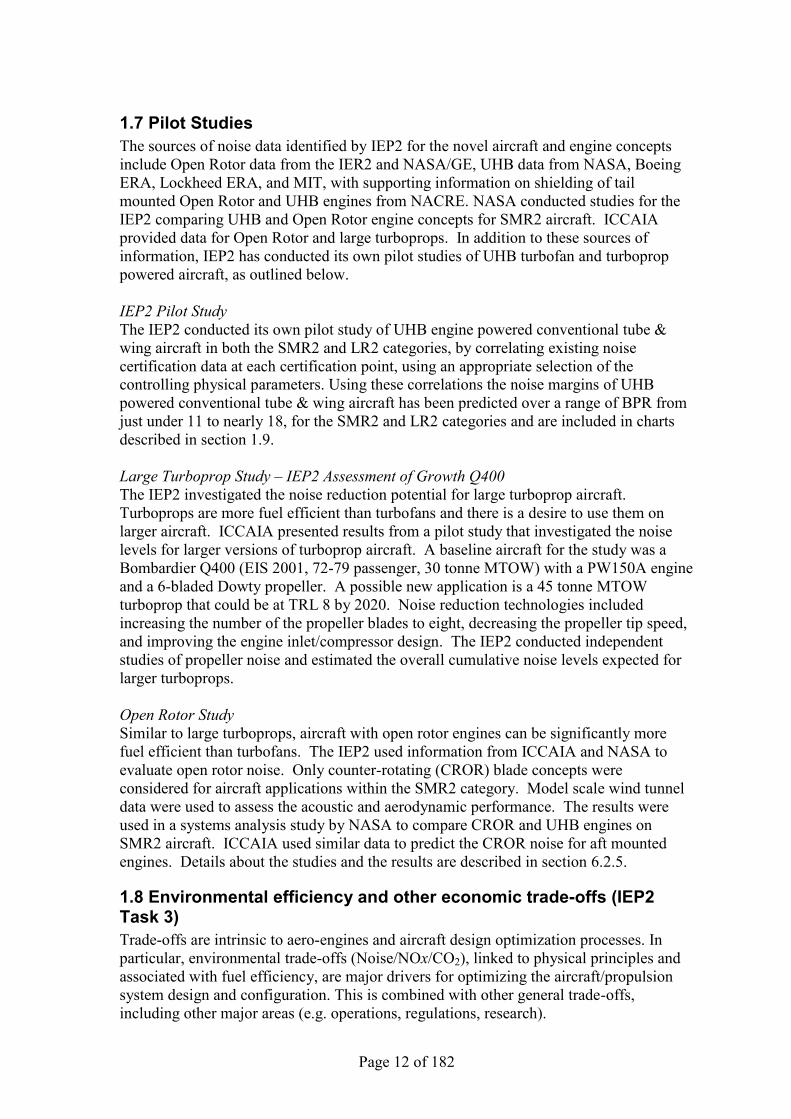
The IEP2 updated the BPR chart provided by ICCAIA for the first review. The original chart is shown in Figure 1.9.1 along with information available at the time of the IER2 review. This chart has been updated in Figure 1.9.2 for the SMR2 and LR2 aircraft classes. The actual BPR for aircraft that have been certified since the previous review are included, along with projections from the Fuel Burn IEP. For SMR2 aircraft, the IEP2 has increased the upper range of expected BPR from 10 to 13 for Long term goals. ICCAIA has concurred with this update.
Page 15 of 182
B787 Actual
B747 ActualIEP1 Mid-Term2018
IEP1 Long-Term2028
B787 Actual
B747 Actual
Fuel Burn IEP2020 & 2030
Figure 1.9.1: Projected Bypass ratio trends proposed by WG1, IEP1 and the Fuel Burn IEP plus recently certified aircraft

Page 16 of 182
1
SMR2 LR2
Bypass Ratio Range for Technology Scenarios
4
6
8
10
12
14
16
18
20
M
LM
L
M
L
ICCAIAMid-Term
2020
ICCAIALong-Term
2030SeaLevelStaticBypassRatio
IEP1Mid-Term
2018
IEP1Long-Term
2028
B787 Actual
Fuel Burn IEP2020 & 2030
IEP2 Mid-Term
2020
IEP2Long-Term
2030Most Likely Future Target Values
M
L
L
L
L
M
M MMM
L
L
Figure 1.9.2: Projected Bypass ratio trends proposed by WG1, the Fuel Burn IEP and IEP2 plus recently certified aircraft
Page 17 of 182
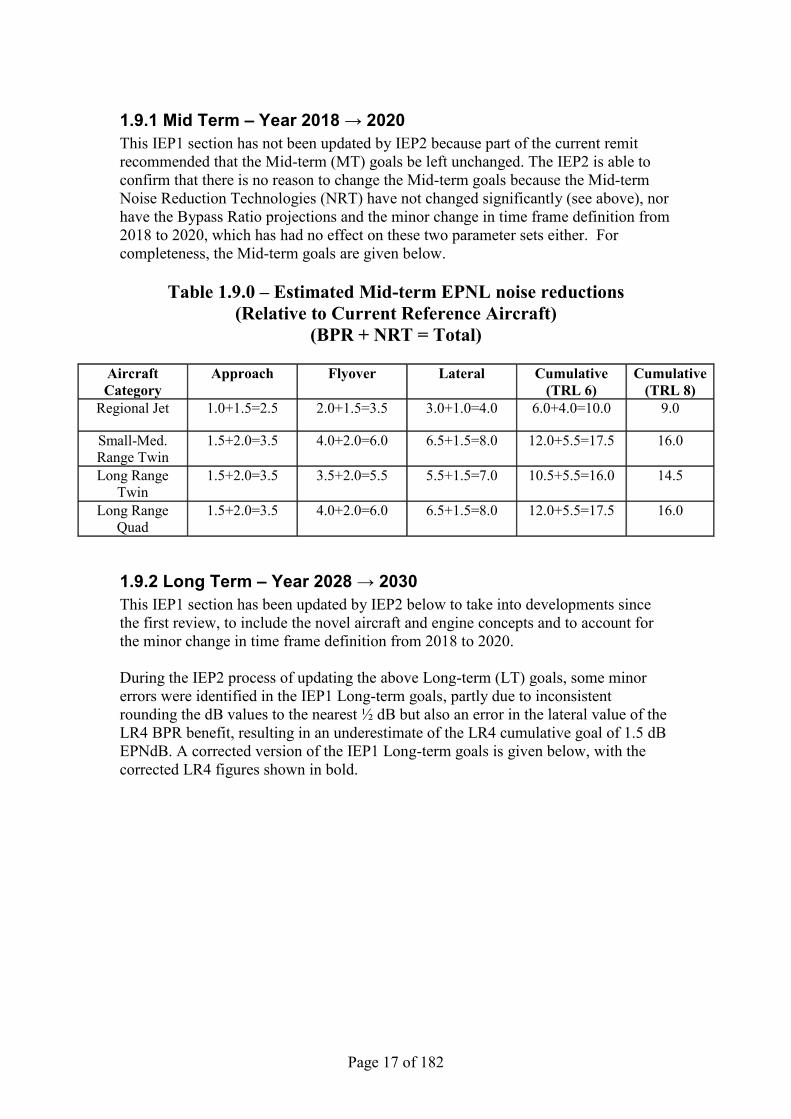
1.9.1 Mid Term – Year 2018 → 2020 This IEP1 section has not been updated by IEP2 because part of the current remit recommended that the Mid-term (MT) goals be left unchanged. The IEP2 is able to confirm that there is no reason to change the Mid-term goals because the Mid-term Noise Reduction Technologies (NRT) have not changed significantly (see above), nor have the Bypass Ratio projections and the minor change in time frame definition from 2018 to 2020, which has had no effect on these two parameter sets either. For completeness, the Mid-term goals are given below.
Table 1.9.0 – Estimated Mid-term EPNL noise reductions (Relative to Current Reference Aircraft)
(BPR + NRT = Total)
Aircraft Category
Approach Flyover Lateral Cumulative (TRL 6)
Cumulative (TRL 8)
Regional Jet 1.0+1.5=2.5 2.0+1.5=3.5 3.0+1.0=4.0 6.0+4.0=10.0 9.0
Small-Med. Range Twin
1.5+2.0=3.5 4.0+2.0=6.0 6.5+1.5=8.0 12.0+5.5=17.5 16.0
Long Range Twin
1.5+2.0=3.5 3.5+2.0=5.5 5.5+1.5=7.0 10.5+5.5=16.0 14.5
Long Range Quad
1.5+2.0=3.5 4.0+2.0=6.0 6.5+1.5=8.0 12.0+5.5=17.5 16.0
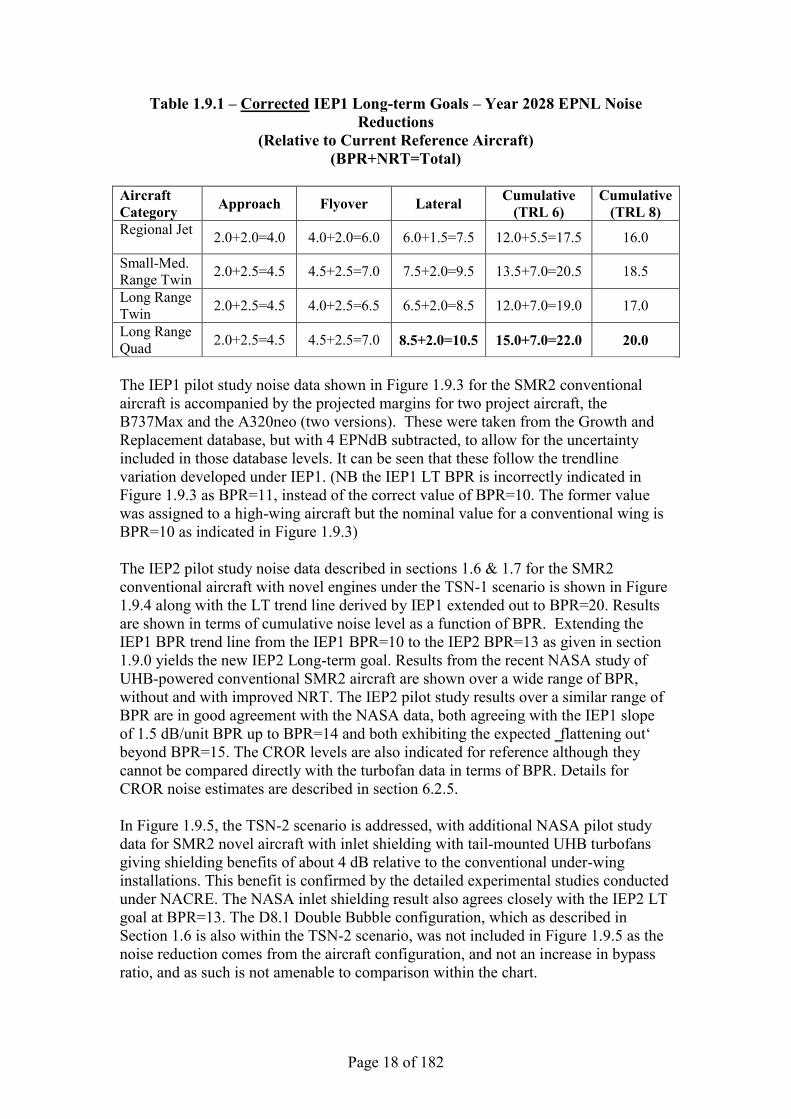
1.9.2 Long Term – Year 2028 → 2030 This IEP1 section has been updated by IEP2 below to take into developments since the first review, to include the novel aircraft and engine concepts and to account for the minor change in time frame definition from 2018 to 2020. During the IEP2 process of updating the above Long-term (LT) goals, some minor errors were identified in the IEP1 Long-term goals, partly due to inconsistent rounding the dB values to the nearest ½ dB but also an error in the lateral value of the LR4 BPR benefit, resulting in an underestimate of the LR4 cumulative goal of 1.5 dB EPNdB. A corrected version of the IEP1 Long-term goals is given below, with the corrected LR4 figures shown in bold.
Page 18 of 182
Table 1.9.1 – Corrected IEP1 Long-term Goals – Year 2028 EPNL Noise Reductions
(Relative to Current Reference Aircraft) (BPR+NRT=Total)
Aircraft Category Approach Flyover Lateral Cumulative
(TRL 6) Cumulative
(TRL 8) Regional Jet 2.0+2.0=4.0 4.0+2.0=6.0 6.0+1.5=7.5 12.0+5.5=17.5 16.0
Small-Med. Range Twin 2.0+2.5=4.5 4.5+2.5=7.0 7.5+2.0=9.5 13.5+7.0=20.5 18.5
Long Range Twin 2.0+2.5=4.5 4.0+2.5=6.5 6.5+2.0=8.5 12.0+7.0=19.0 17.0
Long Range Quad 2.0+2.5=4.5 4.5+2.5=7.0 8.5+2.0=10.5 15.0+7.0=22.0 20.0
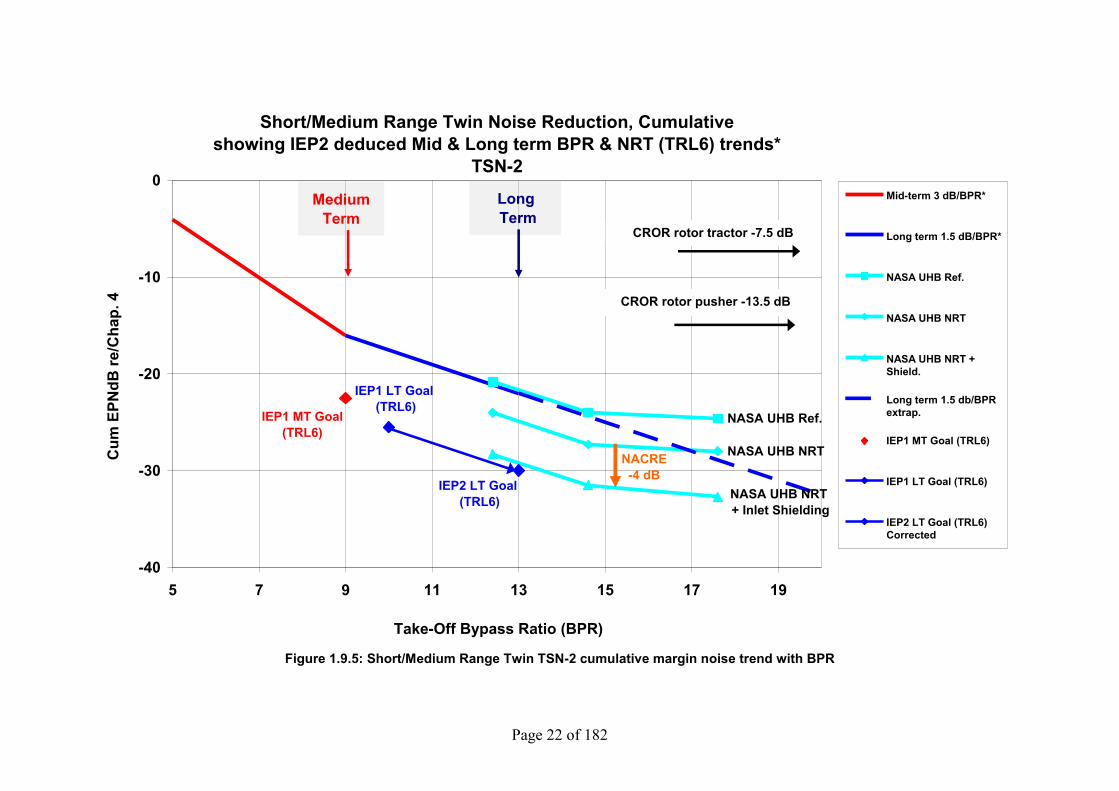
The IEP1 pilot study noise data shown in Figure 1.9.3 for the SMR2 conventional aircraft is accompanied by the projected margins for two project aircraft, the B737Max and the A320neo (two versions). These were taken from the Growth and Replacement database, but with 4 EPNdB subtracted, to allow for the uncertainty included in those database levels. It can be seen that these follow the trendline variation developed under IEP1. (NB the IEP1 LT BPR is incorrectly indicated in Figure 1.9.3 as BPR=11, instead of the correct value of BPR=10. The former value was assigned to a high-wing aircraft but the nominal value for a conventional wing is BPR=10 as indicated in Figure 1.9.3) The IEP2 pilot study noise data described in sections 1.6 & 1.7 for the SMR2 conventional aircraft with novel engines under the TSN-1 scenario is shown in Figure 1.9.4 along with the LT trend line derived by IEP1 extended out to BPR=20. Results are shown in terms of cumulative noise level as a function of BPR. Extending the IEP1 BPR trend line from the IEP1 BPR=10 to the IEP2 BPR=13 as given in section 1.9.0 yields the new IEP2 Long-term goal. Results from the recent NASA study of UHB-powered conventional SMR2 aircraft are shown over a wide range of BPR, without and with improved NRT. The IEP2 pilot study results over a similar range of BPR are in good agreement with the NASA data, both agreeing with the IEP1 slope of 1.5 dB/unit BPR up to BPR=14 and both exhibiting the expected ‗flattening out‘ beyond BPR=15. The CROR levels are also indicated for reference although they cannot be compared directly with the turbofan data in terms of BPR. Details for CROR noise estimates are described in section 6.2.5. In Figure 1.9.5, the TSN-2 scenario is addressed, with additional NASA pilot study data for SMR2 novel aircraft with inlet shielding with tail-mounted UHB turbofans giving shielding benefits of about 4 dB relative to the conventional under-wing installations. This benefit is confirmed by the detailed experimental studies conducted under NACRE. The NASA inlet shielding result also agrees closely with the IEP2 LT goal at BPR=13. The D8.1 Double Bubble configuration, which as described in Section 1.6 is also within the TSN-2 scenario, was not included in Figure 1.9.5 as the noise reduction comes from the aircraft configuration, and not an increase in bypass ratio, and as such is not amenable to comparison within the chart.

Page 19 of 182
Similar trends are observed for the Long Range Twin aircraft as described in section 6.3.3.1.

Page 20 of 182
Short/Medium Range Twin Noise Reduction, Cumulativeshowing IEP1 deduced Mid & Long term BPR & NRT (TRL6) trends*
Updated with current project aircraft
A320neo-Eng 1
A320neo-Eng 2
B737Max
IEP1 MT Goal (TRL6) IEP1 LT Goal
(TRL6)
-40
-30
-20
-10
0
5 7 9 11 13 15 17 19
Take-Off Bypass Ratio (BPR)
Cum
EPN
dB re
/Cha
p. 4
Pilot Study 1
Pilot Study 2
Mid-term 3 dB/BPR*
Long term 1.5 dB/BPR*
A320neo-Engine 1 (-4)
A320neo-Engine 2 (-4)
B737Max (-4)
IEP1 MT Goal (TRL6)
IEP1 LT Goal (TRL6)
NRT
NRT
Medium Term
Long Term
NRT
Figure 1.9.3: Short/Medium Range Twin IEP1 cumulative margin noise trends with BPR, updated to include B737Max and A320neo

Page 21 of 182
Short/Medium Range Twin Noise Reduction, Cumulativeshowing IEP2 deduced Mid & Long term BPR & NRT (TRL6) trends*
TSN-1
NASA UHB Ref.
NASA UHB NRT
IEP1 MT Goal (TRL6)
IEP1 LT Goal(TRL6)
IEP2 LT Goal(TRL6)
-40
-30
-20
-10
0
5 7 9 11 13 15 17 19
Take-Off Bypass Ratio (BPR)
Cum
EPN
dB re
/Cha
p. 4
Mid-term 3 dB/BPR*
Long term 1.5 dB/BPR*
NASA UHB Ref.
NASA UHB NRT
Long term 1.5 dB/BPRextrap.
IEP1 MT Goal (TRL6)
IEP2 Pilot
IEP1 LT Goal (TRL6)
IEP2 LT Goal (TRL6)Corrected
Medium Term
Long Term
CROR pusher -13.5 dB
CROR tractor -7.5 dB
Figure 1.9.4: Short/Medium Range Twin TSN-1 cumulative margin noise trend with BPR, with NASA UHB & IEP2 pilots, plus CROR levels
Page 22 of 182
Short/Medium Range Twin Noise Reduction, Cumulativeshowing IEP2 deduced Mid & Long term BPR & NRT (TRL6) trends*
TSN-2
NASA UHB Ref.
NASA UHB NRT
NASA UHB NRT + Inlet Shielding
IEP1 MT Goal (TRL6)
IEP1 LT Goal (TRL6)
IEP2 LT Goal (TRL6)
-40
-30
-20
-10
0
5 7 9 11 13 15 17 19
Take-Off Bypass Ratio (BPR)
Cum
EPN
dB re
/Cha
p. 4
Mid-term 3 dB/BPR*
Long term 1.5 dB/BPR*
NASA UHB Ref.
NASA UHB NRT
NASA UHB NRT +Shield.
Long term 1.5 db/BPRextrap.
IEP1 MT Goal (TRL6)
IEP1 LT Goal (TRL6)
IEP2 LT Goal (TRL6)Corrected
Medium Term
Long Term
NACRE-4 dB
CROR rotor tractor -7.5 dB
CROR rotor pusher -13.5 dB
Figure 1.9.5: Short/Medium Range Twin TSN-2 cumulative margin noise trend with BPR

Page 23 of 182
From the above-described information, for the Long Term (year 2030), the recommended aircraft noise reduction technology goals are shown in Table 1.9.2. Relative to the LT IEP1 goals, the RJ and LR4 are unchanged, but the SMR2 and LR2 goals have reduced by 4.5 dB and 3 dB respectively due to the projected increase in BPR (BPR values are included in the table).
Table 1.9.2 - Long-term Goals – Year 2030 EPNL Noise Reductions
(Relative to Current Reference Aircraft) (BPR+NRT=Total)
Aircraft Category
BPR IEP1
BPR IEP2 Approach Flyover Lateral Cumulative
(TRL 6) Regional Jet 9 9 2.0+2.0=4.0 4.0+2.0=6.0 6.0+1.5=7.5 12.0+5.5=17.5
Small-Med. Range Twin 10 13 2.5+2.5=5.0 5.0+2.5=7.5 10.0+2.0=12.0 18.0+7.0=25.0
Long Range Twin 11 13 2.5+2.5=5.0 4.5+2.5=7.0 8.0+2.0=10.0 15.0+7.0=22.0
Long Range Quad 11 11 2.0+2.5=4.5 4.5+2.5=7.0 8.5+2.0=10.5 15.0+7.0=22.0
The cumulative noise goals listed in Table 1.9.2 are at TRL6 only. The SMR2 cumulative BPR value is 18.0, where the sum of the three certification points is 17.5 due to rounding the numbers to the nearest 0.5 dB.
1.9.3 Noise Reduction Benefit Goal Uncertainty The uncertainty for novel aircraft concepts is expected to be higher since i) the level of maturity is lower, ii) the number of uncertainty factors is larger, iii) the magnitude of some uncertainty factors may be larger, and iv) test vehicles do not exist that can validate the noise predictions. The IEP2 decided to use the same uncertainty values from the IEP1 for Mid-term goals and Long-term goals with conventional engine installation but the values have been rounded to ±4 EPNdB cum, which is based on input from ICCAIA that this agrees well with uncertainty design margins used by industry. Larger uncertainty values are recommended when considering long term, novel aircraft with advanced technologies. ICCAIA presented recommendations that show a correlation between TRL and uncertainty values for novel aircraft concepts. The IEP2 agrees with these recommendations. While the example given in Figure 1.9.6 is for counter-rotating open rotors (CROR), the IEP2 recommends using the same uncertainty values for long term TSN-2 aircraft concepts. The skewed uncertainty distribution was inferred from a list of factors provided by ICCAIA that contribute to variability in noise levels as a function of TRL. The IEP2 observed that there is a higher probability of the noise levels being higher compared to the number of factors that could decrease the noise. For the CROR, the nominal value is predicted to be -13.5 EPNdB cum under Chapter 4 and remains the same from TRL 4 to TRL 6 based on experience from the GE UnDucted Fan (UDF) flight demos.

Page 24 of 182
16
Open Rotor Technology Development & Noise Predictions
3 4 5 6 7 82 Yrs 2 Yrs 5 Yrs 1 Yr 6 YrsTechnology Readiness Level (TRL)
Preliminary Studies &Wind Tunnel Tests
Concept Definition &Flight Demos
Product DevelopmentEntryInto
Service
Cum Margin for 78 Tonne SMR2 Aircraft Relative to Chapter 4 with Estimated Uncertainties
-10
-20
EPN
dB
0
Current StatusExpected NoiseLevels At TRL 6
-5.5
-15.5-13.5
Pusher
-7.5
-15.5
*** -13.5
Pusher
+2.5
-9.5** Tractor
-7.5
* Notional pusher configuration shown above.
** No known plans for higher TRL development of tractor configurations.
*** Nominal value judged by IEP2 to be the same from TRL4 to TRL6 based on experience from GE UnDucted Fan (UDF) flight tests.
Figure 1.9.6: Uncertainty recommendations for long term novel aircraft concepts
Page 25 of 182
1.9.4 Final Noise Reduction Goal Recommendations Summary Realization Factor The IEP2 reviewed the Realization Factor (RF) that was used by IEP1 and the proposal from ICCAIA that was presented at IER2. There were varying opinions on the correct way to develop and use the RF. The IEP1 reported that using a value of 90% was somewhat arbitrary since it was difficult to quantify due to a lack of data. The IEP2 agrees that there will be some degradation of noise reduction when products are developed from TRL6 to TRL8. The current experience is based on turbofan and turboprop powered aircraft. Since one of the primary objectives of the IER2 is to comment on long term technologies that include unconventional engine installations, it is doubtful that the past experience will be applicable especially for CROR propulsion systems. Furthermore, the IEP2 feels that it is not possible to determine the RF for CROR aircraft at a TRL8 since there has not been any development for the concept beyond TRL6. Therefore it is the view of the panel that the scope of the review will be limited to TRL6 for long term novel aircraft configurations. This recommendation was accepted by ICCAIA at a meeting held with the IEP2 on February 8-9, 2012. Noise Goals Tables 1.9.3 and 1.9.4 below give the Panel recommendations for Mid-term and Long-term Cumulative Noise Margin Goals relative to Chapter 4, with their uncertainty factors. The tables show the nominal aircraft weight and the expected maximum weight using the same MTOM range suggested by the N24 Task Group of WG1 and utilized by IEP1 for turbofans. For propeller powered aircraft, ICCAIA provided input on the expected weight ranges to be 35 to 53 tonnes for large turboprops, and 58.5 to 91 tonnes for CROR. Note that CROR aircraft were only considered for the long-term and larger turboprops were only evaluated for the mid-term. The sensitivity to weight within each aircraft category were estimated using the nominal values and assuming a slope of 67×log10(MTOM) for turbofans, 60×log10(MTOM) for large turboprops, and 74×log10(MTOM) for CROR. The Mid-term and Long-term goals, with their uncertainty bands and sensitivity to weight, are illustrated in Figures 1.9.7 and 1.9.8, respectively.

Page 26 of 182
Aircraft Category BPR Goal
NR TRL6 EPNdB
NR TRL8 EPNdB
Cum Margin Ref a/c
Re Ch. 4 EPNdB
Cum margin Goal TRL6
Re Ch. 4 EPNdB
Cum Goal TRL8
Regional Jet (RJ) 40 tonnes (nominal)
50 tonnes (max) 7±1 7±1
10 10
9 9
4 -0.5
14 9.5
13±4 8.5±4
Large Turboprops
45 tonnes (nominal) 53 tonnes (max)
- -
9.5 9.5
9 9
3 0.5
12.5 10
12±4 9.5±4
Short Medium Range Twin (SMR2) Turbofans: 78 tonnes (nominal)
98 tonnes (max) CROR: 78 tonnes (nominal)
91 tonnes (max)
9±1 9±1
- -
17.5 17.5
- -
16 16 - -
5 1.5 - -
22.5 19 - -
21±4 17.5±4
- -
Long Range Twin (LR2) 230 tonnes (nominal)
290 tonnes (max) 10±1 10±1
16 16
14.5 14.5
6 2.5
22 18.5
20.5±4 17±4
Long Range Quad (LR4) 440 tonnes (nominal)
550 tonnes (max) 9±1 9±1
17.5 17.5
16 16
5 -1.5
22.5 16
21±4 14.5±4
Table 1.9.3: Mid Term Goal Summary

Page 27 of 182
Aircraft Category BPR Goal
NR TRL6 EPNdB
NR TRL8 EPNdB
Cum Margin Ref a/c
Re Ch. 4 EPNdB
Cum margin Goal TRL6
Re Ch. 4 EPNdB
Cum Goal TRL8
Regional Jet (RJ) 40 tonnes (nominal)
50 tonnes (max) 9±1 9±1
17.5 17.5
- -
4 -0.5
21.5±4 17±4
- -
Large Turboprops 45 tonnes (nominal)
53 tonnes (max) - -
- -
- -
- -
- -
- -
Short Medium Range Twin (SMR2)
Turbofans: 78 tonnes (nominal) 98 tonnes (max)
CROR: 78 tonnes (nominal) 91 tonnes (max)
13±1 13±1
- -
25 25 8.5 8.5
- - - -
5 1.5 5 2
30±4 26.5±4
*13.5+2/-6 **10.5+2/-6
- - - -
Long Range Twin (LR2) 230 tonnes (nominal)
290 tonnes (max) 13±1 13±1
22 22
- -
6 2.5
28±4 24.5±4
- -
Long Range Quad (LR4) 440 tonnes (nominal)
550 tonnes (max) 11±1 11±1
22 22
- -
5 -1.5
27±4 20.5±4
- -
*CROR cumulative margin with uncertainties range from 7.5 to 15.5 EPNdB for 78 tone nominal weight aircraft. ** CROR cumulative margin with uncertainties range from 4.5 to 12.5 EPNdB for 91 tone maximum weight aircraft.
Table 1.9.4: Long Term Goal Summary

Page 28 of 182
Mid Term (2020) Cumulative Noise Goals at TRL8
240
250
260
270
280
290
300
310
10 100 1000
Max. Takeoff Mass (Tonnes)
Cum
ulat
ive
Noi
se L
evel
, EPN
dBChapter 4 LimitMid-Term Goal for TurbofansMid-term Upper Bound
Mid-term Lower BoundLarge Turboprop Goals
LR4
LR2
SMR2RJ
Figure 1.9.7: IEP2 Mid-term Goals at TRL8

Page 29 of 182
240
250
260
270
280
290
300
310
10 100 1000
Cum
ulat
ive
Noi
se L
evel
, EPN
dB
Max. Takeoff Mass (Tonnes)
Long Term (2030) Cumulative Noise Goals at TRL6
Chapter 4 Limit
Long-Term Goal for Turbofans
Long-term Upper Bound
Long-term Lower Bound
Long-Term CROR Goal
LR2
RJSMR2
LR4
Figure 1.9.8: IEP2 Long Term Goals at TRL6

Page 30 of 182
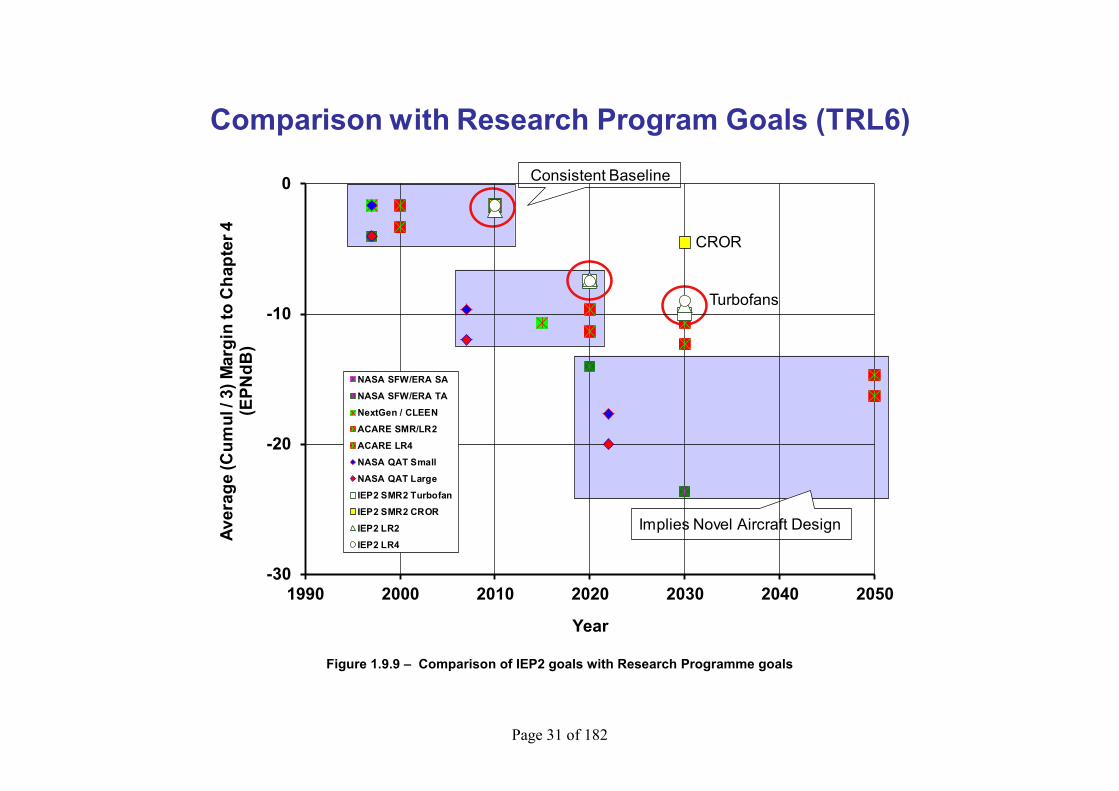
1.9.5 Comparison with Research Programme Goals The mid-term and long-term goals described above are compared with the goals of current research programmes in Figure 1.9.9. The noise values are shown as an average of the cumulative noise margins relative to Chapter 4. The baseline noise levels are consistent between the IEP recommendations and the research programs. The expected nominal noise level for a CROR SMR2 aircraft is shown separate from the turbofan powered aircraft. The estimated noise reduction for the D8.1 Double Bubble aircraft, which could be developed within the TSN-2 scenario, is consistent with the NASA SFW/ERA goals within the region labelled, ―novel aircraft design.‖ Research programme goals, especially for the long term, need to be aggressive enough to ensure a sustained commitment in intensive, properly resourced, research programs. This is needed to efficiently cope with unforeseen obstacles and effects, inevitable compromises and re-orientations that are bound to occur when exploring new novel aircraft configurations. Such goals therefore need to provide a reserve margin. IEP recommended goals for CAEP are assuming also the use of best knowledge, practices and means, but they need to stick ultimately to the best expectation, integrating all the uncertainty factors. Unsurprisingly, such goals tend therefore to show up slightly less aggressive than the research goals (or their achievement slightly delayed in time).
Page 31 of 182
Comparison with Research Program Goals (TRL6)
Implies Novel Aircraft Design
CROR
Turbofans
Consistent Baseline
-30
-20
-10
0
1990 2000 2010 2020 2030 2040 2050
Aver
age
(Cum
ul /
3) M
argi
n to
Cha
pter
4(E
PNdB
)
Year
NASA SFW/ERA SA
NASA SFW/ERA TA
NextGen / CLEEN
ACARE SMR/LR2
ACARE LR4
NASA QAT Small
NASA QAT Large
IEP2 SMR2 Turbofan
IEP2 SMR2 CROR
IEP2 LR2
IEP2 LR4
Figure 1.9.9 – Comparison of IEP2 goals with Research Programme goals

Page 32 of 182
1.9.6 Benefits to Alternative Operations for Novel Aircraft The IEP2 did not investigate alternative aircraft trajectories and operations for reducing community noise. However, one of the novel aircraft concepts (Lockheed-Martin ―Box Wing‖) considers increasing the approach glide slope from the traditional 3 degrees to 6 degrees. This was made possible by the increase in lift from the new wing configuration. The impact on approach noise was substantial, estimates show that 7 to 8 EPNdB noise reduction is possible. Since the airframe noise reduction technologies are difficult to implement and typically do not provide this magnitude of noise reduction, alternative operations should be explored for novel aircraft.
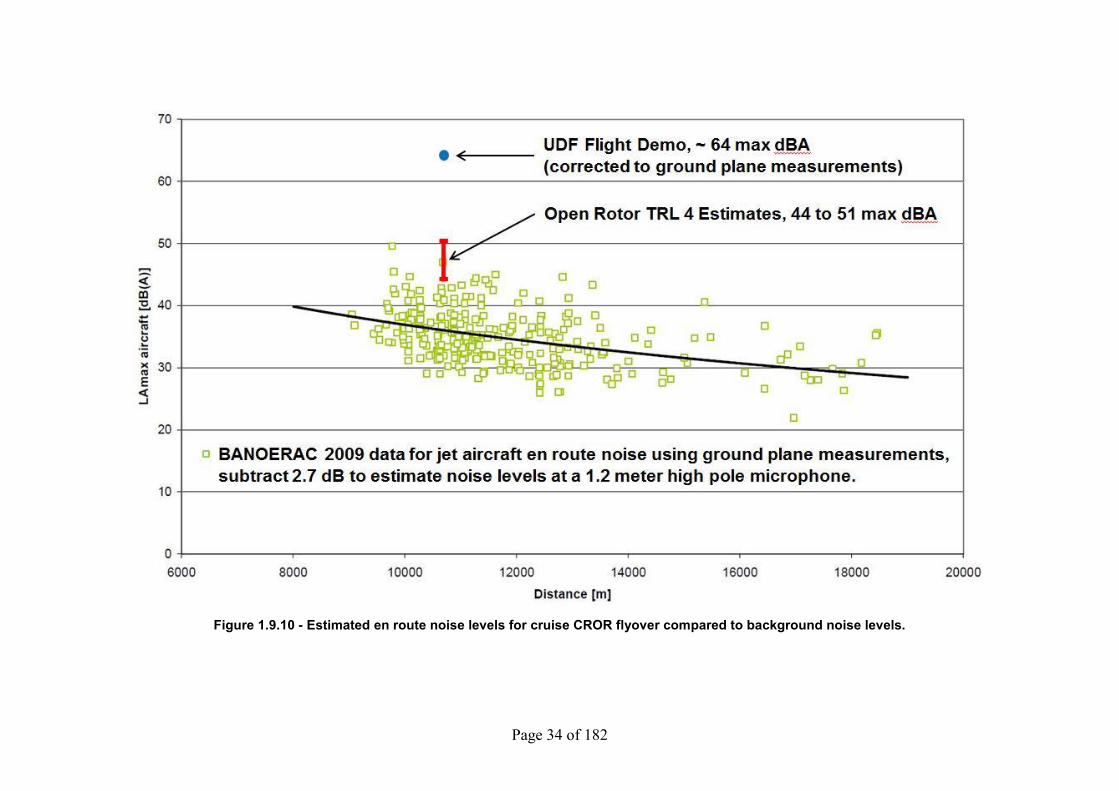
1.9.7 En route noise En route noise from open rotor aircraft is a concern since low frequency tones will propagate through the atmosphere from cruise altitudes and reach the ground. The IEP2 was asked to provide comments on en route noise as a part of their investigation of modern CROR designs. There was considerable work done on en route noise in the 1980‘s that included flight demonstration tests using the General Electric (GE) UnDucted Fan (UDF). The noise levels on the ground were measured from aircraft flyovers at 10,668 meters (35,000 feet). The IEP2 worked through the NASA Glenn Research Center and GE to estimate the noise reduction for newer open rotor propulsion systems based on model scale data. Near field unsteady pressure measurements were scaled and propagated to the ground to account for spherical spreading and atmospheric absorption. Calculations of maximum A-weighted sound pressure level during a flyover show that newer open rotor designs could be 13 to 20 dBA quieter than the older UDF flight test noise levels. The calculations are considered to be TRL 4 and still need to be validated with actual flight data. Figure 1.9.10 shows a comparison of predicted CROR noise levels with recent background noise measurements taken in Europe. The background noise measurements were sponsored by EASA in 2009 and are referred to as the ―BANOERAC Project.‖ Aircraft en route noise measurements were acquired at several quiet rural locations for climb, cruise and descent operations. Figure 1.9.10 shows that maximum A-weighted noise levels for all valid jet aircraft events during cruise phase as a function of altitude. Noise measurements from the GE UDF flight demos were averaged, converted from pole microphone measurements to ground plane measurements, and determined to be about 64 max dBA. Subtracting the 13 to 20 dBA noise reduction estimated for modern CROR engines, the predicted en route noise levels are 44 to 51 max dBA. Therefore the noise levels are approximately near the upper portion of the data scatter from current jet powered aircraft and roughly 12 dB above the average. In addition, the tonal content of the CROR noise might make it more annoying. Although there have been significant improvements in noise reduction using current generation designs, en route noise needs to be continuously monitored and updated. Suitable noise metrics need to be studied. More definitive open rotor en route noise data is expected to be available from Europe and should be used to verify cruise and climb noise estimates. In the short term, data is expected from Europe using a 4-engine single rotor blade aircraft test and in the longer term from a more

Page 33 of 182
representative counter-rotating blade flying test bed demonstrator. Results from these tests will be helpful for validating the noise prediction methods.
Page 34 of 182
Figure 1.9.10 - Estimated en route noise levels for cruise CROR flyover compared to background noise levels.

Page 35 of 182
2. Introduction From this point forward in the report, information from the first review is retained in black text for reference and new information from the second review has been appended at the end of the appropriate section in shaded text.
2.1 Background The Technology Task Group (TTG) of CAEP Working Group 1 nominated a Panel of Independent Experts (IE‘s) who were subsequently appointed by the CAEP Steering Group. The Panel of Independent Experts (IEP) was charged with conducting a review of aircraft noise reduction technologies for reducing aircraft noise certification levels and community noise exposure, and using the review results and evaluations of same to establish medium term (10 year) and long term (20 year) technology goals for future aircraft noise reduction. Technology goal-setting is a means to provide to CAEP members and stakeholders a forward view on what technology might be able to deliver in terms of noise mitigation over the goal-setting period set against foreseen (or quantified) environmental need. Technology goals are not guaranteed to be achieved, and they should not be regarded as alternatives to CAEP standard stringency, given the fundamental difference in nature between the two. Engine and aircraft manufacturers have already produced successive reductions in aircraft noise in the past two decades that have allowed certification standards to be tightened (e.g., the ICAO Annex 16 Chapter 4 standard). Reductions in operational noise levels have been demanded largely by the airport operators, local community action organizations, and airline operators, in response to increasing environmental concerns, both locally and globally. An important element of the Review process laid down by the TTG was the use of a panel of Independent Experts (IE‘s) with balanced backgrounds and perspectives, assisted by industry members, to provide an independent assessment of the prospects for reducing aircraft noise in the mid term and long term, based on the current technology research and development programs presented in the review. The IE‘s were selected from France, the UK, the US, Russia, Canada and Japan, and represent backgrounds in government research organizations, academia and industry.
2.1.1 IEP2 Novel Concepts In addition to reducing aircraft noise, it is desirable to reduce the fuel burn and emissions. Novel concepts such as the open rotor have been shown to reduce fuel burn and carbon dioxide emissions below modern turbofan engines. These concepts were not considered during IER1 since there was not enough information available to conduct a thorough review. Over the past few years, model scale data have been obtained in several facilities in Europe and the United States. One of the primary objectives of IER2 is to evaluate novel concepts that can be certified by 2030, and comment on expected noise levels relative to advanced conventional turbofan and turboprop powered aircraft.

Page 36 of 182
2.2 Remit This is the report of the ‗Noise Technology Independent Experts Panel (IEP)‘ to the Committee on Aviation Environmental Protection (CAEP). WG 1 had assigned the following work item 29 to TTG: Using the independent expert process, to examine and make recommendations for noise, with respect to aircraft technology and air traffic operational goals in the mid term (10 years) and the long term (20 years).
2.3 Conduct of the IE Review A review was held in Seattle from 29 September to 1 October 2008 in Seattle, referred to as the ‗CAEP Noise Technology Independent Experts Review‘, which was organized by the TTG/WG 1. That review, which will be referred to in this report as the ‘Review’, consisted of a number of presentations by members of WG1 supported by representatives of FAA, ICCAIA, and IATA. It was preceded by a half-day workshop on 26 September 2008, mainly to introduce the CAEP Steering Group and the independent experts to the Review by providing a general introduction to noise-reduction research and goals worldwide.
2.4 Terms of Reference The terms of reference provided by TTG/WG1 for this report were as follows:
1. Summarize the status of technology developments for aircraft noise reduction that could be brought to market within 10 years from the date of Review, as well as the 20-year prospects for noise reduction suggested by research progress, without disclosing commercially sensitive information.
2. Assess the possibility of success for each technology, based on experience from past research and development programs.
3. Comment on the environmental, efficiency, and other economic tradeoffs resulting from adopting the candidate noise reduction technologies.
4. Define a noise level baseline.
5. Recommend mid term and long term technology goals for reducing aircraft noise relative to the defined baseline.
2.4.1 IEP2 Tasks The Independent Expert Panel (IEP) was directed to carry out the following, per CAEP-Memo/80, Attachment A, dated January 21, 2011: Task 1 - Summarize the status of new technological advances (novel aircraft and engine concepts) (e.g., open rotor, geared turbofan, blended wing body, etc.) that can be brought to market within 10 years from the date of the review, as well as the 20-year prospects

Page 37 of 182
suggested by research progress, without disclosing commercially sensitive information; Task 2 - Assess the possibility of noise reduction for each technology (novel aircraft and engine concepts); Task 3 - Comment on the environmental efficiency, and other economic trade-offs resulting from adopting the candidate technologies; and Task 4 - Recommend updated mid-term and long-term technology goals for reducing aircraft noise relative to the defined baseline, also considering an improved definition of the realization factor when applied to noise technology development.
2.5 Additional Guidance Additional suggestions and guidance were provided by WG1 on issues to consider when carrying out the IEP evaluations and establishing recommendations:
Which technologies will deliver in the Medium / Long term (2018 / 2028) - Medium-term (TRL5-6 now, TRL 8 within 10 years) - Long-term (TRL3-4 now, TRL 8 within 20 years) - Including performance benefits due to new aircraft technology
With what benefit?
- Average noise reduction over all three certification conditions - Relative to chapter 4 limits - Noting particular difficulties at any one condition
What trade-offs?
- Historical trade-offs / environmental interdependencies only - No assessment of impact of more radical trade-offs associated with novel configurations (e.g. open rotors)
Applicable to what aircraft class
- Business jets - Short/medium range aircraft - Long-range aircraft
An expression of uncertainty with the goals may be appropriate
Page 38 of 182
3. Scope of report
3.1 IEP Report Preparation Preliminary Work The remit, terms of reference and additional guidance for the Independent Expert Panel report to CAEP are given in sections 2.2, 2.4 and 2.5, respectively. Key outcomes of this Review are viewed to be the estimated Medium and Long term technology goals – aircraft noise reduction targets judged to be achievable within 10 and 20 years, respectively. It should be emphasized that they are not guarantees of future noise performance, nor are they alternatives to CAEP standard stringency. The Independent Expert Panel Technology Review was based on evidence presented in the Review and the combined judgment of the IE‘s. The industry had been asked to assess critically their own technology and research programs and to present the information to the IEP in as open a manner as possible, given the commercial and proprietary restrictions that might apply. In order to respect sensitivities, technology conclusions have been reported largely without attribution to specific manufacturers.
3.2 Goal Metrics The Review presented aircraft component noise reduction estimates for various technology concepts under development in various metric formats. The Review had to interpret these estimates in terms of the possible impacts on the noise certification metric Effective Perceived Noise Level (EPNL), not only for the component for which the given technology applied, but also how this component impact on component EPNL affects the total aircraft system EPNL. This required a considerable amount of discussion, dialogue and requests for additional information and data from the Review presentation contributors after the formal review was held. The IEP is grateful to the presentation members, especially to ICCAIA, for their willingness and cooperation in providing this valuable information after the formal review had been completed.
3.3 Component Technology Classification The assessment of the status of technologies presented in the review was based on the CAEP-agreed Technology Readiness Level (TRL) scale. It was agreed that those technologies that, in the opinion of the presenters and the IEP, had reached a TRL of 5 to 6 or higher were applicable to Medium term goal maturity, while those at a TRL of 3 to 4 or less were applicable to the long-term goal assessment.
3.4 Noise Reduction Technology Primary Focus There are three primary approaches to reducing aviation noise exposure:
1. Reducing the noise at the source; 2. Noise abatement operational procedures; and 3. Land use planning.
The remit of the IEP was to primarily address the first, reducing noise at the source. However, some information was provided to the IEP regarding noise abatement procedures, and so, insofar as possible, the IEP has made qualitative assessments of the additional benefits of noise abatement procedures.
Page 39 of 182
4. Policy overview Several Presentations were given at the September 2008 Aviation Noise Technology Workshop which informed the IEP regarding Aviation Noise Policy. Civil aviation is an integral and essential part of modern society, is a wealth-generating industry, and a facilitator of industrial, commercial, and social developments globally. On the other hand, civil aviation makes a relatively small but significant and increasing contribution to global environmental problems, affecting global climate change, local air quality, and noise. In reference ANTW02, results of a CAEP Global analysis showed that the global impacted population experiencing 65 LDN or greater in aircraft community noise exposure decreased from about 3.1 million in the year 2000 to about 2 million in the year 2005, but that the exposed population is expected to climb in succeeding years, such that by the year 2018, the exposed population will return to the 3 million level. Further, it is forecasted that by the year 2028, the exposed population will increase to about 3.4 million. Reference ANTW02 noted regulatory options/instruments to promote adoption of noise reduction technology such as
1. Standards, which promote the incorporation of noise reduction technologies in aircraft design,
2. Phase-out of less environmentally-friendly aircraft technologies, and 3. Restrict/Modify Operations (e.g., curfews, noise-abatement procedures during
take-off and/or landing), and 4. Market-based options such as charges, taxes, and trading schemes.
The UK Department of Transport perspective on Aviation Noise Policy was related in reference ANTW03. Results were shown indicating a diminishing population exposure vs. time for both Leq and Contour Area, even though the number of airport operations has steadily increased as a function of time over the years. However, the trends of exposure have levelled off in the past 3 to 5 years, and the steadily increasing air traffic suggests that the exposure will increase with time again in the near future. In addition, more recent data trend curves showing the subjective ―mean annoyance‖ in per cent vs. 16-hour Leq levels indicates a lower tolerance to aircraft noise than was previously the case. This is attributed to greater public awareness of the impacts of environmental intrusions of all kinds, not just to annoyance, but to other factors such as stress, learning ability, physiological effects, and life expectancy. The public wants to see a clear rate of progress in reducing aircraft noise exposure, and the regulators and policy makers need strong assurance of commitment and delivery of this progress in lieu of setting standards which force technology into the products. The airport operator perspective on aviation noise policy, provided by ACI, was presented in reference ANTW04. The presentation emphasized the strong relationship between aircraft noise exposure and surrounding community acceptance, airport expansion, economic growth, and impact of land use planning around the airport and airspace. Response to public complaints directly influences the adoption of operational restrictions and constraints. The key to future air traffic growth and expansion is the progress in aircraft noise reduction which outpaces the increase in traffic. A trade-off cited was that 0.1 dB annual reduction in aircraft noise via technology is equivalent to

Page 40 of 182
allowing a 2.3% increase in air traffic growth without increasing the community impacted population. The airport perspective notes that the current Chapter 4 noise standards do not specify stringency increases at all three certification points, but allow flexibility in the noise reduction relative to Chapter 3 at each point, so long as the cumulative reduction meets or exceeds 10 dB relative to Chapter 3. This, in the airport operators‘ view, doesn‘t enforce sizeable reductions at the sideline or full power condition, which skews public perception of noise reduction progress in a negative way. It was further noted that several new aircraft certifications in the past couple of years have demonstrated noise levels which are significantly lower than the new Chapter 4 standard. The ACI therefore encourages consideration of more stringent standards sooner, e.g., every 6 years, and further encourages defining lower limits for all three certification conditions rather than just cumulative reductions. The airline operator perspective on Aviation Noise Policy was presented in reference ANTW06. The airline operator perspective emphasized the role Aviation Noise Policy impacts fleet planning decisions. Aircraft purchases represent significant financial investment decisions, involving not only environmental standards compliance, but life cycle operating cost, fleet mix tailored to anticipated route traffic, and timing for acquisition, replacement and retirement. Airlines usually require new aircraft purchases to have comfortable margin to existing standards, so that compliance is assured over the useful service life of the aircraft, even when stringency is increased at some future date during that life span. In certain cases, aircraft selections are made with noise as a primary selection criterion for special route situations where local airport limits are in place, e.g., Orange County Airport. Where airports have noise quotas, aircraft noise improvements permit traffic growth over time as quieter aircraft are deployed. Finally, the airline operator perspective is that noise reduction technology features must balance the benefits of lower noise with potential penalties in manufacturing cost, airline operating cost, fuel consumption and maintenance cost, i.e., there are trade-offs to consider when adopting more stringent noise standards. The aircraft manufacturer perspective on Aviation Noise Policy, presented in reference ANTW05, emphasized the recognition that noise reduction goals are separate and distinct from standards. Goals reflect projections of both the benefits and the time it takes to develop noise reduction concepts. Historically it has been observed that initial concept benefit estimates deteriorate as the technology matures to the state of product readiness, and that the development time typically takes much longer than initially anticipated. This observation was quantified through the use of the parameter Technology Readiness Level (TRL), which numerically quantifies the state of a concept from idea (TRL 1) to concept demonstration in a realistic environment (TRL 5 or 6) to in-service demonstration on aircraft (TRL 9). Industry, through ICCAIA, has provided reasonable estimates of the long-term trends for aircraft noise reduction (slide 17 of ANTW07), considered to be generic trend lines for the purpose of forecasting potential future global noise exposure as a function of time. Two scenarios were proposed, a ―worst case‖ scenario of 0.1 EPNdB noise reduction per year, and a ―best case‖ scenario of 0.3 EPNdB noise reduction per year, for each of the certification points. This trend is shown in figure 4.1. It is a major objective of the IEP to evaluate these trend scenarios, including the trends shown in figure 4.1, and provide an assessment of the most probable trend that can be expected in the next 10 years and in the next 20 years. Historically, the aviation noise reduction policy of CAEP and the manufacturers has been based on the so-called

Page 41 of 182
―3-legged stool‖ philosophy that noise reduction concepts introduced into new aircraft must be:
1. Environmentally beneficial, 2. Technically feasible, and 3. Economically viable.
The IEP, in the process of assessing the most likely noise reduction trends for forecasting fleet average noise reductions as a function of time, must therefore evaluate:
1. The state of readiness of the noise reduction technologies being developed (i.e., what is their TRL);
2. When will they be ready for TRL9; 3. How much of the currently-assessed noise benefit will be retained as it reaches
product maturity, and 4. What are the likely trade-offs that will be required to bring the concepts into a
production state, and on what classes of aircraft.
Fig. 4.1: Estimated aircraft noise reduction as a function of time for three scenarios of EPNL reduction per year

Page 42 of 182
5. Research & Technology Assessment
5.1 Noise Reduction Technologies – Medium Term
5.1.1 Fan 5.1.1.1 Fan Source Noise Reduction Technologies The presentation on fan noise technology, reference IER2008-04, listed several on-going programs for developing fan noise reduction technologies. In the Medium term, i.e., where the technology being pursued is at roughly TRL 5 to 6 or higher, the application of swept rotor designs, swept and/or leaned stator designs, and increasing engine bypass ratio are the primary technologies that can be expected to reach maturation in the next 10 years. These technologies, their projected benefits, estimated TRL values, and their anticipated key integration issues, are summarized in Table 5.1.1.1 below.
Table 5.1.1.1 – Fan Noise Reduction Medium Term Technologies
Technology Noise Reduction Potential Current TRL
Key Integration Issues
Rotor Sweep Inlet Tones: 2-4 dB at T/O; Exhaust Tones: 2 dB
5 to 9 Fan aero and mechanical
performance; fan stability and stall margin; cost and
complexity Stator Sweep
and Lean Inlet Tones: 2 - 4 dB at APP
Exhaust tones: 3 - 5 dB Fan Broadband: 1 to 3 dB
5 to 9 Fan aero performance; cost and complexity
UHBR; Rotor Speed
Optimization
Fan tones: 2 to 4 dB Fan BB: 1 to 3 dB
6 to 7 Nacelle and engine weight and
installation drag; fan operability
From the summary benefits presented, it was estimated that these technologies would provide 2 to 4 dB reductions in fan tone noise and 1 to 3 dB reductions in fan broadband noise. An exception was the effect of stator sweep and lean on fan exhaust tones, which was estimated to be 3 to 5 dB reduction. 5.1.1.2 Nacelle and Liner Technologies The zero splice inlet liners are the most mature (TRL 7-9) and have been successfully implemented to provide 1 to 4 dB inlet fan noise reduction depending on the fan speed (higher benefit for higher fan speeds). It was noted that even though the acoustic benefits for this technology have been known for many years, manufacturing technologies needed to be developed before it was possible to implement zero splice liners. Even though there is higher cost and maintenance, this technology has been implemented into the nacelle for the A380 and is expected also in the A350, B747-8 and B787 aircraft in the near future. Scarf inlets can also provide fan noise reduction for inlet radiated sound by as much as 3 dB, but there are differing views on the aerodynamic performance impact. There is general agreement that this technology cannot be retrofitted into an existing

Page 43 of 182
nacelle. Several test programs have successfully shown this technology to be matured to TRL 6. However, the aerodynamic performance results are mixed. Some tests show acceptable performance data, while others imply that the trade-off between takeoff and cruise conditions needs further work, particularly for wing mounted engines. The availability of this technology in the Medium term depends on the specific application. Nose lip liners increase the treatment area at a more effective location on the engine inlet to reduce inlet radiated turbomachinery noise (fan and LPC). Noise reduction benefits range from 1 to 3 dB. The main issue with this technology is the integration with anti-icing devices for safety, as well as trade-offs with increased weight and possible aerodynamic penalties from surface roughness. The IEP consulted with icing experts who indicated that there are methods for integrating anti-icing devices in this region. The TRL for this technology varies from 4 to 6. There was no information available on what is being done to address these issues and therefore it is not clear if lip liners will be feasible for the Medium term.
Aft cowl liners were presented at the Review as a long term technology. As discussed in the long term section for Nacelle & Liners of this report, the IEP believes that some form of this technology can be ready in the Medium term, as evident by short extensions of acoustic treatment currently used on the CF6-80C2 engine.
Table 5.1.1.2 – Fan Noise Reduction Medium Term Liner Suppression Technologies
Technology Noise Reduction Potential Current
TRL Key Integration
Issues Zero Splice Inlet Liners
Inlet noise: 1-4 dB at Flyover (in service on A380)
7 to 9 Manufacturing & repair technologies
need to be developed Scarf Inlets Inlet noise: ~3 dB 4 to 6 Aero performance
trade-offs at cruise vs. T/O
Nose Lip Liners
Inlet noise: 1-3 dB 4 to 6 Integration with anti-icing systems
Aft cowl Liners
Aft noise: 1-3 dB PWL 3-4 Large-scale validation data
required Taking all these estimates into account as well as the reported progress in developing these technologies, it is the Independent Expert Panel (IEP) view that, collectively, these technologies can provide approximately 2.5 to 4.5 dB reduction in fan component EPNL in the next 10 years, or approximately 3.52 EPNdB reduction in fan component EPNL, plus or minus 1.0 EPNdB. The total aircraft system impact will of course depend on the propulsion system cycle, the aircraft performance and the component contributions of other noise sources.
2 Corrected from 2.5 to 3.5 in IEP2.
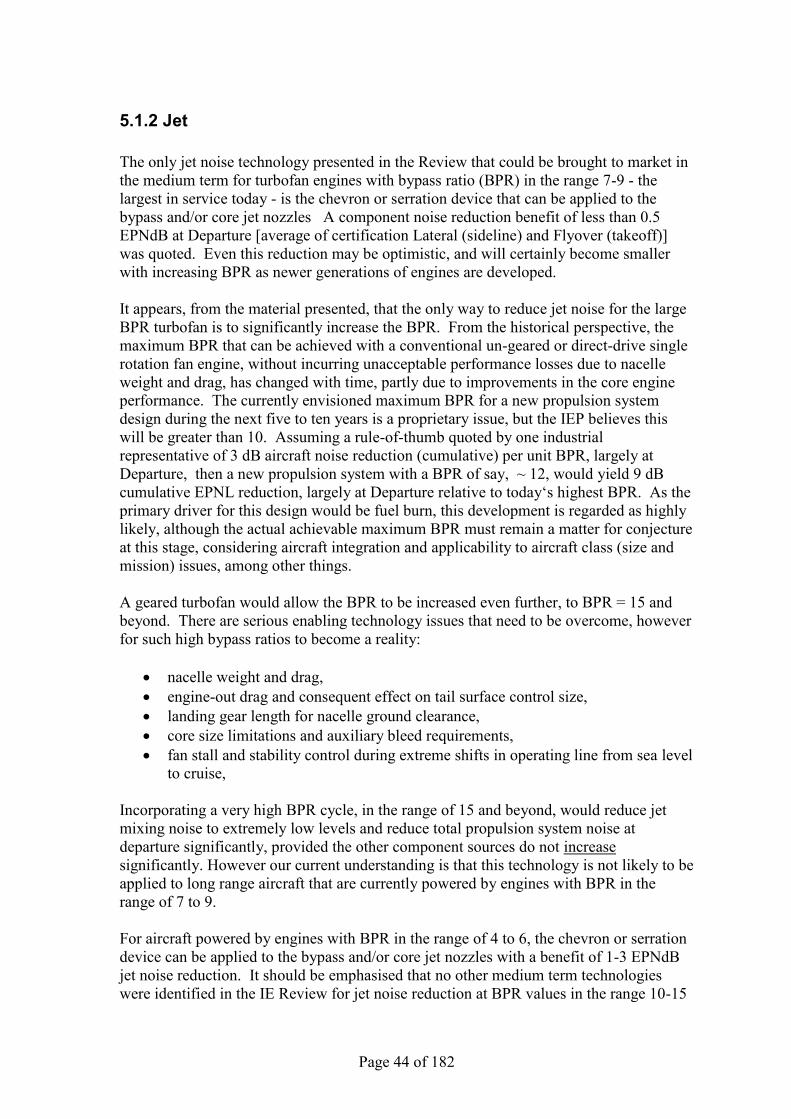
Page 44 of 182
5.1.2 Jet The only jet noise technology presented in the Review that could be brought to market in the medium term for turbofan engines with bypass ratio (BPR) in the range 7-9 - the largest in service today - is the chevron or serration device that can be applied to the bypass and/or core jet nozzles A component noise reduction benefit of less than 0.5 EPNdB at Departure [average of certification Lateral (sideline) and Flyover (takeoff)] was quoted. Even this reduction may be optimistic, and will certainly become smaller with increasing BPR as newer generations of engines are developed. It appears, from the material presented, that the only way to reduce jet noise for the large BPR turbofan is to significantly increase the BPR. From the historical perspective, the maximum BPR that can be achieved with a conventional un-geared or direct-drive single rotation fan engine, without incurring unacceptable performance losses due to nacelle weight and drag, has changed with time, partly due to improvements in the core engine performance. The currently envisioned maximum BPR for a new propulsion system design during the next five to ten years is a proprietary issue, but the IEP believes this will be greater than 10. Assuming a rule-of-thumb quoted by one industrial representative of 3 dB aircraft noise reduction (cumulative) per unit BPR, largely at Departure, then a new propulsion system with a BPR of say, ~ 12, would yield 9 dB cumulative EPNL reduction, largely at Departure relative to today‘s highest BPR. As the primary driver for this design would be fuel burn, this development is regarded as highly likely, although the actual achievable maximum BPR must remain a matter for conjecture at this stage, considering aircraft integration and applicability to aircraft class (size and mission) issues, among other things. A geared turbofan would allow the BPR to be increased even further, to BPR = 15 and beyond. There are serious enabling technology issues that need to be overcome, however for such high bypass ratios to become a reality:
nacelle weight and drag, engine-out drag and consequent effect on tail surface control size, landing gear length for nacelle ground clearance, core size limitations and auxiliary bleed requirements, fan stall and stability control during extreme shifts in operating line from sea level
to cruise, Incorporating a very high BPR cycle, in the range of 15 and beyond, would reduce jet mixing noise to extremely low levels and reduce total propulsion system noise at departure significantly, provided the other component sources do not increase significantly. However our current understanding is that this technology is not likely to be applied to long range aircraft that are currently powered by engines with BPR in the range of 7 to 9. For aircraft powered by engines with BPR in the range of 4 to 6, the chevron or serration device can be applied to the bypass and/or core jet nozzles with a benefit of 1-3 EPNdB jet noise reduction. It should be emphasised that no other medium term technologies were identified in the IE Review for jet noise reduction at BPR values in the range 10-15
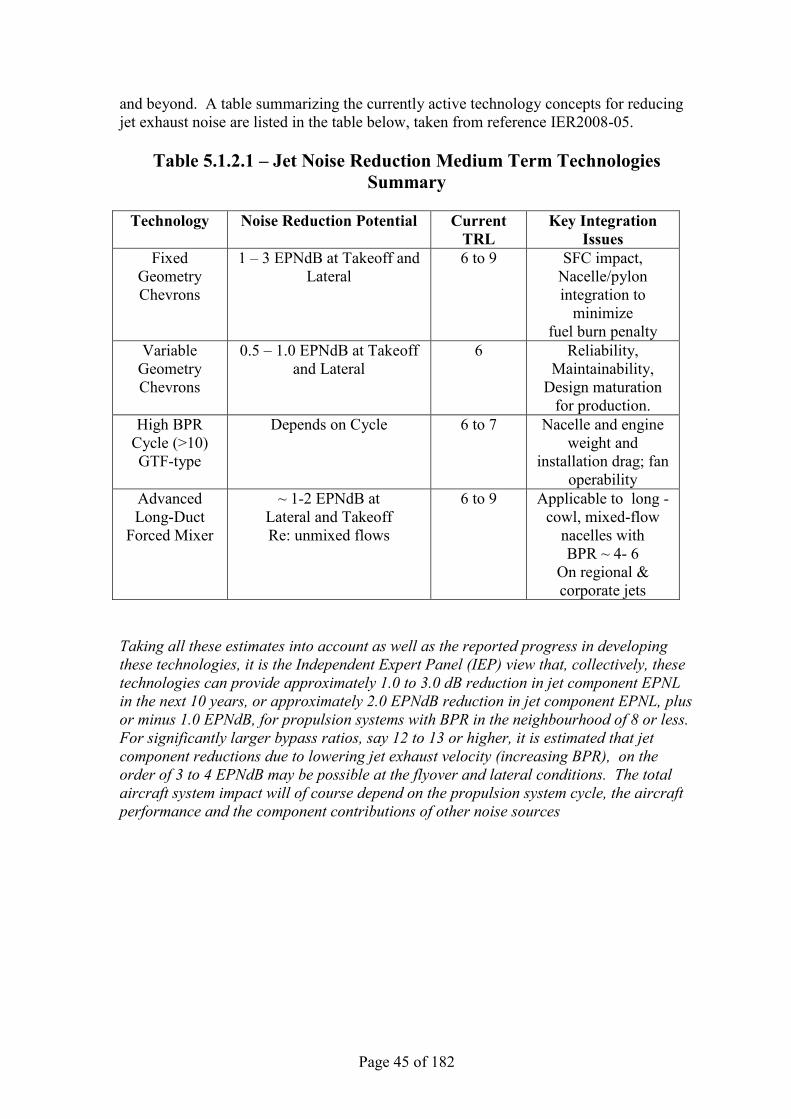
Page 45 of 182
and beyond. A table summarizing the currently active technology concepts for reducing jet exhaust noise are listed in the table below, taken from reference IER2008-05.
Table 5.1.2.1 – Jet Noise Reduction Medium Term Technologies Summary
Technology Noise Reduction Potential Current
TRL Key Integration
Issues Fixed
Geometry Chevrons
1 – 3 EPNdB at Takeoff and Lateral
6 to 9 SFC impact, Nacelle/pylon integration to
minimize fuel burn penalty
Variable Geometry Chevrons
0.5 – 1.0 EPNdB at Takeoff and Lateral
6 Reliability, Maintainability,
Design maturation for production.
High BPR Cycle (>10) GTF-type
Depends on Cycle 6 to 7 Nacelle and engine weight and
installation drag; fan operability
Advanced Long-Duct
Forced Mixer
~ 1-2 EPNdB at Lateral and Takeoff Re: unmixed flows
6 to 9 Applicable to long - cowl, mixed-flow
nacelles with BPR ~ 4- 6
On regional & corporate jets
Taking all these estimates into account as well as the reported progress in developing these technologies, it is the Independent Expert Panel (IEP) view that, collectively, these technologies can provide approximately 1.0 to 3.0 dB reduction in jet component EPNL in the next 10 years, or approximately 2.0 EPNdB reduction in jet component EPNL, plus or minus 1.0 EPNdB, for propulsion systems with BPR in the neighbourhood of 8 or less. For significantly larger bypass ratios, say 12 to 13 or higher, it is estimated that jet component reductions due to lowering jet exhaust velocity (increasing BPR), on the order of 3 to 4 EPNdB may be possible at the flyover and lateral conditions. The total aircraft system impact will of course depend on the propulsion system cycle, the aircraft performance and the component contributions of other noise sources

Page 46 of 182
5.1.3 Airframe Since engine noise has been significantly reduced for decades, airframe noise has become comparable to engine noise during approach for current production airplanes with high bypass ratio engines. The major sources of airframe noise mentioned in the Review are the landing gear, high lift devices and noise due to aerodynamic interaction among them. 5.1.3.1 Landing Gear From the materials presented in the Review, it was made clear that fairing and caps on landing gears are the only technology which will be brought to market in the Medium term. They are based on concept of covering the landing gear components and minimizing the exposure to, and creation of, turbulence generated by the flow. The potential benefit of fairing and caps of landing gears was quoted to be up to 3 dB for a component directly adaptable to existing designs. Fairings and caps have not been implemented on aircraft in production, probably because these are judged unnecessary for aircraft currently certified under Chapter 4, and they are heavy and costly. Under the Quiet Technology Demonstrator 2 (QTD 2) program, the flight tests using B777-300ER showed gear deployment caused 3 dB increase of noise in wide range of 1/3 octave band spectra. However, the results of flight tests with a ‗toboggan‘ type main gear fairing showed no reduction as has been seen in scale-model wind tunnel tests. This may be due to the complexity of flow around gears in actual flight. More effort is necessary to understand the mechanism of noise generation from gears in order to achieve noise reduction by full-scale aircraft in flight. Nevertheless, even if at TRL3/4, a Low Noise Design landing gear looks to be, in the opinion of the IEP, a good candidate for noise reduction in the Medium term. This technology is planned, according to the Review, to reach TRL6 by 2013, and TRL8 by 2015, which suggests availability by 2018. Moreover, a full scale experiment has been carried out with this concept, in a wind tunnel, at large scale, as part of a EU research programme, justifying TRL 5 (according to the TRL 5 definition). The landing gear design is very specific for an aircraft and cannot be tested on a flying test bed like an engine or nacelle, and so initial testing has to be done in a wind tunnel. This technology includes an optimization of landing gear door position and shaping, a filling of forging voids, streamlining of bluff shapes for legs and stays. Some of this has already partly been introduced in some new aircraft. The IEP considers that a potential EPNL reduction of up to 5 dB at component level may be expected by 2018. Fairings and caps benefits are not additive, but give credibility to the goal. This is applicable basically for conventional aircraft with under the wing installed engines, provided that the aeroacoustical aspects of the landing gear are taken into account from the very beginning of the project. Fuselage-mounted short landing gears – not mentioned during the review – might give better results but require aircraft architecture change.
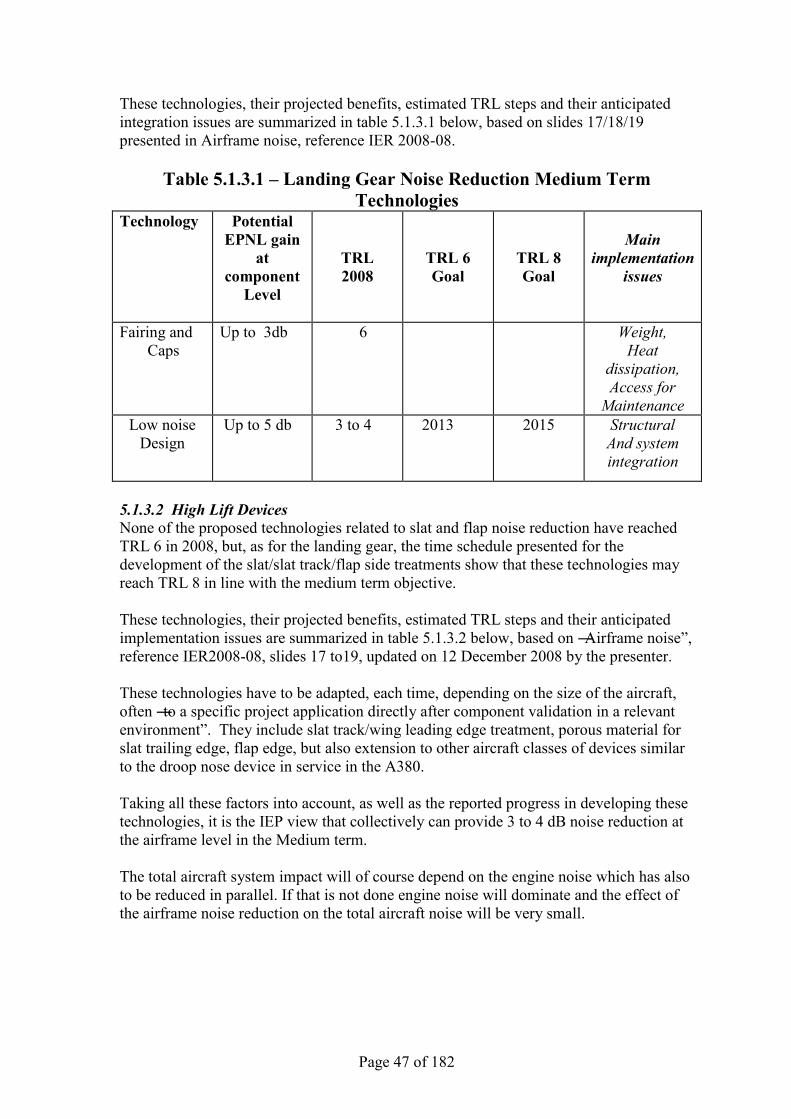
Page 47 of 182
These technologies, their projected benefits, estimated TRL steps and their anticipated integration issues are summarized in table 5.1.3.1 below, based on slides 17/18/19 presented in Airframe noise, reference IER 2008-08.
Table 5.1.3.1 – Landing Gear Noise Reduction Medium Term Technologies
Technology Potential EPNL gain
at component
Level
TRL 2008
TRL 6 Goal
TRL 8 Goal
Main
implementation issues
Fairing and Caps
Up to 3db 6 Weight, Heat
dissipation, Access for
Maintenance Low noise
Design
Up to 5 db 3 to 4 2013 2015 Structural And system integration
5.1.3.2 High Lift Devices None of the proposed technologies related to slat and flap noise reduction have reached TRL 6 in 2008, but, as for the landing gear, the time schedule presented for the development of the slat/slat track/flap side treatments show that these technologies may reach TRL 8 in line with the medium term objective. These technologies, their projected benefits, estimated TRL steps and their anticipated implementation issues are summarized in table 5.1.3.2 below, based on ―Airframe noise‖, reference IER2008-08, slides 17 to19, updated on 12 December 2008 by the presenter. These technologies have to be adapted, each time, depending on the size of the aircraft, often ―to a specific project application directly after component validation in a relevant environment‖. They include slat track/wing leading edge treatment, porous material for slat trailing edge, flap edge, but also extension to other aircraft classes of devices similar to the droop nose device in service in the A380. Taking all these factors into account, as well as the reported progress in developing these technologies, it is the IEP view that collectively can provide 3 to 4 dB noise reduction at the airframe level in the Medium term. The total aircraft system impact will of course depend on the engine noise which has also to be reduced in parallel. If that is not done engine noise will dominate and the effect of the airframe noise reduction on the total aircraft noise will be very small.
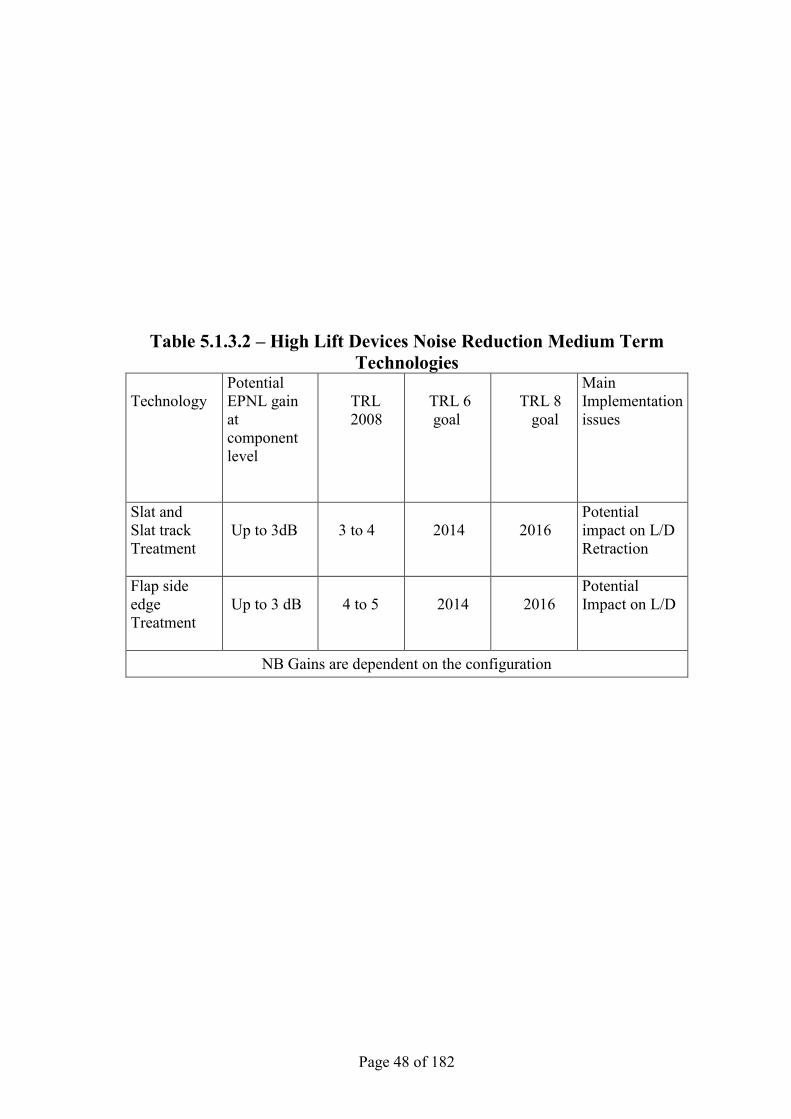
Page 48 of 182
Table 5.1.3.2 – High Lift Devices Noise Reduction Medium Term Technologies
Technology
Potential EPNL gain at component level
TRL 2008
TRL 6 goal
TRL 8 goal
Main Implementation issues
Slat and Slat track Treatment
Up to 3dB
3 to 4
2014
2016
Potential impact on L/D Retraction
Flap side edge Treatment
Up to 3 dB
4 to 5
2014
2016
Potential Impact on L/D
NB Gains are dependent on the configuration
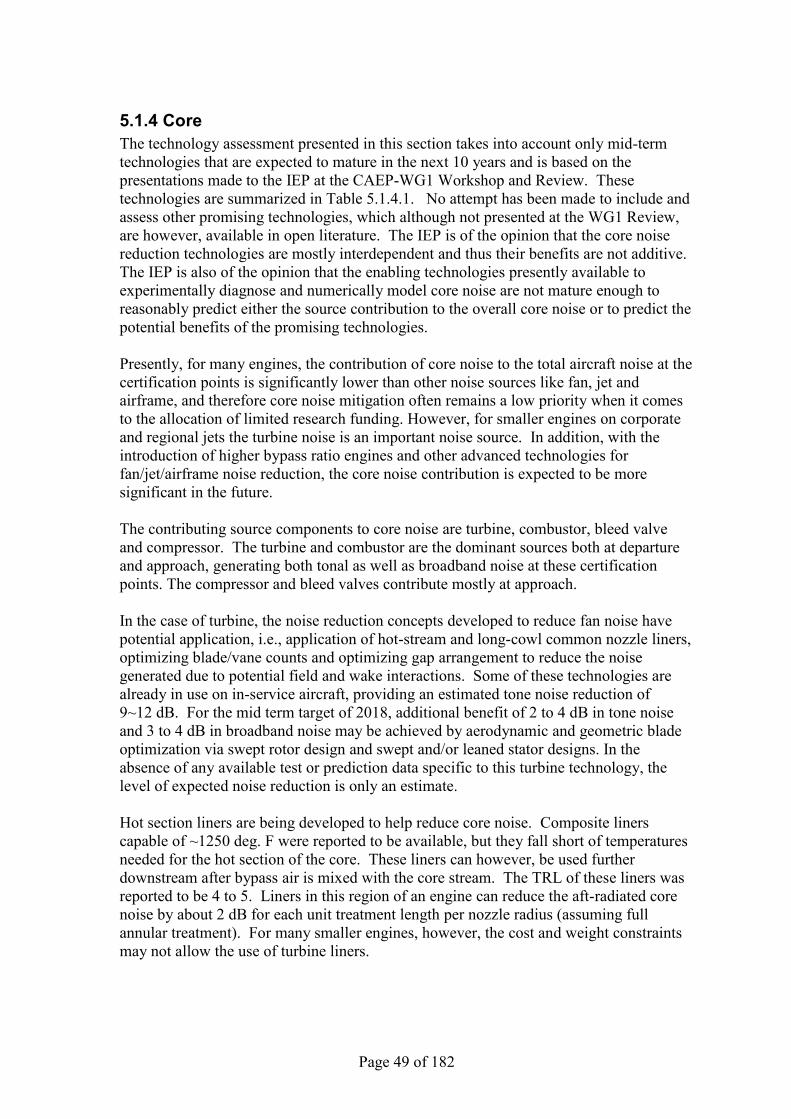
Page 49 of 182
5.1.4 Core The technology assessment presented in this section takes into account only mid-term technologies that are expected to mature in the next 10 years and is based on the presentations made to the IEP at the CAEP-WG1 Workshop and Review. These technologies are summarized in Table 5.1.4.1. No attempt has been made to include and assess other promising technologies, which although not presented at the WG1 Review, are however, available in open literature. The IEP is of the opinion that the core noise reduction technologies are mostly interdependent and thus their benefits are not additive. The IEP is also of the opinion that the enabling technologies presently available to experimentally diagnose and numerically model core noise are not mature enough to reasonably predict either the source contribution to the overall core noise or to predict the potential benefits of the promising technologies. Presently, for many engines, the contribution of core noise to the total aircraft noise at the certification points is significantly lower than other noise sources like fan, jet and airframe, and therefore core noise mitigation often remains a low priority when it comes to the allocation of limited research funding. However, for smaller engines on corporate and regional jets the turbine noise is an important noise source. In addition, with the introduction of higher bypass ratio engines and other advanced technologies for fan/jet/airframe noise reduction, the core noise contribution is expected to be more significant in the future. The contributing source components to core noise are turbine, combustor, bleed valve and compressor. The turbine and combustor are the dominant sources both at departure and approach, generating both tonal as well as broadband noise at these certification points. The compressor and bleed valves contribute mostly at approach. In the case of turbine, the noise reduction concepts developed to reduce fan noise have potential application, i.e., application of hot-stream and long-cowl common nozzle liners, optimizing blade/vane counts and optimizing gap arrangement to reduce the noise generated due to potential field and wake interactions. Some of these technologies are already in use on in-service aircraft, providing an estimated tone noise reduction of 9~12 dB. For the mid term target of 2018, additional benefit of 2 to 4 dB in tone noise and 3 to 4 dB in broadband noise may be achieved by aerodynamic and geometric blade optimization via swept rotor design and swept and/or leaned stator designs. In the absence of any available test or prediction data specific to this turbine technology, the level of expected noise reduction is only an estimate. Hot section liners are being developed to help reduce core noise. Composite liners capable of ~1250 deg. F were reported to be available, but they fall short of temperatures needed for the hot section of the core. These liners can however, be used further downstream after bypass air is mixed with the core stream. The TRL of these liners was reported to be 4 to 5. Liners in this region of an engine can reduce the aft-radiated core noise by about 2 dB for each unit treatment length per nozzle radius (assuming full annular treatment). For many smaller engines, however, the cost and weight constraints may not allow the use of turbine liners.

Page 50 of 182
Table 5.1.4.1 – Core Noise Reduction Mid-term Technologies
Noise source Reduction technology Current TRL
Reduction potential
Turbine
Hot stream acoustic liners
93 2~4 dB
Long-cowl nacelle common nozzle
9 3 dB
Aerofoil counts (conventional and reverse)
9 4 dB
Optimized aerodynamics
Optimized gap arrangement (reduce potential field and wake interactions)
9 3~4 dB
Aerofoil geometric optimization (via sweep, lean)
4~5 3dB
Combustor
Cavity acoustic plugs
4~5 4~9 dB at some
frequencies 1~2 dB at
others In the case of combustor noise, the only mid-term promising technologies that will be ready for application by 2018 are the tail-cone resonators, which comprise of micro-perforated liners and cavity septum rolled into folding cavity acoustic plugs. These can be tailored for specific frequency ranges to reduce a narrow range of the noise spectra by 4~9 dB at flyover and 3~4 dB at approach. How this impacts the overall engine noise depends on the relative levels of combustion noise to other sources such as jet noise. In addition, the application of optimized vane/blade ratio and curved and leaned turbine blades may not only provide turbine noise reduction, but can also aid in reducing downstream propagation of combustor noise by providing higher acoustic impedance at combustor exit. Bleed valve exit screens are presently in use to mitigate bleed valve noise. They have been demonstrated to be very effective in reducing bleed valve noise to up to a 10 EPNdB component reduction, and sometimes a several EPNdB reduction on total aircraft noise. Another bleed valve noise reduction technology is the application of reduction teeth. This methodology can be put to use by 2018 and according to the 3 The TRL is lower for small engines, since these liners are not widely used on such engines
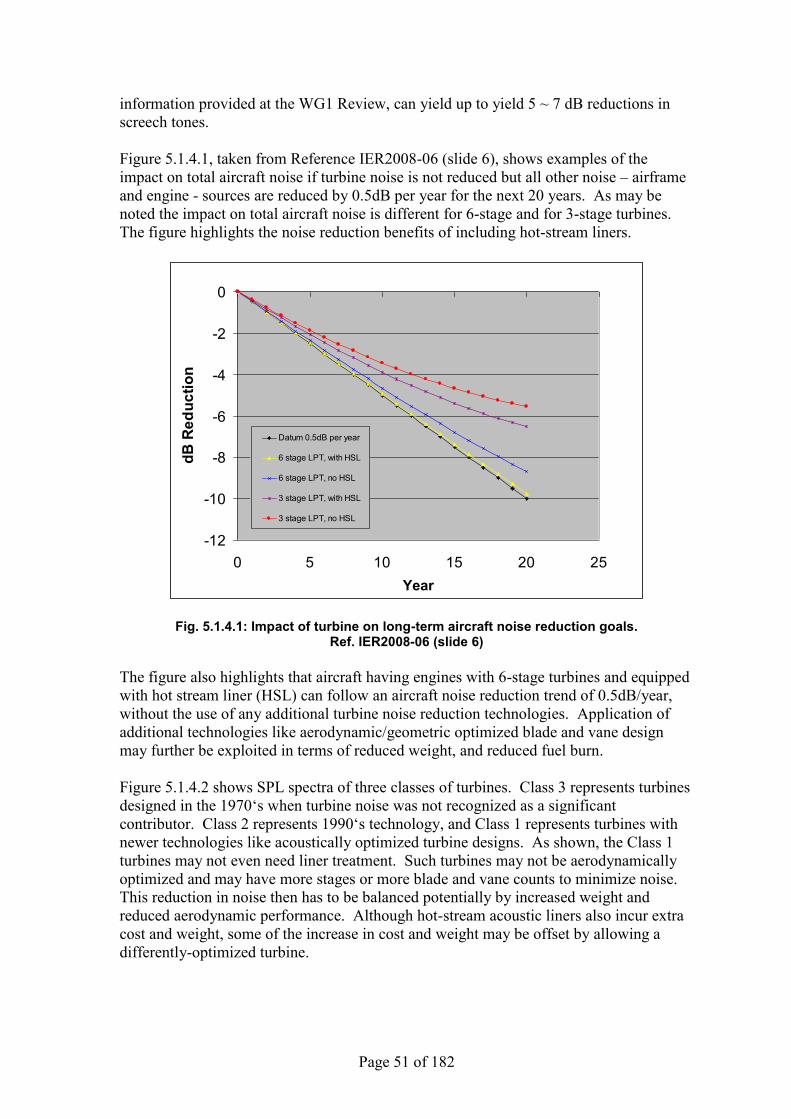
Page 51 of 182
information provided at the WG1 Review, can yield up to yield 5 ~ 7 dB reductions in screech tones. Figure 5.1.4.1, taken from Reference IER2008-06 (slide 6), shows examples of the impact on total aircraft noise if turbine noise is not reduced but all other noise – airframe and engine - sources are reduced by 0.5dB per year for the next 20 years. As may be noted the impact on total aircraft noise is different for 6-stage and for 3-stage turbines. The figure highlights the noise reduction benefits of including hot-stream liners.
Fig. 5.1.4.1: Impact of turbine on long-term aircraft noise reduction goals. Ref. IER2008-06 (slide 6)
The figure also highlights that aircraft having engines with 6-stage turbines and equipped with hot stream liner (HSL) can follow an aircraft noise reduction trend of 0.5dB/year, without the use of any additional turbine noise reduction technologies. Application of additional technologies like aerodynamic/geometric optimized blade and vane design may further be exploited in terms of reduced weight, and reduced fuel burn. Figure 5.1.4.2 shows SPL spectra of three classes of turbines. Class 3 represents turbines designed in the 1970‘s when turbine noise was not recognized as a significant contributor. Class 2 represents 1990‘s technology, and Class 1 represents turbines with newer technologies like acoustically optimized turbine designs. As shown, the Class 1 turbines may not even need liner treatment. Such turbines may not be aerodynamically optimized and may have more stages or more blade and vane counts to minimize noise. This reduction in noise then has to be balanced potentially by increased weight and reduced aerodynamic performance. Although hot-stream acoustic liners also incur extra cost and weight, some of the increase in cost and weight may be offset by allowing a differently-optimized turbine.
-12
-10
-8
-6
-4
-2
0
0 5 10 15 20 25Year
dB R
educ
tion
Datum 0.5dB per year
6 stage LPT, with HSL
6 stage LPT, no HSL
3 stage LPT, with HSL
3 stage LPT, no HSL

Page 52 of 182
Fig. 5.1.4.2: Comparison of turbine noise reduction benefits for different classes of turbine.
Ref. IER2008 It may be concluded that engines with higher number of turbine stages, designed and optimized for performance (lower stage loading) also provide noise benefits, even without aerodynamic or geometric blade/vane design optimization. But they do bring weight penalties, which may be unacceptable. The real benefit of turbine technologies such as aerodynamic or geometric blade/vane design optimization may therefore be on highly-loaded turbine designs. Taking into account the noise reduction estimates shown in Table 5.1.4.1 as well as the reported progress in developing these technologies and other considerations highlight in this section, it is the IEP view that, collectively, the technologies can provide approximately 1.0 to 2.0 dB reduction in core component EPNL in the next 10 years.
5.1.5 Nacelle & Liners
The nacelle and liner technologies include methods for absorbing, cancelling or redirecting sound sources originating within an engine. A summary was given at the Review on promising Medium term technologies that included zero splice inlet liners, scarf inlets, nose lip liners, high temperature liners, combustor Helmholtz resonators, and Herschel-Quinke (HQ) tubes. The IEP evaluated each technology and agreed with the recommended time frame for technology maturation, except for HQ tubes which were moved to the Long term time frame. Apart from some generic aspects briefly covered in this section, nacelle and liner technologies are discussed under the appropriate component headings (i.e. fan and core)
Frequency (Hz)
SPL Class “2”
Class “1”
Class “3”
5dB

Page 53 of 182
Acoustic liners have well established benefits for nacelle applications. Single and double degree of freedom (DOF) liners are in production today and typically provide 3 to 6 dB fan noise reduction. There does not appear to be a strong case for higher DOF liners (greater than two) due to manufacturing cost, complexity, weight, and diminishing acoustic benefits. The selection of the liner is strongly dependent on the source and it is possible to design a single DOF liner that can be just as effective as a double DOF liner. There was a general impression at the Review that liners for cooler sections of the engine have matured and strategies for additional noise reduction should deal with more effective placement of the liners, e.g. nose lip liners, and the detailed design, e.g. zero-splice liners. Apart from that, for a given liner area, there are no liner technologies available in the Medium term that will significantly reduce turbomachinery noise beyond current levels.
There has been concern in the past about the scalability of liners tested in wind tunnels due to smaller size and the uncertainty to match target impedances. Discussion at the Review indicated that this is not a problem as long as the scale factor does not exceed 5 and if there are no additional self noise sources from the liner.
In summary, it is the opinion of the IEP that the technologies that will be ready for Medium term applications will be zero splice liners, scarf inlets (depending on application) , possibly inlet nose lip liners, high temperature exhaust liners, tailcone resonators, and some form of aft cowl liners.
Page 54 of 182
5.2 Noise Reduction Technologies – Long Term
5.2.1 Fan 5.2.1.1 Fan Source Noise Reduction Technologies For the long term, several technologies for reducing fan noise were presented in reference IER2008-04 that are considered to be at TRL 3 to 4. These include: Variable-area fan nozzle, ―Soft vane‖ for reducing rotor-stator interactions, Over-the-rotor treatment for reducing fan rotor noise, active stator control, active rotor tone control, and the ―Zero-hub fan‖ for reducing fan inflow Mach number (and hence noise). The Long Term Technologies characteristics, benefits, and issues are summarized in Table 5.2.1.1 below. Table 5.2.1.1 – Fan Noise Reduction Long Term Technologies Summary
Technology Noise Reduction Potential Current TRL
Key Integration Issues
Variable Area Nozzle
Tone & Broadband: 2 dB 4 to 5 Complexity, weight and Cost
―Soft‖ Vanes Tones & Broadband: 1.5 dB 3 Maintenance & perhaps drag
Over-the-Rotor Treatment
Tones & Broadband: 3 dB 3 Fan performance impact
Active Stator Inlet 1BPF: 8 dB Inlet 2BPF: 5 dB
3 Actuator integration; structural integrity;
weight & cost Active Blade Tone Control
Inlet 1BPF: 24 dB Inlet 2BPF: 9 dB
3 Complexity; weight & cost; TSFC impact
Zero Hub Fan Inlet Tone and Broadband: 0.5 dB re: Swept Rotor
4 Structural Integrity
The ―Soft Vane‖ concept and the Over-the-Rotor Treatment technologies listed Key Integration Issues, but, in the view of the IEP, overlooked some important ones. The ―Soft Vane‖ concept (see slide 22 of IER2008-04) shows a very complex, and therefore possibly high-cost construction of the vane. Also, no mention is made of whether the concept can be incorporated into fan exit guide vanes which are also structural (fan frame struts), which also contain engine air and fluid piping. The Over-the-Rotor Treatment concept key integration issues are listed as performance impact, but the issue of fan blade containment and structural complexity and integrity were not mentioned. The IEP views these additional key integration issues as important, and therefore the estimated time to develop these technologies may be longer than currently envisioned. For the Active control concepts, large reductions in tone noise, on the order of 5 to 24 dB for blade-passing frequency (BPF) and second harmonic tones, were quoted. Most all of these long-term technologies involve much more complex component and system designs, thus introducing significant uncertainty in the resulting impact on manufacturability, performance, cost, maintenance, and reliability. The IEP view is that

Page 55 of 182
these technologies are interactive, in that their benefits are not additive. For example, if a fan BPF tone has been significantly reduced through cut-off design, or stator sweep and lean, or rotor sweep, or other means, then active control concepts may not produce nearly the tone reductions demonstrated on rig tests where the BPF tone is very high. The IEP view is that these long-term technologies may provide about 1 to 3 dB reduction in fan component EPNL over and above the Medium term technologies in the next 20 years. It should be noted that some of the IEP members felt that the active control technologies described had a low likelihood of ever reaching maturity. The IEP also feels that some of the long-term technologies will probably prove unfeasible as further investigations on more realistic configurations are developed, but that perhaps other approaches or technologies will come to light that may prove to be more successful than those currently being pursued 5.2.1.2 Nacelle and Liner technologies Herschel-Quinke (HQ) tubes have been investigated as a way to increase fan noise attenuation when integrated into the liners. Results from engine tests have shown that they work well in isolation, but did not give the expected additional attenuation when added to the liners. A static engine test result showed 3 dB reduction when the HQ tubes were tested alone and 4 dB reduction when integrated with a liner. It is unlikely that this technology will be implemented in the Medium term unless significant noise reduction can be achieved beyond traditional liners and therefore is considered a Long-Term Technology. Optimized zone liners were shown to be added as rings to the inner and outer walls of the aft bypass duct to reduce fan noise. The impedance is optimized for each ring to improve sound absorption and requires knowledge of the source distribution. Computational methods for duct sound propagation have been used to show that accounting for the curvature and the changes in impedance for each zone can increase the effectiveness of the liners according to the predictions. This idea is not new, but needs to be validated with experimental data. The reported benefit of 5 dB reduction of peak SPL spectra is significant and efforts should be accelerated if it can be shown to work in TRL 5 and 6 tests. Aft cowl duct liners are a way to increase the treatment area for aft radiated noise beyond current practice. Estimated noise reduction ranges from 1 to 3 dB (PWL) based on predictions. It was recognized that some engines such as the CF6-80C2 already use short extensions of acoustic treatment beyond the fan cowl, although this was done primarily for manufacturing reasons. As suggested with the optimized zone liners, this technology should be accelerated if it can be shown to work in TRL 5 and 6 tests. Acoustic splitters are also an old idea being revisited with today‘s technologies. Initially, multiple splitter rings were added to the inlet during research programs in the 1970‘s. The performance losses were found to be too high. Recent investigations have concentrated on aft radiated fan noise since it tends to dominate for lower speed fans associated with higher bypass ratio engines. Splitters can be located in the fan nacelle bypass duct to increase the treatment area and change the length/height ratio to increase the noise absorption. Estimates show an increase of 2 to 6 dB noise reduction over exhaust duct liners without splitters. However, the performance losses could be significant and, in the case of the long bypass duct splitter, integration with the thrust
Page 56 of 182
reverser is a challenge. Future development of this technology should concentrate on methods to reduce the performance losses before higher TRL can be achieved. Active/passive liners hold the same promise as the optimized zone liners with the added ability to change the impedance throughout the operating range of the engine. This is accomplished by introducing a second source within the liner that is linked to a control system to vary the amplitude and phase until the desired impedance is obtained to optimize sound absorption for a given engine speed. Strategies can be employed to integrate the active system with a passive liner to make it more effective. It is also possible to use the active system for lower frequencies while the same liner provides higher frequency attenuation. Test performed so far have targeted tones and have shown reductions from 2 to 7 dB. This technology is appropriate for the longer term and requires development of reliable, low-cost, low-weight, high amplitude actuators and control systems. The IEP notes that the Nacelle/Liner technologies for fan noise reduction are also interactive with the fan source noise reduction concepts discussed in this section, and are therefore their benefits are not necessarily additive. On the average, with the exception of the active control technologies, these concepts were estimated to yield 1.5 to4 dB additional reductions over and above that provided by the Medium term technologies. Alternatively, the anticipated potential benefits are approximately an additional 2.5 EPNdB in fan component EPNL, plus or minus 1.5 EPNdB, over and above that provided by the Medium term technologies. The total aircraft system impact will of course depend on the propulsion system cycle, the aircraft performance and the component contributions of other noise sources.

Page 57 of 182
5.2.2 Jet The presentation in reference IER2008-05 described several technologies at low TRL that are being pursued in various research programs that may reach maturity in the long term, by the year 2028. These are summarized in Table 5.2.2.1 below. Table 5.2.2.1 – Jet Noise Reduction Long-Term Technologies Summary
Technology Noise Reduction Potential Current TRL
Key Integration Issues
Fluidic Injection
1 – 2 EPNdB at Takeoff and Lateral
3 to 4 Air source - Cycle impact and sizing; Design maturation;
Complex issues with implementation
Bevelled Nozzle
1 – 3 EPNdB at Takeoff and Lateral
4 Thrust vectoring addressed by nozzle
tailoring Microjets 1 – 3 EPNdB at Takeoff and
Lateral 3 to 4 Air source - Cycle
impact and sizing; Design maturation;
Complex issues with implementation
High-Frequency Excitation
~ 1-2 EPNdB at Lateral and Takeoff
5 to 6 Air source - Cycle impact and sizing; Design maturation;
Complex issues with implementation
A difficulty with assessing the potential benefits of the advanced jet noise reduction technologies listed in Table 5.2.2.1 above is that it is not clear whether these benefits would apply to very high bypass ratio jets. Further, it is not clear whether they can be additive to the Medium term technology concepts, or whether they replace the Medium term technology concepts. Of the four technologies listed above, only the Bevelled Nozzle concept appears to be separate and distinct from the others, so that most likely the others can conceivably augment the Bevelled Nozzle noise reduction, but not each other. In other words, Fluidic Injection, Microjets and High-Frequency Excitation are all viewed to be variants of the same family of technologies, and are potentially competing concepts, from which only one will reach maturity for a given aircraft application. It is the view of the IEP that these long term technologies would most likely be applicable to propulsion systems with BPR on the order of 6 to 9, and that they would not be as effective, either on a component jet noise reduction basis, or on an aircraft system noise level basis, for very high BPR propulsion systems, say 12 to 13 or higher. The IEP further questions the maturity of the ―High-Frequency Excitation‖ concept, since no evidence was given that it has been tested in an engine environment. On the average, with the exception of the active control technologies, these long term concepts for jet noise reduction were estimated to yield 1 to 3 EPNdB reductions, but it is not clear whether this is over and above that provided by the Medium term technologies.
Page 58 of 182
Further, it is not clear that these benefits on jet noise reduction will be as effective on very high BPR jets. To the extent that we may expect at least some new aircraft classes to have very high BPR propulsion systems, the IEP opinion is that these long-term technologies may not be effective in reducing total aircraft system noise. For new aircraft with BPR less than 9 or 10, they may offer some additional noise reduction over the Medium term technology concepts, assuming that they can augment the jet noise reduction of those technologies. However, they may not be additive, and the combined benefit may be less than the sum of the separate benefits. The IEP view is that the anticipated potential benefits on the average are approximately an additional 1.0 EPNdB in jet component EPNL, plus or minus 1.0 EPNdB, over and above that provided by the Medium term technologies. The total aircraft system impact will of course depend on the propulsion system cycle, the aircraft performance and the component contributions of other noise sources.
5.2.3 Airframe 5.2.3.1 Landing gear Starting from a low noise design, the only technology which may be available for additional noise reduction uses flow control, today at TRL 1 to 2. The expected noise reduction is no more than 1 dB at the component level, which is additive to the benefit of the low noise design, but is so small that it would be not very significant at the aircraft level.
The IEP concluded that no additional noise reduction can be expected for a conventional configuration (under the wing installed engine). It appears that the only way to obtain more landing gear noise reduction at the approach condition seems to be the development of fuselage mounted short landing gear, which of course necessitates corresponding change of the aircraft structure, as described in Reference IEP05.1. 5.2.3.2 High lift devices Slat and flap low noise designs (including in particular the slat cove filler), today at TRL 1 to 2 are expected to be at TRL 6 by 2020 with a potential of 5 dB maximum reduction at the component level. These technologies, their projected benefits and their anticipated integration issues are summarized in table 5.2.3.1 below based on slide 17 presented in ―Airframe noise,‖ reference IER2008-08.
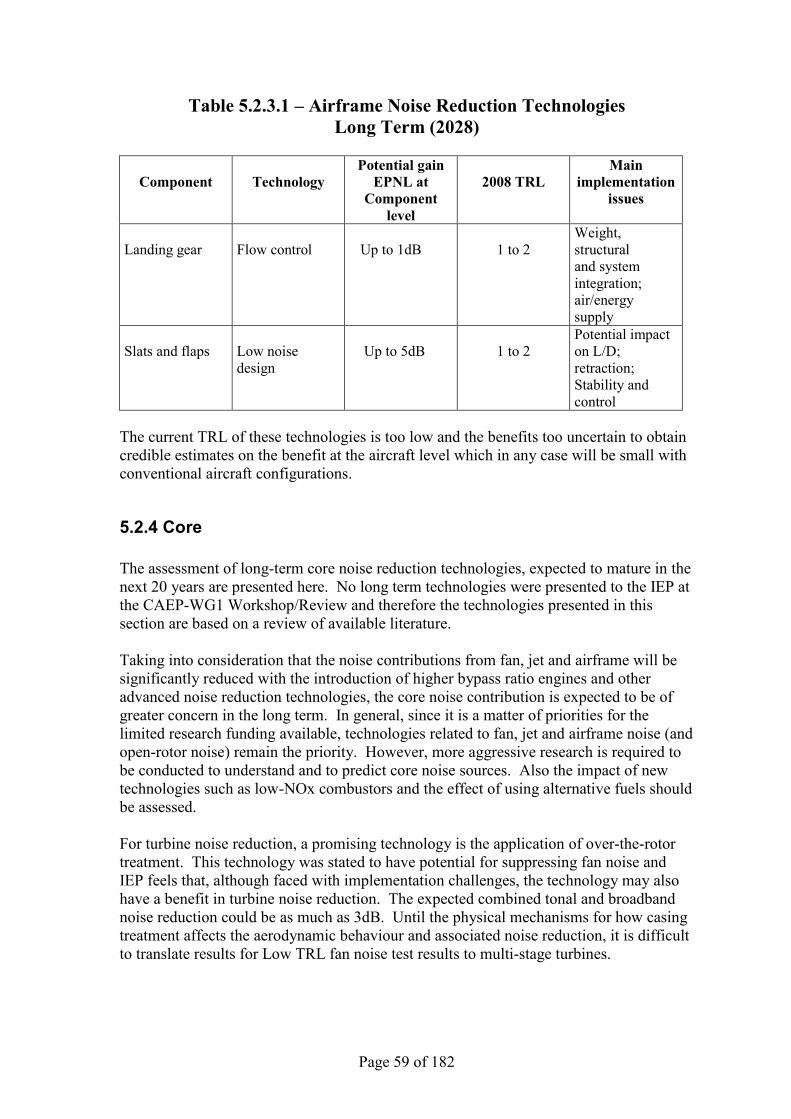
Page 59 of 182
Table 5.2.3.1 – Airframe Noise Reduction Technologies Long Term (2028)
Component
Technology Potential gain
EPNL at Component
level
2008 TRL
Main implementation
issues
Landing gear
Flow control
Up to 1dB
1 to 2
Weight, structural and system integration; air/energy supply
Slats and flaps
Low noise design
Up to 5dB
1 to 2
Potential impact on L/D; retraction; Stability and control
The current TRL of these technologies is too low and the benefits too uncertain to obtain credible estimates on the benefit at the aircraft level which in any case will be small with conventional aircraft configurations.
5.2.4 Core The assessment of long-term core noise reduction technologies, expected to mature in the next 20 years are presented here. No long term technologies were presented to the IEP at the CAEP-WG1 Workshop/Review and therefore the technologies presented in this section are based on a review of available literature. Taking into consideration that the noise contributions from fan, jet and airframe will be significantly reduced with the introduction of higher bypass ratio engines and other advanced noise reduction technologies, the core noise contribution is expected to be of greater concern in the long term. In general, since it is a matter of priorities for the limited research funding available, technologies related to fan, jet and airframe noise (and open-rotor noise) remain the priority. However, more aggressive research is required to be conducted to understand and to predict core noise sources. Also the impact of new technologies such as low-NOx combustors and the effect of using alternative fuels should be assessed. For turbine noise reduction, a promising technology is the application of over-the-rotor treatment. This technology was stated to have potential for suppressing fan noise and IEP feels that, although faced with implementation challenges, the technology may also have a benefit in turbine noise reduction. The expected combined tonal and broadband noise reduction could be as much as 3dB. Until the physical mechanisms for how casing treatment affects the aerodynamic behaviour and associated noise reduction, it is difficult to translate results for Low TRL fan noise test results to multi-stage turbines.

Page 60 of 182
From a liner treatment perspective, ceramic and metal foams increase the temperature range, but are heavy and need to address contamination issues in an engine environment. The TRL of these liners was reported to be low (TRL 1 to 3). In the case of combustor, the technologies with noise reduction potentials include: multi-stage combustor design and application of aerated injectors instead of high pressure injectors. Another combustor noise suppression method includes enlarging chamber cross-section area at locations where combustion takes place. The trade-off with respect to emissions will have to be assessed. For compressor noise reduction, long term technologies may include the application of active clearance control. However, since no supporting data is yet available, it is not possible to predict the noise reduction gain. For core noise in general, the long term noise reduction potential beyond the mid-term 2018 time period relies on very low TRL technologies, for which no quantitative evidence is available to project their benefits. The IEP therefore cannot project core noise reduction benefits beyond 2018, other than perhaps suggesting that the mid-term technology reductions might achieve better noise reductions following additional development and refinement.

Page 61 of 182
5.2.5 Nacelle & Liners Nacelle and liner technologies that were identified at the Review for Long term applications include optimized zone liners, aft cowl liners, acoustic splitters in the bypass duct, and active/adaptive liners. Scarf inlets were discussed earlier under the Medium term time frame but have been added to the long-term technology list due to uncertainties over aerodynamic performance penalties. The IEP also suggests that HQ Tubes will not be matured until they can demonstrate higher noise reduction and therefore has been moved to the long-term technology list. The TRL for long-term technologies ranges from 3 to 4. Some of these technologies may be applied to other noise sources such as the core, but the primary target appears to be the fan noise.
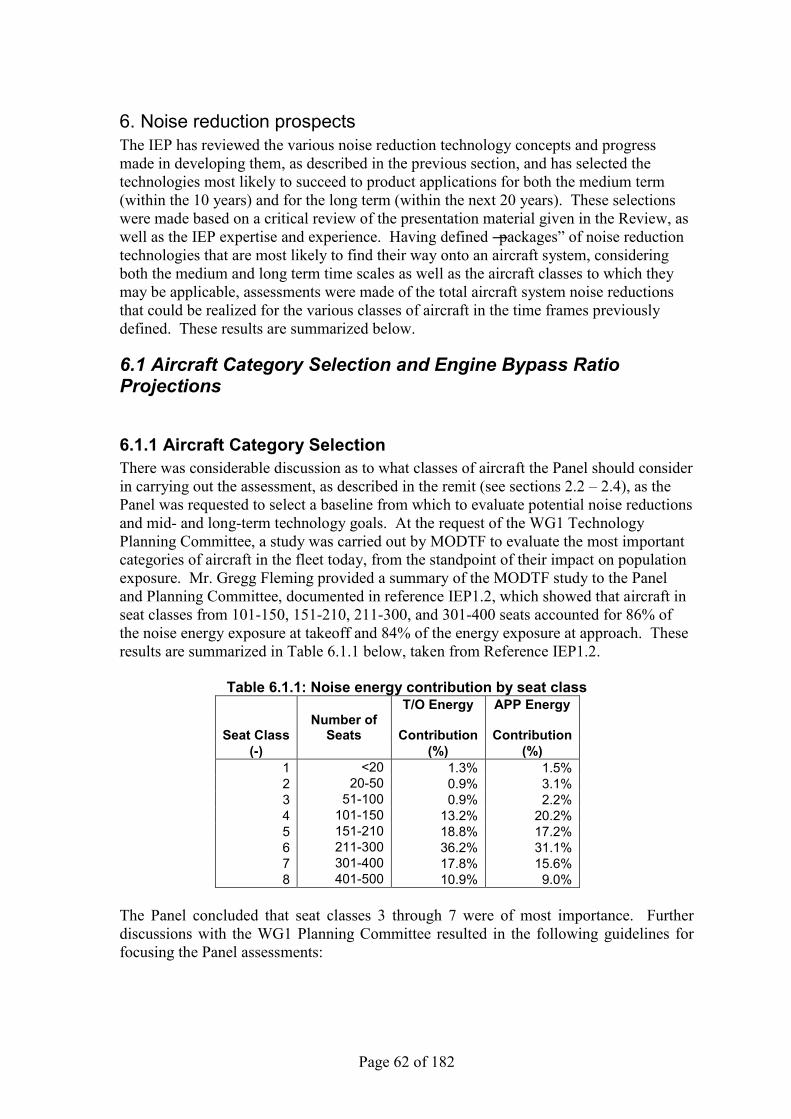
Page 62 of 182
6. Noise reduction prospects The IEP has reviewed the various noise reduction technology concepts and progress made in developing them, as described in the previous section, and has selected the technologies most likely to succeed to product applications for both the medium term (within the 10 years) and for the long term (within the next 20 years). These selections were made based on a critical review of the presentation material given in the Review, as well as the IEP expertise and experience. Having defined ―packages‖ of noise reduction technologies that are most likely to find their way onto an aircraft system, considering both the medium and long term time scales as well as the aircraft classes to which they may be applicable, assessments were made of the total aircraft system noise reductions that could be realized for the various classes of aircraft in the time frames previously defined. These results are summarized below.
6.1 Aircraft Category Selection and Engine Bypass Ratio Projections
6.1.1 Aircraft Category Selection There was considerable discussion as to what classes of aircraft the Panel should consider in carrying out the assessment, as described in the remit (see sections 2.2 – 2.4), as the Panel was requested to select a baseline from which to evaluate potential noise reductions and mid- and long-term technology goals. At the request of the WG1 Technology Planning Committee, a study was carried out by MODTF to evaluate the most important categories of aircraft in the fleet today, from the standpoint of their impact on population exposure. Mr. Gregg Fleming provided a summary of the MODTF study to the Panel and Planning Committee, documented in reference IEP1.2, which showed that aircraft in seat classes from 101-150, 151-210, 211-300, and 301-400 seats accounted for 86% of the noise energy exposure at takeoff and 84% of the energy exposure at approach. These results are summarized in Table 6.1.1 below, taken from Reference IEP1.2.
Table 6.1.1: Noise energy contribution by seat class T/O Energy APP Energy
Seat Class Number of
Seats Contribution Contribution (-) (%) (%)
1 <20 1.3% 1.5% 2 20-50 0.9% 3.1% 3 51-100 0.9% 2.2% 4 101-150 13.2% 20.2% 5 151-210 18.8% 17.2% 6 211-300 36.2% 31.1% 7 301-400 17.8% 15.6% 8 401-500 10.9% 9.0%
The Panel concluded that seat classes 3 through 7 were of most importance. Further discussions with the WG1 Planning Committee resulted in the following guidelines for focusing the Panel assessments:

Page 63 of 182
Business jets, seat class1, were dropped from further consideration, based on the MODTF results summarized in Table 1.4.1, and at the recommendation of the WG1 Planning Committee.
Regional jets in the mid-term (2018) would not be introduced which are completely new designs. Rather, small, retrofits of noise reduction features will most likely be introduced as they become mature. Regional jets are not likely to have bypass ratios greater than 9 in the mid-term time frame, and the technology benefits are likely to be comparable to those for short-medium range twin aircraft.
Long range 2-engine (twin) and 4-engine (quad) aircraft in the mid-term (2018) are likely to have the same acoustic performance as the current project aircraft already entered into the ―Best Practices Database‖ and these entries should be representative of what is achievable in the mid-term.
The IE Panel settled on four classes of aircraft, based on the MODTF study results and WG1 guidelines, for the purpose of recommending noise reduction goals in the mid- and long-term. These were as follows:
1. Regional Jets (RJ) 2. Short-Medium Range Jets (SMR2) 3. Long Range Twin Jets (LR2) 4. Long Range Quad Jets (LR4)
A study was made of the current Best Practices database noise levels for each of the above aircraft categories. Noise levels relative to ICAO Annex 16 Chapter 4 were studied as a function of certified Maximum Takeoff Gross Mass. From these data analyses, it was observed that various models of aircraft designs certified over the years exhibited an increasing cumulative noise level as the aircraft grew in capacity (MTOM) to meet customer requirements. For some aircraft categories, deviations from the nominal trends were identified which could be related to either introduction of non-optimum noise reduction features for specific customer requirements, or more advanced design features not present in other aircraft in the same category. Taking into account these deviations from common design practice, the Panel arrived at the following reference cumulative levels relative to Chapter 4, for the four aircraft categories listed above:
Table 6.1.0 – Reference Aircraft Take-off Weight and Noise Levels Aircraft Category MTOM, tonnes Cum Level re: Ch. 4, Regional Jet 40 -4 EPNdB Small-Med. Range Twin 78 -5 EPNdB Long-Range Twin 230 -6 EPNdB Long-Range Quad 440 -5 EPNdB
6.1.1.1 IEP2 Review For the second review, the same aircraft categories were used with emphasis on the small/medium range twin and the long range twin since advanced study information was available and new aircraft/engine development are expected by 2030. There was also interest in large turboprops with increased weight up to 53 tonnes. The IEP2 added large turboprops as a separate category for evaluating noise reduction technologies and projecting noise levels for future aircraft.
Page 64 of 182
IEP2 decided to maintain the same reference aircraft noise margins as in the original IEP, the rationale being as follows.
4. In order to maintain consistency with the Fuel Burn IEP, which for category SMR2 selected the A320-200 and the 737-800W.
5. Since the previous review only the A320-232 and -233 have entered service and these for the lower gross take-off weights are within the scatter of the previous data.
6. Similarly the A330-243 has been certified in 2010 at a MTOM of 182,000 kg, which also falls within the scatter of other aircraft.
For the Regional and LR4 there have been no new aircraft introduced into service between 2008 and 2010.
6.1.2 Engine Bypass Ratio Projections There are two major approaches to reducing aircraft noise that can contribute to both Medium term and Long term noise reduction goals. These are: (1) advanced noise reduction design features or Noise Reduction Technology (NRT) for the various components of both the propulsion system and the airframe, and (2) advances in propulsion system design which normally require increased Bypass Ratio (BPR) and therefore lower exhaust velocities. The IEP therefore focused on these two approaches. It was concluded that, for current aircraft propulsion systems, jet exhaust mixing noise is a dominant contributor to the total propulsion system and aircraft noise at takeoff, and that the most effective approach to reducing jet mixing noise is to increase bypass ratio. The IEP therefore requested and received input from the Working Group 1 (WG1) planning committee an estimate of the range of bypass ratios that are likely to be developed for the mid term and the long term, for several classes of aircraft. The recommended mid-term and long-term bypass ratio ranges for the selected reference aircraft categories provided by ICCAIA through the WG1 N29 Planning Committee are presented in figure 6.1.1. The IE Panel developed the following average bypass ratio variations from reference to mid-term to long-term aircraft designs based on: (1) the Best Practices Noise Database from which the reference aircraft were derived and (2) the recommended bypass ratios provided by ICCAIA through WG1 for the mid- and long-term shown in Fig. 6.1.1. These projected BPR variations are shown in Table 6.1.1.
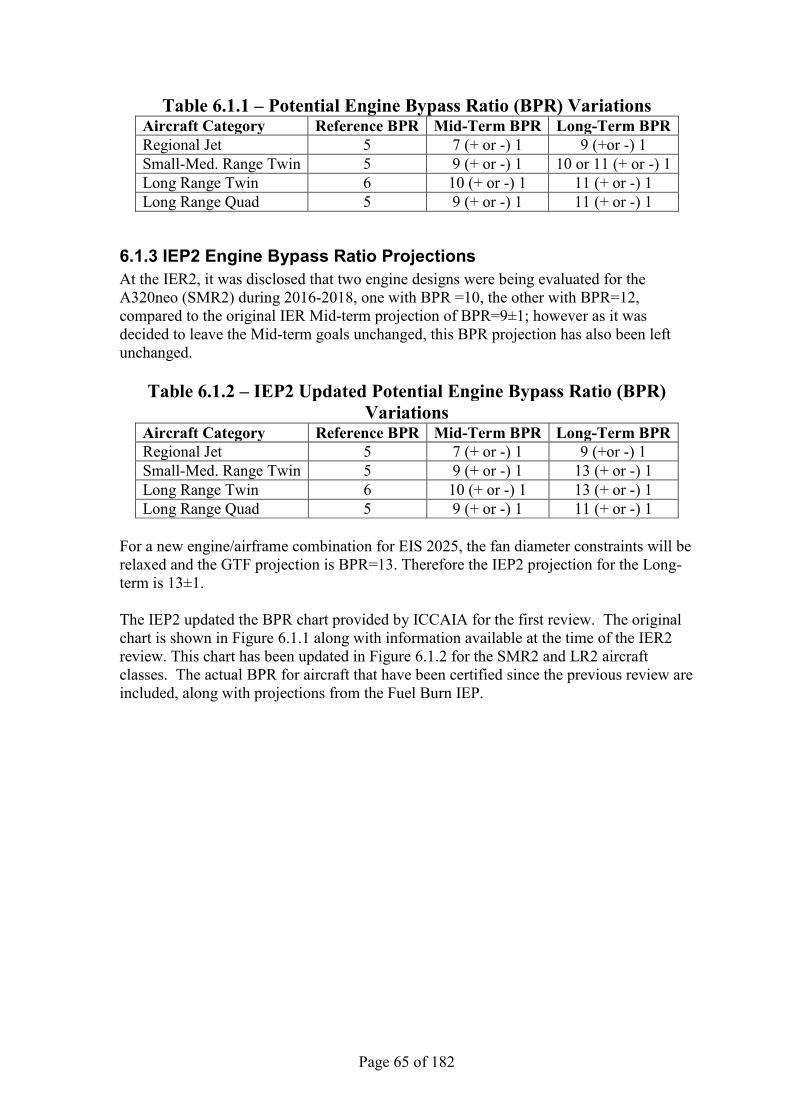
Page 65 of 182
Table 6.1.1 – Potential Engine Bypass Ratio (BPR) Variations Aircraft Category Reference BPR Mid-Term BPR Long-Term BPR Regional Jet 5 7 (+ or -) 1 9 (+or -) 1 Small-Med. Range Twin 5 9 (+ or -) 1 10 or 11 (+ or -) 1 Long Range Twin 6 10 (+ or -) 1 11 (+ or -) 1 Long Range Quad 5 9 (+ or -) 1 11 (+ or -) 1
6.1.3 IEP2 Engine Bypass Ratio Projections At the IER2, it was disclosed that two engine designs were being evaluated for the A320neo (SMR2) during 2016-2018, one with BPR =10, the other with BPR=12, compared to the original IER Mid-term projection of BPR=9±1; however as it was decided to leave the Mid-term goals unchanged, this BPR projection has also been left unchanged.
Table 6.1.2 – IEP2 Updated Potential Engine Bypass Ratio (BPR) Variations
Aircraft Category Reference BPR Mid-Term BPR Long-Term BPR Regional Jet 5 7 (+ or -) 1 9 (+or -) 1 Small-Med. Range Twin 5 9 (+ or -) 1 13 (+ or -) 1 Long Range Twin 6 10 (+ or -) 1 13 (+ or -) 1 Long Range Quad 5 9 (+ or -) 1 11 (+ or -) 1
For a new engine/airframe combination for EIS 2025, the fan diameter constraints will be relaxed and the GTF projection is BPR=13. Therefore the IEP2 projection for the Long-term is 13±1. The IEP2 updated the BPR chart provided by ICCAIA for the first review. The original chart is shown in Figure 6.1.1 along with information available at the time of the IER2 review. This chart has been updated in Figure 6.1.2 for the SMR2 and LR2 aircraft classes. The actual BPR for aircraft that have been certified since the previous review are included, along with projections from the Fuel Burn IEP.

Page 66 of 182
B787 Actual
B747 ActualIEP1 Mid-Term2018
IEP1 Long-Term2028
B787 Actual
B747 Actual
Fuel Burn IEP2020 & 2030
Figure 6.1.1: Projected Bypass ratio trends proposed by WG1, IEP1 and the Fuel Burn IEP plus recently certified aircraft

Page 67 of 182
1
SMR2 LR2
Bypass Ratio Range for Technology Scenarios
4
6
8
10
12
14
16
18
20
M
LM
L
M
L
ICCAIAMid-Term
2020
ICCAIALong-Term
2030SeaLevelStaticBypassRatio
IEP1Mid-Term
2018
IEP1Long-Term
2028
B787 Actual
Fuel Burn IEP2020 & 2030
IEP2 Mid-Term
2020
IEP2Long-Term
2030Most Likely Future Target Values
M
L
L
L
L
M
M MMM
L
L
Figure 6.1.2: Projected Bypass ratio trends proposed by WG1, the Fuel Burn IEP and IEP2 plus recently certified aircraft
Page 68 of 182
6.2 Pilot Studies
6.2.1 Introduction During the IEP preliminary assessment, it became clear that the information provided on the noise reduction benefits of the technology packages would be insufficient, on its own, to determine the benefits on aircraft system noise. System noise reductions are determined not only by the component noise reductions (fan, jet, core and airframe) but the relative levels of each component. This source component balance varies with certification point, aircraft class (e.g. Regional jets, Short/medium range aircraft and Long-range aircraft), engine type and manufacturer and so on. Although it is possible to make approximate estimates of the source balance, details on this are generally of a proprietary nature, as are details of the component noise reductions. However, bearing in mind that we are attempting here to establish trends in aircraft system noise reduction, the IEP proposed that a ‗Pilot Study‘ assessment be conducted by the one or more aircraft companies, to provide an example of the system noise benefits in the Short/Medium range class due to (a) a significant increase in engine bypass ratio, and (b) the noise reduction technologies selected by the IEP for the Medium term, relative to a baseline aircraft. Two companies agreed to carry out a Pilot Study, designated Pilot 1 and Pilot 2. If successful, it was anticipated that a similar study could be conducted in the Long-range aircraft class; however, the companies involved were not prepared to do this for the following reasons. Trends in the noise of long range twin aircraft in the Medium term is already determined by the future introduction into service of the Boeing B787 and the Airbus A350, for which noise estimates have already been published. Further, these anticipated new aircraft introductions will have several of the component noise reduction technologies previously discussed already incorporated. Finally, no other additional conventional long range twin aircraft are expected in the Medium term. The same applies in the Long term, although it is conceivable that an un-conventional aircraft may be launched within this time frame (see Section 6.3). Arguably an assessment should be made as to the benefit of noise technology packages to, say, growth versions of long range twins, but this requires some working knowledge of the source balance of both existing twins and the new twins mentioned above. This could be attempted if the source balance data were made available. Similar arguments apply to the long range quads; in the Medium term we will see the introduction of the B747-8, for which noise estimates are available. Otherwise no new or growth versions are anticipated in this class. In the long term an assessment should be made as to the benefit of noise technology packages to, say, growth versions of long range quads but again this requires some working knowledge of the source balance of both existing quads and the 747-8. This could be attempted if the source balance data were made available.

Page 69 of 182
6.2.2 Pilot Study Specification At the WG 1/IEP meeting on 2 December 2008, it was agreed that the two ICCAIA companies would supply information to the IEP in the form of System/Component sensitivity and ‗Δ Component EPNL‘ data for a high BPR Virtual Platform (VP) in the Short/Medium Range Twin class, termed the ‗VP SR High‘. This VP would incorporate most if not all the noise reduction technologies identified by the IEP. These pilot studies would support the current IEP assessment and if successful would be repeated for VP‘s in other classes of aircraft. The IEP agreed to outline the pilot process and to supply a definition of the information required, which is given below.
IEP to specify Noise Reduction Technology Package (NRTP) list for this ―Virtual Platform‖ (VP).
Pilot 1 & 2 studies to produce the following information. 1. The System EPNL of the Reference Aircraft at the three certification points. 2. Confirm BPR of VP SR High (BPR=7-13). 3. Δ System EPNL at the three certification points for the VP relative to the reference aircraft. 4. Component Δ EPNL reductions for each NRTP item per noise source component 5. System sensitivity for each noise source component, i.e. Δ System EPNL/ Δ Component EPNL
The recommended Noise Reduction Technology (NRT) packages suggested by the IEP are summarized in Table 6.2.1.
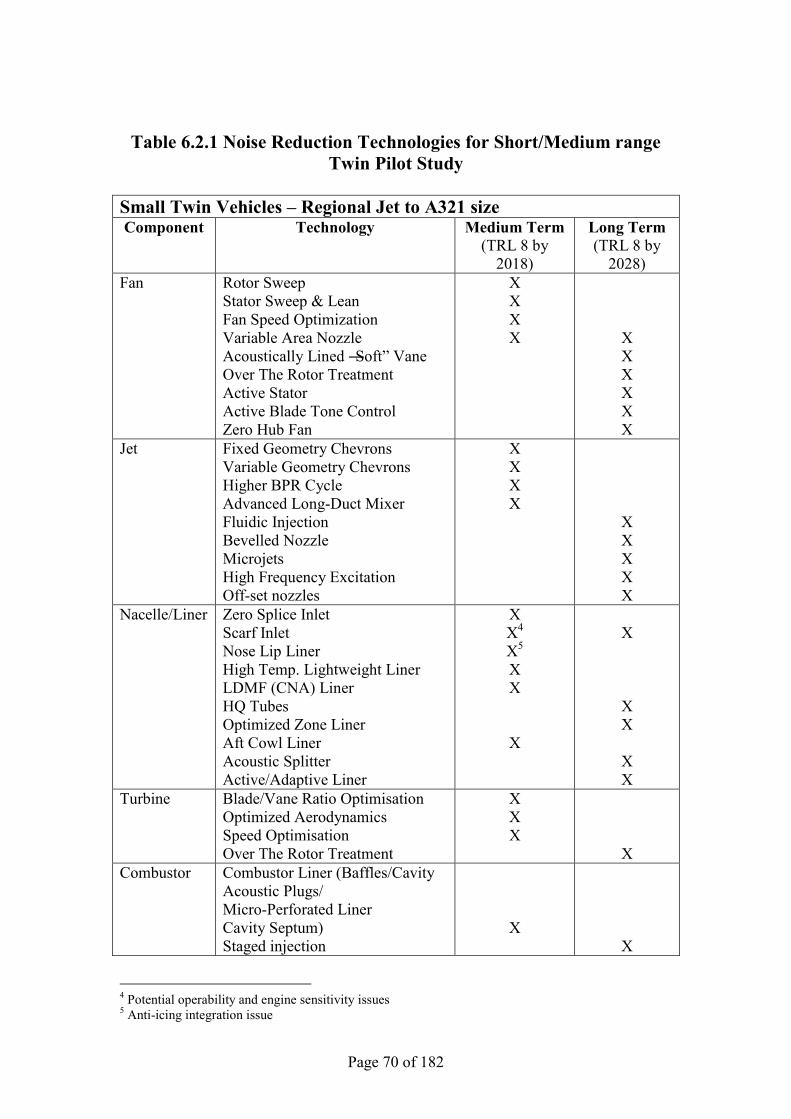
Page 70 of 182
Table 6.2.1 Noise Reduction Technologies for Short/Medium range Twin Pilot Study
Small Twin Vehicles – Regional Jet to A321 size Component Technology Medium Term
(TRL 8 by 2018)
Long Term (TRL 8 by
2028) Fan Rotor Sweep
Stator Sweep & Lean Fan Speed Optimization Variable Area Nozzle Acoustically Lined ―Soft‖ Vane Over The Rotor Treatment Active Stator Active Blade Tone Control Zero Hub Fan
X X X X
X X X X X X
Jet Fixed Geometry Chevrons Variable Geometry Chevrons Higher BPR Cycle Advanced Long-Duct Mixer Fluidic Injection Bevelled Nozzle Microjets High Frequency Excitation Off-set nozzles
X X X X
X X X X X
Nacelle/Liner Zero Splice Inlet Scarf Inlet Nose Lip Liner High Temp. Lightweight Liner LDMF (CNA) Liner HQ Tubes Optimized Zone Liner Aft Cowl Liner Acoustic Splitter Active/Adaptive Liner
X X4 X5 X X
X
X
X X
X X
Turbine Blade/Vane Ratio Optimisation Optimized Aerodynamics Speed Optimisation Over The Rotor Treatment
X X X
X Combustor Combustor Liner (Baffles/Cavity
Acoustic Plugs/ Micro-Perforated Liner Cavity Septum) Staged injection
X
X
4 Potential operability and engine sensitivity issues 5 Anti-icing integration issue
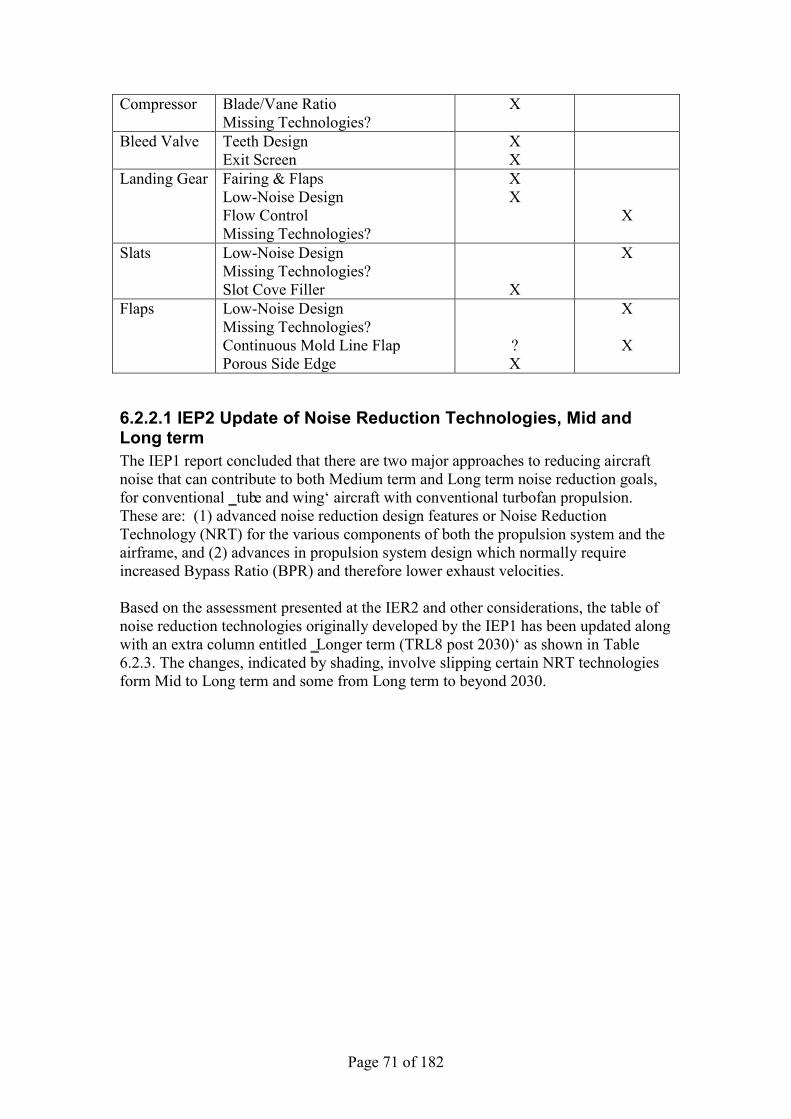
Page 71 of 182
Compressor Blade/Vane Ratio Missing Technologies?
X
Bleed Valve Teeth Design Exit Screen
X X
Landing Gear Fairing & Flaps Low-Noise Design Flow Control Missing Technologies?
X X
X
Slats Low-Noise Design Missing Technologies? Slot Cove Filler
X
X
Flaps Low-Noise Design Missing Technologies? Continuous Mold Line Flap Porous Side Edge
? X
X
X
6.2.2.1 IEP2 Update of Noise Reduction Technologies, Mid and Long term The IEP1 report concluded that there are two major approaches to reducing aircraft noise that can contribute to both Medium term and Long term noise reduction goals, for conventional ‗tube and wing‘ aircraft with conventional turbofan propulsion. These are: (1) advanced noise reduction design features or Noise Reduction Technology (NRT) for the various components of both the propulsion system and the airframe, and (2) advances in propulsion system design which normally require increased Bypass Ratio (BPR) and therefore lower exhaust velocities. Based on the assessment presented at the IER2 and other considerations, the table of noise reduction technologies originally developed by the IEP1 has been updated along with an extra column entitled ‗Longer term (TRL8 post 2030)‘ as shown in Table 6.2.3. The changes, indicated by shading, involve slipping certain NRT technologies form Mid to Long term and some from Long term to beyond 2030.
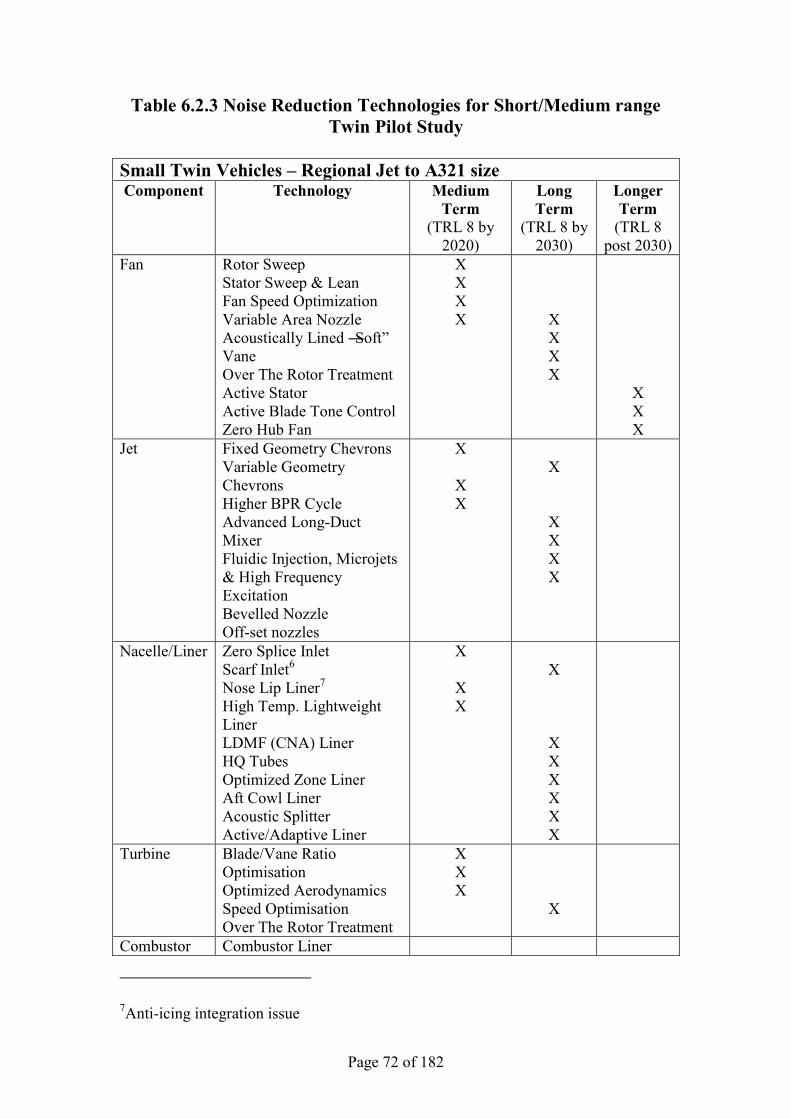
Page 72 of 182
Table 6.2.3 Noise Reduction Technologies for Short/Medium range Twin Pilot Study
Small Twin Vehicles – Regional Jet to A321 size Component Technology Medium
Term (TRL 8 by
2020)
Long Term
(TRL 8 by 2030)
Longer Term
(TRL 8 post 2030)
Fan Rotor Sweep Stator Sweep & Lean Fan Speed Optimization Variable Area Nozzle Acoustically Lined ―Soft‖ Vane Over The Rotor Treatment Active Stator Active Blade Tone Control Zero Hub Fan
X X X X
X X X X
X X X
Jet Fixed Geometry Chevrons Variable Geometry Chevrons Higher BPR Cycle Advanced Long-Duct Mixer Fluidic Injection, Microjets & High Frequency Excitation Bevelled Nozzle Off-set nozzles
X
X X
X
X X X X
Nacelle/Liner Zero Splice Inlet Scarf Inlet6 Nose Lip Liner7 High Temp. Lightweight Liner LDMF (CNA) Liner HQ Tubes Optimized Zone Liner Aft Cowl Liner Acoustic Splitter Active/Adaptive Liner
X
X X
X
X X X X X X
Turbine Blade/Vane Ratio Optimisation Optimized Aerodynamics Speed Optimisation Over The Rotor Treatment
X X X
X
Combustor Combustor Liner
7Anti-icing integration issue
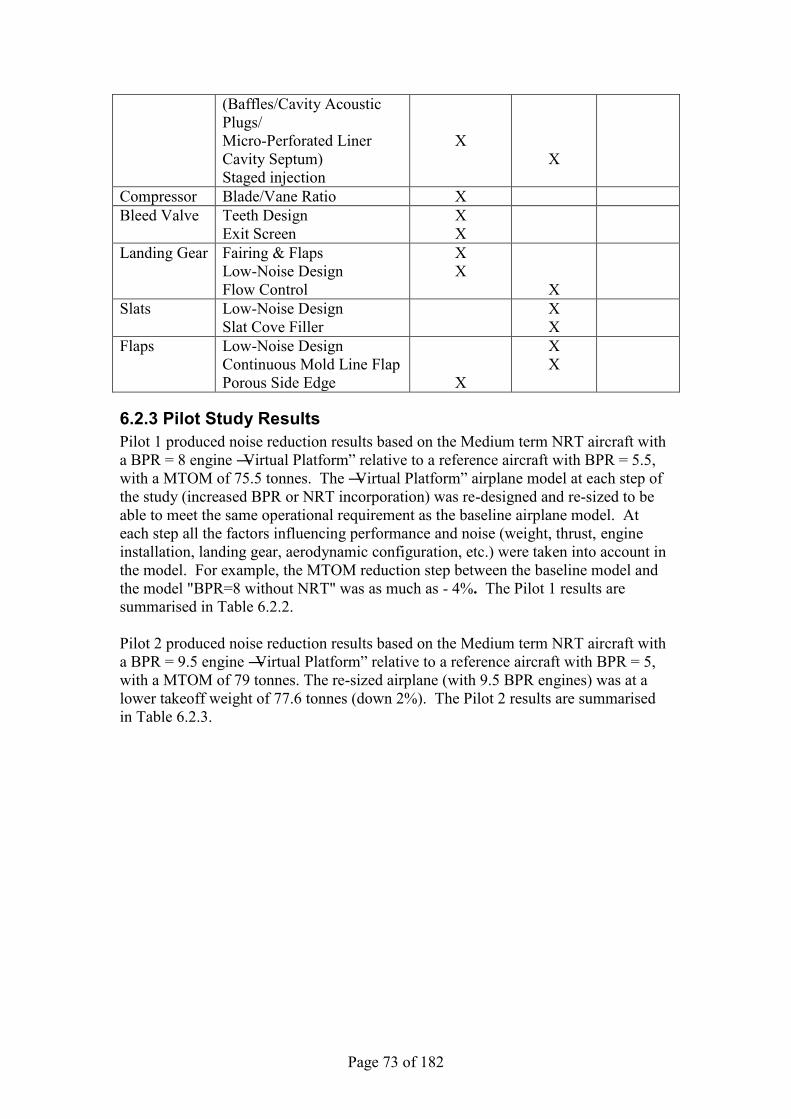
Page 73 of 182
(Baffles/Cavity Acoustic Plugs/ Micro-Perforated Liner Cavity Septum) Staged injection
X
X
Compressor Blade/Vane Ratio X Bleed Valve Teeth Design
Exit Screen X X
Landing Gear Fairing & Flaps Low-Noise Design Flow Control
X X
X
Slats Low-Noise Design Slat Cove Filler
X X
Flaps Low-Noise Design Continuous Mold Line Flap Porous Side Edge
X
X X
6.2.3 Pilot Study Results Pilot 1 produced noise reduction results based on the Medium term NRT aircraft with a BPR = 8 engine ―Virtual Platform‖ relative to a reference aircraft with BPR = 5.5, with a MTOM of 75.5 tonnes. The ―Virtual Platform‖ airplane model at each step of the study (increased BPR or NRT incorporation) was re-designed and re-sized to be able to meet the same operational requirement as the baseline airplane model. At each step all the factors influencing performance and noise (weight, thrust, engine installation, landing gear, aerodynamic configuration, etc.) were taken into account in the model. For example, the MTOM reduction step between the baseline model and the model "BPR=8 without NRT" was as much as - 4%. The Pilot 1 results are summarised in Table 6.2.2. Pilot 2 produced noise reduction results based on the Medium term NRT aircraft with a BPR = 9.5 engine ―Virtual Platform‖ relative to a reference aircraft with BPR = 5, with a MTOM of 79 tonnes. The re-sized airplane (with 9.5 BPR engines) was at a lower takeoff weight of 77.6 tonnes (down 2%). The Pilot 2 results are summarised in Table 6.2.3.
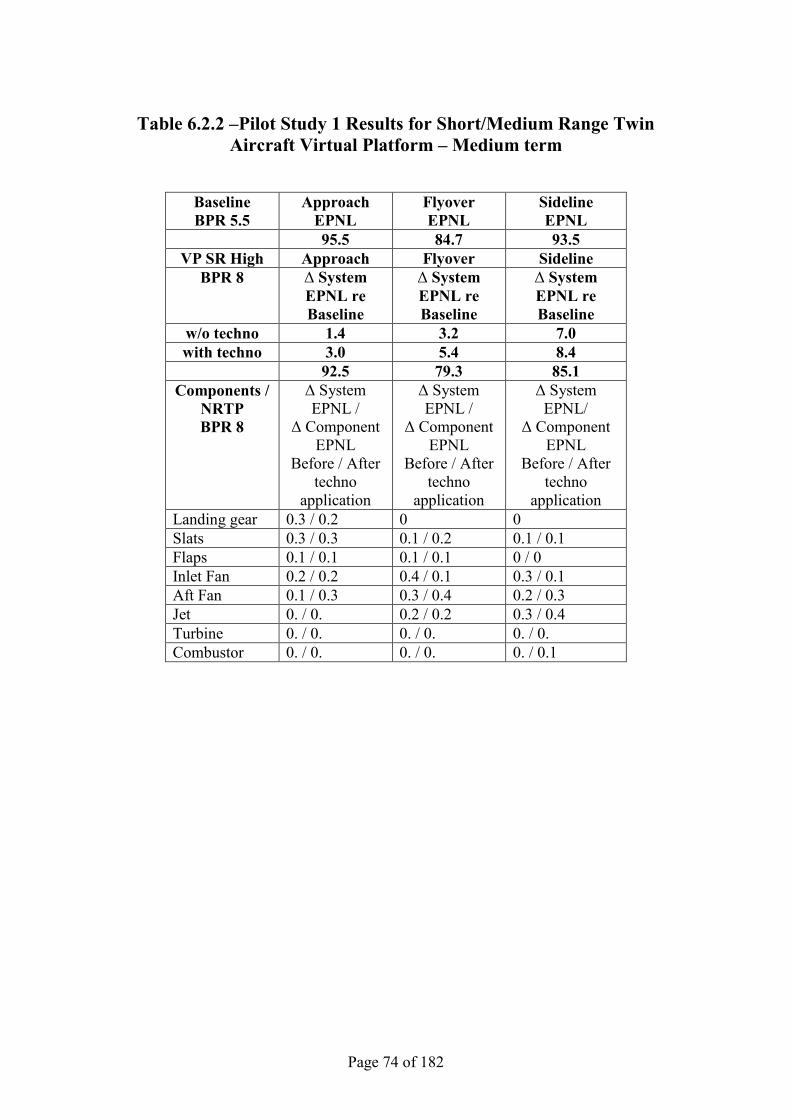
Page 74 of 182
Table 6.2.2 –Pilot Study 1 Results for Short/Medium Range Twin
Aircraft Virtual Platform – Medium term
Baseline BPR 5.5
Approach EPNL
Flyover EPNL
Sideline EPNL
95.5 84.7 93.5 VP SR High Approach Flyover Sideline
BPR 8 Δ System EPNL re Baseline
Δ System EPNL re Baseline
Δ System EPNL re Baseline
w/o techno 1.4 3.2 7.0 with techno 3.0 5.4 8.4
92.5 79.3 85.1 Components /
NRTP BPR 8
Δ System EPNL /
Δ Component EPNL
Before / After techno
application
Δ System EPNL /
Δ Component EPNL
Before / After techno
application
Δ System EPNL/
Δ Component EPNL
Before / After techno
application Landing gear 0.3 / 0.2 0 0 Slats 0.3 / 0.3 0.1 / 0.2 0.1 / 0.1 Flaps 0.1 / 0.1 0.1 / 0.1 0 / 0 Inlet Fan 0.2 / 0.2 0.4 / 0.1 0.3 / 0.1 Aft Fan 0.1 / 0.3 0.3 / 0.4 0.2 / 0.3 Jet 0. / 0. 0.2 / 0.2 0.3 / 0.4 Turbine 0. / 0. 0. / 0. 0. / 0. Combustor 0. / 0. 0. / 0. 0. / 0.1
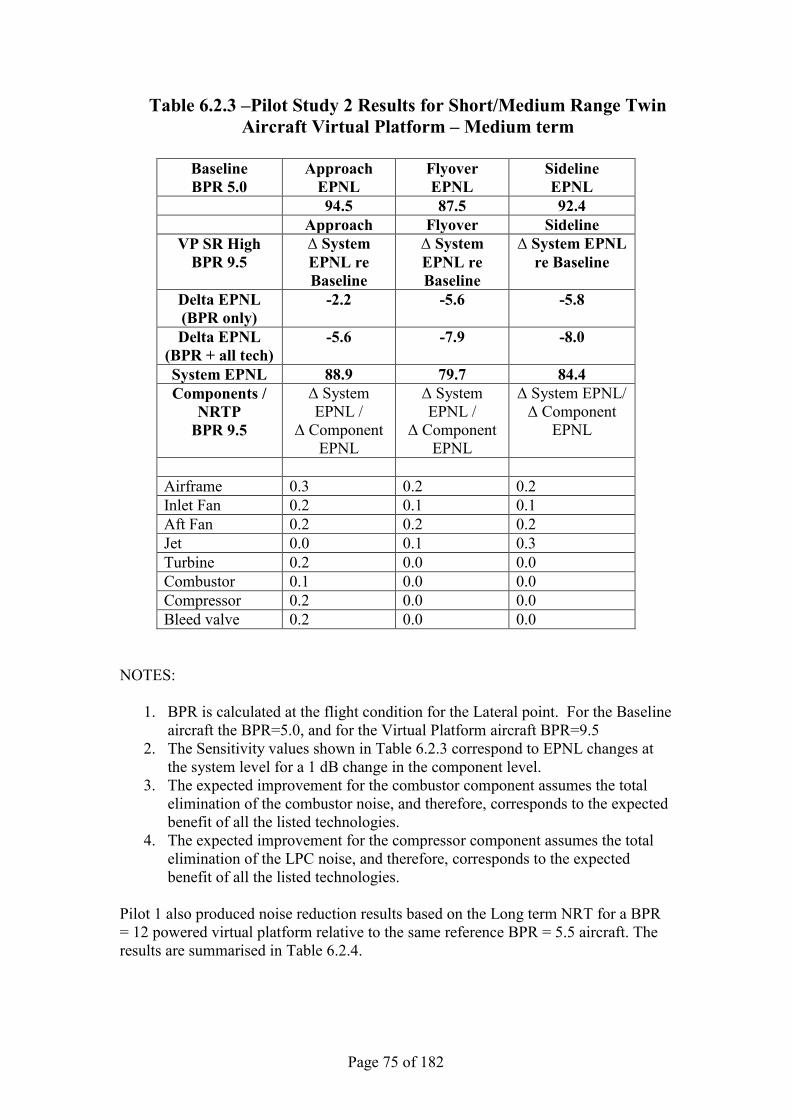
Page 75 of 182
Table 6.2.3 –Pilot Study 2 Results for Short/Medium Range Twin Aircraft Virtual Platform – Medium term
Baseline BPR 5.0
Approach EPNL
Flyover EPNL
Sideline EPNL
94.5 87.5 92.4 Approach Flyover Sideline
VP SR High BPR 9.5
Δ System EPNL re Baseline
Δ System EPNL re Baseline
Δ System EPNL re Baseline
Delta EPNL (BPR only)
-2.2 -5.6 -5.8
Delta EPNL (BPR + all tech)
-5.6 -7.9 -8.0
System EPNL 88.9 79.7 84.4 Components /
NRTP BPR 9.5
Δ System EPNL /
Δ Component EPNL
Δ System EPNL /
Δ Component EPNL
Δ System EPNL/ Δ Component
EPNL
Airframe 0.3 0.2 0.2 Inlet Fan 0.2 0.1 0.1 Aft Fan 0.2 0.2 0.2 Jet 0.0 0.1 0.3 Turbine 0.2 0.0 0.0 Combustor 0.1 0.0 0.0 Compressor 0.2 0.0 0.0 Bleed valve 0.2 0.0 0.0
NOTES:
1. BPR is calculated at the flight condition for the Lateral point. For the Baseline aircraft the BPR=5.0, and for the Virtual Platform aircraft BPR=9.5
2. The Sensitivity values shown in Table 6.2.3 correspond to EPNL changes at the system level for a 1 dB change in the component level.
3. The expected improvement for the combustor component assumes the total elimination of the combustor noise, and therefore, corresponds to the expected benefit of all the listed technologies.
4. The expected improvement for the compressor component assumes the total elimination of the LPC noise, and therefore, corresponds to the expected benefit of all the listed technologies.
Pilot 1 also produced noise reduction results based on the Long term NRT for a BPR = 12 powered virtual platform relative to the same reference BPR = 5.5 aircraft. The results are summarised in Table 6.2.4.

Page 76 of 182
Table 6.2.4 –Pilot Study 1 Results for Short/Medium Range Twin Aircraft Virtual Platform – Long term
Short Medium range
twin a/c Approach
EPNL Flyover EPNL
Lateral EPNL
Baseline BPR 5.5 95.5 84.7 93.5 Technology Platform
BPR 8 Δ System EPNL re Baseline
Δ System EPNL re Baseline
Δ System EPNL re Baseline
w/o MT techno -1.4 -3.2 -7.0 with MT techno -3.0 -5.4 -8.4
Approach EPNL
Flyover EPNL Lateral EPNL
TP BPR8 92.5 79.3 85.1 Components / NRTP
BPR 8 Δ System EPNL / Δ Comp. EPNL Before / After
techno application
Δ System EPNL / Δ Comp. EPNL Before / After
techno application
System EPNL / Δ Comp. EPNL Before / After
techno application Landing gear 0.3 / 0.2 0 0 Slats 0.3 / 0.3 0.1 / 0.2 0.1 / 0.1 Flaps 0.1 / 0.1 0.1 / 0.1 0 / 0 Inlet Fan 0.2 / 0.2 0.4 / 0.1 0.3 / 0.1 Aft Fan 0.1 / 0.3 0.3 / 0.4 0.2 / 0.3 Jet 0. / 0. 0.2 / 0.2 0.3 / 0.4 Turbine 0. / 0. 0. / 0. 0. / 0. Combustor 0. / 0. 0. / 0. 0. / 0.1 Compressor 0. / 0. 0. / 0. 0. / 0.
Technology Platform BPR 12
Δ System EPNL re Baseline
Δ System EPNL re Baseline
Δ System EPNL re Baseline
w/o MT techno* -1.8 -4.9 -10.9 w/o LT techno** -3.2 -6.0 -11.2
with MT & LT techno -3.8 -6.4 -11.6 Approach
EPNL Flyover EPNL Lateral EPNL
TP BPR12 91.7 78.3 81.9 Components / NRTP
BPR 12 Δ System EPNL / Δ Comp. EPNL
After techno application
Δ System EPNL / Δ Comp. EPNL
After techno application
System EPNL / Δ Comp. EPNL
After techno application
Landing gear 0.2 0.0 0.0 Slats 0.3 0.3 0.2 Flaps 0.1 0.1 0.1 Inlet Fan 0.2 0.1 0.1 Aft Fan 0.2 0.3 0.4 Jet 0.0 0.1 0.1 Turbine 0.0 0.0 0.0 Combustor 0.0 0.2 0.2 Compressor 0.0 0.0 0.0
Note: In the above table, technologies included in the BPR12 virtual platform are:

Page 77 of 182
*Mid term: zero splice intake, lip liner, negatively scarfed intake, low frequency hot stream liners, low noise LP compressor, low noise LP turbine, low noise landing gears design, high lift add on treatment **Long term: Bypass duct splitters, Active fan stators The IEP Chair, Phil Gliebe, conducted a mini-pilot study to complement the manufacturer-supplied pilot studies, and enable the IEP to independently assess trends. This was based on a proprietary empirical correlation of component EPNL as a function of cycle parameters. It used the A321-200 of MTOM 93 tonnes as a reference aircraft and ‗perturbed‘ the reference engine cycle by varying jet exhaust mixed velocity, computing other cycle parameters including BPR, while holding net thrust and core airflow constant. It re-computed the component EPNL values and summed these to obtain new system noise levels vs. BPR, anchored to reference aircraft levels. The results may be optimistic in that the method neglected the increase in nacelle drag as fan diameter increases, and neglected potential reduction in fan liner suppression if treatment L/D cannot be maintained. Aircraft re-sizing was also neglected. The results were used to confirm Pilot study 1 & 2 trends and helped define Noise vs. Bypass Ratio trend lines.
6.2.4 Summary of Pilot Study Noise Reduction Technology results The reductions obtained in the Pilot 1 & 2 studies for the benefits of NRT are summarised below for the Mid-term NRT and the combined effect of Mid-term and Long-term NRT, in Table 6.2.5. For the Mid-term NRT, The IEP has also assessed the NRT results obtained in the AST studies, and generated statistical averages of the 1, 2 and AST values, which are also shown in the table. Based on all three values, the IEP recommends the values shown in the following line. For the combined Mid-term and Long-term NRT, there are only the Pilot 1 and AST results.
Table 6.2.5 – Pilot Study NRT EPNL noise reductions for Short/Medium Range Twin (SMR2)
Mid-term NRT Pilot Approach Flyover Lateral Cumulative 1 1.6 2.2 1.4 5.2 2 3.4 2.3 2.0 7.9 AST 1.6 2.1 2.0 5.7 IEP 2.0 2.0 1.5 5.5 Mid-term & Long-term NRT 1 2.0 1.5 0.7 4.2 AST 1.8 2.1 2.0 5.7 IEP 2.5 2.5 2.0 7.0
6.2.5 IEP2 noise data sources (NASA, Boeing ERA & Lockheed ERA, MIT, NACRE) The sources of noise data identified by IEP2 for the novel aircraft and engine concepts include the CROR data from the IER2 and NASA/GE, the UHB data from NASA,

Page 78 of 182
advanced concept studies from Boeing ERA, Lockheed ERA and MIT, and supporting information on shielding of tail mounted CROR and UHB engines from NACRE. NASA conducted studies for the IEP2 comparing UHB and Open Rotor engine concepts for SMR2 aircraft. ICCAIA provided data for Open Rotor and large turboprops. In addition to these sources of information, IEP2 has conducted its own pilot studies of UHB turbofan and turboprop powered aircraft, as outlined below. IEP2 Pilot Study The IEP2 conducted its own pilot study of UHB engine powered conventional tube & wing aircraft in both the SMR2 and LR2 categories, by correlating existing noise certification data at each certification point, using an appropriate selection of the controlling physical parameters. Using these correlations the noise margins of UHB powered conventional tube & wing aircraft have been predicted over a range of BPR from just under 11 to nearly 18, for the SMR2 and LR2 categories and are included in charts described in sections 6.3.2.1 and 6.3.3.1. The EPNL values at the lateral measuring point were made independent of thrust by normalizing them with a reference thrust (100 kN was chosen). The normalized EPNL values were correlated with an effective jet speed based on the jet speed of the fully mixed jet and airspeed. The duration of the noise signal was corrected with airspeed. The jet speed was determined from the actual thrust at the lateral point with airspeed of V2+20 kts and from the inlet mass flow. V2 is the minimum airspeed at which the aircraft can safely be operated. The inlet mass flow was derived from a correlation between the fan diameter (normalized for a reference thrust) and the jet speed. The slope of the correlation line (EPNL vs. jet speed) was considerably decreased for the extrapolation to effective jet speeds smaller than 180 m/s to take into account that the relative contribution of jet mixing noise decreases and the noise reduction of fan noise may be less dependent on jet speed. A comparison between the certification data of several aircraft with the correlation is shown in Figure 6.2.0a. The scatter between the normalized noise levels of existing newer aircraft and the correlation is about ±1 EPNdB. The effective jet speed for the thrust-normalized noise level is defined as Ve=Vj
(1/3)(Vj-Vf)(2/3). The duration correction is 10*log(Vf/100 m/s). The climb rate correction takes account of the aircraft attitude and is defined by 2*log10(climb rate/0.15). Note that the correlation is valid for all aircraft categories. The EPNL at the flyover measuring point depends on the effective jet speed at cutback for an airspeed of V2+20 kts and the flyover altitude. The latter depends on the take-off field length, the initial climb ratio and the climb ratio at the flyover point. The climb ratios depend on the thrust-to-weight ratio and the lift-to-drag ratio. The field length depends on thrust-to-weight ratio and V2 speed of the aircraft. The scatter between the normalized noise levels of existing newer twin engine aircraft and the correlation is less than ±1 EPNdB, as shown in Figure 6.2.0b.
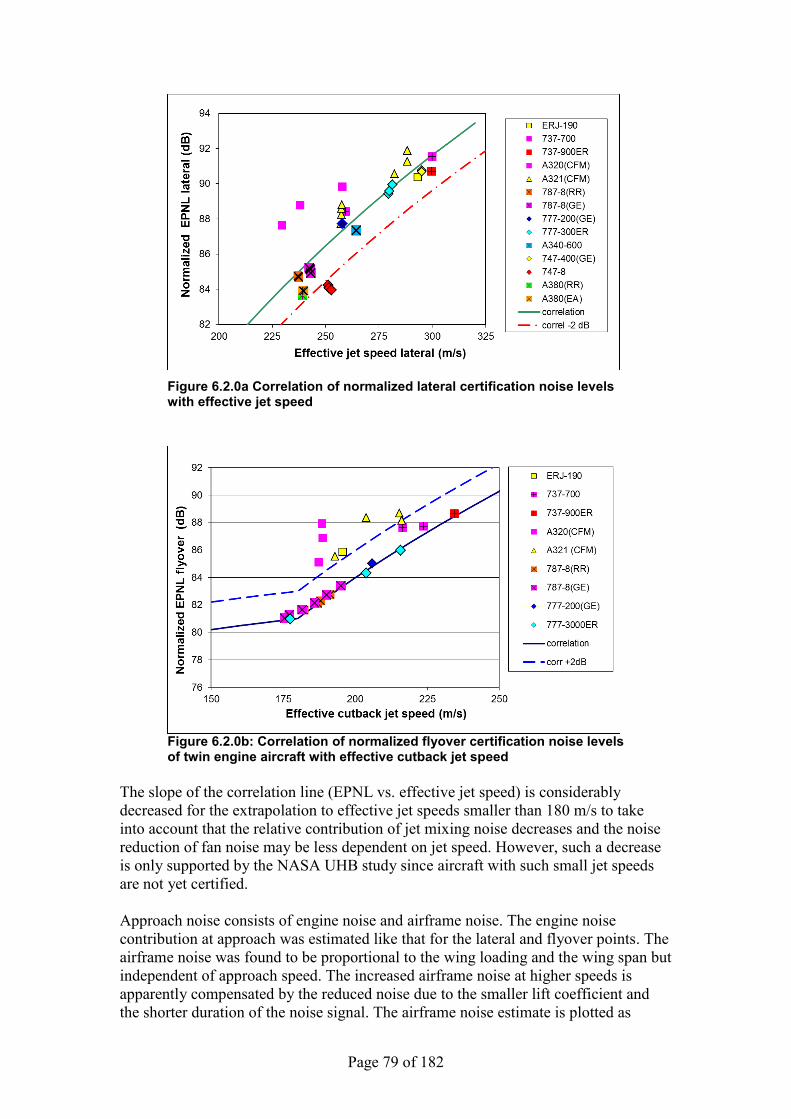
Page 79 of 182
Figure 6.2.0a Correlation of normalized lateral certification noise levels with effective jet speed
Figure 6.2.0b: Correlation of normalized flyover certification noise levels of twin engine aircraft with effective cutback jet speed
The slope of the correlation line (EPNL vs. effective jet speed) is considerably decreased for the extrapolation to effective jet speeds smaller than 180 m/s to take into account that the relative contribution of jet mixing noise decreases and the noise reduction of fan noise may be less dependent on jet speed. However, such a decrease is only supported by the NASA UHB study since aircraft with such small jet speeds are not yet certified. Approach noise consists of engine noise and airframe noise. The engine noise contribution at approach was estimated like that for the lateral and flyover points. The airframe noise was found to be proportional to the wing loading and the wing span but independent of approach speed. The increased airframe noise at higher speeds is apparently compensated by the reduced noise due to the smaller lift coefficient and the shorter duration of the noise signal. The airframe noise estimate is plotted as

Page 80 of 182
dashed line in figure 6.2.0c. The levels are normalized for the influence of wing loading via. 10*log(loading/6000 Pa).Many aircraft are in a range of +2 EPNdB above the airframe noise estimate. Some exceptions with excessively high engine noise on approach exist which are 4 EPNdB above the airframe noise estimate. Predictions are made by adding airframe noise and engine noise with the formulas developed for the lateral noise. This means that core noise (including bleed valve noise) is not considered, which may have a substantial influence on approach.
Figure 6.2.0c Normalized approach EPNL over wing span. EPNL normalized with wing loading. Dashed line is wing loading corrected airframe noise estimate.
Figure 6.2.0d: Bypass ratio as function of static specific thrust. The NASA study was included to extend the range of the correlation to larger bypass ratios.

Page 81 of 182
Figure 6.2.0e Correlation of normalized fan diameter with static specific thrust. Fan diameter is normalized for a thrust of 100 kN.
Finally a correlation between the bypass ratio and the jet speed was made based on the highest thrust rating of a given engine. This is shown in figure 6.2.0d. The jet speeds (specific thrust values of the static engine) of some engines can be derived from the thrust values and the inlet mass flows reported by the manufacturers. However, in many cases these values are not available. The specific thrust of the static engine was estimated in these cases with the aid of the fan diameter as shown in figure 6.2.0e. The fan diameters are normalized for a static thrust of 100 kN. Comparisons with engine data show that the normalized diameter is approximately proportional to Uj-0.8, where Uj is the specific thrust of the static engine. This relation agrees quite well with the engines of the NASA turbofan study. The thrust lapse rate for the lateral measuring point was calculated by assuming a constant fan pressure ratio. Large Turboprop Study The IEP2 investigated the noise reduction potential for large turboprop aircraft. Turboprops are more fuel efficient than turbofans and there is a desire to use them on larger aircraft. ICCAIA presented results from a pilot study that investigated the noise levels for larger versions of turboprop aircraft. A baseline aircraft for the study was a Bombardier Q400 (EIS 2001, 72-79 passenger, 30 tonne MTOW) with a PW150A engine and a 6-bladed Dowty propeller. A possible new application is a 45 tonne MTOW turboprop that could be at TRL 8 by 2020. Noise reduction technologies included increasing the number of the propeller blades to eight, decreasing the propeller tip speed, and improving the engine inlet/compressor design. The IEP2 conducted independent studies of propeller noise and estimated the overall cumulative noise levels expected for larger turboprops. The ICCAIA studies identified propeller and engine noise reduction technologies that would provide 3 EPNdB and 5 EPNdB cumulative noise reductions, respectively. The propeller noise reduction comes from increasing the number of blades to eight and keeping the tip speed the same as the 6 bladed propellers. Analysis of the engine noise showed that the compressor of the PW150A contributes significantly during approach. Both ICCAIA and the IEP2 agree that this noise source can be addressed with improvements to the compressor design and possibly the improvement of

Page 82 of 182
acoustic treatment and possibly straightening the inflow inside the S-duct. Since this study is for Mid-term at TRL8, a realization factor of 90% was applied to the engine noise reduction to be consistent with the IEP1 results, giving a total cumulative noise reduction of 4.5 EPNdB. The IEP2 conducted independent studies of propeller noise. The IEP2 used information from three sources to evaluate propeller noise for a large turboprop aircraft: - NASA Langley PAS/ANOPP Code
- An empirical correlation code called ―GASP‖ - Regression analysis from Bombardier data The results show that an additional 1.5 EPNdB cum propeller noise reduction is possible beyond the 3 EPNdB cum recommended by ICCAIA by increasing the blade count from 6 to 8 and reducing the tip rotational speed by 5%. (The diameter was increased from 13.5‘ to 14.0‘ for the 8-bladed propeller based on input from Bombardier and Dowty). Figure 6.2.1 shows how the noise levels would increase for a heavier, 45 tonne turboprop relative to the Q400, and how much the cumulative noise levels could be decreased by applying the noise reduction technologies to the engine and propeller. The nominal growth level was provided by Bombardier using their standard methods for new aircraft projections and was found to be 269.6 EPNdB cum. Reducing the propeller noise by 4.5 EPNdB gives a total noise level of 265.1 EPNdB cum. Finally, applying the engine noise reduction of 4.5 EPNdB gives a total noise level of 260.6 EPNdB cum. ICCAIA confirmed that an uncertainty band of ±4 EPNdB cum is reasonable for large turboprops. This is indicated in Figure 6.2.1 with a vertical bar centred on a nominal noise level of 260.6 EPNdB cum. Aircraft weight variations are expected around this nominal value of 45 tonnes. The IEP2 worked with ICCAIA to identify a reasonable range of weights to be 35 to 53 tonnes. The IEP2 studied the sensitivity of noise with aircraft weight using certification data available in the Growth and Replacement data base. It was found that the slope of the cumulative noise level varied approximately with 60×log10(MTOM) for turboprops. This was used to predict the minimum noise margins relative to Chapter 4 for the 53 tonne growth aircraft, and was determined to be 9.5±4 EPNdB cum (see Section 7 of this report).
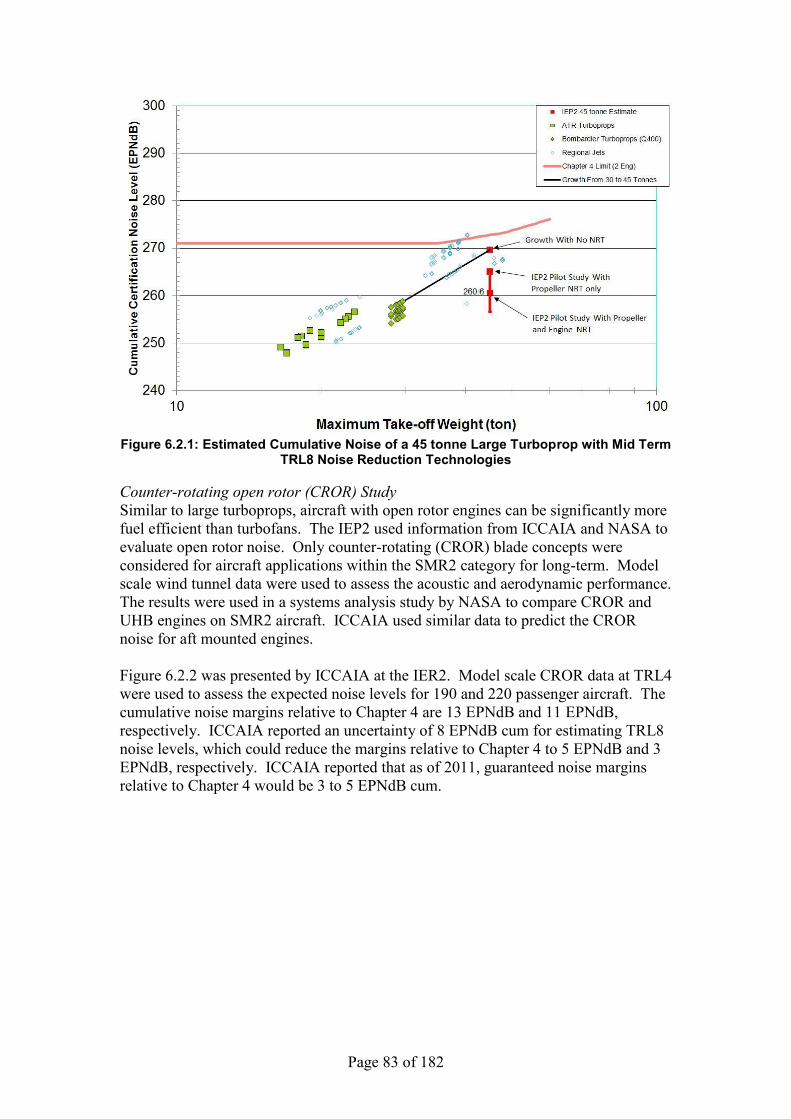
Page 83 of 182
Figure 6.2.1: Estimated Cumulative Noise of a 45 tonne Large Turboprop with Mid Term
TRL8 Noise Reduction Technologies
Counter-rotating open rotor (CROR) Study Similar to large turboprops, aircraft with open rotor engines can be significantly more fuel efficient than turbofans. The IEP2 used information from ICCAIA and NASA to evaluate open rotor noise. Only counter-rotating (CROR) blade concepts were considered for aircraft applications within the SMR2 category for long-term. Model scale wind tunnel data were used to assess the acoustic and aerodynamic performance. The results were used in a systems analysis study by NASA to compare CROR and UHB engines on SMR2 aircraft. ICCAIA used similar data to predict the CROR noise for aft mounted engines. Figure 6.2.2 was presented by ICCAIA at the IER2. Model scale CROR data at TRL4 were used to assess the expected noise levels for 190 and 220 passenger aircraft. The cumulative noise margins relative to Chapter 4 are 13 EPNdB and 11 EPNdB, respectively. ICCAIA reported an uncertainty of 8 EPNdB cum for estimating TRL8 noise levels, which could reduce the margins relative to Chapter 4 to 5 EPNdB and 3 EPNdB, respectively. ICCAIA reported that as of 2011, guaranteed noise margins relative to Chapter 4 would be 3 to 5 EPNdB cum.
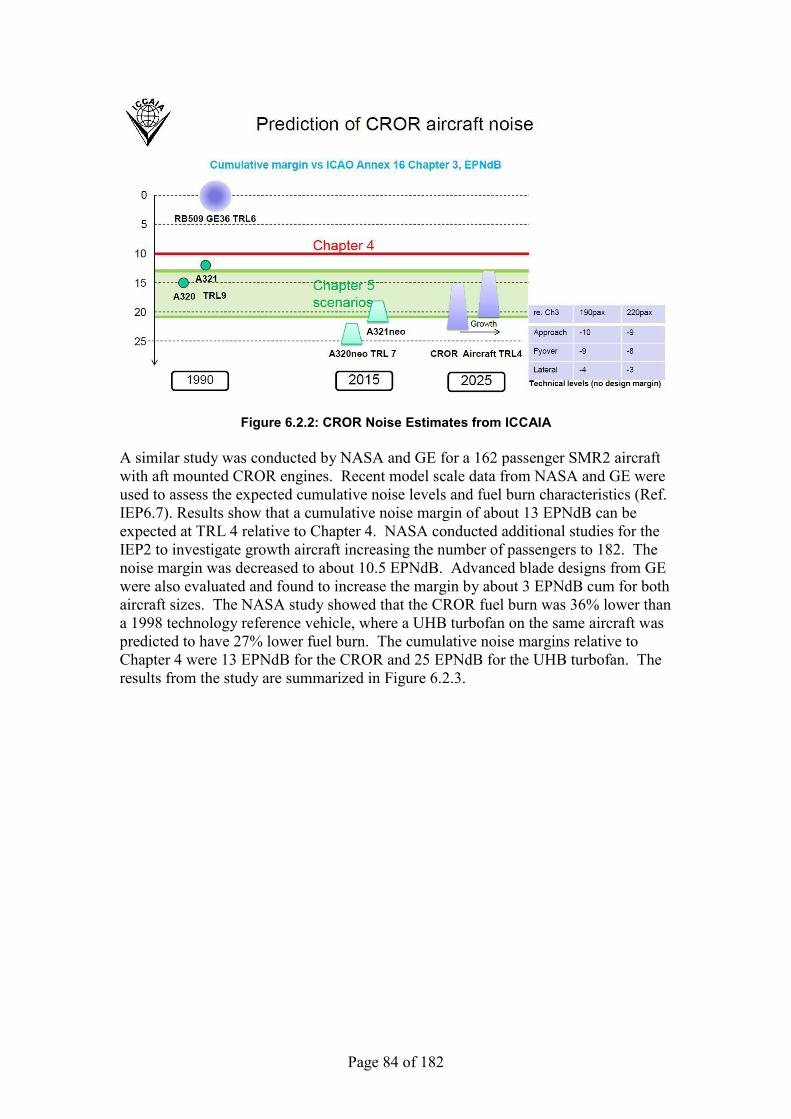
Page 84 of 182
Figure 6.2.2: CROR Noise Estimates from ICCAIA A similar study was conducted by NASA and GE for a 162 passenger SMR2 aircraft with aft mounted CROR engines. Recent model scale data from NASA and GE were used to assess the expected cumulative noise levels and fuel burn characteristics (Ref. IEP6.7). Results show that a cumulative noise margin of about 13 EPNdB can be expected at TRL 4 relative to Chapter 4. NASA conducted additional studies for the IEP2 to investigate growth aircraft increasing the number of passengers to 182. The noise margin was decreased to about 10.5 EPNdB. Advanced blade designs from GE were also evaluated and found to increase the margin by about 3 EPNdB cum for both aircraft sizes. The NASA study showed that the CROR fuel burn was 36% lower than a 1998 technology reference vehicle, where a UHB turbofan on the same aircraft was predicted to have 27% lower fuel burn. The cumulative noise margins relative to Chapter 4 were 13 EPNdB for the CROR and 25 EPNdB for the UHB turbofan. The results from the study are summarized in Figure 6.2.3.

Page 85 of 182
% Fuel Burn Benefit
No
ise M
arg
in
N+1 TechOpen Rotor
BPR >30
N+1 TechUHB TF BPR ~14
Advanced UHB TurbofanFuel burn: 27% *Noise: 25 dB cum margin to Ch.4 *
Open Rotor (modern blade set)Fuel burn: 36% *Noise: 13 dB cum margin to Ch.4 *
NASA modern airplane162 pax, 3250nm mission
Cruise M= 0.78, 35kft (FL350)Rear mount Turbofan
Cooperative Study with GENASA modern airplane
162 pax, 3250nm missionCruise M= 0.78, 35kft (FL350)
Rear mount Open Rotor
NASA modern airplane:15% structural weight reduction from composites5000 psi hydraulic systems1% drag reduction from drag cleanup and variable trailing edgeOpen rotor version has +2100lbs (953 kg) weight penalty
1998 technology reference vehicle162 pax, 3250nm mission
* Uncertainty Not Included1
Figure 6.2.3: NASA Study Results for CROR versus UHB Turbofans The IEP2 conducted an additional study for wing-mounted tractor CROR engines using information provided by NASA. The predictions for the tail-mounted engines were modified to account for the absence of a pylon and a higher angle of attack due to the wing upwash. Results show that the noise can be expected to increase by about 6 EPNdB cum, but is highly dependent on the actual location of the engine relative to the wing. The range of installed angle of attack for an aft-mounted CROR was predicted to be 1.5 to 4 degrees, where the angle of attack for a wing-mounted tractor CROR configuration was predicted to be 8 to 12 degrees and causes the noise levels to increase. The results from the ICCAIA and NASA studies are summarized in Figure 6.2.4. The plot shows the cumulative noise level as a function of aircraft weight. The upper (red) line is the Chapter 4 limit, and the lower (green) line is the expected trend for turbofans at TRL6 with UHB engines. The symbols are study results from ICCAIA and NASA. The larger symbol labelled ―CROR Noise Goal at 78 tonnes‖ is an average from the studies at the same aircraft weight as the nominal SMR2 turbofans, and shows a cumulative margin relative to Chapter 4 of 13.5 EPNdB cum. The sensitivity to aircraft weight was determined by the IEP2 to have a slope of 74×log10(MTOM), as shown by the (black) line labelled ―CROR Slope 74.‖ This was used to predict the minimum noise margins relative to Chapter 4 for the heaviest CROR aircraft expected for SMR2. The heaviest growth CROR recommended by ICCAIA is 91 tonnes and the IEP2 predicts the nominal noise margin to be 11 EPNdB cum.

Page 86 of 182
Figure 6.2.4: Summary of CROR Noise Predictions at TRL6
The IEP2 worked with ICCAIA to determine the uncertainty for CROR noise predictions as a function of TRL. Figure 6.2.5 summarizes the expected trends. The timeline across the top of the figure was provided by ICCAIA and defines the technology development sequence starting from model scale wind tunnel tests through entry into service. The lower portion of the figure shows the expected CROR uncertainty at several TRL. The current status for aft mounted CROR is somewhere between TRL4 and TRL5. Wing-mounted, tractor CROR is shown at a lower TRL since there have not been any recent technology developments for newer blades beyond the development of the AN-70 aircraft. The magnitude of the uncertainty for the upper band (loudest) is 8 EPNdB at TRL4, which is consistent with the recommendation from ICCAIA. This is reduced to 6 EPNdB at TRL6, which would be validated through flight demonstrations similar to the GE UDF in the 1980‘s. The accepted uncertainty for turbofans with conventional installation is ±4 EPNdB cum. Since there is limited experience with CROR installations, the uncertainty is higher. The IEP2 noted that there are higher risks associated with engine installation which could increase the noise, and very few mitigation technologies available for decreasing the noise. Therefore, the IEP2 recommends a skewed uncertainty distribution for CROR aircraft, as illustrated by the shaded uncertainty bands in Figure 6.2.5. The nominal cumulative noise margin under Chapter 4 of 13.5 EPNdB remains the same between TRL4 and TRL6 based on experience from scaling wind tunnel model data to flight demonstration tests for the GE UDF. When the uncertainty is included in the CROR pilot studies, the recommended TRL6 noise margin goals under Chapter 4 are 13.5+2/-6 EPNdB cum for a nominal 78 tonne aircraft, and 10.5+2/-6 EPNdB cum for a maximum weight aircraft of 91 tonnes.

Page 87 of 182
Figure 6.2.5: CROR Technology Development and Noise Predictions
Page 88 of 182
6.3 Assessment of noise reduction trends with bypass ratio (BPR) and Noise Reduction Technology (NRT) for conventional wing and tube configurations
6.3.1 Bypass Ratio Effects Methodology Historical trends in aircraft noise reduction are often viewed as a function of engine bypass ratio (BPR) because this has had a strong influence on jet mixing noise, the major noise component on aircraft with low-bypass ratio engines. However it should be emphasised that medium to high bypass turbofan engines have significant fan noise and other noise source components. The cycle change represented by an increased BPR requires these components to be re-designed, which normally leads to lower component noise source levels. Thus the benefit of increased BPR arises not only from reductions in jet mixing noise but also reductions in fan noise and other components. It is probably better to think of the engine cycle being changed to improve fuel burn, say, and the resulting changes in the engine design almost invariably lead to an increased BPR (at least up till the present time). Noise data are presented below as a function of BPR for different maximum take-off mass (MTOM). This means that the absolute margins are not strictly comparable because it is well established that aircraft noise increases rapidly with MTOM. But what we are trying to establish here is the rate of change of the noise margin with engine cycle, represented by BPR, in order to separate out this strong, inevitable noise reduction benefit from the reduction due to noise technology. As long as we view the gradient or sensitivity to BPR for each subset of data at an approximately constant MTOM, which is the case for the Pilots 1 & 2 and the AST study aircraft (reference IEP 6.6), we should not confuse BPR benefits with effects due to changes in MTOM. We review noise trends in this way, in Appendix A, for the Short/Medium range and Long range classes, at each certification point, using the Best Practices Database provided and the results of the Pilot studies outlined above. Data is shown as the margin relative to Stage 3, rather than absolute levels. Those results are summarised below by considering the trends in the cumulative margin (sum of margins at the three conditions).
6.3.2 Short/Medium Range Class The cumulative margins help to summarise the trends identified above. Fig. 6.3.1 shows the SMR2 cumulative data together with the Pilot results and the AST results. On average the Pilot 1 & 2 results appear to follow a trend line of 3 dB per unit BPR as indicated by the red line and the Medium term NRT offers a benefit of between 5 and 8 dB. Over the range BPR=9 to 12, Pilots 1 & 3, the former with or without NRT, appears to follow a trend line of about 1.5 dB per unit BPR, as indicated by the blue line. Most of this comes from the Lateral condition. The Pilot 1 NRT appears to provide a slightly smaller benefit at BPR=12 compared to that at BPR=8. Regional Jet aircraft are expected to exhibit the same sensitivity to BPR as deduced for the SMR2 aircraft.
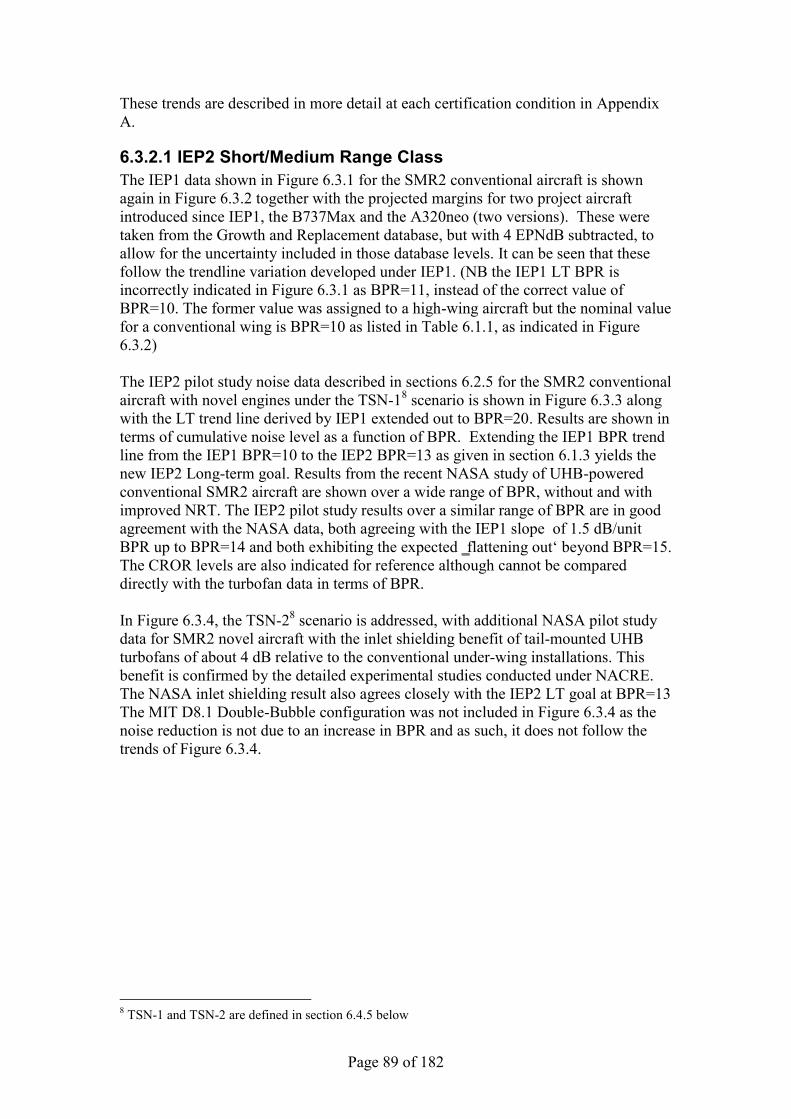
Page 89 of 182
These trends are described in more detail at each certification condition in Appendix A.
6.3.2.1 IEP2 Short/Medium Range Class The IEP1 data shown in Figure 6.3.1 for the SMR2 conventional aircraft is shown again in Figure 6.3.2 together with the projected margins for two project aircraft introduced since IEP1, the B737Max and the A320neo (two versions). These were taken from the Growth and Replacement database, but with 4 EPNdB subtracted, to allow for the uncertainty included in those database levels. It can be seen that these follow the trendline variation developed under IEP1. (NB the IEP1 LT BPR is incorrectly indicated in Figure 6.3.1 as BPR=11, instead of the correct value of BPR=10. The former value was assigned to a high-wing aircraft but the nominal value for a conventional wing is BPR=10 as listed in Table 6.1.1, as indicated in Figure 6.3.2) The IEP2 pilot study noise data described in sections 6.2.5 for the SMR2 conventional aircraft with novel engines under the TSN-18 scenario is shown in Figure 6.3.3 along with the LT trend line derived by IEP1 extended out to BPR=20. Results are shown in terms of cumulative noise level as a function of BPR. Extending the IEP1 BPR trend line from the IEP1 BPR=10 to the IEP2 BPR=13 as given in section 6.1.3 yields the new IEP2 Long-term goal. Results from the recent NASA study of UHB-powered conventional SMR2 aircraft are shown over a wide range of BPR, without and with improved NRT. The IEP2 pilot study results over a similar range of BPR are in good agreement with the NASA data, both agreeing with the IEP1 slope of 1.5 dB/unit BPR up to BPR=14 and both exhibiting the expected ‗flattening out‘ beyond BPR=15. The CROR levels are also indicated for reference although cannot be compared directly with the turbofan data in terms of BPR. In Figure 6.3.4, the TSN-28 scenario is addressed, with additional NASA pilot study data for SMR2 novel aircraft with the inlet shielding benefit of tail-mounted UHB turbofans of about 4 dB relative to the conventional under-wing installations. This benefit is confirmed by the detailed experimental studies conducted under NACRE. The NASA inlet shielding result also agrees closely with the IEP2 LT goal at BPR=13 The MIT D8.1 Double-Bubble configuration was not included in Figure 6.3.4 as the noise reduction is not due to an increase in BPR and as such, it does not follow the trends of Figure 6.3.4.
8 TSN-1 and TSN-2 are defined in section 6.4.5 below

Page 90 of 182
Short/Medium Range Twin Noise Reduction, Cumulativeshowing IEP deduced Mid & Long term BPR & NRT (TRL6) trends*
-30
-20
-10
0
10
4 6 8 10 12 14T/O Bypass Ratio (BPR)
Cum
EPN
dB re
/Cha
p. 4
NASA AST StudyPilot Study 1Pilot Study 2Pilot Study 3Mid-term 3 dB/BPR*Long term 1.5 dB/BPR*
NRT
NRT
Medium Term
Long Term
NRT
NRT
Figure 6.3.1: Short/Medium Range Twin cumulative margin noise trend with BPR & NRT (Note Pilot 3 does not include NRT)
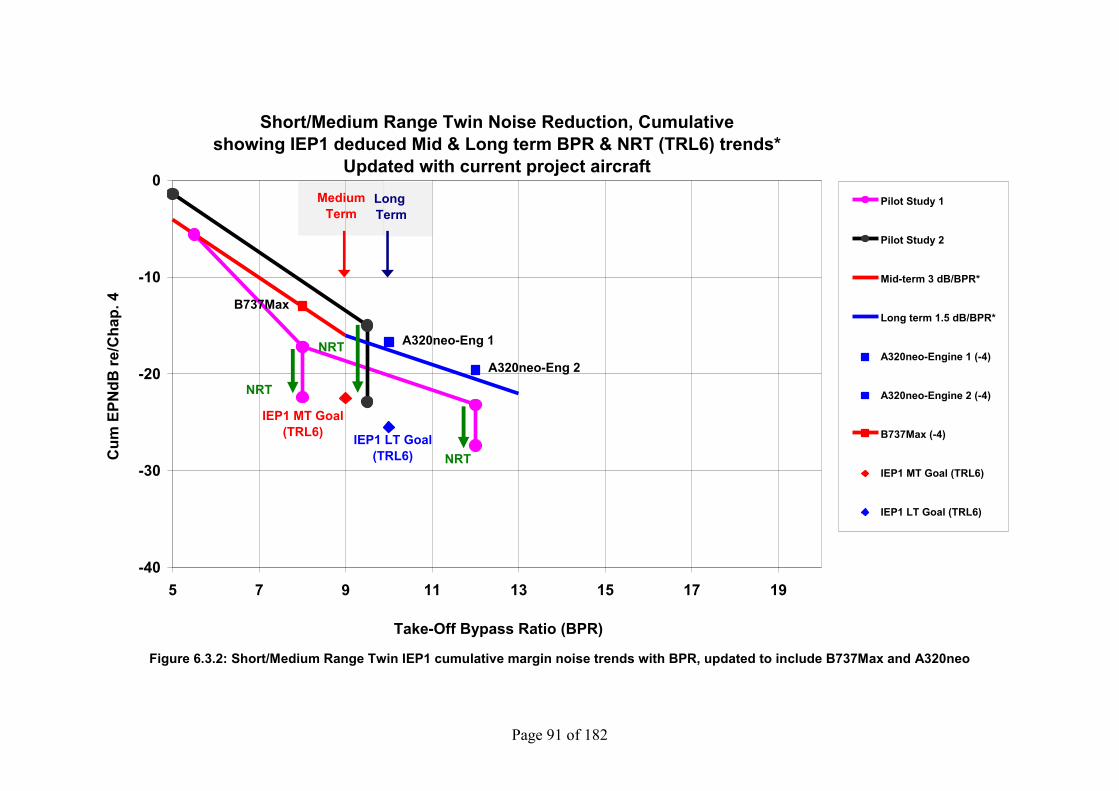
Page 91 of 182
Short/Medium Range Twin Noise Reduction, Cumulativeshowing IEP1 deduced Mid & Long term BPR & NRT (TRL6) trends*
Updated with current project aircraft
A320neo-Eng 1
A320neo-Eng 2
B737Max
IEP1 MT Goal (TRL6) IEP1 LT Goal
(TRL6)
-40
-30
-20
-10
0
5 7 9 11 13 15 17 19
Take-Off Bypass Ratio (BPR)
Cum
EPN
dB re
/Cha
p. 4
Pilot Study 1
Pilot Study 2
Mid-term 3 dB/BPR*
Long term 1.5 dB/BPR*
A320neo-Engine 1 (-4)
A320neo-Engine 2 (-4)
B737Max (-4)
IEP1 MT Goal (TRL6)
IEP1 LT Goal (TRL6)
NRT
NRT
Medium Term
Long Term
NRT
Figure 6.3.2: Short/Medium Range Twin IEP1 cumulative margin noise trends with BPR, updated to include B737Max and A320neo
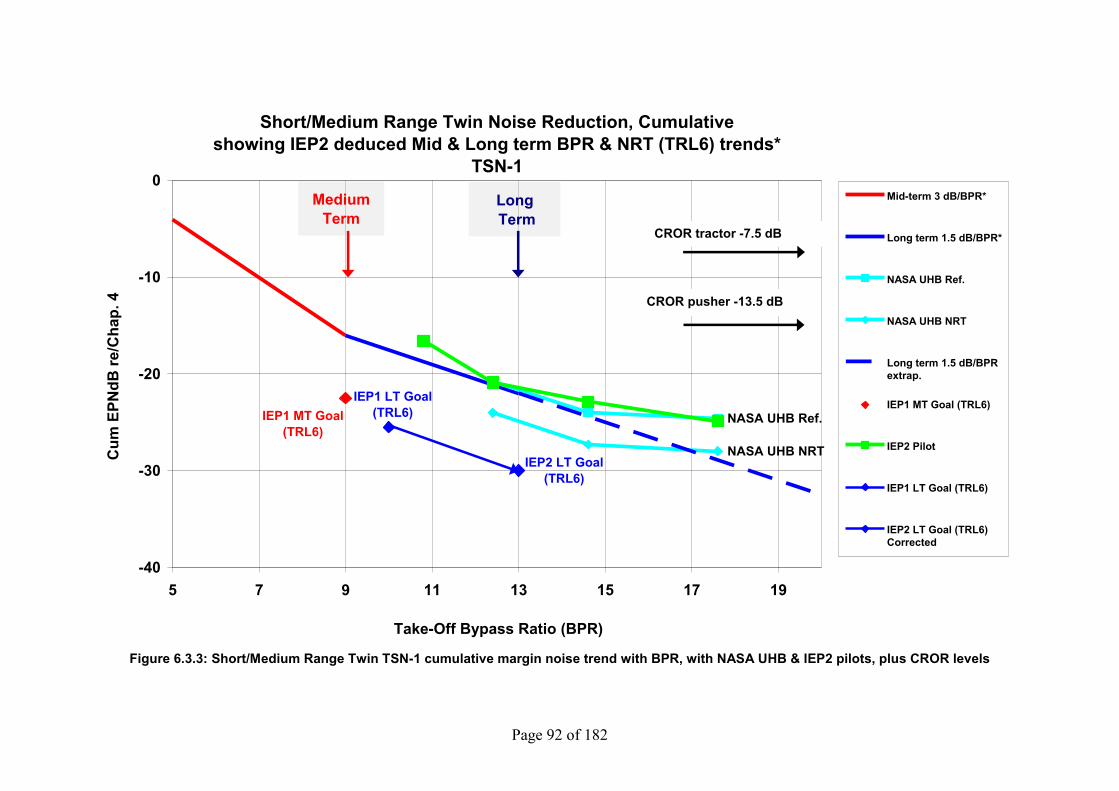
Page 92 of 182
Short/Medium Range Twin Noise Reduction, Cumulativeshowing IEP2 deduced Mid & Long term BPR & NRT (TRL6) trends*
TSN-1
NASA UHB Ref.
NASA UHB NRT
IEP1 MT Goal (TRL6)
IEP1 LT Goal(TRL6)
IEP2 LT Goal(TRL6)
-40
-30
-20
-10
0
5 7 9 11 13 15 17 19
Take-Off Bypass Ratio (BPR)
Cum
EPN
dB re
/Cha
p. 4
Mid-term 3 dB/BPR*
Long term 1.5 dB/BPR*
NASA UHB Ref.
NASA UHB NRT
Long term 1.5 dB/BPRextrap.
IEP1 MT Goal (TRL6)
IEP2 Pilot
IEP1 LT Goal (TRL6)
IEP2 LT Goal (TRL6)Corrected
Medium Term
Long Term
CROR pusher -13.5 dB
CROR tractor -7.5 dB
Figure 6.3.3: Short/Medium Range Twin TSN-1 cumulative margin noise trend with BPR, with NASA UHB & IEP2 pilots, plus CROR levels

Page 93 of 182
Short/Medium Range Twin Noise Reduction, Cumulativeshowing IEP2 deduced Mid & Long term BPR & NRT (TRL6) trends*
TSN-2
NASA UHB Ref.
NASA UHB NRT
NASA UHB NRT + Inlet Shielding
IEP1 MT Goal (TRL6)
IEP1 LT Goal (TRL6)
IEP2 LT Goal (TRL6)
-40
-30
-20
-10
0
5 7 9 11 13 15 17 19
Take-Off Bypass Ratio (BPR)
Cum
EPN
dB re
/Cha
p. 4
Mid-term 3 dB/BPR*
Long term 1.5 dB/BPR*
NASA UHB Ref.
NASA UHB NRT
NASA UHB NRT +Shield.
Long term 1.5 db/BPRextrap.
IEP1 MT Goal (TRL6)
IEP1 LT Goal (TRL6)
IEP2 LT Goal (TRL6)Corrected
Medium Term
Long Term
NACRE-4 dB
CROR rotor tractor -7.5 dB
CROR rotor pusher -13.5 dB
Figure 6.3.4: Short/Medium Range Twin TSN-2 cumulative margin noise trend with BPR

Page 94 of 182
6.3.3 Long Range Class The Long range Quad cumulative data shown in Fig. 6.3.5 agrees very well with the 3 dB/BPR trend line from the SMR2 study over the range BPR=5 to 8.3 and falls below the A380 as expected. However there is insufficient data in the BPR=8.3 to 12 range to be certain that the same trends would apply. The A380 at BPR=9 is at the same level as the AST Study Large Quad Aircraft B747-400 with the P&W ADP engine at BPR=13. During the IEP2 process, Fig. 6.3.5 was updated to include B747-8/Genx-2B67 which has been certified since IEP1, see Fig. 6.3.6, which appears to be 4 dB quieter than the project estimate. Likewise the LR2 cumulative data shown in Fig. 6.3.7 also supports the 3 dB/BPR trend line from the SMR2 study over the range BPR=5 to 8.3,based on BPD data for the A330 and B777 at MTOM of 230t and 247t respectively. These were selected to bracket the MTOM of the A350 and B787 which are 245/265t and 220t respectively. The extrapolated trend line exceeds the margins predicted for the new A350 and B787 aircraft by up to 5 dB but as these are predicted rather than certified levels, this difference may turn out to be smaller in reality. On the other hand this difference may also be caused in part by a flattening off of the sensitivity to BPR, observed in the data discussed above for the SMR2 and LR4. For the categories of aircraft studied, within the variability and data scatter of the information available, the cumulative noise levels for a new design aircraft will have an approximate dependence on the take-off BPR as follows. 4≤BPR≤9: Cum EPNL sensitivity ~ 3.0 EPNdB per unit change in BPR 9≤BPR≤13: Cum EPNL sensitivity ~ 1.5 EPNdB per unit change in BPR
6.3.3.1 IEP2 Long Range Class For LR2 conventional aircraft under the TSN-19 scenario, noise levels of aircraft certified since IEP1 and noise study data described in sections 6.2.5 & 6.4.5, in particular the Boeing RR ATF (Rolls-Royce Advanced Turbofan), the Boeing PWA GTF (P&W Geared Turbofan) and the Lockheed RR ATF, are shown in Figure 6.3.8 as a function of Bypass Ratio (BPR) along with the trend lines derived by IEP1. Also shown is the new LT IEP2 goal, obtained as before by applying the trend line from BPR=11 to BPR=13. This is similar in level to that of the Lockheed RR ATF but significantly lower than the Boeing RR ATF. Figure 6.3.8 is repeated in Figure 6.3.9 but with the IEP2 pilot prediction included (no improved NRT), covering the higher BPR range and approximately confirming the slope of the IEP1 trend line. Under the TSN-29 scenario, Figure 6.3.10 repeats the previous figure but excludes the IEP2 pilot and includes the unconventional Boeing RR Mid-ATF (mid-mounted turbofans located above the wings).
9 TSN-1 and TSN-2 are defined in section 6.4.5 below
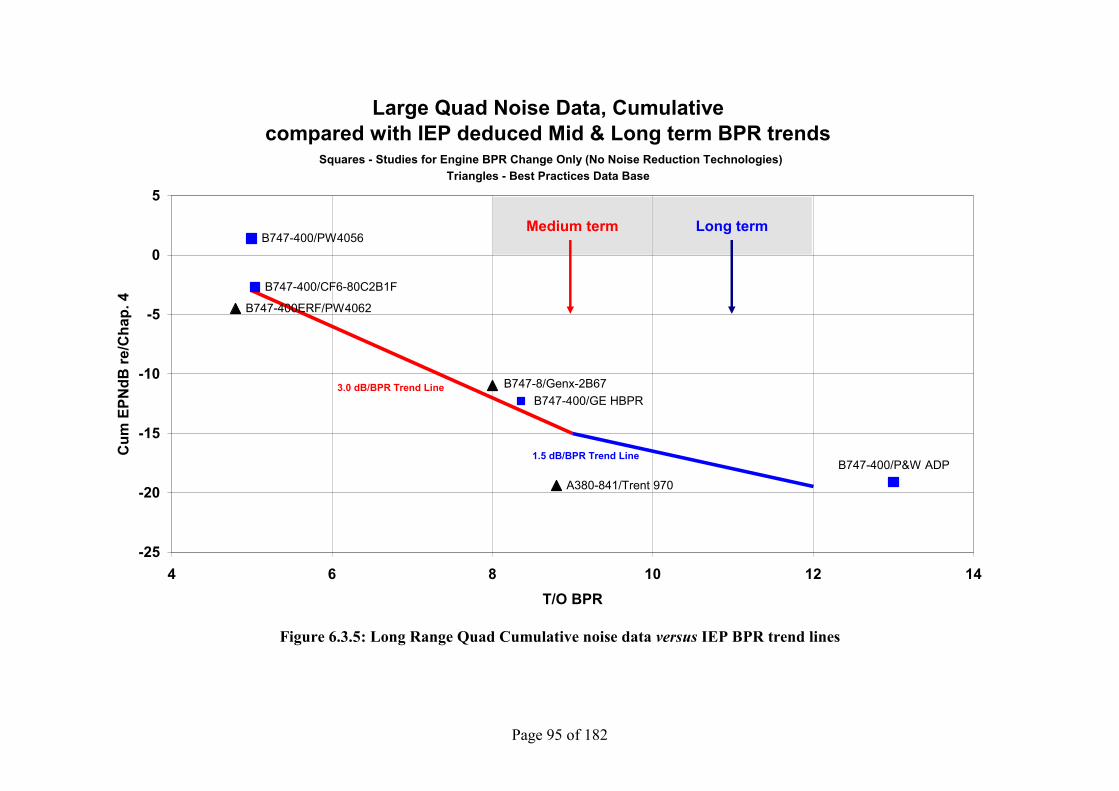
Page 95 of 182
Large Quad Noise Data, Cumulativecompared with IEP deduced Mid & Long term BPR trends
Squares - Studies for Engine BPR Change Only (No Noise Reduction Technologies)Triangles - Best Practices Data Base
B747-400/CF6-80C2B1F
B747-400/PW4056
B747-400ERF/PW4062
A380-841/Trent 970
B747-8/Genx-2B67B747-400/GE HBPR
B747-400/P&W ADP
3.0 dB/BPR Trend Line
1.5 dB/BPR Trend Line
-25
-20
-15
-10
-5
0
5
4 6 8 10 12 14T/O BPR
Cum
EPN
dB re
/Cha
p. 4
Medium term Long term
Figure 6.3.5: Long Range Quad Cumulative noise data versus IEP BPR trend lines
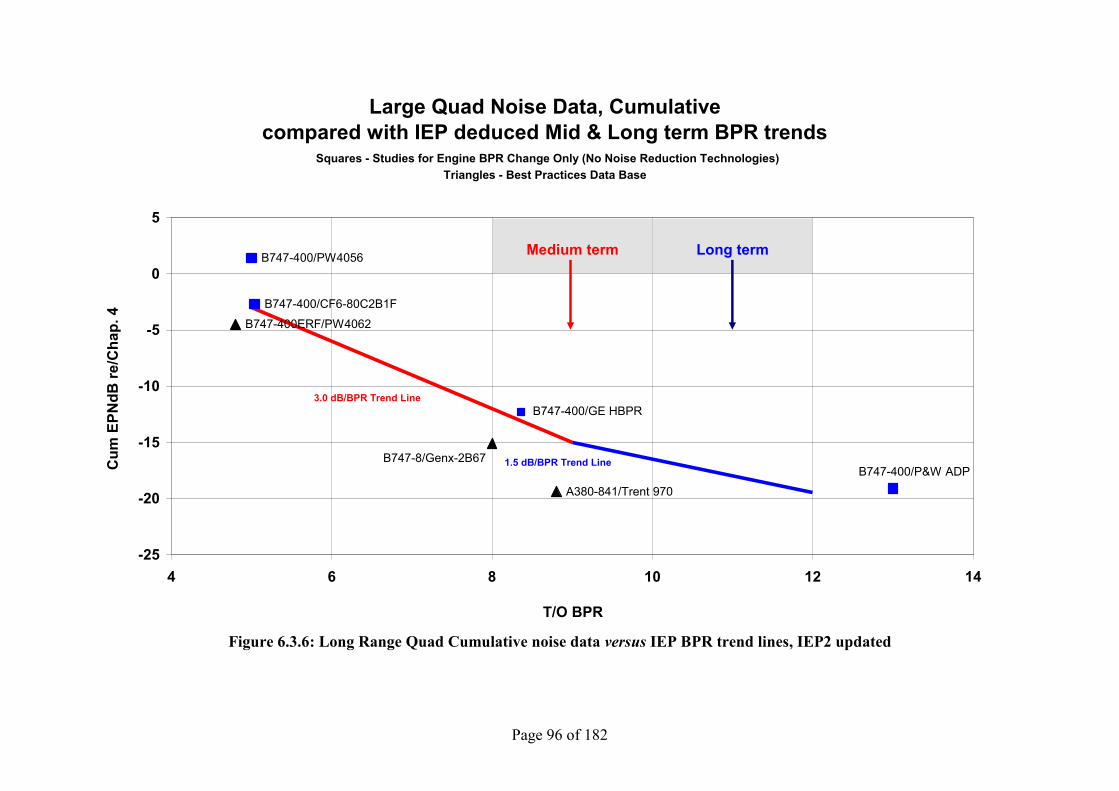
Page 96 of 182
Large Quad Noise Data, Cumulativecompared with IEP deduced Mid & Long term BPR trends
Squares - Studies for Engine BPR Change Only (No Noise Reduction Technologies)Triangles - Best Practices Data Base
B747-400/CF6-80C2B1F
B747-400/PW4056
B747-400ERF/PW4062
A380-841/Trent 970
B747-8/Genx-2B67
B747-400/GE HBPR
B747-400/P&W ADP
3.0 dB/BPR Trend Line
1.5 dB/BPR Trend Line
-25
-20
-15
-10
-5
0
5
4 6 8 10 12 14
T/O BPR
Cum
EPN
dB re
/Cha
p. 4
Medium term Long term
Figure 6.3.6: Long Range Quad Cumulative noise data versus IEP BPR trend lines, IEP2 updated

Page 97 of 182
Figure 6.3.7: Long Range Twin Cumulative margin data versus IEP BPR trend lines
Long Range Twin Noise Data, Cumulativecompared with IEP deduced BPR trends
Squares - AST LR2 Study for Engine BPR Change Only (No Noise Reduction Technologies) Other symbols - Best Practices Data Base
-20
-15
-10
-5
0
5
4 6 8 10 12 14T/O Bypass Ratio
Cum
EPN
dB re
/Cha
p. 4
A330 (230t) CF6
B777 (247t) PW4090
B777 (247t) T875
B777 (247t) GE90
B787-8 (220t)
A350 (245/265t)
AST LR2
3 dB/BPR Trend line
1.5 dB/BPR Trend line
Medium Term
Long Term

Page 98 of 182
Long Range Twin Noise Data, Cumulativecompared with IEP deduced BPR trends
TSN-1
Lockheed RR ATF Boeing PWA GTF
Boeing RR ATF
IEP2 LT Goal(TRL6)
IEP1 LT Goal(TRL6)
IEP1 MT Goal (TRL6)
-40
-35
-30
-25
-20
-15
-10
-5
0
5 7 9 11 13 15 17 19Take-Off Bypass Ratio
Cum
EPN
dB re
/Cha
p. 4
A330 (230t) CF6B777 (247t) PW4090B777 (247t) T875B777 (247t) GE90B787-8 (220t) GEnxA350 (268t)-4dBAST LR2B787-8 (220t) T1000Lockheed RR ATFBoeing PWA GTFBoeing RR ATF3 dB/BPR Trend line1.5 dB/BPR Trend lineIEP LT Goals (TRL6)IEP1 MT Goal (TRL6)
Medium Term
Long Term
Figure 6.3.8: Long Range Twin TSN-1 cumulative margin noise trend with BPR

Page 99 of 182
Long Range Twin Noise Data, Cumulativecompared with IEP deduced BPR trends
TSN-1
Lockheed RR ATF Boeing PWA GTF
Boeing RR ATFIEP1 LT Goal
IEP2 LT Goal
IEP1 MT Goal (TRL6)
-40
-35
-30
-25
-20
-15
-10
-5
0
5 7 9 11 13 15 17 19Take-Off Bypass Ratio
Cum
EPN
dB re
/Cha
p. 4
A330 (230t) CF6B777 (247t) PW4090B777 (247t) T875B777 (247t) GE90B787-8 (220t) GEnxA350 (268t)-4dBAST LR2B787-8 (220t) T1000Lockheed RR ATFBoeing PWA GTFBoeing RR ATF3 dB/BPR Trend line1.5 dB/BPR Trend lineIEP LT Goals (TRL6)IEP2 PilotIEP1 MT Goal (TRL6)
Medium Term
Long Term
Figure 6.3.9: Long Range Twin TSN-1 cumulative margin noise trend with BPR (including IEP2 pilot)
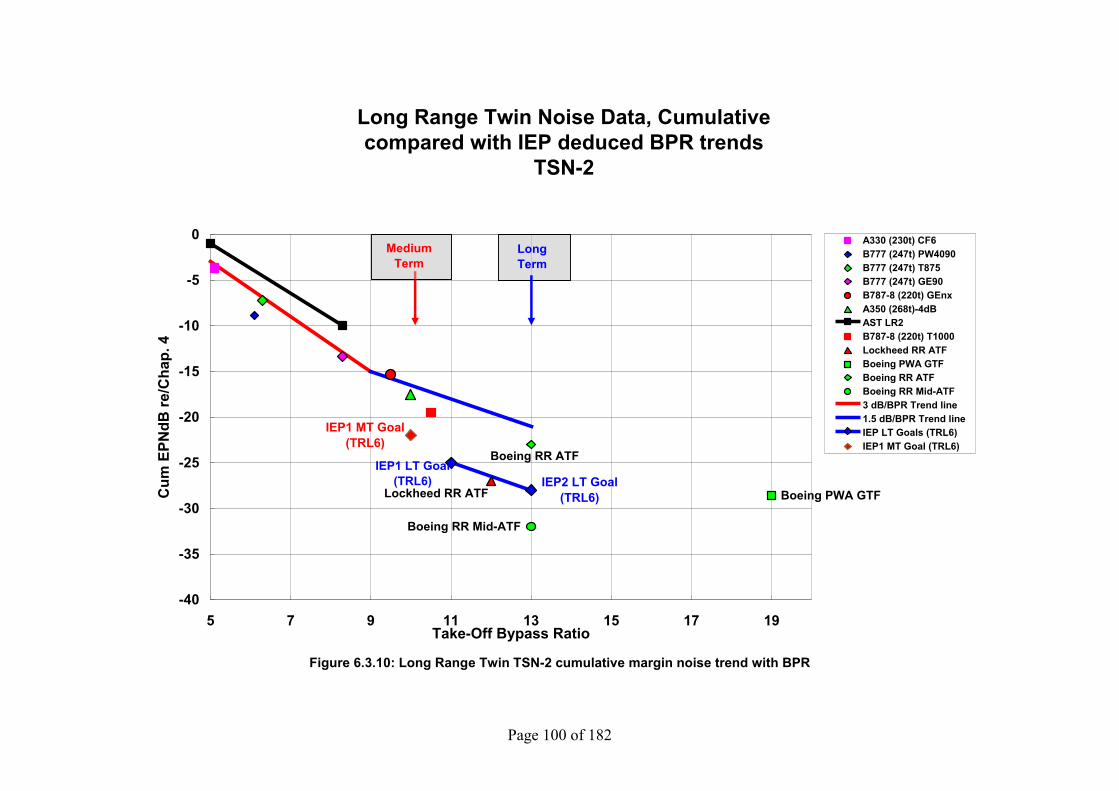
Page 100 of 182
Long Range Twin Noise Data, Cumulativecompared with IEP deduced BPR trends
TSN-2
Lockheed RR ATF Boeing PWA GTF
Boeing RR ATF
Boeing RR Mid-ATF
IEP2 LT Goal(TRL6)
IEP1 LT Goal(TRL6)
IEP1 MT Goal(TRL6)
-40
-35
-30
-25
-20
-15
-10
-5
0
5 7 9 11 13 15 17 19Take-Off Bypass Ratio
Cum
EPN
dB re
/Cha
p. 4
A330 (230t) CF6B777 (247t) PW4090B777 (247t) T875B777 (247t) GE90B787-8 (220t) GEnxA350 (268t)-4dBAST LR2B787-8 (220t) T1000Lockheed RR ATFBoeing PWA GTFBoeing RR ATFBoeing RR Mid-ATF3 dB/BPR Trend line1.5 dB/BPR Trend lineIEP LT Goals (TRL6)IEP1 MT Goal (TRL6)
Medium Term
Long Term
Figure 6.3.10: Long Range Twin TSN-2 cumulative margin noise trend with BPR
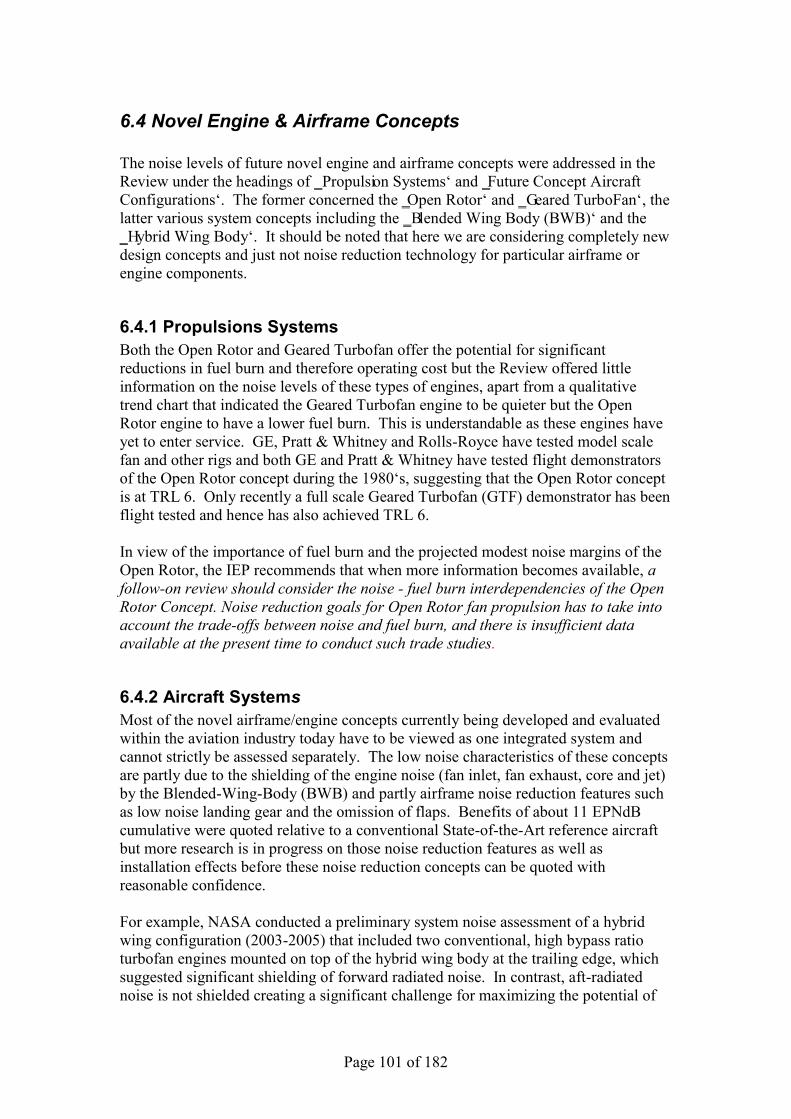
Page 101 of 182
6.4 Novel Engine & Airframe Concepts The noise levels of future novel engine and airframe concepts were addressed in the Review under the headings of ‗Propulsion Systems‘ and ‗Future Concept Aircraft Configurations‘. The former concerned the ‗Open Rotor‘ and ‗Geared TurboFan‘, the latter various system concepts including the ‗Blended Wing Body (BWB)‘ and the ‗Hybrid Wing Body‘. It should be noted that here we are considering completely new design concepts and just not noise reduction technology for particular airframe or engine components.
6.4.1 Propulsions Systems Both the Open Rotor and Geared Turbofan offer the potential for significant reductions in fuel burn and therefore operating cost but the Review offered little information on the noise levels of these types of engines, apart from a qualitative trend chart that indicated the Geared Turbofan engine to be quieter but the Open Rotor engine to have a lower fuel burn. This is understandable as these engines have yet to enter service. GE, Pratt & Whitney and Rolls-Royce have tested model scale fan and other rigs and both GE and Pratt & Whitney have tested flight demonstrators of the Open Rotor concept during the 1980‘s, suggesting that the Open Rotor concept is at TRL 6. Only recently a full scale Geared Turbofan (GTF) demonstrator has been flight tested and hence has also achieved TRL 6. In view of the importance of fuel burn and the projected modest noise margins of the Open Rotor, the IEP recommends that when more information becomes available, a follow-on review should consider the noise - fuel burn interdependencies of the Open Rotor Concept. Noise reduction goals for Open Rotor fan propulsion has to take into account the trade-offs between noise and fuel burn, and there is insufficient data available at the present time to conduct such trade studies.
6.4.2 Aircraft Systems Most of the novel airframe/engine concepts currently being developed and evaluated within the aviation industry today have to be viewed as one integrated system and cannot strictly be assessed separately. The low noise characteristics of these concepts are partly due to the shielding of the engine noise (fan inlet, fan exhaust, core and jet) by the Blended-Wing-Body (BWB) and partly airframe noise reduction features such as low noise landing gear and the omission of flaps. Benefits of about 11 EPNdB cumulative were quoted relative to a conventional State-of-the-Art reference aircraft but more research is in progress on those noise reduction features as well as installation effects before these noise reduction concepts can be quoted with reasonable confidence. For example, NASA conducted a preliminary system noise assessment of a hybrid wing configuration (2003-2005) that included two conventional, high bypass ratio turbofan engines mounted on top of the hybrid wing body at the trailing edge, which suggested significant shielding of forward radiated noise. In contrast, aft-radiated noise is not shielded creating a significant challenge for maximizing the potential of

Page 102 of 182
this configuration. One approach examined was to move the engine pods two diameters forward, and estimate the maximum impact of moving part of the jet sources upstream, in addition to overall jet noise source reduction of the distributed source downstream of the nozzles. The hybrid wing body promises to impact airframe sources levels with a more distributed lift and the absence of the traditional high lift system. However, there is a scarcity of experiments and prediction methods, and a number of assumptions had to be made to produce the preliminary estimates that the airframe noise component could be reduced 6 dB. This preliminary system noise assessment using, best available information, estimated that the hybrid wing body could reach 42 dB cumulative below Chapter 4, see Fig. 6.4.2.1
Fig. 6.4.2.1: Predicted noise reduction for BWB aircraft
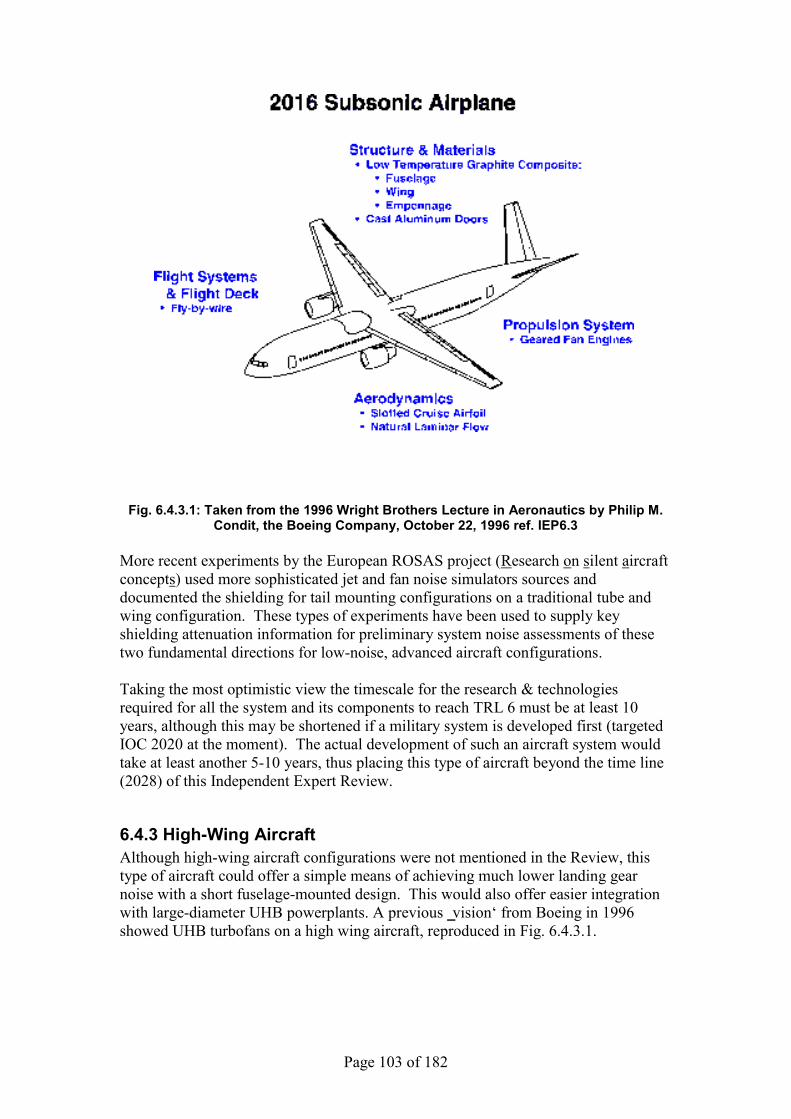
Page 103 of 182
Fig. 6.4.3.1: Taken from the 1996 Wright Brothers Lecture in Aeronautics by Philip M. Condit, the Boeing Company, October 22, 1996 ref. IEP6.3
More recent experiments by the European ROSAS project (Research on silent aircraft concepts) used more sophisticated jet and fan noise simulators sources and documented the shielding for tail mounting configurations on a traditional tube and wing configuration. These types of experiments have been used to supply key shielding attenuation information for preliminary system noise assessments of these two fundamental directions for low-noise, advanced aircraft configurations. Taking the most optimistic view the timescale for the research & technologies required for all the system and its components to reach TRL 6 must be at least 10 years, although this may be shortened if a military system is developed first (targeted IOC 2020 at the moment). The actual development of such an aircraft system would take at least another 5-10 years, thus placing this type of aircraft beyond the time line (2028) of this Independent Expert Review.
6.4.3 High-Wing Aircraft Although high-wing aircraft configurations were not mentioned in the Review, this type of aircraft could offer a simple means of achieving much lower landing gear noise with a short fuselage-mounted design. This would also offer easier integration with large-diameter UHB powerplants. A previous ‗vision‘ from Boeing in 1996 showed UHB turbofans on a high wing aircraft, reproduced in Fig. 6.4.3.1.
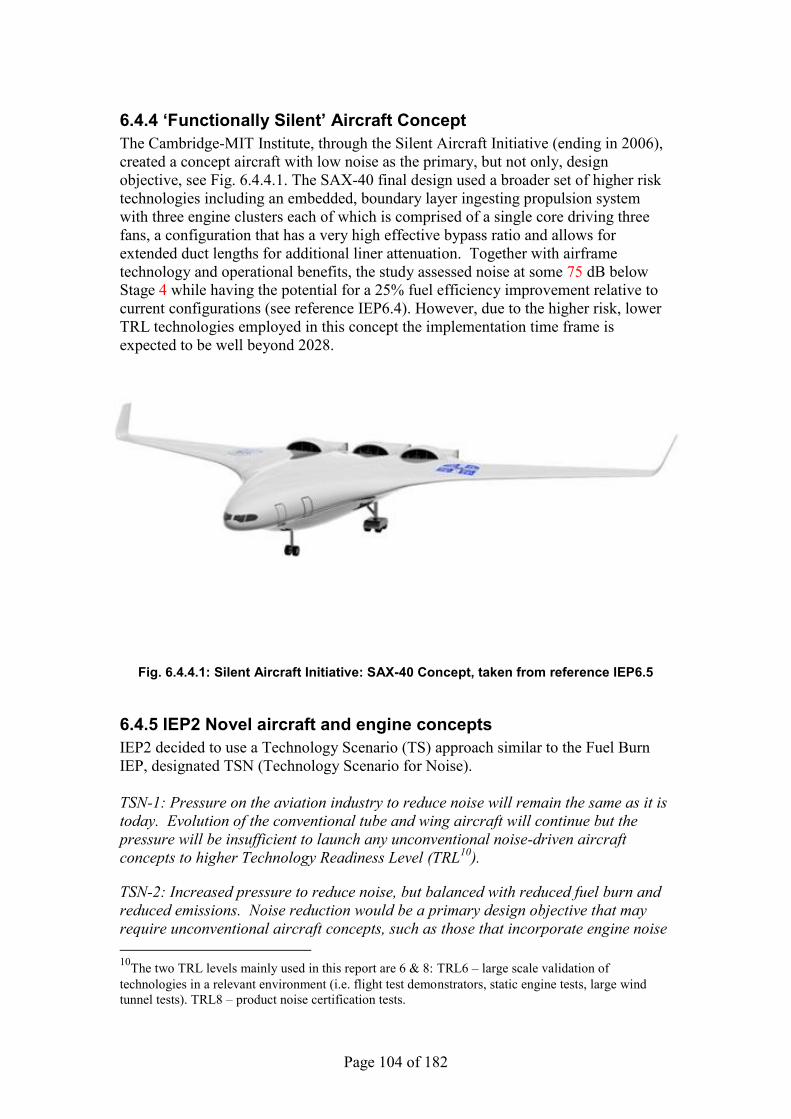
Page 104 of 182
6.4.4 ‘Functionally Silent’ Aircraft Concept The Cambridge-MIT Institute, through the Silent Aircraft Initiative (ending in 2006), created a concept aircraft with low noise as the primary, but not only, design objective, see Fig. 6.4.4.1. The SAX-40 final design used a broader set of higher risk technologies including an embedded, boundary layer ingesting propulsion system with three engine clusters each of which is comprised of a single core driving three fans, a configuration that has a very high effective bypass ratio and allows for extended duct lengths for additional liner attenuation. Together with airframe technology and operational benefits, the study assessed noise at some 75 dB below Stage 4 while having the potential for a 25% fuel efficiency improvement relative to current configurations (see reference IEP6.4). However, due to the higher risk, lower TRL technologies employed in this concept the implementation time frame is expected to be well beyond 2028.
Fig. 6.4.4.1: Silent Aircraft Initiative: SAX-40 Concept, taken from reference IEP6.5
6.4.5 IEP2 Novel aircraft and engine concepts IEP2 decided to use a Technology Scenario (TS) approach similar to the Fuel Burn IEP, designated TSN (Technology Scenario for Noise). TSN-1: Pressure on the aviation industry to reduce noise will remain the same as it is today. Evolution of the conventional tube and wing aircraft will continue but the pressure will be insufficient to launch any unconventional noise-driven aircraft concepts to higher Technology Readiness Level (TRL10).
TSN-2: Increased pressure to reduce noise, but balanced with reduced fuel burn and reduced emissions. Noise reduction would be a primary design objective that may require unconventional aircraft concepts, such as those that incorporate engine noise 10The two TRL levels mainly used in this report are 6 & 8: TRL6 – large scale validation of technologies in a relevant environment (i.e. flight test demonstrators, static engine tests, large wind tunnel tests). TRL8 – product noise certification tests.
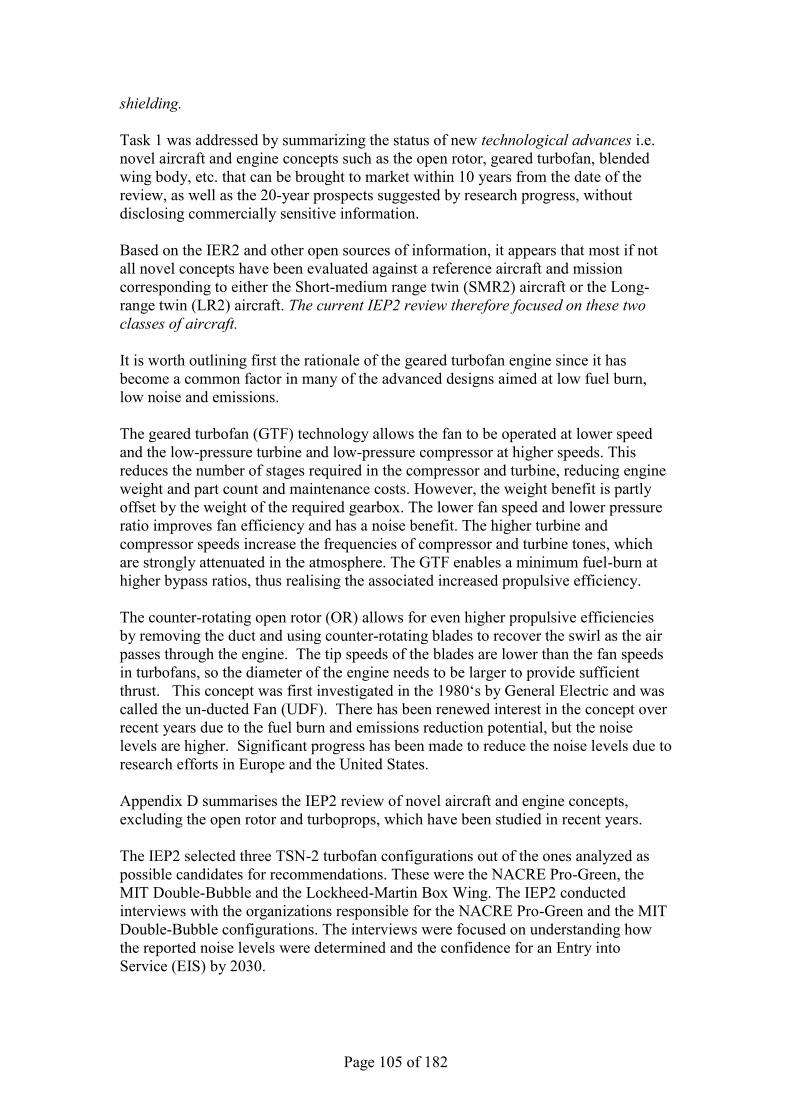
Page 105 of 182
shielding. Task 1 was addressed by summarizing the status of new technological advances i.e. novel aircraft and engine concepts such as the open rotor, geared turbofan, blended wing body, etc. that can be brought to market within 10 years from the date of the review, as well as the 20-year prospects suggested by research progress, without disclosing commercially sensitive information. Based on the IER2 and other open sources of information, it appears that most if not all novel concepts have been evaluated against a reference aircraft and mission corresponding to either the Short-medium range twin (SMR2) aircraft or the Long-range twin (LR2) aircraft. The current IEP2 review therefore focused on these two classes of aircraft. It is worth outlining first the rationale of the geared turbofan engine since it has become a common factor in many of the advanced designs aimed at low fuel burn, low noise and emissions. The geared turbofan (GTF) technology allows the fan to be operated at lower speed and the low-pressure turbine and low-pressure compressor at higher speeds. This reduces the number of stages required in the compressor and turbine, reducing engine weight and part count and maintenance costs. However, the weight benefit is partly offset by the weight of the required gearbox. The lower fan speed and lower pressure ratio improves fan efficiency and has a noise benefit. The higher turbine and compressor speeds increase the frequencies of compressor and turbine tones, which are strongly attenuated in the atmosphere. The GTF enables a minimum fuel-burn at higher bypass ratios, thus realising the associated increased propulsive efficiency. The counter-rotating open rotor (OR) allows for even higher propulsive efficiencies by removing the duct and using counter-rotating blades to recover the swirl as the air passes through the engine. The tip speeds of the blades are lower than the fan speeds in turbofans, so the diameter of the engine needs to be larger to provide sufficient thrust. This concept was first investigated in the 1980‘s by General Electric and was called the un-ducted Fan (UDF). There has been renewed interest in the concept over recent years due to the fuel burn and emissions reduction potential, but the noise levels are higher. Significant progress has been made to reduce the noise levels due to research efforts in Europe and the United States. Appendix D summarises the IEP2 review of novel aircraft and engine concepts, excluding the open rotor and turboprops, which have been studied in recent years. The IEP2 selected three TSN-2 turbofan configurations out of the ones analyzed as possible candidates for recommendations. These were the NACRE Pro-Green, the MIT Double-Bubble and the Lockheed-Martin Box Wing. The IEP2 conducted interviews with the organizations responsible for the NACRE Pro-Green and the MIT Double-Bubble configurations. The interviews were focused on understanding how the reported noise levels were determined and the confidence for an Entry into Service (EIS) by 2030.
Page 106 of 182
The IEP2 also concluded that in addition to the geared turbofan and open rotor, only the MIT D8.1 Double-Bubble configuration could be developed and brought into service by 2030 (see Figure 6.4.5.1) under TSN-2. The reasons for this are that the higher risk technology, namely the integration of the fuselage and the propulsion system, is under study with wind tunnel testing as well as computational simulations. This work is being carried out by the MIT team under the US NASA N+3 Phase II contract. There were no technologies identified that could not be developed by 2030 although the certification of the aft mounted engine would need to be addressed. The concept would require financial commitment and there are no current plans to develop the concept into a product. It would likely require risk reduction research and development that is typically sponsored by government and/or industry consortia. The MIT D8.1 Double-Bubble configuration has a noise level that is 43 EPNdB below Chapter 4. The reported noise level corresponds to a conceptual study and has an uncertainty of ±10 EPNdB. To quantify the effects of the low noise aspects of the D8.1 aircraft concept and noise reduction technologies, the noise of the D8.1 is examined with respect to the Chapter 4 limit in Appendix D section D.2.
Figure 6.4.5.1 Rendering and three view of MIT D8.1 Double-Bubble lifting body
Page 107 of 182
7. Recommended noise reduction goals The projections in this report are based on best available information on the potential benefits of noise reduction technologies and expected future vehicle configurations. Specific noise reduction technologies have been used in the IEP evaluation that can realistically be implemented in the mid and long term timeframes. However, the marketplace will determine which technologies are actually selected for a particular vehicle. So while the results in this report show what can be done, what actually happens over the next ten and twenty years will depend on factors well beyond the scope of this study. This is why there will continue to be significant variations in noise levels for aircraft within a vehicle class that may either fall short or exceed the projections.
7.1 Mid Term – Year 20182020 This IEP1 section has not been updated by IEP2 because part of the current remit recommended that the Mid-term (MT) goals be left unchanged. The IEP2 is able to confirm that there is no reason to change the Mid-term goals because the Mid-term Noise Reduction Technologies (NRT) have not changed significantly (see above), nor have the Bypass Ratio projections and the minor change in time frame definition from 2018 to 2020, which has had no effect on these two parameter sets either. In the previous section, the IEP developed a set of trend lines which provided guidance on the amount of noise reduction that can be achieved for the various classes of aircraft, and used these trend lines to infer how much noise reduction might be possible based on bypass ratio improvements alone, and then with advanced noise reduction design features included. Following an assessment of the various NRT packages currently under development, as reported in the Review, it was concluded that these packages can provide small but not insignificant reductions in total aircraft system noise at takeoff, but that the addition of increased BPR designs provide a substantial improvement in takeoff noise. For approach noise, the increased BPR benefits are not as great as at takeoff, but the NRT packages have a more substantial benefit at approach than at takeoff. As outlined in Section 6, the IEP had requested that the WG1 industry members provide some sample aircraft noise estimates for a couple of BPR scenarios and for a Medium term and a Long term set of NRT packages, to supplement the information provided in the Review. The information was provided by two industry members for a ―Short-Medium Range Twin‖ virtual platform aircraft and gave the IEP critical information needed to assess the separate effects of NRT packages and increased BPR, as well as assess the likely uncertainty in the noise reduction benefits due to NRT package variations, BPR variations and also manufacturer implementation variations. From the above-described information in Section 6, for the Medium term (year 2018), the following recommended aircraft noise reduction technology goals are given in Table 7.1.1, relative to reference aircraft noise levels (derived from current Best Practice Noise Database aircraft noise levels), for consideration by CAEP.
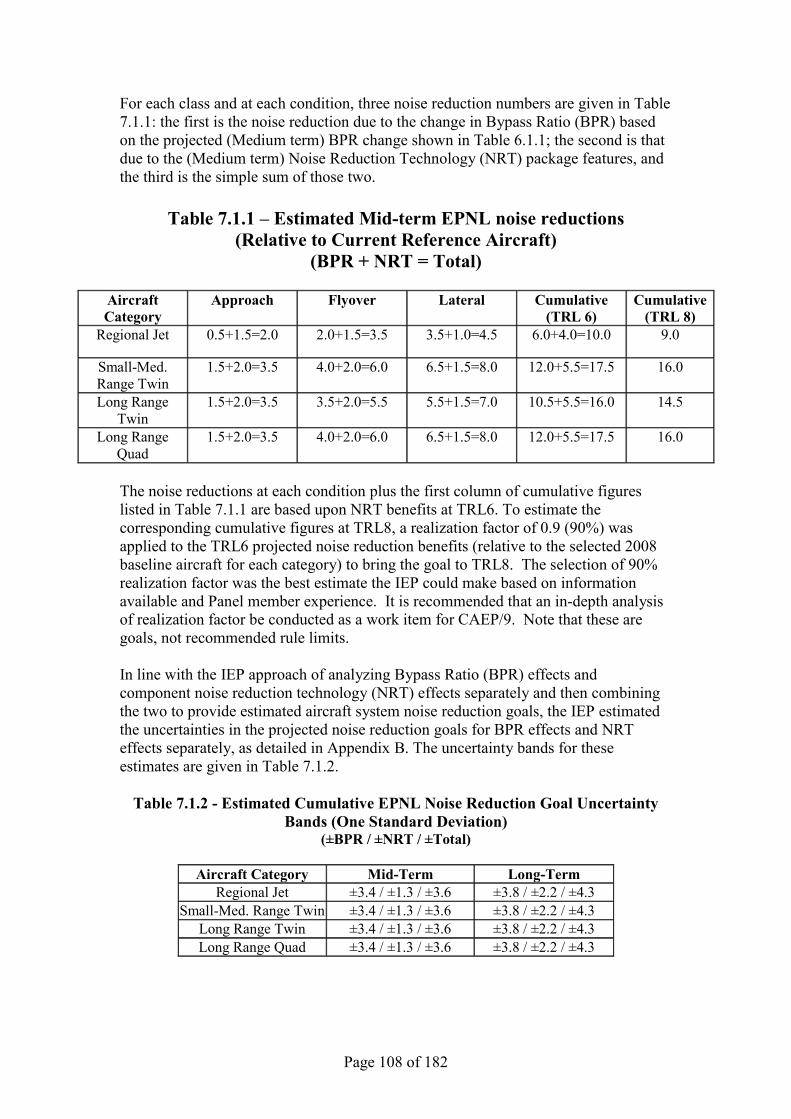
Page 108 of 182
For each class and at each condition, three noise reduction numbers are given in Table 7.1.1: the first is the noise reduction due to the change in Bypass Ratio (BPR) based on the projected (Medium term) BPR change shown in Table 6.1.1; the second is that due to the (Medium term) Noise Reduction Technology (NRT) package features, and the third is the simple sum of those two.
Table 7.1.1 – Estimated Mid-term EPNL noise reductions
(Relative to Current Reference Aircraft) (BPR + NRT = Total)
Aircraft Category
Approach Flyover Lateral Cumulative (TRL 6)
Cumulative (TRL 8)
Regional Jet 0.5+1.5=2.0 2.0+1.5=3.5 3.5+1.0=4.5 6.0+4.0=10.0 9.0
Small-Med. Range Twin
1.5+2.0=3.5 4.0+2.0=6.0 6.5+1.5=8.0 12.0+5.5=17.5 16.0
Long Range Twin
1.5+2.0=3.5 3.5+2.0=5.5 5.5+1.5=7.0 10.5+5.5=16.0 14.5
Long Range Quad
1.5+2.0=3.5 4.0+2.0=6.0 6.5+1.5=8.0 12.0+5.5=17.5 16.0
The noise reductions at each condition plus the first column of cumulative figures listed in Table 7.1.1 are based upon NRT benefits at TRL6. To estimate the corresponding cumulative figures at TRL8, a realization factor of 0.9 (90%) was applied to the TRL6 projected noise reduction benefits (relative to the selected 2008 baseline aircraft for each category) to bring the goal to TRL8. The selection of 90% realization factor was the best estimate the IEP could make based on information available and Panel member experience. It is recommended that an in-depth analysis of realization factor be conducted as a work item for CAEP/9. Note that these are goals, not recommended rule limits. In line with the IEP approach of analyzing Bypass Ratio (BPR) effects and component noise reduction technology (NRT) effects separately and then combining the two to provide estimated aircraft system noise reduction goals, the IEP estimated the uncertainties in the projected noise reduction goals for BPR effects and NRT effects separately, as detailed in Appendix B. The uncertainty bands for these estimates are given in Table 7.1.2.
Table 7.1.2 - Estimated Cumulative EPNL Noise Reduction Goal Uncertainty Bands (One Standard Deviation)
(±BPR / ±NRT / ±Total)
Aircraft Category Mid-Term Long-Term Regional Jet ±3.4 / ±1.3 / ±3.6 ±3.8 / ±2.2 / ±4.3
Small-Med. Range Twin ±3.4 / ±1.3 / ±3.6 ±3.8 / ±2.2 / ±4.3 Long Range Twin ±3.4 / ±1.3 / ±3.6 ±3.8 / ±2.2 / ±4.3 Long Range Quad ±3.4 / ±1.3 / ±3.6 ±3.8 / ±2.2 / ±4.3
Page 109 of 182
7.1.1 IEP2 Uncertainty Analysis The uncertainty for novel aircraft concepts is expected to be higher since i) the level of maturity is lower, ii) the number of uncertainty factors is larger, iii) the magnitude of some uncertainty factors may be larger, and iv) test vehicles do not exist that can validate the noise predictions. The IEP2 decided to use the same uncertainty values from the IEP1 for Mid-term goals and Long-term aircraft using conventional tube and wing configurations. The values have been rounded to ±4 EPNdB cum based on input from ICCAIA that this agrees well with uncertainty design margins used by industry. Larger uncertainty values are recommended for long term, novel aircraft with advanced technologies. ICCAIA presented recommendation that show a correlation between TRL and uncertainty values for novel aircraft concepts. The IEP2 agrees with these recommendations and have applied them to the long term noise goals for novel aircraft. See section 6.2 for more information on uncertainties for large turboprops and CROR. While the example given in Figure 1.9.7 is for counter-rotating open rotors (CROR), the IEP2 recommends using the same uncertainty values for long term TSN-2 aircraft concepts.
7.2 Long Term – Year 2028 In addition to advances in conventional aircraft configurations that might occur, novel concepts such as the Blended-Wing-Body (BWB) aircraft, Open-Rotor Fan Propulsion, and the Functionally Silent Aircraft were reviewed by the IEP, to the extent that quantitative information was available. It was concluded that the Blended Wing-Body (BWB) aircraft concepts and the Functionally Silent Aircraft concept were at too low a Technology Readiness Level to become viable products by 2028, and so the IEP conclusions and recommendations are based on conventional Wing-and-Tube aircraft architecture. The IEP concluded that propulsions systems could achieve larger bypass ratios than has been considered for the Medium term, based on input from the WG1 Planning Committee and individual ICCAIA member representatives. From the above-described information and the NASA AST and Pilot Study results, the following recommended aircraft noise reduction technology goals are given in Table 7.2.1, relative to reference aircraft noise levels (derived from current Best Practice Noise Database aircraft noise levels), for consideration by CAEP. As before, for each category and at each condition, three noise reduction numbers are given: the first is that due to the change in Bypass Ratio (BPR) from reference aircraft value to the maximum BPR in the Long Term projected by the Panel (see Table 6.1.1), the second is the noise reduction due to the Long Term Noise Reduction Technologies (NRT), and the final figure is the sum of the first two numbers. The goal Noise Reduction uncertainty bands are the same as for the Mid-term given in Table 7.1.2.
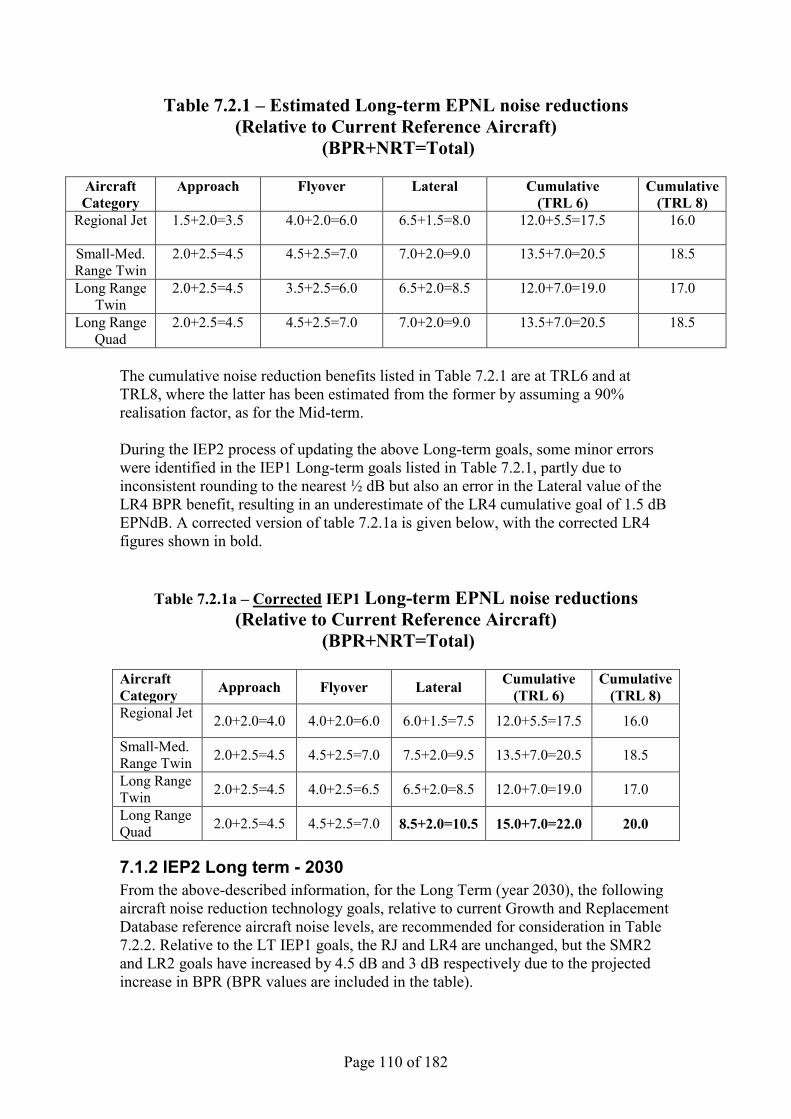
Page 110 of 182
Table 7.2.1 – Estimated Long-term EPNL noise reductions (Relative to Current Reference Aircraft)
(BPR+NRT=Total)
Aircraft Category
Approach Flyover Lateral Cumulative (TRL 6)
Cumulative (TRL 8)
Regional Jet 1.5+2.0=3.5 4.0+2.0=6.0 6.5+1.5=8.0 12.0+5.5=17.5 16.0
Small-Med. Range Twin
2.0+2.5=4.5 4.5+2.5=7.0 7.0+2.0=9.0 13.5+7.0=20.5 18.5
Long Range Twin
2.0+2.5=4.5 3.5+2.5=6.0 6.5+2.0=8.5 12.0+7.0=19.0 17.0
Long Range Quad
2.0+2.5=4.5 4.5+2.5=7.0 7.0+2.0=9.0 13.5+7.0=20.5 18.5
The cumulative noise reduction benefits listed in Table 7.2.1 are at TRL6 and at TRL8, where the latter has been estimated from the former by assuming a 90% realisation factor, as for the Mid-term. During the IEP2 process of updating the above Long-term goals, some minor errors were identified in the IEP1 Long-term goals listed in Table 7.2.1, partly due to inconsistent rounding to the nearest ½ dB but also an error in the Lateral value of the LR4 BPR benefit, resulting in an underestimate of the LR4 cumulative goal of 1.5 dB EPNdB. A corrected version of table 7.2.1a is given below, with the corrected LR4 figures shown in bold.
Table 7.2.1a – Corrected IEP1 Long-term EPNL noise reductions (Relative to Current Reference Aircraft)
(BPR+NRT=Total) Aircraft Category Approach Flyover Lateral Cumulative
(TRL 6) Cumulative
(TRL 8) Regional Jet 2.0+2.0=4.0 4.0+2.0=6.0 6.0+1.5=7.5 12.0+5.5=17.5 16.0
Small-Med. Range Twin 2.0+2.5=4.5 4.5+2.5=7.0 7.5+2.0=9.5 13.5+7.0=20.5 18.5
Long Range Twin 2.0+2.5=4.5 4.0+2.5=6.5 6.5+2.0=8.5 12.0+7.0=19.0 17.0
Long Range Quad 2.0+2.5=4.5 4.5+2.5=7.0 8.5+2.0=10.5 15.0+7.0=22.0 20.0
7.1.2 IEP2 Long term - 2030 From the above-described information, for the Long Term (year 2030), the following aircraft noise reduction technology goals, relative to current Growth and Replacement Database reference aircraft noise levels, are recommended for consideration in Table 7.2.2. Relative to the LT IEP1 goals, the RJ and LR4 are unchanged, but the SMR2 and LR2 goals have increased by 4.5 dB and 3 dB respectively due to the projected increase in BPR (BPR values are included in the table).
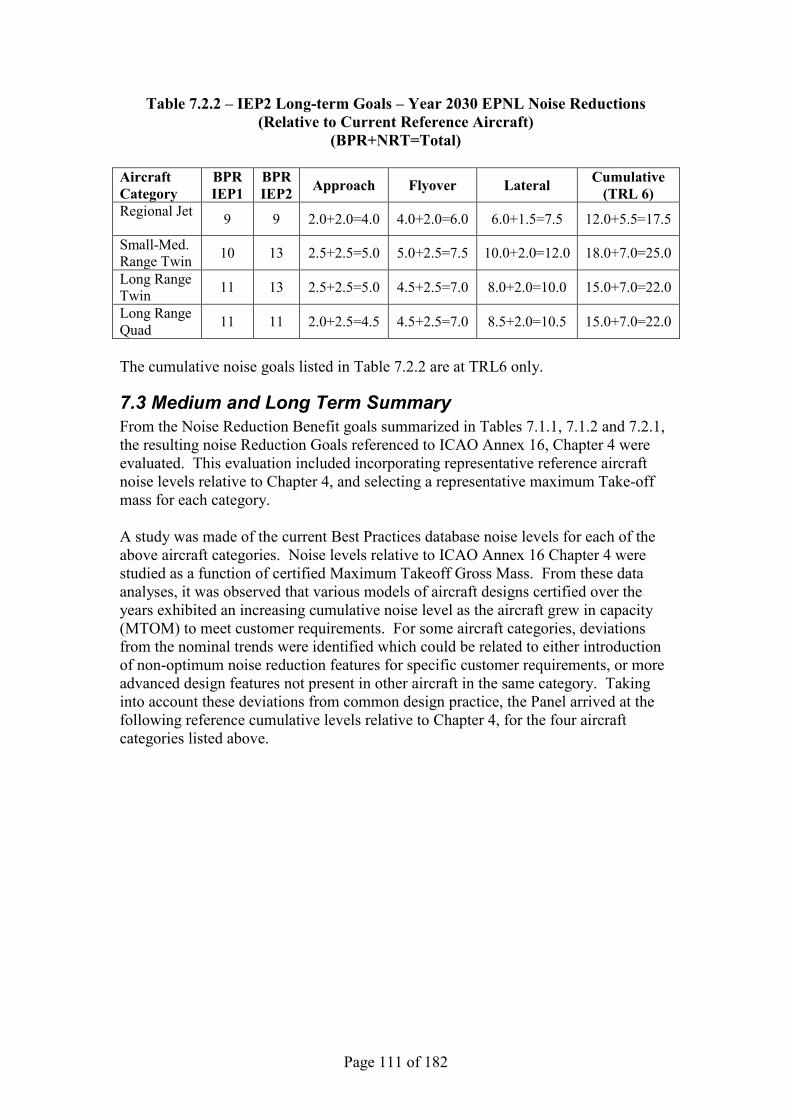
Page 111 of 182
Table 7.2.2 – IEP2 Long-term Goals – Year 2030 EPNL Noise Reductions (Relative to Current Reference Aircraft)
(BPR+NRT=Total) Aircraft Category
BPR IEP1
BPR IEP2 Approach Flyover Lateral Cumulative
(TRL 6) Regional Jet 9 9 2.0+2.0=4.0 4.0+2.0=6.0 6.0+1.5=7.5 12.0+5.5=17.5
Small-Med. Range Twin 10 13 2.5+2.5=5.0 5.0+2.5=7.5 10.0+2.0=12.0 18.0+7.0=25.0
Long Range Twin 11 13 2.5+2.5=5.0 4.5+2.5=7.0 8.0+2.0=10.0 15.0+7.0=22.0
Long Range Quad 11 11 2.0+2.5=4.5 4.5+2.5=7.0 8.5+2.0=10.5 15.0+7.0=22.0
The cumulative noise goals listed in Table 7.2.2 are at TRL6 only.
7.3 Medium and Long Term Summary From the Noise Reduction Benefit goals summarized in Tables 7.1.1, 7.1.2 and 7.2.1, the resulting noise Reduction Goals referenced to ICAO Annex 16, Chapter 4 were evaluated. This evaluation included incorporating representative reference aircraft noise levels relative to Chapter 4, and selecting a representative maximum Take-off mass for each category. A study was made of the current Best Practices database noise levels for each of the above aircraft categories. Noise levels relative to ICAO Annex 16 Chapter 4 were studied as a function of certified Maximum Takeoff Gross Mass. From these data analyses, it was observed that various models of aircraft designs certified over the years exhibited an increasing cumulative noise level as the aircraft grew in capacity (MTOM) to meet customer requirements. For some aircraft categories, deviations from the nominal trends were identified which could be related to either introduction of non-optimum noise reduction features for specific customer requirements, or more advanced design features not present in other aircraft in the same category. Taking into account these deviations from common design practice, the Panel arrived at the following reference cumulative levels relative to Chapter 4, for the four aircraft categories listed above.

Page 112 of 182
Table 7.3.1 – Reference Aircraft Take-off Weight and Noise Levels
Aircraft Category MTOM, tonnes Cum Level re: Ch. 4, Regional Jet 40 -4 EPNdB Small-Med. Range Twin 78 -5 EPNdB Long-Range Twin 230 -6 EPNdB Long-Range Quad 440 -5 EPNdB
It was recommended by the ICCAIA members of the WG1 N29 Planning Committee that the Panel apply a ―realization factor‖ to the recommended Noise Goal levels, to recognize the likelihood that some of the projected noise reduction concept benefits would erode as they are designed into a production aircraft system, and to recognize that there is an erosion in aircraft noise performance as it progresses from a TRL6 design definition to final aircraft certification. The ICCAIA recommendation was to add 5 EPNdB to the Panel TRL6 Noise Goal Levels to account for these effects. This correction represents the possible loss in noise benefits due to design compromises made as the design definition matures to a certifiable configuration, and due to certification flight test variability and uncertainty. After several discussions with the WG1 N29 Planning Committee members, the Panel felt collectively felt that it was still unclear as to what parts of the above-described realization factor causes have already been taken into account in their goal assessments and the uncertainty analysis that had been carried out. However, the Panel recognizes that a realization factor should be applied to the noise reduction benefits associated with both the Bypass Ratio benefits and the Noise Reduction Technology benefits that result from design implementation from TRL6 demonstration to final manufactured product certification. Therefore the Panel chose to apply a % realization factor to the cumulative noise benefit for each aircraft category. The factor chosen was 90%, i.e., 90% of the cumulative noise benefit demonstrated at TRL6 is estimated to be realized at aircraft certification. This factor was based on very little quantitative data, and the Panel used what little information it had available, plus several Panel members‘ past experience in choosing the above value of realization factor. The Panel therefore recommends that an in-depth study of ―Realization Factor‖ be the subject of a future CAEP work project, as a step toward improving the goal forecasting process established in the present Panel Review effort. This study could include quantifying the effects of aircraft category, certification point (not just cumulative level), and Bypass ratio. The Panel therefore offers the following Noise Goal levels, in cumulative noise level EPNL, relative to Chapter 4, with the understanding that they are based on TRL8 Noise Reduction Technology Benefits. It is important that CAEP realize that they are based on a somewhat arbitrary estimate of the realization factor employed to project benefits from TRL6 to TRL8. The Goal Levels given below in Table 7.3.2 have an uncertainty in their estimates, as described in section 7.1 above. Therefore an uncertainty band around the goal was estimated using the standard deviation values in Table 7.1.2, multiplied by a factor of 1.282 to yield an 80% confidence interval. Thus the band represents the range within which there is 80% probability that the goal can/may be achieved.
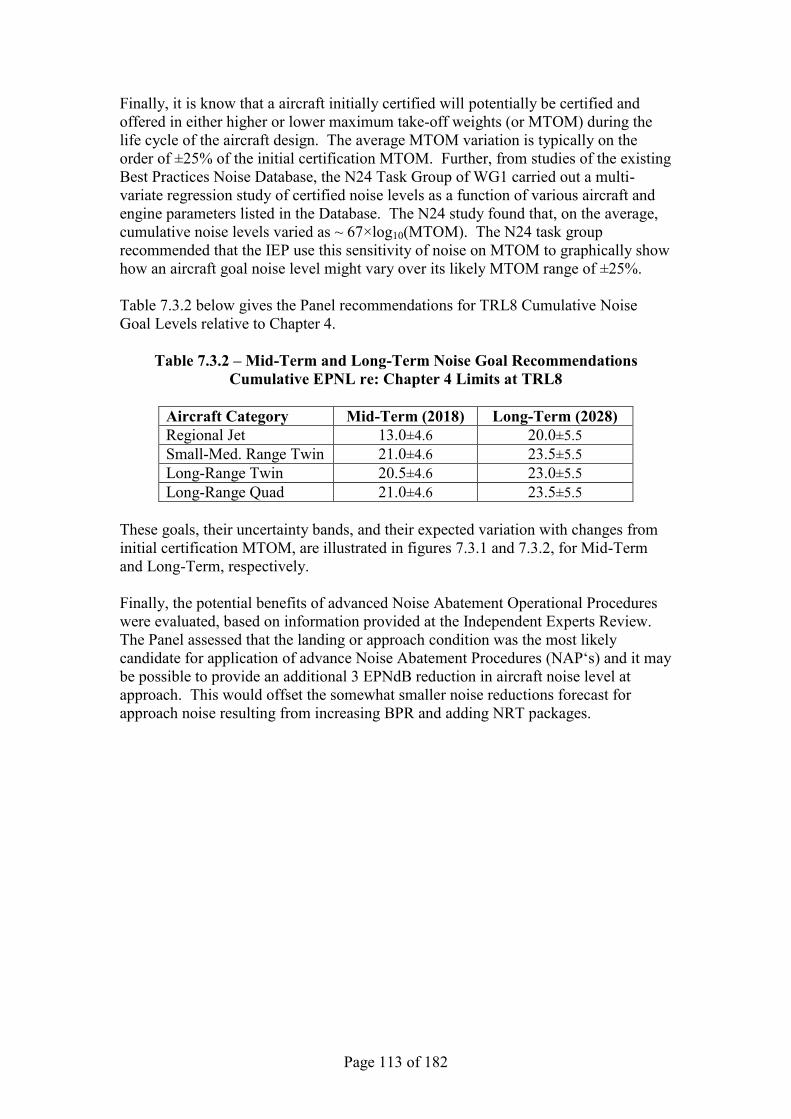
Page 113 of 182
Finally, it is know that a aircraft initially certified will potentially be certified and offered in either higher or lower maximum take-off weights (or MTOM) during the life cycle of the aircraft design. The average MTOM variation is typically on the order of ±25% of the initial certification MTOM. Further, from studies of the existing Best Practices Noise Database, the N24 Task Group of WG1 carried out a multi-variate regression study of certified noise levels as a function of various aircraft and engine parameters listed in the Database. The N24 study found that, on the average, cumulative noise levels varied as ~ 67×log10(MTOM). The N24 task group recommended that the IEP use this sensitivity of noise on MTOM to graphically show how an aircraft goal noise level might vary over its likely MTOM range of ±25%. Table 7.3.2 below gives the Panel recommendations for TRL8 Cumulative Noise Goal Levels relative to Chapter 4.
Table 7.3.2 – Mid-Term and Long-Term Noise Goal Recommendations Cumulative EPNL re: Chapter 4 Limits at TRL8
Aircraft Category Mid-Term (2018) Long-Term (2028) Regional Jet 13.0±4.6 20.0±5.5 Small-Med. Range Twin 21.0±4.6 23.5±5.5 Long-Range Twin 20.5±4.6 23.0±5.5 Long-Range Quad 21.0±4.6 23.5±5.5
These goals, their uncertainty bands, and their expected variation with changes from initial certification MTOM, are illustrated in figures 7.3.1 and 7.3.2, for Mid-Term and Long-Term, respectively. Finally, the potential benefits of advanced Noise Abatement Operational Procedures were evaluated, based on information provided at the Independent Experts Review. The Panel assessed that the landing or approach condition was the most likely candidate for application of advance Noise Abatement Procedures (NAP‘s) and it may be possible to provide an additional 3 EPNdB reduction in aircraft noise level at approach. This would offset the somewhat smaller noise reductions forecast for approach noise resulting from increasing BPR and adding NRT packages.
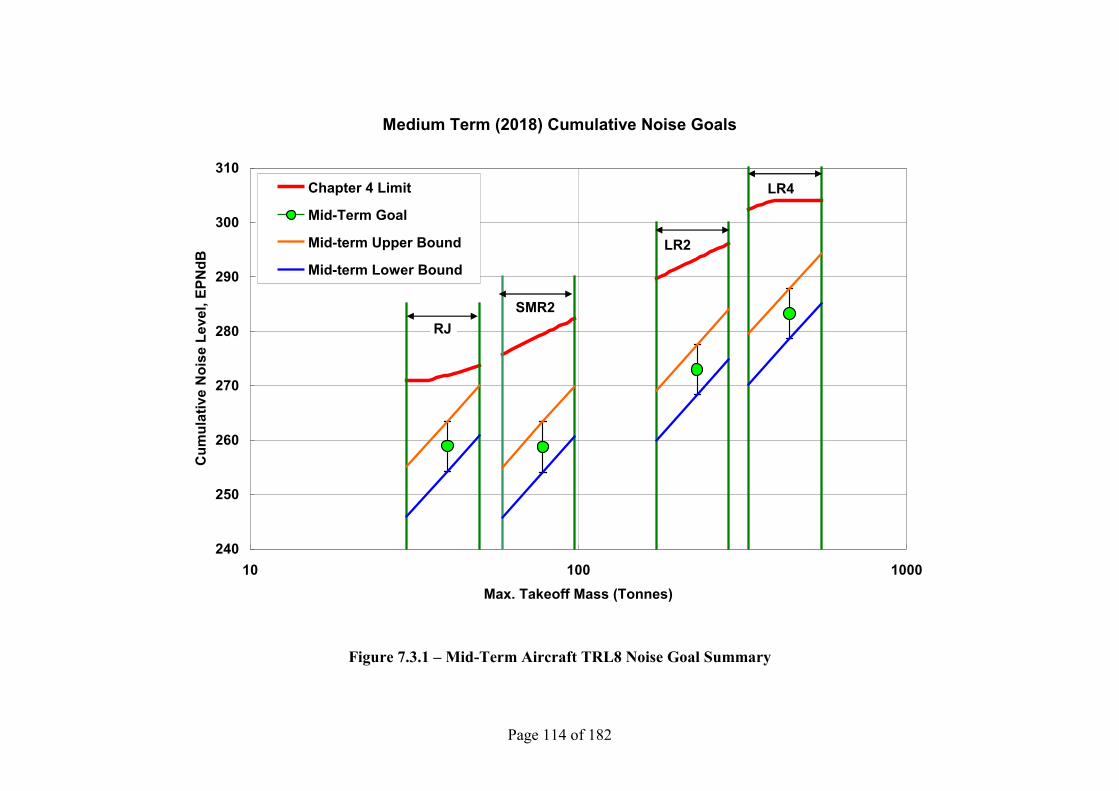
Page 114 of 182
Medium Term (2018) Cumulative Noise Goals
240
250
260
270
280
290
300
310
10 100 1000Max. Takeoff Mass (Tonnes)
Cum
ulat
ive
Noi
se L
evel
, EPN
dBChapter 4 Limit
Mid-Term Goal
Mid-term Upper Bound
Mid-term Lower Bound
RJSMR2
LR2
LR4
Figure 7.3.1 – Mid-Term Aircraft TRL8 Noise Goal Summary
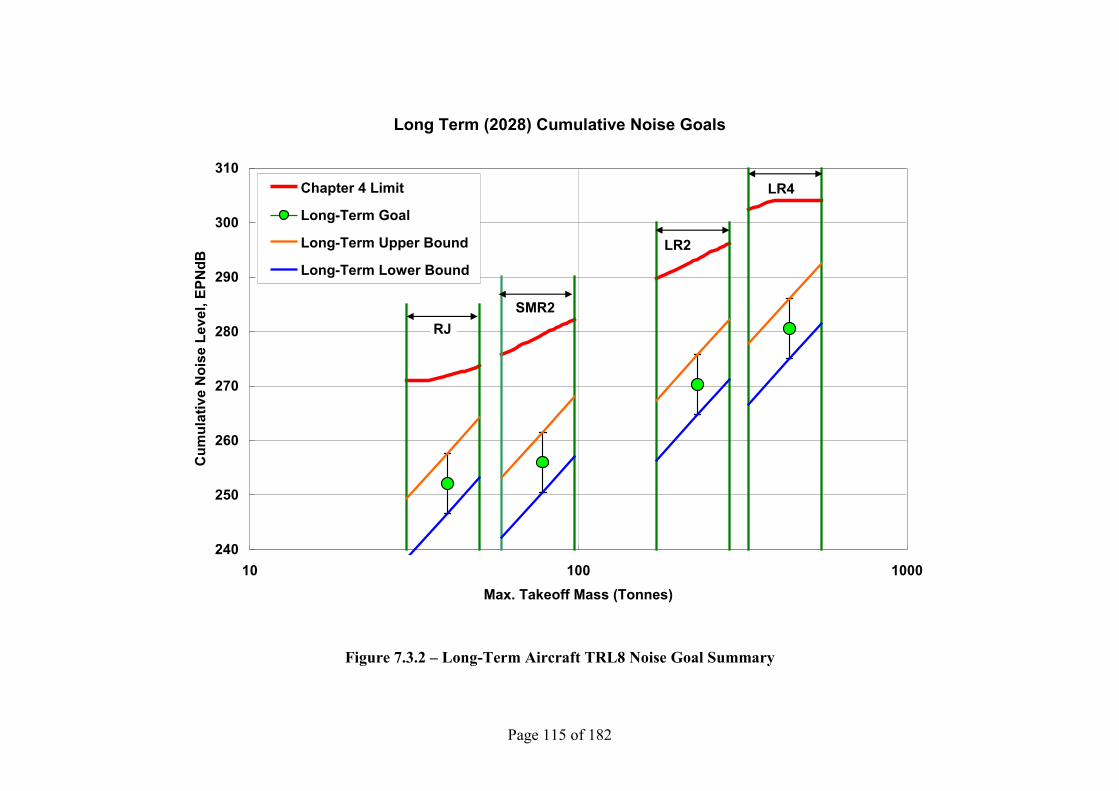
Page 115 of 182
Long Term (2028) Cumulative Noise Goals
240
250
260
270
280
290
300
310
10 100 1000Max. Takeoff Mass (Tonnes)
Cum
ulat
ive
Noi
se L
evel
, EPN
dBChapter 4 Limit
Long-Term Goal
Long-Term Upper Bound
Long-Term Lower Bound
RJSMR2
LR2
LR4
Figure 7.3.2 – Long-Term Aircraft TRL8 Noise Goal Summary
Page 116 of 182
7.3.1 IEP2 Final Noise Reduction Goal Recommendations Realization Factor The IEP2 reviewed the Realization Factor (RF) that was used by IEP1 and the proposal from ICCAIA that was presented at IER2. There were varying opinions on the correct way to develop and use the RF. The IEP1 reported that using a value of 90% was somewhat arbitrary since it was difficult to quantify due to a lack of data. The IEP2 agrees that there will be some degradation of noise reduction when products are developed from TRL6 to TRL8. The current experience is based on turbofan and turboprop powered aircraft. Since one of the primary objectives of the IER2 is to comment on long term technologies that include unconventional engine installations, it is doubtful that the past experience will be applicable especially for CROR propulsion systems. Furthermore, the IEP2 feels that it is not possible to determine the RF for an CROR aircraft at a TRL8 since there has not been any development for the concept beyond TRL6. Therefore it is the view of the panel that the scope of the review will be limited to TRL6 for long term novel aircraft configurations. This recommendation was accepted by ICCAIA at a meeting held with the IEP2 on February 8-9, 2012. Noise Goals Tables 7.3.1 and 7.3.2 below give the Panel recommendations for Mid-term and Long-term Cumulative Noise Margin Goals relative to Chapter 4, with their uncertainty factors. The tables show goals for the nominal aircraft weight and the expected maximum weight within each aircraft category. For large turboprops, ICCAIA provided input on the expected weight ranges to be 35 to 53 tonnes. Only mid-term goals are provided at TRL8. The sensitivity to weight is predicted to follow a slope of 60×log10(MTOM), as described in Section 6.2.5. The nominal cumulative noise margin goal relative to Chapter 4 for a 45 tonne aircraft is 12±4 EPNdB, and the minimum noise margin for the 53 tonne maximum weight aircraft is 9.5±4 EPNdB. For CROR aircraft, ICCAIA provided input on the expected weight ranges to be 58.5 to 91 tonnes. Only long-term goals are provided at TRL6. The sensitivity to weight is predicted to follow a slope of 74×log10(MTOM), as described in Section 6.2.5. The nominal cumulative noise margin goal relative to Chapter 4 for a 78 tonne aircraft is 13.5+2/-6 EPNdB, and the minimum noise margin for the 91 tonne maximum weight aircraft is 10.5+2/-6 EPNdB. All of the other goals in Tables 7.3.1 and 7.3.2 are for turbofans and have remained the same as the IEP1 recommendations, except for the long-term goals for SMR2 and LR2. The nominal and maximum weight margins were increased by 3 EPNdB to account for the increase in BPR from 11 to 13, as described in Sections 6.3.2.1 and 6.3.3.1. Also, the uncertainty values were rounded to ±4 EPNdB. The noise goals are shown graphically in Figures 7.3.3 and 7.3.4 for mid-term and long-term goals, respectively. The nominal turbofan goals are shown as green symbols with upper and lower bound uncertainty bands. The large turboprop and CROR nominal goals are shown as yellow symbols. The yellow shaded parallelograms depict the uncertainty bands and sensitivity to weight.

Page 117 of 182
Aircraft Category BPR Goal
NR TRL6 EPNdB
NR TRL8 EPNdB
Cum Margin Ref a/c
Re Ch. 4 EPNdB
Cum margin Goal TRL6
Re Ch. 4 EPNdB
Cum Goal TRL8
Regional Jet (RJ) 40 tonnes (nominal)
50 tonnes (max) 7±1 7±1
10 10
9 9
4 -0.5
14 9.5
13±4 8.5±4
Large Turboprops
45 tonnes (nominal) 53 tonnes (max)
- -
9.5 9.5
9 9
3 0.5
12.5 10
12±4 9.5±4
Short Medium Range Twin (SMR2) Turbofans: 78 tonnes (nominal)
98 tonnes (max) CROR: 78 tonnes (nominal)
91 tonnes (max)
9±1 9±1
- -
17.5 17.5
- -
16 16 - -
5 1.5 - -
22.5 19 - -
21±4 17.5±4
- -
Long Range Twin (LR2) 230 tonnes (nominal)
290 tonnes (max) 10±1 10±1
16 16
14.5 14.5
6 2.5
22 18.5
20.5±4 17±4
Long Range Quad (LR4) 440 tonnes (nominal)
550 tonnes (max) 9±1 9±1
17.5 17.5
16 16
5 -1.5
22.5 16
21±4 14.5±4
Table 7.3.1: Mid Term Goal Summary

Page 118 of 182
Aircraft Category BPR Goal
NR TRL6 EPNdB
NR TRL8 EPNdB
Cum Margin Ref a/c
Re Ch. 4 EPNdB
Cum margin Goal TRL6
Re Ch. 4 EPNdB
Cum Goal TRL8
Regional Jet (RJ) 40 tonnes (nominal)
50 tonnes (max) 9±1 9±1
17.5 17.5
- -
4 -0.5
21.5±4 17±4
- -
Large Turboprops 45 tonnes (nominal)
53 tonnes (max) - -
- -
- -
- -
- -
- -
Short Medium Range Twin (SMR2)
Turbofans: 78 tonnes (nominal) 98 tonnes (max)
CROR: 78 tonnes (nominal) 91 tonnes (max)
13±1 13±1
- -
25 25 8.5 8.5
- - - -
5 1.5 5 2
30±4 26.5±4
*13.5+2/-6 **10.5+2/-6
- - - -
Long Range Twin (LR2) 230 tonnes (nominal)
290 tonnes (max) 13±1 13±1
22 22
- -
6 2.5
28±4 24.5±4
- -
Long Range Quad (LR4) 440 tonnes (nominal)
550 tonnes (max) 11±1 11±1
22 22
- -
5 -1.5
27±4 20.5±4
- -
*CROR cumulative margin with uncertainties range from 7.5 to 15.5 EPNdB for 78 tone nominal weight aircraft. ** CROR cumulative margin with uncertainties range from 4.5 to 12.5 EPNdB for 91 tone maximum weight aircraft.
Table 7.3.2: Long Term Goal Summary
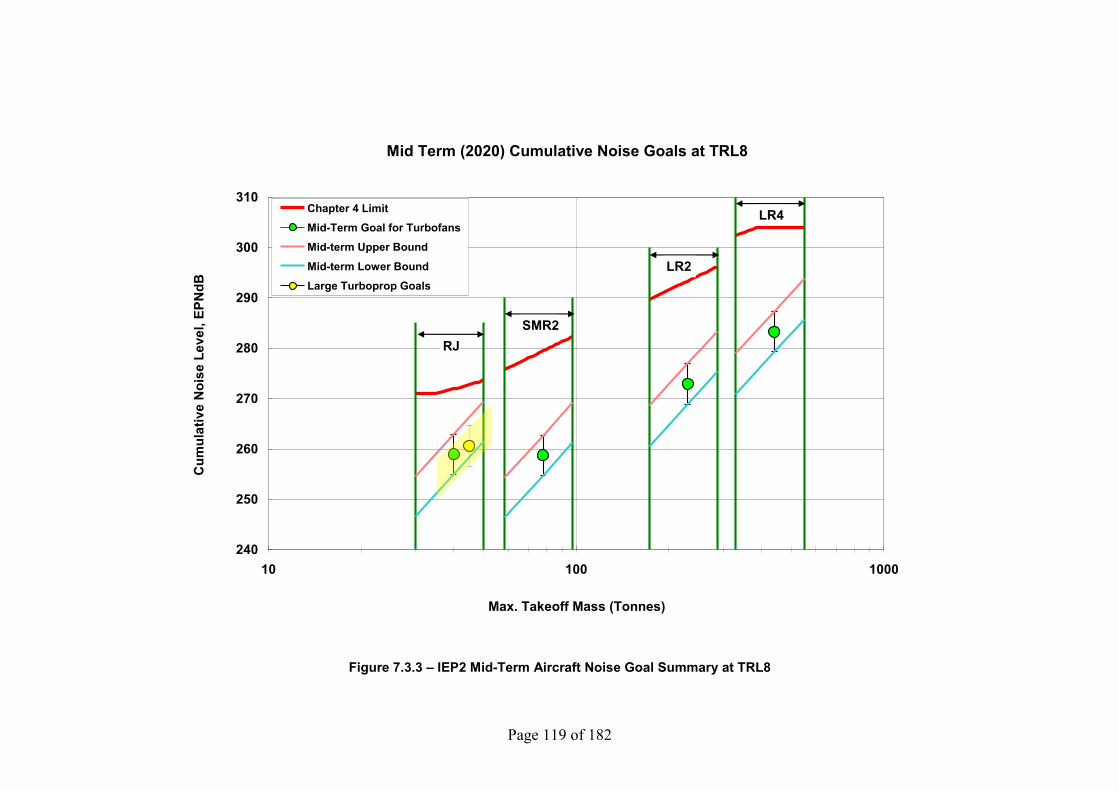
Page 119 of 182
Figure 7.3.3 – IEP2 Mid-Term Aircraft Noise Goal Summary at TRL8
Mid Term (2020) Cumulative Noise Goals at TRL8
240
250
260
270
280
290
300
310
10 100 1000
Max. Takeoff Mass (Tonnes)
Cum
ulat
ive
Noi
se L
evel
, EPN
dBChapter 4 LimitMid-Term Goal for TurbofansMid-term Upper Bound
Mid-term Lower BoundLarge Turboprop Goals
LR4
LR2
SMR2RJ
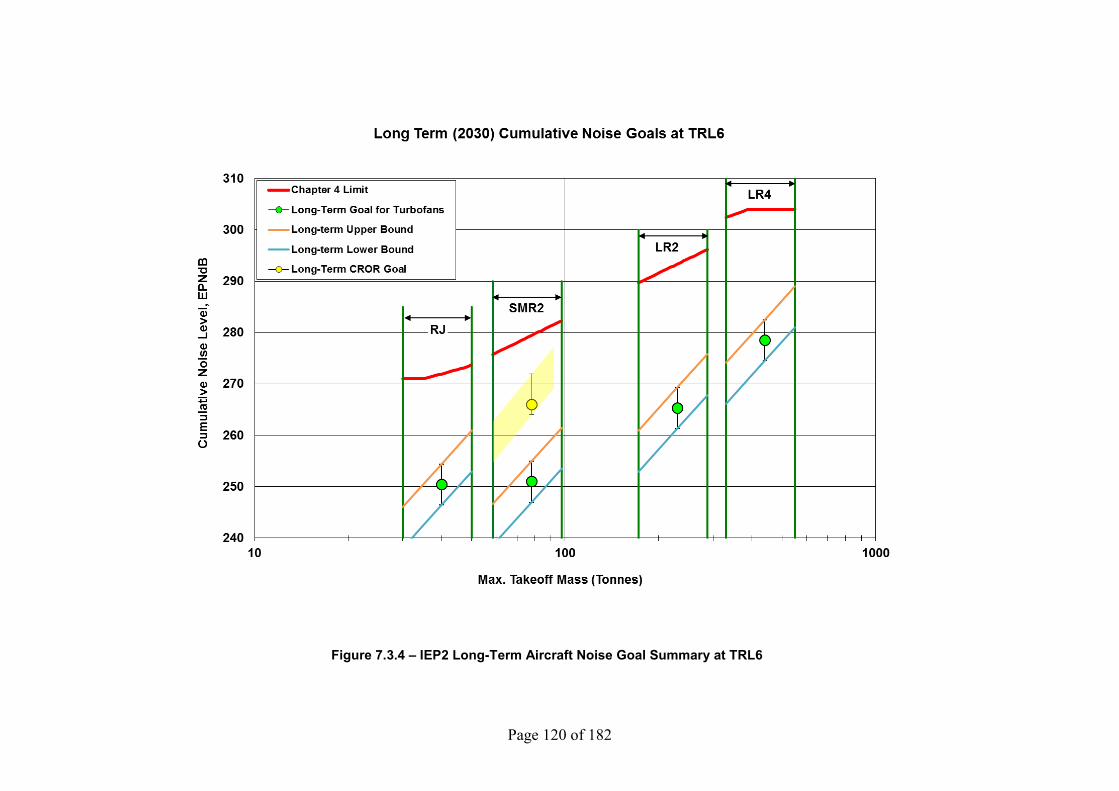
Page 120 of 182
Figure 7.3.4 – IEP2 Long-Term Aircraft Noise Goal Summary at TRL6
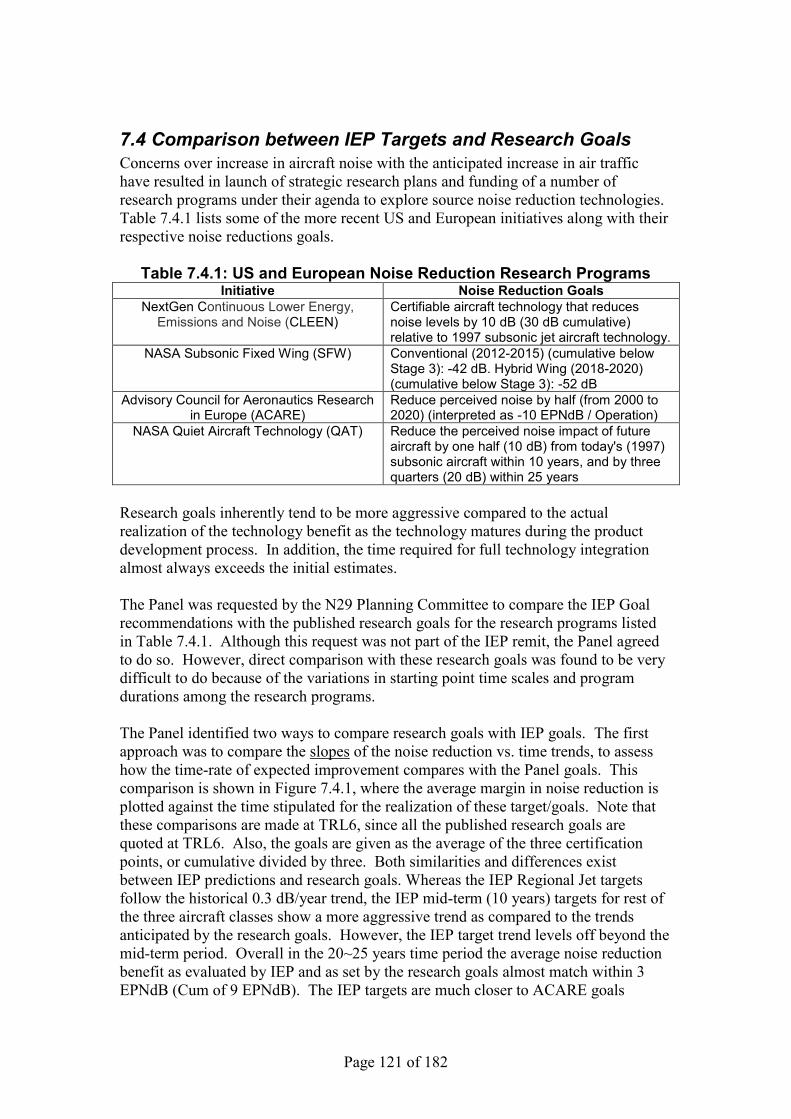
Page 121 of 182
7.4 Comparison between IEP Targets and Research Goals Concerns over increase in aircraft noise with the anticipated increase in air traffic have resulted in launch of strategic research plans and funding of a number of research programs under their agenda to explore source noise reduction technologies. Table 7.4.1 lists some of the more recent US and European initiatives along with their respective noise reductions goals.
Table 7.4.1: US and European Noise Reduction Research Programs Initiative Noise Reduction Goals
NextGen Continuous Lower Energy, Emissions and Noise (CLEEN)
Certifiable aircraft technology that reduces noise levels by 10 dB (30 dB cumulative) relative to 1997 subsonic jet aircraft technology.
NASA Subsonic Fixed Wing (SFW) Conventional (2012-2015) (cumulative below Stage 3): -42 dB. Hybrid Wing (2018-2020) (cumulative below Stage 3): -52 dB
Advisory Council for Aeronautics Research in Europe (ACARE)
Reduce perceived noise by half (from 2000 to 2020) (interpreted as -10 EPNdB / Operation)
NASA Quiet Aircraft Technology (QAT) Reduce the perceived noise impact of future aircraft by one half (10 dB) from today's (1997) subsonic aircraft within 10 years, and by three quarters (20 dB) within 25 years
Research goals inherently tend to be more aggressive compared to the actual realization of the technology benefit as the technology matures during the product development process. In addition, the time required for full technology integration almost always exceeds the initial estimates. The Panel was requested by the N29 Planning Committee to compare the IEP Goal recommendations with the published research goals for the research programs listed in Table 7.4.1. Although this request was not part of the IEP remit, the Panel agreed to do so. However, direct comparison with these research goals was found to be very difficult to do because of the variations in starting point time scales and program durations among the research programs. The Panel identified two ways to compare research goals with IEP goals. The first approach was to compare the slopes of the noise reduction vs. time trends, to assess how the time-rate of expected improvement compares with the Panel goals. This comparison is shown in Figure 7.4.1, where the average margin in noise reduction is plotted against the time stipulated for the realization of these target/goals. Note that these comparisons are made at TRL6, since all the published research goals are quoted at TRL6. Also, the goals are given as the average of the three certification points, or cumulative divided by three. Both similarities and differences exist between IEP predictions and research goals. Whereas the IEP Regional Jet targets follow the historical 0.3 dB/year trend, the IEP mid-term (10 years) targets for rest of the three aircraft classes show a more aggressive trend as compared to the trends anticipated by the research goals. However, the IEP target trend levels off beyond the mid-term period. Overall in the 20~25 years time period the average noise reduction benefit as evaluated by IEP and as set by the research goals almost match within 3 EPNdB (Cum of 9 EPNdB). The IEP targets are much closer to ACARE goals
Page 122 of 182
compared to the goals of NASA programs, which are more aggressive. This may be because the NASA programs assume a different architecture. The second approach was to compare on the basis of consistent Technology Readiness Level. The N29 Planning committee suggested a format for doing this, and this is shown in figure 7.4.2. The aggregate noise reduction trend envisaged by IEP for the 20~25 years period for the Short-Medium Range Twins, Long Range Twins and Long Range Quad aircraft classes is 0.35 dB/year. This prediction seems very conservative in comparison with the US and European research goals beyond the 20~25 years timeframe. IEP feels that this trend is more realistic given the noise reduction technologies and their development status that were present at the Review. IEP also believes that achievement of research goals beyond this time period can only be realized via the application of novel propulsion and airframe architectures, some of which have been discussed in Section 6.4.
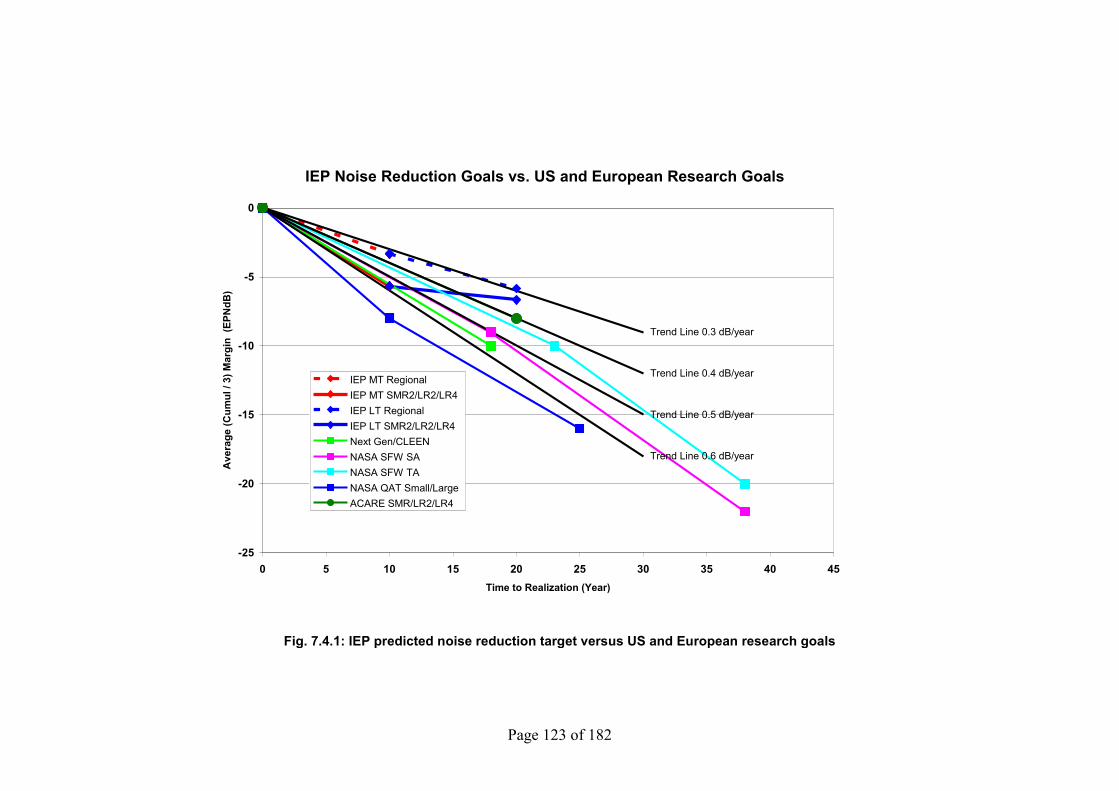
Page 123 of 182
IEP Noise Reduction Goals vs. US and European Research Goals
Trend Line 0.4 dB/year
Trend Line 0.5 dB/year
Trend Line 0.6 dB/year
Trend Line 0.3 dB/year
-25
-20
-15
-10
-5
0
0 5 10 15 20 25 30 35 40 45Time to Realization (Year)
Ave
rage
(Cum
ul /
3) M
argi
n (E
PNdB
)
IEP MT RegionalIEP MT SMR2/LR2/LR4IEP LT RegionalIEP LT SMR2/LR2/LR4Next Gen/CLEENNASA SFW SA NASA SFW TANASA QAT Small/Large ACARE SMR/LR2/LR4
Fig. 7.4.1: IEP predicted noise reduction target versus US and European research goals

Page 124 of 182
Figure 7.4.2: Comparison of IEP Goals with European and U.S. Research Goals based on TRL Equivalence
-30
-20
-10
0
1990 2000 2010 2020 2030 2040Year
Ave
rage
(Cum
ul /
3) M
argi
n to
Cha
pter
4(E
PNdB
)
NASA SFW SANASA SFW TANextGen / CLEENACARE SMRACARE LR2ACARE LR4NASA QAT SmallNASA QAT LargeIEP SMRIER LR2IER LR4
Realistic Expectations From On-Going research
Greater Uncertainty: Benefits associated with breakthrough on novel A/C configs
Consistent Baselines

Page 125 of 182
7.4.1 IEP2 Comparison with Research Programme Goals The mid-term and long-term goals described above are compared with the goals of current research programmes in Figure 7.4.3. The noise values are shown as an average of the cumulative noise margins relative to Chapter 4. The baseline noise levels are consistent between the IEP recommendations and the research programs. The expected nominal noise level for a CROR SMR2 aircraft is shown separate from the turbofan powered aircraft. The estimated noise reduction for the D8.1 Double Bubble aircraft, which could be developed within the TSN-2 scenario, is consistent with the NASA SFW/ERA goals within the region labelled ―novel aircraft design.‖ Research programme goals, especially for the long term, need to be aggressive enough to ensure a sustained commitment in intensive, properly resourced, research programs. This is needed to efficiently cope with unforeseen obstacles and effects, inevitable compromises and re-orientations that are bound to occur when exploring new novel aircraft configurations. Such goals therefore need to provide a reserve margin. IEP recommended goals for CAEP are assuming also the use of best knowledge, practices and means, but they need to stick ultimately to the best expectation, integrating all the uncertainty factors. Unsurprisingly, such goals tend therefore to show up slightly less aggressive than the research goals (or their achievement slightly delayed in time).

Page 126 of 182
Comparison with Research Program Goals (TRL6)
Implies Novel Aircraft Design
CROR
Turbofans
Consistent Baseline
-30
-20
-10
0
1990 2000 2010 2020 2030 2040 2050
Aver
age
(Cum
ul /
3) M
argi
n to
Cha
pter
4(E
PNdB
)
Year
NASA SFW/ERA SA
NASA SFW/ERA TA
NextGen / CLEEN
ACARE SMR/LR2
ACARE LR4
NASA QAT Small
NASA QAT Large
IEP2 SMR2 Turbofan
IEP2 SMR2 CROR
IEP2 LR2
IEP2 LR4
Figure 7.4.3 – Comparison of IEP2 goals with Research Programme goals
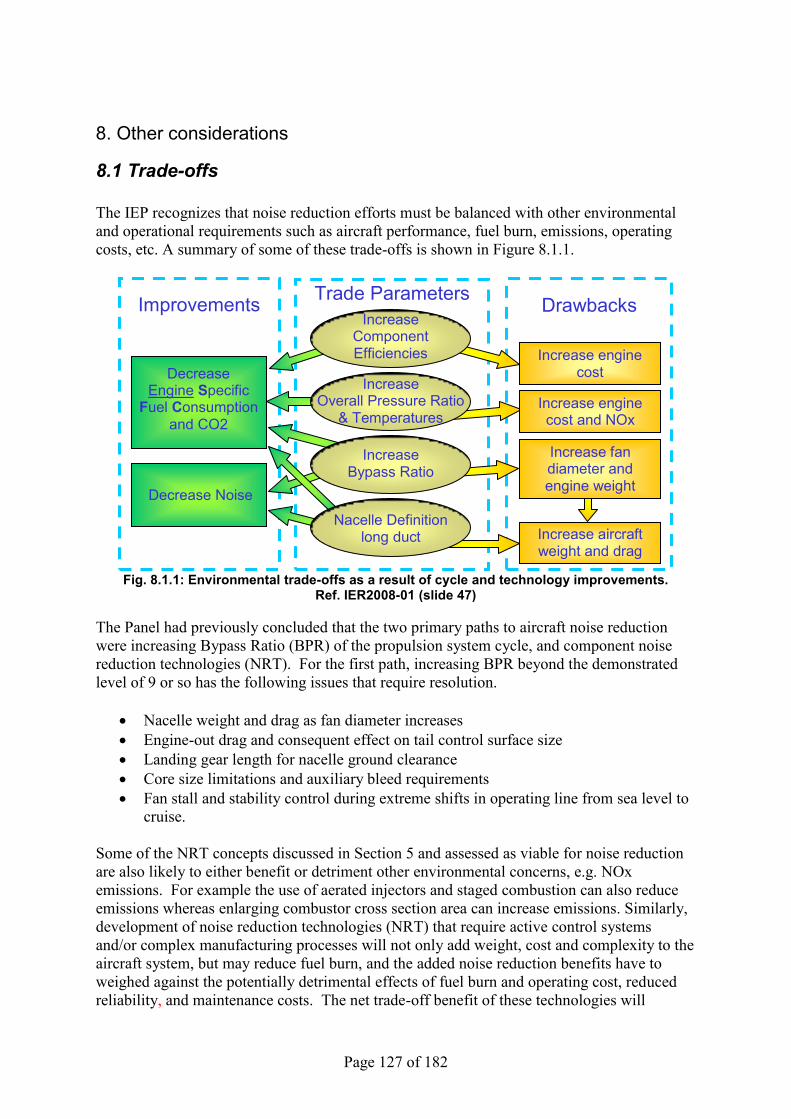
Page 127 of 182
8. Other considerations
8.1 Trade-offs The IEP recognizes that noise reduction efforts must be balanced with other environmental and operational requirements such as aircraft performance, fuel burn, emissions, operating costs, etc. A summary of some of these trade-offs is shown in Figure 8.1.1.
Fig. 8.1.1: Environmental trade-offs as a result of cycle and technology improvements.
Ref. IER2008-01 (slide 47) The Panel had previously concluded that the two primary paths to aircraft noise reduction were increasing Bypass Ratio (BPR) of the propulsion system cycle, and component noise reduction technologies (NRT). For the first path, increasing BPR beyond the demonstrated level of 9 or so has the following issues that require resolution.
Nacelle weight and drag as fan diameter increases Engine-out drag and consequent effect on tail control surface size Landing gear length for nacelle ground clearance Core size limitations and auxiliary bleed requirements Fan stall and stability control during extreme shifts in operating line from sea level to
cruise. Some of the NRT concepts discussed in Section 5 and assessed as viable for noise reduction are also likely to either benefit or detriment other environmental concerns, e.g. NOx emissions. For example the use of aerated injectors and staged combustion can also reduce emissions whereas enlarging combustor cross section area can increase emissions. Similarly, development of noise reduction technologies (NRT) that require active control systems and/or complex manufacturing processes will not only add weight, cost and complexity to the aircraft system, but may reduce fuel burn, and the added noise reduction benefits have to weighed against the potentially detrimental effects of fuel burn and operating cost, reduced reliability, and maintenance costs. The net trade-off benefit of these technologies will
Improvements Drawbacks Trade Parameters
Increase engine cost and NOx
Increase fan diameter and engine weight
Increase aircraft weight and drag
Increase Bypass Ratio
Nacelle Definition long duct
Decrease Engine Specific
Fuel Consumption and CO2
Decrease Noise
Increase Component Efficiencies Increase engine
cost Increase
Overall Pressure Ratio & Temperatures

Page 128 of 182
therefore have to be weighed via overall system optimization. System level analysis using tools like the Carpet-Plots, similar to the one shown in Figure 8.1.2, may be very useful to achieve a balance.
Min Fuel Burn
Min Noise(min FPR)
Min NOx
-4.0
-3.0
-2.0
-1.0
0.0
+1.0
+2.0
+3.0
+4.0
+5.0
+6.0
72 76 80 84 88 92 96 100 104 108 112
Absolute LTO NOx, %kg (Relative to Base Engine)
Min
Del
ta F
uel B
urn,
% (R
elat
ive
to B
ase
Engi
ne)
Constant OPR
Low OPR
High OPR
Constant FPR
High FPRCum Noise Margin=0
Low FPRCum Noise Margin=6
Mid FPRCum Noise Margin=3.6
Min Fuel Burn
Min Noise(min FPR)
Min NOx
Min Fuel Burn
Min Noise(min FPR)
Min NOx
-4.0
-3.0
-2.0
-1.0
0.0
+1.0
+2.0
+3.0
+4.0
+5.0
+6.0
72 76 80 84 88 92 96 100 104 108 112
Absolute LTO NOx, %kg (Relative to Base Engine)
Min
Del
ta F
uel B
urn,
% (R
elat
ive
to B
ase
Engi
ne)
Constant OPR
Low OPR
High OPR
Constant FPR
High FPRCum Noise Margin=0
Low FPRCum Noise Margin=6
Mid FPRCum Noise Margin=3.6
High FPRCum Noise Margin=0
Low FPRCum Noise Margin=6
Mid FPRCum Noise Margin=3.6
Fig. 8.1.2: Overall System Optimization – Carpet plot for Noise/NOx/Fuel Burn trade-off.
Ref. IER2008-01 (slide 46)
8.1.1 Environmental efficiency and other economic trade-offs (IEP2 Task 3) Trade-offs are intrinsic to aero-engines and aircraft design optimization processes. In particular, environmental trade-offs (Noise/NOx/CO2), linked to physical principles and associated with fuel efficiency, are major drivers for optimizing the aircraft/propulsion system design and configuration. This is combined with other general trade-offs, including other major areas (e.g. operations, regulations, research). This omnipresence of trade-offs is evidenced by the multiple key integration issues associated with the NRT‘s. It is also manifest on every new product from overall design requirements to detailed design, with multiple interdependencies within and between design features and technologies. It is the case when assessing the relative advantages of GTF (geared turbofan), UHB (Ultra High Bypass) engine or open rotor engines, in terms of noise and fuel burn/emissions, and when determining the optimum balance of design and technological features for each application. The GTF characteristics (in particular: low speed fan, low fan pressure ratio, higher BPR), aim at producing lower fuel burn compared to a conventional turbofan of the earlier generation, while emitting less noise. The Open Rotor favours more fuel burn reduction, through high propulsive efficiency, but this design limits the capability of reducing noise, compared to an advanced turbofan. On any combination of engine, nacelle and powerplant installation features, benefits and penalties must be weighed in terms of noise, fuel consumption/CO2 emissions, NOx
Page 129 of 182
emissions, weight and costs. Any product design must of course remain consistent with all major requirements, safety remaining on top as an overarching one. Environmental and economic trade-offs are very challenging to apprehend and analyse, due to complex, ―remote and entangled‖ features, and evolving issues: remote by the nature of the physical parameters involved, by their types of effects, local or global, very different in terms of time basis, altitude effects, etc.; entangled through intimately linked and interacting features at the level of propulsion system and aircraft design and technologies, operations, etc. Identifying the most appropriate balance between environmental requirements and/or making a meaningful comparison of environmental and other characteristics is a difficult challenge, due to the lack of unique, universal criteria. Nevertheless, it is crucial to make progress in understanding quantitative trade-offs for optimizing solutions based on selected criteria, and for perpetuating environmental benefits. This implies extensive analyses specific to each case. In the context of ICAO noise technology goals setting, trade-offs between noise and fuel efficiency/emissions raise a particular challenge11, especially when dealing with the little explored territory of novel configurations where uncertainty bands are unavoidably large. Nevertheless, because of the very intrinsic nature of environmental and economic trade-offs within all aero-engine and aircraft design optimization processes, the studies used and the results contained in this report, including noise technology related goals, integrate and reflect to some extent the combined effect of multidimensional underlying trade-offs.
8.2 Noise Abatement Operational Procedures Detailed assessment of Noise Abatement Operational Procedures (NAP) is the responsibility of WG2, made up of Air Traffic Control experts, Airline representatives, Airline Pilot representatives, and aircraft manufacturer representatives. However, the WG1 Planning Committee requested that the Independent Expert Panel (IEP) address NAP methods, to evaluate how and when Noise Abatement operational Procedures might be used to supplement new noise reduction technology developments in the next 10 years, to further reduce noise exposure around the airport community, as well as during climb and descent. A very significant improvement in cumulative noise reduction is expected from the introduction of NRT and increased BPR, but this improvement is not expected to be the same between takeoff and landing, most of this improvement occurring at take-off (lateral and flyover) with much smaller benefits predicted at approach. Tables 7.1.1 and 7.2.1 show that the benefits at landing/approach are ~3 to 4 dB less than at departure. The main contributor at landing, at least for the SMR and LR classes of aircraft, is the undercarriage-generated noise, even when engine noise has a non-negligible contribution. So the difference between take-off and landing suggests a difference in the potential role of operational procedures for aircraft noise reduction. NAP may be useful for reducing noise exposure at take-off, but may
11 The ICAO fuel burn reduction technology goal resulting from the corresponding IEP exercise corresponds to a 1.4% annual reduction at ―best-in-class‖ aircraft individual level, i.e. less than the ICAO target of 2% fuel burn reduction at fleet level, indicating that technology alone cannot produce the targeted reduction. Therefore, depending where technology goals are set, the challenge may be more or less difficult. In other words, this may raise a potential issue of consistency/compatibility of noise and fuel burn goals, taking into account the general emerging trend to-day, whereby the fuel burn/GHG emissions appear to be the likely fastest growing concern.
Page 130 of 182
be essential for the final approach, depending on what noise levels are ultimately deemed acceptable. Takeoff For takeoff, improvements are likely to be provided mainly by increased BPR, but also to source noise reduction technologies. Standard takeoff procedures are already in place that incorporates a power cut-back at 1000 ft. altitude, followed by acceleration before the continuation of the climb. The cut-back altitude may be reduced to 800 ft., if the aircraft systems allow it, to better protect more sensitive areas closer to the airport. In contrast, cut-back may be delayed to a higher altitude for a better benefit over areas further from the airport. Hence the takeoff NAP may be very specific to the airport locale from which the aircraft is operating. As an example, for a short-medium range aircraft, the expected noise reduction may be ~6 to 7 dB at flyover. However, it is likely to be very difficult to do more with the procedures, except possibly in very specific cases. Climb At the climb rating, which is close to the takeoff rating, it may be expected that the increased BPR and the associated noise reduction technologies will yield a noise reduction equal to or better than that achieved during takeoff. This effect, plus the increasing attenuation due to the increasing altitude, should reduce considerably the footprint at a given noise level. Further, the flight management system (FMS) may be optimized to avoid more sensitive areas and simplify the crew tasks. Landing For the final approach, the effect of the increased BPR is small and the expected noise level reductions will also be small, even with noise reduction technologies, which are expected to be clearly smaller than at takeoff. As an example, for the SMR2, for an increase in BPR from ~5 to between 8 and 9 , the reduction is estimated to be only ~0.5 db/BPR unit for BPR changes alone, and ~1.2db/BPR unit with the noise reduction technologies included. As previously discussed, even if the engine noise still plays a role in the noise signature at approach, the undercarriage becomes the dominant noise source, at least for the SMR and LR aircraft classes. Further, it may be speculated that with the conventional under-the-wing engine-aircraft architecture, above a given BPR, the increased diameter of the nacelle will lead to an increased size of the undercarriage, which will further negate some of the noise benefits potentially achievable from increased BPR and noise reduction technologies. The anticipated small noise reduction benefits of new configurations, and the risk of decreasing these benefits with increasing BPR show that significant noise reductions at approach, comparable to that anticipated at takeoff, may only be achievable with adequate noise abatement procedures. One way to do it might be to fly over the approach certification point at a higher altitude, using, for instance, an increased ILS slope, today set for certification purposes at 3°, which is common practice. A 4°slope could potentially reduce approach noise by about ~4 dB, while a 3.5° glide slope may only provide ~2 dB appreciable reduction. The benefit is there, but the question is how to get it, in coordination between airlines, ATC, aircraft manufacturers, and airline pilots, without increasing the noise somewhere else. Note that a 3.5° glide slope is already used at some airports for environmental reasons (mountains ...), showing the feasibility of the concept.
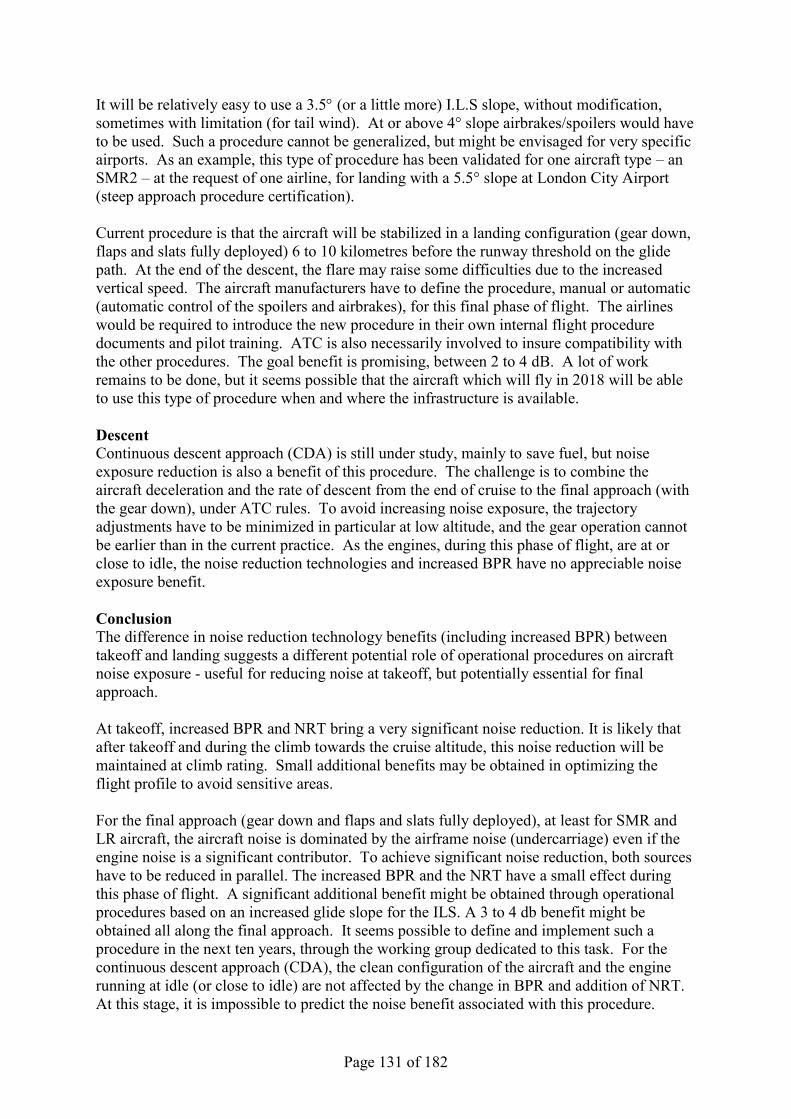
Page 131 of 182
It will be relatively easy to use a 3.5 (or a little more) I.L.S slope, without modification, sometimes with limitation (for tail wind). At or above 4° slope airbrakes/spoilers would have to be used. Such a procedure cannot be generalized, but might be envisaged for very specific airports. As an example, this type of procedure has been validated for one aircraft type – an SMR2 – at the request of one airline, for landing with a 5.5° slope at London City Airport (steep approach procedure certification). Current procedure is that the aircraft will be stabilized in a landing configuration (gear down, flaps and slats fully deployed) 6 to 10 kilometres before the runway threshold on the glide path. At the end of the descent, the flare may raise some difficulties due to the increased vertical speed. The aircraft manufacturers have to define the procedure, manual or automatic (automatic control of the spoilers and airbrakes), for this final phase of flight. The airlines would be required to introduce the new procedure in their own internal flight procedure documents and pilot training. ATC is also necessarily involved to insure compatibility with the other procedures. The goal benefit is promising, between 2 to 4 dB. A lot of work remains to be done, but it seems possible that the aircraft which will fly in 2018 will be able to use this type of procedure when and where the infrastructure is available. Descent Continuous descent approach (CDA) is still under study, mainly to save fuel, but noise exposure reduction is also a benefit of this procedure. The challenge is to combine the aircraft deceleration and the rate of descent from the end of cruise to the final approach (with the gear down), under ATC rules. To avoid increasing noise exposure, the trajectory adjustments have to be minimized in particular at low altitude, and the gear operation cannot be earlier than in the current practice. As the engines, during this phase of flight, are at or close to idle, the noise reduction technologies and increased BPR have no appreciable noise exposure benefit. Conclusion The difference in noise reduction technology benefits (including increased BPR) between takeoff and landing suggests a different potential role of operational procedures on aircraft noise exposure - useful for reducing noise at takeoff, but potentially essential for final approach. At takeoff, increased BPR and NRT bring a very significant noise reduction. It is likely that after takeoff and during the climb towards the cruise altitude, this noise reduction will be maintained at climb rating. Small additional benefits may be obtained in optimizing the flight profile to avoid sensitive areas. For the final approach (gear down and flaps and slats fully deployed), at least for SMR and LR aircraft, the aircraft noise is dominated by the airframe noise (undercarriage) even if the engine noise is a significant contributor. To achieve significant noise reduction, both sources have to be reduced in parallel. The increased BPR and the NRT have a small effect during this phase of flight. A significant additional benefit might be obtained through operational procedures based on an increased glide slope for the ILS. A 3 to 4 db benefit might be obtained all along the final approach. It seems possible to define and implement such a procedure in the next ten years, through the working group dedicated to this task. For the continuous descent approach (CDA), the clean configuration of the aircraft and the engine running at idle (or close to idle) are not affected by the change in BPR and addition of NRT. At this stage, it is impossible to predict the noise benefit associated with this procedure.

Page 132 of 182
8.2.1 Benefits to Alternative Operations for Novel Aircraft (IEP2) The IEP2 did not investigate alternative aircraft trajectories and operations for reducing community noise. However, one of the novel aircraft concepts (Lockheed-Martin ―Box Wing‖, Figure D9) considers increasing the approach glide slope from the traditional 3 degrees to 6 degrees. This was made possible by the increase in lift from the new wing configuration. The impact on approach noise was substantial, estimates show that 7 to 8 EPNdB noise reduction is possible. Since the airframe noise reduction technologies are difficult to implement and typically do not provide this magnitude of noise reduction, alternative operations should be explored for novel aircraft.

Page 133 of 182
9. IEP2 En Route noise En route noise from open rotor aircraft is a concern since low frequency tones will propagate through the atmosphere from cruise altitudes and reach the ground. The IEP2 was asked to provide comments on en route noise as a part of their investigation of modern CROR designs. There was considerable work done on en route noise in the 1980‘s that included flight demonstration tests using the General Electric (GE) Un Ducted Fan (UDF). The noise levels on the ground were measured from aircraft flyovers at 10,668 meters (35,000 feet). The IEP2 worked through the NASA Glenn Research Center and GE to estimate the noise reduction for newer open rotor propulsion systems based on model scale data. Near field unsteady pressure measurements (Figure 9.1) were scaled and propagated to the ground to account for spherical spreading and atmospheric absorption. Calculations of maximum A-weighted sound pressure level during a flyover show that newer open rotor designs could be 13 to 20 dBA quieter than the older UDF flight test noise levels. The calculations are considered to be TRL4 and still need to be validated with actual flight data.
Figure 9.1: Model scale cruise simulations in the NASA Glenn 8’ x 6’ Supersonic Wind Tunnel with acoustic plate installed for near field noise assessments.
Figure 9.2 shows a comparison of predicted CROR noise levels with recent background noise measurements taken in Europe. The background noise measurements were sponsored by EASA in 2009 and are referred to as the ―BANOERAC Project‖ (Ref. IEP9.1). Aircraft en route noise measurements were acquired at several quiet rural locations for climb, cruise and descent operations. Figure 9.2 shows that maximum A-weighted noise levels for all valid jet aircraft events during cruise phase as a function of altitude. Noise measurements from the GE UDF flight demos were averaged, converted from pole microphone measurements to ground plane measurements, and determined to be about 64 dBA max. Subtracting the 13 to
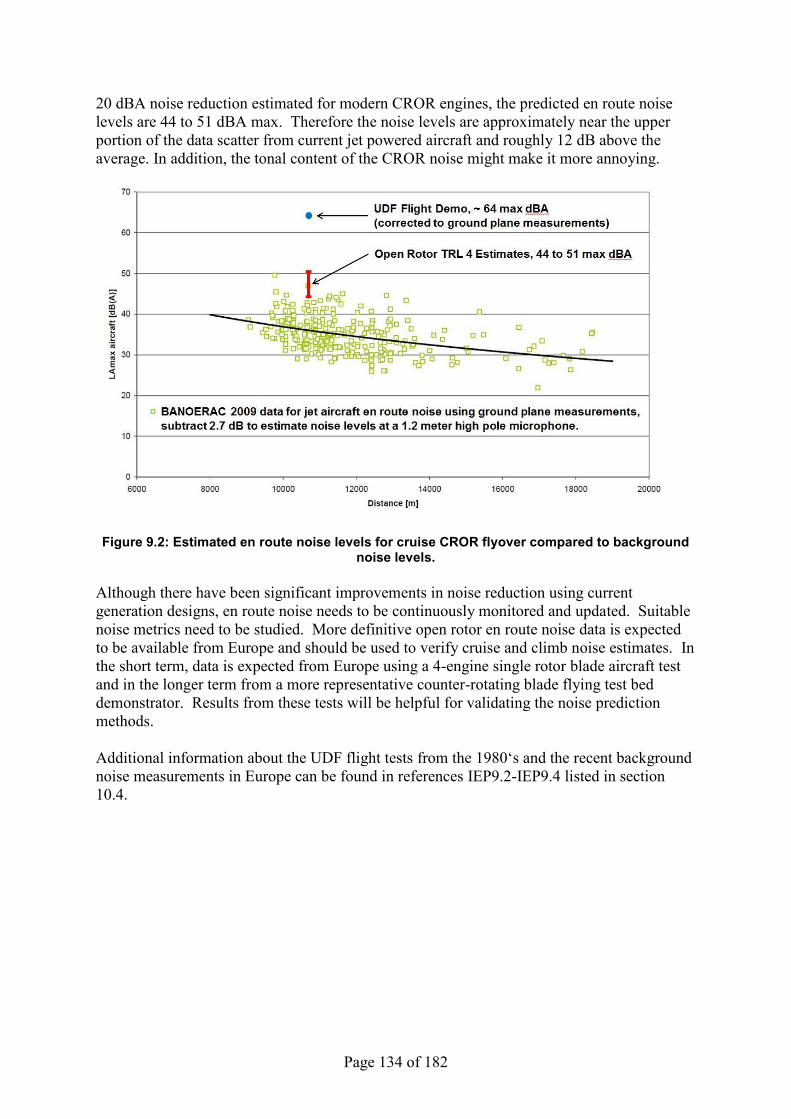
Page 134 of 182
20 dBA noise reduction estimated for modern CROR engines, the predicted en route noise levels are 44 to 51 dBA max. Therefore the noise levels are approximately near the upper portion of the data scatter from current jet powered aircraft and roughly 12 dB above the average. In addition, the tonal content of the CROR noise might make it more annoying.
Figure 9.2: Estimated en route noise levels for cruise CROR flyover compared to background
noise levels. Although there have been significant improvements in noise reduction using current generation designs, en route noise needs to be continuously monitored and updated. Suitable noise metrics need to be studied. More definitive open rotor en route noise data is expected to be available from Europe and should be used to verify cruise and climb noise estimates. In the short term, data is expected from Europe using a 4-engine single rotor blade aircraft test and in the longer term from a more representative counter-rotating blade flying test bed demonstrator. Results from these tests will be helpful for validating the noise prediction methods. Additional information about the UDF flight tests from the 1980‘s and the recent background noise measurements in Europe can be found in references IEP9.2-IEP9.4 listed in section 10.4.

Page 135 of 182
10. References
10.1 References – 2nd Aircraft Noise Technology Workshop Presentations, September 26, 2008 ANTW01 - CAEP Remit - Workshop Introduction – D.Collin ANTW02 – Aviation Noise-Reduction and Technology Review and Goal Setting:
Regulators‘ Perspective – R. Girvin ANTW03 – Aviation Noise – A Policy Makers‘ Perspective – M. Capstick ANTW04 – An Airport Perspective on Aircraft Noise Technology – X. Oh ANTW05 – Development of Mid and Long-Term Goals - Manufacturers‘ Perspective – D. Allyn ANTW06 - Airline Industry Perspective – Fleet Planning and Aviation Noise – C. Schubert ANTW07 - Fundamentals of Aircraft Noise and Technology Development – A. Kempton ANTW08 – U.S. National R&D Policy, Plan, Goals and Initiatives – L. Maurice, F. Collier ANTW09 – EU Aircraft Noise Research – D. Collin ANTW10 – Overview of Research Initiatives in Japan – T. Oishi ANTW11 – National Research Program and Goals - Canada – B. Pang ANTW12 – Russian National Program – Y Khaletskiy, V. Kopiev
10.2 References – Noise Technology Independent Experts Review Presentations, September 29-October 1, 2008 IER2008-00 – Introduction – R. Girvin IER2008-01 – Background and Context – A. Kempton IER2008-02 – Overall Aircraft Noise – E. Nesbitt IER2008-03 – Overview of Aircraft Noise Research Goals – D. Collin IER2008-04 – Technology Development Status/Plan – Fan Noise – B. Morin IER2008-05 – Technology Development Status/Plan – Jet Noise – M. Majjigi IER2008-06 – Technology Development Status/Plan – Core Noise – A. Kempton IER2008-07 – Technology Development Status/Plan – Nacelle/Liner – J. Yu IER2008-08 – Technology Development Status/Plan – Airframe Noise – P. Lempereur IER2008-09 – Technology Development Status/Plan – Operational Procedures – D. McGregor IER2008-10 – Technology Enablers and Future Concepts – Computational Acoustics: Past, Present and Future – D. Lockard IER2008-11 - Technology Enablers and Future Concepts – Advanced Experimental Techniques – A worldwide overview - D. Gely IER2008-12 - Technology Enablers and Future Concepts – Advanced Concepts – R. Thomas IER2008-13 - Technology Enablers and Future Concepts – Design Considerations for a Silent Aircraft – E. Greitzer IER2008-14 - Technology Enablers and Future Concepts – Technology Evaluation and Integration – P. Lempereur
10.3 Independent Expert Panel Additional References IEP1.1 – Nomination for Noise Technology Independent Experts Review – Jane Hupe, Secretary, CAEP, CAEP-Memo/70, 01/04/08. IEP1.2 – ―Average Weighted Certificated Noise Levels and Noise Energy Contribution by Aircraft Seat Class,‖ Informal Memo by MODTF dated 5-Feb-2009.
Page 136 of 182
IEP5.1 - W. M. Dobrzynski, B. Schöning, Leung Choi Chow, C.Wood and C.Seror, ‗Design and testing of low noise landing gears‘. AIAA 2005–3008, 11th Aeroacoustics Conference, Monterey, May 2005. IEP6.1 C. Hughes (Subsonic Fixed Wing Project) and T Zeug (GE Aviation), Fundamental Aeronautics Program 2nd Annual Meeting Atlanta, GA October 7-9, 2008 . ‗NASA / GE Aviation Collaborative Partnership Research in Ultra High Bypass Cycle Propulsion Concepts‘. IEP6.2 C. Hughes (Subsonic Fixed Wing Project), W Lord (Pratt & Whitney) and S. Masoudi (Pratt & Whitney), Fundamental Aeronautics Program 2nd Annual Meeting Atlanta, GA October 7-9, 2008 . ‗NASA / Pratt & Whitney Collaborative Partnership Research in Ultra High Bypass Cycle Propulsion Concepts‘. IEP6.3 Wright Brothers Lecture in Aeronautics by Philip M. Condit, the Boeing Company, October 22, 1996 IEP6.4 Daniel Crichton, Elena de la Rosa Blanco, Thomas R. Law and James I. Hileman, AIAA 2007-456, 45th AIAA Aerospace Sciences Meeting and Exhibit, January 2007, Reno, Nevada, USA. ‗Design and operation for ultra low noise take-off‘. IEP6.5 Dowling, A. P., "The Silent Aircraft Initiative - Overview," 45th AIAA Aerospace Sciences Meeting and Exhibit, AIAA-2007-0452, Reno, Nevada, 2007. IEP6.6 Golub, RA, Rawls, Jr., JW, and Russell, JW: ―Evaluation of the Advanced Subsonic Technology Program Noise Reduction Benefits,‖ NASA/TM-2005-212144, May 2005.
10.4 IEP2 Additional References IEP6.7 Guynn, M.D.; Berton, J. J.; Haller, W. J.; Hendricks, E. S.; Tong, M. T.: Performance and Environmental Assessment of an Advanced Aircraft with Open Rotor Propulsion. NASA/TM-2012-217772, October 2012, <http://ntrs.nasa.gov/>. IEP9.1 ―Background Noise level and noise levels from En Route AirCraft (BANOERAC),‖ European Aviation Safety Agency, EASA.2008/OP14, October 2009. IEP9.2Harris, R.W. and Cuthbertson, R.D., ―UDF/727 Flight Test Program,‖ AIAA-87-1733, July 1987. IEP9.3 Donelson, J.E., Lewerenz, W.T., and Durbin, R.T., ―UHB Technology Validation – The Final Step,‖ AIAA-88-2807, July 1988. IEP9.4 Hager, R.D. and Vrabel, D, ―Advanced Turboprop Project,‖ NASA SP-495, 1988. IEPD.1 Berton, J. et al., (2012), ―NASA‘s Turbofan Engine Concept Study for a Next-
Generation Single-Aisle Transport,‖ Presentation by NASA to ICAO‘s Noise Technology Independent Expert Panel, January 25, 2012.
IEPD.2 Bonet, J.T., (2012), ―Boeing ERA N+2 Advanced Vehicle Concept Results,‖
Presentation to the 50th AIAA Aerospace Sciences Meeting, Nashville TN.

Page 137 of 182
IEPD.3 Martin, K., (2012), ―NASA Environmentally Responsible Aviation (ERA) Lockheed
Martin ERA Team,‖ Presentation to the 50th AIAA Aerospace Sciences Meeting, Nashville TN.
IEPD.4 Drake, A., (2012), ―Northrup Grumman NASA Environmentally Responsible
Aviation (ERA) N+2 Advanced Vehicle Study,‖ Presentation to the 50th AIAA Aerospace Sciences Meeting, Nashville TN.
IEPD.5 Bruner, S., et al. (2010). ―NASA N+3 subsonic fixed wing silent efficient low-
emissions commercial transport (SELECT) vehicle study.‖ CR—2010-216798, NASA, Hampton, VA, <http://ntrs.nasa.gov/>
IEPD.6 D'Angelo, M. M., et al. (2010). ―N+3 small commercial efficient and quiet
transportation for year 2030–2035.‖ CR—2010-216691, NASA, Hampton, VA, http://ntrs.nasa.gov/
IEPD.7 Frota, J., et al. (2011) ―New Aircraft Concepts REsearch (NACRE) Final Activity
Report 2005-2010,‖ FP6-2003-AERO-1 Contract 516068, European Commission Sixth Framework Programme; as of October 21, 2012, http://cordis.europa.eu/search/index.cfm?fuseaction=lib.document&DOC_LANG_ID=EN&DOC_ID=132122751&q=
IEPD.8 Greitzer, E. M., et al. (2010). ―N+3 aircraft concept designs and trade studies, final
report volumes 1 and 2.‖ CR-2010-216794, NASA, Hampton, VA, http://ntrs.nasa.gov/ IEPD.9 Bradley, M. K., and Droney, C. K. (2011). ―Subsonic ultra green aircraft research,
Phase 1 final report.‖ CR–2011-216847, NASA, Hampton, VA, <http://ntrs.nasa.gov/> IEPD.10 Hileman, J.I. et al. (2010) ―Airframe Design for ‗Silent,‘ Fuel Efficient Aircraft,‖
Journal of Aircraft, Vol. 47, No. 3. IEPD.11 De La Rosa Blanco, E. et al. (2011) ―Noise Assessment of the Double-Bubble
Aircraft Configuration,‖ AIAA 2011-0268, 49th AIAA ASM, Orlando, FL.
Page 138 of 182
Appendix A
Assessment of noise reduction trends with bypass ratio (BPR) and Noise Reduction Technology (NRT) at each certification point
A.1 Noise Reduction at Approach Noise reduction trends with bypass ratio (BPR) and noise reduction technology (NRT) are reviewed for the Short/Medium range and Long range classes, at each certification point, using the Best Practices Database provided and the results of the Pilot studies outlined in Section 6. Data is shown as the margin relative to Stage 3, rather than absolute levels. These results have been combined and expressed as trends in cumulative margin reduction, as summarised in Section 6.3 Short/Medium Range Class The data shown in Fig. A.1 for the noise margin at the Approach condition exhibits a weak sensitivity to BPR, which is not unexpected for medium to high BPR powered aircraft at this condition and one that was highlighted at the IER. The Pilot 1 & 2 results - without most of the NRT packages - agree closely even though they differ in BPR (8 v. 9.5). The Pilot 3 result, computed over a range of BPR, also agrees closely with the other two pilots. The NRT packages provide an increased margin of 2-4 dB according to the Pilot 1 & 2 results over this BPR 8-9.5 range. This is almost completely due to airframe noise technology reduction. This has been confirmed by a separate study within Pilot 3 where a 5 dB airframe noise benefit has been applied, resulting in similar reductions in aircraft system noise, i.e. a substantial fraction of 1 dB system noise benefit per 1 dB of airframe noise reduction. The Long term result for a BPR=12 aircraft shows no significant improvement without NRT, according to Pilot 1, and the Long term NRT packages have negligible effect because these do not include airframe noise reduction. The red trend line is an approximate indication of the benefit of increased BPR at Approach, with a gradient of 0.4 dB per BPR over the Medium term and the blue trend line of 0.3 dB per BPR in the Long term. These simple trend lines are introduced here as a means of comparing results across the different classes for each condition in turn. The overall trend is that higher BPR engines on future aircraft – driven by fuel burn – will deliver very little system noise benefits at Approach, unless effective airframe noise reduction technology is included in the design. Long Range Classes The Long range 2- and 4-engine aircraft (LR2, LR4) have not been the subject of the Pilot studies, as in the Short-Medium Range Twin (SMR2) class. Therefore we have only the Best practices database to guide us, plus previous study aircraft, such as the AST study. Starting with the LR4 class, Fig. A.2 shows data for various existing versions of the 747, the A380 and the two AST study versions of the 747-400 powered by the GE HBPR and the P&W ADP. The red trend line from the SMR2 results passes through the ‗real‘ aircraft points here but exhibits considerably less sensitivity than that of the AST results. The A380 is also well below that trend, which may be due to some airframe and other NRT in its modern design relative to that of the 747 versions. For the LR2 class, Fig. A3, the red trend line from the SMR2 results also passes through the ‗real‘ aircraft points here but again exhibits considerably less sensitivity than that of the AST results.
Page 139 of 182
A.2 Noise Reduction at Flyover Short/Medium Range Class At Flyover, the effect of BPR is more significant, see Fig. A.4, probably due to the more significant jet noise component. Here results from Pilot 1 (BPR=8) and Pilot 2 (BPR=9.5) differ somewhat both without and with NRT. This may be due to some differences in opinion as to what is existing technology (e.g. swept fans) and what is Medium term NRT. The IEP Pilot does show a ‗flattening‘ of the trend beyond BPR=9, consistent with the jet noise component becoming less significant at the higher BPR engines. The trend line at this condition is estimated to be 1 dB per unit BPR, which is an approximate average of the Pilot 1 & 2 sensitivities. Pilot 1 & 2 agree that the Mid-term NRT should yield a benefit of about 2 EPNdB. In the longer term the Pilot 1 sensitivity to BPR between the BPR = 8 and BPR=12 without NRT is certainly reduced compared to that between BPR = 5 and BPR=8 and even more so with the Mid-term NRT. This ‗flattening off‘ in the Pilot 1 results without NRT is consistent with the Pilot 3 results in terms of the change, rather than the absolute margins, between BPR = 8 and BPR=12 . Furthermore the benefit of Long term NRT at BPR=12 is very small according to Pilot 1 so noise reduction is likely to be completely reliant on Medium term NRT but once that is cashed in, the benefits of BPR or Long term NRT at this Flyover condition are quite small. Long Range Class Fig. A.5 shows the LR4 data for existing aircraft and two study aircraft, the 747-400 with the GE HBPR at BPR=8.3 and the P&W ADP at BPR=13. In this case the trend line of 1 dB/BPR from the SMR2 data is in reasonable agreement with the AST study aircraft but somewhat steeper than that exhibited by ‗real‘ aircraft margins from the Best Practices Database. Again the A380 is well below the trend line and at BPR=9 is quieter than the P&W ADP at BPR=13 without NRT. Although the A380 does have some NRT that is Medium term relative to the current 747-400, this strongly suggests there is little or no benefit of BPR at this condition beyond BPR=9. This supports the tentative conclusions outlined above for the SMR2 class. The LR2 data in Fig. A6 exhibits more scatter about our trend line but the deviations are judged to be acceptable.
A.3 Noise Reduction at Lateral Short/Medium Range Class Fig. A.7 shows the SMR2 data at the Lateral condition with a markedly increased sensitivity to BPR. A trend line of 1.6 dB per unit BPR appears to follow the pilot data quite well, on average. The Pilot 2 result shows more sensitivity to Medium term NRT than does the Pilot 1 although this may be due to a slightly different mix of NRT packages. However, when the range BPR=8 to 12 is considered, Pilot 1 and the Pilot 3 exhibit a similar benefit of about 3-4 dB, or no more than 1 dB per unit BPR. At BPR=12 both the Mid-term and the Long term NRT is ineffective, according to the Pilot 1. Beyond BPR=12 it is likely to be zero with little or no Long term NRT benefits.

Page 140 of 182
Long Range Class The LR4 data at the Lateral condition in Fig. A.8 supports the above conclusions with the trend line of 1.6 dB/BPR passing close to all the data up to BPR=9, including the A380. This suggests that the A380 has little or no Mid-term NRT at this condition, in particular for the presumably significant jet noise component. The P&W ADP falls above an extrapolation of this trend line unless NRT is applied, which the IEP understands is not available for individual certification points at this point in time. The trend line compares favourably with the LR2 data in Fig. A9 and agrees well with the B787-8 projected margin.
A.4 IEP2 Updates During the IEP2 process, the opportunity was taken to update the above noise trendline charts developed in IEP1, at each certification point, with data published since IEP1, either in the form of new project aircraft noise predictions, such as the B737Max and A320neo, or certification data such as the 787-8. Following each IEP1 figure, a duplicate copy of that figure (denoted with ‗a‘) has been inserted with appropriate updates at all three certification conditions. In general the new data agrees reasonably well with the BPR trends developed in IEP1.

Page 141 of 182
Short/Medium Range Twin Noise Reduction at Approach conditionshowing IEP deduced Mid & Long term BPR & NRT (TRL6) trends*
-15
-10
-5
0
5
4 6 8 10 12 14
T/O Bypass Ratio (BPR)
App
roac
h EP
NdB
re/C
hap.
3
NASA AST StudyPilot Study 1Pilot Study 2Pilot Study 3Mid-term 0.4 dB/BPR*Long term 0.3 dB/BPR*
NRT
NRT
Medium Term
Long Term
NRTNRT
Figure A.1: Short/Medium Range Twin Approach noise trend with BPR (Corrected IEP1 LT BPR)
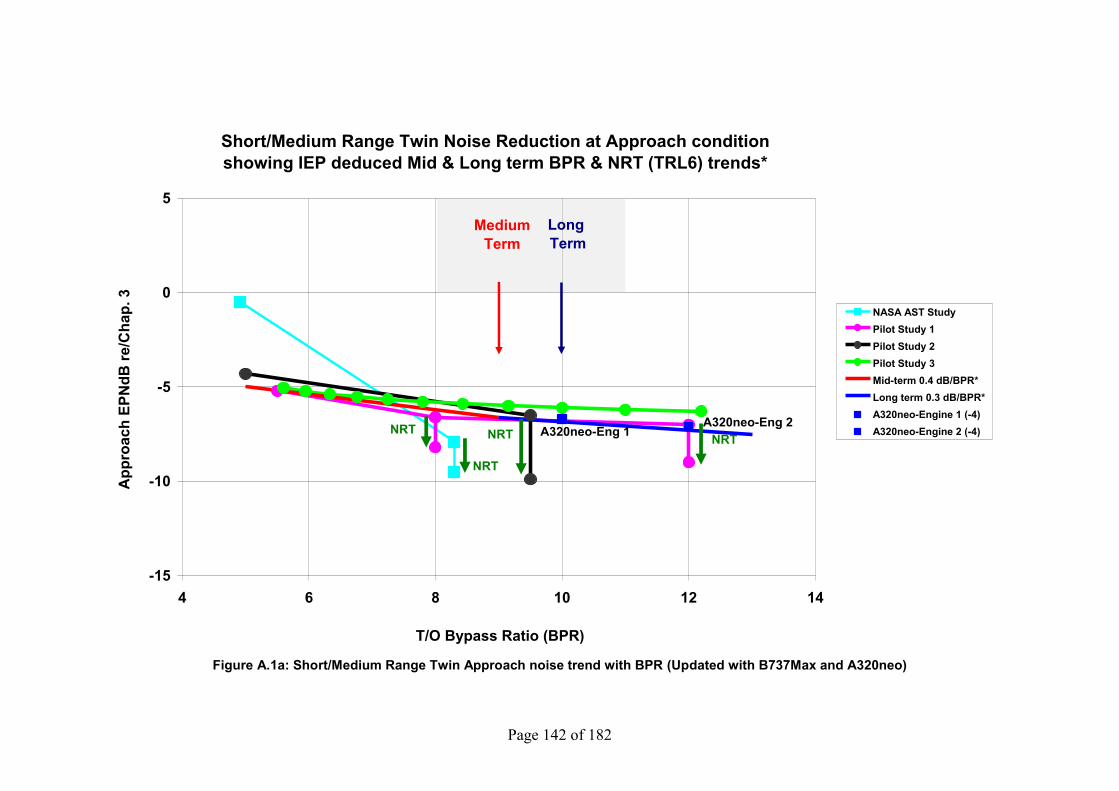
Page 142 of 182
Short/Medium Range Twin Noise Reduction at Approach conditionshowing IEP deduced Mid & Long term BPR & NRT (TRL6) trends*
A320neo-Eng 1A320neo-Eng 2
-15
-10
-5
0
5
4 6 8 10 12 14
T/O Bypass Ratio (BPR)
App
roac
h EP
NdB
re/C
hap.
3
NASA AST StudyPilot Study 1Pilot Study 2Pilot Study 3Mid-term 0.4 dB/BPR*Long term 0.3 dB/BPR*A320neo-Engine 1 (-4)A320neo-Engine 2 (-4)NRT
NRT
Medium Term
Long Term
NRTNRT
Figure A.1a: Short/Medium Range Twin Approach noise trend with BPR (Updated with B737Max and A320neo)
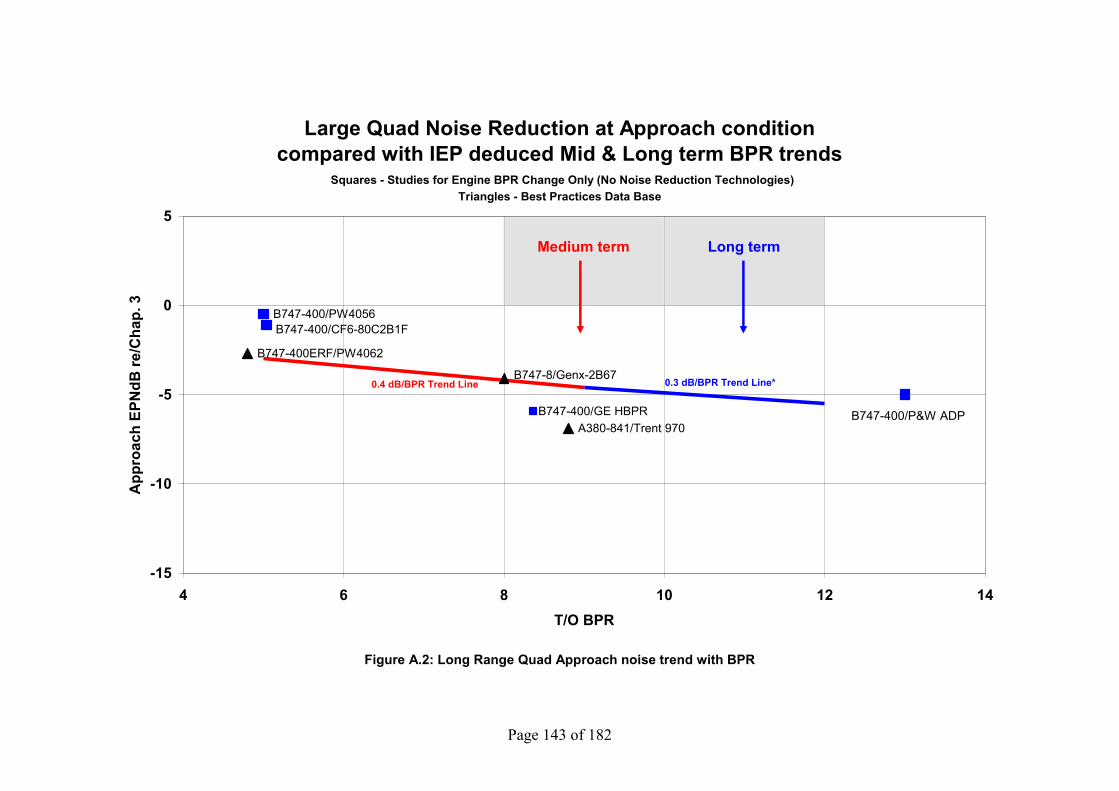
Page 143 of 182
Large Quad Noise Reduction at Approach conditioncompared with IEP deduced Mid & Long term BPR trends
Squares - Studies for Engine BPR Change Only (No Noise Reduction Technologies)Triangles - Best Practices Data Base
B747-400/PW4056
B747-400ERF/PW4062
A380-841/Trent 970
B747-400/CF6-80C2B1F
B747-8/Genx-2B67
B747-400/GE HBPR B747-400/P&W ADP
0.4 dB/BPR Trend Line 0.3 dB/BPR Trend Line*
-15
-10
-5
0
5
4 6 8 10 12 14T/O BPR
App
roac
h EP
NdB
re/C
hap.
3
Medium term Long term
Figure A.2: Long Range Quad Approach noise trend with BPR
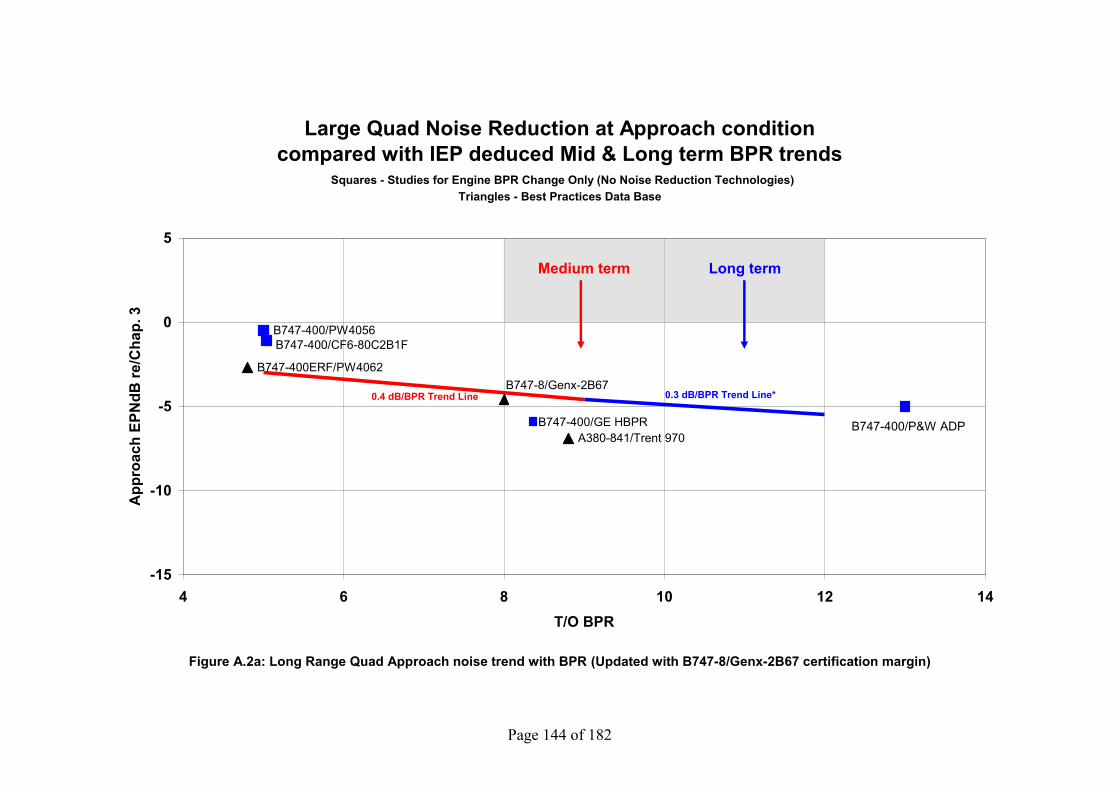
Page 144 of 182
Large Quad Noise Reduction at Approach conditioncompared with IEP deduced Mid & Long term BPR trends
Squares - Studies for Engine BPR Change Only (No Noise Reduction Technologies)Triangles - Best Practices Data Base
B747-400/PW4056
B747-400ERF/PW4062
A380-841/Trent 970
B747-400/CF6-80C2B1F
B747-8/Genx-2B67
B747-400/GE HBPR B747-400/P&W ADP
0.4 dB/BPR Trend Line 0.3 dB/BPR Trend Line*
-15
-10
-5
0
5
4 6 8 10 12 14T/O BPR
App
roac
h EP
NdB
re/C
hap.
3
Medium term Long term
Figure A.2a: Long Range Quad Approach noise trend with BPR (Updated with B747-8/Genx-2B67 certification margin)
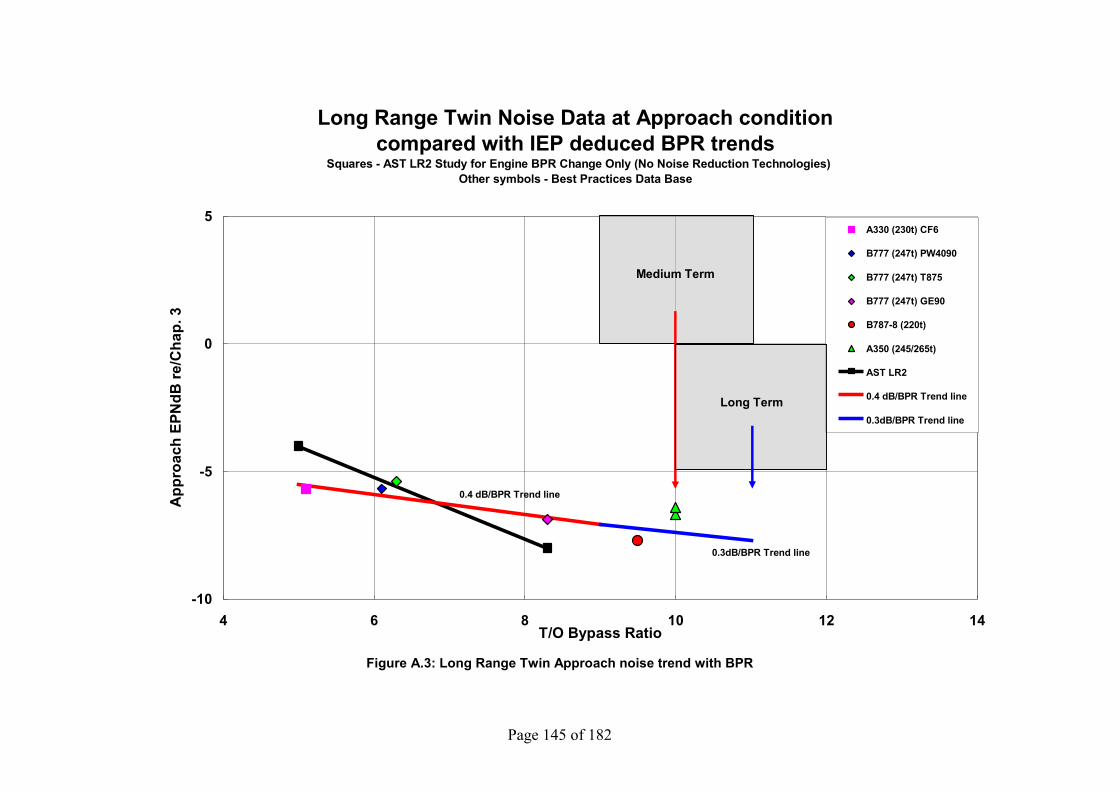
Page 145 of 182
Long Range Twin Noise Data at Approach conditioncompared with IEP deduced BPR trends
Squares - AST LR2 Study for Engine BPR Change Only (No Noise Reduction Technologies) Other symbols - Best Practices Data Base
0.4 dB/BPR Trend line
0.3dB/BPR Trend line
-10
-5
0
5
4 6 8 10 12 14T/O Bypass Ratio
App
roac
h EP
NdB
re/C
hap.
3
A330 (230t) CF6
B777 (247t) PW4090
B777 (247t) T875
B777 (247t) GE90
B787-8 (220t)
A350 (245/265t)
AST LR2
0.4 dB/BPR Trend line
0.3dB/BPR Trend line
Medium Term
Long Term
Figure A.3: Long Range Twin Approach noise trend with BPR

Page 146 of 182
Long Range Twin Noise Data at Approach conditioncompared with IEP deduced BPR trends
Squares - AST LR2 Study for Engine BPR Change Only (No Noise Reduction Technologies) Other symbols - Best Practices Data Base
0.4 dB/BPR Trend line
0.3dB/BPR Trend line
-10
-5
0
5
4 6 8 10 12 14T/O Bypass Ratio
App
roac
h EP
NdB
re/C
hap.
3
A330 (230t) CF6
B777 (247t) PW4090
B777 (247t) T875
B777 (247t) GE90
B787-8 (228t) GEnx
A350 (245/265t)
AST LR2
0.4 dB/BPR Trend line
0.3dB/BPR Trend line
B787-8 (228t) T1000
Medium Term
Long Term
Figure A.3a: Long Range Twin Approach noise trend with BPR (Updated with 787 certification margins)
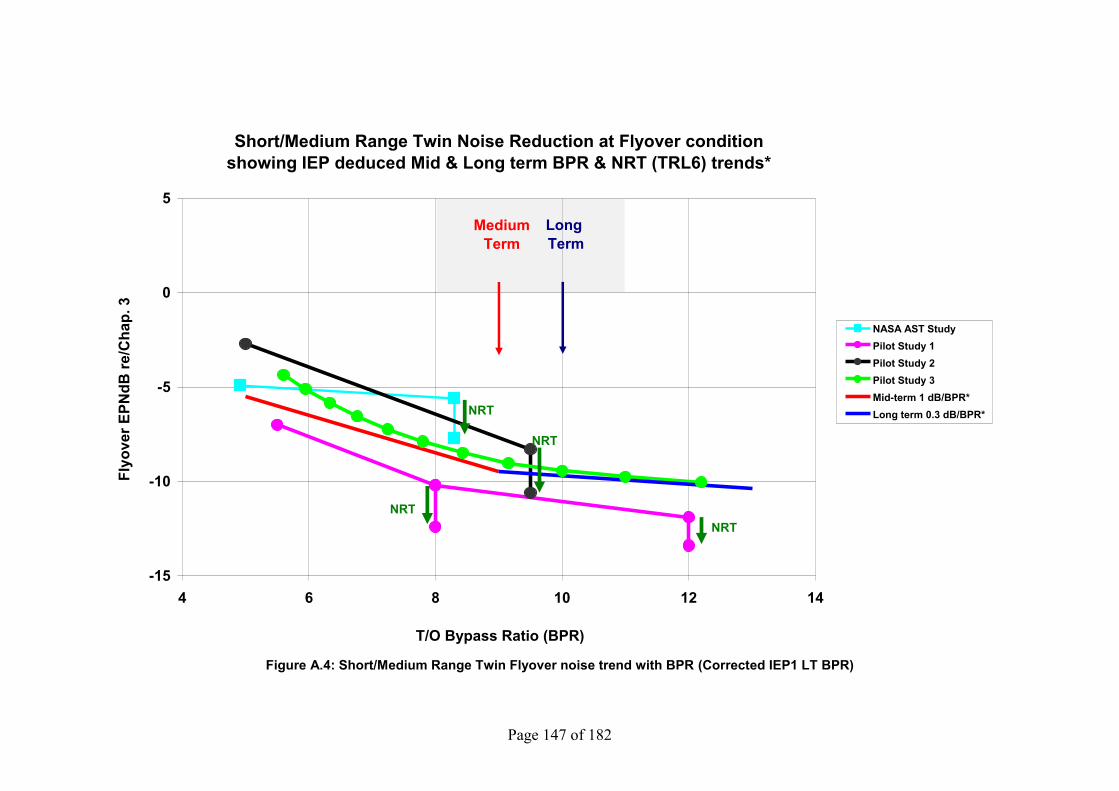
Page 147 of 182
Short/Medium Range Twin Noise Reduction at Flyover conditionshowing IEP deduced Mid & Long term BPR & NRT (TRL6) trends*
-15
-10
-5
0
5
4 6 8 10 12 14
T/O Bypass Ratio (BPR)
Flyo
ver E
PNdB
re/C
hap.
3
NASA AST StudyPilot Study 1Pilot Study 2Pilot Study 3Mid-term 1 dB/BPR*Long term 0.3 dB/BPR*
NRT
NRT
Medium Term
Long Term
NRTNRT
Figure A.4: Short/Medium Range Twin Flyover noise trend with BPR (Corrected IEP1 LT BPR)

Page 148 of 182
Short/Medium Range Twin Noise Reduction at Flyover conditionshowing IEP deduced Mid & Long term BPR & NRT (TRL6) trends*
A320neo-Eng 1A320neo-Eng 2
-15
-10
-5
0
5
4 6 8 10 12 14
T/O Bypass Ratio (BPR)
Flyo
ver E
PNdB
re/C
hap.
3 NASA AST StudyPilot Study 1Pilot Study 2Pilot Study 3Mid-term 1 dB/BPR*Long term 0.3 dB/BPR*A320neo-Engine 1 (-4)A320neo-Engine 2 (-4)
NRT
NRT
Medium Term
Long Term
NRTNRT
Figure A.4a: Short/Medium Range Twin Flyover noise trend with BPR (Updated with B737Max and A320neo)
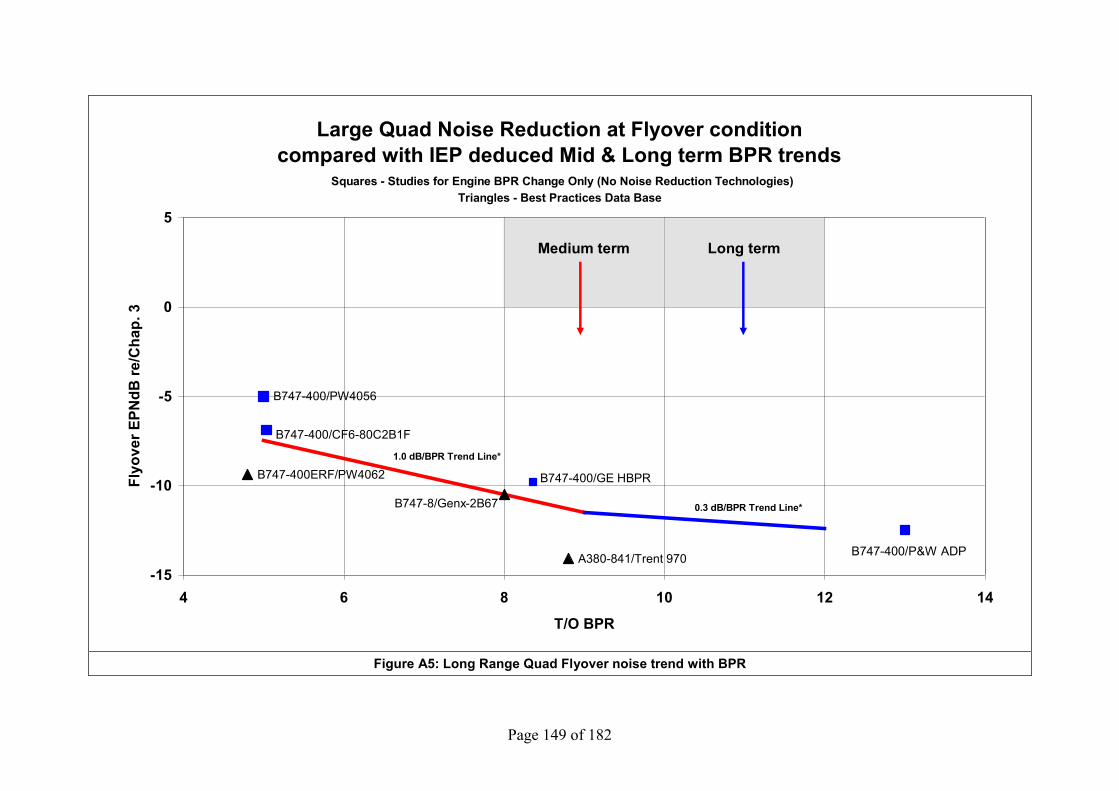
Page 149 of 182
Large Quad Noise Reduction at Flyover conditioncompared with IEP deduced Mid & Long term BPR trends
Squares - Studies for Engine BPR Change Only (No Noise Reduction Technologies)Triangles - Best Practices Data Base
B747-400/PW4056
B747-400ERF/PW4062
A380-841/Trent 970
B747-400/CF6-80C2B1F
B747-8/Genx-2B67
B747-400/GE HBPR
B747-400/P&W ADP
1.0 dB/BPR Trend Line*
0.3 dB/BPR Trend Line*
-15
-10
-5
0
5
4 6 8 10 12 14
T/O BPR
Flyo
ver E
PNdB
re/C
hap.
3
Medium term Long term
Figure A5: Long Range Quad Flyover noise trend with BPR
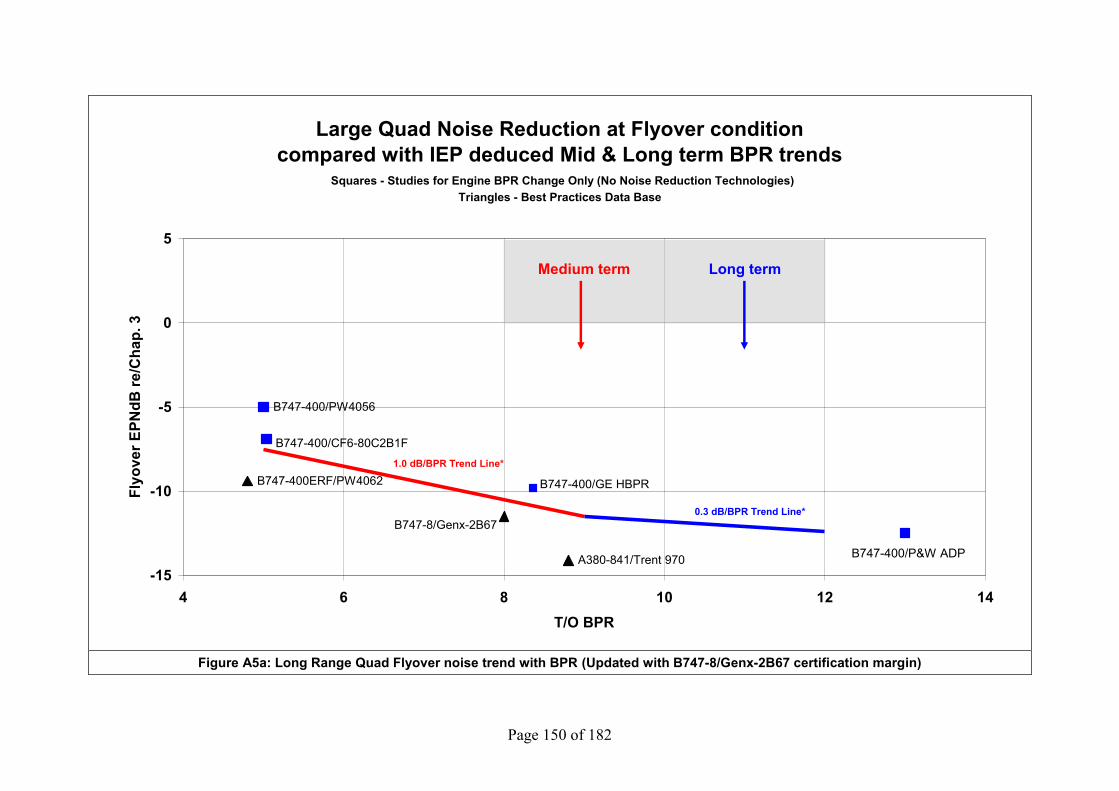
Page 150 of 182
Large Quad Noise Reduction at Flyover conditioncompared with IEP deduced Mid & Long term BPR trends
Squares - Studies for Engine BPR Change Only (No Noise Reduction Technologies)Triangles - Best Practices Data Base
B747-400/PW4056
B747-400ERF/PW4062
A380-841/Trent 970
B747-400/CF6-80C2B1F
B747-8/Genx-2B67
B747-400/GE HBPR
B747-400/P&W ADP
1.0 dB/BPR Trend Line*
0.3 dB/BPR Trend Line*
-15
-10
-5
0
5
4 6 8 10 12 14T/O BPR
Flyo
ver E
PNdB
re/C
hap.
3
Medium term Long term
Figure A5a: Long Range Quad Flyover noise trend with BPR (Updated with B747-8/Genx-2B67 certification margin)

Page 151 of 182
Long Range Twin Noise Data at Flyover conditioncompared with IEP deduced BPR trends
Squares - AST LR2 Study for Engine BPR Change Only (No Noise Reduction Technologies) Other symbols - Best Practices Data Base
0.3 dB/BPR Trend line
1 dB/BPR Trend line
-15
-10
-5
0
5
4 6 8 10 12 14T/O Bypass Ratio
Flyo
ver E
PNdB
re/C
hap.
3
A330 (230t) CF6
B777 (247t) PW4090
B777 (247t) T875
B777 (247t) GE90
B787-8 (220t)
A350 (245/265t)
AST LR2
1 dB/BPR Trend line
0.3 dB/BPR Trend line
Medium Term
Long Term
Figure A.6: Long Range Twin Flyover noise trend with BPR
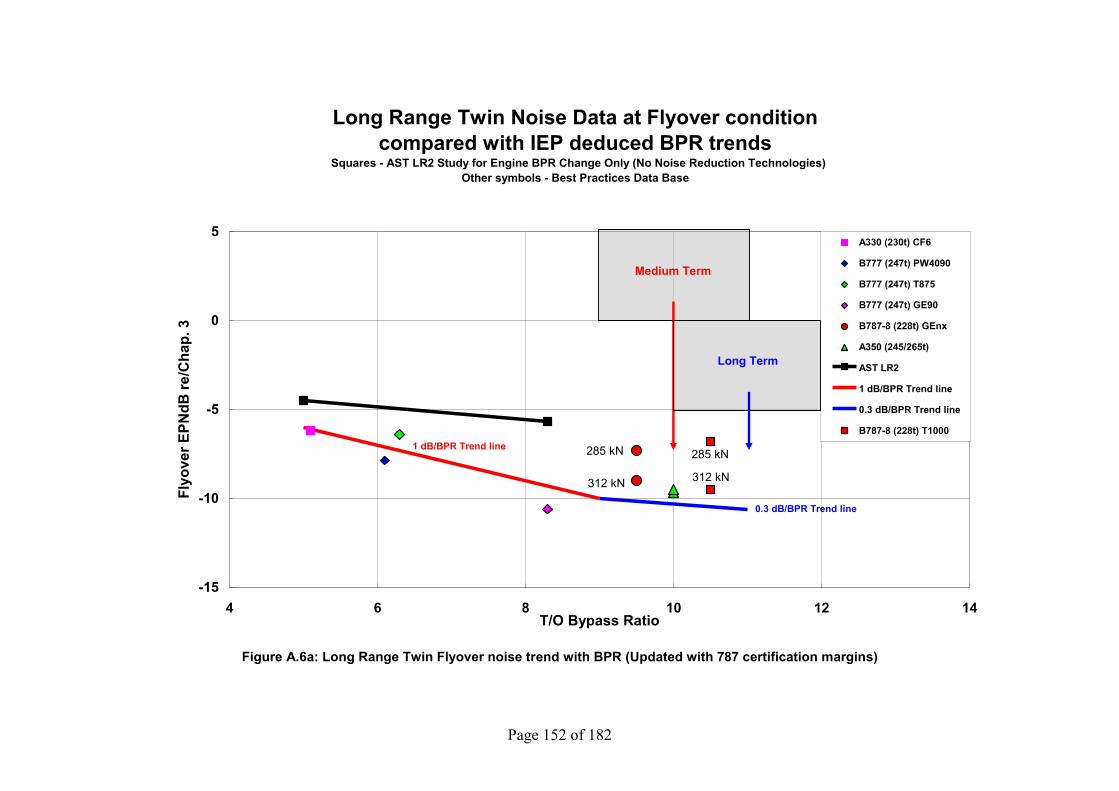
Page 152 of 182
Long Range Twin Noise Data at Flyover conditioncompared with IEP deduced BPR trends
Squares - AST LR2 Study for Engine BPR Change Only (No Noise Reduction Technologies) Other symbols - Best Practices Data Base
0.3 dB/BPR Trend line
285 kN
312 kN
1 dB/BPR Trend line
312 kN
285 kN
-15
-10
-5
0
5
4 6 8 10 12 14T/O Bypass Ratio
Flyo
ver E
PNdB
re/C
hap.
3
A330 (230t) CF6
B777 (247t) PW4090
B777 (247t) T875
B777 (247t) GE90
B787-8 (228t) GEnx
A350 (245/265t)
AST LR2
1 dB/BPR Trend line
0.3 dB/BPR Trend line
B787-8 (228t) T1000
Medium Term
Long Term
Figure A.6a: Long Range Twin Flyover noise trend with BPR (Updated with 787 certification margins)
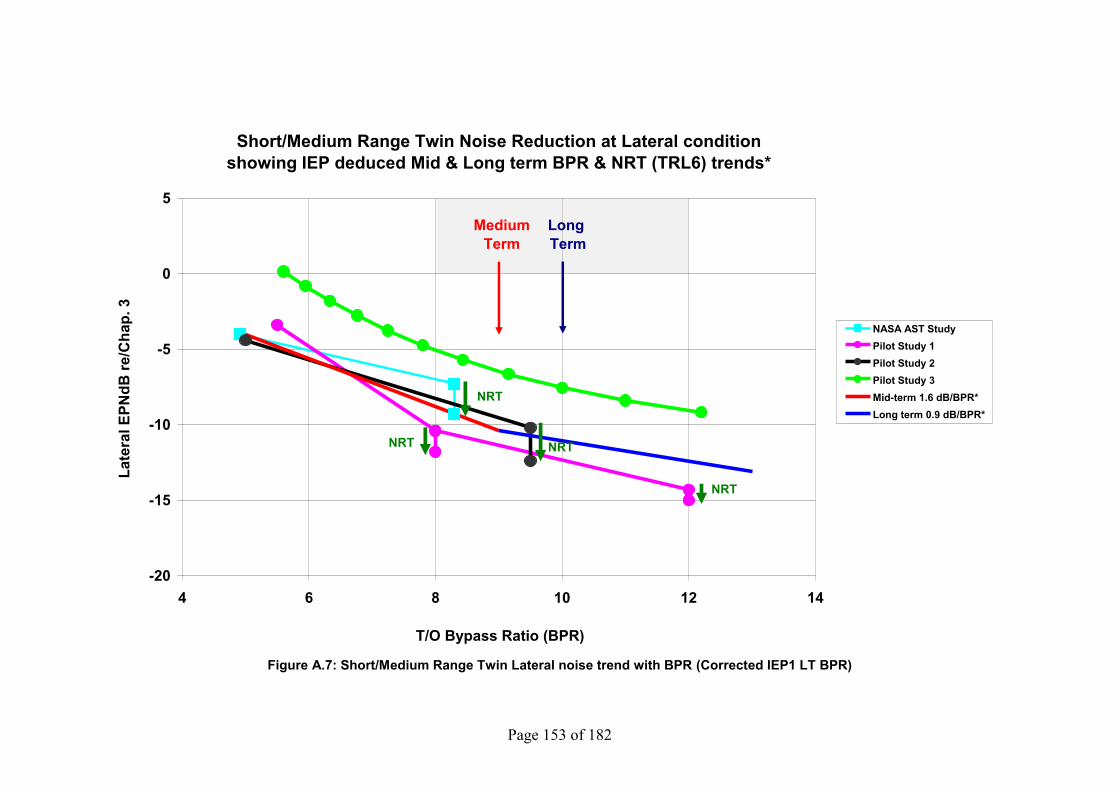
Page 153 of 182
Short/Medium Range Twin Noise Reduction at Lateral conditionshowing IEP deduced Mid & Long term BPR & NRT (TRL6) trends*
-20
-15
-10
-5
0
5
4 6 8 10 12 14
T/O Bypass Ratio (BPR)
Late
ral E
PNdB
re/C
hap.
3
NASA AST StudyPilot Study 1Pilot Study 2Pilot Study 3Mid-term 1.6 dB/BPR*Long term 0.9 dB/BPR*
NRT
NRT
Medium Term
Long Term
NRT
NRT
Figure A.7: Short/Medium Range Twin Lateral noise trend with BPR (Corrected IEP1 LT BPR)

Page 154 of 182
Short/Medium Range Twin Noise Reduction at Lateral conditionshowing IEP deduced Mid & Long term BPR & NRT (TRL6) trends*
A320neo-Eng 1
A320neo-Eng 2
B737Max
-20
-15
-10
-5
0
5
4 6 8 10 12 14
T/O Bypass Ratio (BPR)
Late
ral E
PNdB
re/C
hap.
3 NASA AST StudyPilot Study 1Pilot Study 2Pilot Study 3Mid-term 1.6 dB/BPR*Long term 0.9 dB/BPR*A320neo-Engine 1 (-4)A320neo-Engine 2 (-4)B737Max (-4)NRT
NRT
Medium Term
Long Term
NRT
NRT
Figure A.7a: Short/Medium Range Twin Lateral noise trend with BPR (Updated with B737Max and A320neo)

Page 155 of 182
Large Quad Noise Reduction at Lateral conditioncompared with IEP deduced Mid & Long term BPR trends
Squares - Studies for Engine BPR Change Only (No Noise Reduction Technologies)Triangles - Best Practices Data Base
B747-400/PW4056B747-400ERF/PW4062
A380-841/Trent 970
B747-400/CF6-80C2B1F
B747-8/Genx-2B67B747-400/GE HBPR
B747-400/P&W ADP
1.6 dB/BPR Trend Line*
0.9 dB/BPR Trend Line*
-15
-10
-5
0
5
4 6 8 10 12 14
T/O BPR
Late
ral E
PNdB
re/C
hap.
3
Medium term Long term
Figure A.8: Long Range Quad Lateral noise trend with BPR
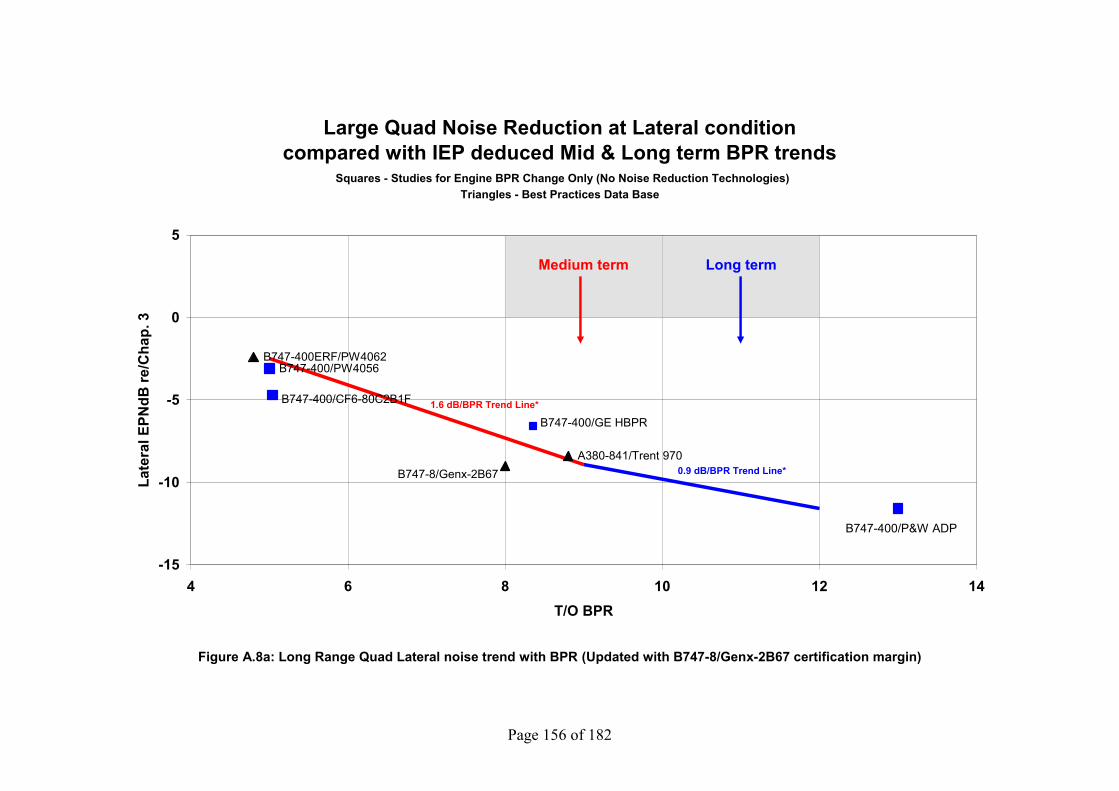
Page 156 of 182
Large Quad Noise Reduction at Lateral conditioncompared with IEP deduced Mid & Long term BPR trends
Squares - Studies for Engine BPR Change Only (No Noise Reduction Technologies)Triangles - Best Practices Data Base
B747-400/PW4056B747-400ERF/PW4062
A380-841/Trent 970
B747-400/CF6-80C2B1F
B747-8/Genx-2B67
B747-400/GE HBPR
B747-400/P&W ADP
1.6 dB/BPR Trend Line*
0.9 dB/BPR Trend Line*
-15
-10
-5
0
5
4 6 8 10 12 14T/O BPR
Late
ral E
PNdB
re/C
hap.
3
Medium term Long term
Figure A.8a: Long Range Quad Lateral noise trend with BPR (Updated with B747-8/Genx-2B67 certification margin)
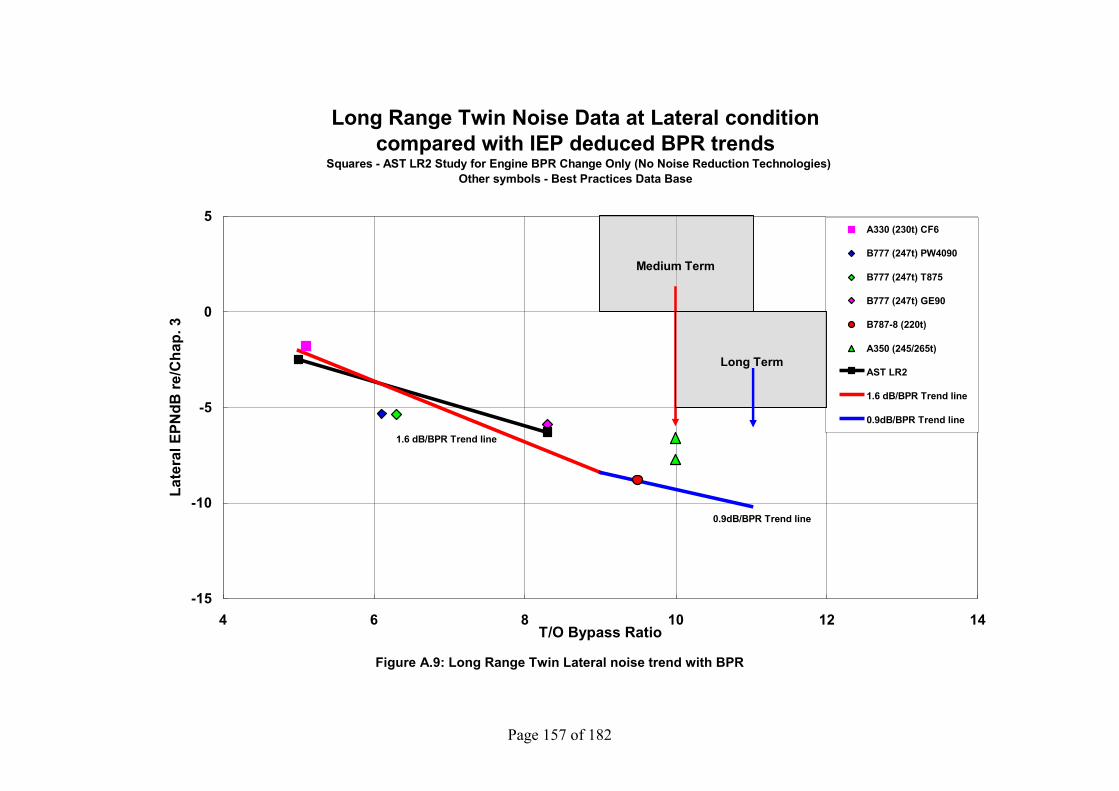
Page 157 of 182
Long Range Twin Noise Data at Lateral conditioncompared with IEP deduced BPR trends
Squares - AST LR2 Study for Engine BPR Change Only (No Noise Reduction Technologies) Other symbols - Best Practices Data Base
1.6 dB/BPR Trend line
0.9dB/BPR Trend line
-15
-10
-5
0
5
4 6 8 10 12 14T/O Bypass Ratio
Late
ral E
PNdB
re/C
hap.
3
A330 (230t) CF6
B777 (247t) PW4090
B777 (247t) T875
B777 (247t) GE90
B787-8 (220t)
A350 (245/265t)
AST LR2
1.6 dB/BPR Trend line
0.9dB/BPR Trend line
Medium Term
Long Term
Figure A.9: Long Range Twin Lateral noise trend with BPR
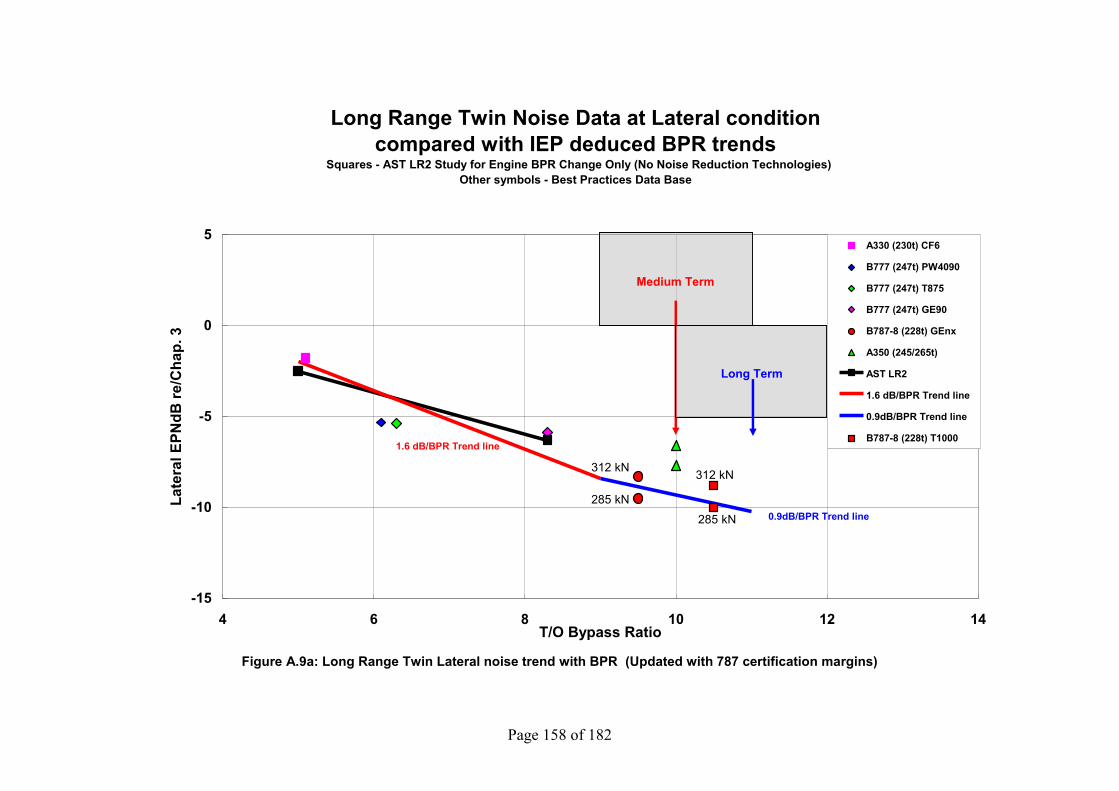
Page 158 of 182
Long Range Twin Noise Data at Lateral conditioncompared with IEP deduced BPR trends
Squares - AST LR2 Study for Engine BPR Change Only (No Noise Reduction Technologies) Other symbols - Best Practices Data Base
312 kN
285 kN
1.6 dB/BPR Trend line
0.9dB/BPR Trend line285 kN
312 kN
-15
-10
-5
0
5
4 6 8 10 12 14T/O Bypass Ratio
Late
ral E
PNdB
re/C
hap.
3
A330 (230t) CF6
B777 (247t) PW4090
B777 (247t) T875
B777 (247t) GE90
B787-8 (228t) GEnx
A350 (245/265t)
AST LR2
1.6 dB/BPR Trend line
0.9dB/BPR Trend line
B787-8 (228t) T1000
Medium Term
Long Term
Figure A.9a: Long Range Twin Lateral noise trend with BPR (Updated with 787 certification margins)

Page 159 of 182
Appendix B
Uncertainty Estimates for Noise Reduction Goals In line with the IEP approach of analyzing Bypass Ratio (BPR) effects and component noise reduction technology (NRT) effects separately and then combining the two to provide estimated aircraft system noise reduction goals, the IEP also looked at estimating the uncertainties in the projected noise reduction goals for BPR effects and NRT effects separately.
B.1 Engine Cycle Change Effects Uncertainties – Mid Term The uncertainty in forecasting potential aircraft noise reductions due to improved engine cycles which incorporate higher bypass ratio designs was based on the IEP judgment on the likely level of BPR that would be introduced into products in the Mid-Term (2018) and in the Long-Term (2028). These estimated BPR levels are tabulated in section 6.1, Table 6.1.1. The Panel concluded that there is a reasonable probability of achieving these levels, within ± 1 unit of bypass ratio. For each class of aircraft, and for each certification point, the sensitivity of noise level to BPR was determined, either by correlating pilot study results, NASA AST study results, and/or Best Practices Database correlation results. For example, if a given class of aircraft were projected to have a bypass ratio of 10 by the Mid-Term time (2018), and, from one or more of the above correlations, a sensitivity of 2.0 EPNdB per unit BPR were projected, then the uncertainty in BPR effects on noise reduction would be ± 1 ×2.0 = ± 2.0 EPNdB. The above estimate of uncertainty represents the uncertainty in achieving the target BPR, but does not specifically account for the uncertainty associated with the noise benefit achievable for a given BPR change. However, information gleaned from the various pilot studies and the results of the NASA AST studies reported in Reference IEP 7.1 have provided the Panel some additional insights, as described in the paragraphs below. First, three aircraft assessment studies from the NASA AST Program evaluated the cycle change benefits (from BPR = 5 to BPR = 8.3), but for three different classes of aircraft, i.e., SMR2, LR2, and LR4. These results showed the cumulative noise benefit due to cycle change to vary 9.0 EPNdB to 11.4 EPNdB, with a standard deviation of ~ 1.2 EPNdB. Second, two additional pilot studies for the SMR2 aircraft class were carried out at the request of Panel, but two aircraft manufacturers. Pilot Study A showed an 11.6 EPNdB cycle change benefit for a BPR change from 5.5 to 8.0. Similarly, Pilot Study B showed a cycle change benefit of 13.6 EPNdB for a BPR change from 5.0 to 9.5. The Panel also carried out a study to independently evaluate BPR change effects, using a proprietary aircraft noise simulation model available to one of the Panel members. This study evaluated cycle change effects only, but over a wide range of BPR from 5.6 to 12.2. The results for this study were compared with the cycle change results from Pilot Studies A and B, and these comparisons are tabulated below.
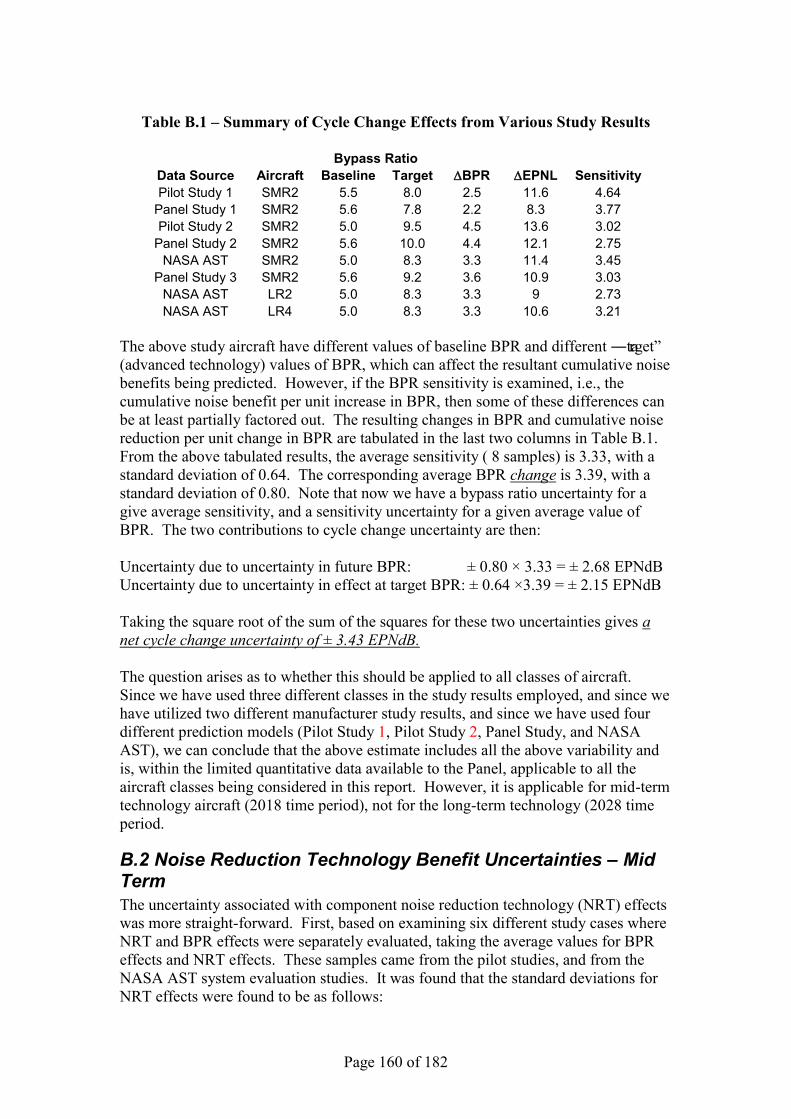
Page 160 of 182
Table B.1 – Summary of Cycle Change Effects from Various Study Results
Bypass Ratio Data Source Aircraft Baseline Target BPR EPNL Sensitivity Pilot Study 1 SMR2 5.5 8.0 2.5 11.6 4.64
Panel Study 1 SMR2 5.6 7.8 2.2 8.3 3.77 Pilot Study 2 SMR2 5.0 9.5 4.5 13.6 3.02
Panel Study 2 SMR2 5.6 10.0 4.4 12.1 2.75 NASA AST SMR2 5.0 8.3 3.3 11.4 3.45
Panel Study 3 SMR2 5.6 9.2 3.6 10.9 3.03 NASA AST LR2 5.0 8.3 3.3 9 2.73 NASA AST LR4 5.0 8.3 3.3 10.6 3.21
The above study aircraft have different values of baseline BPR and different ―target‖
(advanced technology) values of BPR, which can affect the resultant cumulative noise benefits being predicted. However, if the BPR sensitivity is examined, i.e., the cumulative noise benefit per unit increase in BPR, then some of these differences can be at least partially factored out. The resulting changes in BPR and cumulative noise reduction per unit change in BPR are tabulated in the last two columns in Table B.1. From the above tabulated results, the average sensitivity ( 8 samples) is 3.33, with a standard deviation of 0.64. The corresponding average BPR change is 3.39, with a standard deviation of 0.80. Note that now we have a bypass ratio uncertainty for a give average sensitivity, and a sensitivity uncertainty for a given average value of BPR. The two contributions to cycle change uncertainty are then: Uncertainty due to uncertainty in future BPR: ± 0.80 × 3.33 = ± 2.68 EPNdB Uncertainty due to uncertainty in effect at target BPR: ± 0.64 ×3.39 = ± 2.15 EPNdB Taking the square root of the sum of the squares for these two uncertainties gives a net cycle change uncertainty of ± 3.43 EPNdB. The question arises as to whether this should be applied to all classes of aircraft. Since we have used three different classes in the study results employed, and since we have utilized two different manufacturer study results, and since we have used four different prediction models (Pilot Study 1, Pilot Study 2, Panel Study, and NASA AST), we can conclude that the above estimate includes all the above variability and is, within the limited quantitative data available to the Panel, applicable to all the aircraft classes being considered in this report. However, it is applicable for mid-term technology aircraft (2018 time period), not for the long-term technology (2028 time period.
B.2 Noise Reduction Technology Benefit Uncertainties – Mid Term The uncertainty associated with component noise reduction technology (NRT) effects was more straight-forward. First, based on examining six different study cases where NRT and BPR effects were separately evaluated, taking the average values for BPR effects and NRT effects. These samples came from the pilot studies, and from the NASA AST system evaluation studies. It was found that the standard deviations for NRT effects were found to be as follows:
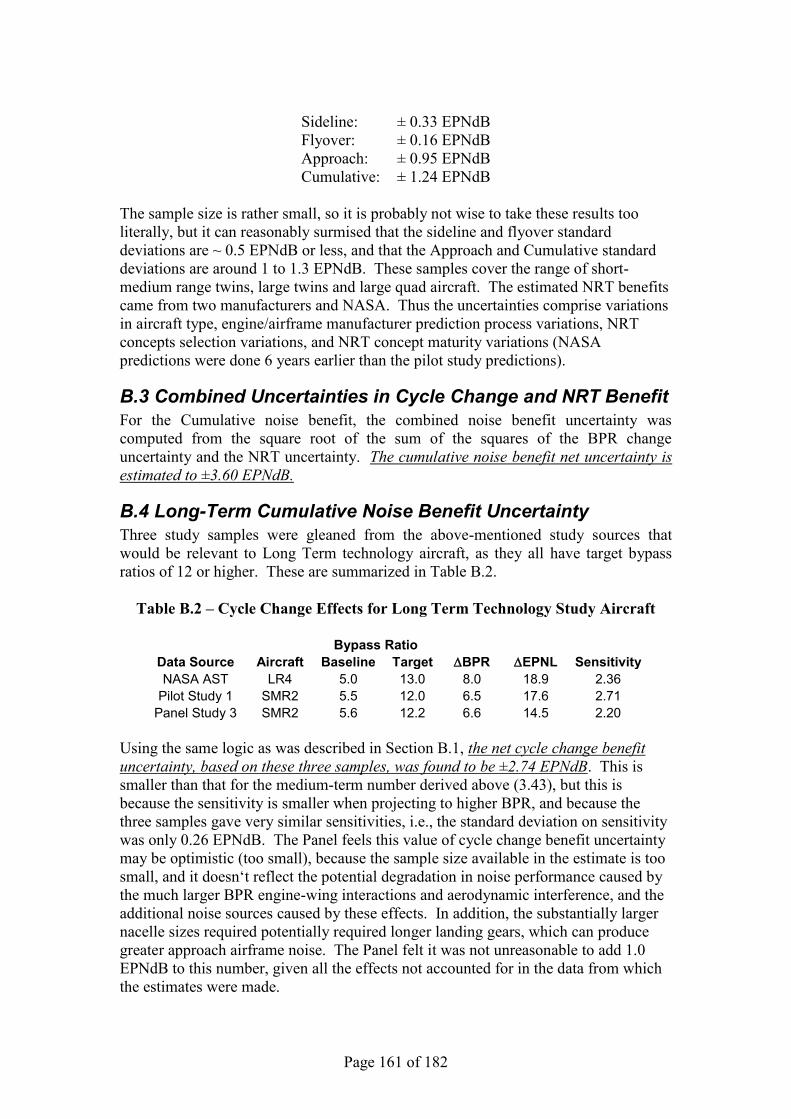
Page 161 of 182
Sideline: ± 0.33 EPNdB Flyover: ± 0.16 EPNdB Approach: ± 0.95 EPNdB Cumulative: ± 1.24 EPNdB
The sample size is rather small, so it is probably not wise to take these results too literally, but it can reasonably surmised that the sideline and flyover standard deviations are ~ 0.5 EPNdB or less, and that the Approach and Cumulative standard deviations are around 1 to 1.3 EPNdB. These samples cover the range of short-medium range twins, large twins and large quad aircraft. The estimated NRT benefits came from two manufacturers and NASA. Thus the uncertainties comprise variations in aircraft type, engine/airframe manufacturer prediction process variations, NRT concepts selection variations, and NRT concept maturity variations (NASA predictions were done 6 years earlier than the pilot study predictions).
B.3 Combined Uncertainties in Cycle Change and NRT Benefit For the Cumulative noise benefit, the combined noise benefit uncertainty was computed from the square root of the sum of the squares of the BPR change uncertainty and the NRT uncertainty. The cumulative noise benefit net uncertainty is estimated to ±3.60 EPNdB.
B.4 Long-Term Cumulative Noise Benefit Uncertainty Three study samples were gleaned from the above-mentioned study sources that would be relevant to Long Term technology aircraft, as they all have target bypass ratios of 12 or higher. These are summarized in Table B.2.
Table B.2 – Cycle Change Effects for Long Term Technology Study Aircraft
Bypass Ratio Data Source Aircraft Baseline Target BPR EPNL Sensitivity NASA AST LR4 5.0 13.0 8.0 18.9 2.36
Pilot Study 1 SMR2 5.5 12.0 6.5 17.6 2.71 Panel Study 3 SMR2 5.6 12.2 6.6 14.5 2.20
Using the same logic as was described in Section B.1, the net cycle change benefit uncertainty, based on these three samples, was found to be ±2.74 EPNdB. This is smaller than that for the medium-term number derived above (3.43), but this is because the sensitivity is smaller when projecting to higher BPR, and because the three samples gave very similar sensitivities, i.e., the standard deviation on sensitivity was only 0.26 EPNdB. The Panel feels this value of cycle change benefit uncertainty may be optimistic (too small), because the sample size available in the estimate is too small, and it doesn‘t reflect the potential degradation in noise performance caused by the much larger BPR engine-wing interactions and aerodynamic interference, and the additional noise sources caused by these effects. In addition, the substantially larger nacelle sizes required potentially required longer landing gears, which can produce greater approach airframe noise. The Panel felt it was not unreasonable to add 1.0 EPNdB to this number, given all the effects not accounted for in the data from which the estimates were made.
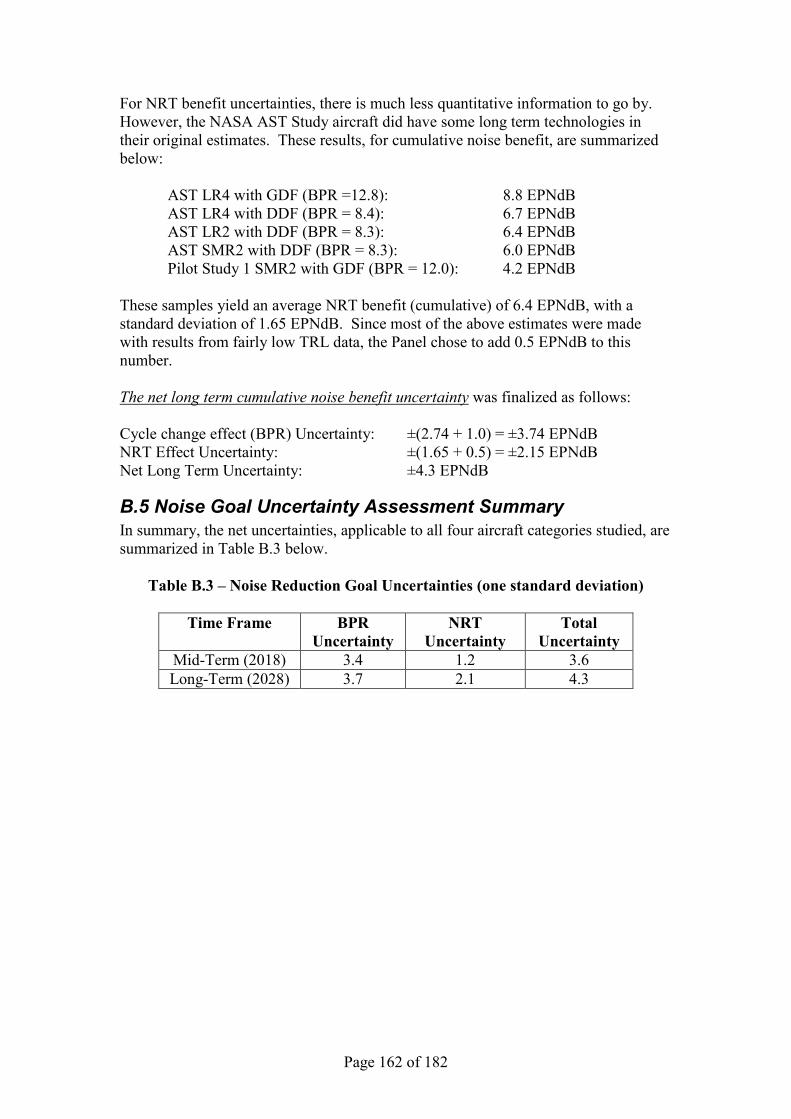
Page 162 of 182
For NRT benefit uncertainties, there is much less quantitative information to go by. However, the NASA AST Study aircraft did have some long term technologies in their original estimates. These results, for cumulative noise benefit, are summarized below:
AST LR4 with GDF (BPR =12.8): 8.8 EPNdB AST LR4 with DDF (BPR = 8.4): 6.7 EPNdB AST LR2 with DDF (BPR = 8.3): 6.4 EPNdB AST SMR2 with DDF (BPR = 8.3): 6.0 EPNdB Pilot Study 1 SMR2 with GDF (BPR = 12.0): 4.2 EPNdB
These samples yield an average NRT benefit (cumulative) of 6.4 EPNdB, with a standard deviation of 1.65 EPNdB. Since most of the above estimates were made with results from fairly low TRL data, the Panel chose to add 0.5 EPNdB to this number. The net long term cumulative noise benefit uncertainty was finalized as follows: Cycle change effect (BPR) Uncertainty: ±(2.74 + 1.0) = ±3.74 EPNdB NRT Effect Uncertainty: ±(1.65 + 0.5) = ±2.15 EPNdB Net Long Term Uncertainty: ±4.3 EPNdB
B.5 Noise Goal Uncertainty Assessment Summary In summary, the net uncertainties, applicable to all four aircraft categories studied, are summarized in Table B.3 below.
Table B.3 – Noise Reduction Goal Uncertainties (one standard deviation)
Time Frame BPR Uncertainty
NRT Uncertainty
Total Uncertainty
Mid-Term (2018) 3.4 1.2 3.6 Long-Term (2028) 3.7 2.1 4.3
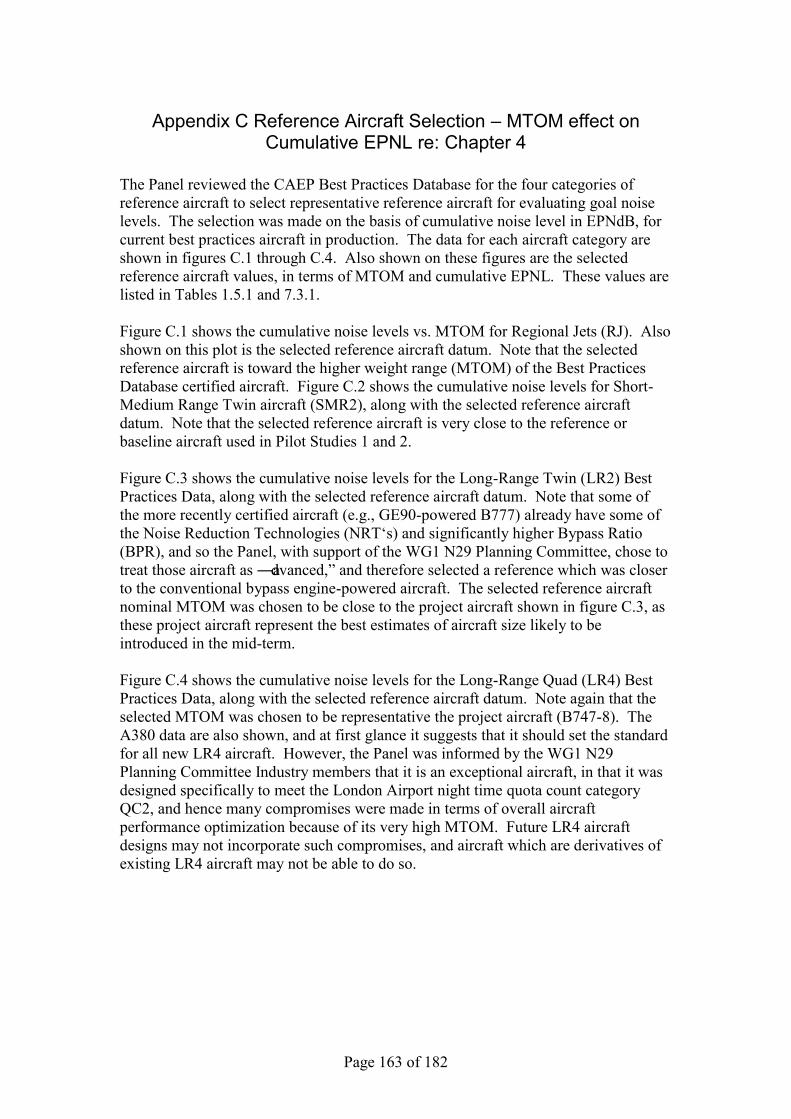
Page 163 of 182
Appendix C Reference Aircraft Selection – MTOM effect on Cumulative EPNL re: Chapter 4
The Panel reviewed the CAEP Best Practices Database for the four categories of reference aircraft to select representative reference aircraft for evaluating goal noise levels. The selection was made on the basis of cumulative noise level in EPNdB, for current best practices aircraft in production. The data for each aircraft category are shown in figures C.1 through C.4. Also shown on these figures are the selected reference aircraft values, in terms of MTOM and cumulative EPNL. These values are listed in Tables 1.5.1 and 7.3.1. Figure C.1 shows the cumulative noise levels vs. MTOM for Regional Jets (RJ). Also shown on this plot is the selected reference aircraft datum. Note that the selected reference aircraft is toward the higher weight range (MTOM) of the Best Practices Database certified aircraft. Figure C.2 shows the cumulative noise levels for Short-Medium Range Twin aircraft (SMR2), along with the selected reference aircraft datum. Note that the selected reference aircraft is very close to the reference or baseline aircraft used in Pilot Studies 1 and 2. Figure C.3 shows the cumulative noise levels for the Long-Range Twin (LR2) Best Practices Data, along with the selected reference aircraft datum. Note that some of the more recently certified aircraft (e.g., GE90-powered B777) already have some of the Noise Reduction Technologies (NRT‘s) and significantly higher Bypass Ratio (BPR), and so the Panel, with support of the WG1 N29 Planning Committee, chose to treat those aircraft as ―advanced,‖ and therefore selected a reference which was closer to the conventional bypass engine-powered aircraft. The selected reference aircraft nominal MTOM was chosen to be close to the project aircraft shown in figure C.3, as these project aircraft represent the best estimates of aircraft size likely to be introduced in the mid-term. Figure C.4 shows the cumulative noise levels for the Long-Range Quad (LR4) Best Practices Data, along with the selected reference aircraft datum. Note again that the selected MTOM was chosen to be representative the project aircraft (B747-8). The A380 data are also shown, and at first glance it suggests that it should set the standard for all new LR4 aircraft. However, the Panel was informed by the WG1 N29 Planning Committee Industry members that it is an exceptional aircraft, in that it was designed specifically to meet the London Airport night time quota count category QC2, and hence many compromises were made in terms of overall aircraft performance optimization because of its very high MTOM. Future LR4 aircraft designs may not incorporate such compromises, and aircraft which are derivatives of existing LR4 aircraft may not be able to do so.

Page 164 of 182
Regional Jet Cumulative Level re: Ch. 4
-25
-20
-15
-10
-5
0
0 10000 20000 30000 40000 50000 60000Maximum Takeoff Gross Mass, Kg
Cum
ulat
ive
Noi
se L
evel
, EPN
dB re
: Ch.
4
CRJ 100/200
CRJ 700/705
CRJ 900
CRJ 1000
EMB-135
EMB-145
EMB-170
EMB-190
Selected ReferenceAircraft
Figure C.1: Regional Jet Reference Aircraft Selection Process

Page 165 of 182
Small-Medium Range Twin Cumulative Level re: Ch. 4
-25
-20
-15
-10
-5
0
50000 60000 70000 80000 90000 100000Maximum Takeoff Gross Mass, Kg
Cum
ulat
ive
Noi
se L
evel
, EPN
dB re
: Ch.
4
A318
A319
A320
A321
B737-600
B737-800
B737-800/-800SFP
B737-900/-900ER
B737-800/-900 withwingletPilot Study 1
Pilot Study 2
Pilot Study 3
Average
Selected ReferenceAircraft
Figure C.2: Small-Medium Range Twin Reference Aircraft Selection Process

Page 166 of 182
Long Range Twin Cumulative Level re: Ch. 4
-25
-20
-15
-10
-5
0
100000 150000 200000 250000 300000 350000 400000Maximum T/O Gross Mass, Kg
Cum
ulat
ive
Leve
l, EP
NdB
re: C
h. 4
B767
B777
B787-8
A300
A310
A330
A350
GE90-Powered
RR and PW - Powered
Short Duct
Long Duct
Selected ReferenceAircraft
Figure C.3: Long-Range Twin Reference Aircraft Selection Process

Page 167 of 182
Long Range Quad Cumulative Level re: Ch. 4
-25
-20
-15
-10
-5
0
200000 250000 300000 350000 400000 450000 500000 550000 600000Maximum T/O Gross Mass, Kg
Cum
ulat
ive
Leve
l, EP
NdB
re: C
h. 4
B747-400
A340-600
A380
B747-8
Selected ReferenceAircraft
Figure C.4: Long-Range Quad Reference Aircraft Selection Process

Page 168 of 182
Appendix D
IEP2 Review of Novel Aircraft Concepts
D.1 Introduction This Appendix summarises the IEP2 review of public domain information available on advanced, low noise aircraft configurations, excluding open rotors and turboprop powered aircraft. Out of these the IEP2 has identified only one configuration that could be developed and brought into service by 2030, as explained in Section D.3.
D.2 Definition of the configurations For each configuration, this section will include a brief definition of the concept; the mission in terms of payload, range, cruise Mach number and maximum cruise altitude; a list of the main technologies used for the airframe, engine, and structures and a notional picture of the concept. The configurations have been broken into three categories. The first category covers ―conventional‖ tube-wing aircraft, which are designs that have a traditional passenger aircraft layout where the wings are cantilever mounted to the airframe and the engines are hung from the wings. The second category presents novel tube-wing configurations that deviate from the traditional tube-wing design, but still have a tail for aircraft control. The third category presents tail-less aircraft such as the blended wing body, hybrid wing body, and the flying wing. Information for the aircraft concepts was gathered from the following programs: the NASA Subsonic Fixed Wing project (SFW), NASA Environmentally Responsible Aviation project (ERA), European Commission New Aircraft Concepts Research (NACRE) project, European Commission EnVIronmTALly Friendly Aero Engines (VITAL) project, and Cambridge-MIT Initiative (CMI).
D.1.1 Conventional Tube and Wing Aircraft The NASA UHB Turbofan Tube and Wing Aircraft (Fig. D1) Reference: Berton et al. (IEPD.1) The NASA design considered here is a tube and wing configuration designed for 162 passengers and 3,250 nm range with a cruise Mach number of 0.78 and a cruise altitude of 35,000 feet. The reference aircraft is a Boeing 737-800 with CFM56-7B2 engines. A parametric study was done for engines with higher bypass ratios by varying the fan pressure ratio and investigating geared versus direct drive. A new aircraft incorporating the advanced engine and airframe technologies is predicted to have a 27% reduction in fuel burn. Three scenarios for cumulative noise margins under Chapter 4 are: 1) a UHB engine with current noise reduction technologies for the engine and airframe giving 21 to 25 EPNdB, 2) application of advanced acoustic treatment for aft fan noise suppression (2 dB at each cert point) and advanced airframe noise reduction technologies, giving 24 to 28 EPNdB, and 3)
Figure D1. Aircraft configuration
for the NASA UHB engine studies
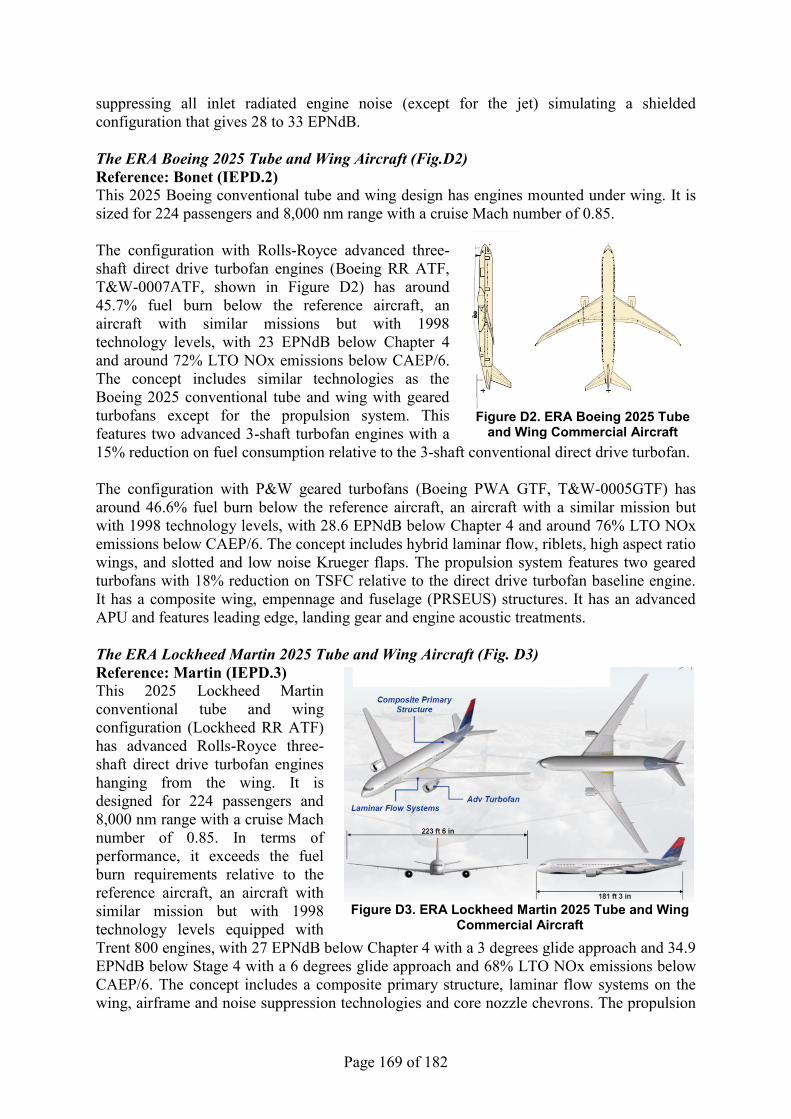
Page 169 of 182
suppressing all inlet radiated engine noise (except for the jet) simulating a shielded configuration that gives 28 to 33 EPNdB. The ERA Boeing 2025 Tube and Wing Aircraft (Fig.D2) Reference: Bonet (IEPD.2) This 2025 Boeing conventional tube and wing design has engines mounted under wing. It is sized for 224 passengers and 8,000 nm range with a cruise Mach number of 0.85. The configuration with Rolls-Royce advanced three-shaft direct drive turbofan engines (Boeing RR ATF, T&W-0007ATF, shown in Figure D2) has around 45.7% fuel burn below the reference aircraft, an aircraft with similar missions but with 1998 technology levels, with 23 EPNdB below Chapter 4 and around 72% LTO NOx emissions below CAEP/6. The concept includes similar technologies as the Boeing 2025 conventional tube and wing with geared turbofans except for the propulsion system. This features two advanced 3-shaft turbofan engines with a 15% reduction on fuel consumption relative to the 3-shaft conventional direct drive turbofan. The configuration with P&W geared turbofans (Boeing PWA GTF, T&W-0005GTF) has around 46.6% fuel burn below the reference aircraft, an aircraft with a similar mission but with 1998 technology levels, with 28.6 EPNdB below Chapter 4 and around 76% LTO NOx emissions below CAEP/6. The concept includes hybrid laminar flow, riblets, high aspect ratio wings, and slotted and low noise Krueger flaps. The propulsion system features two geared turbofans with 18% reduction on TSFC relative to the direct drive turbofan baseline engine. It has a composite wing, empennage and fuselage (PRSEUS) structures. It has an advanced APU and features leading edge, landing gear and engine acoustic treatments. The ERA Lockheed Martin 2025 Tube and Wing Aircraft (Fig. D3) Reference: Martin (IEPD.3) This 2025 Lockheed Martin conventional tube and wing configuration (Lockheed RR ATF) has advanced Rolls-Royce three-shaft direct drive turbofan engines hanging from the wing. It is designed for 224 passengers and 8,000 nm range with a cruise Mach number of 0.85. In terms of performance, it exceeds the fuel burn requirements relative to the reference aircraft, an aircraft with similar mission but with 1998 technology levels equipped with Trent 800 engines, with 27 EPNdB below Chapter 4 with a 3 degrees glide approach and 34.9 EPNdB below Stage 4 with a 6 degrees glide approach and 68% LTO NOx emissions below CAEP/6. The concept includes a composite primary structure, laminar flow systems on the wing, airframe and noise suppression technologies and core nozzle chevrons. The propulsion
Figure D2. ERA Boeing 2025 Tube
and Wing Commercial Aircraft
Figure D3. ERA Lockheed Martin 2025 Tube and Wing
Commercial Aircraft

Page 170 of 182
system consists of two advanced direct drive turbofan engines with a 17% reduction on fuel consumption relative to the Trent 800. It has an overall pressure ratio of 50, with 15% increase of inlet turbine temperature, twice the bypass ratio and a noise reduction of 16 EPNdB. The ERA Northrop Grumman 2025 Tube and Wing Aircraft (Fig. D4) Reference: Drake (IEPD.4) This 2025 Northrup Grumman conventional tube and wing design has advanced Rolls-Royce direct drive turbofan engines hanging from the wing. It is designed for 224 passengers and 8,000 nm range with a cruise Mach number of 0.85. In terms of performance, it has around 37.8% fuel burn below the reference aircraft, an aircraft with similar mission but with 1998 technology levels, with 23.6 EPNdB below Chapter 4 and 72% LTO NOx emissions below CAEP/6. The concept includes an advanced propulsion as an amalgamation of 32 separate technologies, swept wing laminar flow control, a composite wing structure, fuselage advanced structures, riblets, electric environmental control system, manoeuvre loads alleviation, carbon nanotube data cables, and an embedded IP electric generator. The SFW Northrop-Grumman 2035 Tube and Wing Aircraft (Fig. D5) Reference Bruner et al. (IEPD.5) This 2035 Northrup Grumman tube and wing configuration is designed for 120 passengers and is sized for a 2,600 nm range with a cruise Mach number of 0.75 and a cruise altitude of 45,000 feet. In terms of performance, it has 64% fuel burn below the baseline aircraft (a perturbation of the B737-500), 70 EPNdB below Chapter 4 and 75% LTO NOx emissions below CAEP/6. The concept includes two Rolls-Royce three-shaft turbofan engines with ultrahigh bypass ratio of 18 at cruise conditions, compressor intercooling and cooled cooling air turbine, active compressor clearance control, lightweight fan and fan cowl, fan blade and outlet guide vanes sweep designs, lean-burn ceramic matrix composite (CMC) combustor, CMC turbine blades, shape memory alloy nozzle, porous ceramic nozzle material, endothermic fuel system and advanced inlet acoustic liners. For the airframe, the most relevant technologies are ultrahigh-performance fiber, advanced metallic, aero elastic structures, sweep-wing laminar flow, large integrated structures, landing gear fairings, 3D woven pi perform joints and carbon nanotube electrical cables.
Figure D4. ERA Northrup Grumman 2025 Tube and
Wing Commercial Aircraft
Figure D5. SFW Northrup Grumman 2035 Tube and Wing Commercial Aircraft
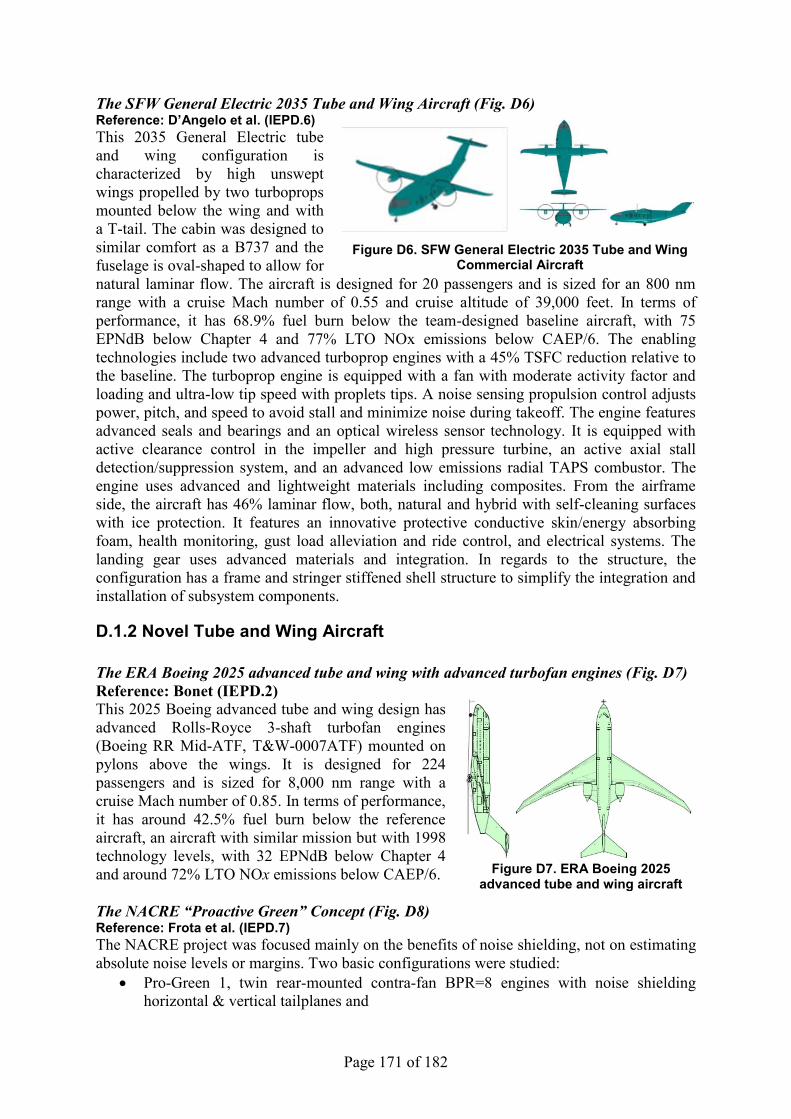
Page 171 of 182
The SFW General Electric 2035 Tube and Wing Aircraft (Fig. D6) Reference: D’Angelo et al. (IEPD.6) This 2035 General Electric tube and wing configuration is characterized by high unswept wings propelled by two turboprops mounted below the wing and with a T-tail. The cabin was designed to similar comfort as a B737 and the fuselage is oval-shaped to allow for natural laminar flow. The aircraft is designed for 20 passengers and is sized for an 800 nm range with a cruise Mach number of 0.55 and cruise altitude of 39,000 feet. In terms of performance, it has 68.9% fuel burn below the team-designed baseline aircraft, with 75 EPNdB below Chapter 4 and 77% LTO NOx emissions below CAEP/6. The enabling technologies include two advanced turboprop engines with a 45% TSFC reduction relative to the baseline. The turboprop engine is equipped with a fan with moderate activity factor and loading and ultra-low tip speed with proplets tips. A noise sensing propulsion control adjusts power, pitch, and speed to avoid stall and minimize noise during takeoff. The engine features advanced seals and bearings and an optical wireless sensor technology. It is equipped with active clearance control in the impeller and high pressure turbine, an active axial stall detection/suppression system, and an advanced low emissions radial TAPS combustor. The engine uses advanced and lightweight materials including composites. From the airframe side, the aircraft has 46% laminar flow, both, natural and hybrid with self-cleaning surfaces with ice protection. It features an innovative protective conductive skin/energy absorbing foam, health monitoring, gust load alleviation and ride control, and electrical systems. The landing gear uses advanced materials and integration. In regards to the structure, the configuration has a frame and stringer stiffened shell structure to simplify the integration and installation of subsystem components.
D.1.2 Novel Tube and Wing Aircraft The ERA Boeing 2025 advanced tube and wing with advanced turbofan engines (Fig. D7) Reference: Bonet (IEPD.2) This 2025 Boeing advanced tube and wing design has advanced Rolls-Royce 3-shaft turbofan engines (Boeing RR Mid-ATF, T&W-0007ATF) mounted on pylons above the wings. It is designed for 224 passengers and is sized for 8,000 nm range with a cruise Mach number of 0.85. In terms of performance, it has around 42.5% fuel burn below the reference aircraft, an aircraft with similar mission but with 1998 technology levels, with 32 EPNdB below Chapter 4 and around 72% LTO NOx emissions below CAEP/6. The NACRE “Proactive Green” Concept (Fig. D8) Reference: Frota et al. (IEPD.7) The NACRE project was focused mainly on the benefits of noise shielding, not on estimating absolute noise levels or margins. Two basic configurations were studied:
Pro-Green 1, twin rear-mounted contra-fan BPR=8 engines with noise shielding horizontal & vertical tailplanes and
Figure D6. SFW General Electric 2035 Tube and Wing Commercial Aircraft
Figure D7. ERA Boeing 2025
advanced tube and wing aircraft
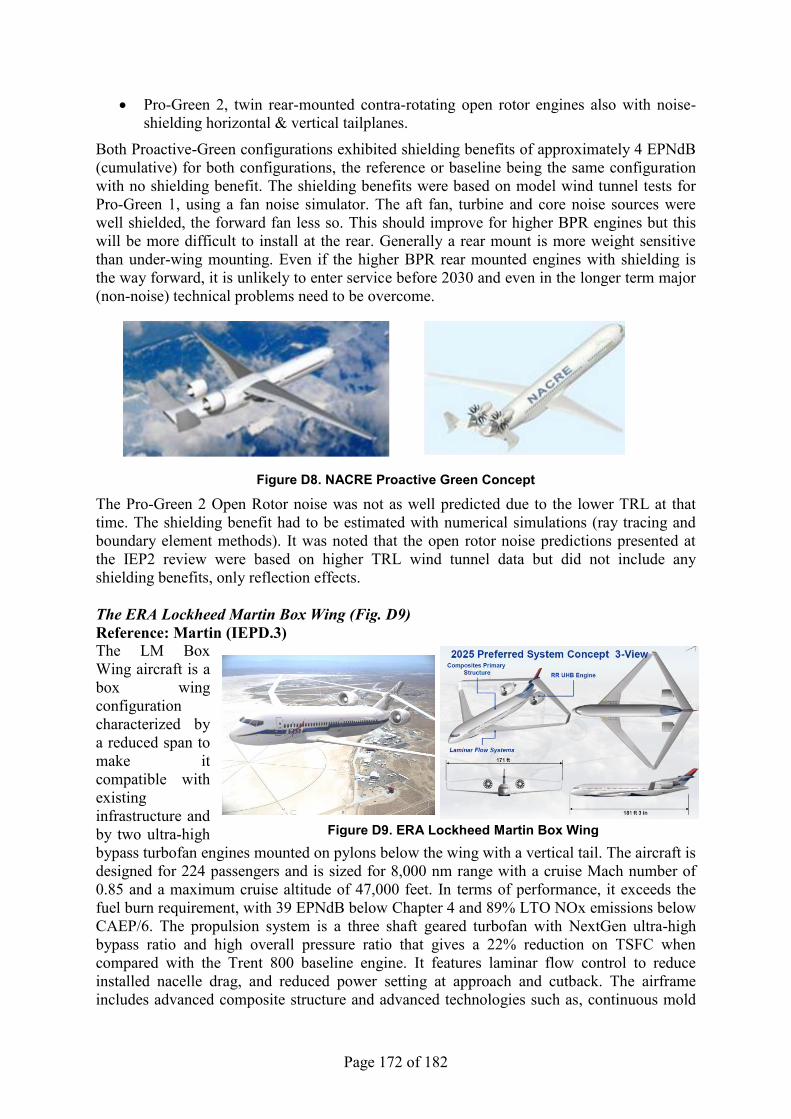
Page 172 of 182
Pro-Green 2, twin rear-mounted contra-rotating open rotor engines also with noise-shielding horizontal & vertical tailplanes.
Both Proactive-Green configurations exhibited shielding benefits of approximately 4 EPNdB (cumulative) for both configurations, the reference or baseline being the same configuration with no shielding benefit. The shielding benefits were based on model wind tunnel tests for Pro-Green 1, using a fan noise simulator. The aft fan, turbine and core noise sources were well shielded, the forward fan less so. This should improve for higher BPR engines but this will be more difficult to install at the rear. Generally a rear mount is more weight sensitive than under-wing mounting. Even if the higher BPR rear mounted engines with shielding is the way forward, it is unlikely to enter service before 2030 and even in the longer term major (non-noise) technical problems need to be overcome.
Figure D8. NACRE Proactive Green Concept
The Pro-Green 2 Open Rotor noise was not as well predicted due to the lower TRL at that time. The shielding benefit had to be estimated with numerical simulations (ray tracing and boundary element methods). It was noted that the open rotor noise predictions presented at the IEP2 review were based on higher TRL wind tunnel data but did not include any shielding benefits, only reflection effects. The ERA Lockheed Martin Box Wing (Fig. D9) Reference: Martin (IEPD.3) The LM Box Wing aircraft is a box wing configuration characterized by a reduced span to make it compatible with existing infrastructure and by two ultra-high bypass turbofan engines mounted on pylons below the wing with a vertical tail. The aircraft is designed for 224 passengers and is sized for 8,000 nm range with a cruise Mach number of 0.85 and a maximum cruise altitude of 47,000 feet. In terms of performance, it exceeds the fuel burn requirement, with 39 EPNdB below Chapter 4 and 89% LTO NOx emissions below CAEP/6. The propulsion system is a three shaft geared turbofan with NextGen ultra-high bypass ratio and high overall pressure ratio that gives a 22% reduction on TSFC when compared with the Trent 800 baseline engine. It features laminar flow control to reduce installed nacelle drag, and reduced power setting at approach and cutback. The airframe includes advanced composite structure and advanced technologies such as, continuous mold
Figure D9. ERA Lockheed Martin Box Wing

Page 173 of 182
line flaps, landing gear fairings, quiet slat gap filler, and shape memory alloy serration on Chevrons. In terms of approach operation, a 6 degrees glide slope is used to reduce noise. The SFW MIT D8.1 Double-Bubble lifting body (Fig. D10) Reference: Greitzer et al. (IEPD.8) The MIT Double-Bubble lifting aircraft has a ―double-bubble‖ fuselage cross-section with a lifting nose, a lightweight Pi tail and nearly unswept wings. The propulsion system consists of three boundary layer ingesting engines flush mounted at the back of the fuselage and located between the vertical tails what allows for engine noise shielding. The aircraft is designed for 180 passengers and is sized for 3,000 nm range with a cruise Mach number of 0.72 and a maximum cruise altitude of 43,300 feet. In terms of performance, it has 49% fuel burn below the baseline aircraft (the B737-800), with 43 EPNdB below Chapter 4 and 53% LTO NOx emissions below CAEP/6. The aircraft is aluminium based and does not include advanced materials on airframe or engine. It has a lifting body with no leading edge slats. The engines have a bypass ratio of 6 at cruise condition and 6.9 at takeoff, distortion tolerant fans and advanced multi-segment extended rearward liners. The SFW MIT D8.5 Double-Bubble lifting body (Fig. D11) Reference: Greitzer et al. (IEPD.8) The MIT D8.5 configuration is a similar concept as the MIT D8.1 configuration but features 2035 technologies. It is designed for a similar mission except that the cruise Mach number is 0.74 and the maximum cruise altitude is 46,400 feet. In terms of performance, it has 70.8% fuel burn below the baseline aircraft (the B737-800), with 60 EPNdB below Chapter 4 and 87.3% LTO NOx emissions below CAEP/6. This configuration also has three ingesting boundary layer engines. However, the engines have a bypass ratio at cruise condition of 20 and at takeoff of 23.7 and an overall pressure ratio of 50 and they are equipped with high efficiency small cores, an LDI advanced combustor, a variable area nozzle, and advanced engine materials and cooling technologies. The D8.5 configuration also includes advanced materials for the airframe, a reduced secondary structure weight, active load alleviation and health and usage monitoring, natural laminar flow on the wing bottom and landing gear fairings. To reduce noise, in terms of approach operations the D8.5 uses a 4 degree approach descent angle and runway displacement threshold.
Figure D10. SFW MIT D8.1 Double-Bubble lifting body
Figure D11. SFW MIT D8.5 double-bubble lifting body
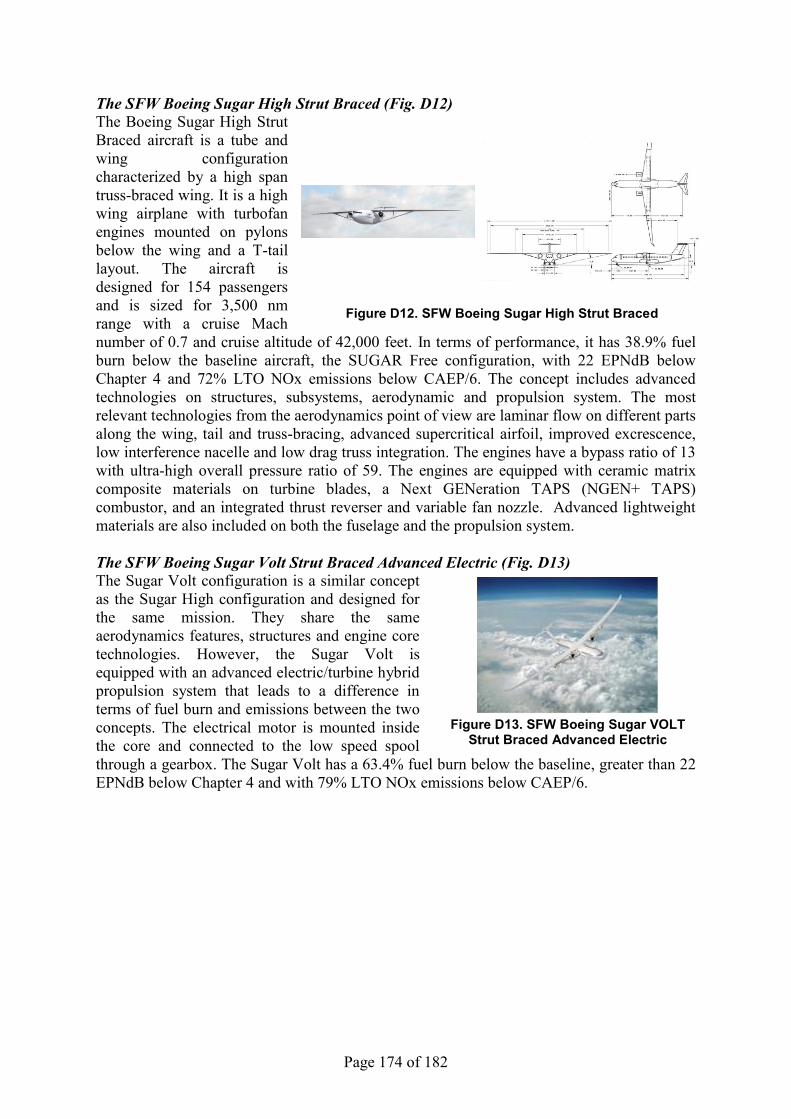
Page 174 of 182
The SFW Boeing Sugar High Strut Braced (Fig. D12) The Boeing Sugar High Strut Braced aircraft is a tube and wing configuration characterized by a high span truss-braced wing. It is a high wing airplane with turbofan engines mounted on pylons below the wing and a T-tail layout. The aircraft is designed for 154 passengers and is sized for 3,500 nm range with a cruise Mach number of 0.7 and cruise altitude of 42,000 feet. In terms of performance, it has 38.9% fuel burn below the baseline aircraft, the SUGAR Free configuration, with 22 EPNdB below Chapter 4 and 72% LTO NOx emissions below CAEP/6. The concept includes advanced technologies on structures, subsystems, aerodynamic and propulsion system. The most relevant technologies from the aerodynamics point of view are laminar flow on different parts along the wing, tail and truss-bracing, advanced supercritical airfoil, improved excrescence, low interference nacelle and low drag truss integration. The engines have a bypass ratio of 13 with ultra-high overall pressure ratio of 59. The engines are equipped with ceramic matrix composite materials on turbine blades, a Next GENeration TAPS (NGEN+ TAPS) combustor, and an integrated thrust reverser and variable fan nozzle. Advanced lightweight materials are also included on both the fuselage and the propulsion system. The SFW Boeing Sugar Volt Strut Braced Advanced Electric (Fig. D13) The Sugar Volt configuration is a similar concept as the Sugar High configuration and designed for the same mission. They share the same aerodynamics features, structures and engine core technologies. However, the Sugar Volt is equipped with an advanced electric/turbine hybrid propulsion system that leads to a difference in terms of fuel burn and emissions between the two concepts. The electrical motor is mounted inside the core and connected to the low speed spool through a gearbox. The Sugar Volt has a 63.4% fuel burn below the baseline, greater than 22 EPNdB below Chapter 4 and with 79% LTO NOx emissions below CAEP/6.
Figure D12. SFW Boeing Sugar High Strut Braced
Figure D13. SFW Boeing Sugar VOLT Strut Braced Advanced Electric

Page 175 of 182
D.1.3 Tail-Less Aircraft The ERA Boeing Blended Wing Body (Fig. D14) Reference: Bonet (IEPD.2) This Boeing Blended Wing Body configuration (BWB-0009 NG AAT) has advanced acoustic treatment with two advanced geared turbofan engines mounted on pylon on top of the centrebody. The aircraft is designed for 224 passengers and is sized for 8,000 nm range with a cruise Mach number of 0.85. In terms of performance, it has 53.7% fuel burn below the baseline aircraft, the B767, with 42 EPNdB below Chapter 4 and around 74% LTO NOx emissions below CAEP/6. The ERA Blended Wing Body incorporates advanced technologies such as optimal and adaptive flight control laws, advanced technology engines (geared turbofan) for efficiency and low noise, actuation technology to reduce secondary power, laminar flow control, alternate leading edges for laminar flow control and reduced noise, low noise landing gear, acoustic shielding, slat noise reduction technologies, riblets, PRSEUS centrebody and advanced stitched composite wing. The SFW Boeing Sugar Ray Advanced Low Noise Hybrid Wing Body (Fig. D15) Reference: Bradley et al. (IEPD.9) The Boeing Sugar Ray configuration is a semi-high wing blended body with two high bypass ratio turbofans mounted on pylons on top of the centrebody that provide noise shielding for the inlet (fan) and the exhaust nozzle. The vertical tail surfaces are mounted at the outboard boundary of the center body and provides sideline noise shielding for the core and fan nozzles. The aircraft is designed for 155 passengers and is sized for 3,500 nm range with a cruise Mach number of 0.7 and an optimum cruise altitude of 40,800 feet. In terms of performance, it has 43.3% fuel burn below the baseline aircraft, the SUGAR free, with 37 EPNdB below Chapter 4 and 72% LTO NOx emissions below CAEP/6. The SUGAR Ray features the same technologies as the SUGAR High aircraft concept but the primary design emphasis is on reducing aircraft noise, while maintaining performance similar to the SUGAR High.
Figure D14. ERA Boeing Blended Wing Body
Figure D15. SFW N+3 Boeing SUGAR Ray

Page 176 of 182
The SFW MIT H3.2 Hybrid Wing Body (Fig. D16) The MIT H3.2 HWB is a hybrid wing body aircraft characterized by a lifting body with leading edge camber. It features a distributed propulsion system consisting of two boundary layer ingesting engines embedded at the back of the fuselage that allows for engine noise shielding. Each of the engines consists of one core moving two propulsors connected via a bevel gear transmissions system. The aircraft is designed for 350 passengers and is sized for 7,600 nm range with a cruise Mach number of 0.8 and a maximum cruise altitude of 41,000 feet. In terms of performance, it has fuel burn 54% below the baseline aircraft, the B777-200 LR, with 46 EPNdB below Chapter 4 and 81% LTO NOx emissions below CAEP/6. The major engine technologies are ultra-high bypass ratio turbofans (20 at cruise conditions), with high OPR (50 at cruise conditions), increased component efficiencies, advanced engine materials to reduce cooling requirements, a variable area nozzle with thrust vectoring, an LDI advanced combustor, and extended multi-segment rearward liners. The major airframe technologies include advanced composite materials, a drooped leading edge, landing gear fairings, no leading edge slats of flaps, active load alleviation and health and usage monitoring. To reduce noise on approach, the D8.5 uses a 4 degree approach descent angle and runway displacement threshold. The Cambridge-MIT Initiative (CMI) SAX-40 Hybrid Wing Body (Fig. D17) Reference: http://silentaircraft.org/ and Hileman et al. (IEPD.10) The SAX 40 is a hybrid wing body aircraft characterized by a lifting body with leading edge camber. It features a distributed propulsion system consisting of three boundary layer ingesting engines embedded at the back of the fuselage what allows for engine noise shielding. Each of the engines consists of one core moving three propulsors connected via a bevel gear transmissions system. The aircraft is designed for 215 passengers and is sized for 5,000 nm range with a cruise Mach number of 0.8. In terms of performance, it has fuel burn 25% below the baseline aircraft, the B777, with 62 dBA outside the airport perimeter (this is near the background noise of a well-populated area). The major technologies are advanced airfoil leading edge treatment, airframe shielding of forward propagating engine noise, thrust vectoring variable area nozzle and ultra-high bypass ratio engines with low idle thrust enabling low approach speed, low noise low pressure turbine design, optimized extensive liners for low engine noise, deployable drooped
Figure D16. SFW MIT H3.2 Hybrid Wing Body
Figure D17. CMI SAX-40 Hybrid Wing Body

Page 177 of 182
leading edge, faired, low noise landing gear, advanced centrebody design that enables a low approach speed, suppression of flaps or slats and trailing edge brushes. The ERA Northrop Grumman Flying Wing (Fig. D18) Reference: Drake (IEPD.4) The Northrup Grumman tail-less flying wing configuration has four embedded high bypass ratio engines. The aircraft is designed for 224 passengers and is sized for 8,000 nm range with a cruise Mach number of 0.85 and a maximum cruise altitude of around 52,000 feet. In terms of performance, it has 41.5% fuel burn below the 1998 baseline passenger vehicle, with 74.7 EPNdB below Chapter 4 and around 88% LTO NOx emissions below CAEP/6. The ERA Northrup Grumman flying wing incorporates advanced technologies such as an advanced propulsion system with embedded high bypass ratio engines, which are an amalgamation of 32 advanced technologies, swept wing laminar flow control, composite wing structure and fuselage advanced structure, riblets, electric environmental control system, manoeuvre load alleviation, carbon nanotube data cables and embedded IP electric generator.
D.1.4 Engine Concepts The VITAL Ducted Counter-Rotating Fan (Fig. D19) Reference: http://ec.europa.eu/research/transport/projects/items/vital_en.htm The ducted counter-rotating turbofan (CRTF) concept has objectives to reduce the perceived noise and fuel burn and therefore NOx and CO2 emissions simultaneously. With the CRTF concept, two fans rotate in opposite directions to obtain the desired fan pressure ratio. The work is distributed between the two fans, thus reducing the fan tip speeds which results in lowered fan noise. The European Commission EnVIronmTALly Friendly Aero Engines program (VITAL) includes three CRTF models. The purpose of these alternative designs is to identify the effects of axial spacing, blade numbers and radial load distribution while meeting requirements related to composite blade airfoils thickness. The first reference fan CRTF1, shown in Fig. D19, was designed as a baseline configuration. The second fan configuration, CRTF2a, differs from the baseline in that it has thickened blade profiles that were designed to simulate composite blades. The third fan configuration, CRTF2b, was also designed with thickened blades for the first and second rotor and manufactured according to ―blisk‖ technology. To a certain extent, the third design meets real engine specifications in terms of blade count, which provides an economic constraint, and axial length of this module, which provides a weight constraint.
Figure D19. Front view (left) and sketch (right) of the reference CRTF design.
Figure D18. ERA Northrup Grumman Flying Wing Passenger
Aircraft

Page 178 of 182
The initial assumption with regard to the CRTF is to achieve the same pressure ratio as a conventional fan with two counter-rotating stages rotating at significantly slower speeds, which theoretically results in improved aerodynamic and acoustic performance. Therefore, for propulsive performances equivalent to those of a conventional fan, this technology offers a potentially advantageous solution for reducing fan noise. The challenges of the CRTF concept can be summed up as follows: reduce noise by decreasing fan rotation speed, be competitive in terms of weight and cost by limiting fan blade count and diameter increase, and improve specific consumption by improving fan efficiency. The counter rotating fan model study has been successfully conducted. Basic rules for CRTF aerodynamic design and the key differences relative to the design of a conventional fan were determined. The experimental results from CRTF1 are reassuring with regard to the obtained performance relative to the VITAL objective, and they confirm the suitability of the CFD approach, which is identical to that conducted in the design phase, for sufficiently predicting the observed performance from testing. The same methodology was applied to alternative designs CRTF2A and CRTF2B and it confirmed the advantages of these two versions relative to the baseline design.
D.2. Selection of preferred configuration This section will present the selected configuration, the reason why it was chosen and a detailed explanation of where the benefits in terms of noise are coming from. The IEP2 selected three configurations out of the ones analyzed above as possible candidates for recommendations. These were the NACRE Pro-Green, the MIT Double-Bubble and the Lockheed-Martin Box Wing. The IEP2 conducted interviews with the organizations responsible for the NACRE Pro-Green and the MIT Double-Bubble configurations. The interviews were focused on understanding how the reported noise levels were determined and the confidence for an Entry into Service (EIS) by 2030. Based on the results the IEP2 concluded that only the MIT D8.1 Double-Bubble configuration could be developed and brought into service by 2030. The reasons for this are that the higher risk technology, namely the integration of the fuselage and the propulsion system, is under study with wind tunnel testing as well as computational simulations. This work is being carried out by the MIT team under a NASA SFW Phase II contract. There were no technologies identified that could not be developed by 2030 although the certification of aft mounted engines would need to be addressed. The concept falls under TSN-2 category and would require financial commitment. There are no current plans to develop the concept into a product and it would likely require risk reduction research and development that is typically sponsored by government and/or industry consortia. The MIT D8.1 Double-Bubble configuration has a noise level that is 43 EPNdB below Chapter 4. The reported noise level corresponds to a conceptual study and has an uncertainty of ±10 EPNdB. To quantify the effects of the low noise aspects of the D8.1 aircraft concept and noise reduction technologies, the noise of the D8.1 is examined with respect to the Chapter 4 limit. The features of the design were introduced in a step-by-step manner as it is shown in Figure D20. The labelled values correspond to the cumulative EPNdB change relative to the Chapter 4 limit of the D8.1 configuration of 278 EPNdB. The largest noise reduction comes from moving the engines from the wing to the rear part of the fuselage that together with an improvement of the engine technology to 2010 levels give rise to a -16.7 EPNdB noise reduction. This is mainly due to the shielding of the fan rearward and forward noise from the
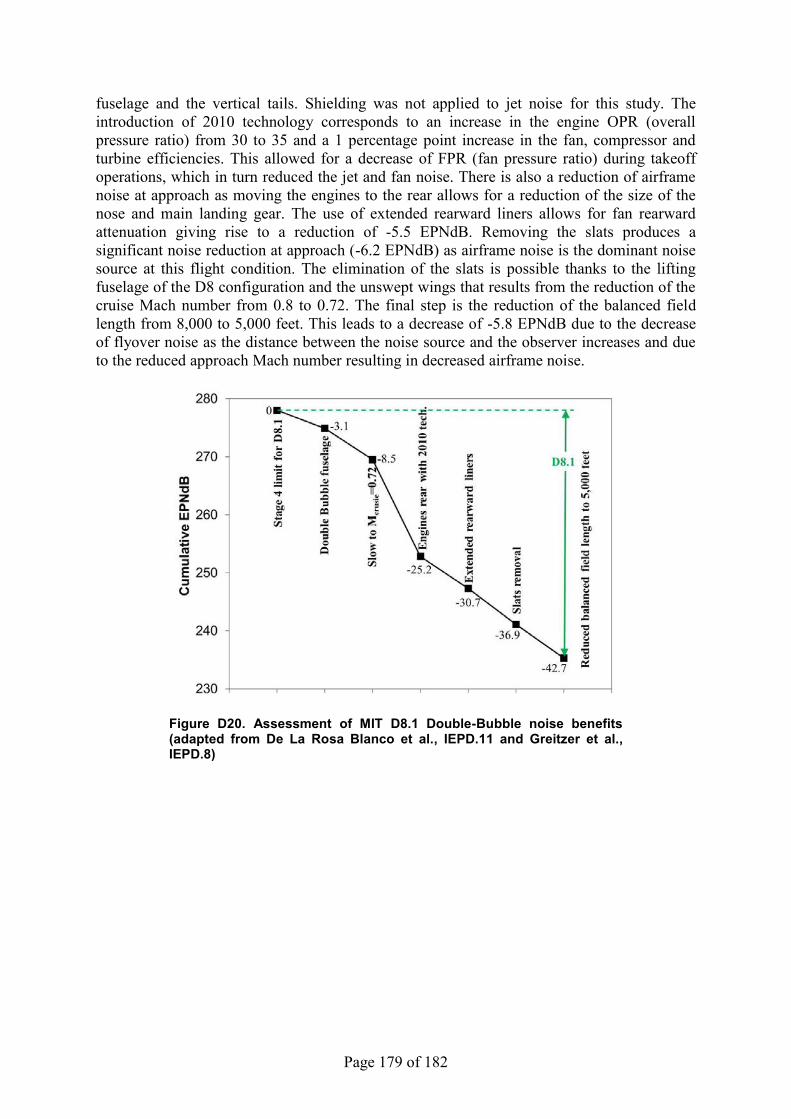
Page 179 of 182
fuselage and the vertical tails. Shielding was not applied to jet noise for this study. The introduction of 2010 technology corresponds to an increase in the engine OPR (overall pressure ratio) from 30 to 35 and a 1 percentage point increase in the fan, compressor and turbine efficiencies. This allowed for a decrease of FPR (fan pressure ratio) during takeoff operations, which in turn reduced the jet and fan noise. There is also a reduction of airframe noise at approach as moving the engines to the rear allows for a reduction of the size of the nose and main landing gear. The use of extended rearward liners allows for fan rearward attenuation giving rise to a reduction of -5.5 EPNdB. Removing the slats produces a significant noise reduction at approach (-6.2 EPNdB) as airframe noise is the dominant noise source at this flight condition. The elimination of the slats is possible thanks to the lifting fuselage of the D8 configuration and the unswept wings that results from the reduction of the cruise Mach number from 0.8 to 0.72. The final step is the reduction of the balanced field length from 8,000 to 5,000 feet. This leads to a decrease of -5.8 EPNdB due to the decrease of flyover noise as the distance between the noise source and the observer increases and due to the reduced approach Mach number resulting in decreased airframe noise.
Figure D20. Assessment of MIT D8.1 Double-Bubble noise benefits (adapted from De La Rosa Blanco et al., IEPD.11 and Greitzer et al., IEPD.8)
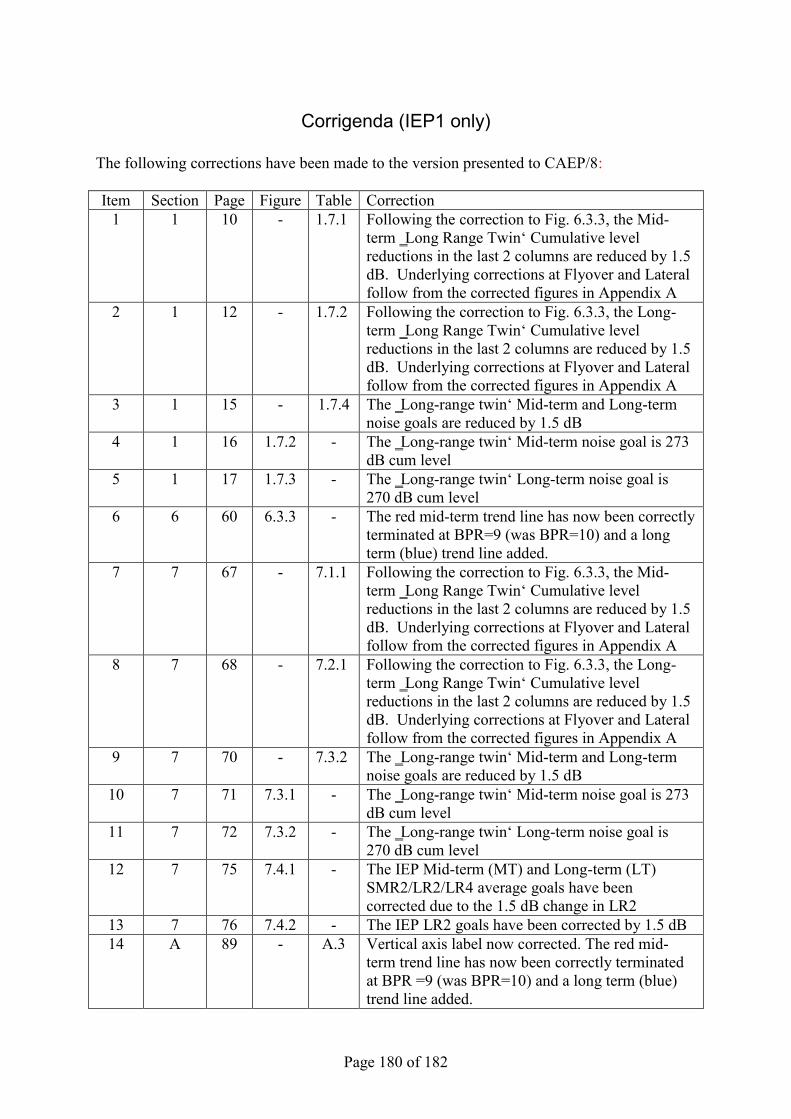
Page 180 of 182
Corrigenda (IEP1 only) The following corrections have been made to the version presented to CAEP/8: Item Section Page Figure Table Correction
1 1 10 - 1.7.1 Following the correction to Fig. 6.3.3, the Mid-term ‗Long Range Twin‘ Cumulative level reductions in the last 2 columns are reduced by 1.5 dB. Underlying corrections at Flyover and Lateral follow from the corrected figures in Appendix A
2 1 12 - 1.7.2 Following the correction to Fig. 6.3.3, the Long-term ‗Long Range Twin‘ Cumulative level reductions in the last 2 columns are reduced by 1.5 dB. Underlying corrections at Flyover and Lateral follow from the corrected figures in Appendix A
3 1 15 - 1.7.4 The ‗Long-range twin‘ Mid-term and Long-term noise goals are reduced by 1.5 dB
4 1 16 1.7.2 - The ‗Long-range twin‘ Mid-term noise goal is 273 dB cum level
5 1 17 1.7.3 - The ‗Long-range twin‘ Long-term noise goal is 270 dB cum level
6 6 60 6.3.3 - The red mid-term trend line has now been correctly terminated at BPR=9 (was BPR=10) and a long term (blue) trend line added.
7 7 67 - 7.1.1 Following the correction to Fig. 6.3.3, the Mid-term ‗Long Range Twin‘ Cumulative level reductions in the last 2 columns are reduced by 1.5 dB. Underlying corrections at Flyover and Lateral follow from the corrected figures in Appendix A
8 7 68 - 7.2.1 Following the correction to Fig. 6.3.3, the Long-term ‗Long Range Twin‘ Cumulative level reductions in the last 2 columns are reduced by 1.5 dB. Underlying corrections at Flyover and Lateral follow from the corrected figures in Appendix A
9 7 70 - 7.3.2 The ‗Long-range twin‘ Mid-term and Long-term noise goals are reduced by 1.5 dB
10 7 71 7.3.1 - The ‗Long-range twin‘ Mid-term noise goal is 273 dB cum level
11 7 72 7.3.2 - The ‗Long-range twin‘ Long-term noise goal is 270 dB cum level
12 7 75 7.4.1 - The IEP Mid-term (MT) and Long-term (LT) SMR2/LR2/LR4 average goals have been corrected due to the 1.5 dB change in LR2
13 7 76 7.4.2 - The IEP LR2 goals have been corrected by 1.5 dB 14 A 89 - A.3 Vertical axis label now corrected. The red mid-
term trend line has now been correctly terminated at BPR =9 (was BPR=10) and a long term (blue) trend line added.

Page 181 of 182
15 A 91 - A.5 Vertical axis label now corrected. 16 A 92 - A.6 Vertical axis label now corrected. The red mid-
term trend line has now been correctly terminated at BPR=9 (was BPR=10) and a long term (blue) trend line added.
17 A 94 - A.8 Vertical axis label now corrected. 18 A 95 - A.9 Vertical axis label now corrected. The red mid-
term trend line has now been correctly terminated at BPR=9 (was BPR=10) and a long term (blue) trend line added.

Page 182 of 182
Corrigenda (IEP2 only) The following corrections have been made to the version presented to CAEP/9 in Appendix D, under the following sub-titles. The SFW Boeing Sugar Volt Strut Braced Advanced Electric (Fig. D13) The figure 70% corrected to 79% The ERA Boeing Blended Wing Body (Fig. D14) The figure 41 corrected to 42 EPNdB The right hand graphic in figure D.14 replaced with correct version. The Cambridge-MIT Initiative (CMI) SAX-40 Hybrid Wing Body (Fig. D17) The figure 34% corrected to 25%


![Bobs Card Models...1 Bobs Card Models and [Resources] Canadair CL-415 (1:144) The Bombardier 415 (formerly Canadair CL-415) is a Canadian amphibious aircraft purpose-built as a water](https://img.pdfslide.us/doc/110x75/5f83338491257e00bc3a9e5f/bobs-card-1-bobs-card-models-and-resources-canadair-cl-415-1144-the-bombardier.jpg)