Embed Size (px)
Citation preview
ORIGINAL ARTICLE
Morten Odden • Per Wegge • Trude Fredriksen
Do tigers displace leopards? If so, why?
Received: 15 October 2009 / Accepted: 27 March 2010 / Published online: 29 May 2010� The Ecological Society of Japan 2010
Abstract We investigated predictions concerning thecompetitive relationships between tigers Panthera tigrisand leopards Panthera pardus in Bardia National Park,Nepal, based on spatial distributions of scats and terri-torial markings (sign), analyses of scat content andcensus of wild ungulate prey. Medium-sized ungulates,in particular chital Axis axis, was the main food of bothpredators, but leopards consumed significantly largerproportions of domestic animals, small mammals, andbirds than tigers. Tiger sign were never found outside thepark, while leopard sign occurred both inside and out-side, and were significantly closer to the park borderthan tiger sign. Significantly higher prey densities atlocations of tiger sign than that of leopards were mainlydue to a preference of the latter species for the parkborder areas. Our results imply that interference com-petition––and not competition for food––was a limitingfactor for the leopard population, whose distributionwas restricted to the margins of the tiger territories. Wesuggest that the composition of the prey base is a keyfactor in understanding the different results and inter-pretations reported in studies on tiger/leopard coexis-tence. There are two potential mechanisms that linkinterference competition and prey: (1) low abundance oflarge ungulate prey decreases foraging efficiency oftigers, leading to increased energetic stress and aggres-sion towards leopards; and (2) increased diet overlap due
to scarcity of large prey leads to increased encounterrates and increased levels of interference competition.
Keywords Avoidance behavior Æ Resourcepartitioning Æ Exploitative competition Æ Competitionrefuge
Introduction
Almost all prey are consumed by multiple predatorspecies, and, accordingly, most predators are prone tointeract with other species of the same guild. The com-bined effect of multiple predators on shared prey is oftenadditive, and may produce a top-down mode of popu-lation regulation of prey (Sinclair et al. 2003). As a re-sult, coexisting carnivores may adversely influence eachother due to their limiting effect on shared resources.This form of interaction is termed exploitative compe-tition (Begon et al. 1990).
During the last few decades, much attention has beenaimed at competitive relationships that may occur whenthe shared resources are not necessarily limited in termsof abundance. Instead, one species imposes a cost on aninferior competitor by limiting its foraging abilitythrough a process termed interference competition(Goss-Custard 1980; Creel et al. 2001). Interferencecompetition involves kleptoparasitism, intraguild pre-dation, and avoidance behavior (Creel et al. 2001). Be-cause intraguild predation is a major factor promotingavoidance and, due to its severe consequences, it hasbeen considered as interference competition in its mostextreme form (Polis et al. 1989).
Tigers and leopards are sympatric in several parts ofAsia, and reports concerning the nature of their coex-istence are conflicting. Karanth and Sunquist (1995,2000) studied prey selection and interactions betweenthese solitary felids in Nagarahole, India, where thedensities of both species are high (Karanth 1993, 1995),and their prey base is rich and diverse in terms of speciesand sizes (Karanth and Sunquist 1992). The authors
M. Odden Æ P. WeggeDepartment of Ecology and Natural Resource Management,Norwegian University of Life Sciences, 1432 As, NorwayE-mail: [email protected]
T. FredriksenBrobakken 8, 4639 Kristiansand S, Norway
Present address: M. Odden (&)Hedmark University College, Campus Evenstad,2418 Elverum, NorwayE-mail: [email protected].: +47-48055664Fax: +47-64968501
Ecol Res (2010) 25: 875–881DOI 10.1007/s11284-010-0723-1
observed similar patterns between the species in spaceuse and activity patterns (Karanth and Sunquist 2000),but differences in prey selection with respect to prey size(Karanth and Sunquist 1995). The authors thus con-cluded that behavioral factors play a minor role inshaping predator communities in tropical forests, andthat availability of an appropriate range of prey sizesand high tree cover and density were key factors for theircoexistence. This conclusion is in accordance with clas-sical competition theory, which states that animals thatare subject to exploitative competition can only coexist ifeach species has access to some distinct resource thatthey are better able to utilize than the other species(MacArthur and Levins 1967; Tilman 1982). If bothcompetitors depend on a single resource, then the speciesthat is able to subsist on the lowest resource density willsuppress the other. Among predators, the upper limit toprey size is typically determined by the ability of thepredator to kill large prey and avoid being injured in theprocess, whereas the other end of the prey size contin-uum is more diffuse, consisting of less profitable andopportunistically killed prey (Gittleman 1985; Radloffand du Toit 2004). Hence, competition between tigersand leopards may be minimized when the former haveaccess to larger prey items that the latter are unable tokill. Furthermore, the size difference between tigers andleopards entails a different energetic gain from killingsmaller prey. Due to their smaller size, leopards shouldbe able to escape exploitative competition by focusingtheir foraging efforts on prey items that are too small tobe profitable for tigers.
Theory and empirical data suggest that behavioralfactors may play a role in tiger–leopard coexistence incertain circumstances. Indications of tiger avoidancewere observed among leopards in Chitwan NationalPark, Nepal, by Seidensticker (1976) and McDougal(1988). Furthermore, the size difference between tigersand leopards, their similar feeding habits, and their closetaxonomic relatedness are strong indicators of a high riskof intraguild predation (Polis et al. 1989; Palomares andCaro 1999; Donadio and Buskirk 2006). Empiricalstudies have demonstrated that an inferior competitormay avoid interference competition by inhabiting‘‘competition refuges’’, areas where encounters with thesuperior opponent are less frequent (Durant 1998;Woodroffe and Ginsberg 2005). Two main types of ref-uges are reported in the literature; some species avoidconflicts by inhabiting the margins of their competitors’home ranges, whereas others seek out areas within theranges of their opponents that are low in resource density,thereby reducing the probability of interspecific encoun-ters (Woodroffe and Ginsberg 2005). According to Creelet al. (2001), a sound approach of detecting avoidancedue to interference competition among carnivores re-quires objective methods of mapping habitat quality forthe competitors and of recording their spatial distribu-tions. In our study, we used non-invasive methods forrecording these two aspects of tiger and leopard ecology.Based on analyzes of scat contents, ungulate prey census
data and distributions of scats and territorial markings,we investigated predictions concerning the competitionand coexistence in Bardia National Park, Nepal.
The tiger density in our study area in Bardia wasamong the highest ever recorded (Wegge et al. 2004, 2009:13.3–19.3 tigers per 100 km2),whereas the leopard densitywas much lower (Heinen and Kattel 1992; Støen andWegge 1996; Wegge et al. 2009: five leopards per km2).Tiger and leopard competition would probably not beexploitative, firstly, because the study area sustained veryhigh densities of medium-sized ungulates (Wegge et al.2009; Støen andWegge 1996), which are suitable prey forleopards (Odden and Wegge 2005, 2009; Hayward et al.2006; Wegge et al. 2009). Secondly, food consumption ofradio-collared leopards in our study area was high (ca.4 kg per day, Odden and Wegge 2009). Hence, if compe-tition occurs, it ismore likely to bedue to direct behavioralinteractions between the two species, and not due to lim-ited food resources.According to the theory and empiricalevidence outlined above, we predict that tigers and leop-ards in Bardia exhibit spatial segregation. Being thebehaviorally dominant species, the spatial distribution oftiger sign, i.e., scats and territorial markings, should cor-respond positively with the density distribution of theirmain prey, whereas leopard sign should be most commonin areas that are less frequently used by tigers, i.e., areaswith a lower direct correspondence to the distribution oftheir prey.
Methods
Study area
Our research activities were conducted within a 105-km2
area in the southwestern part of the Bardia National Park(986 km2). The study area is delineated by the GeruwaRiver in the west, human settlements and agriculturalfields in the south and east, and the Amreni–Chisapanihighway in the north. The Geruwa River consists ofnumerous larger and smaller water channels interspersedwith islets with tall grass (Saccharum spp.) and patches ofearly forest successional stages, dominated by sissoo(Dalbergia sissoo) and khair (Acacia catechu). Borderingthe river are broken patches of riverine forest (Trewianudiflora, Ficus spp., Mallotus phillippinensis, Syzigiumcumini), andwooded grasslands consisting of amixture ofhardwood trees (including Adina cordifolia, Schleicheratrijuga, Lagerstroemia spp.) and species of short grasses(including Vetiveria zizanoides, Imperata cylindrica). SalShorea robusta forest grows on slightly elevated and driersoils away from the main river course.
Ungulate densities
The methods of estimating ungulate densities and dis-tributions were explained in detail in Wegge et al. (2009),
876
and will be briefly described here. Ungulates werecounted by flushing animals out from patches of vege-tation surrounded by either roads or dry riverbeds.During 1997–1999, 169 counts were conducted in 46different habitat blocks with an average size of 33.7 ha.To ensure that we counted all animals within the patch,we employed a large number of beaters (�65 people/block), walking in a line 10–20 m apart. We modeled theinfluence of habitat on the densities of each ungulatespecies by using generalized linear models (GLM). Themost parsimonious models describing ungulate densitieswere selected by comparing the Akaike informationcriterion corrected for small samples (AICc, Burnhamand Anderson 2002).
Chital was the most abundant ungulate [Weight(W) � 50–60 kg, Density (D) = 84.7 ± 7.9 (SE) ani-mals per km2], followed by hog deer Axis porcinus(W � 30–40 kg, D = 13.2 ± 1.5), muntjac Muntiacusmuntjak (W � 15–20 kg, D = 2.3 ± 0.4) and wild boarSus scrofa (W � 35–40 kg, D = 2.2 ± 0.4, Wegge et al.2009). Larger ungulates occurred in very low densities.These were barasingha Cervus duvauceli (W > 150 kg,D = 0.4 ± 0.1), nilgai Boselaphus tragocamelus(W > 150 kg, D = 0.3 ± 0.1) and sambar Cervus uni-color (Wegge et al. 2009). The latter species wasencountered sporadically, but their density was too lowto obtain reliable density estimates. Models of ungulatedensity showed that the different species were associatedwith different vegetation types (Wegge et al. 2009). Wildboar and muntjac were most common in forested vege-tation types in the eastern part of study area, whereas
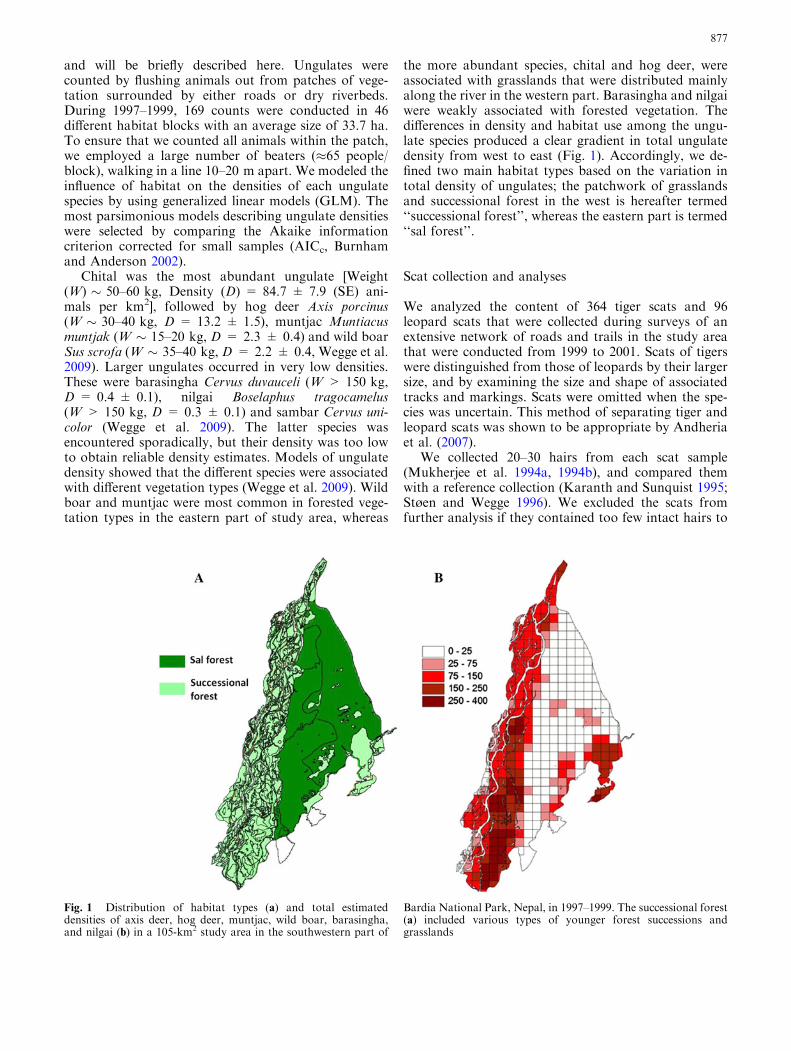
the more abundant species, chital and hog deer, wereassociated with grasslands that were distributed mainlyalong the river in the western part. Barasingha and nilgaiwere weakly associated with forested vegetation. Thedifferences in density and habitat use among the ungu-late species produced a clear gradient in total ungulatedensity from west to east (Fig. 1). Accordingly, we de-fined two main habitat types based on the variation intotal density of ungulates; the patchwork of grasslandsand successional forest in the west is hereafter termed‘‘successional forest’’, whereas the eastern part is termed‘‘sal forest’’.
Scat collection and analyses
We analyzed the content of 364 tiger scats and 96leopard scats that were collected during surveys of anextensive network of roads and trails in the study areathat were conducted from 1999 to 2001. Scats of tigerswere distinguished from those of leopards by their largersize, and by examining the size and shape of associatedtracks and markings. Scats were omitted when the spe-cies was uncertain. This method of separating tiger andleopard scats was shown to be appropriate by Andheriaet al. (2007).
We collected 20–30 hairs from each scat sample(Mukherjee et al. 1994a, 1994b), and compared themwith a reference collection (Karanth and Sunquist 1995;Støen and Wegge 1996). We excluded the scats fromfurther analysis if they contained too few intact hairs to
Fig. 1 Distribution of habitat types (a) and total estimateddensities of axis deer, hog deer, muntjac, wild boar, barasingha,and nilgai (b) in a 105-km2 study area in the southwestern part of
Bardia National Park, Nepal, in 1997–1999. The successional forest(a) included various types of younger forest successions andgrasslands
877
make a reliable identification of the prey species. Thereference collection included hair from all potential wildand domestic ungulate, primate, and carnivore preyspecies.
We investigated the relative differences in selection ofprey by the following method: First, we grouped theprey species in the following categories; medium-sizedungulates (chital, hog deer, wild boar, and muntjac, ca.15–60 kg), large ungulates (barasingha, nilgai, andsambar <150 kg), domestic animals (cows, buffalos,sheep, goats, pigs, and dogs) and smaller wild mammalsand birds. Next, we ran a series of binomial logisticregression models, where predator species, i.e., tiger orleopard, was the response variable, and the presence ofeach of the prey categories in the scats were explanatoryvariables. We compared 15 models based on the Akaikeinformation criterion corrected for small samples (AICc;Burnham and Anderson 2002). The full model includedall four prey categories as main effects, whereas the other14 models represented all the simpler combinations ofthese prey categories, excluding interaction terms.
Predator distribution
During 2000/2001, we plotted positions of tiger andleopard scats and territorial markings (scrapes), andmapped the routes that were followed.We did not includepugmarks, as the occurrence of this sign may varymarkedly among different habitats according to theground substratum. On foot, we surveyed a route of142 km of roads and trails inside the national park, and64 km in buffer zone outside the park border, whichconsisted mainly of degraded sal forest. The whole routeof 206 kmwas surveyed on two occasions at an interval of2 months. The analyses of these data were conducted inthree steps: (1) We compared the relative use of the areasinside and outside the national park by the two species; (2)We investigated the differences in distributions betweentiger and leopard sign within the park boundaries withbinomial logistic regression models. We used predatorspecies (tiger or leopard) as a binary response variable andthe different characteristics of the sign locations asexplanatory variables: habitat type (ST), the densities ofall wild ungulates (TT), of medium-sized ungulates (MD:chital, hog deer, muntjac, and wild boar) and large un-gulates (LG: barasingha, sambar, andnilgai).Weoverlaida grid with cells of 33 ha on a digitized habitat map of thestudy area, and used ungulate density models that weredeveloped in a recent study in the same area to predict thedensities of each prey category in each cell (Wegge et al.2009). For each predator sign, we assigned ungulatedensity values from the grid cell where the sign was lo-cated. The predictors were correlated and, thus, we didnot allow them to appear in the same models. Accord-ingly, we compared four models based on the AICc; (3)Lastly, we measured the distances between the sign andthe park border, and compared the data from each of thetwo predator species.
Results
Predator diets
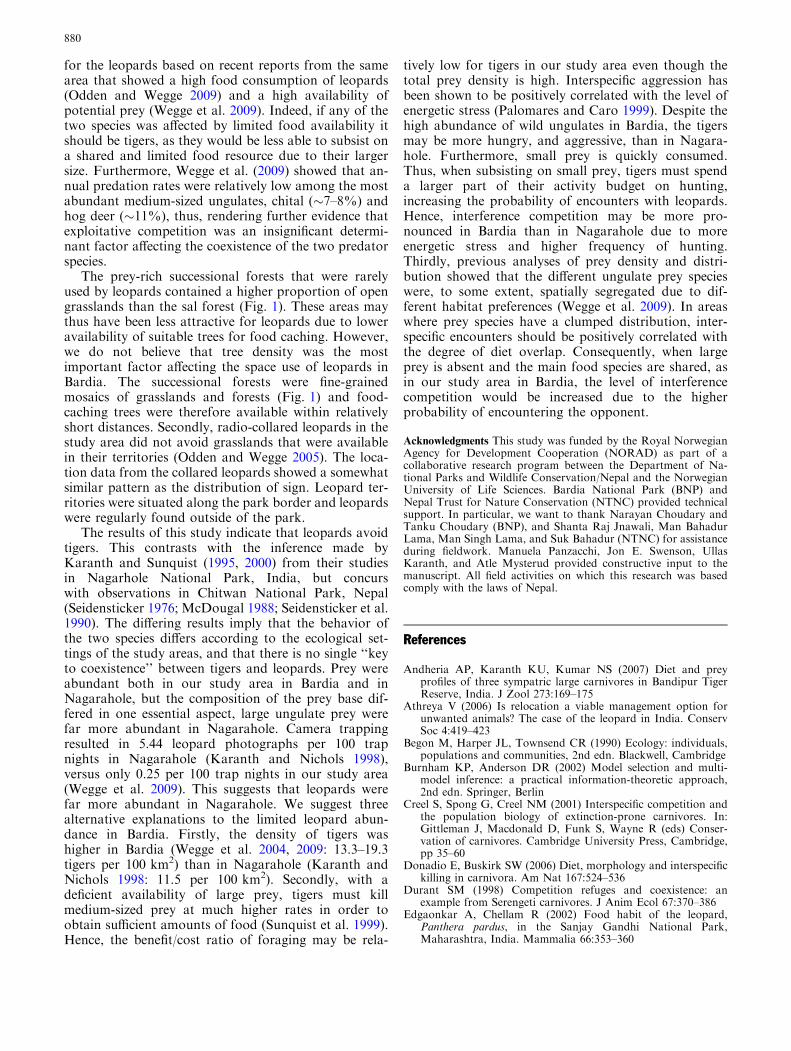
Medium-sized ungulates were the most common preyfor both tigers and leopards (Table 1). However, theprey categories small mammals/birds (SM) and domesticanimals (DM) were more common in leopard scats thanin tiger scats, and these categories were included in allthe best models of interspecific differences in scat con-tents (Tables 1, 2), suggesting that the occurrence ofthese prey items were the best predictors of whether ascat stemmed from a tiger or a leopard. Larger ungulates(LG) were rare in scats from both tiger and leopard(Table 1).
Predator sign distribution
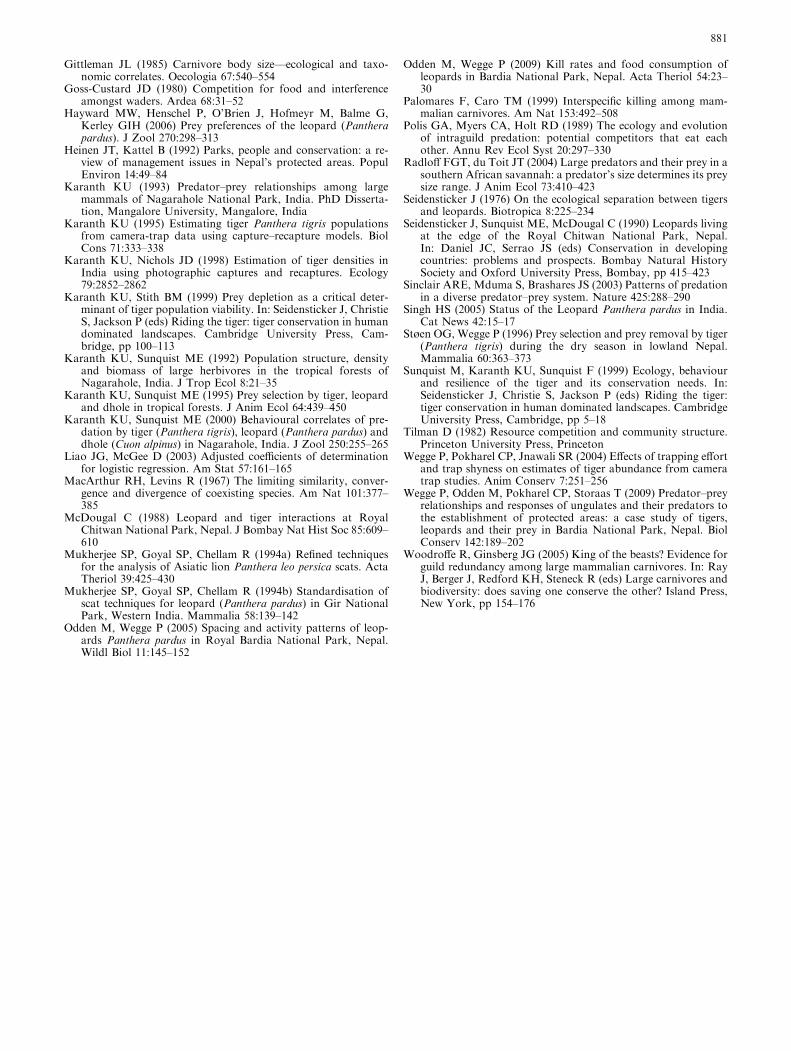
The best model of predator sign distribution inside thenational park performed far better than any of the othercandidate models (model 1, Table 3). This model in-cluded only one term, habitat type (ST). Tiger sign werefound on 218 occasions in successional forest and on 252occasions in sal forest (v2 = 0.2, df = 1, p = 0.65). Incontrast, leopard sign were found only 3 occasionsin successional forest and on 36 occasions in salforest (v2 = 14.2, df = 1, p < 0.001). All three modelsthat included the predicted densities of ungulates(DAICc � 13–15) performed considerably better thanthe null model (DAICc = 24.51). The models predictedthat tiger sign were more likely to occur than leopardsign in areas with high total densities of ungulates (M3),high densities of medium-sized ungulates (M2), and withlow density of large ungulates (M4).
We found sign of tigers (n = 470) exclusively inside thenational park, whereas leopard sign were distributed bothinside (n = 39) and outside the park (n = 12). Hence,tiger sign occurred nearly ten times more frequently thandid leopard sign, and there was evidence that their relativedistribution inside and outside the park differed from thatof the leopard (Fisher’s exact test, p < 0.001). Also, the
Table 1 Contents of scats collected from tigers and leopards inBardia National Park, Nepal
Prey category No. of scats (%)
Tiger Leopard
Small 10 (3) 22 (23)Medium 337 (93) 55 (57)Large 23 (6) 3 (3)Domestic 17 (5) 21 (22)
Prey categories include medium-sized ungulates (chital, hog deer,wild boar, and muntjac, ca. 15–60 kg), large ungulates (barasingha,nilgai, and sambar <150 kg), domestic animals (cows, buffalos,sheep, goats, pigs, and dogs) and smaller wild mammals and birds.The data are presented as the number of scats containing remainsof each prey category and their respective proportions
878
distribution of tiger sign differed from a random distri-bution (Fisher’s exact test, p < 0.001), whereas leopardsign did not (v2 = 0.4, df = 1, p = 0.506). The signfound within the habitat that was used by both predators,i.e., sal forest, was distributed differently between the twospecies. Tiger signwere further away from the park borderthan were leopard sign (tiger: 1.47 ± 0.06 km SE, leop-ard: 0.8 ± 0.14 km SE; t test, t = 3.43, df = 261,p = 0.001).
Discussion
A characteristic feature of leopards is their ability todwell near human settlements. In contrast to tigers,which need relatively large and undisturbed areas with ahealthy natural prey base (Karanth and Stith 1999),leopards often live alongside humans, sometimes inareas where wild prey are scarce (Singh 2005; Athreya2006). In the vicinity of human settlements, domesticanimals may dominate leopard diets (Edgaonkar andChellam 2002), resulting in a high potential for conflictswith their human neighbors (Athreya 2006). Thesegeneral interspecific differences were confirmed in ourstudy; leopards included a far larger proportion ofdomestic animals in their diet than tigers, and leopardsign were evenly distributed on both sides of the park
border and close to human settlements, whereas tigersclearly avoided the human-dominated areas.
The avoidance of human-dominated areas by tigerscreated a potential competition refuge for leopards.Hence, this competition refuge was situated in an areawith a high likelihood of human conflict and persecu-tion. Our data indicated that the leopards responded tothis opportunity, using the buffer zone forest outside thepark and, when in the park, using areas closer to thepark border than tigers. Hence, the leopards seemed toavoid tigers by using the periphery of the tiger rangeinstead of using areas of low quality within the homeranges of the tigers. The latter way of avoiding tigers wasprobably not feasible, as we did not detect any signifi-cant difference among tigers in the distribution of signwith respect to areas of rich and poor prey density.
The line of reasoning above rests on the assumptionsthat the distribution of leopard sign was a result ofavoidance of tigers rather than a preference for human-dominated areas. Both theory and empirical data sup-port these assumptions. Medium-sized ungulates werethe main food source of both species, and the fact thatleopard sign within the park were mainly located inareas with a relatively low availability of this resourceindicated that the leopards were subject to some form ofconstraint. We previously argued that interspecificcompetition for food was an implausible limiting factor
Table 2 Generalized linear models of differences between tigers and leopards in prey selection in Bardia National Park, Nepal
Model terms and parameter estimates (SE) R2 AICc DAICc W
M1 1.83 (0.15)Int � 1.95 (0.36)DM*** � 3.74 (0.63)SM*** 0.172 393.47 0.00 0.512M2 2.09 (0.53)Int � 0.26 (0.54)MD � 2.18 (0.60)DM*** � 3.97 (0.79)SM*** 0.170 395.26 1.79 0.209M3 1.82 (0.15)Int + 0.22 (0.63)LG � 1.93 (0.36)DM*** � 3.73 (0.64)SM*** 0.171 395.38 1.91 0.197M4 2.11 (0.85)Int � 0.30 (0.84)MD � 0.05 (0.99)LG � 2.21 (0.87)DM* � 4.00 (1.00)SM*** 0.168 397.30 3.83 0.075NULL 1.33 (0.11)Int 472.79 79.32 0.000
We modeled the binomial-dependent variable, i.e., if a scat stemmed from a tiger or a leopard, based on the contents of the scatsDM domestic animals, LG large ungulates (barasingha, sambar, and nilgai), MD medium-sized ungulates (chital, hog deer, muntjac, andwild boar), SM small mammals and birds, R2 is an adjusted coefficient of determination for logistic regression (Liao and McGee 2003),AICc is the Akaike information criterion corrected for small samples (Burnham and Anderson 2002), DAICc is the AICc of the model inquestion minus the smallest AICc among all models, W is the Akaike weight, NULL null model, Int interceptSignificance levels are indicated by ** (p < 0.01) and *** (p < 0.001)
Table 3 Generalized linear models of differences in distribution of scats and sign of territorial markings between tigers and leopards inBardia National Park, Nepal
Model terms and parameter estimates (SE) R2 AICc DAICc W
M1 1.946 (0.178)Int + 2.340 (0.608)ST*** 0.092 252.8 0.00 0.997M2 1.880 (0.220)Int + 0.006 (0.002)MD** 0.044 266.12 13.32 0.001M3 1.872 (0.221)Int � 0.006 (0.002)TT** 0.044 266.13 13.33 0.001M4 3.311 (0.343)Int � 1.081 (0.335)LG** 0.040 267.43 14.63 0.001NULL 2.489 (0.167)Int 277.31 24.51 0.000
We used predator species (tiger or leopard) as a response variable, and different characteristics of the scat/sign location as explanatoryvariables, including habitat type (ST: climax sal forest vs. grassland/successional forest), total density of wild ungulates (TT), density ofmedium-sized ungulates (MD: axis deer, hog deer, wild boar and muntjac) and density of large ungulates (LG: barasingha + nilgai)R2 is an adjusted coefficient of determination for logistic regression (Liao and McGee 2003), AICc is the Akaike information criterioncorrected for small samples (Burnham and Anderson 2002), DAICc is the AICc of the model in question minus the smallest AICc among allmodels, W is the Akaike weight, NULL null model, Int interceptSignificance levels are indicated by ** (p < 0.01) and *** (p < 0.001)
879
for the leopards based on recent reports from the samearea that showed a high food consumption of leopards(Odden and Wegge 2009) and a high availability ofpotential prey (Wegge et al. 2009). Indeed, if any of thetwo species was affected by limited food availability itshould be tigers, as they would be less able to subsist ona shared and limited food resource due to their largersize. Furthermore, Wegge et al. (2009) showed that an-nual predation rates were relatively low among the mostabundant medium-sized ungulates, chital (�7–8%) andhog deer (�11%), thus, rendering further evidence thatexploitative competition was an insignificant determi-nant factor affecting the coexistence of the two predatorspecies.
The prey-rich successional forests that were rarelyused by leopards contained a higher proportion of opengrasslands than the sal forest (Fig. 1). These areas maythus have been less attractive for leopards due to loweravailability of suitable trees for food caching. However,we do not believe that tree density was the mostimportant factor affecting the space use of leopards inBardia. The successional forests were fine-grainedmosaics of grasslands and forests (Fig. 1) and food-caching trees were therefore available within relativelyshort distances. Secondly, radio-collared leopards in thestudy area did not avoid grasslands that were availablein their territories (Odden and Wegge 2005). The loca-tion data from the collared leopards showed a somewhatsimilar pattern as the distribution of sign. Leopard ter-ritories were situated along the park border and leopardswere regularly found outside of the park.
The results of this study indicate that leopards avoidtigers. This contrasts with the inference made byKaranth and Sunquist (1995, 2000) from their studiesin Nagarhole National Park, India, but concurswith observations in Chitwan National Park, Nepal(Seidensticker 1976; McDougal 1988; Seidensticker et al.1990). The differing results imply that the behavior ofthe two species differs according to the ecological set-tings of the study areas, and that there is no single ‘‘keyto coexistence’’ between tigers and leopards. Prey wereabundant both in our study area in Bardia and inNagarahole, but the composition of the prey base dif-fered in one essential aspect, large ungulate prey werefar more abundant in Nagarahole. Camera trappingresulted in 5.44 leopard photographs per 100 trapnights in Nagarahole (Karanth and Nichols 1998),versus only 0.25 per 100 trap nights in our study area(Wegge et al. 2009). This suggests that leopards werefar more abundant in Nagarahole. We suggest threealternative explanations to the limited leopard abun-dance in Bardia. Firstly, the density of tigers washigher in Bardia (Wegge et al. 2004, 2009: 13.3–19.3tigers per 100 km2) than in Nagarahole (Karanth andNichols 1998: 11.5 per 100 km2). Secondly, with adeficient availability of large prey, tigers must killmedium-sized prey at much higher rates in order toobtain sufficient amounts of food (Sunquist et al. 1999).Hence, the benefit/cost ratio of foraging may be rela-
tively low for tigers in our study area even though thetotal prey density is high. Interspecific aggression hasbeen shown to be positively correlated with the level ofenergetic stress (Palomares and Caro 1999). Despite thehigh abundance of wild ungulates in Bardia, the tigersmay be more hungry, and aggressive, than in Nagara-hole. Furthermore, small prey is quickly consumed.Thus, when subsisting on small prey, tigers must spenda larger part of their activity budget on hunting,increasing the probability of encounters with leopards.Hence, interference competition may be more pro-nounced in Bardia than in Nagarahole due to moreenergetic stress and higher frequency of hunting.Thirdly, previous analyses of prey density and distri-bution showed that the different ungulate prey specieswere, to some extent, spatially segregated due to dif-ferent habitat preferences (Wegge et al. 2009). In areaswhere prey species have a clumped distribution, inter-specific encounters should be positively correlated withthe degree of diet overlap. Consequently, when largeprey is absent and the main food species are shared, asin our study area in Bardia, the level of interferencecompetition would be increased due to the higherprobability of encountering the opponent.
Acknowledgments This study was funded by the Royal NorwegianAgency for Development Cooperation (NORAD) as part of acollaborative research program between the Department of Na-tional Parks and Wildlife Conservation/Nepal and the NorwegianUniversity of Life Sciences. Bardia National Park (BNP) andNepal Trust for Nature Conservation (NTNC) provided technicalsupport. In particular, we want to thank Narayan Choudary andTanku Choudary (BNP), and Shanta Raj Jnawali, Man BahadurLama, Man Singh Lama, and Suk Bahadur (NTNC) for assistanceduring fieldwork. Manuela Panzacchi, Jon E. Swenson, UllasKaranth, and Atle Mysterud provided constructive input to themanuscript. All field activities on which this research was basedcomply with the laws of Nepal.
References
Andheria AP, Karanth KU, Kumar NS (2007) Diet and preyprofiles of three sympatric large carnivores in Bandipur TigerReserve, India. J Zool 273:169–175
Athreya V (2006) Is relocation a viable management option forunwanted animals? The case of the leopard in India. ConservSoc 4:419–423
Begon M, Harper JL, Townsend CR (1990) Ecology: individuals,populations and communities, 2nd edn. Blackwell, Cambridge
Burnham KP, Anderson DR (2002) Model selection and multi-model inference: a practical information-theoretic approach,2nd edn. Springer, Berlin
Creel S, Spong G, Creel NM (2001) Interspecific competition andthe population biology of extinction-prone carnivores. In:Gittleman J, Macdonald D, Funk S, Wayne R (eds) Conser-vation of carnivores. Cambridge University Press, Cambridge,pp 35–60
Donadio E, Buskirk SW (2006) Diet, morphology and interspecifickilling in carnivora. Am Nat 167:524–536
Durant SM (1998) Competition refuges and coexistence: anexample from Serengeti carnivores. J Anim Ecol 67:370–386
Edgaonkar A, Chellam R (2002) Food habit of the leopard,Panthera pardus, in the Sanjay Gandhi National Park,Maharashtra, India. Mammalia 66:353–360
880
Gittleman JL (1985) Carnivore body size––ecological and taxo-nomic correlates. Oecologia 67:540–554
Goss-Custard JD (1980) Competition for food and interferenceamongst waders. Ardea 68:31–52
Hayward MW, Henschel P, O’Brien J, Hofmeyr M, Balme G,Kerley GIH (2006) Prey preferences of the leopard (Pantherapardus). J Zool 270:298–313
Heinen JT, Kattel B (1992) Parks, people and conservation: a re-view of management issues in Nepal’s protected areas. PopulEnviron 14:49–84
Karanth KU (1993) Predator–prey relationships among largemammals of Nagarahole National Park, India. PhD Disserta-tion, Mangalore University, Mangalore, India
Karanth KU (1995) Estimating tiger Panthera tigris populationsfrom camera-trap data using capture–recapture models. BiolCons 71:333–338
Karanth KU, Nichols JD (1998) Estimation of tiger densities inIndia using photographic captures and recaptures. Ecology79:2852–2862
Karanth KU, Stith BM (1999) Prey depletion as a critical deter-minant of tiger population viability. In: Seidensticker J, ChristieS, Jackson P (eds) Riding the tiger: tiger conservation in humandominated landscapes. Cambridge University Press, Cam-bridge, pp 100–113
Karanth KU, Sunquist ME (1992) Population structure, densityand biomass of large herbivores in the tropical forests ofNagarahole, India. J Trop Ecol 8:21–35
Karanth KU, Sunquist ME (1995) Prey selection by tiger, leopardand dhole in tropical forests. J Anim Ecol 64:439–450
Karanth KU, Sunquist ME (2000) Behavioural correlates of pre-dation by tiger (Panthera tigris), leopard (Panthera pardus) anddhole (Cuon alpinus) in Nagarahole, India. J Zool 250:255–265
Liao JG, McGee D (2003) Adjusted coefficients of determinationfor logistic regression. Am Stat 57:161–165
MacArthur RH, Levins R (1967) The limiting similarity, conver-gence and divergence of coexisting species. Am Nat 101:377–385
McDougal C (1988) Leopard and tiger interactions at RoyalChitwan National Park, Nepal. J Bombay Nat Hist Soc 85:609–610
Mukherjee SP, Goyal SP, Chellam R (1994a) Refined techniquesfor the analysis of Asiatic lion Panthera leo persica scats. ActaTheriol 39:425–430
Mukherjee SP, Goyal SP, Chellam R (1994b) Standardisation ofscat techniques for leopard (Panthera pardus) in Gir NationalPark, Western India. Mammalia 58:139–142
Odden M, Wegge P (2005) Spacing and activity patterns of leop-ards Panthera pardus in Royal Bardia National Park, Nepal.Wildl Biol 11:145–152
Odden M, Wegge P (2009) Kill rates and food consumption ofleopards in Bardia National Park, Nepal. Acta Theriol 54:23–30
Palomares F, Caro TM (1999) Interspecific killing among mam-malian carnivores. Am Nat 153:492–508
Polis GA, Myers CA, Holt RD (1989) The ecology and evolutionof intraguild predation: potential competitors that eat eachother. Annu Rev Ecol Syst 20:297–330
Radloff FGT, du Toit JT (2004) Large predators and their prey in asouthern African savannah: a predator’s size determines its preysize range. J Anim Ecol 73:410–423
Seidensticker J (1976) On the ecological separation between tigersand leopards. Biotropica 8:225–234
Seidensticker J, Sunquist ME, McDougal C (1990) Leopards livingat the edge of the Royal Chitwan National Park, Nepal.In: Daniel JC, Serrao JS (eds) Conservation in developingcountries: problems and prospects. Bombay Natural HistorySociety and Oxford University Press, Bombay, pp 415–423
Sinclair ARE, Mduma S, Brashares JS (2003) Patterns of predationin a diverse predator–prey system. Nature 425:288–290
Singh HS (2005) Status of the Leopard Panthera pardus in India.Cat News 42:15–17
Støen OG, Wegge P (1996) Prey selection and prey removal by tiger(Panthera tigris) during the dry season in lowland Nepal.Mammalia 60:363–373
Sunquist M, Karanth KU, Sunquist F (1999) Ecology, behaviourand resilience of the tiger and its conservation needs. In:Seidensticker J, Christie S, Jackson P (eds) Riding the tiger:tiger conservation in human dominated landscapes. CambridgeUniversity Press, Cambridge, pp 5–18
Tilman D (1982) Resource competition and community structure.Princeton University Press, Princeton
Wegge P, Pokharel CP, Jnawali SR (2004) Effects of trapping effortand trap shyness on estimates of tiger abundance from cameratrap studies. Anim Conserv 7:251–256
Wegge P, Odden M, Pokharel CP, Storaas T (2009) Predator–preyrelationships and responses of ungulates and their predators tothe establishment of protected areas: a case study of tigers,leopards and their prey in Bardia National Park, Nepal. BiolConserv 142:189–202
Woodroffe R, Ginsberg JG (2005) King of the beasts? Evidence forguild redundancy among large mammalian carnivores. In: RayJ, Berger J, Redford KH, Steneck R (eds) Large carnivores andbiodiversity: does saving one conserve the other? Island Press,New York, pp 154–176
881


![Snow leopards[1]](https://img.pdfslide.us/doc/110x75/548e7950b47959b3488b479a/snow-leopards1.jpg)
