Embed Size (px)
Citation preview

Do the Maths 2015London’s school places challenge
September 2015

LONDONCOUNCILS 2

3Health & Wellbeing Boards | March 2015
Introduction 4
Analysis of London’s shortfall 5
Pupil growth 5
Capacity 8
Shortfall 9
Funding 13
Special Educational Needs 15
Funding methodology 15
Free schools and demand 17
Conclusion 18
AppendiX 1 19
Contents

LONDONCOUNCILS 44
Introduction
In recent years London’s children, parents, schools and councils have witnessed an unprecedented growth in demand for school places. During the last parliament, London’s pupil population (aged 5-19) increased by 112,000 representing 35 per cent of the overall national pupil growth. Such rapid growth, alongside insufficient funding from the Department for Education and higher costs of creating places in the capital, has compounded London’ school places challenge. Ensuring a child has a good education is a collective effort of different stakeholders across the education system. Local authorities, as part of their duties, have a legal responsibility to secure sufficient school places for children. To fulfil this duty, local authorities closely monitor the supply and demand for places and secure sufficient capacity among schools to meet the needs of their community. This cannot be achieved without the hard work of local school leaders and it is testament to the relationships of London’s schools with London boroughs that there are sufficient school places despite the significant increases in pupil populations. During the last few years primary schools have borne the brunt of the increases, but this demand is now reaching London’s secondary schools. The expansion of secondary schools is more complex than primary schools as they lack the flexibility to add single multifunctional classrooms and often are on tight sites. This will create significant challenges to build new school places to meet rising demand, requiring the status quo to change including how secondary school places are planned.
London Councils, through its series of Do the Maths publications, has been at the forefront of the debate about the school places pressure in London. This publication examines the dual challenge of primary and secondary school place shortages in London over the lifetime of this parliament, 2015 to 2019/20. Our analysis shows:
•London’spupilpopulationissettoincreaseby a further 146,000 representing 26 per cent of the overall national growth between 2015 and 2020.
•Londonneedstocreate113,110newschoolplaces during the lifetime of this parliament – broken down into 78,275 primary 34,835 secondary places. Nationally, 471,000 new school places are needed. London represents 24 per cent, nearly a quarter, of the national shortfall.
•Londonneedsatleast£1.5billionofBasicNeed funding by 2020 to create the new places required, excluding land acquisition costs. With secondary school places in London costing up to twice as much as primary places, and greater numbers of secondary places needed, costs are likely to continue to rise in London.
•TheaveragecapitalcostofaSENDplaceinLondonisover£70,000-threetimesthat of an average secondary place. The Department for Education does not provide capital funding for SEND school places.
•Ofthefreeschoolssetupinthefirstthreeyears (2011 to 2013) of the free schools programme, only 11 (23 per cent) will be in communities in the top 10 per cent of planning areas with the highest need by 2020.
5Do the Maths | September 2015
Analysis of London’s shortfall
Pupil growth
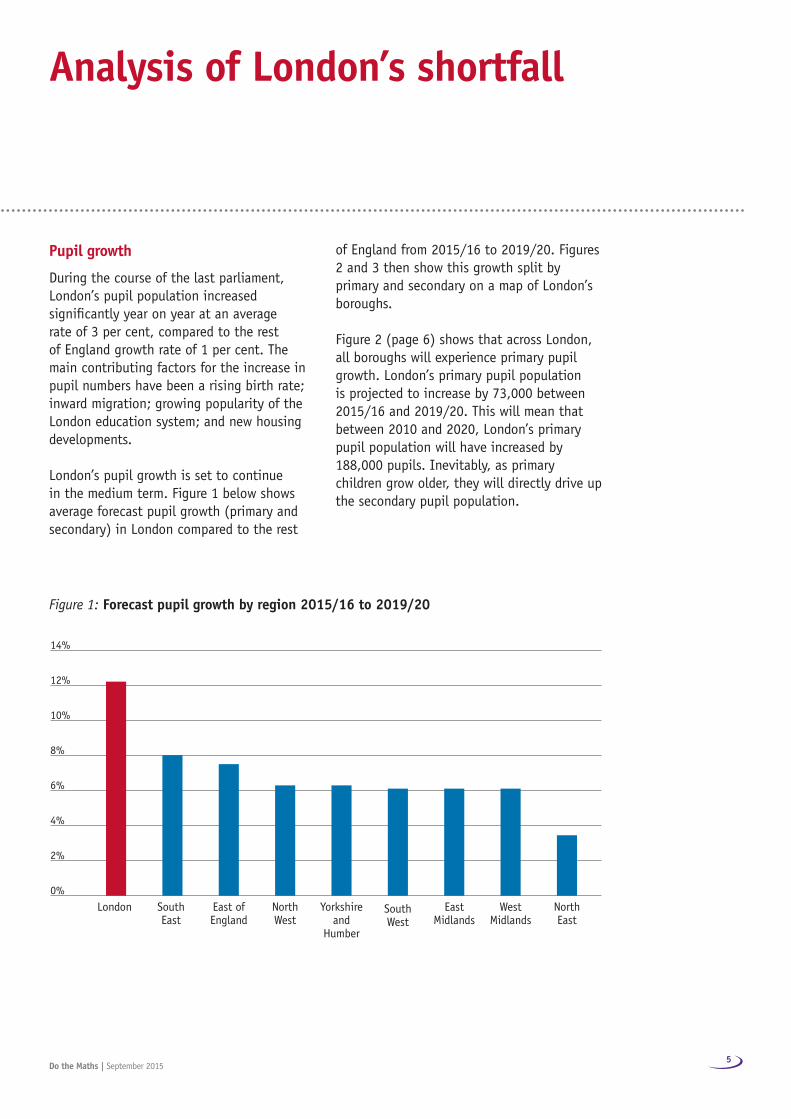
During the course of the last parliament, London’s pupil population increased significantly year on year at an average rate of 3 per cent, compared to the rest of England growth rate of 1 per cent. The main contributing factors for the increase in pupil numbers have been a rising birth rate; inward migration; growing popularity of the London education system; and new housing developments.
London’s pupil growth is set to continue in the medium term. Figure 1 below shows average forecast pupil growth (primary and secondary) in London compared to the rest
of England from 2015/16 to 2019/20. Figures 2 and 3 then show this growth split by primary and secondary on a map of London’s boroughs.
Figure 2 (page 6) shows that across London, all boroughs will experience primary pupil growth. London’s primary pupil population is projected to increase by 73,000 between 2015/16 and 2019/20. This will mean that between 2010 and 2020, London’s primary pupil population will have increased by 188,000 pupils. Inevitably, as primary children grow older, they will directly drive up the secondary pupil population.
Figure 1: Forecast pupil growth by region 2015/16 to 2019/20
14%
12%
10%
8%
6%
4%
2%
0%
London South East
East of England
North West
Yorkshire and
Humber
South West
East Midlands
West Midlands
North East

LONDONCOUNCILS 6
Figure 4 (page 8) shows that London has a higher increase in pupil numbers at all school ages. London accounts for 24 per cent of total growth of secondary pupils in England.
This is significant as secondary schools can cost 50 per cent more per pupil place to build, according to London Councils’ analysis. Secondary schools have larger intakes than primary schools, more space is required for
these schools and subject specific rooms are required as well as specialist equipment that can be expensive to purchase. All of these factors add to costs and construction time, meaning increasing secondary school places cannot be met on the same tight time scales that primary growth has been accommodated.
London Councils is calling for the government to provide long-term surety of funding that
Figure 2: Forecast primary pupil growth map 2015/16 to 2019/20
Harrow
Barnet
Enfield
Southwark
Wandsworth Lambeth
Kingston
Hounslow
Hillingdon
Merton
Sutton Croydon
Bromley
BexleyGreenwich
Lewisham
TowerHamlets
HackneyIslingtonCamden
Haringey WalthamForest
Redbridge
Newham
Havering
Ealing
BrentCity of
Westminster
City Kensington &
Chelsea
andFulham
Hamm
ersmith
Richmond
Barking & Dagenham
Harrow
Barnet
Enfield
Southwark
Wandsworth Lambeth
Kingston
Hounslow
Hillingdon
Merton
Sutton Croydon
Bromley
BexleyGreenwich
Lewisham
TowerHamlets
HackneyIslingtonCamden
Haringey WalthamForest
Redbridge
Newham
Havering
Ealing
Brent
City of
Westminster
City
Kensington &
Chelsea
andFulham
Hamm
ersmith
Richmond
Barking & Dagenham
16.1 - 20%
12.1 - 16%
8.1 – 12%
4.1 - 8.0%
0 - 4%

7Do the Maths | September 2015
Figure 3: Forecast secondary pupil growth map 2015/16 to 2019/20
Harrow
Barnet
Enfield
Southwark
Wandsworth Lambeth
Kingston
Hounslow
Hillingdon
Merton
Sutton Croydon
Bromley
BexleyGreenwich
Lewisham
TowerHamlets
HackneyIslingtonCamden
Haringey WalthamForest
Redbridge
Newham
Havering
Ealing
BrentCity of
Westminster
City Kensington &
Chelsea
andFulham
Hamm
ersmith
Richmond
Barking & Dagenham
is front-loaded. This will allow a greater proportionofBasicNeedfundingear-marked for boroughs to be allocated earlier to support longer term planning, which is particularly important for secondary schools. Such an approach increases the value for money to be achieved from school spending.
While other regions are beginning to experience pupil growth within primary schools, the scale of growth and dual pressure of needing primary as well as secondary schoolplacesisaLondonchallenge.Betweenthe academic years 2015/16 and 2019/20, forecasts show that London’s pupil population is set to increase by a further 146,000 representing 26 per cent of the overall national growth.
Harrow
Barnet
Enfield
Southwark
Wandsworth Lambeth
Kingston
Hounslow
Hillingdon
Merton
Sutton Croydon
Bromley
BexleyGreenwich
Lewisham
TowerHamlets
HackneyIslingtonCamden
Haringey WalthamForest
Redbridge
Newham
Havering
Ealing
Brent
City of
Westminster
City
Kensington &
Chelsea
andFulham
Hamm
ersmith
Richmond
Barking & Dagenham
16.1 - 27%
12.1 - 16%
8.1 – 12%
4.1 - 8.0%
0 - 4%

LONDONCOUNCILS 8
Capacity
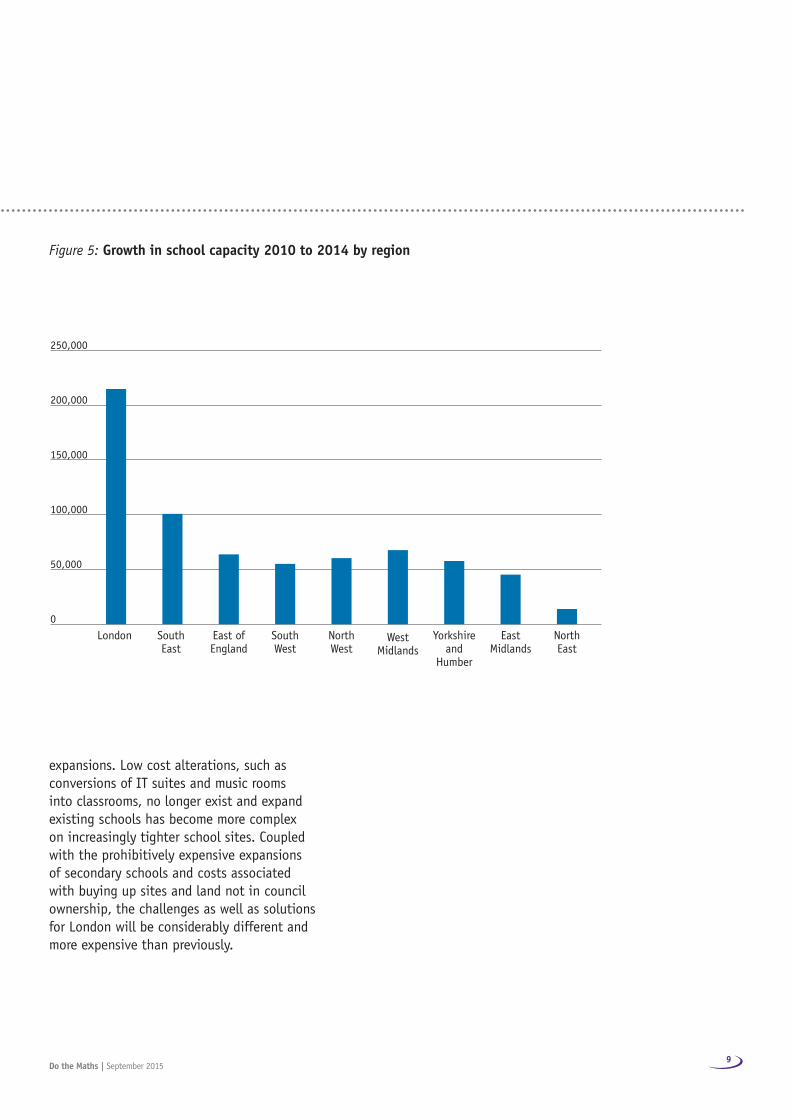
Keeping pace with pupil growth requires a significant expansion of school capacity, which is the number of school places available. London boroughs, with the hard work of school leaders, have managed to build additional school places in areas of need.BetweenMay2010andMay2014,thenumber of school places (Reception to year 13) increased by nearly 213,000 places in London, which accounted for 31 per cent of the overall school capacity growth in England – see figure 5. According to the latest Ofsted data available, of the places created between
2009/10 and 2013/14, a total of 85 per cent were in schools judged good or outstanding by Ofsted, versus 80 per cent for England, demonstrating London boroughs focus on expanding high performing schools.
Overall, a further 10 per cent capacity is needed in the London education system between 2015 and 2020, almost twice as much capacity compared to the rest of England.
However, after five years of creating additional places, many primary schools in London have already undergone several
Figure 4: Forecast increase in pupils in London and England by primary and secondary age
18%
16%
14%
12%
10%
8%
6%
4%
2%
0%
2015/16 2016/17 2017/18 2018/19 2019/20
London Primary
London Secondary
Rest of England Primary
Rest of England Secondary
9Do the Maths | September 2015
Figure 5: Growth in school capacity 2010 to 2014 by region
expansions. Low cost alterations, such as conversions of IT suites and music rooms into classrooms, no longer exist and expand existing schools has become more complex on increasingly tighter school sites. Coupled with the prohibitively expensive expansions of secondary schools and costs associated with buying up sites and land not in council ownership, the challenges as well as solutions for London will be considerably different and more expensive than previously.
250,000
200,000
150,000
100,000
50,000
0
London South East
East of England
South West
North West
West Midlands
Yorkshire and
Humber
East Midlands
North East

LONDONCOUNCILS 10
Shortfall
London Councils has calculated the shortfall of school places year-by-year by comparing the capacity in existing schools with the forecast number of pupils. The shortfall shows how many places will be needed over time in the capital, before funding is taken into account. London Councils’ methodology differs from the Department for Education, as it enables us to take into account fluctuations within a funding period and potential need each year. Further detail that underpins our methodology can be found at Appendix 1.
Nationally, a total of 471,000 new school places are required between 2015 and 2020. BaseduponLondonCouncils’analysis,London’s share of the places needed is 113,000 (covering both primary and secondary school places). This means London represents 24 per cent, nearly a quarter, of the national shortfall during this period. Figure 6 shows a yearly breakdown of the shortfall and split between primary and secondary places need. While the secondary shortfall only makes up a small proportion of places needed in 2015/16
Figure 6: shortfall of pupil places in London schools 2015/16 to 2019/20
2015/16 2016/17 2017/18 2018/19 2019/20 TotalPrimary 13,620 16,814 18,417 16,095 13,329 78,275
Secondary 1,906 3,333 5,481 10,106 14,009 34,835
Total 15,526 20,147 23,898 26,201 27,338 113,110
-30,000
-25,000
-20,000
-15,000
-10,000
-5,000
0
2015/16 2016/17 2017/18 2018/19 2019/20
Secondary
Primary

11Do the Maths | September 2015
compared to primary, by 2019/20 the shortfall at secondary is actually larger than primary. This illustrates the impact that the rapid primary pupil population will not only eat into exist secondary capacity but create a need to build new secondary school places.
To meet the need for new places, London boroughs and schools will need to work together to create capacity within the London education system in areas of need. At primary level, capacity will need to increase by 11 per cent and secondary school capacity will
need to increase by 8 per cent. While these projections take into account confirmed housing developments to date, as further developments are confirmed during the lifetime of this parliament, school capacity will need to be closely monitored.
Figure 9 (over page) shows that, as a proportion of current capacity, the pressure on both primary and secondary school places is much greater in London than in other regions:
Figure 7: Map of primary shortfall
Harrow
Barnet
Enfield
Southwark
Wandsworth Lambeth
Kingston
Hounslow
Hillingdon
Merton
Sutton Croydon
Bromley
BexleyGreenwich
Lewisham
TowerHamlets
HackneyIslingtonCamden
Haringey WalthamForest
Redbridge
Newham
Havering
Ealing
Brent
City of
Westminster
City
Kensington &
Chelsea
andFulham
Hamm
ersmith
Richmond
Barking & Dagenham
16.1 - 22%
12.1 - 16%
8.1 – 12%
4.1 - 8.0%
0 - 4%

LONDONCOUNCILS 12
Figure 9: Shortfall as a percentage of capacity by region
12%
10%
8%
6%
4%
2%
0%
Primary
Secondary
London South East
East of England
East Midlands
North West
South West
Yorkshire and
Humber
West Midlands
NorthEast
Rest of England
Harrow
Barnet
Enfield
Southwark
Wandsworth Lambeth
Kingston
Hounslow
Hillingdon
Merton
Sutton Croydon
Bromley
BexleyGreenwich
Lewisham
TowerHamlets
HackneyIslingtonCamden
Haringey WalthamForest
Redbridge
Newham
Havering
Ealing
Brent
City of
Westminster
City
Kensington &
Chelsea
andFulham
Hamm
ersmith
Richmond
Barking & Dagenham
Figure 8: Map of secondary shortfall
Harrow
Barnet
Enfield
Southwark
Wandsworth Lambeth
Kingston
Hounslow
Hillingdon
Merton
Sutton Croydon
Bromley
BexleyGreenwich
Lewisham
TowerHamlets
HackneyIslingtonCamden
Haringey WalthamForest
Redbridge
Newham
Havering
Ealing
Brent
City of
Westminster
City
Kensington &
Chelsea
andFulham
Hamm
ersmith
Richmond
Barking & Dagenham
16.1 - 20%
12.1 - 16%
8.1 – 12%
4.1 - 8.0%
0 - 4%
13Do the Maths | September 2015
The Department for Education allocates local authorities a grant specifically to create newschoolplaces,whichisknownasBasicNeed funding. Local authorities can use the funding for expanding existing maintained schools, free schools or academies, and establishing new schools. LondonboroughshaveeffectivelyusedBasicNeed funding to expand schools to meet London’s rapid pupil growth. With demand projected to continue to rise, a proportion of London’s schools will reach full capacity and negotiations with head teachers and governors to undertake further expansions will become increasingly challenging across all schools. The local authority is not able to intervene for academies, which account for more than 50 per cent of secondary schools in London, which can limit possibilities and opportunities for meeting demand. The Department for Education has committed to paying 100 per cent of costs for creating new school places needed. The House of Commons Committee of Public Accounts, Department for Education: Capital funding for new school places reported the following: In 2010, the DfE estimated that local authorities would need to contribute 20 per cent of the costs of delivering school places over the spending period to March 2015. During the hearing, the DfE told us that it now estimates it will provide 100 per cent of the funding required over the spending period, so its expectation of local authority contributions has reduced. This commitment from the Department for Education does not reflect the evidence and experience of London boroughs. During 2010/11 and 2014/15, the government
allocated£5billionofBasicNeedfundingtolocal authorities nationally to create school places in areas of need – of which, London received£1.6billion. BasicNeedfundinginLondononlymet59per cent of the total cost to provide school places during 2010 to 2015, not the 100 per cent the Department for Education committed to. Consequently, a 41 per cent funding shortfall needed to be met in order to secure new school places to educate children in London’s state schools. London boroughs, asadirectresultofinsufficientBasicNeedfundingrate,hadtosecure£1billionoffunding to ensure there were sufficient school places. Councils have had to borrow, use asset disposals, maintenance funding and general council funds to meet the needs of their pupils. At the same time, councils have seen a 34 per cent cut in central government funding, which is placing extra pressure on already stretched budgets who have fewer sites available to use for education purposes.
For the period 2015 to 2021 the Department for Education has committed to providing a£7billionBasicNeedfundingpot,whichdoes not account for purchasing land or sites.Atotalof£3.6billionhasalreadybeenallocated to local authorities to create new places between 2015 and 2018, with London receiving£963million.TheLondonallocationis based on a per place cost that is set by the Department for Education, which it expects to cover the cost each new school place required. Table 1 (over page) shows the unit cost paid by the Department for Education for primary and secondary school places in London.
Funding
LONDONCOUNCILS 14
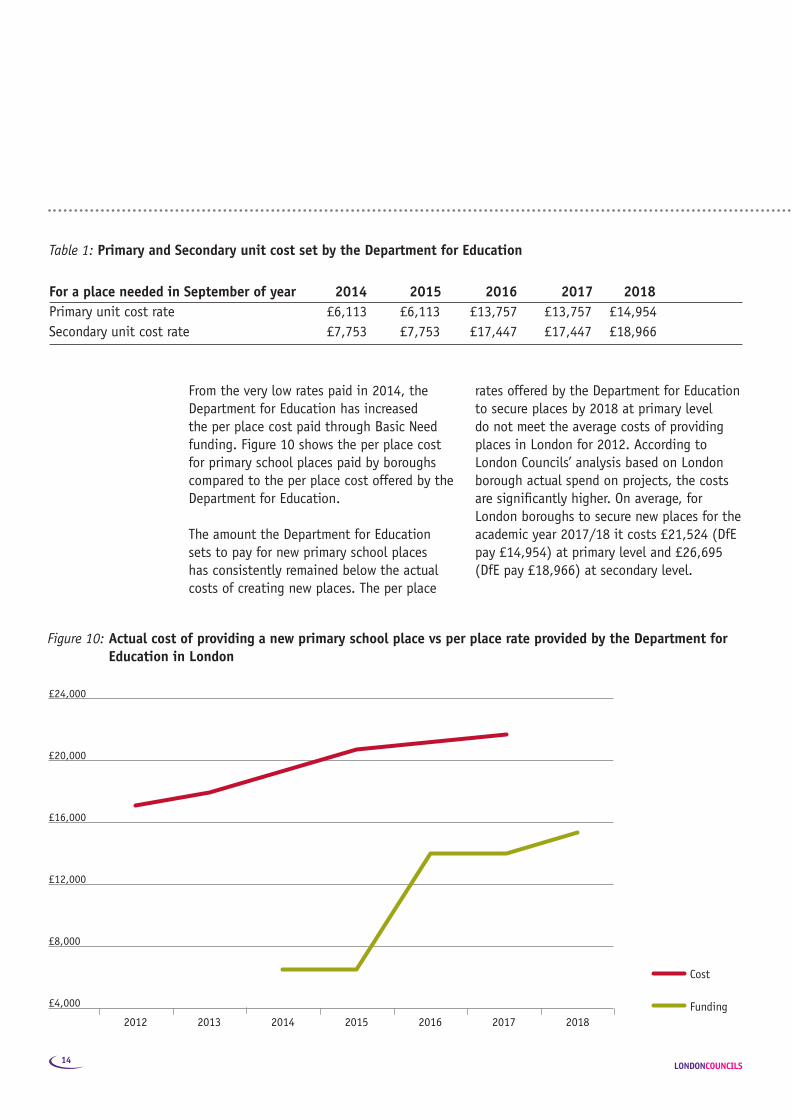
From the very low rates paid in 2014, the Department for Education has increased theperplacecostpaidthroughBasicNeedfunding. Figure 10 shows the per place cost for primary school places paid by boroughs compared to the per place cost offered by the Department for Education.
The amount the Department for Education sets to pay for new primary school places has consistently remained below the actual costs of creating new places. The per place
Table 1: Primary and Secondary unit cost set by the Department for Education
Figure 10: Actual cost of providing a new primary school place vs per place rate provided by the Department for Education in London
For a place needed in September of year 2014 2015 2016 2017 2018Primaryunitcostrate £6,113 £6,113 £13,757 £13,757 £14,954Secondaryunitcostrate £7,753 £7,753 £17,447 £17,447 £18,966
£24,000
£20,000
£16,000
£12,000
£8,000
£4,000
2012 2013 2014 2015 2016 2017 2018
Cost
Funding
rates offered by the Department for Education to secure places by 2018 at primary level do not meet the average costs of providing places in London for 2012. According to London Councils’ analysis based on London borough actual spend on projects, the costs are significantly higher. On average, for London boroughs to secure new places for the academicyear2017/18itcosts£21,524(DfEpay£14,954)atprimaryleveland£26,695(DfEpay£18,966)atsecondarylevel.

15Do the Maths | September 2015
This demonstrates that the funding has not been based on the actual cost of supplying new school places, but on a flawed national assessment by the government of how much funding is available based on a fixed quantum. As the Department for Education rates do not meet the actual costs of provide school places, London faces a funding shortfallofatleast£1.5billion(excludingsite acquisitions) between 2015/16 and 2019/20 to meet the rising demand for school places. London will need 44 per cent of the remaining £3.4billionthattheDepartmentforEducation has to allocate. Without adequate funding the Department for Education will not meet its goal of providing 100 per cent of the cost of places and crucially, within a context of a challenge financial climate for London boroughs, it is unlikely that boroughs will be able to meet the shortfall in funding during this parliament. Without sufficient funding there is a very real risk in London of not being able to secure a school place for every child, particularly given the complex and costly secondary school place expansions needed. Special Educational Needs
Since 2009, London has had consistently higher proportions of Special Educational Needs and Disability (SEND) pupils than nationally. According to the Department for Education, 18.3 per cent of pupils in London have SEND compared to a national figure of 17.9 per cent. Additionally, 23 per cent of post 16 places in London are held foryoungpeoplewithSEND.However,BasicNeed funding does not account for special school places, and there is no separate funding stream for increasing special schools. Additionally, the allocation of funding for
mainstream schools is insufficient to include specialist and flexible provision to promote SEN inclusion in mainstream schools. With the average capital cost of a SEND placeperpupilover£70,000–threetimesthat of an average secondary place – and the increasing demand for these places, it is important the Department for Education recognises this challenge. London Councils believes it is vital the Department for Education funds this provision to enable local authorities to effectively plan for these SEND places. Funding methodology
The Department for Education recently reformed the funding methodology used to allocateBasicNeedfunding.Theyinsertedan assumption in their allocations that, with priorBasicNeedfunding,previousschoolplace projections would have been met and therefore, boroughs present with lower demand in future allocations.
While boroughs have secured a school place for every child, it has not been solely using BasicNeedfundingastheunitcostshavenot been sufficient. The assumption in the methodology penalises the London region, which not only has higher levels of historic growth, when per place rates were very low, but also, as shown in this document, London will be penalised because rates have not been sufficient to cover future costs. Due to this assumption,witheachBasicNeedallocation,there is a significant under-estimation of the money needed in London. It is not helpful or sensible to assume, for instance, boroughs were able to provide all the school places neededin2014withBasicNeedfundingwhen the Department for Education provided aperpupilrateof£6,000whenactualcosts

LONDONCOUNCILS 16
werenearer£16,000.Anyassumptionshouldbe based on the number of places that could becreatedwithBasicNeedfundingbasedonthe actual market per place rates at the time.

17Do the Maths | September 2015
Alongside funding local authorities to secure new places, the Department for Education has a separate budget to specifically set up new schools, known as free schools. There is a target to create 500 new free schools between 2015 and 2020. Free schools, similar to academies, are all ability state funded schools that are directly accountable to the Secretary of State for Education. Free schools are not required to be setupinareasofneed,basedontheBasicNeed definition used by local authorities. The approval of any free school rests with the Department for Education. Between2010and2014/15,atotalof89Free Schools were set up in London. Table 2 shows the different types of schools set up. Basedonthelatestdataavailable,LondonCouncils has compared where mainstream free schools established between 2010 and 2013 have been set up compared to need. In total, of the 48 mainstream schools set up during this period: •27mainstreamfreeschoolsaresetupin
communities where there is a shortfall of less than 30 places as of 2015/16.
•By2020,only11FreeSchools(23percent)
will be in communities in the top 10 per cent of planning areas with the highest need.
Free schools and demand
Table 2: Free Schools set up
The evidence from the first three years of the free schools programme has shown that these schools are not always set up on areas of greatest need in London. Given the school places pressures in London there is an opportunity in the coming five years to better align government planning for investment in new schools with local intelligence of need and community aspiration. London Councils is calling on all free schools set up to be in areas of need.
16 to 19 All- Primary Secondary Grand through Total
16 to 19 6 6AlternativeProvision 1 7 8Mainstream 7 42 21 70Special 3 2 5Grand Total 6 11 42 30 89

LONDONCOUNCILS 18
The school places pressure in London is unlike the pressure in other parts of the country. Not only has London experienced the fastest pupil population growth and severest school places shortfall in the country between 2010 and 2015, this trend is set to continue until at least 2020. Meaning, by the end of this parliamentary period, London will have experienced school places pressure for more than a decade. The efforts of the London boroughs, school governors and head teachers have meant that, despite insufficient support from central government, sufficient additional school places in the capital have been created, mainly in the primary phase. The next period presents a different type of pressure. No longer will pupil growth and shortfalls be confined to primary schools but there will be an acute demand for secondary school places at the same time. Relevant partners across London are committed to working together to plan new secondary provision but this will not succeed without the necessary resource for site acquisition and then building new school places.
Conclusion
It is vital London boroughs receive sufficient BasicNeedfundingtorespondtothispressure. Inadequate funding in the past left Londonboroughswitha£1billionfundingshortfall to plug and, given the additional costs associated with secondary expansion, LondonCouncils’estimatesatleast£1.5billion shortfall needs to be tackled for the period 2015-2020. As the government embarks on the 2015 spending review, a settlement that takes into account London’s school places will be critical to secure a school place for each child. With local government finances being reduced further, London boroughs will not be able to pick up the shortfall.
At the same time, the Department for Education’s commitment to provide 500 free schools can help meet some of the need in London. In order to do so, where free schools are set up will be critical as evidence has shown these schools have not always aligned to areas of greatest need.
•Torecognisetheunprecedentedchallengeofcreating35,000 new secondary places in the capital and the associated site acquisition and building costs.
•TofullyfundtheexpansionofschoolplacesinLondon
byallocatingatleastanadditional£1.5billionofBasicNeedfundingforthetwoyearperiod2018/19to2019/20overandabovethe£963millionalreadyallocated. This funding should be allocated as soon as possible to allow sufficient time to plan of places.
•Committoincreasingtheunitcostsofferedperplaceto ensure they are aligned to the actual costs of providing school places in London.
•Providefundingtosecureplacesinspecialschools
and SEN provision in mainstream schools for children with SEND.
•Ensureallnewfreeschoolsareprioritisedinareasof
need for school places.
London Councils is calling on the Department for Education:

19Do the Maths | September 2015
Appendix 1
Calculating the shortfall in London
The Department for Education calculates shortfall in school places by comparing the capacity in existing schools with the forecast number of pupils for a particular year. Local authorities submit forecasts to the Department for Education. These forecasts project the future pupil populations using the local knowledge within local authority school planning teams. For example, as well as looking at the birth rate, local authorities take into account: •transferrates(i.e.movingschools)•crossboroughin/outmigration-particularly
for faith schools •patternsofintake•popularityandparentalpreferences•earlycaptureofimprovingschoolsand
therefore increasing popularity •accuracyofpastprojections•housingdevelopments. Some local authorities in London also use demographics analysis by the Greater London Authority (GLA) as a basis or comparator to their modelling.
In the past three years forecasts by London boroughs have been 98 per cent accurate. Ideally, shortfall analysis would be done at school level, as this is where the pressures are, and by comparing it at a higher level it is likely the need will be understated as one school with spare capacity would net off another school which needs additional places. Historically, the Department for Education has released the capacity and forecast data at a local authority level. Due to the reasoning above, this has meant that the shortfall has been understated. In the statistics released
on 18 December 2013, the capacity and forecast data are available at planning area level, which enables a much more detailed analysis of need. The Department for Education has now also sent the allocation methodology and workings to each local authority, and we have been able to analyse the methodology in more detail. Unlike the Department for Education, our methodology calculates the shortfall year by year and totals these for the relevant period. This enables us to take account of fluctuations within a funding period and potential need each year. It is also arguably the case that our methodology is on the optimistic side as it assumes an uplift in capacity each year to meet that year’s demand for school places.
Projection period 2015/16 to 2019/20
London Councils has extrapolated local authority forecasts from SCAP underlying data for the final year (2019/20) of the projection period to obtain primary pupil population figures. Existing secondary population figures go up to 2021 requiring no extrapolation to cover the period 2015/16 to 2019/20.

LONDONCOUNCILS 20


London Councils59½ Southwark StreetLondon SE1 0ALwww.londoncouncils.gov.uk020 7934 9813
design: pinsentdesign.comimages: Photofusionpublication date: September 2015