Embed Size (px)
Citation preview
Dissertation
Master in Corporate Finance
Do “The Best Companies to Work” have Higher Stock
Returns?
Mariana Pereira Roque
Leiria, September 2016

This page was intetionally left blank
Dissertation
Master in Corporate Finance
Do “The Best Companies to Work” have Higher Stock
Returns?
Mariana Pereira Roque
Dissertation developed under the supervision of Doctor Maria João da Silva Jorge, professor at the School of Technology and Management of the Polytechnic Institute of Leiria and co-supervision of Doctor Célia Patrício Valente Oliveira, professor at the School of Technology and Management of the Polytechnic Institute of Leiria.
Leiria, September 2016

ii
This page was intetionally left blank

iii
Dedication
“Everything's in the mind. That's where it all starts. Knowing what
you want is the first step toward getting it.”
Mae West
To my family, mom, dad and sisters.
Dedicated to the memory of my grandma, Maria Inácia.

iv
This page was intetionally left blank

v
Acknowledgements
First of all, I would like to thank my family.
To my mom, Maria Teresa, for the unconditional support and love. To my father,
Joaquim Roque, for pride and the concern shown. To my sisters, Ana Teresa and Ana Lúcia,
for the support and sincerity in everything I do.
I have to give a big thanks to my boyfriend, Alexandre Vieira, who helped me
throughout the process to keep me balanced and patient, and didn't let me give up.
Thanks to my classmate, Ana Rita Oliveira. We made it through this journey together
and we finish as aim.
Last but not least, thanks to my guides, Professor Maria Joao Jorge and Celia Oliveira.
This work is also yours. Thanks for the help, the advice and the knowledge that you gave
me.
Thank you, to all of you!

vi
This page was intetionally left blank
vii
Abstract
Do “The Best Companies to Work” have Higher Stock Returns? The main purpose of
this work is to prove the link between job satisfaction and the firm’s value. The «Best
Companies to Work» list give us our measure for job satisfaction. The sample of this work
is composed by firms listed in STOXX Europe 600 Index. We compared the monthly returns
of a portfolio composed by firms present in the «Best Companies to Work» list with two
other benchmark portfolios, using the four-factor model proposed by Carhart (1997), from
January 2010 to December 2014. Our results show that the BCWE600 portfolio outperforms
both benchmark portfolios. In other words, companies classified as Best Companies to Work
generated 0.40%/month and 4.94%/year higher stock returns than their peers over the 2010-
2014 period. Also, the market risk in portfolio BCWE600 is inferior compared to other
portfolios. This work shows that firms with the most satisfied workers get better results,
resulting in higher returns for it’s shareholders.
Keywords: Firm Value, Job Satisfaction, Best Companies To Work, Carhart Model,
Four-Factor Model.

viii
This page was intetionally left blank
ix
Resumo
Será que as “Melhores Empresas para Trabalhar” têm maiores rendibilidades? O
principal objetivo deste trabalho é provar a ligação entre satisfação no trabalho e o valor da
empresa. A nossa forma de medir a satisfação no trabalho utiliza as listas «Melhores
Empresas para Trabalhar». A nossa amostra é constituída por empresas cotadas no índice
STOXX Europa 600. Foram comparadas as rendibilidades mensais, de Janeiro de 2010 a
Dezembro de 2014, de um portfolio constituído por empresas presentes nas listas «Melhores
Empresas para Trabalhar» com dois portfolios benchmark utilizando o modelo dos quatro-
fatores proposto por Carhart (1997). Os resultados obtidos mostram que o portfolio
BCWE600 supera ambos os portfolios benchmark. Ou seja, empresas classificadas como
melhores para trabalhar, no período 2010-2014, originaram maiores rendibilidades,
ascendendo esta diferença a 0.40%/mês e 4.94%/ano, face às restantes empresas no mercado.
Para além de rendibilidades superiores o portfolio BCWE600 apresenta menor risco de
mercado face aos portfolios benchmark. Este trabalho corrobora que empresas com
colaboradores mais satisfeitos alcançam melhores resultados, proporcionando rendibilidades
mais elevadas aos seus acionistas.
Palavras-chave: Valor da Empresa, Satisfação no Trabalho, Melhores Empresas para
Trabalhar, Carhart, Modelo Quatro-Fatores.

x
This page was intetionally left blank
xi
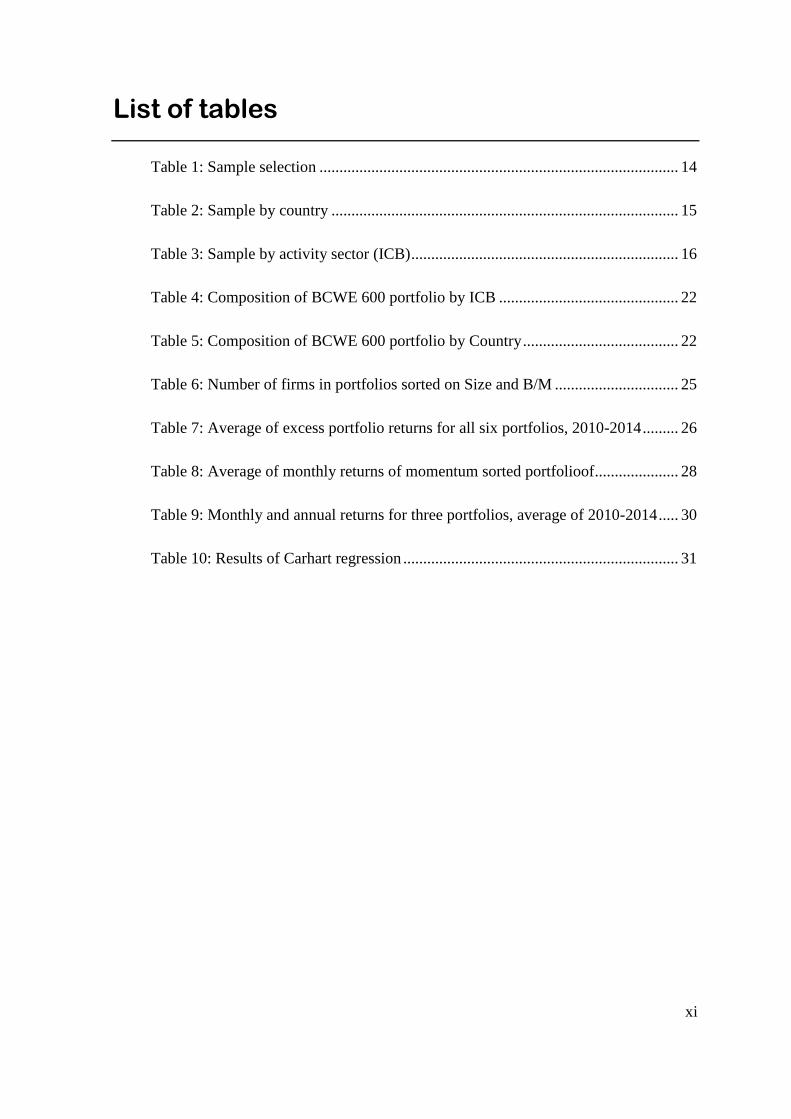
List of tables
Table 1: Sample selection .......................................................................................... 14
Table 2: Sample by country ....................................................................................... 15
Table 3: Sample by activity sector (ICB) ................................................................... 16
Table 4: Composition of BCWE 600 portfolio by ICB ............................................. 22
Table 5: Composition of BCWE 600 portfolio by Country ....................................... 22
Table 6: Number of firms in portfolios sorted on Size and B/M ............................... 25
Table 7: Average of excess portfolio returns for all six portfolios, 2010-2014 ......... 26
Table 8: Average of monthly returns of momentum sorted portfolioof ..................... 28
Table 9: Monthly and annual returns for three portfolios, average of 2010-2014 ..... 30
Table 10: Results of Carhart regression ..................................................................... 31

xii
This page was intetionally left blank

xiii
List of acronyms
OCB – Organisational Citizenship Behaviour
E/P – Earnings-Price Ratio
ICB – Industry Classification Benchmark
FM – Full Market
RM - Reduced Market
BCWE 600 - Best Companies To Work in Europe 600
LRG – Large Company
MID – Medium company
SML – Small company
B/M – Book-To-Market

xiv
This page was intetionally left blank
xv
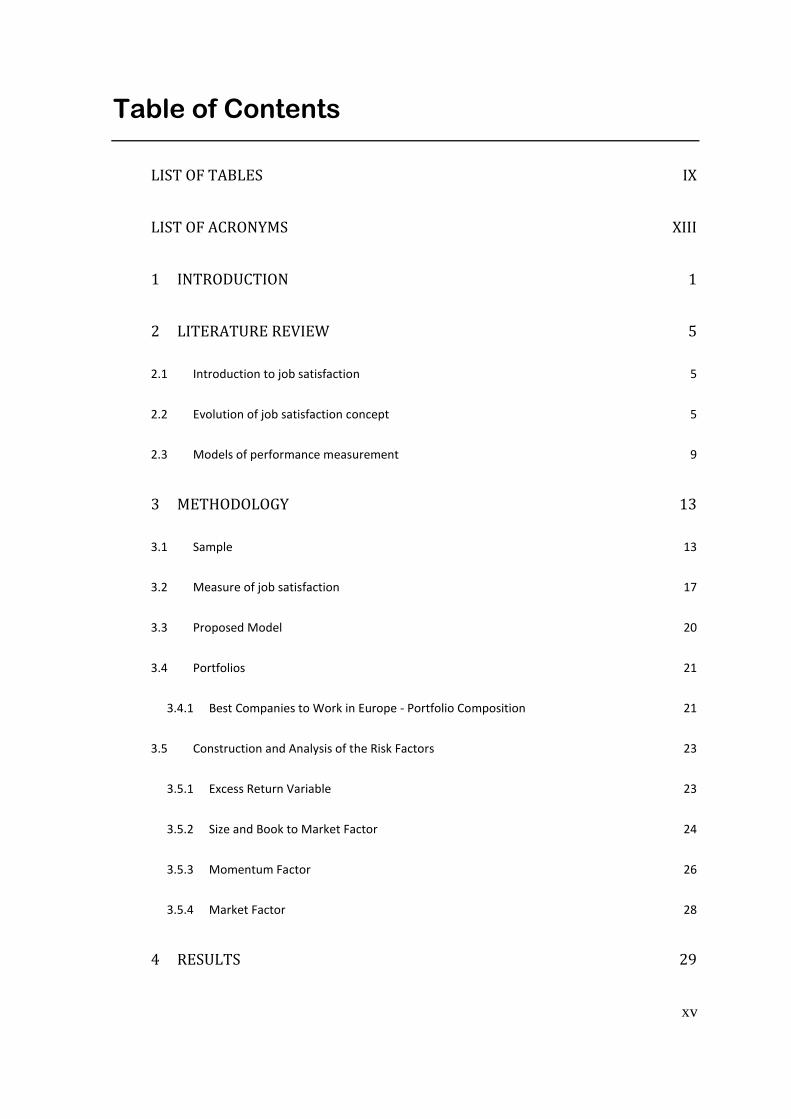
Table of Contents
LIST OF TABLES IX
LIST OF ACRONYMS XIII
1 INTRODUCTION 1
2 LITERATURE REVIEW 5
2.1 Introduction to job satisfaction 5
2.2 Evolution of job satisfaction concept 5
2.3 Models of performance measurement 9
3 METHODOLOGY 13
3.1 Sample 13
3.2 Measure of job satisfaction 17
3.3 Proposed Model 20
3.4 Portfolios 21
3.4.1 Best Companies to Work in Europe - Portfolio Composition 21
3.5 Construction and Analysis of the Risk Factors 23
3.5.1 Excess Return Variable 23
3.5.2 Size and Book to Market Factor 24
3.5.3 Momentum Factor 26
3.5.4 Market Factor 28
4 RESULTS 29
xvi
4.1 Evolution of the yields of portfolios 29
4.2 Carhart regression 30
5 CONCLUSIONS 33
6 REFERENCES 35
7 APPENDICES 41
7.1 Appendix 1 – Composition of the BCWE 600 portfolio 41
7.2 Appendix 2 – Output Gretl Software 43
7.2.1 Dependent variable: EXCESSBCWE600 43
7.2.2 Dependent variable: EXCESSFM 44
7.2.3 Dependent variable: EXCESSRM 45


1
1 Introduction
Landy, (1989, as cited in Edmans, 2012) described the relationship between job
satisfaction and firm value as the “holy grail” of organisational behaviour. It is one of the
most venerable research traditions in industrial-organisational psychology (Judge, Bono,
Thoresen, & Patton, 2001).
The causes and implications of job satisfaction have been debatable issues for many
years. It is believed that the interest in the relationship between job satisfaction and
performance first emerged in studies of Hawthorne in 1933.
Theoretically, higher job satisfaction levels imply higher productivity. However, it is
a very complex relationship. Empirically, it has been difficult to find the relationship
between job satisfaction and performance indicators.
In the 50’s, various meta-analysis about job satisfaction began to emerge. The
investigations that have taken place until the 1990’s have shown weak relationships between
job satisfaction and performance variables (Brayfield & Crockett, 1955; Chapman &
Chapman, 1969; Iaffaldano & Muchinsky, 1985). This meta-analysis had great influence in
the management by the end of the millennium since its conclusions used to deny any
relationship between satisfaction and performance (Jones, 2006; Edmans, 2012).
More positive results have recently appeared (Fulmer, Gerhart, & Scott, 2003;
Harrison, Newman, & Roth, 2006; Talachi, Gorji, & Boerhannoeddin, 2014). Fulmer,
Gerhart and Scott (2003, p.965) conclude that companies on the list «100 Best Companies
to work in America» have more “stable and highly positive workforce attitudes”. Harrison,
Newman, & Roth (2006) found a strong correlation (𝑟 = 0.59) between general job attitude
and individual effectiveness.
The main purpose of this work is to confirm human resource management (HRM)
theories, proving a link between satisfaction and the firm’s value through a financial
methodology. For this, we will compare the monthly returns of a portfolio composed by
firms listed in «Best Companies to Work» with other two benchmark portfolios.
2
It is expected that distinct policies of human resources result in different levels of
satisfaction and value created. In other words: firms with higher job satisfaction levels are
more valuable.
The sample used allows us to understand the link between job satisfaction and the
firm’s value in firms listed, specifically, in the STOXX Europe 600 Index between 2010 and
2014.
Most investigations address job satisfaction with an individual perspective, linking it
to individual performance of the employee (Brayfield & Crockett, 1955; Iaffaldano &
Muchinsky, 1985; Harrison, Newman, & Roth, 2006). We will understand the impact of job
satisfaction in organisational performance, specifically, in firm value. This variable will be
measured by future stock returns.
Generally, the variable job satisfaction is measured by surveys (Ostroff, 1992; Talachi,
Gorji, & Boerhannoeddin, 2014). This paradigm has been change by A. Edmans (2012).
Following its contribution, we will measure job satisfaction by using the lists of “Best
Companies to Work” published by Great Place to Work® Institute.
In this work, we will use the 4-factor model. This model was constructed by Carhart
(1997) using Fama and French (1993) 3-factor model.
Finally, using 4-factor model and variables described before, this work has some
advantages over the others. Firstly, we leave the individual approach because “the market
value takes into account all of the channels through which job satisfaction affects firm value”
(Edmans, 2012, p. 5). It’s not only money, only holidays or only a good boss. Secondly,
using future stock returns we allow the market to take time to recognize the benefits of job
satisfaction and we avoid reverse causality. If we use current stock returns, a high market
value could actually lead to high satisfaction. However, if satisfaction in December was
caused by strong performance during that year, the market value would already be high in
December and so we should not expect high returns in the following year.
After the brief introductory chapter, the remainder of this dissertation consists of four
more chapters. Chapter 2 provides the literature review of job satisfaction concept and their
evolution in the last years. Additionally, we summarize the evolution of models of

3
performance measurement and we refer the work model (4-factor model). In Chapter 3 we
present the main objective and hypothesis of this work, sample and methodology. We will
thoroughly explain the construction of the variables used in the Carhart model. Chapter 4 is
dedicated to the presentation of the empirical results and in Chapter 5 we conclude about
main achievements of this work.

4
5
2 Literature Review
2.1 Introduction to job satisfaction
The concept of job satisfaction has been defined in many ways (Judge & Klinger,
2007). Under previous authors, the most widely used definition is the Locke’s, who
described job satisfaction as "a pleasurable or positive emotional state resulting from the
appraisal of one's job or job experiences" (Locke, 1976, p. 1304).
“Given that a job is a significant part of one's life, the correlation between job and life
satisfaction makes sense ...” (Judge & Klinger, 2007, p. 404). In other words, the work
experiences have always influenced the non-working life.
The impact of job satisfaction in general life satisfaction seems to be unquestionable,
but what about the impact in performance of the employer?
Judge, Bono, Thoresen and Patton (2001) consider that a relationship between job
satisfaction and job performance is one of the most venerable research traditions in
industrial-organisational psychology.
2.2 Evolution of job satisfaction concept
Judge, Bono, Thoresen and Patton (2001) believed that the interest in the link between
attitudes and productivity in the workplace goes back at least as far as the Hawthorne studies.
The Hawthorne effect is even a reference in management and psychology schools. By 1920,
in Hawthorne Works, electrical equipment producer, few studies have been conducted to
systematically explore the impact of environmental factors on the productivity of the
workforce. The workers were divided into groups in different workrooms and they executed
various tasks. The light levels varied from room to room and the productivity of workers
was monitored. “To the surprise of the researchers, even when lighting levels were
decreased, productivity continued to increase” (Macefield, 2007, p. 2).
Elton Mayo was a key member of the research team in Hawthorne. According to him,
the increase in performance is explained by the motivation of workers that resulted from the
6
attention given by their leaders during testing. However, we must take into consideration
that this is “Mayo’s interpretation of the Hawthorne effect” (Draper, 2000).
Nowadays, workers tasks are harder to quantify because times are no longer industrial.
Frederick Winslow Taylor’s system, dated back to 1911, the "incentive-initiative system",
is no longer acceptable: If you give a (financial) incentive to workmen you can expect
“initiative” from him (Blunden, s.d.). Therefore, Kohn (1993) alert to the inefficiency of
incentive’s systems based on outputs.
Job satisfaction began to emerge when extrinsic motivators such as payments and
working conditions became less effective.
In the 50’s some studies and meta-analyses found that there was “surprisingly little
association between individual-level job satisfaction and job or task performance” (Fulmer,
Gerhart, & Scott, 2003, p. 967).
Brayfield and Crockett (1955) reviewed existing literature about job satisfaction to job
performance and to a number of other behavioural outcomes – accidents, absence, and
turnover. Additionally, they concluded that there was little or a non-existent relationship
between job satisfaction and performance, only a correlation of 0.15.
This study is considered “the most influential narrative review of the job satisfaction
job performance relationship” (Judge, Bono, Thoresen, & Patton, 2001, p. 376). However,
their review was limited by the small number of published studies in that time.
Iaffaldano and Muchinsky (1985) meta-analysed 217 correlations from 74 studies and
found a mean correlation of only 0.17 between satisfaction and performance at the individual
level. However, the 0.17 correlation between satisfaction and performance reported by
Iaffaldano and Muchinsky is a correlation between pay, co-worker or promotion satisfaction
and job performance. This approach is not an appropriate estimate of the relationship
between overall job satisfaction and job performance because it violates the independence
assumption (Judge, Bono, Thoresen, & Patton, 2001).
Ostroff (1992) tried to understand if overall level of satisfaction or the attitudes of
employees within organisations was related to organisational performance. This study was
part of a project for the NASSP - National Association of Secondary School Principals. The
7
sample comprised 298 schools from 36 states in the United States of America and Canada.
The authors sent, by email, three types of surveys to each school for principals, teachers and
students. In the end, the usable data was taken from 352 principal’s questionnaires, 13,808
teachers and 24,874 students. In 12 organisational performance indexes, they found
“magnitudes of the zero-order correlations between satisfaction and organisational
performance ranged from 0.11 𝑡𝑜 0.54” (Ostroff, 1992, p. 968).
Fulmer, Gerhart and Scott (2003) compare the companies on the list «100 Best
Companies to Work in America» with two sets of other companies, a matched group and the
broad market. The authors concluded that companies on the list have more “stable and highly
positive workforce attitudes” (Fulmer, Gerhart, & Scott, 2003, p. 965). In addition, these
enterprises have performance advantages over the broad market, for example, ratios like
ROA and market-to-book were better for companies in the list.
Gorton and Schmid (2004, as cited in Addison & Schnabel, 2009) analysed the effect
of codetermination on the economic performance of the firm using financial indicators
(market-to-book ratio of equity and Tobin’s q). But they also examined the effects of
codetermination on company leverage, the wage bill-to-employees ratio, the employee-to-
sales ratio, and the compensation of the management board and the supervisory board. They
concluded that greater employee involvement reduced firm value.
Harrison, Newman and Roth (2006) found a strong correlation (𝑟 = 0.59) between
general job attitude (comprised of job satisfaction and organisational commitment) and
individual effectiveness (a structure based on a broad set of workplace behaviours, including
focal performance, contextual performance, lateness, absenteeism and turnover).
Jones (2006) reinforced the belief there was until the 90's. The relationship between
job satisfaction and performance is an “illusory correlation” (Chapman & Chapman, 1969).
In other words, there is a perceived relationship between satisfaction and performance, "We
logically or intuitively think should interrelate, but, in fact, do not”. (Jones, 2006, p. 21)
Talachi, Gorji and Boerhannoeddin (2014) investigated the relationship between job
satisfaction and Organisational Citizenship Behaviour (OCB). The data was gathered from
154 employees working in industry, mine and trade organisation of Golestan province in
Iran. They found a significant relation between job satisfaction with OCB and its
8
components. Spearman and Pearson’s correlation coefficients were of 0.644 and 0.622,
respectively.
Edmans (2012) points out several difficulties in identifying the relationship between
job satisfaction and firm value variables. According to him, most publications may not show
the true impact of job satisfaction. On the one hand, studies are cross-sectional and positive
correlation could result from reverse causality. For example, an increase in productivity may
not be related to job satisfaction but by other external factors, like payments and work
conditions. On the other hand, studies above use job performance as a dependent variable.
Three problems may result from this. Firstly, they measure job performance at the individual
level and its implications at the firm level are unclear. Secondly, considering organisational
performance, there are many possible dimensions which may influence it and it is difficult
to assign a weight to each one. Thirdly, some performance measures do not take into account
the costs of achieving higher job satisfaction.
Edmans (2012) raised a question of management and human resources with many
years of discussion and tried to relate it, through a financial methodology, with a financial
factor (firm value). This author compared the firm value of «100 Best Companies to Work
for in America» and other companies using the 4-factor model proposed by Carhart (1997)1.
Firm value is obtained by market value (future stock returns) and «Best Companies to Work»
is a proxy for job satisfaction. On the one hand, “the market value takes into account all of
the channels through which job satisfaction affects firm value” (Edmans, 2012, p. 5). It’s not
only money, only holidays or only a good boss. On the other hand, it avoids reverse causality.
If it uses current stock returns, a high market value could actually lead to high satisfaction.
However, if satisfaction in December was caused by strong performance during the year, the
market value would already be high in December and so we should not expect high returns
in the following year. Additionally, by using future stock returns, it gives the market time to
recognize the benefits of job satisfaction.
1 See model description in the 2.3 Section: Models of Performance Measurement
9
In their study, Edmans (2012) concluded that companies listed in the «100 Best
Companies to Work For in America» generated 2.3-3.8%/year higher stock returns than their
peers from 1984-2011.
There aren't many additional studies of job satisfaction related with financial metrics
of firms using financial methodologies. In this way, we will follow Edmans (2012)
contribution and try to understand the phenomenon of job satisfaction in European firms.
The next section, 2.3, discusses the evolution of asset or companies valuation
methodologies.
2.3 Models of performance measurement
The model developed by William Sharpe in 1964 and John Lintner in 1965 – Capital
Asset Pricing Model (CAPM) – was a mark in the history of Models of Performance
Measurement.
The model is defined by:
𝐸(𝑅𝑖) = 𝑅𝑓 + 𝛽𝑖 ∗ [(𝑅𝑀) − 𝑅𝑓]
Where,
𝐸(𝑅𝑖) is the expected return of portfolio /stock i;
𝑅𝑓 is the risk free rate;
𝛽𝑖 is the systematic risk of portfolio i;
(𝑅𝑀) is the market return.
Decades later, CAPM is still used to evaluate the performance of managed portfolio.
However, CAPM presents some problems resulting “of many simplifying assumptions”
(Fama & French, 2004, p. 25) and “has never been an empirical success” (Fama & French,
2004, p. 43).
(1)
10
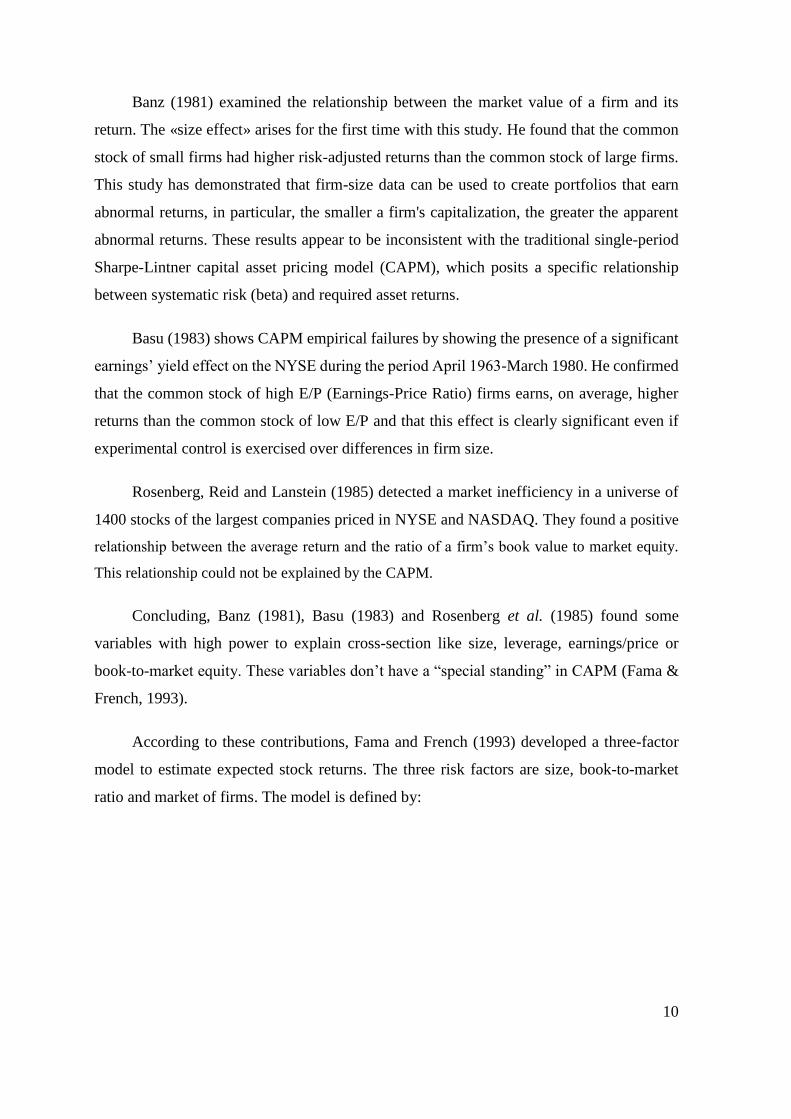
Banz (1981) examined the relationship between the market value of a firm and its
return. The «size effect» arises for the first time with this study. He found that the common
stock of small firms had higher risk-adjusted returns than the common stock of large firms.
This study has demonstrated that firm-size data can be used to create portfolios that earn
abnormal returns, in particular, the smaller a firm's capitalization, the greater the apparent
abnormal returns. These results appear to be inconsistent with the traditional single-period
Sharpe-Lintner capital asset pricing model (CAPM), which posits a specific relationship
between systematic risk (beta) and required asset returns.
Basu (1983) shows CAPM empirical failures by showing the presence of a significant
earnings’ yield effect on the NYSE during the period April 1963-March 1980. He confirmed
that the common stock of high E/P (Earnings-Price Ratio) firms earns, on average, higher
returns than the common stock of low E/P and that this effect is clearly significant even if
experimental control is exercised over differences in firm size.
Rosenberg, Reid and Lanstein (1985) detected a market inefficiency in a universe of
1400 stocks of the largest companies priced in NYSE and NASDAQ. They found a positive
relationship between the average return and the ratio of a firm’s book value to market equity.
This relationship could not be explained by the CAPM.
Concluding, Banz (1981), Basu (1983) and Rosenberg et al. (1985) found some
variables with high power to explain cross-section like size, leverage, earnings/price or
book-to-market equity. These variables don’t have a “special standing” in CAPM (Fama &
French, 1993).
According to these contributions, Fama and French (1993) developed a three-factor
model to estimate expected stock returns. The three risk factors are size, book-to-market
ratio and market of firms. The model is defined by:
11
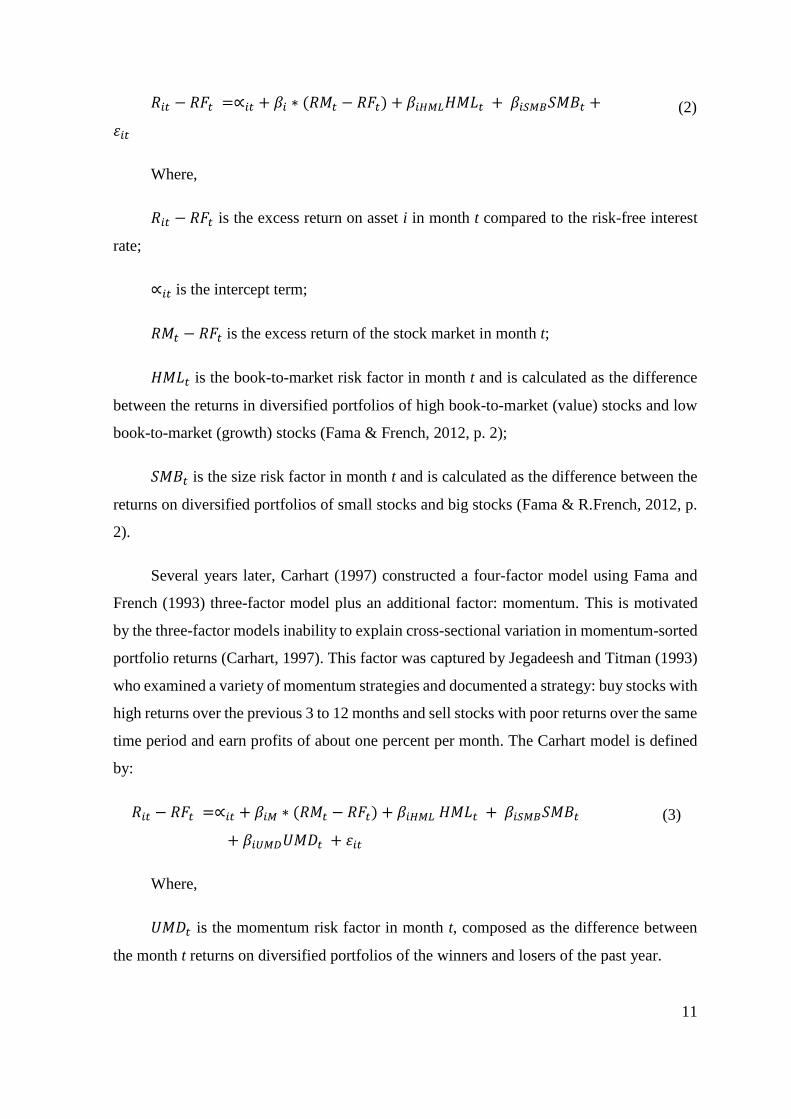
𝑅𝑖𝑡 − 𝑅𝐹𝑡 =∝𝑖𝑡 + 𝛽𝑖 ∗ (𝑅𝑀𝑡 − 𝑅𝐹𝑡) + 𝛽𝑖𝐻𝑀𝐿𝐻𝑀𝐿𝑡 + 𝛽𝑖𝑆𝑀𝐵𝑆𝑀𝐵𝑡 +
𝜀𝑖𝑡
Where,
𝑅𝑖𝑡 − 𝑅𝐹𝑡 is the excess return on asset i in month t compared to the risk-free interest
rate;
∝𝑖𝑡 is the intercept term;
𝑅𝑀𝑡 − 𝑅𝐹𝑡 is the excess return of the stock market in month t;
𝐻𝑀𝐿𝑡 is the book-to-market risk factor in month t and is calculated as the difference
between the returns in diversified portfolios of high book-to-market (value) stocks and low
book-to-market (growth) stocks (Fama & French, 2012, p. 2);
𝑆𝑀𝐵𝑡 is the size risk factor in month t and is calculated as the difference between the
returns on diversified portfolios of small stocks and big stocks (Fama & R.French, 2012, p.
2).
Several years later, Carhart (1997) constructed a four-factor model using Fama and
French (1993) three-factor model plus an additional factor: momentum. This is motivated
by the three-factor models inability to explain cross-sectional variation in momentum-sorted
portfolio returns (Carhart, 1997). This factor was captured by Jegadeesh and Titman (1993)
who examined a variety of momentum strategies and documented a strategy: buy stocks with
high returns over the previous 3 to 12 months and sell stocks with poor returns over the same
time period and earn profits of about one percent per month. The Carhart model is defined
by:
𝑅𝑖𝑡 − 𝑅𝐹𝑡 =∝𝑖𝑡 + 𝛽𝑖𝑀 ∗ (𝑅𝑀𝑡 − 𝑅𝐹𝑡) + 𝛽𝑖𝐻𝑀𝐿 𝐻𝑀𝐿𝑡 + 𝛽𝑖𝑆𝑀𝐵𝑆𝑀𝐵𝑡
+ 𝛽𝑖𝑈𝑀𝐷𝑈𝑀𝐷𝑡 + 𝜀𝑖𝑡
Where,
𝑈𝑀𝐷𝑡 is the momentum risk factor in month t, composed as the difference between
the month t returns on diversified portfolios of the winners and losers of the past year.
(2)
(3)

12
In the next chapter we will present the methodology used in this study, including the
sample, time horizon, hypothesis and statistical model.
13
3 Methodology
The main purpose of this work is to prove the link between job satisfaction and the
firm’s value.
For this, we will compare the monthly returns of a portfolio composed by firms present
in the «Best Companies to Work» list with two other benchmark portfolios using the four-
factor model proposed by Carhart (1997).
Our hypothesis is «firms with higher job satisfaction levels are more valuable» and it
takes into account companies listed in STOXX Europe 600 Index.
The period used to develop this work is from January 2010 to December 2014, five
years, sixty months. Using a time series analysis, we have sixty observations for each firm.
3.1 Sample
The initial sample consists of all firms listed in the STOXX Europe 600 Index.
The index is derived by STOXX Europe Total Market Index (TMI) and part of STOXX
Global 1800 Index. The STOXX Global 1800 derived benchmark indices are designed to
provide a broad yet investable representation of the world's developed markets of Europe,
North America and Asia/Pacific, represented by the STOXX Europe 600, the STOXX North
America 600 and the STOXX Asia/Pacific 600 indices, respectively.
With a fixed number of 600 components, this index represents large, mid and small
capitalization firms across 18 countries of the European region: Austria, Belgium, Czech
Republic, Denmark, Finland, France, Germany, Greece, Ireland, Italy, Luxembourg, the
Netherlands, Norway, Portugal, Spain, Sweden, Switzerland and the United Kingdom
(STOXX® Europe 600, s.d.).
However, several criterial must be considered to get a correct sample to apply the
methodology:
1. Companies that have been listed in the STOXX Europe 600 Index over 5 years
in analysis;
14
2. Companies that have all required data available in DataStream Database
(database used for data collection);
a. Monthly stock prices for the analysis period and for the previous twelve
months;
b. Market capitalization for the analysis period and for December of 2009;
c. Book-to-Market for the analysis period and for December of 2009;
3. Companies with positive book-to-market.
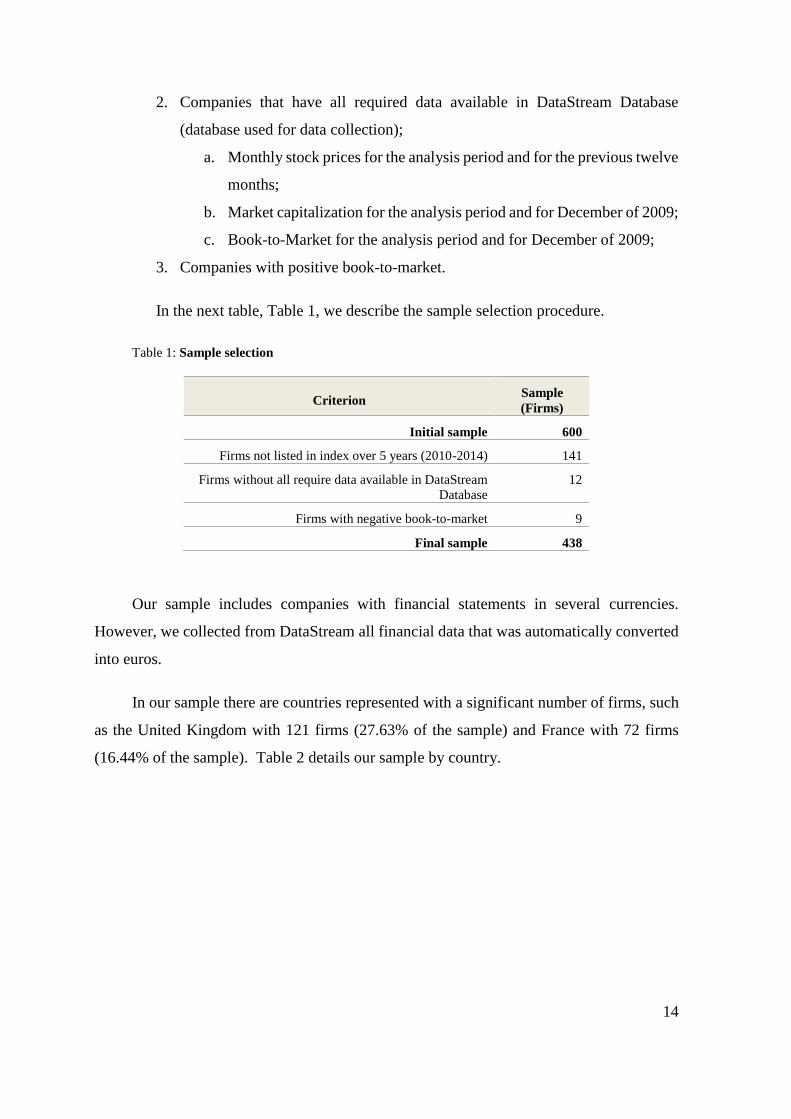
In the next table, Table 1, we describe the sample selection procedure.
Table 1: Sample selection
Criterion Sample
(Firms)
Initial sample 600
Firms not listed in index over 5 years (2010-2014) 141
Firms without all require data available in DataStream
Database
12
Firms with negative book-to-market 9
Final sample 438
Our sample includes companies with financial statements in several currencies.
However, we collected from DataStream all financial data that was automatically converted
into euros.
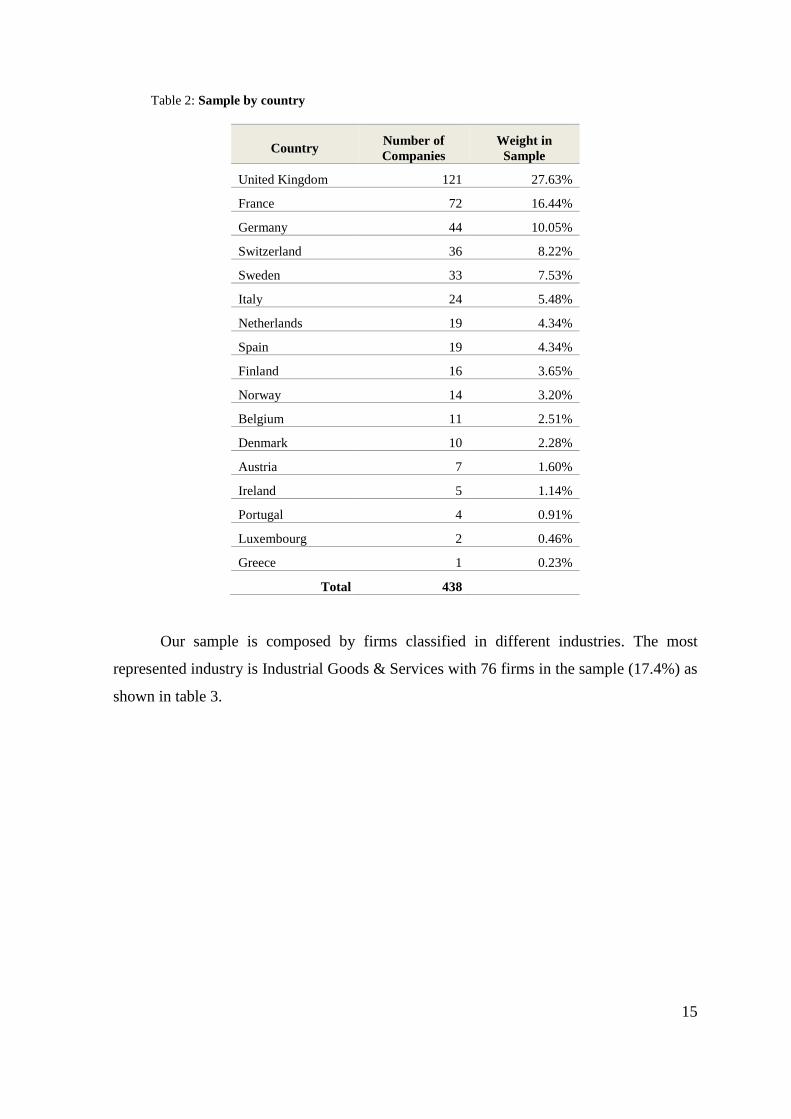
In our sample there are countries represented with a significant number of firms, such
as the United Kingdom with 121 firms (27.63% of the sample) and France with 72 firms
(16.44% of the sample). Table 2 details our sample by country.
15
Table 2: Sample by country
Country Number of
Companies
Weight in
Sample
United Kingdom 121 27.63%
France 72 16.44%
Germany 44 10.05%
Switzerland 36 8.22%
Sweden 33 7.53%
Italy 24 5.48%
Netherlands 19 4.34%
Spain 19 4.34%
Finland 16 3.65%
Norway 14 3.20%
Belgium 11 2.51%
Denmark 10 2.28%
Austria 7 1.60%
Ireland 5 1.14%
Portugal 4 0.91%
Luxembourg 2 0.46%
Greece 1 0.23%
Total 438
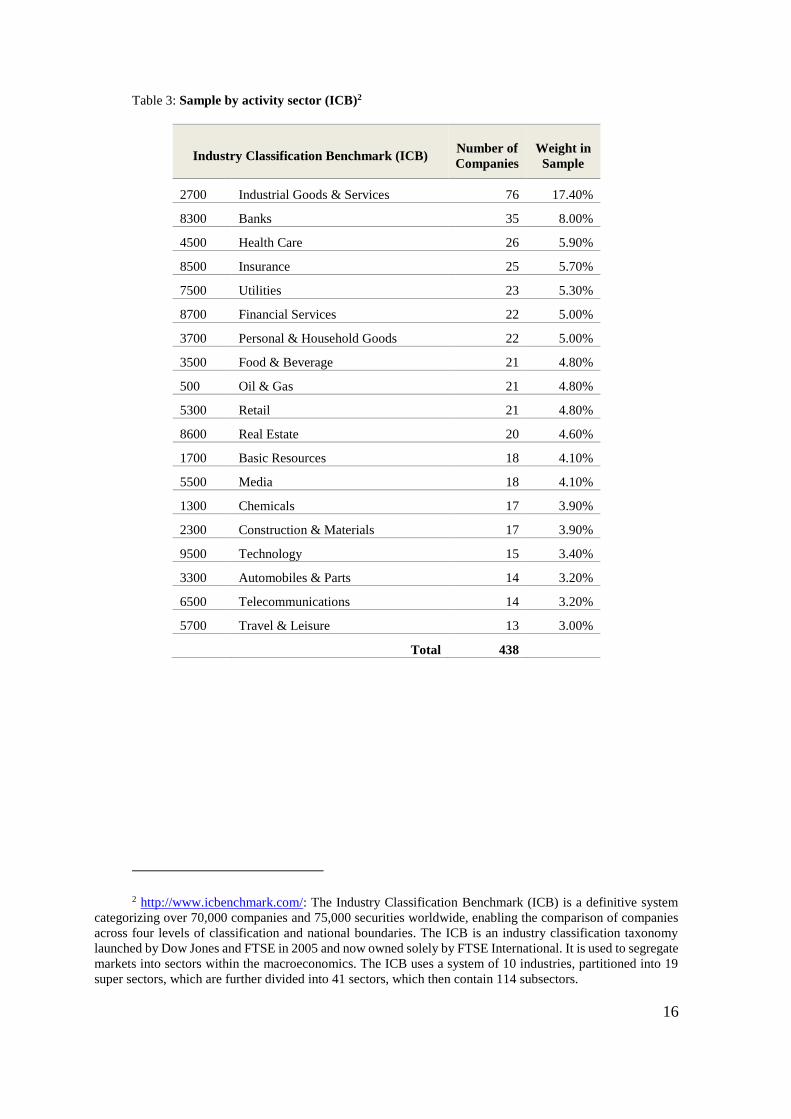
Our sample is composed by firms classified in different industries. The most
represented industry is Industrial Goods & Services with 76 firms in the sample (17.4%) as
shown in table 3.
16
Table 3: Sample by activity sector (ICB)2
Industry Classification Benchmark (ICB) Number of
Companies
Weight in
Sample
2700 Industrial Goods & Services 76 17.40%
8300 Banks 35 8.00%
4500 Health Care 26 5.90%
8500 Insurance 25 5.70%
7500 Utilities 23 5.30%
8700 Financial Services 22 5.00%
3700 Personal & Household Goods 22 5.00%
3500 Food & Beverage 21 4.80%
500 Oil & Gas 21 4.80%
5300 Retail 21 4.80%
8600 Real Estate 20 4.60%
1700 Basic Resources 18 4.10%
5500 Media 18 4.10%
1300 Chemicals 17 3.90%
2300 Construction & Materials 17 3.90%
9500 Technology 15 3.40%
3300 Automobiles & Parts 14 3.20%
6500 Telecommunications 14 3.20%
5700 Travel & Leisure 13 3.00%
Total 438
2 http://www.icbenchmark.com/: The Industry Classification Benchmark (ICB) is a definitive system
categorizing over 70,000 companies and 75,000 securities worldwide, enabling the comparison of companies
across four levels of classification and national boundaries. The ICB is an industry classification taxonomy
launched by Dow Jones and FTSE in 2005 and now owned solely by FTSE International. It is used to segregate
markets into sectors within the macroeconomics. The ICB uses a system of 10 industries, partitioned into 19
super sectors, which are further divided into 41 sectors, which then contain 114 subsectors.
17
3.2 Measure of job satisfaction
Following the contribution of Edmans (2012) we will measure job satisfaction using a
list published by Great Place to Work ® Institute. This project emerges in 1981 with a
challenge posed by a New York editor to two business journalists, Robert Levering and
Milton Moskowitz. The first list, «100 Best Companies to Work in America» was published
in 1984 by these journalists and since 1998 it has been published in the January issue of
Fortune magazine each year. Later, in 1997, Fortune (in the United States) and Exame (in
Brazil) partnered with the Institute’s research and produced the world’s first «100 Best
Companies to Work». Great Place to Work ® Institute gradually emerged in 45 countries
around the world with more growth slated in the coming years (Great Place To Work
Institute, n.d. a).
In the institute’s website it is possible to obtain many information about their approach
of job satisfaction. Trust is the central issue. For them, “trust is the defining principle of great
workplaces”. On the one hand, the employee's perspective of the best place to work is a place
where they TRUST the people they work for, where they have PRIDE in what they do and
ENJOY the people they work with. On the other hand, the manager’s perspective of the best
place to work is where they achieve organisational OBJECTIVES with employees who give
their personal BEST and work together as a TEAM / FAMILY in an environment of TRUST.
Great Place to Work ® Institute created a survey that measures the behaviours and the
environment of companies. There are two points to take into account to measure the level of
trust in the organisation: the culture of the organisation and the characteristics of the
workplace.
The level of trust is measured by the Trust Index© survey and the characteristics of
the company by the Culture Audit© (Great Place to Work Institute, n.d. c).
No one better to evaluate a workplace than their employees! In this way, two-thirds of
the score are based on anonymous feedback of employees – Trust Index Employee Survey.
This assessment is focused on measuring the behaviours that lead to a trusting workplace
environment. The survey asks employees about behaviours that measure the way in which
credibility, respect and fairness are expressed in the workplace. It also collects data about
18
the levels of pride and camaraderie in the organisational environment (Great Place To Work
Institute, n.d. b).
Most of the questions follow the Likert scale using ratings of a 1-5 scale. In addition,
employees answer two open-ended questions (Edmans, 2012).
Finally, one-third of total assessment is measured by the Culture Audit – Management
Questionnaire, which is generally filled out by human resources department and top
management. This tool provides insight into organisation's value system, programs and
practices. It is divided into two parts. Part I includes employee and company demographics
data, for example, number of employees, voluntary turnover, ethnic breakdowns, tenure,
year of company foundation and financial revenues. Other questions include the benefits and
perks that they offer to employees, for example, percentage of premium insurance paid by
the company for the employee and holidays. Part 2 contains some open-ended questions,
providing the company an opportunity to share their philosophy and practices in areas such
as hiring, communication, employee development, and company celebrations.
The questionnaires are not published. However, the Institute kindly provided them for
Edmans paper in 2012 and it presents examples of questions used by the survey. According
to him, it includes questions such as: diversity (proportion of women and minorities in senior
positions), turnover (voluntary, involuntary, and retirements), compensation (average cash
compensation, retirement benefits, employee stock ownership plans, stock options, profit
sharing), benefits (healthcare, training, on-site perks), time off (paid vacations, sabbaticals,
community involvement) and work-family issues (parental leave, child care).
Are the «Best Companies to Work» lists the best way to measure job satisfaction? The
Best Companies list has advantages as a measure of firm-level job satisfaction. First, it is
available for many years which includes recessions and booms periods. In other words, this
tool gives us longer time series than those used in most previous literature (generally one or
two years). This factor helps to ensure that the results are not influenced by a specific period
or market conditions. Second, most studies about job satisfaction have focused on individual
dimensions, but using the Best Companies list we can measure overall job satisfaction, which
involve surveying several dimensions.

19
However, the list has some limitations. The list results of two different assessments,
by employee and by management. In the end, the score is not a pure measure of job
satisfaction by employees because 1/3 comes from management questionnaire. If both
responses are correlated it’s not a problem. On the other hand, management responses can
have advantages to the list (Blasi & Kruse, 2012): managers may be aware of workplace
benefits that the employee is unaware of because they haven’t benefited from them yet.
Additionally, there are factors unknown to employees, like turnover, that provide a more
accurate overall picture of the organisation. Another limitation is that the Great Place to
Work Institute does not survey all companies. Firms must apply to be considered for the list.
Nevertheless, the lists published by Great Place to Work ® Institute have been used in
previous years by many authors. Fulmer, Gerhart and Scott (2003) use the list «100 Best
Companies to Work in America» to prove that positive employee relations serve as an
intangible asset and a source of sustained competitive advantage. Filbeck and Preece (2003)
examine the market reaction to the announcement by Fortune of the «Best 100 Companies
to Work for in America». They found a statistically significant positive response to the
announcement. In addition, they found that these firms generally outperform the matched
sample of companies. Edmans (2011) and Edmans (2012) used the list «100 Best Companies
to Work in America» to create portfolios (applied in the 4-factor model proposed by Carhart
(1997)) and connect job satisfaction and firm stock returns.
Can a list divulgation influence the stock value? Can it influence a shareholder to buy
assets of a company known as a best place to work?
According to Edmans (2012) it is arguably the most respected and prominent measure
of job satisfaction available. As a result, it receives significant attention from shareholders,
management, employees, and the media.
20
3.3 Proposed Model
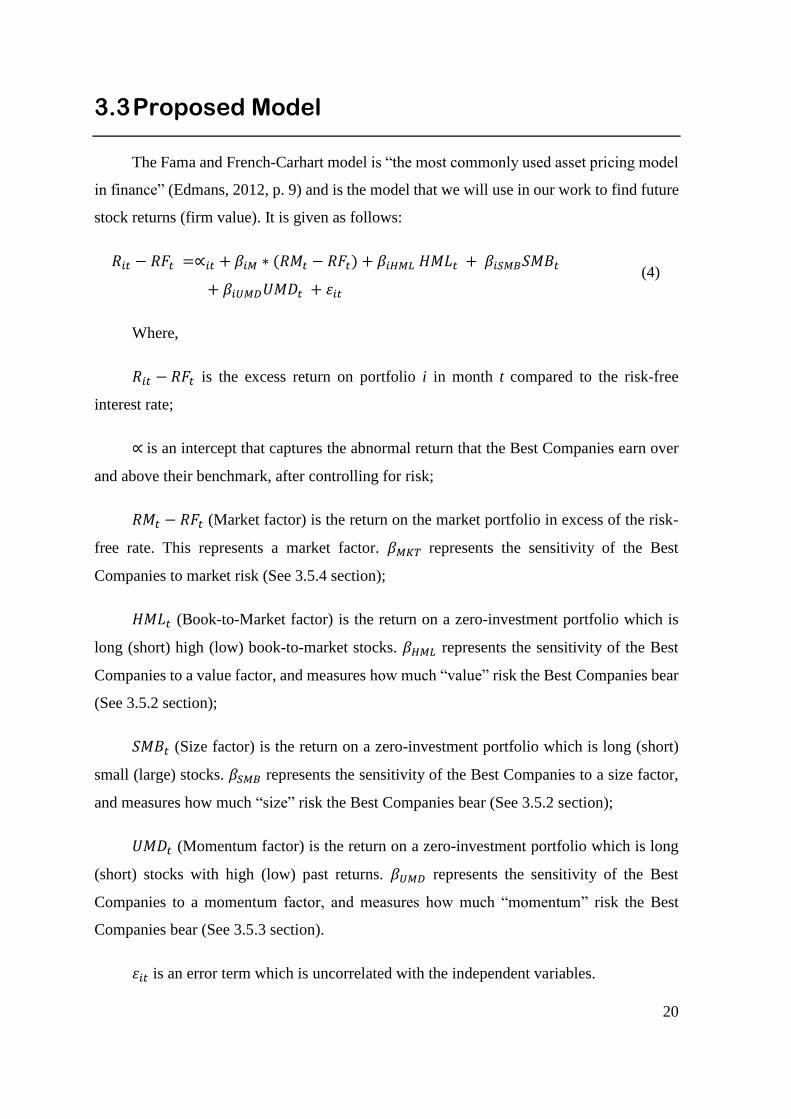
The Fama and French-Carhart model is “the most commonly used asset pricing model
in finance” (Edmans, 2012, p. 9) and is the model that we will use in our work to find future
stock returns (firm value). It is given as follows:
𝑅𝑖𝑡 − 𝑅𝐹𝑡 =∝𝑖𝑡 + 𝛽𝑖𝑀 ∗ (𝑅𝑀𝑡 − 𝑅𝐹𝑡) + 𝛽𝑖𝐻𝑀𝐿 𝐻𝑀𝐿𝑡 + 𝛽𝑖𝑆𝑀𝐵𝑆𝑀𝐵𝑡
+ 𝛽𝑖𝑈𝑀𝐷𝑈𝑀𝐷𝑡 + 𝜀𝑖𝑡
Where,
𝑅𝑖𝑡 − 𝑅𝐹𝑡 is the excess return on portfolio i in month t compared to the risk-free
interest rate;
∝ is an intercept that captures the abnormal return that the Best Companies earn over
and above their benchmark, after controlling for risk;
𝑅𝑀𝑡 − 𝑅𝐹𝑡 (Market factor) is the return on the market portfolio in excess of the risk-
free rate. This represents a market factor. 𝛽𝑀𝐾𝑇 represents the sensitivity of the Best
Companies to market risk (See 3.5.4 section);
𝐻𝑀𝐿𝑡 (Book-to-Market factor) is the return on a zero-investment portfolio which is
long (short) high (low) book-to-market stocks. 𝛽𝐻𝑀𝐿 represents the sensitivity of the Best
Companies to a value factor, and measures how much “value” risk the Best Companies bear
(See 3.5.2 section);
𝑆𝑀𝐵𝑡 (Size factor) is the return on a zero-investment portfolio which is long (short)
small (large) stocks. 𝛽𝑆𝑀𝐵 represents the sensitivity of the Best Companies to a size factor,
and measures how much “size” risk the Best Companies bear (See 3.5.2 section);
𝑈𝑀𝐷𝑡 (Momentum factor) is the return on a zero-investment portfolio which is long
(short) stocks with high (low) past returns. 𝛽𝑈𝑀𝐷 represents the sensitivity of the Best
Companies to a momentum factor, and measures how much “momentum” risk the Best
Companies bear (See 3.5.3 section).
𝜀𝑖𝑡 is an error term which is uncorrelated with the independent variables.
(4)

21
3.4 Portfolios
As mentioned before, we will use the 4-factor model to compare the monthly returns
of a portfolio composed by firms present in the «Best Companies to Work» list with two
other benchmark portfolios. Therefore, we need to create three portfolio, as described below:
1. Full market (FM) portfolio is constituted by the whole sample: all firms listed
in the STOXX Europe 600 Index between 2010 and 2015. This portfolio is
composed by 438 firms (see section 3.1).
2. Best Companies To Work in Europe 600 (BCWE600) portfolio is
constituted by firms in our sample that are classified as the best companies to
work at least once in the period under review, as published by Great Place to
Work® Institute (see section 3.4.1). Note that we only consider European lists.
This portfolio is composed by 45 firms.
3. Reduced market (RM) portfolio is the whole sample except those firms
included in the BCWE600 portfolio, so it includes 393 firms.
3.4.1 Best Companies to Work in Europe - Portfolio
Composition
We use the «Best Companies to Work» lists to create one of three portfolios to prove
that firms with higher levels of job satisfaction are more valuable. Through the site of Great
Place to Work ® Institute we identified which firms in our sample were classified as the best
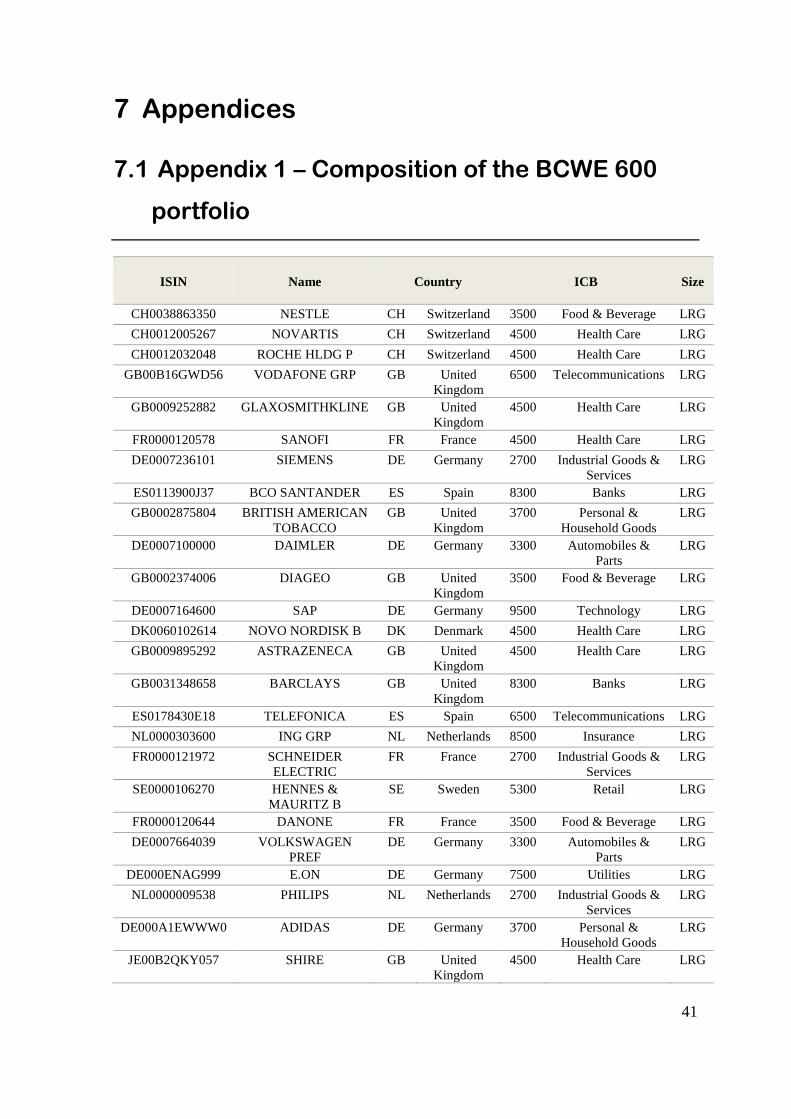
companies to work. In Appendix 1 all companies that constitute the portfolio of best
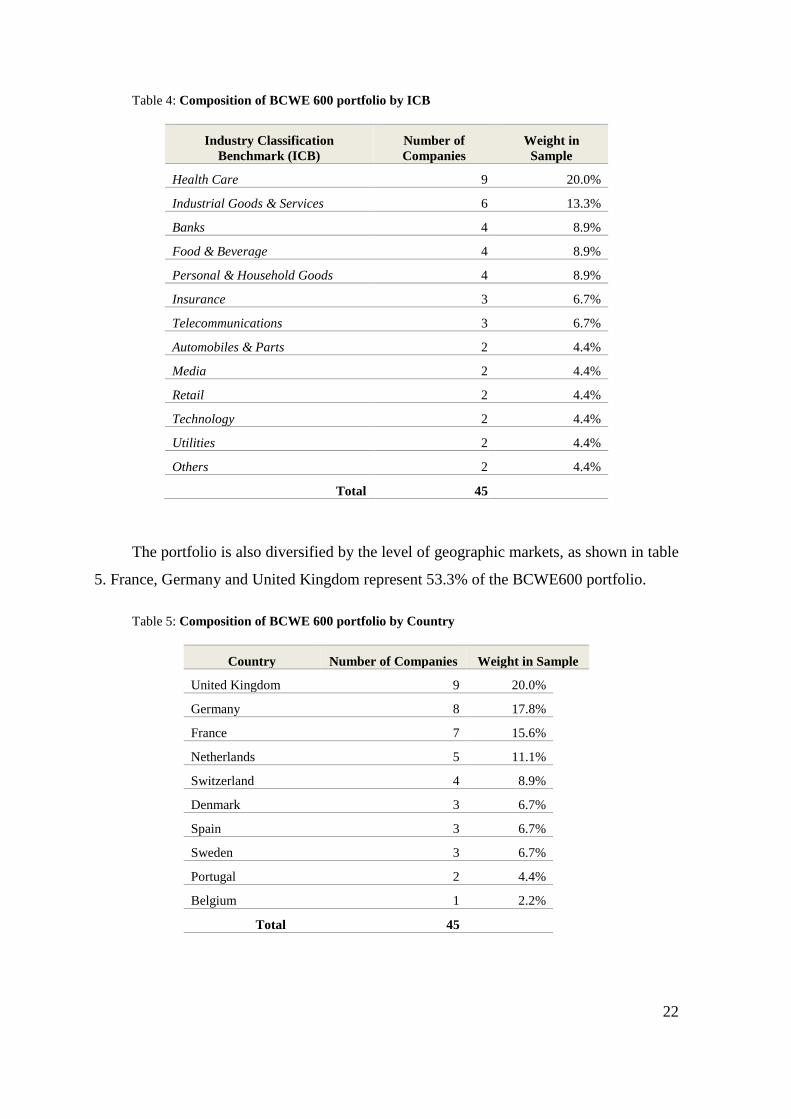
companies to work in Europe (BCWE600 are identified). Table 4 summarizes the
composition of the portfolio by industry sector. Health Care, Industrial Goods & Services
and Banks represent 42.2% of the BCTWE600 portfolio.
22
Table 4: Composition of BCWE 600 portfolio by ICB
Industry Classification
Benchmark (ICB)
Number of
Companies
Weight in
Sample
Health Care 9 20.0%
Industrial Goods & Services 6 13.3%
Banks 4 8.9%
Food & Beverage 4 8.9%
Personal & Household Goods 4 8.9%
Insurance 3 6.7%
Telecommunications 3 6.7%
Automobiles & Parts 2 4.4%
Media 2 4.4%
Retail 2 4.4%
Technology 2 4.4%
Utilities 2 4.4%
Others 2 4.4%
Total 45
The portfolio is also diversified by the level of geographic markets, as shown in table
5. France, Germany and United Kingdom represent 53.3% of the BCWE600 portfolio.
Table 5: Composition of BCWE 600 portfolio by Country
Country Number of Companies Weight in Sample
United Kingdom 9 20.0%
Germany 8 17.8%
France 7 15.6%
Netherlands 5 11.1%
Switzerland 4 8.9%
Denmark 3 6.7%
Spain 3 6.7%
Sweden 3 6.7%
Portugal 2 4.4%
Belgium 1 2.2%
Total 45
23
3.5 Construction and Analysis of the Risk Factors
Fama and French (1993) offer an extensive database for different portfolio dimensions
and characteristics, including all factors required to compute the multifactor model output3.
However, there is no European database available on their website. In this sense, we
manually compute all four factors for every month (t=60). We will following explain the
procedure.
3.5.1 Excess Return Variable
Excess return variable (𝑅𝑖𝑡 − 𝑅𝐹𝑡) is the excess return on portfolio i in month t
compared to the risk-free rate.
This variable was calculated for the three portfolios, as we explained in section 3.4:
Full Market (FM), Best Companies To Work in Europe 600 (BCWE600) and Reduced
Market (RM).
For each portfolio, we calculated a value-weighted monthly return minus the risk-free
rate. Following Carhart (1997) we choose the one month Euribor rate as the free rate proxy.
𝑅𝑖𝑡 − 𝑅𝐹𝑡 = ∑ 𝑊𝑗,𝑡𝑗=𝑛𝑗=1 × 𝑅𝑗,𝑡 − 𝐸𝑢𝑟𝑖𝑏𝑜𝑟 1𝑀𝑡 (5)
R i,t is the value-weighted monthly return of portfolio i in month t;
R j,t is the monthly return of stock j in month t;
W j,t: is the weight of each stock j belonging to the portfolio i in month t;
n: is the number of stocks of portfolio i.
Following Fama and French (1993) explanations, all stock returns are not continuously
compounded and they are calculated using the formula below:
𝑅 𝑗,𝑡 =𝑃𝑗,𝑡−𝑃𝑗,𝑡−1
𝑃𝑗,𝑡−1 (6)
3 http://mba.tuck.dartmouth.edu/pages/faculty/ken.french/
24
Where P is the stock price in euros and was obtained in DataStream Database.
The weight of each stock j in portfolio i in month t (W j,t) was determined by market
capitalization. We compared the market value of stock j with the sum of total portfolio
market value. The market value of firms in euros was obtained in DataStream Database.
The Euribor rate was obtained in DataStream. To compare the Euribor rate with the
monthly weighted returns we calculated the monthly equivalent rate as follows:
(1 + 𝑎𝑛𝑛𝑢𝑎𝑙 𝑟𝑎𝑡𝑒) = (1 + 𝑚𝑜𝑛𝑡ℎ𝑙𝑦 𝑟𝑎𝑡𝑒)12 (7)
3.5.2 Size and Book to Market Factor
To calculate the book-to-market factor (𝐻𝑀𝐿𝑡) and the size factor (𝑆𝑀𝐵𝑡) we ranked
all stocks according to their size (market capitalization) and their book-to-market ratio.
The median market capitalization value was used to divide stocks into two groups:
stocks with small (S) capitalization and stocks with big (B) capitalization.
Also, the book-to-market ratio was used to divide stocks into three groups: stocks with
low (L) (bottom 30%), medium (M) (middle 40%) and high (H) (top 30%) book-to-market
ratio (Fama & French, 2012).
After, we created six portfolios from the interception of these groups:
S/L (Small and Low): Stocks with small market capitalization and low book-
to-market (B/M) ratio;
S/M (Small and Medium): Stocks with small market capitalization and medium
B/M ratio;
S/H (Small and High): Stocks with small market capitalization and high B/M
ratio;
B/L (Big and Low): Stocks with big market capitalization and low B/M ratio;
B/M (Big and Medium): Stocks with big market capitalization and medium
B/M ratio;
B/H (Big and High): Stocks with big market capitalization and high B/M ratio
25
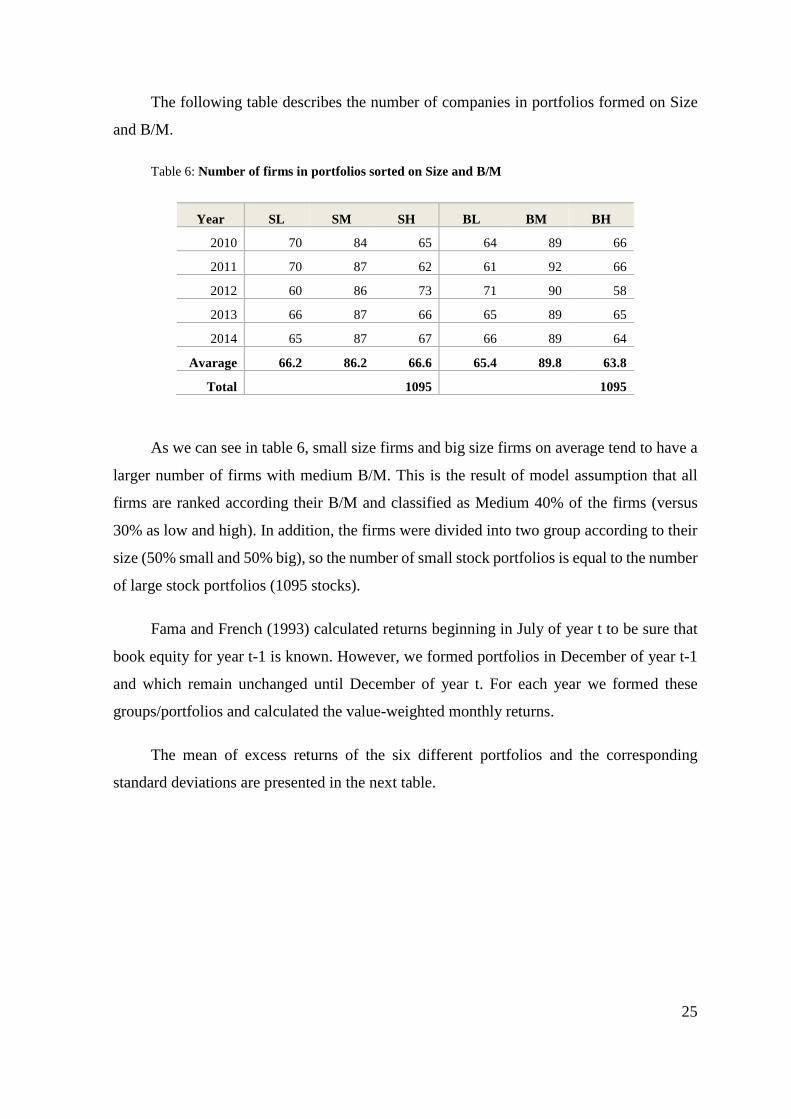
The following table describes the number of companies in portfolios formed on Size
and B/M.
Table 6: Number of firms in portfolios sorted on Size and B/M
Year SL SM SH BL BM BH
2010 70 84 65 64 89 66
2011 70 87 62 61 92 66
2012 60 86 73 71 90 58
2013 66 87 66 65 89 65
2014 65 87 67 66 89 64
Avarage 66.2 86.2 66.6 65.4 89.8 63.8
Total 1095 1095
As we can see in table 6, small size firms and big size firms on average tend to have a
larger number of firms with medium B/M. This is the result of model assumption that all
firms are ranked according their B/M and classified as Medium 40% of the firms (versus
30% as low and high). In addition, the firms were divided into two group according to their
size (50% small and 50% big), so the number of small stock portfolios is equal to the number
of large stock portfolios (1095 stocks).
Fama and French (1993) calculated returns beginning in July of year t to be sure that
book equity for year t-1 is known. However, we formed portfolios in December of year t-1
and which remain unchanged until December of year t. For each year we formed these
groups/portfolios and calculated the value-weighted monthly returns.
The mean of excess returns of the six different portfolios and the corresponding
standard deviations are presented in the next table.
26
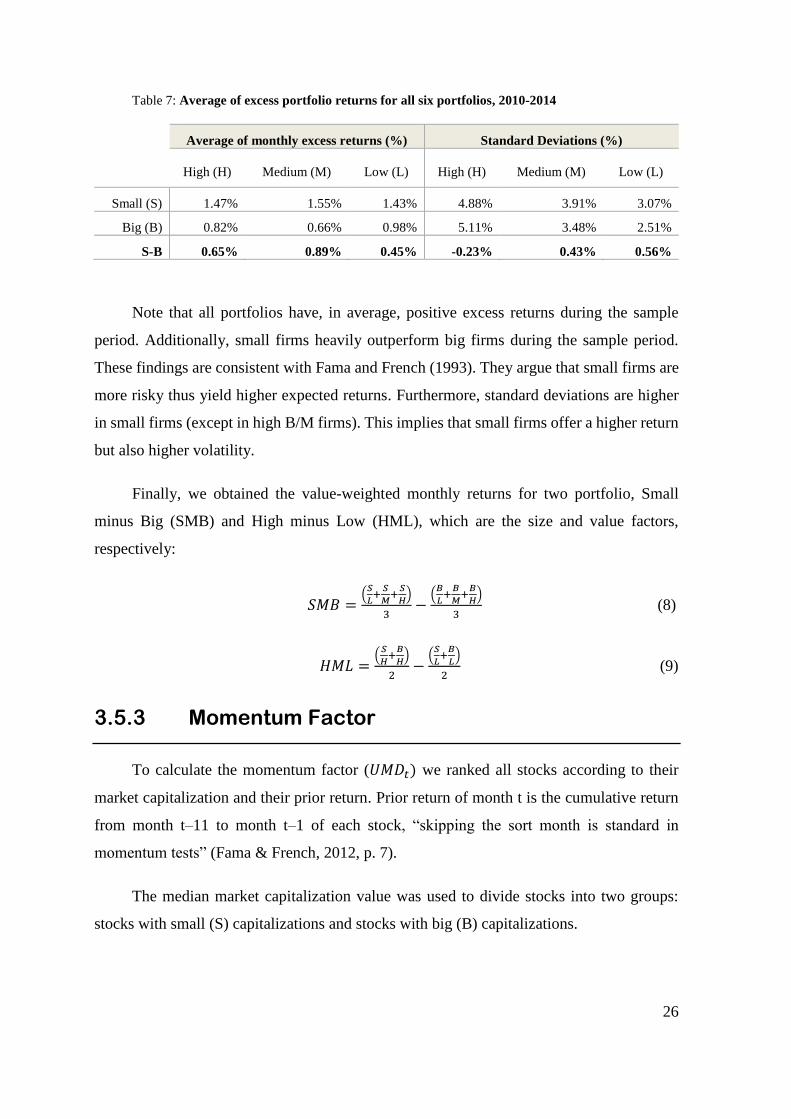
Table 7: Average of excess portfolio returns for all six portfolios, 2010-2014
Average of monthly excess returns (%) Standard Deviations (%)
High (H) Medium (M) Low (L) High (H) Medium (M) Low (L)
Small (S) 1.47% 1.55% 1.43% 4.88% 3.91% 3.07%
Big (B) 0.82% 0.66% 0.98% 5.11% 3.48% 2.51%
S-B 0.65% 0.89% 0.45% -0.23% 0.43% 0.56%
Note that all portfolios have, in average, positive excess returns during the sample
period. Additionally, small firms heavily outperform big firms during the sample period.
These findings are consistent with Fama and French (1993). They argue that small firms are
more risky thus yield higher expected returns. Furthermore, standard deviations are higher
in small firms (except in high B/M firms). This implies that small firms offer a higher return
but also higher volatility.
Finally, we obtained the value-weighted monthly returns for two portfolio, Small
minus Big (SMB) and High minus Low (HML), which are the size and value factors,
respectively:
𝑆𝑀𝐵 =(
𝑆
𝐿+
𝑆
𝑀+
𝑆
𝐻)
3−
(𝐵
𝐿+
𝐵
𝑀+
𝐵
𝐻)
3 (8)
𝐻𝑀𝐿 =(
𝑆
𝐻+
𝐵
𝐻)
2−
(𝑆
𝐿+
𝐵
𝐿)
2 (9)
3.5.3 Momentum Factor
To calculate the momentum factor (𝑈𝑀𝐷𝑡) we ranked all stocks according to their
market capitalization and their prior return. Prior return of month t is the cumulative return
from month t–11 to month t–1 of each stock, “skipping the sort month is standard in
momentum tests” (Fama & French, 2012, p. 7).
The median market capitalization value was used to divide stocks into two groups:
stocks with small (S) capitalizations and stocks with big (B) capitalizations.
27
Also, prior return was used to divide stocks into three groups: stocks with down (D)
(bottom 30%), medium (M) (middle 40%) and up (U) (top 30%) prior returns.
The intersection of the independent 2x3 sorts on size and momentum produces six
value-weighted portfolios:
S/D (Small and Down): Stocks with small market capitalization and down prior
returns;
S/M (Small and Medium): Stocks with small market capitalization and medium
prior returns;
S/U (Small and Up): Stocks with small market capitalization and up prior
returns;
B/D (Big and Down): Stocks with big market capitalization and down prior
returns;
B/M (Big and Medium): Stocks with big market capitalization and medium
prior returns;
B/U (Big and Up): Stocks with big market capitalization and up prior returns.
The portfolios are formed every month t-1. For each month we formed these
groups/portfolios and calculated the value-weighted monthly returns.
Finally, we obtained the value-weighted monthly returns for one portfolio, Up Minus
Down (UMD):
𝑈𝑀𝐷 =(
𝑆
𝑈+
𝐵
𝑈)
2−
(𝑆
𝐷+
𝐵
𝐷)
2 (10)
This computation can be interpreted as the average return on the two high prior return
portfolios minus the average return on the two low prior return portfolios (Lopez, 2014).
The mean of returns and excess returns of the portfolio UMD and the corresponding
standard deviations are presented in the next table.
28
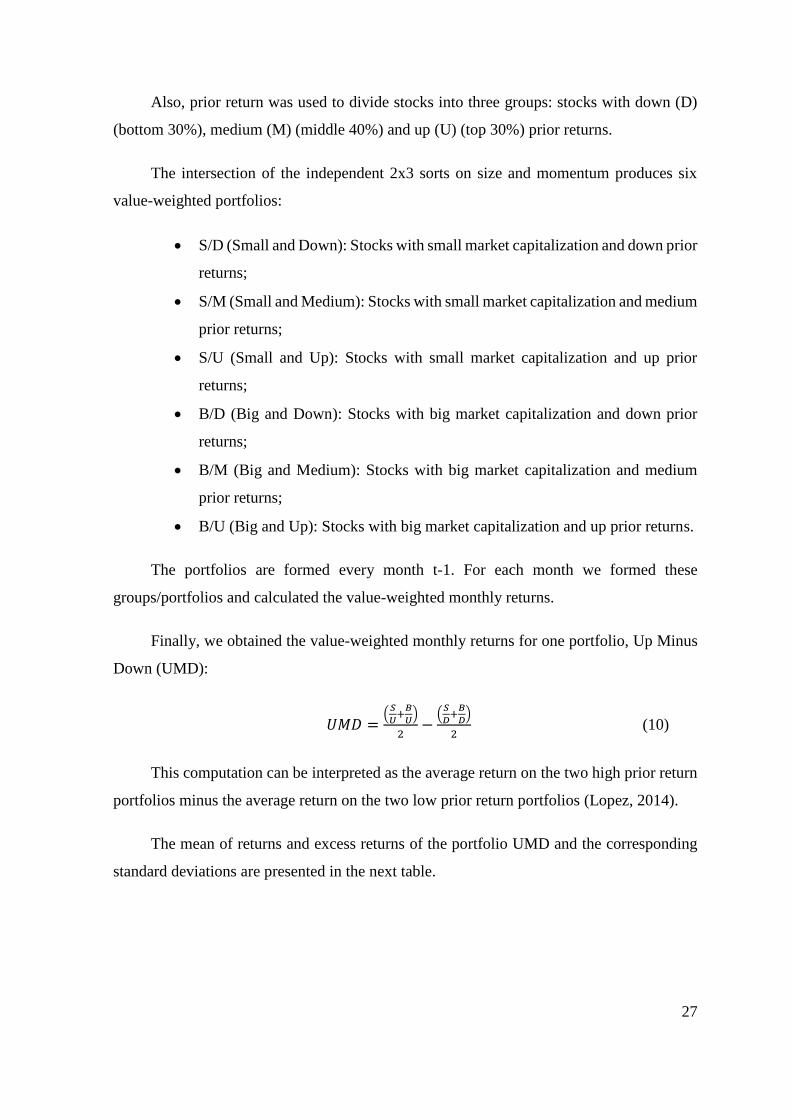
Table 8: Average of monthly returns of momentum sorted portfolioof
Portfolios Average Returns
(%)
Std. Deviation
(%)
UP 2.766% 7.501%
Down 1.913% 8.779%
UMD 0.427% 3.397%
Free Rate (Euribor 1m) 0.030% 0.023%
Excess Return 0.396% 3.374%
The portfolio up, which contains stocks with highest past returns, offered the highest
mean return of 2.766% with total risk of 7.501%. The portfolio down offered 1.913% with
standard deviation of 8.779%.
The UMD (Up minus Down) portfolio shows the gain offered by the momentum
strategy over the sample period (Nwani, 2015, p. 99). Concluding, if investors implemented
the momentum strategy in the sample period they obtained, in average, a return of 0.427%
per month.
This conclusion corroborates the findings of Carhart (1997). He finds that the stocks
which performed best last year (in the top decile) also had positive exposure to the
momentum factor (UMD) while those which performed worst had negative exposure.
3.5.4 Market Factor
The market risk factor is the difference between the value weighted portfolio and the
risk free rate for the full market (438 stocks) Like we referred before, risk free rate is
represented by the one month Euribor rate.
In the next chapter we will discuss the evolution of profitability of portfolios and
estimation results of Carhart regressions.
29
4 Results
4.1 Evolution of the yields of portfolios
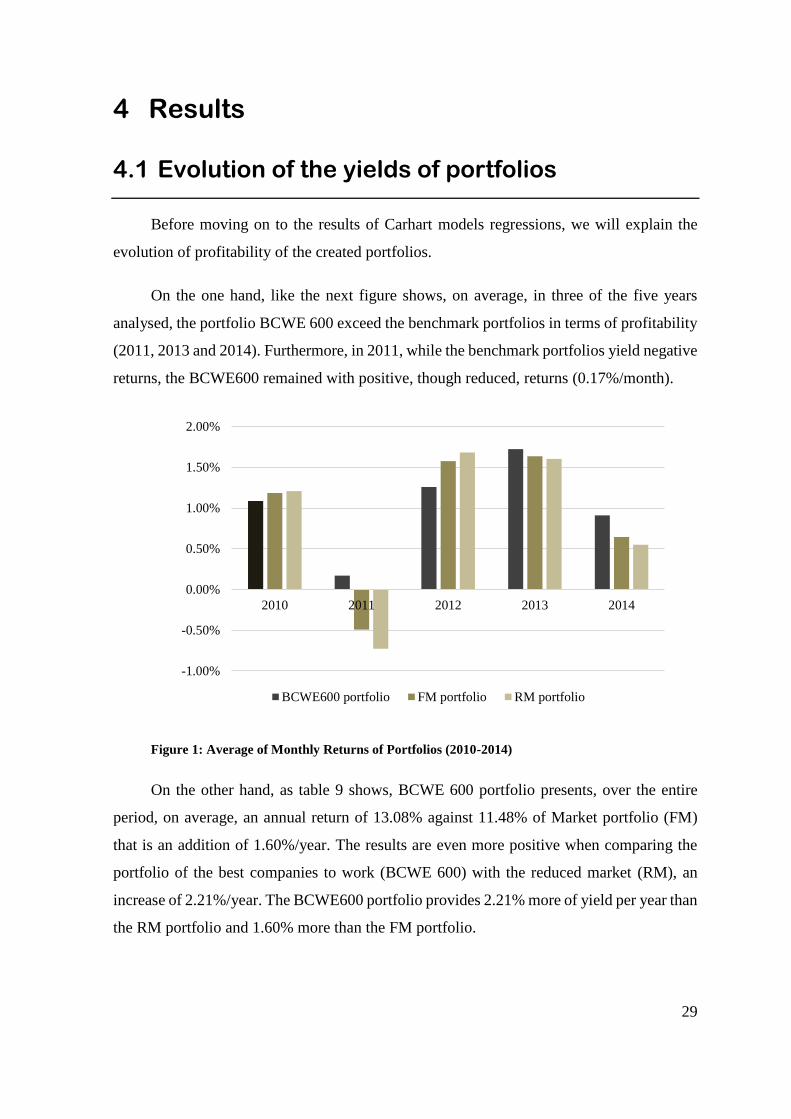
Before moving on to the results of Carhart models regressions, we will explain the
evolution of profitability of the created portfolios.
On the one hand, like the next figure shows, on average, in three of the five years
analysed, the portfolio BCWE 600 exceed the benchmark portfolios in terms of profitability
(2011, 2013 and 2014). Furthermore, in 2011, while the benchmark portfolios yield negative
returns, the BCWE600 remained with positive, though reduced, returns (0.17%/month).
Figure 1: Average of Monthly Returns of Portfolios (2010-2014)
On the other hand, as table 9 shows, BCWE 600 portfolio presents, over the entire
period, on average, an annual return of 13.08% against 11.48% of Market portfolio (FM)
that is an addition of 1.60%/year. The results are even more positive when comparing the
portfolio of the best companies to work (BCWE 600) with the reduced market (RM), an
increase of 2.21%/year. The BCWE600 portfolio provides 2.21% more of yield per year than
the RM portfolio and 1.60% more than the FM portfolio.
-1.00%
-0.50%
0.00%
0.50%
1.00%
1.50%
2.00%
2010 2011 2012 2013 2014
BCWE600 portfolio FM portfolio RM portfolio
30
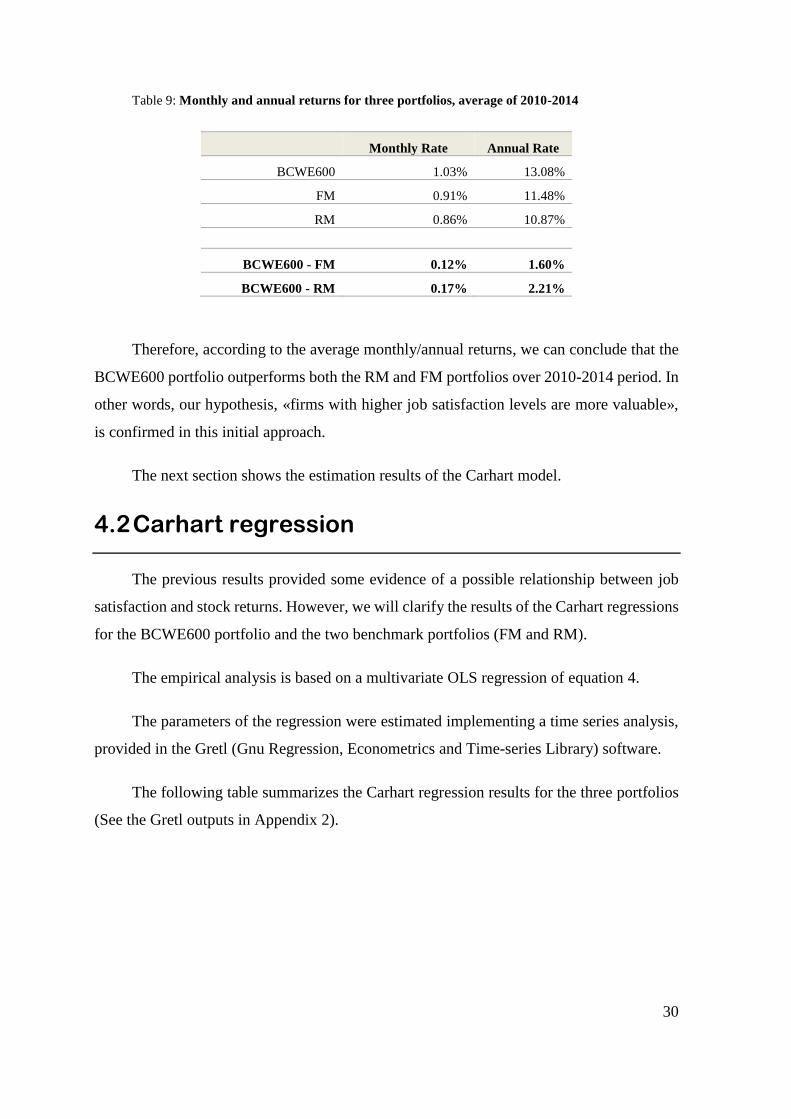
Table 9: Monthly and annual returns for three portfolios, average of 2010-2014
Monthly Rate Annual Rate
BCWE600 1.03% 13.08%
FM 0.91% 11.48%
RM 0.86% 10.87%
BCWE600 - FM 0.12% 1.60%
BCWE600 - RM 0.17% 2.21%
Therefore, according to the average monthly/annual returns, we can conclude that the
BCWE600 portfolio outperforms both the RM and FM portfolios over 2010-2014 period. In
other words, our hypothesis, «firms with higher job satisfaction levels are more valuable»,
is confirmed in this initial approach.
The next section shows the estimation results of the Carhart model.
4.2 Carhart regression
The previous results provided some evidence of a possible relationship between job
satisfaction and stock returns. However, we will clarify the results of the Carhart regressions
for the BCWE600 portfolio and the two benchmark portfolios (FM and RM).
The empirical analysis is based on a multivariate OLS regression of equation 4.
The parameters of the regression were estimated implementing a time series analysis,
provided in the Gretl (Gnu Regression, Econometrics and Time-series Library) software.
The following table summarizes the Carhart regression results for the three portfolios
(See the Gretl outputs in Appendix 2).
31
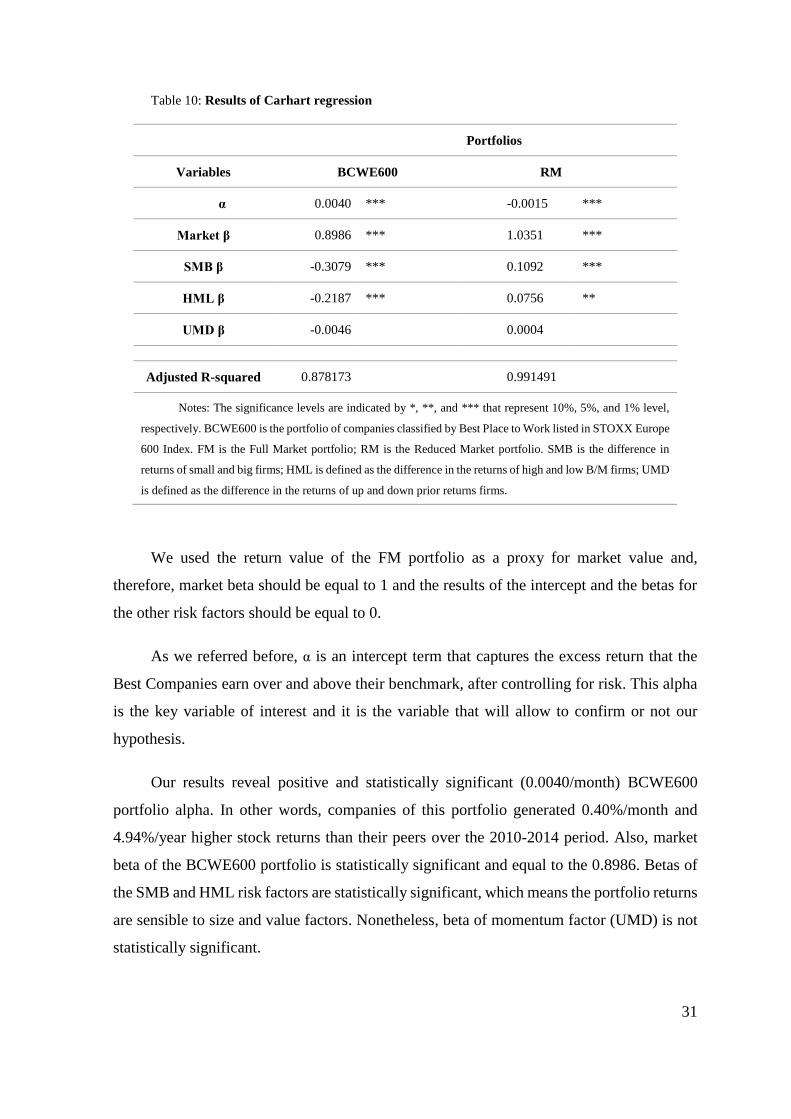
Table 10: Results of Carhart regression
Portfolios
Variables BCWE600 RM
α 0.0040 *** -0.0015 ***
Market β 0.8986 *** 1.0351 ***
SMB β -0.3079 *** 0.1092 ***
HML β -0.2187 *** 0.0756 **
UMD β -0.0046
0.0004
Adjusted R-squared 0.878173 0.991491
Notes: The significance levels are indicated by *, **, and *** that represent 10%, 5%, and 1% level,
respectively. BCWE600 is the portfolio of companies classified by Best Place to Work listed in STOXX Europe
600 Index. FM is the Full Market portfolio; RM is the Reduced Market portfolio. SMB is the difference in
returns of small and big firms; HML is defined as the difference in the returns of high and low B/M firms; UMD
is defined as the difference in the returns of up and down prior returns firms.
We used the return value of the FM portfolio as a proxy for market value and,
therefore, market beta should be equal to 1 and the results of the intercept and the betas for
the other risk factors should be equal to 0.
As we referred before, α is an intercept term that captures the excess return that the
Best Companies earn over and above their benchmark, after controlling for risk. This alpha
is the key variable of interest and it is the variable that will allow to confirm or not our
hypothesis.
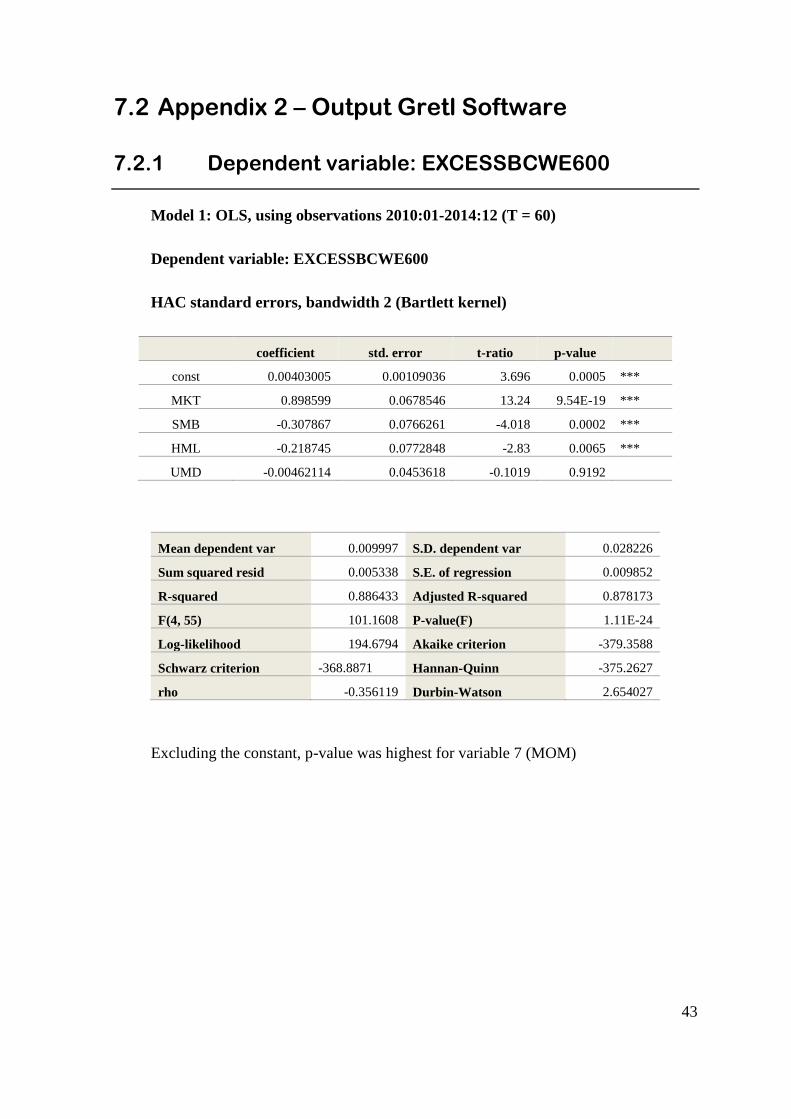
Our results reveal positive and statistically significant (0.0040/month) BCWE600
portfolio alpha. In other words, companies of this portfolio generated 0.40%/month and
4.94%/year higher stock returns than their peers over the 2010-2014 period. Also, market
beta of the BCWE600 portfolio is statistically significant and equal to the 0.8986. Betas of
the SMB and HML risk factors are statistically significant, which means the portfolio returns
are sensible to size and value factors. Nonetheless, beta of momentum factor (UMD) is not
statistically significant.
32
For the RM portfolio our results reveal a negative but statistically significant alpha (-
0.0015/month). In other words, companies of this portfolio generated 0.15%/month and
1.73%/year below stock returns than their peers over the 2010-2014 period. Also, market
beta of the RM portfolio is statistically significant and equal to the 1.0351. Betas of the SMB
and HML risk factors are statistically significant, which means the portfolio returns are
sensible to size and value factors. Nonetheless, beta of momentum factor (UMD) is not
statistically significant.
In addition to the portfolio BCWE600 obtaining higher stock returns than benchmark
portfolios, the market risk is also less. BCWE600 portfolio presents a lower market beta
(0.8986) than FM portfolio (1.00) and RM portfolio (1.0351).
To complete the regression analysis we discuss the goodness of fit of the model. The
adjusted 𝑅2 for the four factor regressions (BCWE600 portfolio as dependent variable) is of
87.82%. This means that our four-factors (Size, B/M, Market and Momentum) explain
87.82% of variance of excess return of BCWE600 portfolio. On the other hand, the adjusted
𝑅2 for the four factor regressions (RM portfolio as dependent variable) is of 99.15%.
33
5 Conclusions
Over the years, there has been a great evolution in human resource management in
organizations, however, this management is not always done in the most efficient or morally
correct way. While we believe that today there are organizations that believe that intellectual
capital is critical to your success, there is too much evidence that this belief is not unanimous
on the market. The reasons may be numerous, among other personal beliefs of managers and
the pressure of shareholders and other stakeholders.
Believing that people are the most important asset of firms is generally accepted for
us to see how we can make this asset in a competitive and sustainable resource. Many authors
have raised the importance of keeping satisfied and motivated employees on staff in order
to achieve these individual targets contributing to achieve the underlying objective of all for-
profit organizations: making money.
The main purpose of this work was to prove the link between job satisfaction and the
firm’s value. We compared the monthly returns of a portfolio composed by firms present in
the «Best Companies to Work» list with two other benchmark portfolios using the four-
factor model proposed by Carhart (1997) from January 2010 to December 2014. Note that
«Best Companies to Work» list originates our measure for job satisfaction on portfolio firms
and our sample was firms listed in STOXX Europe 600 Index.
Our results show that the BCWE600 portfolio outperforms both benchmark portfolios
(RM and FM). The four-factors model estimation reveal positive and statistically significant
(0.0040/month) BCWE600 portfolio alpha. In other words, companies of this portfolio
generated 0.40%/month and 4.94%/year higher stock returns than their peers over the 2010-
2014 period. In addition, betas of the Market, SMB and HML risk factors are statistically
significant, which means the portfolio returns are sensible to these factors. Nonetheless, beta
of momentum factor (UMD) is not statistically significant. Also, the market risk in portfolio
BCWE600 (Market β=0.8986) is inferior compared to other portfolios.
So we accomplished the objective and proved that there is a link between job
satisfaction and the company's value. We confirm our hypothesis «firms with higher job
34
satisfaction levels are more valuable». This work shows that the firms with the most satisfied
workers get better results, resulting in higher returns for its shareholders.
Like any other research, our study has its own limitations that could be overcome by
further research. Measuring job satisfaction is the main challenge detected in the existing
literature on the subject and our job satisfaction measure, «Best Companies to Work» list
may have some limitations. The Great Place to Work Institute does not survey all firms.
Firms must apply to be considered for the list. In addition, the score of firms is not a pure
measure of job satisfaction by employees because 1/3 comes from management
questionnaire.
We would like to make some suggestions to extend this theme to other studies. Job
satisfaction is a subject of social science and a highly debated psychological topic. However,
it will be interesting to combine these social issues to financial methodologies that give
measurable and easy interpretation results. Thus a possible extension of this work is the
combination of other measures of job satisfaction to create portfolios in the four-factor
model. On the other hand, it is possible to use different models of performance assessment
and keep this job satisfaction measure. A comparative analysis between different valuation
models or different measures of job satisfaction would also be relevant.
35
6 References
1
Addison, J. T., & Schnabel, C. (2009). Worker Directors: A German Product that Didn’t
Export? Faculdade de Economia da Universidade de Coimbra, Grupo de Estudos
Monetários e Financeiros. Coimbra: Secção de Textos da FEUC.
Banz, R. W. (1981). The relationship between return and market value of common stocks.
Journal of Financial Economics, 9(1), pp. 3-18.
Basu, S. (1983). The relationship between earnings' yield, market value and return for NYSE
common stocks. Journal of Financial Economics, 12(1), pp. 129-156.
Blasi, J. R., & Kruse, D. L. (2012). Broad-based Worker Ownership and Profit Sharing:
Can These Ideas Work in the Entire Economy?
Blunden, A. (n.d.). Principles of Scientific Management, Frederick Winslow Taylor (1911).
Retrieved from The Principles of Scientific Management:
https://www.marxists.org/reference/subject/economics/taylor/principles/index.htm
Brayfield, A. H., & Crockett, W. H. (1955). Employee Attitudes and Employee Performance.
Psychological Bulletin, 52(5), 396-424.
Carhart, M. M. (1997, March). On Persistence in Mutual Fund Performance. The Journal of
Finance, 52(1), 57-82.
Chapman, L. J., & Chapman, J. P. (1969). Illusory correlation as an obstacle to the use of
valid psychodiagnostic signs. Journal of Abnormal Psychology, 271-280.
Draper, S. (2000). The Hawthorne, Pygmalion, Placebo and other effects of expectation:
some notes. Retrieved October 24, 2015, from University of Glasgow:
http://www.psy.gla.ac.uk/~steve/hawth.html
Edmans, A. (2011). Does the stock market fully value intangibles? Employee satisfaction
and equity prices. Journal of Financial Economics, 101(1), 621-640.
36
Edmans, A. (2012). The Link Between Job Satisfaction and Firm Value, With Implications
for Corporate Social Responsibility. Academy of Management Perspectives 26(4),
pp. 1-19.
Fama, E. F., & French, K. R. (1993). Common risk factors in the returns on stocks and bonds.
Journal of Financial Economics, 33, 3-56.
Fama, E. F., & French, K. R. (2004). The Capital Asset Pricing Model: Theory and Evidence.
Journal of Economic Perspectives, 18(3), 25–46.
Fama, E. F., & R.French, K. (2012). Size, Value, and Momentum in International Stock
Returns. Journal of Financial Economics, 105(3), 457-472.
Fama, E., & French, K. (n.d.). Description of Fama/French Factors for Developed Markets.
Retrieved July 21, 2016, from Kenneth R. French website:
http://mba.tuck.dartmouth.edu/pages/faculty/ken.french/Data_Library/f-
f_developed.html
Filbeck, G., & Preece, D. (2003). Fortune's Best 100 Companies to Work for in America:
Do They Work for Shareholders? Journal of Business Finance & Accounting, 30,
771-797.
Fulmer, I. S., Gerhart, B., & Scott, K. S. (2003). Are the 100 Best Better? An Empirical
investigation of the relationhip between being a "great place to work" and firm
performance. Personnel Psicology, 56(4), 965-993.
Great Place To Work Institute. (n.d. a). Our History. Retrieved July 12, 2016, from Great
Place To Work: http://www.greatplacetowork.net/about-us/our-history
Great Place To Work Institute. (n.d. b). How You're Evaluated. Retrieved July 21, 2016,
from Great Place To Work: http://www.greatplacetowork.net/best-companies/about-
applying-to-best-companies-lists/how-youre-evaluated
Great Place to Work Institute. (n.d. c). What is a Great Workplace? Retrieved July 13, 2016,
from Great Place to Work: http://www.greatplacetowork.net/our-approach/what-is-
a-great-workplace
37
Harrison, D. A., Newman, D. A., & Roth, P. L. (2006). How important are job attitudes?
Meta-analytic comparisons of integrative behavioral outcomes and time sequences.
Academy of Management Journal, 49(2), 305-325.
Iaffaldano, M. T., & Muchinsky, P. M. (1985). Job Satisfaction and Job Performance. A
Meta-Analysis. Psychological Bulletin, 97(2), 251-273.
Jegadeesh, N., & Titman, S. (1993). Returns to Buying Winners and Selling Losers:
Implications for Stock Market Efficiency. The Journal of Finance, 48(1), 65-91.
Jones, M. D. (2006). Which is a Better Predictor of Job Performance: Job Satisfaction or
Life Satisfaction? Journal of Behavioral and Applied Management, 8(1), 20-42.
Judge, T. A., & Klinger, R. (2007). Job Satisfaction. In The Science of Subjective Weel-Being
(pp. 393-413, chap. 19). The Guilford Press.
Judge, T. A., Bono, J. E., Thoresen, C. J., & Patton, G. K. (2001). The Job Satisfaction-Job
Performance Relationship: A Qualitative and Quantitative Review. Psychological
Bulletin, 127(3), 376-407.
Kohn, A. (1993, October). Why Incentive Plans Cannot Work. Retrieved from Harvard
Business Review: https://hbr.org/1993/09/why-incentive-plans-cannot-work
Locke, E. A. (1976). The nature and causes of job satisfaction. In Handbook of industrial
and organizational psychology (pp. 1927-1349). Chicago: Rand McNally.
Lopez, H. L. (2014). On the robustness of the CAPM, Fama-French Three-Factor Model
and the Carhart Four-Factor Model on the Dutch stock market. Bachelor Thesis in
Finance, Tilburg University, Netherlands.
Macefield, R. (2007, Maio). Usability Studies and the Hawtorne Effect. Journal of Usability
Studies, 2, 145-154.
Nwani, C. (2015). An Empirical Investigation of Fama-French-Carhart Multifactor Model:
UK Evidence. Journal of Economics and Finance, 6(1), 95-103.

38
Ostroff, C. (1992). The Relationship Between Satisfaction, Attitudes, and Performance: An
Organizational Level Analysis. Journal of Applied Psychology, 77(6), 963-974.
STOXX® Europe 600. (n.d.). Retrieved December 5, 2015, from STOXX:
https://www.stoxx.com/index-details?symbol=SXXP
Talachi, R. K., Gorji, M. B., & Boerhannoeddin, A. B. (2014). An Investigation of the Role
of Job Satisfaction in Employees’ Organizational Citizenship Behavior. Coll.
Antropol(38), 429–436.

39
This page was intetionally left blank

40
41
7 Appendices
7.1 Appendix 1 – Composition of the BCWE 600
portfolio
ISIN Name Country ICB Size
CH0038863350 NESTLE CH Switzerland 3500 Food & Beverage LRG
CH0012005267 NOVARTIS CH Switzerland 4500 Health Care LRG
CH0012032048 ROCHE HLDG P CH Switzerland 4500 Health Care LRG
GB00B16GWD56 VODAFONE GRP GB United
Kingdom
6500 Telecommunications LRG
GB0009252882 GLAXOSMITHKLINE GB United
Kingdom
4500 Health Care LRG
FR0000120578 SANOFI FR France 4500 Health Care LRG
DE0007236101 SIEMENS DE Germany 2700 Industrial Goods &
Services
LRG
ES0113900J37 BCO SANTANDER ES Spain 8300 Banks LRG
GB0002875804 BRITISH AMERICAN
TOBACCO
GB United
Kingdom
3700 Personal &
Household Goods
LRG
DE0007100000 DAIMLER DE Germany 3300 Automobiles &
Parts
LRG
GB0002374006 DIAGEO GB United
Kingdom
3500 Food & Beverage LRG
DE0007164600 SAP DE Germany 9500 Technology LRG
DK0060102614 NOVO NORDISK B DK Denmark 4500 Health Care LRG
GB0009895292 ASTRAZENECA GB United
Kingdom
4500 Health Care LRG
GB0031348658 BARCLAYS GB United
Kingdom
8300 Banks LRG
ES0178430E18 TELEFONICA ES Spain 6500 Telecommunications LRG
NL0000303600 ING GRP NL Netherlands 8500 Insurance LRG
FR0000121972 SCHNEIDER
ELECTRIC
FR France 2700 Industrial Goods &
Services
LRG
SE0000106270 HENNES &
MAURITZ B
SE Sweden 5300 Retail LRG
FR0000120644 DANONE FR France 3500 Food & Beverage LRG
DE0007664039 VOLKSWAGEN
PREF
DE Germany 3300 Automobiles &
Parts
LRG
DE000ENAG999 E.ON DE Germany 7500 Utilities LRG
NL0000009538 PHILIPS NL Netherlands 2700 Industrial Goods &
Services
LRG
DE000A1EWWW0 ADIDAS DE Germany 3700 Personal &
Household Goods
LRG
JE00B2QKY057 SHIRE GB United
Kingdom
4500 Health Care LRG
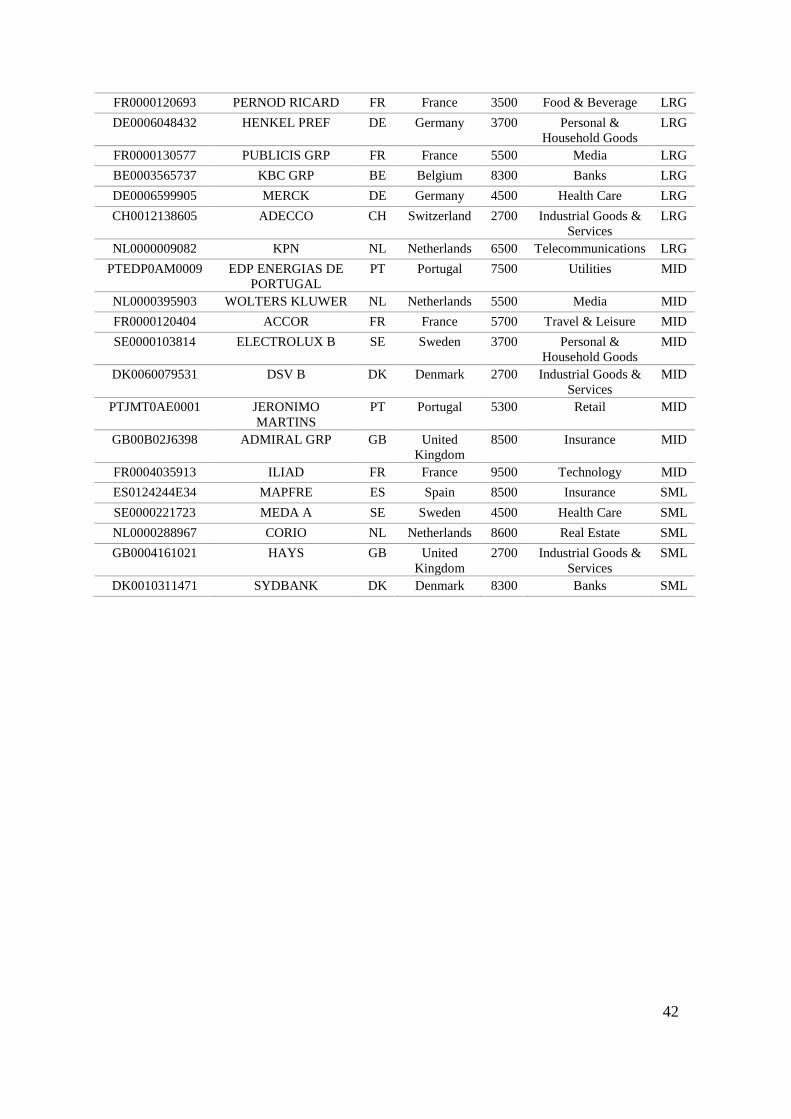
42
FR0000120693 PERNOD RICARD FR France 3500 Food & Beverage LRG
DE0006048432 HENKEL PREF DE Germany 3700 Personal &
Household Goods
LRG
FR0000130577 PUBLICIS GRP FR France 5500 Media LRG
BE0003565737 KBC GRP BE Belgium 8300 Banks LRG
DE0006599905 MERCK DE Germany 4500 Health Care LRG
CH0012138605 ADECCO CH Switzerland 2700 Industrial Goods &
Services
LRG
NL0000009082 KPN NL Netherlands 6500 Telecommunications LRG
PTEDP0AM0009 EDP ENERGIAS DE
PORTUGAL
PT Portugal 7500 Utilities MID
NL0000395903 WOLTERS KLUWER NL Netherlands 5500 Media MID
FR0000120404 ACCOR FR France 5700 Travel & Leisure MID
SE0000103814 ELECTROLUX B SE Sweden 3700 Personal &
Household Goods
MID
DK0060079531 DSV B DK Denmark 2700 Industrial Goods &
Services
MID
PTJMT0AE0001 JERONIMO
MARTINS
PT Portugal 5300 Retail MID
GB00B02J6398 ADMIRAL GRP GB United
Kingdom
8500 Insurance MID
FR0004035913 ILIAD FR France 9500 Technology MID
ES0124244E34 MAPFRE ES Spain 8500 Insurance SML
SE0000221723 MEDA A SE Sweden 4500 Health Care SML
NL0000288967 CORIO NL Netherlands 8600 Real Estate SML
GB0004161021 HAYS GB United
Kingdom
2700 Industrial Goods &
Services
SML
DK0010311471 SYDBANK DK Denmark 8300 Banks SML
43
7.2 Appendix 2 – Output Gretl Software
7.2.1 Dependent variable: EXCESSBCWE600
Model 1: OLS, using observations 2010:01-2014:12 (T = 60)
Dependent variable: EXCESSBCWE600
HAC standard errors, bandwidth 2 (Bartlett kernel)
coefficient std. error t-ratio p-value
const 0.00403005 0.00109036 3.696 0.0005 ***
MKT 0.898599 0.0678546 13.24 9.54E-19 ***
SMB -0.307867 0.0766261 -4.018 0.0002 ***
HML -0.218745 0.0772848 -2.83 0.0065 ***
UMD -0.00462114 0.0453618 -0.1019 0.9192
Mean dependent var 0.009997 S.D. dependent var 0.028226
Sum squared resid 0.005338 S.E. of regression 0.009852
R-squared 0.886433 Adjusted R-squared 0.878173
F(4, 55) 101.1608 P-value(F) 1.11E-24
Log-likelihood 194.6794 Akaike criterion -379.3588
Schwarz criterion -368.8871 Hannan-Quinn -375.2627
rho -0.356119 Durbin-Watson 2.654027
Excluding the constant, p-value was highest for variable 7 (MOM)
44
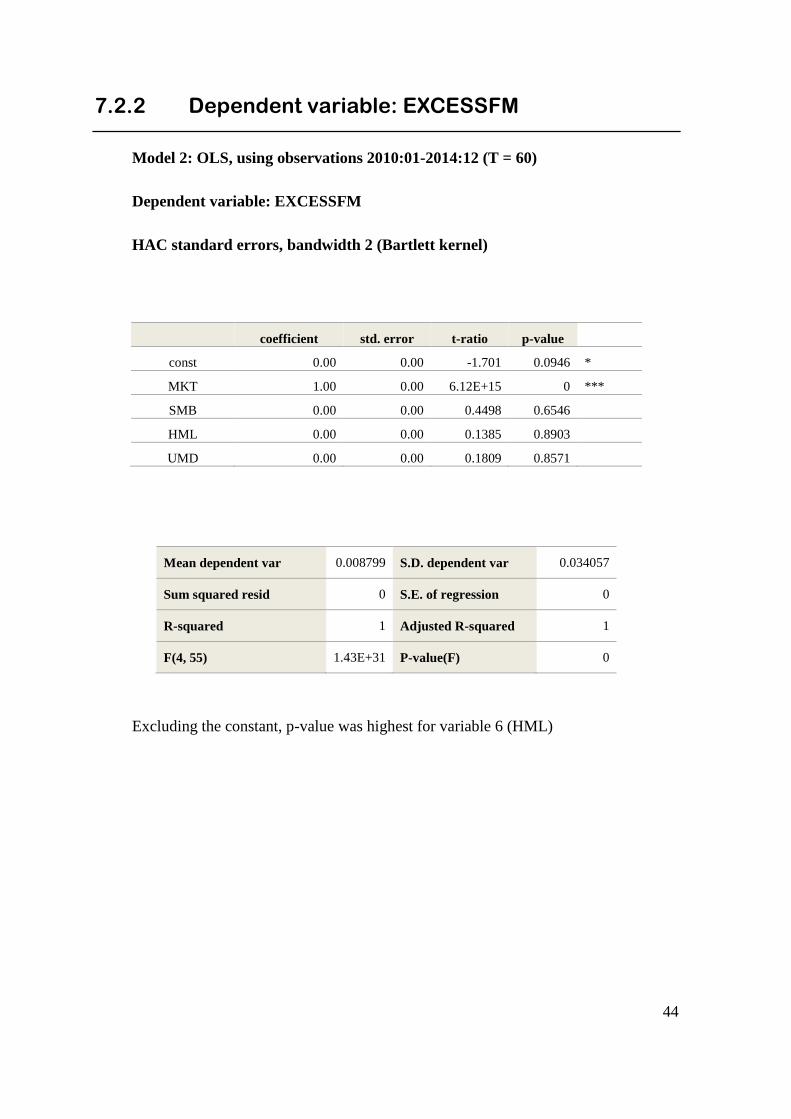
7.2.2 Dependent variable: EXCESSFM
Model 2: OLS, using observations 2010:01-2014:12 (T = 60)
Dependent variable: EXCESSFM
HAC standard errors, bandwidth 2 (Bartlett kernel)
coefficient std. error t-ratio p-value
const 0.00 0.00 -1.701 0.0946 *
MKT 1.00 0.00 6.12E+15 0 ***
SMB 0.00 0.00 0.4498 0.6546
HML 0.00 0.00 0.1385 0.8903
UMD 0.00 0.00 0.1809 0.8571
Mean dependent var 0.008799 S.D. dependent var 0.034057
Sum squared resid 0 S.E. of regression 0
R-squared 1 Adjusted R-squared 1
F(4, 55) 1.43E+31 P-value(F) 0
Excluding the constant, p-value was highest for variable 6 (HML)
45
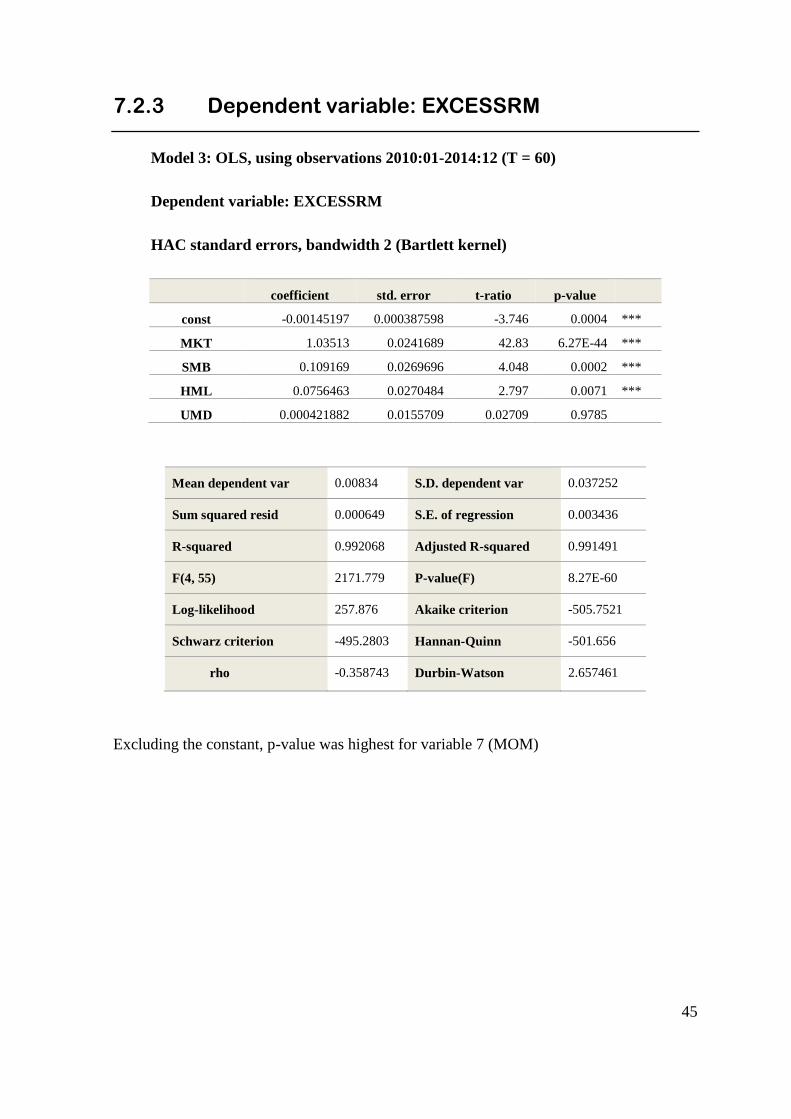
7.2.3 Dependent variable: EXCESSRM
Model 3: OLS, using observations 2010:01-2014:12 (T = 60)
Dependent variable: EXCESSRM
HAC standard errors, bandwidth 2 (Bartlett kernel)
coefficient std. error t-ratio p-value
const -0.00145197 0.000387598 -3.746 0.0004 ***
MKT 1.03513 0.0241689 42.83 6.27E-44 ***
SMB 0.109169 0.0269696 4.048 0.0002 ***
HML 0.0756463 0.0270484 2.797 0.0071 ***
UMD 0.000421882 0.0155709 0.02709 0.9785
Mean dependent var 0.00834 S.D. dependent var 0.037252
Sum squared resid 0.000649 S.E. of regression 0.003436
R-squared 0.992068 Adjusted R-squared 0.991491
F(4, 55) 2171.779 P-value(F) 8.27E-60
Log-likelihood 257.876 Akaike criterion -505.7521
Schwarz criterion -495.2803 Hannan-Quinn -501.656
rho -0.358743 Durbin-Watson 2.657461
Excluding the constant, p-value was highest for variable 7 (MOM)

46
This page was intetionally left blank