Embed Size (px)
Citation preview
Finance Working Paper N°. 31/2003
Update : October 2006
Ernst G. Maug University of Mannheim and ECGI
Kristian RydqvistSUNY at Binghamton and CEPR
© Ernst G. Maug and Kristian Rydqvist 2006. All
rights reserved. Short sections of text, not to exceed
two paragraphs, may be quoted without explicit per-
mission provided that full credit, including © notice,
is given to the source.
This paper can be downloaded without charge from:
http://ssrn.com/abstract_id=471362.
www.ecgi.org/wp
Do Shareholders Vote Strategically?
Voting Behavior, Proposal Screening,
and Majority Rules

European Corporate Governance Institute (ECGI)
ECGI Finance Working Paper No. 31/2003
European Finance Association (EFA)
EFA 2004 Maastricht Meetings Paper No. 2516
University of Mannheim – Center for Finance
Mannheim Finance Working Paper 2006-15
Do Shareholders Vote Strategically?
Voting Behavior, Proposal Screening, and Majority Rules
Ernst Maug University of Mannheim - Department of Business Administration and Finance;
European Corporate Governance Institute (ECGI)
Kristian Rydqvist SUNY at Binghamton - School of Management; Centre for Economic Policy
Research (CEPR)
This paper can be downloaded without charge from the Social Science Research Network Electronic Paper Collection at:
http://ssrn.com/abstract=473162

ECGI Working Paper Series in Finance
Working Paper N°. 31/2003
This version : October 2006
Ernst G. Maug
Kristian Rydqvist
Do Shareholders Vote Strategically? Voting
Behavior, Proposal Screening, and Majority
Rules
We are grateful to Mohan Gopalan, Suresh Paul, Joshua Spitzman, and Xue Wang for research
assistance. We would also like to thank Lucian Bebchuk, Stuart Gillan, Roberta Romano, and
Richard Sias for institutional information, as well as Francois Degeorge, Murali Jagannathan,
Matti Keloharju, Srinivasan Krishnamurthy, Allesandro Sbuelz, Oren Sussman, Steven Todd,
Charlotte Østergaard, Bilge Yilmaz, and seminar participants at Amsterdam, Binghamton, Bu.alo,
CalTech, CEPR-SITE Workshop October 2004 (Stockholm), Cornell, ECARE, European Finance
Association meeting (Maastricht), Financial Intermediation Research Society meeting (Capri),
Helsinki School of Economics, Humboldt University of Berlin, Lugano, Norwegian School of
Management, Oslo Conference on Corporate Governance, Rutgers, People and Money January
2004 (DePaul), Stockholm Institute for Financial Research (SIFR), the Swiss Banking Institute,
Buffalo, and Vienna for their comments on earlier versions of this paper.
© Ernst G. Maug and Kristian Rydqvist 2006. All rights reserved. Short sections of text, not
to exceed two paragraphs, may be quoted without explicit permission provided that full credit,
including © notice, is given to the source.

Abstract
We study shareholder voting on management proposals. We build on a simple model of strategic voting, provide structural estimates of its parameters, and derive testable implications. The evidence suggests that voting is strategic in the sense that shareholders take into account the information of other shareholders when making their voting decisions. We conclude that strategic voting prevents incorrect rejections of management proposals.
Keywords: Shareholder meeting, proposal screening, strategic voting, sincere voting,
supermajority rule.
JEL Classifications: D72, G34
Ernst G. MaugUniversity of Mannheim - Department of Business Administration and
Finance
D-68131 Mannheim
Germany
e-mail: [email protected]
Kristian RydqvistSUNY at Binghamton - School of Management
P.O. Box 6015
Binghamton , NY 13902-6015
United States
phone: 607-777-2673, fax: 607-777-4422
e-mail: [email protected]

1 Introduction
We study shareholder voting on management proposals. We address two related questions. Firstly,
why are shareholders asked to ratify management proposals? In principle, it would be sufficient to
build corporate charters on a model of a representative democracy where shareholders only elect
directors. Direct democracy is costly and many academic observers have expressed scepticism on
the usefulness of this institution, not least because shareholders rarely reject management proposals
which pass with wide margin. Nonetheless, shareholder voting has proved resilient and several inter-
ested parties have taken an active role in the proxy voting process (Easterbrock and Fischel (1983)).
For example, regulators in the U.S. require shareholder approval of certain management proposals,
investment managers are required to vote, management often put forward non-mandatory propos-
als, and a consulting industry has emerged around the demand for vote recommendations. More
than 80% of the shares are typically voted in widely-held US corporations.1 These facts suggest
that shareholder voting serves a useful purpose. We investigate the hypothesis that shareholders
screen proposals. Our empirical results suggest that they do, and that screening is particularly
valuable when managers’ ability to objectively evaluate the proposal is compromised, e.g., because
of conflicts of interest.
Secondly, we ask whether shareholders vote strategically. More specifically, we want to under-
stand if shareholders properly take into account the implications of the fact that their vote matters
only when it is pivotal. The answer to the second question is critical for answering the first. We
use a simple model, which has become standard in the political science literature, and which offers
a remarkable implication: If shareholders do not vote strategically, but simply respond to their
private information when casting their votes, then proposal screening may result in significant er-
rors and shareholder voting will actually destroy value. The data suggest that strategic voting is
particularly important when a proposal is subject to a supermajority rule.
We construct a simple model of strategic voting. In one state of the world, the proposal increases
the value of the firm, whereas in the other state the proposal destroys value. Nobody knows the
1Basic facts about shareholder voting on management proposals can be found in Brickley, Lease, and Smith (1988),Young, Millar, and Glezen (1993), Morgan and Poulsen (2001), Bethel and Gillan (2002), and Burch, Morgan, andWolf (2004).
1
true state of nature, but each shareholder receives some private information in addition to the
publicly available information. Shareholders are only interested in a higher value of their shares
(no conflicts of interest). If shareholders could communicate through a central mechanism, they
would pool their information and make a decision based on a simple cutoff rule: If the amount of
positive information exceeds the cutoff, the proposal is accepted, otherwise it is rejected. The central
mechanism is referred to as the representative shareholder. However, such a central mechanism does
not exist and shareholders must vote on the proposal without learning each others’ information.
The model generates three testable implications. Firstly, the number of votes cast in favor of
the proposal increases with the statutory majority rule. The statutory rule may coincide with the
optimal cutoff rule of the hypothetical representative shareholder, but statutory rules are often too
high. Then, shareholders tend to strategically vote in favor of the proposal to compensate for the
conservatism of the statutory rule, even if they observe unfavorable information. The reason is that
a shareholder’s vote only matters when it is pivotal. As the statutory rule increases, the pivotal
shareholder infers that many of the other shareholders have positive information and therefore is
more inclined to also believe that passing the proposal increases value. Secondly, the relation is
stronger for proposals for which public information is negative. When public information is negative
and the statutory rule is too conservative, then good proposals induce a stronger compensating
behavior of shareholders. Thirdly, the pass rate is independent of the statutory rule: Higher rules
are not associated with higher rejection rates as shareholders’ compensating behavior neutralizes
the higher hurdle the proposal has to take. We collect data on 14,548 proposals, which were voted
on at 9,158 shareholder meetings between 1994 and 2003, and find evidence consistent with the
three implications. Hence, we conclude that shareholders vote strategically, and that proposal
screening increases value.
The model is a version of the political voting model developed by Austen-Smith and Banks (1996)
and Feddersen and Pesendorfer (1998).2 We analyze pure strategy equilibria and provide a repa-
rameterization for empirical testing. We use the model to show that, for many proposals in our
2Subsequent papers include Feddersen and Pesendorfer (1996), Dekel and Piccione (2000), and Persico (2004).Voting models with heterogeneous preferences, which can be used to model conflicts of interest, include Feddersenand Pesendorfer (1997) and Maug and Yilmaz (2002). We allow for conflicts of interest in the empirical analysis bycontrolling for insider ownership.
2
sample, strategic voting significantly reduces the probability of decision-making errors.
Empirical work on voting has been devoted mostly to the turnout question (why people vote
or not vote; see Feddersen (2004) for a survey), and only a few experimental studies investigate
how people vote. Guarnaschelli, McKelvey, and Palfrey (2000) and Battaglini, Morton, and Pal-
frey (2005) show that agents in the laboratory behave approximately in accordance with the theory
of strategic voting. To the best of our knowledge, our paper is the first to investigate strategic
voting in field data. Using data similar to ours, Brickley, Lease, and Smith (1988) and (1994) also
show a positive empirical relation between the proportion in favor and the statutory majority rule.
At the time of their two studies, the theory of strategic voting was not developed and they offer a
different interpretation, which we discuss at the end of the paper.
Models of informational voting have been formulated with a focus on political applications and
have played only a minor role in the literature on shareholder voting. In fact, a recent survey on
corporate governance by Becht, Bolton, and Röell (2003) does not mention voting models at all.
The literature on shareholder voting has taken a different direction. The point of departure is the
separation of ownership and control and the conflict between shareholders and management (Berle
and Means (1932)).3 The question is whether shareholders ratify value-decreasing management
proposals. The primary suspects are proposals which remove shareholder rights and therefore
entrench management. Numerous papers, starting with DeAngelo and Rice (1983) and Linn and
McConnell (1983), have examined the stock price reaction to the announcement of entrenchment
proposals. The overall impression from these studies is that stock price changes are small and
often statistically insignificant, which implies that, on average, shareholder voting may not matter.
However, the empirical results in our paper suggest that the average conceals interesting variation
across proposals where shareholder voting matters.
The rest of the paper is organized as follows: Section 2 develops the basic model with an
emphasis on the empirical implications. The testing methodology is developed in Section 3, the
data are described in Section 4, and the results of the structural estimation are reported in Section 5.
Section 6 discusses alternative interpretations and Section 7 concludes.
3See also the special issues of the Journal of Financial Economics, Volume 11 (1983) and Volume 20 (1988).
3
2 The Theory of Strategic Voting
2.1 Assumptions
A proposal can be either accepted or rejected. The payoff v to the firm from accepting the proposal
depends on the state of nature. Acceptance of the proposal increases the value of the firm by v = 1
with probability p and decreases it by v = −1 with probability 1 − p. There are N shareholders
with one vote each. Shareholders can vote either for or against the proposal. All votes are cast
simultaneously and the voting rule requires that a votes are in favor of the proposal. The voting
rule a is exogenous. Each shareholder i privately observes a signal σi ∈ {0, 1}, which indicates the
state of the world correctly with a probability strictly less than 1:
Pr(σ = 1|v = 1) = Pr(σ = 0|v = −1) = 1− ε, 0 < ε <1
2. (1)
The signal is incorrect with probability ε and therefore correct with probability 1− ε. The private
signals are statistically independent conditional on the state of nature. The probability of receiving
a good signal is:
π = p(1− ε) + (1− p)ε. (2)
The prior p represents common information available to all shareholders. It includes proxy
material, vote recommendations, and the stock price. We assume that markets are incomplete
so that shareholders cannot take bets on the stock with and without the proposal. The signal σ
represents information, which is specific to individual shareholders, and includes genuinely private
information as well as differences in analyzing publicly available information. If these interpretations
are correlated across shareholders and therefore have a common component, then this common
component would also be reflected in the prior p. The ex-ante expected payoff from accepting the
proposal is E(v) = 2p− 1. Therefore, if no private information is available, the proposal should be
accepted whenever p > 1/2.
We follow the political voting literature and assume symmetry of voters (one man, one vote).
This is an approximation as shareholders have votes proportional to the number of shares they
4
own, an aspect we ignore to preserve analytic tractability. For the same reason, we do not allow
for abstentions or non-participation, which would require a more complex model with more para-
meters.4 We also assume that payoffs and error probabilities are symmetric across states. This
assumption simply preserves identifiability. If we allow asymmetry across states, we cannot iden-
tify the additional parameter and the probability p at the same time, so the symmetry assumption
does not restrict the empirical analysis. Finally, we ignore the process whereby managers select
proposals and potentially also time the date when a proposal is put on the agenda. We argue that
all these aspects are eventually reflected in the common prior p.
2.2 Representative Shareholder
Since there are no conflicts of interest, we can analyze any decision by looking at a representative
shareholder, who collects N signals from all shareholders to arrive at an optimal decision. The
information consists of g good signals and N − g bad signals. The objective is to develop a
benchmark for the efficiency of voting rules.
First, we derive the objective function. Invariably, the representative shareholder will commit
two types of errors. With probability eI , she will reject a value-increasing proposal (type I-error),
and with probability eII , she will accept a value-reducing proposal (type II-error). Given that
all signals have the same precision, we can restrict ourselves to decisions by a simple cutoff rule:
If g ≥ a signals are good, the proposal is accepted, otherwise it is rejected. The representative
shareholder chooses a cutoff rule a that minimizes the expected loss:
L = pXg<a
Pr (g |v = +1) + (1− p)Xg≥a
Pr (g |v = −1)
= peI + (1− p) eII . (3)
Note that L can also be interpreted as the probability of error.
Next, we derive the optimal cutoff rule. Let β (g,N) be the probability of being in the good
state after observing g good signals (σi = 1) and N − g bad signals (σi = −1). In Appendix A.1,4See Feddersen and Pesendorfer (1996) for a model, which explicitly allows for abstentions.
5
we derive the functional form of β (g,N) by applying Bayes’ Rule. Intuitively, β(g,N) increases
with g and decreases with N . Then, we can rewrite L as:5
L =Xg<a
β (g,N) Pr (g) +Xg≥a
(1− β (g,N)) Pr (g) . (4)
The representative shareholder accepts the proposal whenever β (g,N) ≥ 1−β (g,N), or β (g,N) ≥
1/2. We ignore that g is an integer and define the optimal cutoff rule a∗ from β (a∗, N) = 1/2. In
Appendix A.2, we derive the following expression for the optimal cutoff rule:
a∗
N=1
2− 1
2N ln¡1−εε
¢ lnµ p
1− p
¶, (5)
which is subject to a∗ ∈ [0, N ].6 Anticipating the discussion of voting rules, we shall refer to a∗/N
as the optimal majority rule. From (5) we can observe two interesting properties. Firstly, a∗/N
decreases with the prior p. Submajority (a∗/N < 1/2) is optimal for p > 1/2 and supermajority
(a∗/N > 1/2) for p < 1/2. Secondly, the simple majority rule (a∗/N = 1/2) is optimal when
the amount of information is large, which occurs whenever the signals are precise (ε → 0) or the
number of shareholders is large (N →∞). The optimality of the simple majority rule in the limit
is a consequence of the symmetry assumption. Error symmetry means that one good signal always
cancels out one bad signal, and payoff symmetry means that good and bad signals are valued
equally.
The set of possible solutions to (3) is constrained by the two extreme cases with no information
and perfect information, respectively. Firstly, if there is no information (ε = 1/2), the representative
shareholder bases her decision on the prior alone. Then, L = min (p, 1− p) ≤ 1/2. Secondly, if
information is perfect (ε = 0), all decisions are correct and L = 0. Hence, in the intermediate case
with imperfect information, we must have 0 ≤ L ≤ 1/2.5We use the fact that pPr (g |v = +1) = Pr (g, v = +1) = β (g,N)Pr (g).6 If a∗ < 0, then β (0,N) > 1/2 (the proposal is always good), and if a∗ > N , then β (N,N) < 1/2 (the proposal
is always bad). In both cases, the decision depends only on the prior p and the signals of shareholders cannot makea difference to the optimal decision.
6
2.3 Shareholder Voting
We now consider the more realistic case, when no representative shareholder exists and information
is revealed and aggregated through voting. Decisions are based on the statutory rule a. Statutory
rules are chosen a long time before the vote and apply to broad classes of proposals, so they
cannot be assumed to be tailored to individual proposals. Therefore, we may have that a 6= a∗.
This veil-of-ignorance argument is common in the discussion of majority rules in the the political
science literature, e.g., Aghion and Bolton (2003) and Holden (2004). The model has two classes
of equilibria. The first class are symmetric equilibria in mixed strategies. The second class are
asymmetric equilibria in pure strategies, so shareholders with the same information may choose
different strategies.
The symmetric equilibria of the voting game are analyzed by Feddersen and Pesendorfer (1998),
who have shown that all symmetric equilibria are in mixed strategies whenever a 6= a∗. Denote by
ωσ the probability to vote in favor of the proposal of a shareholder who has observed the signal
σ ∈ {0, 1}. Any symmetric mixed strategy equilibrium can be fully described by a tuple (ω0, ω1).
Based on the analysis of Feddersen and Pesendorfer (1998) and using (5) we prove the following
proposition in Appendix B.1:
Proposition 1 (Mixed Strategy Equilibria). There exists a responsive mixed strategy equilib-
rium whenever 2a∗ −N < a < 2a∗ + 1 where the mixing probabilities ωσ are given as follows:
(i) If 2a∗ −N < a < a∗, then ω0 = 0 and
0 < ω1 =h− 1
h (1− ε)− ε< 1 , where h =
µ1− ε
ε
¶N+a−2a∗N−a
. (6)
(ii) If a∗ + 1 < a < 2a∗ + 1, then ω1 = 1 and
0 < ω0 =f (1− ε)− ε
1− ε (1 + f)< 1 , where f =
µ1− ε
ε
¶a−1−2a∗a−1
. (7)
(iii) If a∗ ≤ a ≤ a∗ + 1, then ω0 = 0 and ω1 = 1, and the equilibrium is in pure strategies.
The proposition shows that shareholders either vote according to their information after observ-
7
ing a bad signal and mix after observing a good signal (case (i)), or the opposite (case (ii)). If the
statutory rule is optimal (case (iii)), then the equilibrium is in pure strategies. Only in this special
case do shareholders vote in favor whenever they observe a positive signal and against otherwise.
Following Austen-Smith and Banks (1996), we refer to this strategy as sincere voting.
In all pure strategy equilibria, some shareholders ignore their information and vote passively
for or against the proposal independently of their information. The remaining shareholders vote
sincerely and we denote their number by k. We prove the following theorem in Appendix B.2:7
Proposition 2 (Pure Strategy Equilibria). For any set of parameters such that
β(0, N) ≤ 1/2 ≤ β(N,N),
a number k of the N shareholders vote sincerely:
k = max {N − 2 |a∗ − a| , 0} , (8)
where a∗ is defined from condition (5). The remaining N − k shareholders vote passively for if
a ≥ a∗ and against if a < a∗. The number of passive voters is strictly positive if a 6= a∗.
The number of sincere voters is a linear, decreasing function of the absolute difference between
the statutory rule and the optimal rule, |a∗ − a|: If the statutory rule a exceeds the optimal rule
a∗, then some shareholders passively vote for, in the opposite case some shareholders passively vote
against. The number of shareholders voting sincerely can be zero, in which case the equilibrium is
non-responsive. Sincere voting by all shareholders only obtains when the statutory rule equals the
optimal rule.
2.4 Comparative Statics
In both mixed and pure strategy equilibria, voting behavior depends on the relation between the
statutory rule a and the optimal rule a∗. This dependence is the distinguishing property of strategic
voting.7Maug (1999) and Persico (2004) also discuss asymmetric equilibria.
8
2.4.1 Expected Proportion in Favor
The proportion in favor increases with the statutory rule. If the statutory rule exceeds the optimal
rule, a > a∗, then shareholders vote in favor more often. In mixed strategy equilibria, all share-
holders with a good signal and some of the shareholders with a bad signal vote in favor. In pure
strategy equilibria, all passively voting shareholders and sincerely voting shareholders with a good
signal vote in favor. If the statutory rule is less than the optimal rule, a < a∗, the behavior is
reversed. Hence, shareholders compensate for the conservatism of the statutory rule by voting in
favor more often.
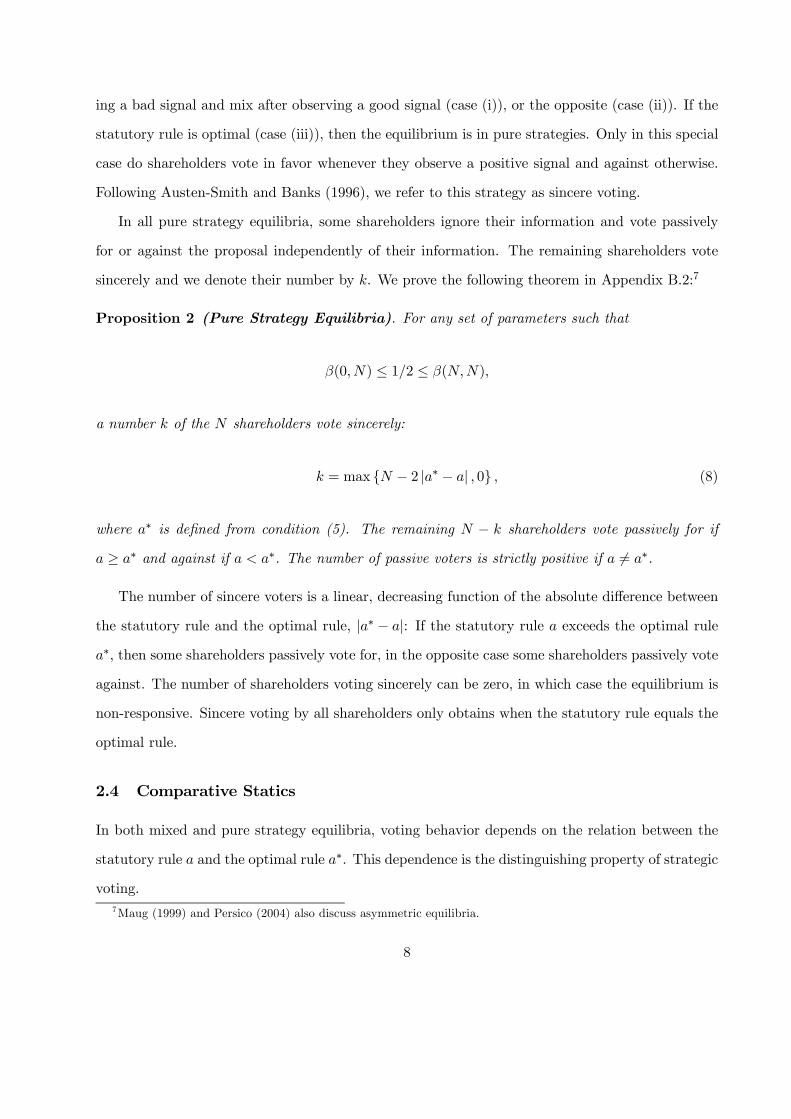
The relation between the proportion in favor and the statutory rule is illustrated numerically
in Figure 1. Define α = a/N , α∗ = a∗/N , and κ = k/N and let E(y/N) denote the expected
proportion in favor of a proposal. From Proposition 1, the expected proportion of votes in favor in
mixed strategy equilibria equals:
E (y/N) =
⎧⎪⎨⎪⎩ πω1 , if α < α∗ ,
π + (1− π)ω0, , if α ≥ α∗ .(9)
>From Proposition 2, the expected proportion of votes in favor in pure strategy equilibria equals:
E(y/N) =
⎧⎪⎨⎪⎩ πκ = π − 2πα∗ + 2πα , if α < α∗ ,
πκ+ 1− κ = π − 2(1− π)α∗ + 2(1− π)α , if α ≥ α∗ .(10)
In Figure 1, the pure strategy equilibria are represented by the piecewise linear (dash-dotted)
function with a kink at α = α∗, the mixed strategy equilibria by the non-linear (solid) function
with an inflection point at α = α∗, and sincere voting by the horizontal (dashed) line. The
figure emphasizes the difference between strategic and sincere voting. Strategic voting implies that
E(y/N) increases with α, whereas sincere voting implies no relation. The figure also illustrates the
difference between mixed and pure strategy equilibria, which is marked only for small values of ε.
The difference vanishes as ε→ 1/2.
9
0 0.2 0.4 0.6 0.8 10
0.2
0.4
0.6
0.8
1
Majority requirement (α)
Perc
enta
ge v
oted
in f
avor
(Y
/N)
Pure
Pure
Mixed
MixedSincere
Mixed StrategyPure StrategySincere
Figure 1: Expected Proportion in Favor and Statutory Rule: The non-linear function(solid) represents the expected proportion in favor for mixed strategy equilibria, the piecewiselinear function (dash-dotted) pure strategy equilibria, and the horizontal line (dashed) sincerevoting. Parameters: p = 0.7, ε = 0.02, and N = 50.
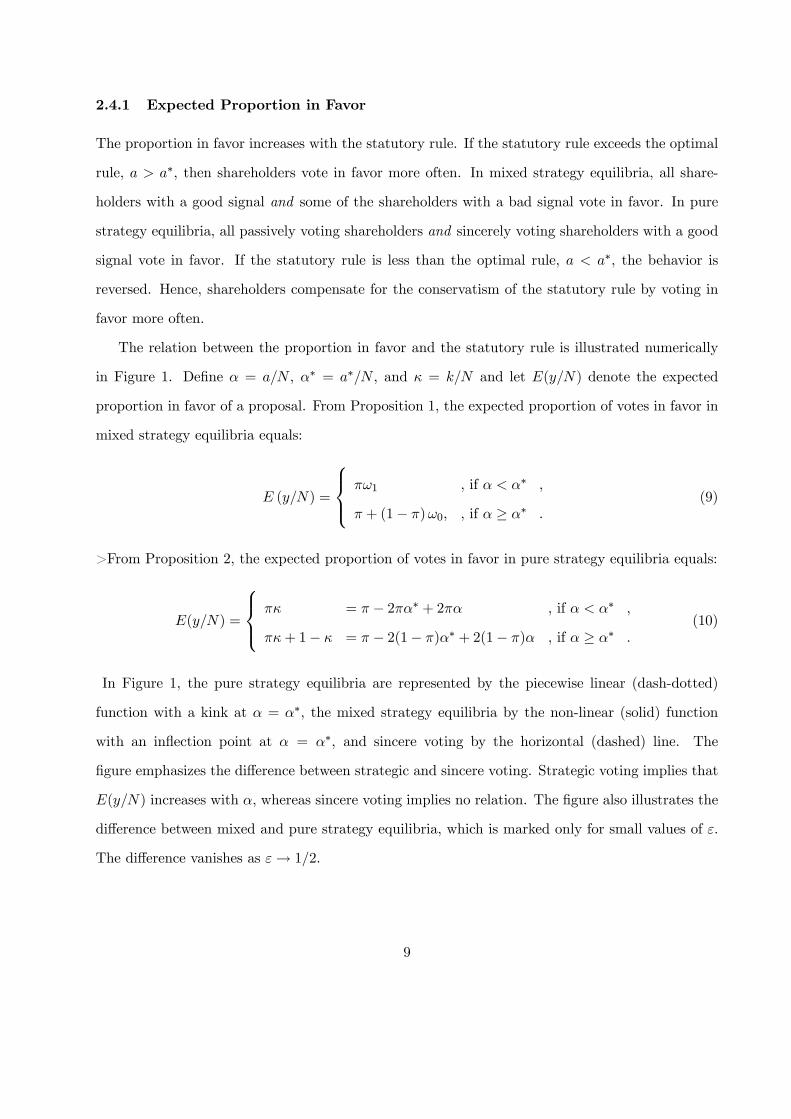
2.4.2 Pass Rate
The pass rate for a proposal is almost independent of the statutory rule. In the bad state, the
probability of incorrectly passing the proposal equals eII . Similarly, the probability of passing the
proposal in the good state is 1 minus the probability of incorrectly rejecting it, hence 1 − eI (see
equation (3)). Across states the pass rate equals
Pass = p (1− eI) + (1− p) eII . (11)
For all strategic voting equilibria, the pass rate converges relatively fast to the prior probability as
N gets large or ε gets small, except near the extreme submajority and supermajority rules:8
limN→∞
Pass = limε→0
Pass = p. (12)
8>From arguments which parallel Proposition 2 of Feddersen and Pesendorfer (1998), the error probabilitiesconverge to zero: limN→∞ eI = limN→∞ eII = 0. Then, (12) follows immediately.
10

When shareholders vote strategically, they effectively mimic the representative shareholder so that,
0 0.2 0.4 0.6 0.8 10
0.2
0.4
0.6
0.8
1
Majority Requirement (α)
Pass
Rat
e
Mixed
Pure
Sincere
MixedPureSincere
Figure 2: Pass Rate and Statutory Rule: Probability that a proposal passes for mixed strategyequilibria (solid), pure strategy equilibria (dash-dotted), and sincere voting (dashed). Parameters:p = 0.7, ε = 0.3, and N = 50.
on average, a proposal passes with probability p.
Figure 2 plots the pass rate as a function of the statutory rule α for pure strategy equilibria
(dash-dotted), mixed strategy equilibria (solid), and sincere voting (dashed). For both mixed and
pure strategy equilibria, the pass rate is close to the prior p except near the extreme submajority
and supermajority. Sincere voting, on the other hand, distorts the voting outcome unless the
statutory rule is close to the optimal rule. Sincerely voting shareholders tend to accept too many
proposals subject to a submajority rule and reject too many proposals subject to a supermajority
rule. Strategic voting mitigates these biases and eliminates them completely if the amount of
information is large (12).9
9This result relies crucially on the assumption of homogeneous preferences. A strategic voting model with hetero-geneous shareholders and conflicts of interest like Maug and Yilmaz (2002) behaves differently.
11
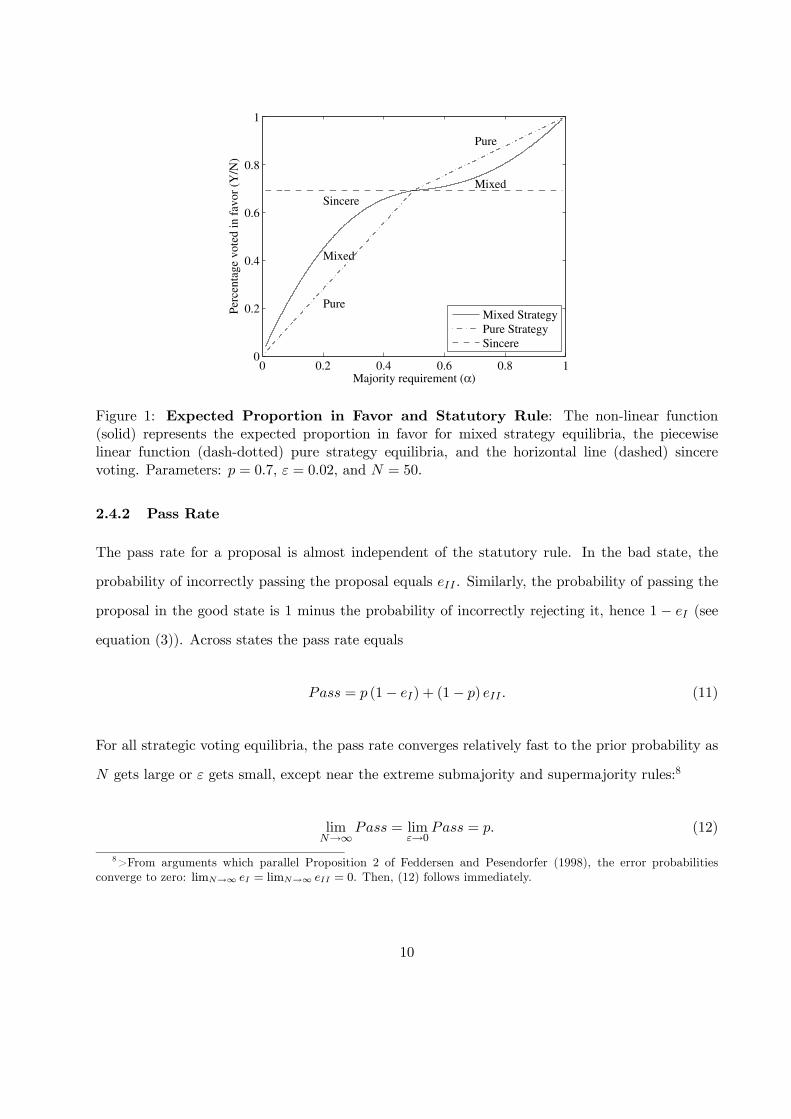
2.5 Efficiency Properties of Voting Rules
In Figure 3, we evaluate the loss function (3) numerically for mixed and for pure strategy equilibria,
sincere voting, the representative shareholder, and the two special cases with no private information
and perfect information, respectively. The figure emphasizes the following properties:
0 0.2 0.4 0.6 0.8 10
0.1
0.2
0.3
0.4
0.5
0.6
Majority Requirement (α)
Prob
abili
ty o
f E
rror
(L
)
SincerePureMixedNo information
Figure 3: Probability of Error and Statutory Rule: Loss function (3) for mixed strategy equi-libria (solid), pure strategy equilibria (dash-dotted), and sincere voting (dashed). The horizontalline (dotted) is the loss with no private information. Parameters: p = 0.7, ε = 0.3, and N = 50.
• Sincere voting results in larger errors than strategic voting except when the statutory rule
equals the optimal rule. In other words, sincere voting is an equilibrium if and only if α = α∗
(Austen-Smith and Banks (1996)).
• Strategic voting is always better than decision making without private information, because
each shareholder uses the available information in the same way as the representative share-
holder would, so more information is used without introducing a bias. When the statutory
rule approaches unanimity, the probability of error is almost as high with strategic voting
as with no private information. The inefficiency of the unanimity rule is the main insight
emphasized in Feddersen and Pesendorfer (1998).
12
• Sincere voting may result in larger errors than decision making without private information
because it introduces a bias. For the parameters in Figure 3, sincere voting destroys value
when the statutory rule exceeds approximately α = 2/3. >From the law of large numbers,
sincere voting inevitably leads to always reject when always accept is a better decision rule
(for p > 1/2). The loss for sincere voting is similar to that of no private information when
the statutory rule is less than approximately α = 1/3.10
• Pure strategy equilibria perform slightly better than mixed strategy equilibria, because mix-
ing equilibria involve some noise from uncoordinated voting decisions of shareholders, whereas
pure strategy equilibria rely on some exogenous coordination mechanism that assigns share-
holders the roles of sincere and passive voters.
3 Testing Methodology
In the empirical analysis, we emphasize the pure strategy equilibria, which can be estimated with
ordinary least squares, but we shall also estimate the mixed strategy equilibria with non-linear least
squares.
3.1 Pure Strategy Equilibria
Assume the following relation between the observed and the expected proportion in favor:
y/N = E(y/N) + ξ , (13)
where E(ξ) = Cov(π, ξ) = Cov(α∗, ξ) = 0 and V ar(ξ) = σ2. We shall estimate (13) in a cross-
section of proposals. Small amounts of noise arise within the theory from the realizations of
shareholders’ private information. Larger amounts of noise arise from omitted variables, which are
always present in field data, and from variation across proposals in the model parameters, π and
10Formally, the limit of the pass-rate is a step-function: 1, if α < ε, p, if ε < α < 1− ε, and 0, if α > 1− ε.
13

α∗. The assumptions imply a simple regression model from E (y/N) = γ0 + γ1α such that
y/N = γ0 + γ1α+ ξ . (14)
Combining (10) and (14), by equating corresponding coefficients, we obtain:
γ0 = π − 2πα∗ , γ1 = 2π , if α < α∗ ,
γ0 = π − 2(1− π)α∗ , γ1 = 2(1− π) , if α ≥ α∗ .(15)
Equations (14) and (15) define a piecewise linear regression with the kink at α∗. For the parameter
values in Figure 1, the top expressions of (15) defines the steeper line to the left, where α < α∗,
and the bottom expressions defines the flatter line to the right, where α ≥ α∗. Each line in (15)
represents a system of two linear equations in two unknowns with unique solutions given by:
π = γ12 , α∗ = 1
2 −γ0γ1
, if α < α∗ ,
π = 1− γ12 , α∗ = 1−γ0
γ1− 1
2 , if α ≥ α∗ .(16)
Our strategy is to estimate γ0 and γ1 from (14), compute estimates of π and α∗ from (16), and
perform tests based on these estimates.
Test 1. Strategic voting implies that γ1 > 0, whereas sincere voting implies γ1 = 0. This
represents a direct test on the regression parameters.
Test 2. Consider two groups of proposals such that pH > pL and accordingly πH > πL, and let
their respective slope parameters be γ1(πH) and γ1(πL). Strategic voting implies that the slope
parameters are different:
γ1(πH) > γ1(πL) , if α < α∗ ,
γ1(πH) < γ1(πL) , if α ≥ α∗ .(17)
14
Test 3. Strategic voting implies that the pass rate converges to p and becomes independent of α
as N increases. Let ν be a noise term. Using probit analysis, we shall estimate the model:
Pass = θ0 + θ1α+ ν, (18)
and test whether θ1 = 0. While this test requires the additional assumption that N is large, this
seems defensible in the context of shareholder voting.
Tests 1 to 3 do not depend on the assumption that error probabilities and payoffs are symmetric
across states, but the next two tests do. They are therefore not a test of the theory, but a test of
the specific parameterization.
Test S (symmetry). The model parameters are confined to the unit interval, π, α∗ ∈ [0, 1], which
constrains the regression parameters to γ0 ∈ [−1, 1] and γ1 ∈ [0, 2]. A wide range of values for the
regression parameters is consistent with the theory, but once we fix the value for one regression
parameter, the permissible range for the other parameter is considerably tighter:11
γ0 − γ12 ≤ 0 ≤ γ0 +
γ12 , if α < α∗ ,
γ0 +γ12 ≤ 1 ≤ γ0 +
3γ12 , if α ≥ α∗ .
(19)
Test M (majority rule). We are interested in testing whether the simple majority is optimal,
α∗ = 1/2. The implied restrictions on the regression parameters equal (from (16)):
γ0 = 0 , if α < α∗ = 1/2 .
γ0 + γ1 = 1 , if α ≥ α∗ = 1/2 .(20)
This test is also an implication of symmetry and requires that N is large or ε small.
11 If error probabilities or payoffs are asymmetric across states, γ1 is multiplied by numbers different from 1/2 and3/2, respectively, in (19).
15
3.2 Mixed Strategy Equilibria
Posit that y/N = E(y/N)+ ξ, where ξ is defined as above. We derive an expression for E(y/N) in
Appendix C and apply non-linear least squares to estimate:
y/N =
⎧⎪⎪⎪⎪⎨⎪⎪⎪⎪⎩γ0
Ã(1−γ1)
α+γ21−α −γ
α+γ21−α1
(1−γ1)1+γ21−α −γ
1+γ21−α1
!+ ξ if α < α∗,
γ0 + (1− γ0)
Ã(1−γ1)γ
γ2α −11 −γ1(1−γ1)
γ2α −1
(1−γ1)γ2α −γ
γ2α1
!+ ξ if α ≥ α∗,
(21)
where γ0 = π, γ1 = ε, and
γ2 =
⎧⎪⎨⎪⎩ 1− 2α∗ if α < α∗,
2α∗ if α ≥ α∗.
We can test whether the model parameters are plausible: π, α∗ ∈ [0, 1] and, from (2):12
ε ∈ [0, π] , if π < 1/2 ,
ε ∈ [0, 1− π] , if π ≥ 1/2 .(22)
These tests imply the analogues of Test 1 and 2. Test 3 is the same for pure and mixed strategy
equilibria. We are also interested in testing whether the simple majority rule is optimal (Test M).
The implied parameter restriction is:
γ2 =
⎧⎪⎨⎪⎩ 0 if α < α∗ = 1/2 ,
1 if α ≥ α∗ = 1/2 .(23)
4 Institutional Background & Data
4.1 Legal Background
Shareholders can vote at annual general meetings, special meetings, and by written consent. The
standard part of the annual general meeting includes the election of the board of directors and
ratification of auditors. The non-standard part includes management and shareholder proposals.
12Solve (2) for p and observe that ε < 1/2 from (1). Then, the conditions (22) follow from p ∈ (0, 1).
16

We study non-standard management proposals. We do not study elections, which are decided by
plurality voting. Shareholders can vote for a specific director or withhold, but cannot vote against.
We also do not consider shareholder proposals, which are not legally binding, so the meaning of
the majority rule is not clear.
Figure 4 displays a time line of events. An ownership register is established on the record
date, which occurs approximately 35 days before the shareholder meeting (Young, Millar, and
Glezen (1993)). The proxy material (Def 14a) is filed with the SEC and mailed to shareholders
about 20 days before the meeting. After the proxy material has become public, Institutional
Shareholder Services (ISS) and other private consulting firms analyze the proposals and issue vote
recommendations to their clients. The New York Stock Exchange and the American Stock Exchange
inform brokers whether a proposal is routine or non-routine according to NYSE rule 452 and Amex
rule 577, respectively (see below). The voting results are announced at the shareholder meeting
and filed with the SEC in the subsequent earnings report (10-K or 10-Q).
-
Recorddate
Filingdate
Meetingdate
ISSanalysis
NYSEroutine
? ?
Figure 4: Time Line: A shareholder register is established on the record date and the proxymaterial is mailed to shareholders on the filing date. ISS issues vote recommendations and NYSEand Amex classify proposals as routine or non-routine.
Only shareholders on the record date are eligible to vote. Shareholders can vote in person at the
meeting or by mailing back the proxy card or by internet. Votes can be cast either for or against a
proposal, but shareholders can also abstain. The proxy statement contains a vote recommendation
by management. If the proxy card is signed and dated, but returned blank, the votes are cast in
accordance with management’s recommendation.
17
Quorum requires that a majority of eligible votes are cast. When shares are registered in street
name, shareholders can instruct the broker to vote the shares. The treatment of uninstructed
shares depends on whether the proposal is routine or non-routine. When the proposal is routine,
the broker must vote the uninstructed shares, resulting in a broker vote. When a proposal is non-
routine, the broker cannot vote the uninstructed shares, but the broker non-votes count towards
quorum and are reported as a separate item along with the number of votes cast for and against
and abstentions in the 10-K/10-Q filing. Hence, all shares that are registered in street name count
towards quorum.
Management proposals are decided by majority voting. The corporate charters specify one
of three vote count methods. Let For, Against, and Abstain denote the number of votes cast
according to each label, and let Nonvoted denote the number of shares that are not voted.
Type I. A proposal passes if there is quorum and
For
For +Against> α . (24)
Abstentions, broker non-votes, and non-voted shares do not count.
Type II. A proposal passes if there is quorum and
For
For +Against+Abstain> α . (25)
Abstentions effectively count as votes against the proposal, but broker non-votes and non-voted
shares do not count.
Type III. A proposal passes if there is quorum and
For
For +Against+Abstain+Nonvoted> α . (26)
18

Abstentions, broker non-votes, and non-voted shares effectively count as votes against the proposal.
Exchange regulations require that there is an annual general meeting and that shareholders
approve equity-based compensation plans and significant stock-for-stock mergers and acquisitions.
Some investors are required to vote. Under the Employee Retirement Income Security Act (ERISA)
pension funds must vote according to two letters issued in 1988 (Avon Letter) and 1990 (ISSI letter),
and an amendment of the Investment Advisers Act (1940) as of 2003 requires that investment
advisers vote. State laws require that shareholders vote on fundamental corporate changes such as
mergers and charter amendments, but shareholders cannot vote on operating strategies, dividend
policy, or fix employment contracts (Easterbrook and Fischel (1983)). Otherwise, there are few
state law restrictions. Firms may choose any quorum and majority rules. Some states have default
supermajority rules for mergers and charter amendments. A few states require that the vote to
change a supermajority charter provision must be by an equal supermajority vote.
4.2 Data
The Investor Responsibility Research Center (IRRC) collects the voting results from 10-K/10-Q
filings for significant management proposals of large U.S. corporations. We purchase their data for
1994-2003. Each record states the company name, the meeting date, a verbal description of the
proposal, the voting results, and the statutory rule. For Type I proposals, the percent voted for and
against are reported and, for Type II and Type III proposals, also the abstentions. Three pieces
of information that are available from the proxy material and the 10-K/10-Q reports are missing:
The quorum rule, the shareholder turnout, and the number of broker non-votes. The data consists
of 15,447 management proposals of which data are complete for 14,548 management proposals put
forward at 9,158 shareholder meetings by 2,822 firms.
Brickley, Lease, and Smith (1994) and Bethel and Gillan (2002) show that routine proposals
receive more votes in their favor than non-routine proposals. We manually collect the routine
classification variable from the NYSE Weekly Bulletin and the Amex Weekly Bulletin, respectively.
Nasdaq does not classify proposals as routine or non-routine, but allows brokers to vote according
19
to the NYSE and Amex regulations. We shall estimate the missing values (see below).
Morgan and Poulsen (2001) and Bethel and Gillan (2002) show that proposals with positive vote
recommendations are associated with a five percentage points higher support than proposals with
negative vote recommendations. ISS vote recommendations are not public and very expensive to
purchase, but a subset is available on Investext. We collect available vote recommendations from
Investext using a combination of computer and manual extraction techniques. A small number
of vote recommendations are purchased from ISS. The final sample includes 7,748 management
proposals with vote recommendations.
Brickley, Lease, and Smith (1988), Morgan and Poulsen (2001) and Bethel and Gillan (2002),
show that the proportion in favor of a management proposal increases with insider ownership. For
each firm with at least one management proposal and a vote recommendation, we collect manually
the complete time-series of the ownership of officers and directors in 1994-2003 from the electronic
proxy statements (Edgar). Sometimes, when there are gaps in the time-series, we replace the
missing value with the observation closest in time (before or after). We define insider voting power
as the proportion of the voting rights owned by officers and directors and affiliated blocks. The
final sample includes 12,602 management proposals with data on insider ownership.
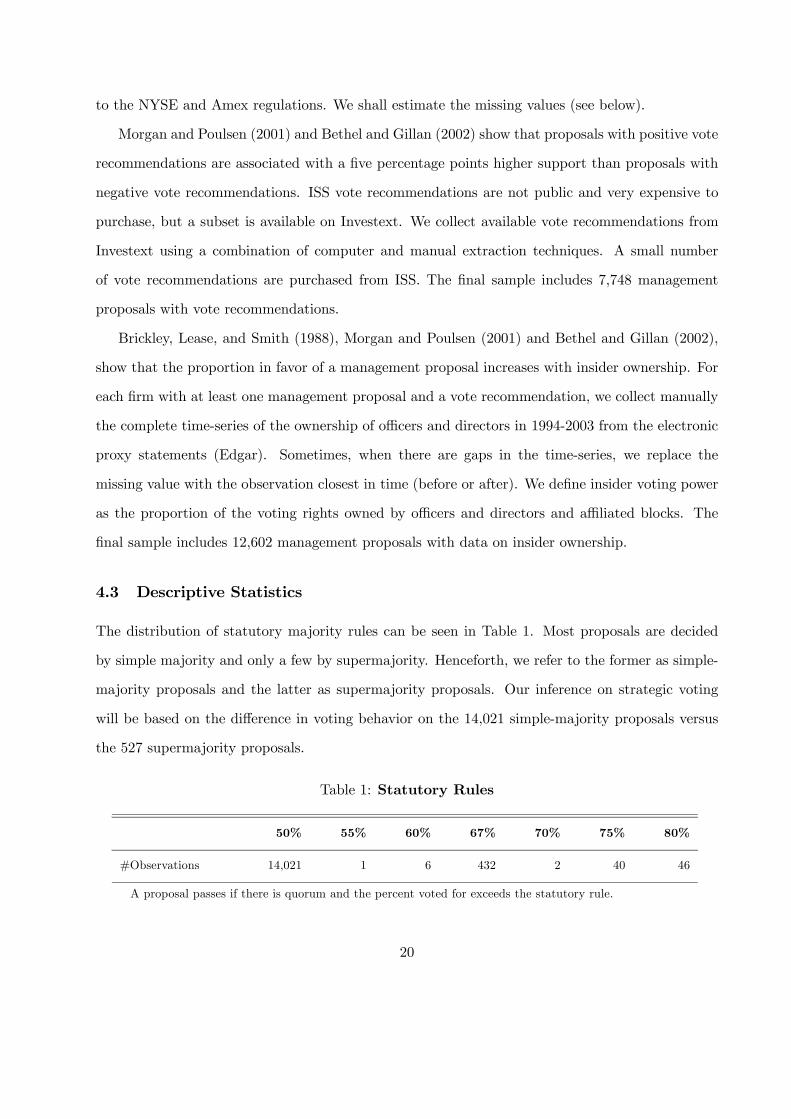
4.3 Descriptive Statistics
The distribution of statutory majority rules can be seen in Table 1. Most proposals are decided
by simple majority and only a few by supermajority. Henceforth, we refer to the former as simple-
majority proposals and the latter as supermajority proposals. Our inference on strategic voting
will be based on the difference in voting behavior on the 14,021 simple-majority proposals versus
the 527 supermajority proposals.
Table 1: Statutory Rules
50% 55% 60% 67% 70% 75% 80%
#Observations 14,021 1 6 432 2 40 46
A proposal passes if there is quorum and the percent voted for exceeds the statutory rule.
20

The voting results are examined in Table 2 for management proposals by NYSE and Amex
firms with known routine classification. The table reports the average proportion voted for and
against, abstentions and non-voted. The averages are conditional on the vote count method and
on routine classification. The proportions in the top four rows sum to one. The table also reports
the pass rate, the number of failed proposals, the number of proposals subject to a supermajority
rule, and the total number of proposals. Several observations can be made.
Table 2: Voting Results
Routine Non-routine
Type I Type II Type III Type I Type II Type III
Proportion voted for 0.899 0.891 0.791 0.853 0.829 0.709
Proportion voted against 0.101 0.098 0.068 0.147 0.154 0.059
Proportion abstain N/A 0.015 0.006 N/A 0.017 0.010
Proportion non-voted N/A N/A 0.135 N/A N/A 0.222
Pass rate 1.000 1.000 0.996 0.998 0.991 0.934
#Failed proposals 0 1 5 2 15 77
#Supermajority 10 8 121 68 7 245
#Observations 1,725 2,985 1,200 984 1,608 1,167
Management proposals by NYSE and Amex firms. Broker votes are included in the vote countsfor routine proposals. Type I: Proportions of shares voted for and against. Type II: Proportions ofshares voted including abstentions. Type III: Proportions of shares outstanding.
Turnout is high. The turnout can be inferred from the average proportion of non-voted shares
in the fourth row. Turnout is 86.6% for routine proposals (including broker votes) and 77.6% for
non-routine proposals (excluding broker votes). Regulations that require certain shareholders to
vote may contribute to the high shareholder turnout. Feddersen (2004) surveys the theories of
election turnout.
Voting outcomes are predictable. The average proportion in favor of a management proposal
is above 70% and the pass rate is near 100%. The high average pass rate is consistent with the
hypothesis that shareholders hire management as experts on running the firm and, therefore, that
21
the average management proposal is good. Pre-meeting behaviors may contribute to the low un-
certainty. Firstly, management may use their control over the agenda to bias the selection towards
high-p proposals, and management may settle with dissident shareholders before the meeting to
ensure a high probability of passage.13 Secondly, anticipating that a proposal will pass, a share-
holder with negative information may sell her shares before the meeting instead of voting against
the proposal (Burch, Morgan, and Wolf (2004)). As a result, the proportion in favor of Type I and
II proposals for which non-voted shares do not count may increase, because the old shareholder
with negative information may not want to vote the shares after they have been sold and the new
shareholder is not allowed to vote the shares. In any case, these behaviors do not bias our analysis,
they only shift the distribution towards high−p proposals.
Shareholders have private information. Some shareholders vote for and others vote against.
This observation suggests that shareholders have private information. Furthermore, when there
are multiple proposals at the same shareholder meeting, the proportion in favor is rarely equal
across the proposals. Controlling for routine classification and vote count method, the average
intra-meeting standard deviation is 0.059, and it is zero in less than 2% of shareholder meetings.
Non-voted shares matter. The proportion in favor and the pass rate are similar for proposals
of Type I and Type II, because abstentions are generally negligible, but the proportion in favor and
the pass rate are significantly less for proposals of Type III. Counting non-voted shares as votes
against the proposal, lowers the proportion in favor by 10 to 15 percentage points and swings the
outcome from pass to fail for 62 proposals. The number is substantial relative to the 100 failed
proposals in the table. Furthermore, 20 Type III proposals fail, because shareholder turnout is
less than the statutory rule, i.e., these proposals would have failed even if all the participating
shareholders had voted in favor.
Broker votes matter. Routine proposals obtain more votes in their favor than non-routine
proposals. On average, the broker raise the proportion in favor by 4.6% for Type I proposals, 6.2%
13See Carleton, Nelsen, and Weisbach (1998) for an example.
22
for Type II proposals, and 8.2% for Type III proposals. We use the conditional averages to estimate
the number of proposals which are swung by the broker votes. If we subtract the conditional average
from the observed proportion in favor, we find that the outcome of 60 proposals are swung from
pass to fail of which four are Type I proposals, 14 Type II proposals, and 42 Type III proposals.
Hence, we concur with Bethel and Gillan (2002) that broker votes may swing the outcome from
fail to pass for a significant number of management proposals.
Summary statistics for subcategories of management proposals are reported in Table 3. We have
classified the proposals into four categories: Compensation (Panel A), recapitalization (Panel B),
restructuring (Panel C), and charter amendments (Panel D). Corporate governance proposals to
restore shareholder rights (Panel D1) and corporate governance proposals to remove shareholder
rights (Panel D2) are separated from other charter amendments. A few proposals do not fit into
any of these categories and are eliminated. Some proposals are complex packages of subproposals.
We assume that proposals are packaged to avoid inconsistent outcomes. For example, proposals
to restructure are often packaged with proposals to issue stock. This combination is classified as a
restructuring proposal. We want to bring out the following patterns:
Compensation proposals dominate. Exchange regulations require shareholder approval of
equity-based compensation plans (see above). In addition, shareholder approval determines the
corporate tax status of both cash and equity-based compensation plans. Under Section 162(m) of
the Internal Revenue Code, a corporation may not deduct for federal income tax purposes annual
compensation in excess of $1 million paid to its officers and directors, unless the compensation is
approved by shareholders. Bebchuk and Fried (2004) argue that shareholders approve ineffective,
large-dilution compensation packages in order to secure this favorable tax treatment. If their
hypothesis is correct, then it may explain the high pass rate for compensation proposals and implies
that results on compensation proposals must be interpreted with caution.
Supermajority rules are used for all proposals. Supermajority rules are most common for
corporate governance proposals to restore shareholder rights (Panel D1), because charter rules that
entrench management are often supported by supermajority rules. Supermajority rules are least
23
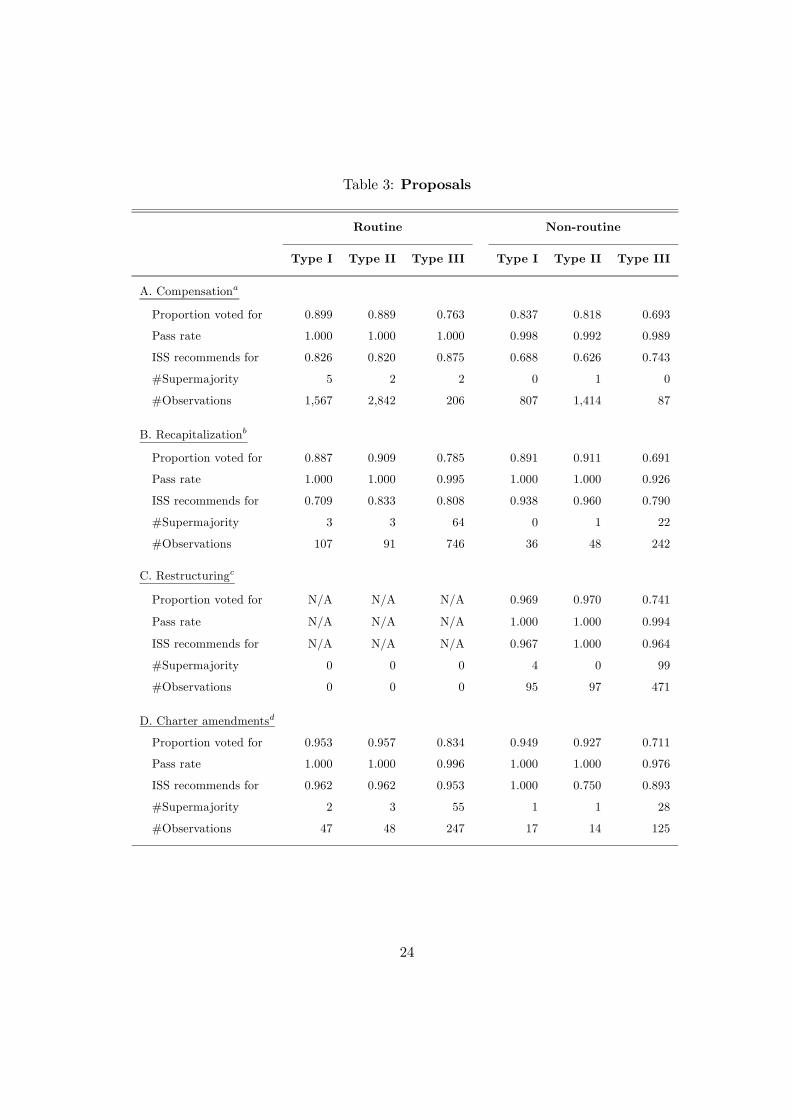
Table 3: Proposals
Routine Non-routine
Type I Type II Type III Type I Type II Type III
A. Compensationa
Proportion voted for 0.899 0.889 0.763 0.837 0.818 0.693
Pass rate 1.000 1.000 1.000 0.998 0.992 0.989
ISS recommends for 0.826 0.820 0.875 0.688 0.626 0.743
#Supermajority 5 2 2 0 1 0
#Observations 1,567 2,842 206 807 1,414 87
B. Recapitalizationb
Proportion voted for 0.887 0.909 0.785 0.891 0.911 0.691
Pass rate 1.000 1.000 0.995 1.000 1.000 0.926
ISS recommends for 0.709 0.833 0.808 0.938 0.960 0.790
#Supermajority 3 3 64 0 1 22
#Observations 107 91 746 36 48 242
C. Restructuringc
Proportion voted for N/A N/A N/A 0.969 0.970 0.741
Pass rate N/A N/A N/A 1.000 1.000 0.994
ISS recommends for N/A N/A N/A 0.967 1.000 0.964
#Supermajority 0 0 0 4 0 99
#Observations 0 0 0 95 97 471
D. Charter amendmentsd
Proportion voted for 0.953 0.957 0.834 0.949 0.927 0.711
Pass rate 1.000 1.000 0.996 1.000 1.000 0.976
ISS recommends for 0.962 0.962 0.953 1.000 0.750 0.893
#Supermajority 2 3 55 1 1 28
#Observations 47 48 247 17 14 125
24
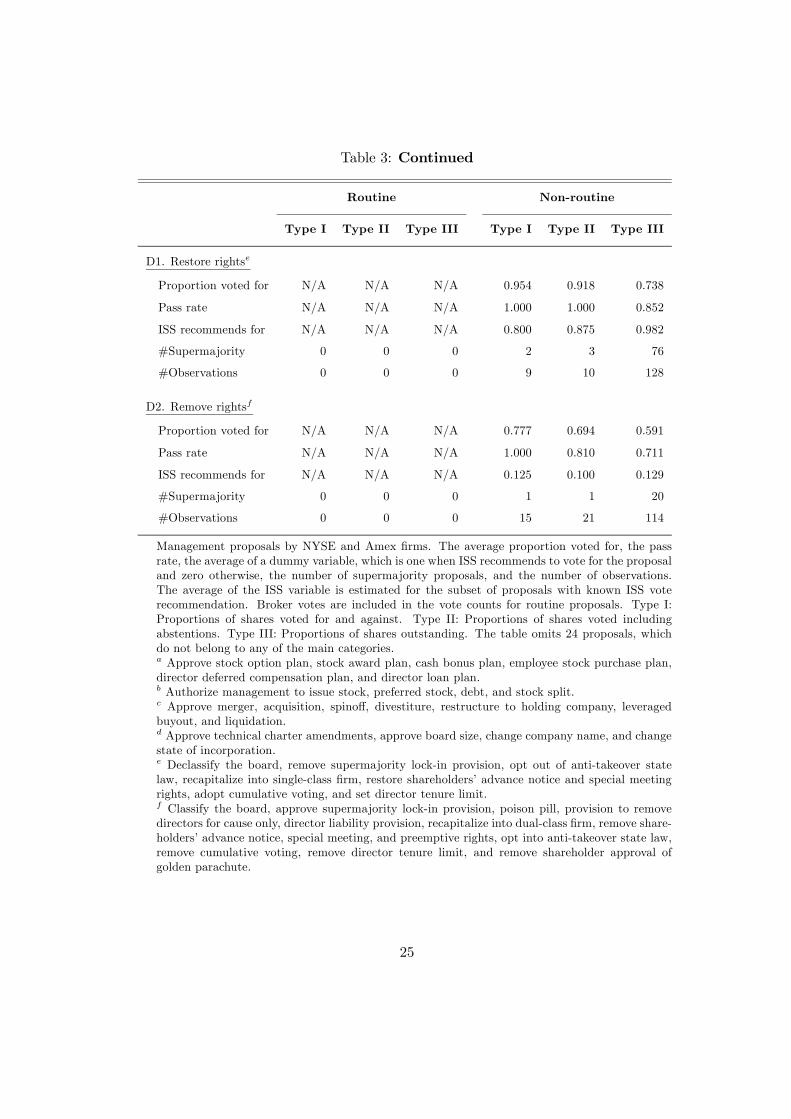
Table 3: Continued
Routine Non-routine
Type I Type II Type III Type I Type II Type III
D1. Restore rightse
Proportion voted for N/A N/A N/A 0.954 0.918 0.738
Pass rate N/A N/A N/A 1.000 1.000 0.852
ISS recommends for N/A N/A N/A 0.800 0.875 0.982
#Supermajority 0 0 0 2 3 76
#Observations 0 0 0 9 10 128
D2. Remove rightsf
Proportion voted for N/A N/A N/A 0.777 0.694 0.591
Pass rate N/A N/A N/A 1.000 0.810 0.711
ISS recommends for N/A N/A N/A 0.125 0.100 0.129
#Supermajority 0 0 0 1 1 20
#Observations 0 0 0 15 21 114
Management proposals by NYSE and Amex firms. The average proportion voted for, the passrate, the average of a dummy variable, which is one when ISS recommends to vote for the proposaland zero otherwise, the number of supermajority proposals, and the number of observations.The average of the ISS variable is estimated for the subset of proposals with known ISS voterecommendation. Broker votes are included in the vote counts for routine proposals. Type I:Proportions of shares voted for and against. Type II: Proportions of shares voted includingabstentions. Type III: Proportions of shares outstanding. The table omits 24 proposals, whichdo not belong to any of the main categories.a Approve stock option plan, stock award plan, cash bonus plan, employee stock purchase plan,director deferred compensation plan, and director loan plan.b Authorize management to issue stock, preferred stock, debt, and stock split.c Approve merger, acquisition, spinoff, divestiture, restructure to holding company, leveragedbuyout, and liquidation.d Approve technical charter amendments, approve board size, change company name, and changestate of incorporation.e Declassify the board, remove supermajority lock-in provision, opt out of anti-takeover statelaw, recapitalize into single-class firm, restore shareholders’ advance notice and special meetingrights, adopt cumulative voting, and set director tenure limit.f Classify the board, approve supermajority lock-in provision, poison pill, provision to removedirectors for cause only, director liability provision, recapitalize into dual-class firm, remove share-holders’ advance notice, special meeting, and preemptive rights, opt into anti-takeover state law,remove cumulative voting, remove director tenure limit, and remove shareholder approval ofgolden parachute.
25

common for compensation proposals (Panel A).
Voting outcomes for corporate governance proposals are uncertain. Voting outcomes are
predictable except for the proposals in the bottom right corner of Table 3: Non-routine, Type III,
corporate governance proposals to restore (Panel D1) or remove shareholder rights (Panel D2).
Since these proposals are often subject to supermajority approval, strategic voting may make the
biggest difference here.
Table 4: Insider Ownership
0-10% 10-20% 20-50% 50-100% Sum
Observations 8,278 1,712 1,826 786 12,602
Proportion 0.657 0.136 0.145 0.062 1.000
Proportion of the voting rights owned by officers and directors and affiliated blocks. Ownership data aremissing for 1,946 proposals.
Table 4 reports the distribution of insider ownership. For about two-thirds of the firms less
than 10% of their shares are held by insiders, whereas for about 6% of the firms in our sample
more than 50% of the shares are held by insiders. The firms with high ownership concentration are
recently listed firms, dual-class firms, and subsidiaries of other listed corporations. The empirical
results below do not depend on the inclusion of proposals by these firms.
5 Results
5.1 Pure Strategy Equilibria
We shall estimate the following regression model:
y/N = γ0 + γ1α+ β0X + ξ, (27)
26

where the vector of control variables X includes a dummy variable for Type III proposals, a dummy
variable for routine proposals, and insider voting power. Since we want to make inference from
the regression intercept, the sample mean is subtracted from each control variable. The list does
not include the ISS vote recommendation. We interpret ISS vote recommendation as public in-
formation, which is reflected in p, so that a positive recommendation is associated with a higher
p and therefore a higher value of π. Technically, ISS vote recommendations are not public, but
we suspect that many institutional shareholders and other blockholders buy ISS reports and have
access to their information, so that from the perspective of our model, ISS vote recommendations
are closer to common information reflected in p than to private signals. The interpretation of ISS
vote recommendation as a proxy for p is supported by the evidence in Section 5.3 below. According
to (15), a proxy for π must enter the regression model interactively. Therefore, we shall estimate the
regression separately for proposals with positive and negative vote recommendations and compare
the coefficients across the two subsets.
The model in Section 2 assumes that shares are voted for or against a proposal and is silent
about abstentions and non-voted shares. Therefore, in testing the model, we shall transform the
data and define the proportion in favor as:
y/N =For
For +Against. (28)
The transformation makes no difference for Type I proposals, it makes only a small difference for
Type II proposals, but it makes a bigger difference for Type III proposals.
We employ all 14,548 proposals with complete voting results. The routine dummy variable is
missing for proposals at Nasdaq firms and must be estimated. We classify restructuring proposals
and governance proposals as non-routine according to the NYSE and Amex rules. Furthermore,
we classify Type III proposals depending on observed shareholder turnout: The proposal is routine
if turnout exceeds 85% and it is non-routine if turnout is less than 75%. Missing values on the
remaining Type III proposals, and Type I and Type II proposals by Nasdaq firms, are replaced
by the conditional sample mean for each of the proposal subcategories in Table 3. Missing insider
ownership data are replaced by the unconditional mean.
27

Table 5 reports the coefficients of ordinary least squares (15) and model parameters (16) as-
suming that α ≥ α∗. Imputed model parameters for α < α∗ are rejected (Test S) and not reported.
Robust standard errors are reported below the coefficients. We ignore possible firm- or meeting-
fixed effects, because the panel is unbalanced with mostly short time-series. There is a single
observation for 16% of the sample firms and 61% of all shareholder meetings. These observations
would be lost using panel regressions with fixed effects. The results (not reported) are similar in
regressions where we include only one proposal at each level of the statutory rule from each share-
holder meeting, so intra-meeting correlation does not affect our results. We also notice that the
527 supermajority proposals are spread out among 442 shareholder meetings. Since management
proposals typically pass, they rarely reappear on the agenda next year. We discuss the regression
results with respect to the tests in Section 3.
Test 1. The proportion in favor increases significantly with the statutory majority rule. This
result is consistent with strategic voting and inconsistent with sincere voting. The slope coefficient
implies that a proposal at α = 2/3 obtains 3.5% more votes in favor than a simple-majority proposal.
When the supermajority rule is α = 4/5, the additional support is 6.3%. These additional votes
swing 74 of 527 supermajority proposals from fail to pass. The effect on the pass rate is similar
to that of the vote count method and broker votes (see Section 4.3 above), so the economic effect
of strategic voting is comparable in magnitude to other effects that have been documented on
shareholder voting before.
Test 2. The slope coefficient γ1 is steeper in the subsample with negative vote recommendations.
We interpret a negative vote recommendation as a proxy for πL and a positive vote recommendation
as a proxy for πH . Then, the difference between the slope coefficients is consistent with strategic
voting. The imputed model parameter π in Panel B and the statistical test in the top row of
Panel C support this interpretation of the data.
Test S. The model parameters, π and α∗, lie within the unit interval and a test of the quantitative
restrictions on the regression parameters are consistent with the model assumption that the payoffs
28
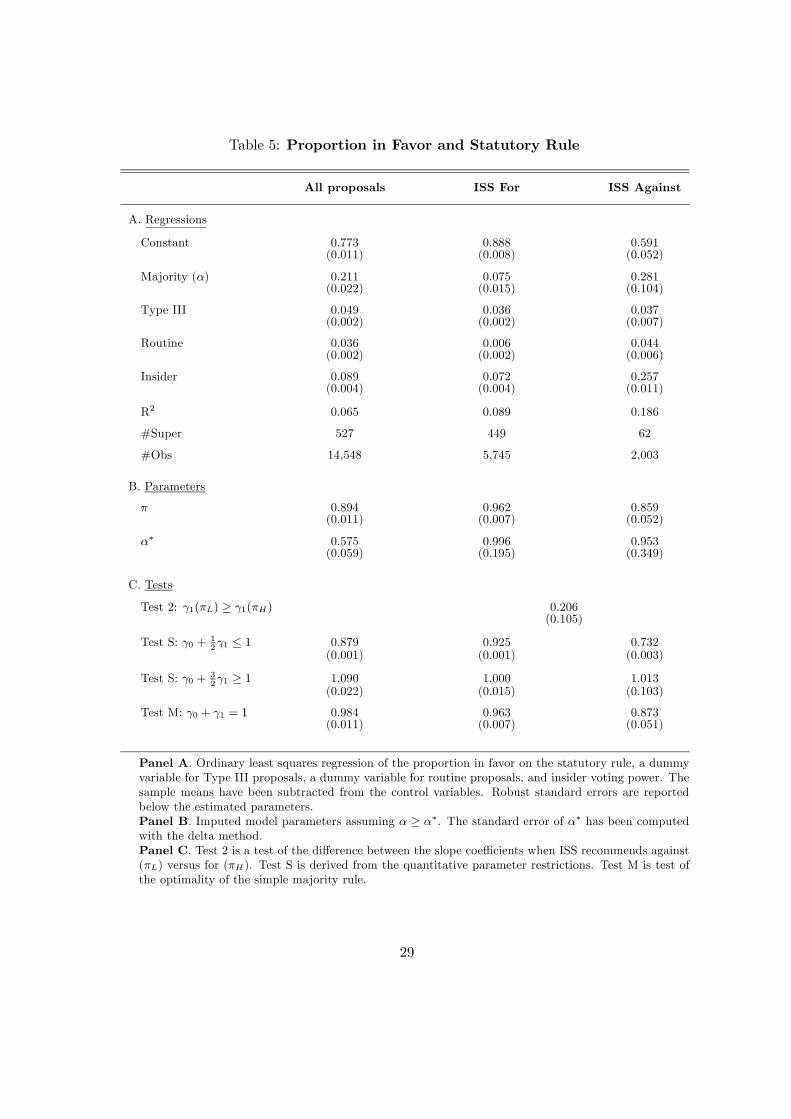
Table 5: Proportion in Favor and Statutory Rule
All proposals ISS For ISS Against
A. Regressions
Constant 0.773 0.888 0.591(0.011) (0.008) (0.052)
Majority (α) 0.211 0.075 0.281(0.022) (0.015) (0.104)
Type III 0.049 0.036 0.037(0.002) (0.002) (0.007)
Routine 0.036 0.006 0.044(0.002) (0.002) (0.006)
Insider 0.089 0.072 0.257(0.004) (0.004) (0.011)
R2 0.065 0.089 0.186
#Super 527 449 62
#Obs 14,548 5,745 2,003
B. Parameters
π 0.894 0.962 0.859(0.011) (0.007) (0.052)
α∗ 0.575 0.996 0.953(0.059) (0.195) (0.349)
C. Tests
Test 2: γ1(πL) ≥ γ1(πH) 0.206(0.105)
Test S: γ0 + 12γ1 ≤ 1 0.879 0.925 0.732
(0.001) (0.001) (0.003)
Test S: γ0 + 32γ1 ≥ 1 1.090 1.000 1.013
(0.022) (0.015) (0.103)
Test M: γ0 + γ1 = 1 0.984 0.963 0.873(0.011) (0.007) (0.051)
Panel A. Ordinary least squares regression of the proportion in favor on the statutory rule, a dummyvariable for Type III proposals, a dummy variable for routine proposals, and insider voting power. Thesample means have been subtracted from the control variables. Robust standard errors are reportedbelow the estimated parameters.Panel B. Imputed model parameters assuming α ≥ α∗. The standard error of α∗ has been computedwith the delta method.Panel C. Test 2 is a test of the difference between the slope coefficients when ISS recommends against(πL) versus for (πH). Test S is derived from the quantitative parameter restrictions. Test M is test ofthe optimality of the simple majority rule.
29

and errors are symmetric. The point estimates of π are similar to the unconditional average
proportion in favor of the proposal (Table 2).
Test M. Using all proposals, we cannot reject the hypothesis that the simple majority rule is
optimal. In this case, the model parameters are consistent with the identifying condition α ≥ α∗.
For the two subsets with ISS vote recommendations, the optimality of the simple majority rule is
rejected, and the identifying condition α ≥ α∗ is violated for some proposals, but we do not have
enough variation in the statutory rule to estimate the break point in the data.
Control variables. After scaling, Type III proposals attract about four to five percentage points
more votes in their favor than Type I and Type II proposals. The additional votes can be the
result of strategic voting behavior. Knowing that non-voted shares count against the proposal,
some shareholders may passively vote in favor to offset the bias. Routine proposals receive higher
support than non-routine proposals, and the effect is stronger when ISS recommends against the
proposal. We do not know if the additional support is due to broker-votes or other shareholders’
votes. Finally, we can see that the proportion in favor increases with insider ownership. The
effect is stronger when the ISS recommendation is against, because negative recommendations are
associated with more concentrated insider ownership.
5.2 Mixed Strategy Equilibria
Table 6 summarizes our non-linear least squares estimations for the mixed strategy equilibria. The
estimation must be carried out without the control variables. The table reports the results of
estimating (21) and those of a corresponding regression subject to the restriction that p = 0.99.
We report only the results for the parameter region α ≥ α∗, because the identifying condition
α < α∗ is violated in the other region. In the unrestricted regression, the parameter estimates for
π and α∗ are close to those of the pure strategy equilibria, while the estimate for ε falls outside the
allowed range in (22), but the standard error is large. In the restricted regression, where we force
ε to be inside the permissible range from 0 to 1−π, the point estimates are the maximum allowed.
The parameter estimates suggest that the mixed strategy equilibria are similar to the pure strategy
30
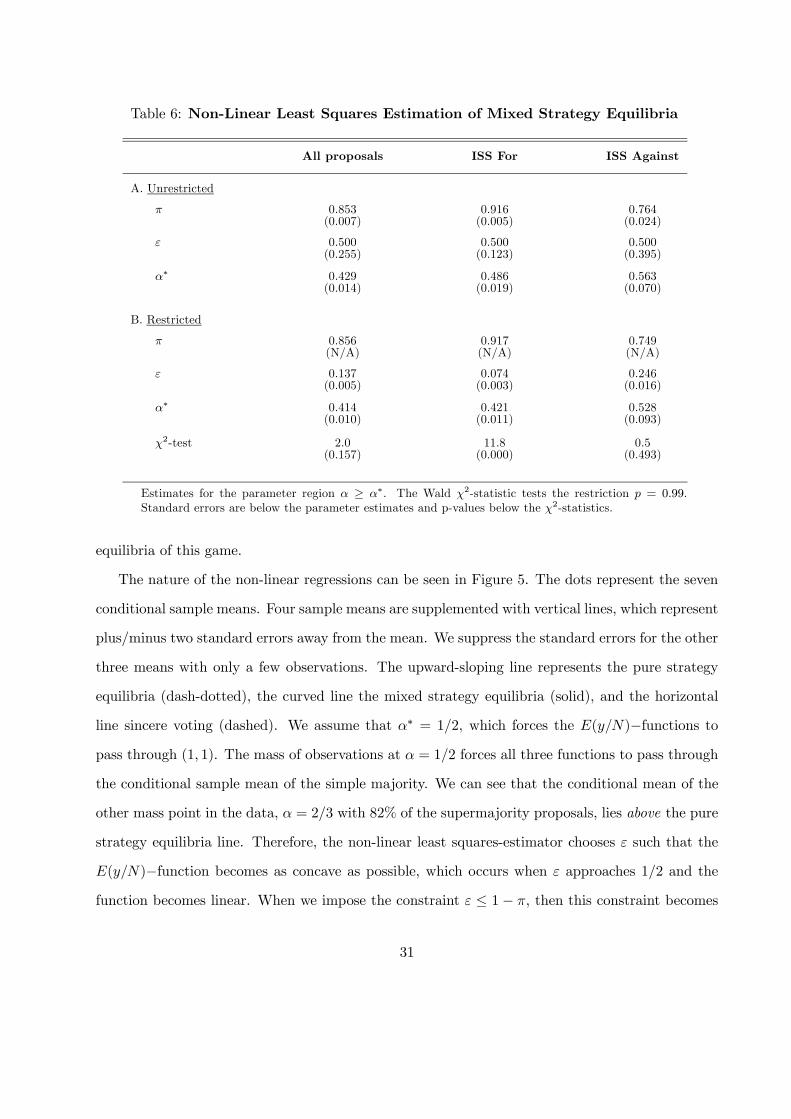
Table 6: Non-Linear Least Squares Estimation of Mixed Strategy Equilibria
All proposals ISS For ISS Against
A. Unrestricted
π 0.853 0.916 0.764(0.007) (0.005) (0.024)
ε 0.500 0.500 0.500(0.255) (0.123) (0.395)
α∗ 0.429 0.486 0.563(0.014) (0.019) (0.070)
B. Restricted
π 0.856 0.917 0.749(N/A) (N/A) (N/A)
ε 0.137 0.074 0.246(0.005) (0.003) (0.016)
α∗ 0.414 0.421 0.528(0.010) (0.011) (0.093)
χ2-test 2.0 11.8 0.5(0.157) (0.000) (0.493)
Estimates for the parameter region α ≥ α∗. The Wald χ2-statistic tests the restriction p = 0.99.Standard errors are below the parameter estimates and p-values below the χ2-statistics.
equilibria of this game.
The nature of the non-linear regressions can be seen in Figure 5. The dots represent the seven
conditional sample means. Four sample means are supplemented with vertical lines, which represent
plus/minus two standard errors away from the mean. We suppress the standard errors for the other
three means with only a few observations. The upward-sloping line represents the pure strategy
equilibria (dash-dotted), the curved line the mixed strategy equilibria (solid), and the horizontal
line sincere voting (dashed). We assume that α∗ = 1/2, which forces the E(y/N)−functions to
pass through (1, 1). The mass of observations at α = 1/2 forces all three functions to pass through
the conditional sample mean of the simple majority. We can see that the conditional mean of the
other mass point in the data, α = 2/3 with 82% of the supermajority proposals, lies above the pure
strategy equilibria line. Therefore, the non-linear least squares-estimator chooses ε such that the
E(y/N)−function becomes as concave as possible, which occurs when ε approaches 1/2 and the
function becomes linear. When we impose the constraint ε ≤ 1− π, then this constraint becomes
31

binding.
0.4 0.5 0.6 0.7 0.8 0.9 10.5
0.55
0.6
0.65
0.7
0.75
0.8
0.85
0.9
0.95
1Vote in favor vs. majority requirement. Parameters: ε = 0.12 π = 0.875
Majority requirement (α)
Perc
enta
ge v
oted
in f
avor
(Y
/N) ♦
14021
♦1
♦6
♦432 ♦ 2
♦40
♦46
Figure 5: Predicted and Observed Proportion in Favor: Mixed strategy equilibria (solid),pure strategy equilibria (dash-dotted), sincere voting (dashed), and conditional sample means(marked with a diamond). The labels indicate the number of observations. The vertical linesrepresent the ±2 standard error-bounds around the conditional sample means.
5.3 Test 3: Pass Rate and Statutory Rule
We estimate a probit model with the dependent variable equal to one if the proposal passes and
zero if it fails. In addition to the independent variables used above, we add a variable which equals
one when ISS recommends for and zero when ISS recommends against. Missing values are replaced
by the unconditional sample mean. The ISS vote recommendation enters the probit regression
additively, because, under the null hypothesis that shareholders vote strategically, a shift in the
prior p affects only the intercept and not the sensitivity to the majority rule, which is zero.
The estimation results are reported in Panel A of Table 7. Specification (1) assigns equal weight
to all observations. The pass rate decreases with the statutory rule and the dummy for Type III
proposals, and it increases with the ISS variable, the routine dummy, and insider ownership. All
32

Table 7: Pass Rate and Statutory Rule
Ordinary probit Weighted probit Turnout restriction
(1) (2) (3)
A. Results
Constant 3.51 2.97 2.28(0.25) (0.65) (0.81)
Majority (α) -4.30 -3.19 -1.79(0.48) (1.29) (1.62)
ISS For 1.09 1.05 1.08(0.08) (0.08) (0.09)
Type III -0.53 -0.55 -0.52(0.07) (0.07) (0.07)
Routine 0.71 0.66 0.63(0.08) (0.08) (0.08)
Insider 1.17 1.29 1.27(0.26) (0.29) (0.29)
#Fail 207 166 159
#Obs 14,548 14,548 14,519
B. Significance
Elasticity at mean α -0.0292 -0.0209 -0.0115
Pass2/3 − Pass1/2 -0.0049 -0.0035 -0.0019
Ordinary probit: Pass/fail dummy variable, the statutory rule, a dummy variable for ISS vote rec-ommendations, a dummy variable for Type III proposals, a dummy variable for routine proposals, andinsider voting power. Missing values for the ISS dummy, the routine dummy, and insider voting power arereplaced by sample means. Panel A reports estimated coefficients and standard errors (below). Panel Breports the elasticity at mean α and the implied change in the pass rate when the statutory rule increasesfrom 1/2 to 2/3.Weighted probit: The weight is the square root of the number of observations at each level of thestatutory rule times the pass probability times the failure probability. The weighted failure count is lessthan the actual count when the weight is low.Turnout restriction: Weighted probit without 29 Type III proposals, where shareholder turnout is lessthan the statutory rule.
33

coefficients are statistically different from zero. The statistically negative relation between the pass
rate and the statutory rule verifies the findings by Brickley, Lease, and Smith (1988) and (1994),
who use ordinary least squares instead of probit analysis. Specification (2) puts less weight on
the supermajority proposals using as weight wα =pnα × p× (1− p). The weighting procedure
assumes that the pass rate is estimated less accurately when there are few observations. The
estimated coefficients are similar to specification (1) and remain statistically different from zero.
Specification (3) repeats the weighted regression without 29 Type III proposals for which share-
holder turnout is less than the statutory rule. These proposals fail regardless of the number of
votes in favor. Five observations occur at α = 1/2 and 17 at α = 4/5. In specification (3), the
relation between the pass rate and the statutory rule is not statistically different from zero.
In Panel B of Table 7, we can see that the elasticity of the pass rate with respect to the statutory
rule is small and implies that the pass rate decreases by less than one half percent as we move from
simple majority to two-thirds supermajority. In Table 8, we report the predicted pass rate for
p = 0.9, N = 30, and ε = {0.1, 0.2, 0.3}. Strategic voting (Panel A) implies that the relation
between the pass rate and the statutory rule is close to zero, but positive. In contrast, sincere
voting (Panel B) predicts a sharp decline in the pass rate except when the error term is small.
While the prediction of the voting theory is not perfectly aligned with the evidence in Table 7, we
conclude that the predictions of strategic voting does much better than sincere voting.
5.4 Economic Significance
Economic significance can be assessed by evaluating the loss function (3) for {p, ε,N}. Table 3
suggests that model parameters vary with the vote count method, routine classification, and pro-
posal category. The economic value of voting is small when the prior p is high and the scope for
improvement is small, so we focus on the proposals in the rightmost column in Table 3, where the
pass rate is lower and the economic value of voting is potentially higher. We omit the compensa-
tion proposals, which are rarely subject to a supermajority rule. We shall assume that N = 30,
p equals the observed pass rate, and that π equals the average proportion voted for. The error
term ε is implied by (2). We set π equal to the average proportion in favor, because there are too
34
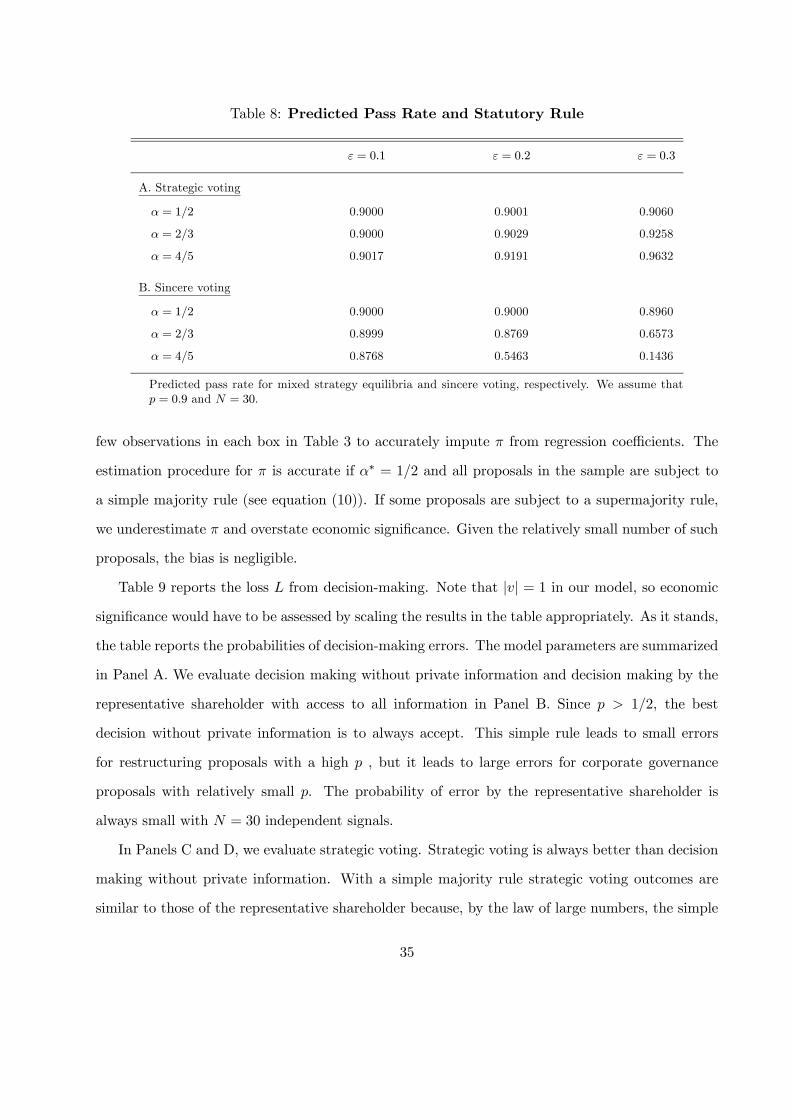
Table 8: Predicted Pass Rate and Statutory Rule
ε = 0.1 ε = 0.2 ε = 0.3
A. Strategic voting
α = 1/2 0.9000 0.9001 0.9060
α = 2/3 0.9000 0.9029 0.9258
α = 4/5 0.9017 0.9191 0.9632
B. Sincere voting
α = 1/2 0.9000 0.9000 0.8960
α = 2/3 0.8999 0.8769 0.6573
α = 4/5 0.8768 0.5463 0.1436
Predicted pass rate for mixed strategy equilibria and sincere voting, respectively. We assume thatp = 0.9 and N = 30.
few observations in each box in Table 3 to accurately impute π from regression coefficients. The
estimation procedure for π is accurate if α∗ = 1/2 and all proposals in the sample are subject to
a simple majority rule (see equation (10)). If some proposals are subject to a supermajority rule,
we underestimate π and overstate economic significance. Given the relatively small number of such
proposals, the bias is negligible.
Table 9 reports the loss L from decision-making. Note that |v| = 1 in our model, so economic
significance would have to be assessed by scaling the results in the table appropriately. As it stands,
the table reports the probabilities of decision-making errors. The model parameters are summarized
in Panel A. We evaluate decision making without private information and decision making by the
representative shareholder with access to all information in Panel B. Since p > 1/2, the best
decision without private information is to always accept. This simple rule leads to small errors
for restructuring proposals with a high p , but it leads to large errors for corporate governance
proposals with relatively small p. The probability of error by the representative shareholder is
always small with N = 30 independent signals.
In Panels C and D, we evaluate strategic voting. Strategic voting is always better than decision
making without private information. With a simple majority rule strategic voting outcomes are
similar to those of the representative shareholder because, by the law of large numbers, the simple
35
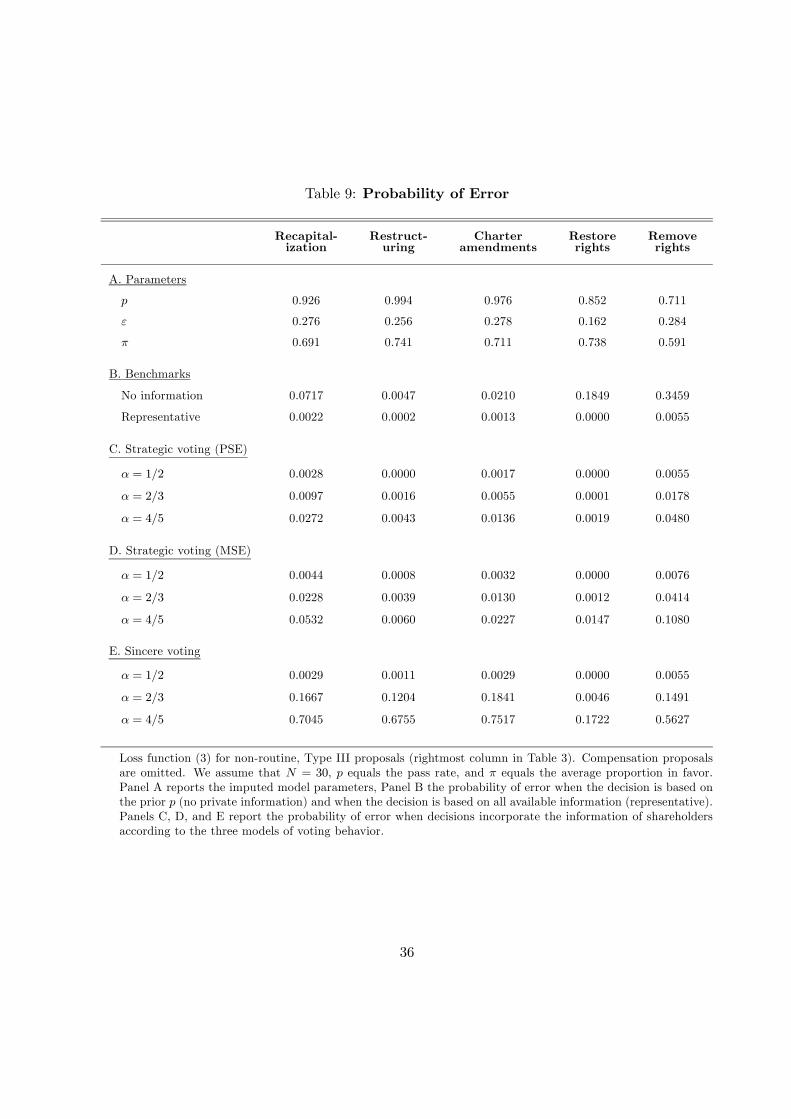
Table 9: Probability of Error
Recapital-ization
Restruct-uring
Charteramendments
Restorerights
Removerights
A. Parameters
p 0.926 0.994 0.976 0.852 0.711
ε 0.276 0.256 0.278 0.162 0.284
π 0.691 0.741 0.711 0.738 0.591
B. Benchmarks
No information 0.0717 0.0047 0.0210 0.1849 0.3459
Representative 0.0022 0.0002 0.0013 0.0000 0.0055
C. Strategic voting (PSE)
α = 1/2 0.0028 0.0000 0.0017 0.0000 0.0055
α = 2/3 0.0097 0.0016 0.0055 0.0001 0.0178
α = 4/5 0.0272 0.0043 0.0136 0.0019 0.0480
D. Strategic voting (MSE)
α = 1/2 0.0044 0.0008 0.0032 0.0000 0.0076
α = 2/3 0.0228 0.0039 0.0130 0.0012 0.0414
α = 4/5 0.0532 0.0060 0.0227 0.0147 0.1080
E. Sincere voting
α = 1/2 0.0029 0.0011 0.0029 0.0000 0.0055
α = 2/3 0.1667 0.1204 0.1841 0.0046 0.1491
α = 4/5 0.7045 0.6755 0.7517 0.1722 0.5627
Loss function (3) for non-routine, Type III proposals (rightmost column in Table 3). Compensation proposalsare omitted. We assume that N = 30, p equals the pass rate, and π equals the average proportion in favor.Panel A reports the imputed model parameters, Panel B the probability of error when the decision is based onthe prior p (no private information) and when the decision is based on all available information (representative).Panels C, D, and E report the probability of error when decisions incorporate the information of shareholdersaccording to the three models of voting behavior.
36
majority rule approximates the optimal majority rule for N = 30. When the supermajority rule
is high, α = 4/5, and the prior is relatively low, strategic voting results in substantially larger
errors than the representative shareholder. Hence, supermajority rules are potentially costly to
shareholders. We can also see in Panels C and D that pure strategy equilibria dominate mixed
strategy equilibria. This is a generic feature of the model, which we discuss above (see Section 2.5).
In Panel E, we evaluate sincere voting. Sincere voting is as good as strategic voting at the
simple majority rule, but sincere voting makes things worse when the proposal is subject to a
supermajority rule. The probability of error is much higher than decision making without private
information, because sincere voting tends to result in rejection when always accept, on average, is
a better decision rule.
6 Relation to the Shareholder Voting Literature
The analysis in this paper is centered around the positive relation between the proportion in favor
and the statutory rule. The relation is not a new discovery and explanations other than strategic
voting have been offered.
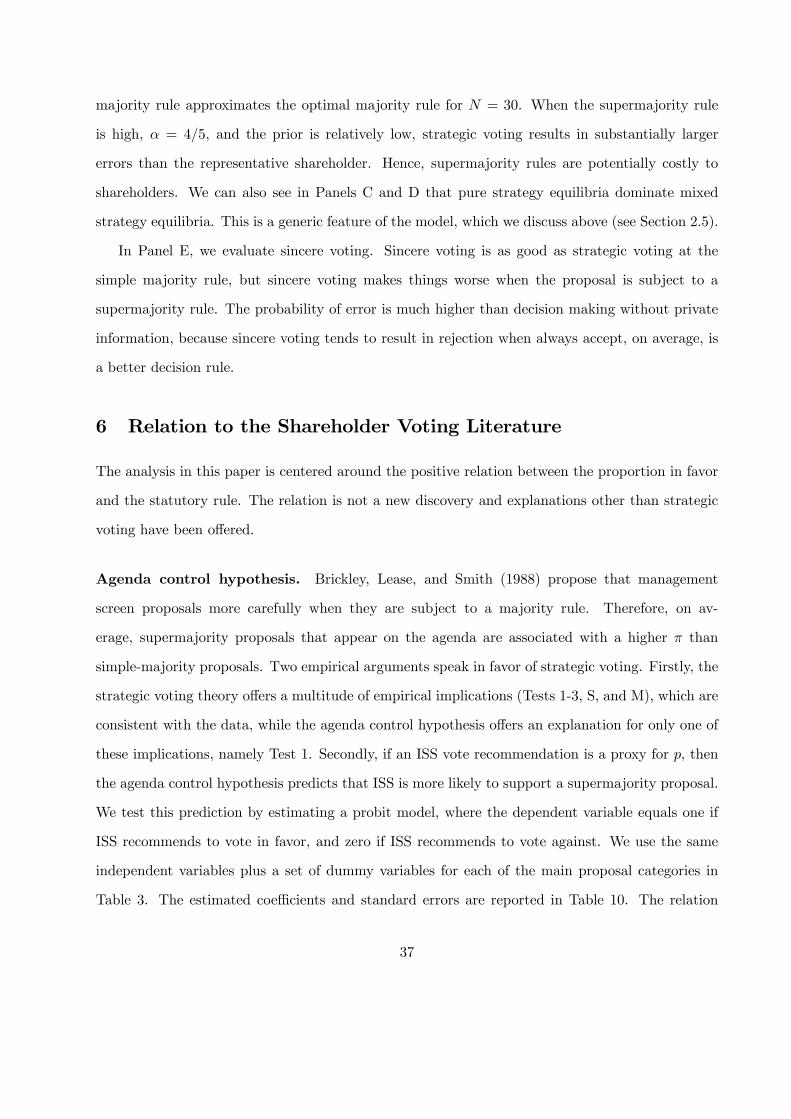
Agenda control hypothesis. Brickley, Lease, and Smith (1988) propose that management
screen proposals more carefully when they are subject to a majority rule. Therefore, on av-
erage, supermajority proposals that appear on the agenda are associated with a higher π than
simple-majority proposals. Two empirical arguments speak in favor of strategic voting. Firstly, the
strategic voting theory offers a multitude of empirical implications (Tests 1-3, S, and M), which are
consistent with the data, while the agenda control hypothesis offers an explanation for only one of
these implications, namely Test 1. Secondly, if an ISS vote recommendation is a proxy for p, then
the agenda control hypothesis predicts that ISS is more likely to support a supermajority proposal.
We test this prediction by estimating a probit model, where the dependent variable equals one if
ISS recommends to vote in favor, and zero if ISS recommends to vote against. We use the same
independent variables plus a set of dummy variables for each of the main proposal categories in
Table 3. The estimated coefficients and standard errors are reported in Table 10. The relation
37
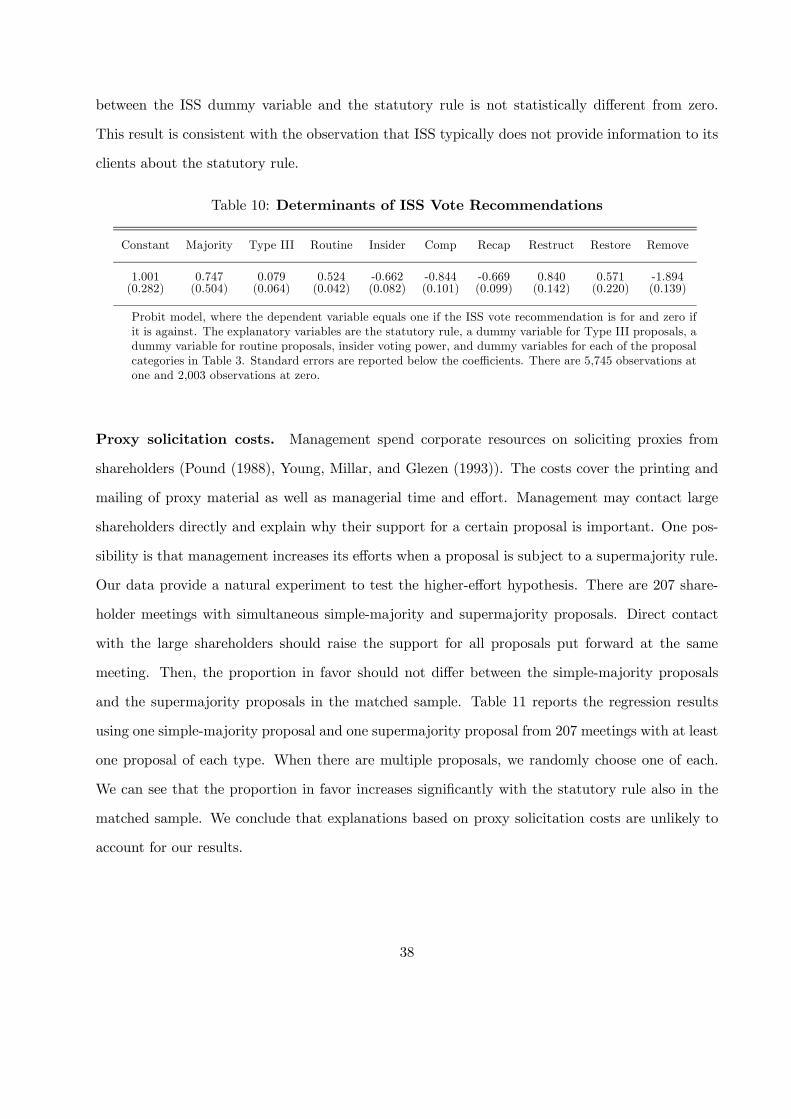
between the ISS dummy variable and the statutory rule is not statistically different from zero.
This result is consistent with the observation that ISS typically does not provide information to its
clients about the statutory rule.
Table 10: Determinants of ISS Vote Recommendations
Constant Majority Type III Routine Insider Comp Recap Restruct Restore Remove
1.001 0.747 0.079 0.524 -0.662 -0.844 -0.669 0.840 0.571 -1.894(0.282) (0.504) (0.064) (0.042) (0.082) (0.101) (0.099) (0.142) (0.220) (0.139)
Probit model, where the dependent variable equals one if the ISS vote recommendation is for and zero ifit is against. The explanatory variables are the statutory rule, a dummy variable for Type III proposals, adummy variable for routine proposals, insider voting power, and dummy variables for each of the proposalcategories in Table 3. Standard errors are reported below the coefficients. There are 5,745 observations atone and 2,003 observations at zero.
Proxy solicitation costs. Management spend corporate resources on soliciting proxies from
shareholders (Pound (1988), Young, Millar, and Glezen (1993)). The costs cover the printing and
mailing of proxy material as well as managerial time and effort. Management may contact large
shareholders directly and explain why their support for a certain proposal is important. One pos-
sibility is that management increases its efforts when a proposal is subject to a supermajority rule.
Our data provide a natural experiment to test the higher-effort hypothesis. There are 207 share-
holder meetings with simultaneous simple-majority and supermajority proposals. Direct contact
with the large shareholders should raise the support for all proposals put forward at the same
meeting. Then, the proportion in favor should not differ between the simple-majority proposals
and the supermajority proposals in the matched sample. Table 11 reports the regression results
using one simple-majority proposal and one supermajority proposal from 207 meetings with at least
one proposal of each type. When there are multiple proposals, we randomly choose one of each.
We can see that the proportion in favor increases significantly with the statutory rule also in the
matched sample. We conclude that explanations based on proxy solicitation costs are unlikely to
account for our results.
38
Table 11: Simultaneous Simple-Majority and Supermajority Proposals
Constant Majority Type III Routine Insider R2 #Obs
0.827 0.155 0.023 0.021 0.036 0.067 414(0.036) (0.060) (0.013) (0.010) (0.023)
Subset of 207 meetings with at least one simple-majority and one supermajority proposal. Ordinary leastsquares regression of the proportion in favor on the statutory rule, a dummy variable for Type III proposals,a dummy variable for routine proposals, and insider voting power. The sample means have been subtractedfrom the control variables. Robust standard errors are reported below the estimated parameters.
7 Conclusions
We have estimated a strategic voting model and found that shareholders vote strategically. Three
empirical implications are consistent with the evidence: (1) Higher statutory rules are associated
with a higher vote cast in favor of the proposal, (2) the relation is stronger for proposals with
less favorable public information, and (3) the pass rate is independent of the statutory rule. We
are not aware of any competing model or explanation that could account for these findings. The
estimation results also suggest that strategic voting is economically important for some proposal
classes. The probability of error (accepting a bad proposal or rejecting a good proposal) is reduced
relative to decision making without private information and relative to sincere voting. Proposal
screening through voting therefore adds value.
The main limitation of our model is its simplicity. We have imposed a binary signal structure
with symmetric payoffs and errors, and we have assumed symmetric voters with homogenous pref-
erences and one vote each. The symmetry assumptions narrow down the number of free model
parameters to be identified in the data. As a result, we cannot account for different shareholder
structures and degrees of ownership concentration. Furthermore, we cannot explain why super-
majority rules exist. Supermajority rules make decision-making more conservative, but strategic
voting largely neutralizes the desired conservatism. Instead, supermajority rules may serve the
purpose of preference aggregation rather than information aggregation.14 We regard the develop-
ment of a more realistic model of shareholder voting, which accounts for ownership structure and
combines heterogeneous preferences with an informational role for voting, as a fruitful avenue for
14Preference aggregation is emphasized by Messner and Polborn (2004), Holden (2004), and Levy (2005).
39

future research.
40
References
[1] Aghion, Philippe, and Patrick Bolton, 2003, Incomplete Social Contracts, Journal of the Eu-ropean Economic Association 1, 38-67.
[2] Austen-Smith, David and Jeffrey S. Banks, 1996, Information Aggregation, Rationality, andthe Condorcet Jury Theorem, American Political Science Review 90, 34-45.
[3] Battaglini, Marco, Rebecca Morton, and Thomas R. Palfrey, 2006, The Swing Voter’s Cursein the Laboratory, CEPR Working Paper, no. 5458.
[4] Bebchuk, Lucian Arye and Jesse M. Fried, 2004, Pay Without Performance–The UnfulfilledPromise of Executive Compensation Harvard University Press.
[5] Becht, Marco, Patrick Bolton, and Ailsa Roëll, 2003, Corporate Governance and Control, inthe Handbook of the Economics of Finance, Vol. 1A, Ch. 1, edited by George Constantinides,Milton Harris and René Stulz, North-Holland.
[6] Berle, Adolf A. and Gardiner Means, 1932, The Modern Corporation and Private Property,McMillan, New York.
[7] Bethel, Jennifer E. and Stuart L. Gillan, 2002, The Impact of the Institutional and RegulatoryEnvironment on Shareholder Voting, Financial Management 31, 29-54.
[8] Brickley, James A., Ronald C. Lease, and Clifford W. Smith Jr., 1988, Ownership Structureand Voting on Antitakeover Amendments, Journal of Financial Economics 20, 267-291.
[9] Brickley, James A., Ronald C. Lease, and Clifford W. Smith Jr., 1994, Corporate Voting:Evidence from Charter Amendment Proposals, Journal of Corporate Finance 1, 5-31.
[10] Burch, Timothy R., Angela G. Morgan, and Jack G. Wolf, 2004, Is Acquiring-Firm ShareholderApproval in Stock-for-Stock Merger Perfunctory?, Financial Management 33, 45-69.
[11] Carleton, Willard T., James M. Nelson, and Michael S. Weisbach, 1998, The Influence ofInstitutions on Corporate Governance Through Private Negotiations: Evidence From TIAA-CREF, Journal of Finance 53, 1335-1362.
[12] Dekel, Eddie and Michele Piccione, 2000, Sequential Voting Procedures in Symmetric BinaryElections, Journal of Political Economy 108, 34-55.
[13] DeAngelo, Harry and Edward M. Rice, 1983, Antitakeover Charter Amendments and Stock-holder Wealth, Journal of Financial Economics 11, 329-359.
[14] Easterbrook, Frank H. and Daniel R. Fischel, 1983, Voting in Corporate Law, Journal of Lawand Economics 26, 395-427.
[15] Feddersen, Timothy J., 2004, Rational Choice Theory and the Paradox of Not Voting, Journalof Economic Perspectives 18, 99-112.
[16] Feddersen, Timothy J. and Wolfgang Pesendorfer, 1996, The Swing Voter’s Curse, AmericanEconomic Review 86, 408-424.
41
[17] Feddersen, Timothy J. and Wolfgang Pesendorfer, 1997, Voting Behavior and InformationAggregation in Elections with Private Information, Econometrica 65, 1029-1059.
[18] Feddersen, Timothy J. and Wolfgang Pesendorfer, 1998, Convicting the Innocent: The Inferi-ority of Unanimous Jury Verdicts, American Political Science Review 92, 23-35.
[19] Guarnaschelli, S., R.D. McKelvey, and T.R. Palfrey, 2000, An Experimental Study of JuryDecision Rules, American Political Science Review 94, 407-423.
[20] Holden, Richard, 2004, Supermajority Voting Rules, working paper, SSRN.
[21] Journal of Financial Economics 11, 1983, The Market for Corporate Control.
[22] Journal of Financial Economics 20, 1988, The Distribution of Power Among Corporate Man-agers, Shareholders, and Directors.
[23] Levy, Gilat, 2005, Decision Making in Committees: Transparency, Reputation and VotingRules, American Economic Review, forthcoming.
[24] Linn, Scott C. and John J. McConnell, 1983, An Empirical Investigation of the Impact of‘Antitakeover’ Amendments on Common Stock Prices, Journal of Financial Economics 11,361-399.
[25] Maug, Ernst, 1999, How Effective is Proxy Voting? Information Aggregation and ConflictResolution in Corporate Voting Contests, working paper, SSRN.
[26] Maug, Ernst and Bilge Yilmaz, 2002, Two-Class Voting: A Mechanism for Conflict Resolution?American Economic Review 92, 1448-1471.
[27] Messner, Matthias and Mattias K. Polborn, 2004, Voting on Majority Rules, Review of Eco-nomic Studies 71, 115-132.
[28] Morgan, Angela G. and Annette B. Poulsen, 2001, Linking Pay to Performance–—Compensation Proposals in the S&P500, Journal of Financial Economics 62, 489-523.
[29] Persico, Nicola, 2004, Committee Design with Endogenous Information, Review of EconomicStudies 71, 165-194.
[30] Thomas, Randall S., and Kenneth J. Martin, 2000, The Determinants of Shareholder Votingon Stock Option Plans, Wake Forest Law Review 35, 31-82.
[31] Young, Philip J., James A. Millar, and G. William Glezen, 1993, Trading Volume, ManagementSolicitation, and Shareholder Voting, Journal of Financial Economics 33, 57-71.
42
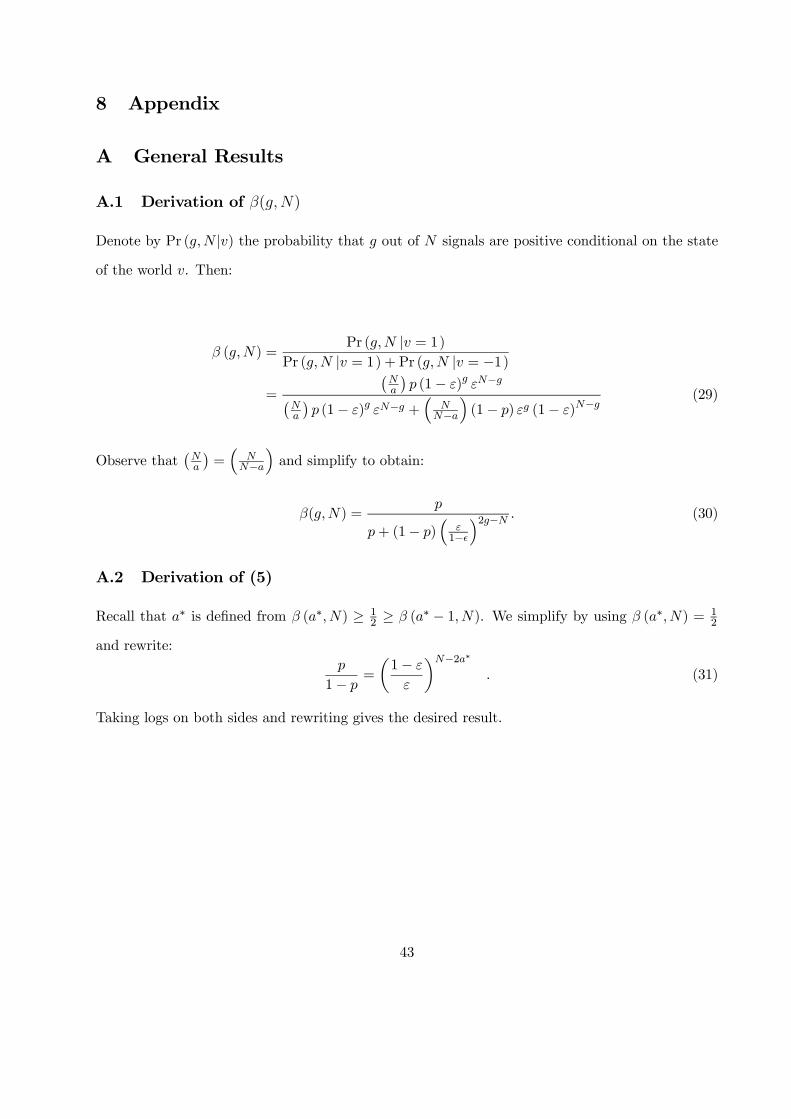
8 Appendix
A General Results
A.1 Derivation of β(g,N)
Denote by Pr (g,N |v) the probability that g out of N signals are positive conditional on the state
of the world v. Then:
β (g,N) =Pr (g,N |v = 1)
Pr (g,N |v = 1) + Pr (g,N |v = −1)
=
¡Na
¢p (1− ε)g εN−g¡
Na
¢p (1− ε)g εN−g +
³N
N−a
´(1− p) εg (1− ε)N−g
(29)
Observe that¡Na
¢=³
NN−a
´and simplify to obtain:
β(g,N) =p
p+ (1− p)³
ε1−
´2g−N . (30)
A.2 Derivation of (5)
Recall that a∗ is defined from β (a∗, N) ≥ 12 ≥ β (a∗ − 1, N). We simplify by using β (a∗,N) = 1
2
and rewrite:p
1− p=
µ1− ε
ε
¶N−2a∗
. (31)
Taking logs on both sides and rewriting gives the desired result.
43
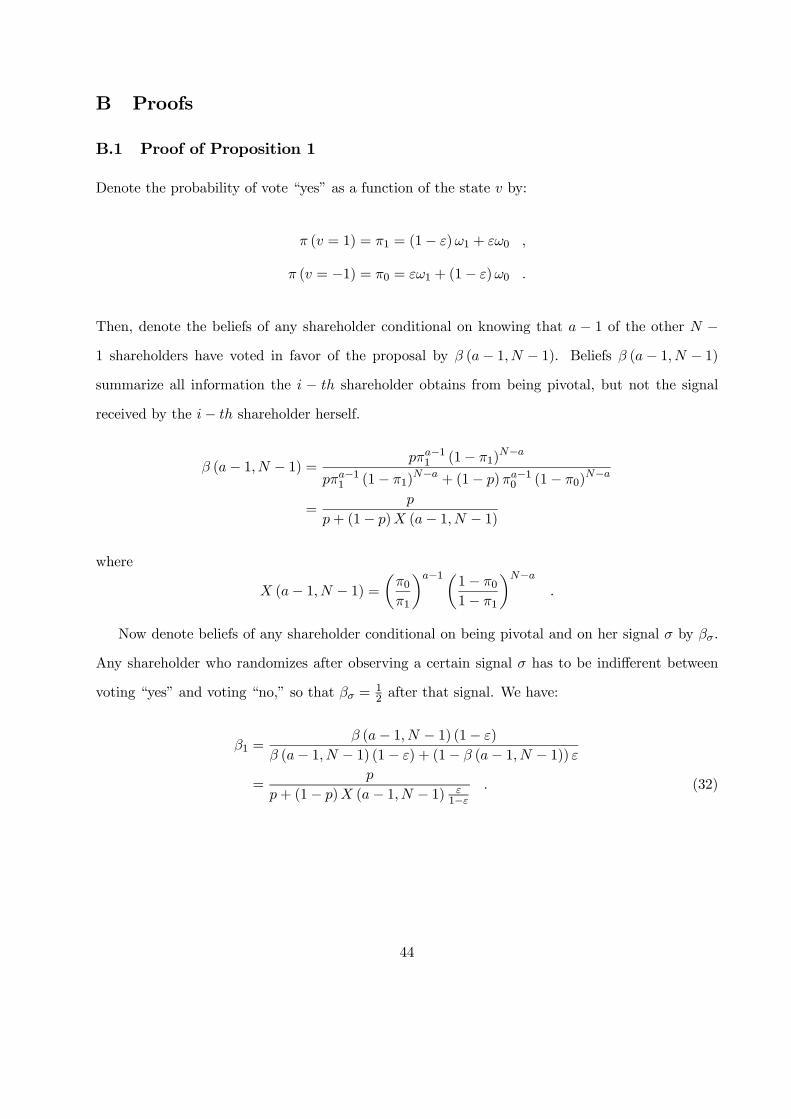
B Proofs
B.1 Proof of Proposition 1
Denote the probability of vote “yes” as a function of the state v by:
π (v = 1) = π1 = (1− ε)ω1 + εω0 ,
π (v = −1) = π0 = εω1 + (1− ε)ω0 .
Then, denote the beliefs of any shareholder conditional on knowing that a − 1 of the other N −
1 shareholders have voted in favor of the proposal by β (a− 1, N − 1). Beliefs β (a− 1, N − 1)
summarize all information the i − th shareholder obtains from being pivotal, but not the signal
received by the i− th shareholder herself.
β (a− 1,N − 1) = pπa−11 (1− π1)N−a
pπa−11 (1− π1)N−a + (1− p)πa−10 (1− π0)
N−a
=p
p+ (1− p)X (a− 1,N − 1)
where
X (a− 1, N − 1) =µπ0π1
¶a−1µ1− π01− π1
¶N−a.
Now denote beliefs of any shareholder conditional on being pivotal and on her signal σ by βσ.
Any shareholder who randomizes after observing a certain signal σ has to be indifferent between
voting “yes” and voting “no,” so that βσ = 12 after that signal. We have:
β1 =β (a− 1, N − 1) (1− ε)
β (a− 1, N − 1) (1− ε) + (1− β (a− 1, N − 1)) ε
=p
p+ (1− p)X (a− 1, N − 1) ε1−ε
. (32)
44

Similarly:
β0 =β (a− 1,N − 1) ε
β (a− 1, N − 1) ε+ (1− β (a− 1, N − 1)) (1− ε)
=p
p+ (1− p)X (a− 1, N − 1) 1−εε. (33)
We can see immediately by direct calculation that:
β1 − β0 =p (1− p)X
³1−2εε(1−ε)
´¡p+ (1− p)X 1−ε
ε
¢ ³p+ (1− p)X ε
1−ε
´ > 0
since we assume that ε < 1/2. Hence, we have either that β1 = 1/2 or that β0 = 1/2, but never
both. For a pure strategy equilibrium we need β0 ≤ 1/2 ≤ β1 with at least one inequality being
strict. We can therefore distinguish three cases.
Case 1: β1 = 1/2. If β1 = 1/2, then β0 < 1/2 and the shareholder strictly prefers rejection of
the proposal after observing a bad signal, so ω0 = 0. Solving the condition β1 = 1/2 gives:
p (1− ε)
(1− p) ε= X (a− 1, N − 1) =
µε
1− ε
¶a−1µ 1− εω11− ω1 (1− ε)
¶N−a.
Rearranging:
1− εω11− ω1 (1− ε)
=
µp
1− p
µ1− ε
ε
¶a¶ 1N−a
= h . (34)
We substitute for p1−p from (31), which gives the expression for h in (6). Solving (34) for ω1 as
a function of h gives (6). The equilibrium is responsive whenever ω1 > 0, which requires h > 1.
The equilibrium is in mixed strategies if ω1 < 1, which is equivalent to h < 1−εε . From (6) this
result obtains whenever the exponent of 1−εε is positive, or a > 2a∗ − N . The equilibrium is in
mixed strategies if ω1 < 1 ⇐⇒ h < 1−εε . This requires the exponent of h to be less than 1, which
is equivalent to a < a∗. Hence, for a ≥ a∗ we always have ω1 = 1.
45
Case 2: β0 = 1/2. If β0 = 1/2, then ω1 = 1 and the condition can be written as:
p
1− p
ε
1− ε= X (a− 1, N − 1) =
µε+ (1− ε)ω01− ε (1− ω0)
¶a−1µ1− ε
ε
¶N−a.
Rearranging:
ε+ (1− ε)ω01− ε (1− ω0)
=
Ãp
1− p
µε
1− ε
¶N−a+1! 1
a−1
= f . (35)
Using (31) to substitute for 1−pp gives the expression for f in 7. Solving (35) for ω0 as a function of
f gives (7). We have a mixing equilibrium if ω0 > 0, which requires f > ε1−ε . Then, the exponent
of 1−εε in f has to exceed −1, which is equivalent to a > a∗ +1. Hence, for any a ≤ a∗+1 we have
ω0 = 0. For the equilibrium to be responsive we need ω0 < 1, or f < 1, hence the exponent of 1−εε
in f has to be negative, or a < 2a∗ + 1.
Case 3: Pure strategy equilibria. >From the discussion of Case 1 above we know that ω1 = 1
whenever a ≥ a∗. Also, from the discussion of Case 2 we know that ω0 = 0 whenever a ≤ a∗ + 1.
Hence, for a∗ ≤ a ≤ a∗ + 1 the equilibrium is in pure strategies.
B.2 Proof of Proposition 2
We demonstrate the result in four steps. We first analyze those parameter ranges, where some
shareholders passively vote against. The second step analyzes those parameter ranges, where some
shareholders passively vote for. Then, we show that these two cases and the case of sincere voting by
all shareholders cover all possible cases. These three steps complete the description of equilibrium.
Step 4 derives equation (8).
Step 1: N − k > 1 shareholders always vote against. We show that for any proposal and
for any majority rule, where the parameters satisfy:
β (a,N) ≤ 12≤ β (a, a) (36)
46
there always exists an equilibrium, where k shareholders vote sincerely, k ≥ a, and the remaining
N − k > 1 shareholders always vote against.
Consider the kth sincere voter. She is marginal if a− 1 sincere voters observe good signals and
the remaining k − a observe bad signals. Then, sincere voting is a best response if and only if
β (a− 1, k) ≤ 12≤ β (a, k) . (37)
Now consider one of the other N − k passive voters. This voter is pivotal whenever a − 1 sincere
voters observe good signals and the remaining k + 1− a observe bad signals. Then, voting against
even after observing a good signal is a best response if β (a, k + 1) ≤ 12 . This together with condition
(37) implies that the proposed equilibrium exists whenever
β (a, k + 1) ≤ 12≤ β (a, k) (38)
since β (a, k + 1) > β (a− 1, k) from (30). Condition (38) implies that the proposed equilibrium
exist for k satisfying the above parameters. Since β (a, k) increases in a and decreases in k, condition
(38) can only be satisfied for some a < a∗ if k < N , where k is increasing in a. Moreover, any k
such that a ≤ k ≤ N − 1 defines an interval, where the proposed equilibrium exists. Since β is
decreasing in k, the lowest value β can take is for k = N − 1, otherwise the number of shareholders
voting against would be zero. Then, beliefs are β (a,N − 1). Conversely, the highest value beliefs
can take is for the lowest value of k, a, then: β = β (a, a). Hence, letting k run from a to N − 1
partitions the interval (36) into N − a subintervals, and that value of k for which condition (38) is
satisfied defines one of these subintervals uniquely.
Step 2: N − k > 1 shareholders always vote for. Next, we show that for any proposal and
any majority rule, where the parameters satisfy:
β (0, N − a+ 1) ≤ 12≤ β (a− 1, N) (39)
there always exists an equilibrium, where k shareholders vote sincerely, whereN−a+1 ≤ k ≤ N−1.
47
It is evident that N−k ≤ a−1 otherwise the proposal would always be accepted, independently
of the information available to all shareholders. Hence, N − a + 1 ≤ k ≤ N − 1. Consider again
one of the k sincere voters. This shareholder is pivotal if and only if the other k − 1 sincere voters
have received exactly a− 1− (N − k) good signals and N − a bad signals. Hence, the beliefs of the
shareholder support her conjectured equilibrium voting strategy if and only if
β (a− (N − k)− 1, k) ≤ 12≤ β (a− (N − k) , k) . (40)
Now consider one of the passive for-voters. She follows her equilibrium strategy only if she
rejects the proposal even if she receives adverse information. Whenever she is pivotal, and has
observed bad information, she knows k + 1 signals. Of these, N − a+ 1 are bad and a− (N − k)
are good. Hence, her passive voting strategy is optimal if and only if:
β (a− (N − k) , k + 1) ≥ 12
. (41)
Since β (a− (N − k) , k) > β (a− (N − k) , k + 1) > β (a− (N − k)− 1, k), conditions (40) and
(41) together imply:
β (a− (N − k) , k + 1) ≥ 12≥ β (a− (N − k)− 1, k) . (42)
Moreover, for any k such that N − a + 1 ≤ k ≤ N − 1 the proposed equilibrium exists. Since
β (a− (N − k) , k) is increasing in a and k, condition (42) can only be satisfied for some a > a∗
if k < N , where k is decreasing in a. Also, the lowest value β can take is for k = N − a + 1.
Then, beliefs at the lower bound of (42) are β (0, N − a+ 1). Conversely, for the upper limit of the
interval (42), the highest value β can take is the highest of k and N − 1. Then, β = β (a− 1, N).
Hence, letting k run from N − a+ 1 to N − 1 partitions the interval (39) into a− 1 subintervals,
and that value of k for which condition (42) is satisfied defines one of these subintervals uniquely.
Hence, these conditions define a unique value for k, where the proposed equilibrium exists.
48
Step 3: Uniqueness. The interval β(a− 1, N) ≤ 12 ≤ β(a,N) together with (36) and (39) cover
the interval:
β (0, N − a+ 1) ≤ 12≤ β (a, a) . (43)
We can see that for a = 1 the lower bound of (43) is β (0,N), and for a = N the upper bound is
β (N,N), hence for any a ∈ [1, N ] there exists an equilibrium with at least one sincere voter.
Finally, we have to show that the equilibria characterized so far are unique. We need to rule out
equilibria with k sincere voters, where l shareholders always vote for and the remaining N − k − l
shareholders always vote against. We prove that this is not possible by contradiction. Every
shareholder is pivotal whenever there are a − 1 for-votes. Shareholders passively voting for are
pivotal if sincere shareholders have observed a − 1 − (l − 1) good signals. Hence, a shareholder
voting for who has observed a bad signal only votes for if:
β (a− l, k + 1) ≥ 12
. (44)
Conversely, a shareholder voting against is pivotal if the sincere voters have observed a−1− l good
signals, and votes against even though she has observed a favorable signal only if:
β (a− l, k + 1) ≤ 12
. (45)
Conditions (44) and (45) are consistent only if β (a− l, k + 1) = 12 , which is generically not true.
Step 4: Derivation of (8). We proceed as in the derivation of (5) and require that β (a, k) = 12 .
Then, after solving and taking logs we obtain:
a =k
2− 1
2 ln 1−εεln
p
1− p. (46)
Using a∗ = α∗N yields:
|a∗ − a| = N − k
2.
Defining κ = k/N gives (8) immediately.
49
C Testing Methodology for Mixed Strategy Equilibria
Case 1: α < α∗. Use α = a/N and α∗ = a∗/N in (6) to obtain:
h =
µ1− ε
ε
¶2(a−a∗)N−a +1
=
µ1− ε
ε
¶ 2(α−α∗)1−α +1
.
Rewrite the exponent as:2 (α− α∗)
1− α+ 1 =
α
1− α+2α∗ − 11− α| {z }=C
.
Write expected fraction of votes from (9) as:
E (y/N) = πω1 = π
" ¡1−εε
¢ α1−α+C − 1
(1− ε)¡1−εε
¢ α1−α+C − ε
#
= π
"(1− ε)
α1−α+C − ε
α1−α+C
(1− ε)α
1−α+C+1 − εα
1−α+C+1
#.
The last expression gives the first line of (21) from α1−α + 1 =
11−α .
Case 2: α ≥ α∗. We use (9), where ω0 is given by (7). Then, with α = a/N and α∗ = a∗/N , we
rewrite the exponent as:
− 2a∗
a− 1 + 1 = −2α∗
α− 1/N + 1 ≈ −2α∗
α+ 1 = −E,
so that E + 1 = 2α∗
α . Then:
ω0 =f (1− ε)− ε
1− ε (1 + f)=
¡1−εε
¢−E(1− ε)− ε
1− ε− ε¡1−εε
¢−E=
(1− ε)1−E εE − ε
1− ε− (1− ε)−E εE+1=(1− ε) εE − ε (1− ε)E
(1− ε)E+1 − εE+1
=(1− ε) ε
2α∗α−1 − ε (1− ε)
2α∗α−1
(1− ε)2α∗α − ε
2α∗α
.
The last expression gives the second line of (21).
50

Mannheim Finance Working Papers 2006
2006-01 Peter Albrecht, JoachimCoche, Raimond Maurer,and Ralph Rogalla
Investment Risks and Returns of Hybrid Pension Plans:Sponsor and Member Perspective
2006-02 Silvia Elsland and MartinWeber
Why Do Shareholders Tender? Shareholder Reaction toTender Offers: Evidence from Germany
2006-03 Sava Savov Dividend Changes, Signaling, and Stock Price Perfor-mance
2006-04 Christoph Schneider, In-golf Dittmann, and ErnstMaug
How Preussag became TUI: Kissing too Many ToadsCan Make You a Toad
2006-05 Sava Savov Earnings Management, Investments, and Dividend Pay-ments
2006-06 Martin Weber and FrankWelfens
An Individual Level Analysis of the Disposition Effect:Empirical and Experimental Evidence
2006-07 Ingolf Dittmann andErnst Maug
Valuation Biases, Error Measures, and the Conglomer-ate Discount
2006-08 Sava Savov and MartinWeber
Fundamentals or Market Movements: What Drives theDividend Decision?
2006-09 Ingolf Dittmann, ErnstMaug, and Oliver Spalt
Executive Stock Options when Managers are Loss-Averse
2006-10 Philipp Schmitz, MarkusGlaser, and Martin Weber
Individual Investor Sentiment and Stock Returns -What Do We Learn from Warrant Traders?
2006-11 Sofia B. Ramos and Ernst-Ludwig von Thadden
Stock Exchange Competition in a Simple Model of Cap-ital Market Equilibrium
2006-12 Wolfgang Bühler andChristian Koziol
Calling Convertible Bonds too Late Can be Rational
2006-13 Wolfgang Bühler and TimThabe
Credit Risk, Liquidity Risk, and Optimal Capital Struc-ture under Incomplete Accounting Information
2006-14 Hans-Martin vonGaudecker and CarstenWeber
Mandatory Unisex Policies and Annuity Pricing: Quasi-Experimental Evidence from Germany

2006-15 Ernst Maug and KristianRydquist
Do Shareholders Vote Strategically? Voting Behavior,Proposal Screening, and Majority Rules

about ECGI
The European Corporate Governance Institute has been established to improve corpo-
rate governance through fostering independent scientific research and related activities.
The ECGI will produce and disseminate high quality research while remaining close to
the concerns and interests of corporate, financial and public policy makers. It will draw on
the expertise of scholars from numerous countries and bring together a critical mass of
expertise and interest to bear on this important subject.
The views expressed in this working paper are those of the authors, not those of the ECGI
or its members.
www.ecgi.org
ECGI Working Paper Series in Finance
Editorial Board
Editor Paolo Fulghieri, Professor of Finance, University of North
Carolina, INSEAD & CEPR
Consulting Editors Franklin Allen, Nippon Life Professor of Finance, Professor of
Economics, The Wharton School of the University of
Pennsylvania
Patrick Bolton, John H. Scully ‘66 Professor of Finance and
Economics, Princeton University, ECGI & CEPR
Marco Pagano, Professor of Economics, Università di Salerno,
ECGI & CEPR
Luigi Zingales, Robert C. McCormack Professor of
Entrepreneurship and Finance, University of Chicago & CEPR
Julian Franks, Corporation of London Professor of Finance,
London Business School & CEPR
Xavier Vives, Professor of Economics and Finance,
INSEAD & CEPR
Editorial Assistants : Paolo Casini, “G.d’Annunzio” University, Chieti & ECARES,
Lidia Tsyganok, ECARES, Université Libre De Bruxelles
www.ecgi.org\wp

Electronic Access to the Working Paper Series
The full set of ECGI working papers can be accessed through the Institute’s Web-site
(www.ecgi.org/wp) or SSRN:
Finance Paper Series http://www.ssrn.com/link/ECGI-Fin.html
Law Paper Series http://www.ssrn.com/link/ECGI-Law.html
www.ecgi.org\wp


![The Complete Guide to ASME B31.3 [Charles Becht IV, 2002].pdf](https://img.pdfslide.us/doc/110x75/577c7f541a28abe054a418b5/the-complete-guide-to-asme-b313-charles-becht-iv-2002pdf.jpg)