Embed Size (px)
Citation preview

Do Now
Note: axis of symm = , minimum value = [ , f() ]

Chapter 5
Section E and F

Vocabulary
• Relative frequency- frequency expressed as a fraction of the total frequency
• Cumulative frequency- sum of the frequency up until the event.
• Cumulative relative frequency- sum of the relative frequency up until the event.

Category Frequency Cumulative Frequency
Relative Frequency
Cumulative Relative
Frequency
Rap 4
Country 3
Rock 6
Classical 2
Total

Category Frequency Cumulative Frequency
Relative Frequency
Cumulative Relative
Frequency
0-1 3
1.01 - 2 5
2.01- 3 2
3.01 -4 10
Total

Create a frequency bar graph and draw the frequency polygon

Create a cumulative frequency graph
Summarizing Data
Given : 3, 6, 5, 4, 5, 5, 6, 7, find the mean, median and mode.

Given a frequency chart; find mean, median, and mode.
Data Freq. (F )( x) 3 14 15 36 77 158 89 5Total 40
Note: To find median within a frequency chart, use: , where n is the total frequency.
To find the mean within a frequency chart, use:
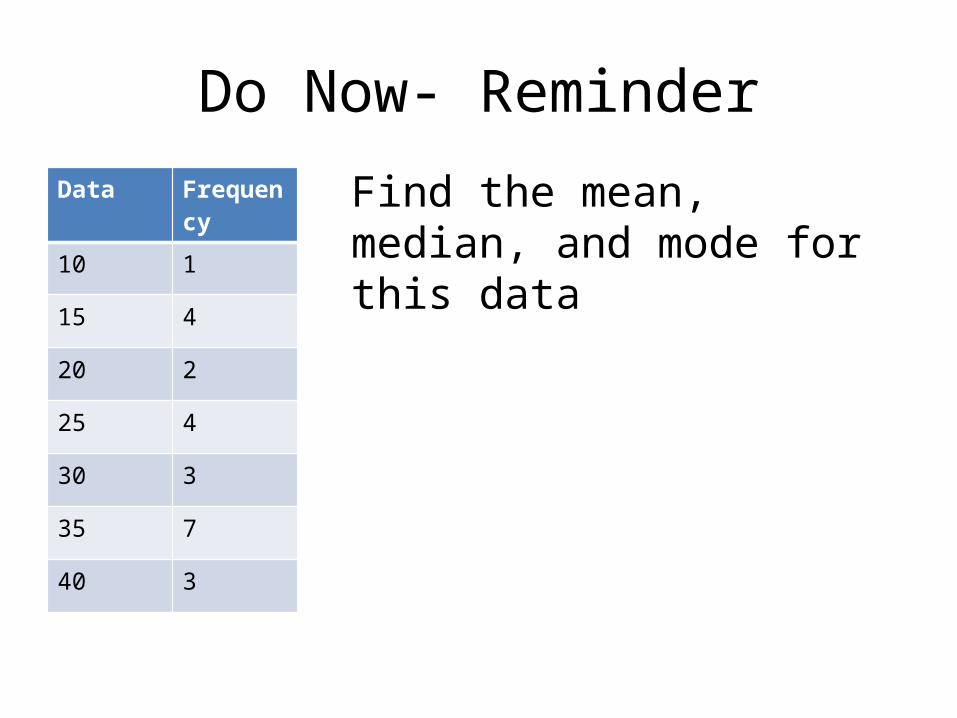
Do Now- ReminderData Frequency
10 1
15 4
20 2
25 4
30 3
35 7
40 3
Find the mean, median, and mode for this data

Given a grouped frequency chart; find the mean
Data Freq. (F )( x) 2-3 13-4 14-5 35-6 76-7 157-8 88-9 5Total 40
To find the mean within a frequency chart, use: , where x is the midpoint of the range.

Given a grouped frequency chart; find the median
Test Mark Number of Students
30-39 6
40-49 20
50-59 64
60-69 87
70-79 51
80-89 19
90-99 10
L = the lower limit of the median classi = the number of scores in the median class needed to arrive at the middle scoref = number of scores in the median classC = length of the class interval

Quartiles
Lower Quartile (Q1) = 25% of total frequenciesMedian Value (Q2) = 50% of total frequenciesUpper Quartile (Q3) = 75% of total frequencies.
Ex: 1,2,3,3,3,4,5,6,6,6,7,8,9,9,10,12

Quartiles with Cumulative Frequency Charts

Measuring the Spread
• Maximum= Highest Number• Minimum= Lowest Number• Range= Maximum – Minimum• Interquartile Range = Q3 – Q1• Ex: For the data set 1,1,1,2,2,3,4,6,6,7,8,8,8,9,10,find the
a. medianb. lower quartilec. upper quartiled. interquartile range

Practice
1. Find the interquartile range.
2. Find the 40% percentile.

Plot what you now know in a Box-and Whisker Plot

Example
• For the data set: 2,3,4,4,4,5,5,5,6,6,6,7,8,9,9,10, Create a Box-and-whisker plot.

Outlier Test Using Boundaries
• Upper boundary = Q3 + 1.5 x IQR“any data larger than this is an outlier”• Lower boundary = Q1 – 1.5 x IQR“any data smaller than this is an outlier”
This is designated with an asterik. Whiskers extend to the last value that is not an outlier

Example
1,1,1,2,2,2,3,3,3,3,5,5,8,9,25

Measuring Dispersion
So far we have range and IQ that measure dispersion. Variance- average distance of the square of each data from the mean.Standard Deviation- square root of the variance. How far each value is from the mean

Steps
• Find the mean• Subtract each value from the mean• Square the differences• Find the average of the squares• Take the square root

Example
15, 20, 30, 35

Calculator steps
• STAT, Edit (enter)• Clear List 1 and enter data into L1• Press keys: stat, >(calc), 1:1-var stats, 2nd L1,
enter (or stat, calc, enter, enter)
• Ex: 5,10,10, 15,15,20,30,35,35,40,40,45