Embed Size (px)
Citation preview
Do Not Use This Material Without Permission from Author1
Visualizing US Urbanization and Transportation Trends
Ken LaberteauxLab S
Toyota Research Institute-North America (TRI-NA)November 2010
Do Not Use This Material Without Permission from Author2
Special thanks to our partners at theMIT Dept. of Urban Studies and Planning
http://www.theprex.net/
Alan Berger Case Brown
Do Not Use This Material Without Permission from Author3
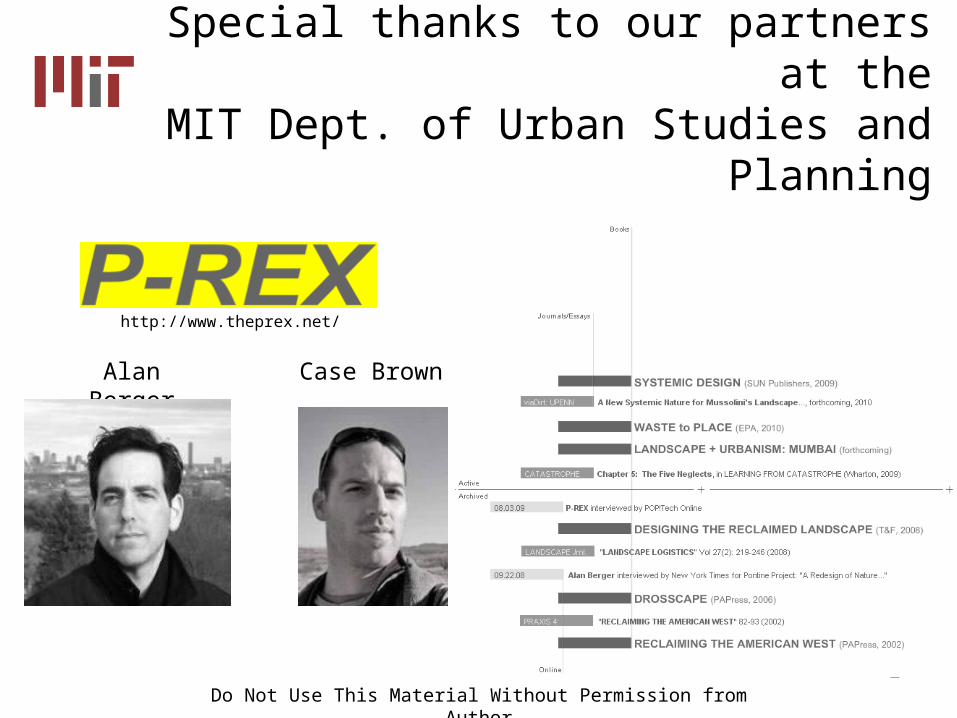
Scope
• National Statistics
• Metro Case Study: Denver
Intro Economics Housing Employment Denver Transportation
Do Not Use This Material Without Permission from Author4
Intro Economics Housing Employment Denver Transportation
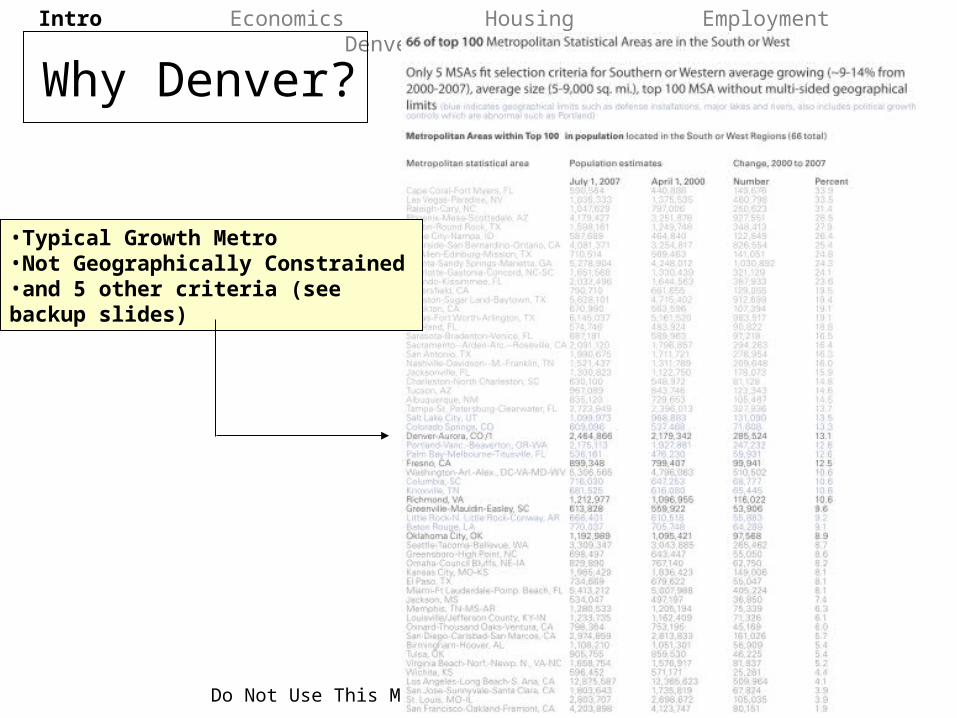
Why Denver?
•Typical Growth Metro•Not Geographically Constrained•and 5 other criteria (see backup slides)
Do Not Use This Material Without Permission from Author5
Outline
• Economy and Transportation
• Decentralization of Housing
• Decentralization of Employment
• Denver Transportation
Main Result: Car-focus culture likely to continue/grow in US
Intro Economics Housing Employment Denver Transportation
Do Not Use This Material Without Permission from Author6
Outline
• Economy and Transportation
• Decentralization of Housing
• Decentralization of Employment
• Denver Transportation
Intro Economics Housing Employment Denver Transportation
Do Not Use This Material Without Permission from Author7
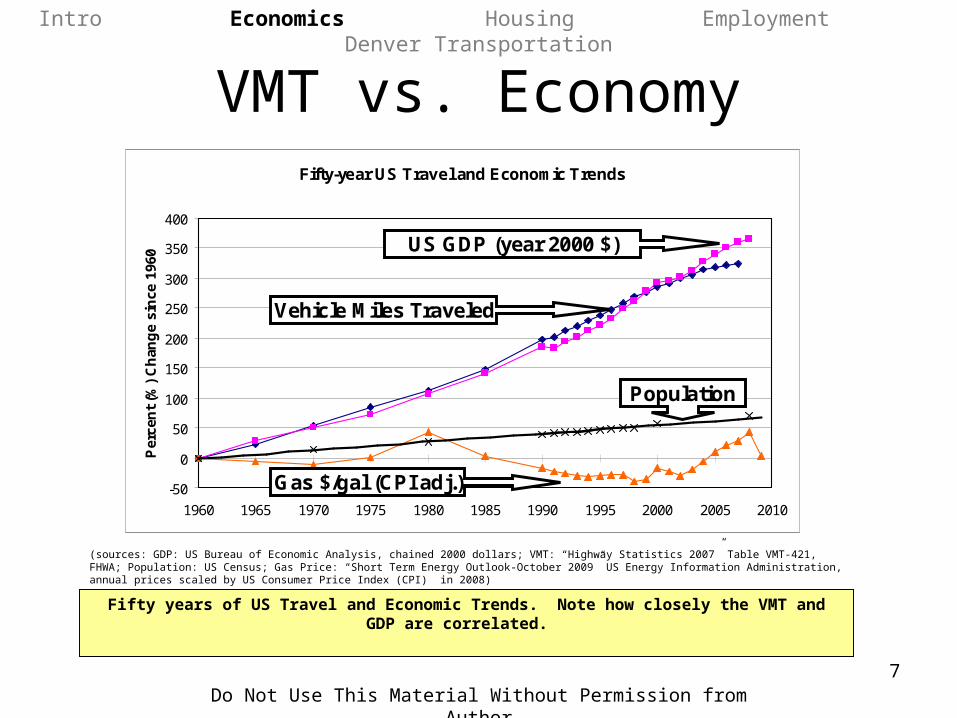
VMT vs. EconomyFifty-year US Travel and Economic Trends
-50
0
50
100
150
200
250
300
350
400
1960 1965 1970 1975 1980 1985 1990 1995 2000 2005 2010
Per
cen
t (%
) C
han
ge
sin
ce 1
960 US GDP (year 2000 $)
Vehicle Miles Traveled
Population
Gas $/gal (CPI adj.)
Fifty years of US Travel and Economic Trends. Note how closely the VMT and GDP are correlated.
(sources: GDP: US Bureau of Economic Analysis, chained 2000 dollars; VMT: “Highway Statistics 2007” Table VMT-421, FHWA; Population: US Census; Gas Price: “Short Term Energy Outlook-October 2009” US Energy Information Administration, annual prices scaled by US Consumer Price Index (CPI) in 2008)
Intro Economics Housing Employment Denver Transportation
Do Not Use This Material Without Permission from Author8
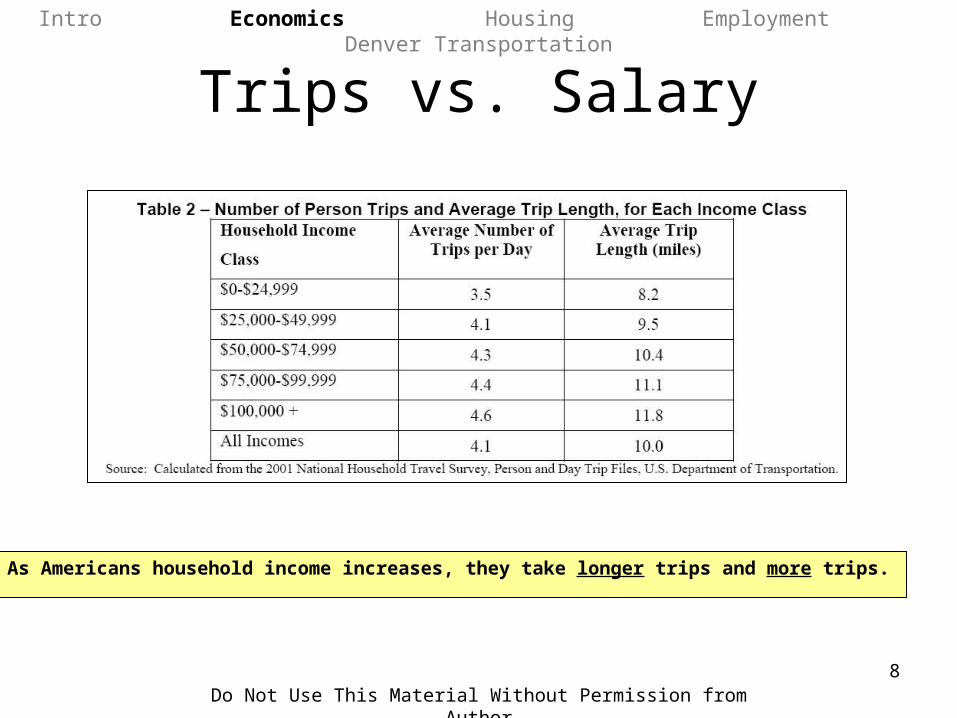
Trips vs. Salary
As Americans household income increases, they take longer trips and more trips.
Intro Economics Housing Employment Denver Transportation
Do Not Use This Material Without Permission from Author9
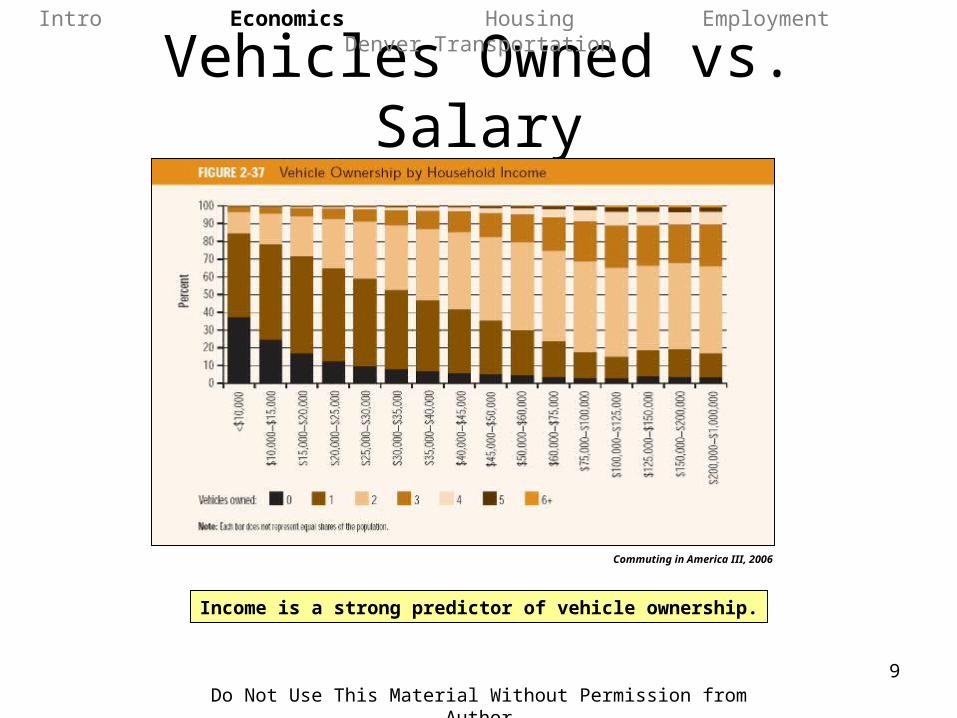
Vehicles Owned vs. Salary
Income is a strong predictor of vehicle ownership.
Intro Economics Housing Employment Denver Transportation
Commuting in America III, 2006
Do Not Use This Material Without Permission from Author10
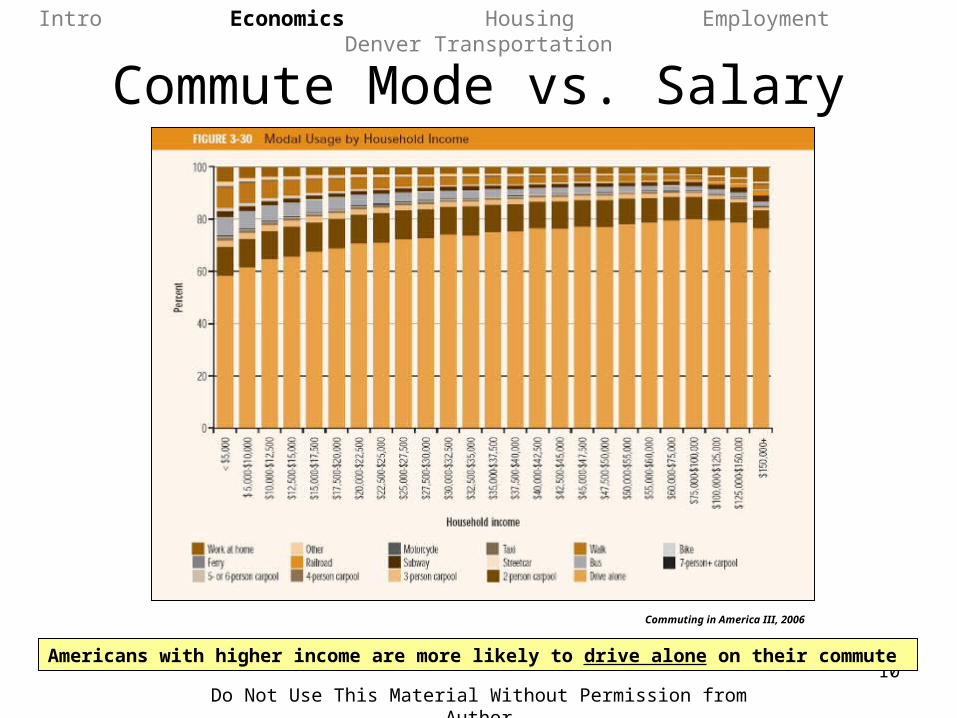
Commute Mode vs. Salary
Americans with higher income are more likely to drive alone on their commute
Intro Economics Housing Employment Denver Transportation
Commuting in America III, 2006
Do Not Use This Material Without Permission from Author11
Analysis
• Americans access more convenience with the frequent use of a car.
• As Americans increase their personal financial means, they buy more cars and drive them more.
Intro Economics Housing Employment Denver Transportation
Do Not Use This Material Without Permission from Author12
Outline
• Economy and Transportation
• Decentralization of Housing
• Decentralization of Employment
• Denver Transportation
Intro Economics Housing Employment Denver Transportation
Do Not Use This Material Without Permission from Author13
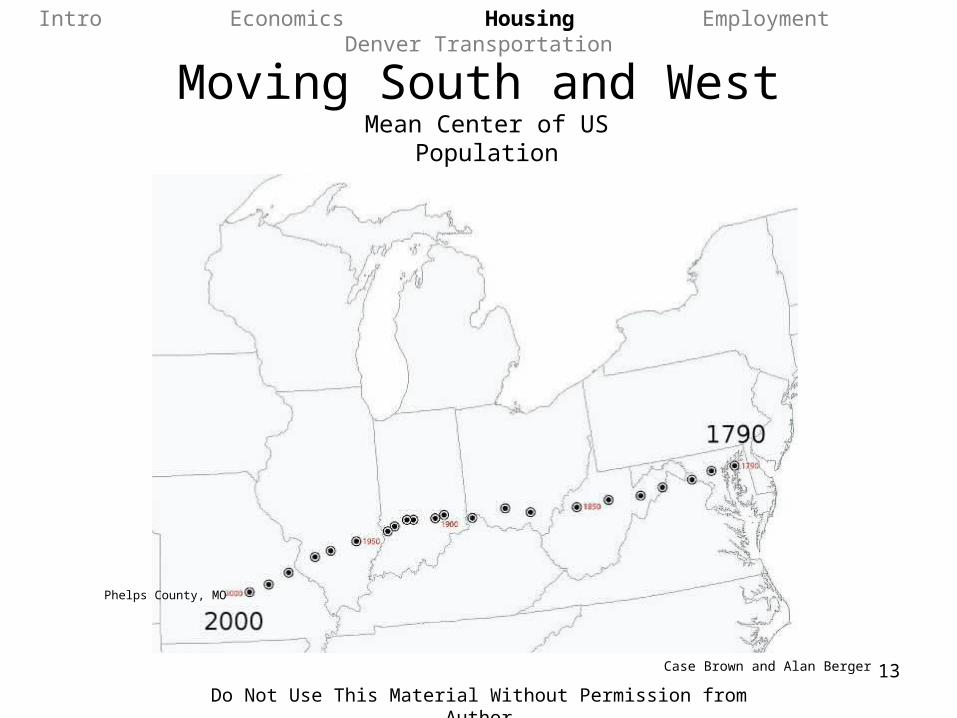
Moving South and West
Case Brown and Alan Berger
Mean Center of US Population
Intro Economics Housing Employment Denver Transportation
Phelps County, MO
Do Not Use This Material Without Permission from Author14
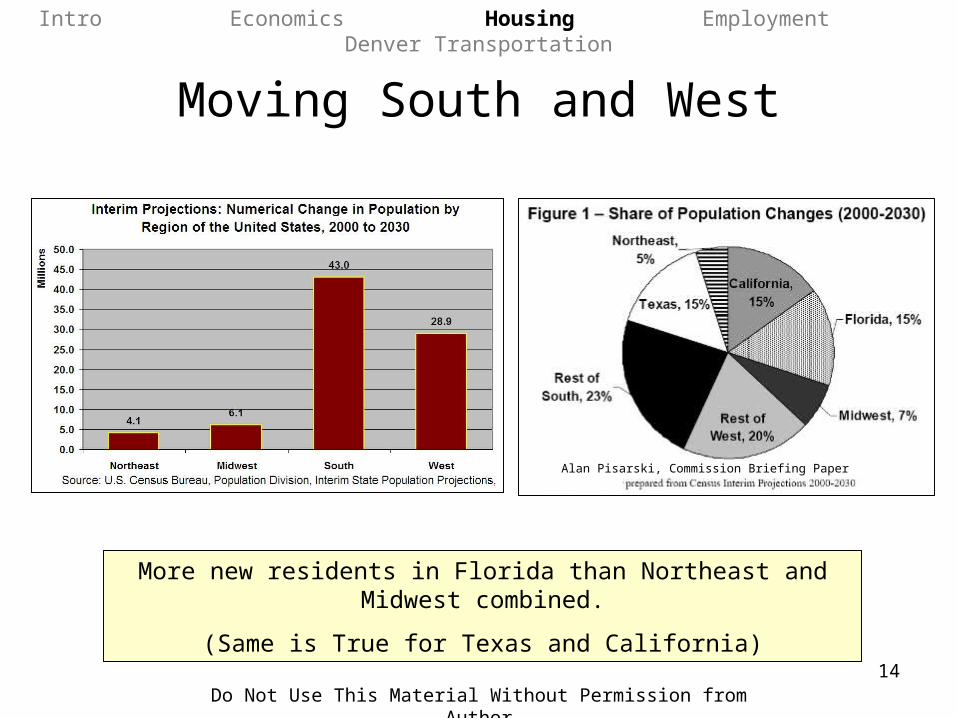
Moving South and West
Alan Pisarski, Commission Briefing Paper 4A-05
More new residents in Florida than Northeast and Midwest combined.
(Same is True for Texas and California)
Intro Economics Housing Employment Denver Transportation
Do Not Use This Material Without Permission from Author15
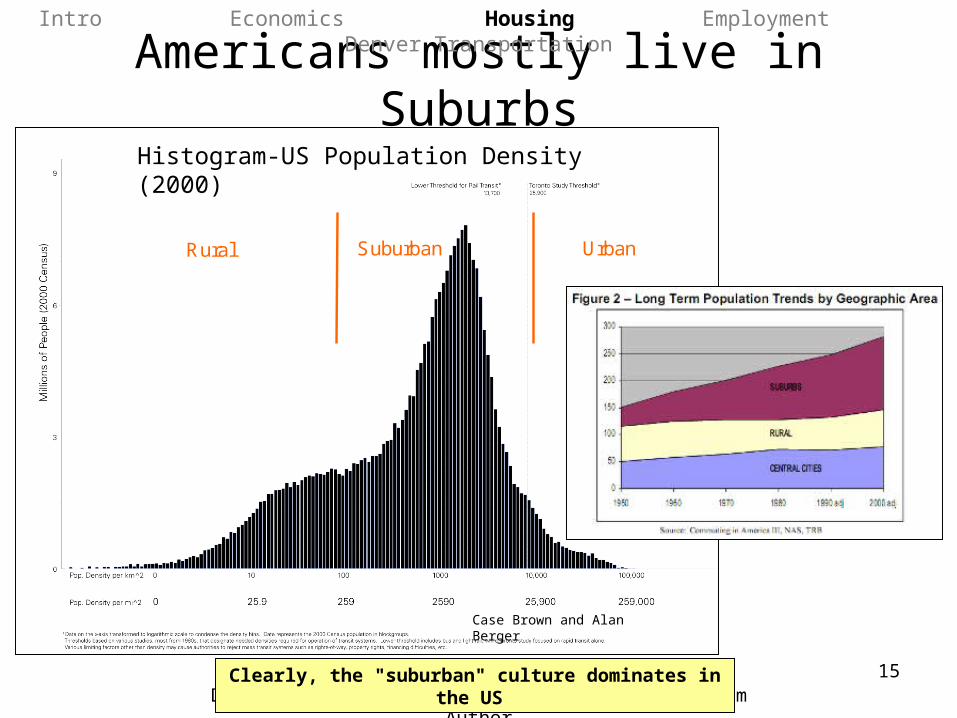
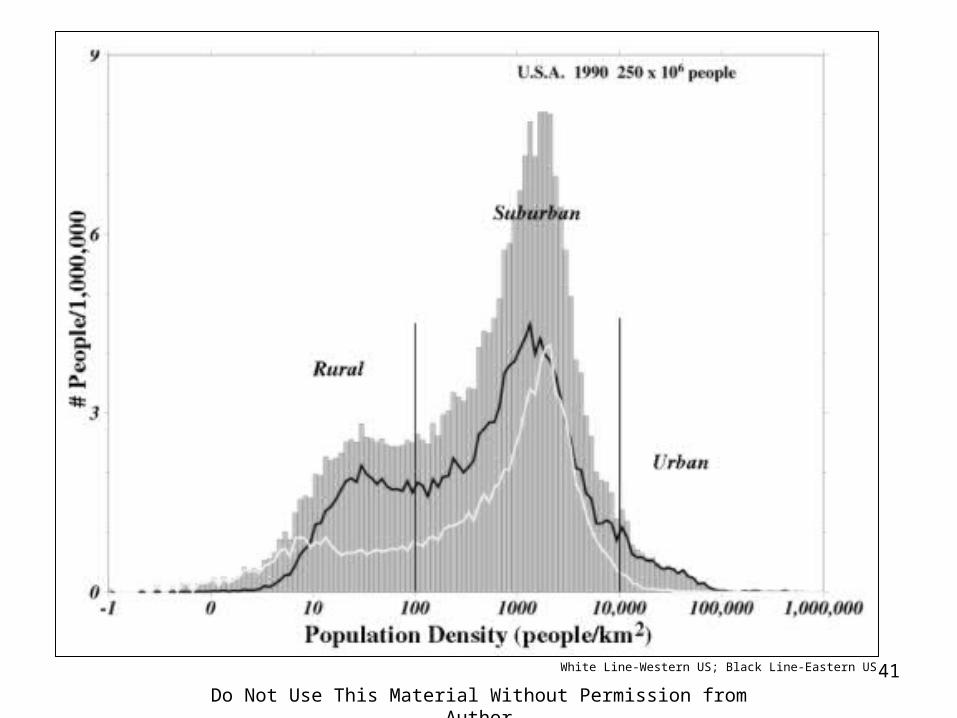
Americans mostly live in Suburbs
Clearly, the "suburban" culture dominates in the US
Rural Suburban UrbanRural Suburban Urban
Histogram-US Population Density (2000)
Case Brown and Alan Berger
Intro Economics Housing Employment Denver Transportation
Do Not Use This Material Without Permission from Author16
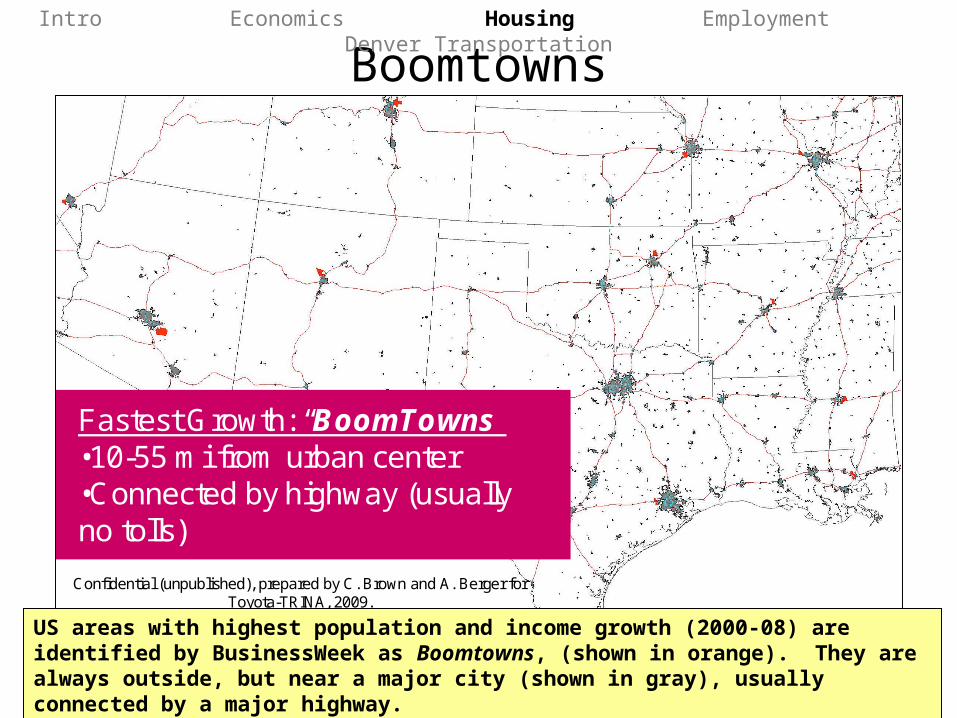
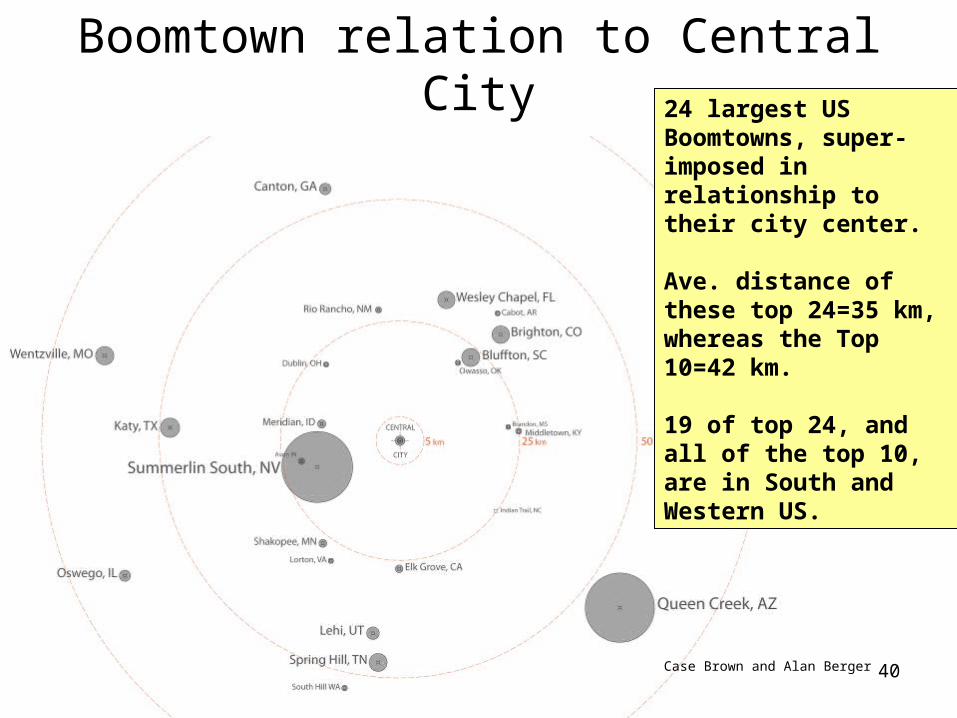
Boomtowns
Fastest Growth: “BoomTowns”•10-55 mi from urban center•Connected by highway (usually no tolls)
Confidential (unpublished), prepared by C. Brown and A. Berger for Toyota-TRINA, 2009.
US areas with highest population and income growth (2000-08) are identified by BusinessWeek as Boomtowns, (shown in orange). They are always outside, but near a major city (shown in gray), usually connected by a major highway.
Intro Economics Housing Employment Denver Transportation
Do Not Use This Material Without Permission from Author17
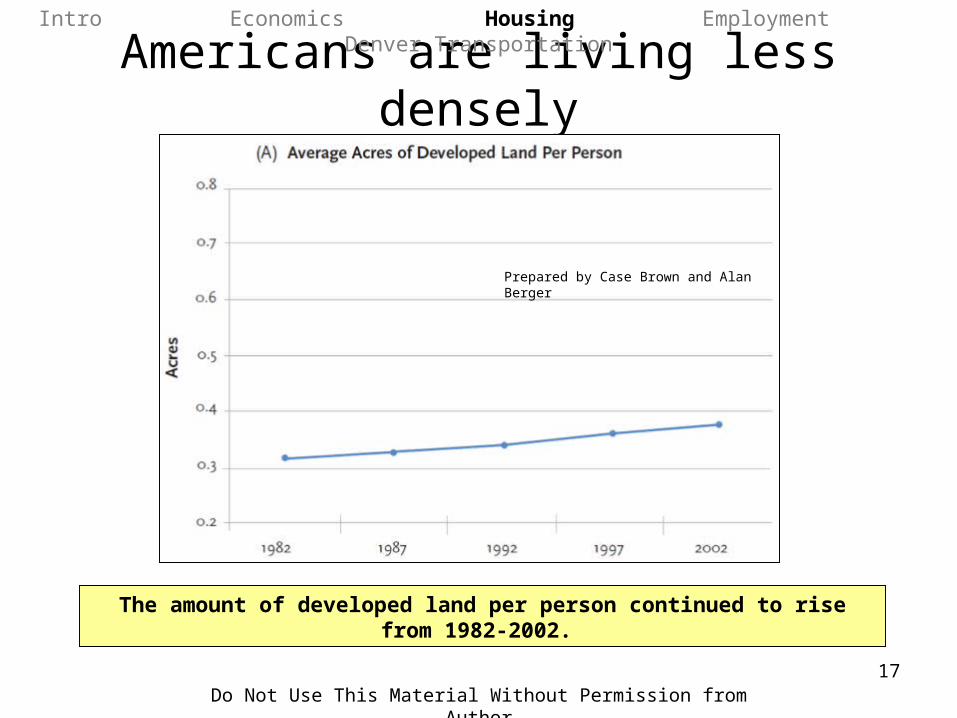
Americans are living less densely
The amount of developed land per person continued to rise from 1982-2002.
Prepared by Case Brown and Alan Berger
Intro Economics Housing Employment Denver Transportation
Do Not Use This Material Without Permission from Author18
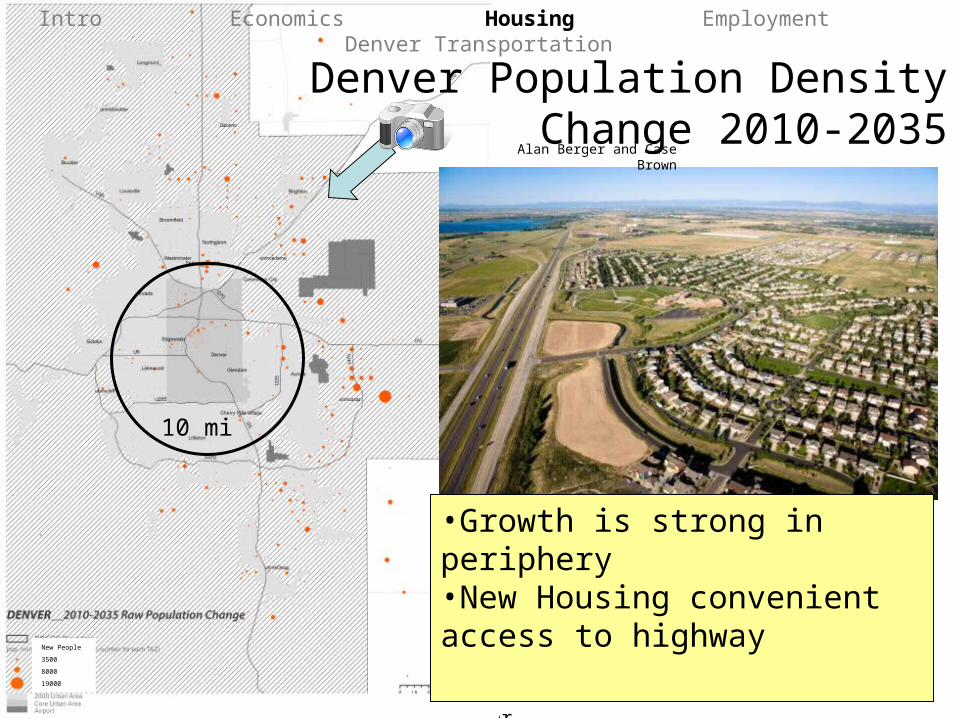
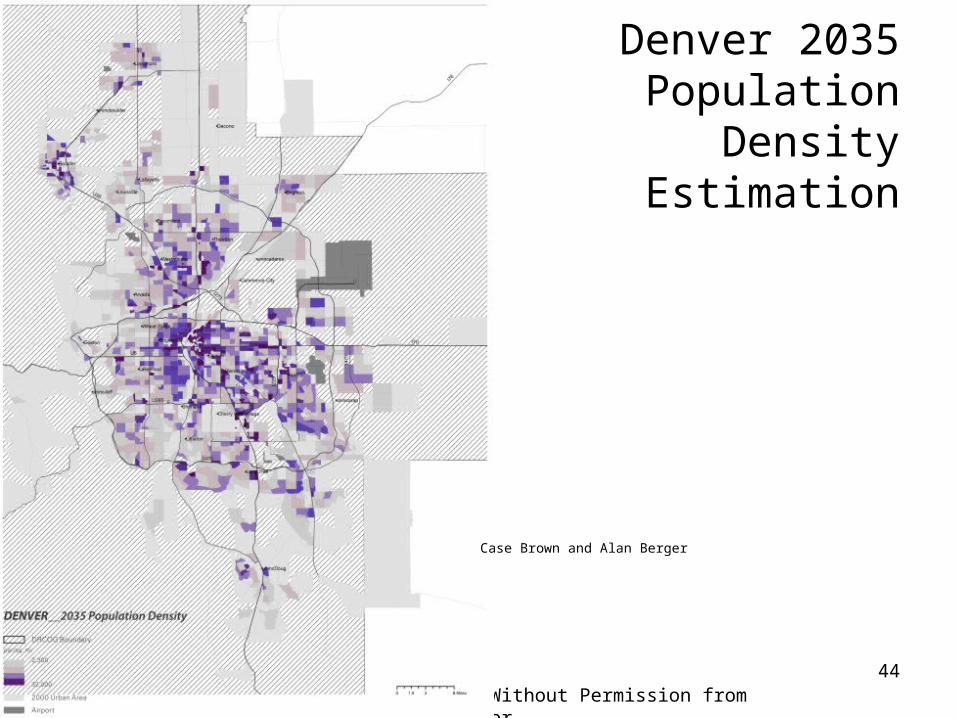
10 mi
New People
3500
8000
19000
Denver Population Density Change 2010-2035
•Growth is strong in periphery•New Housing convenient access to highway
Intro Economics Housing Employment Denver Transportation
Alan Berger and Case Brown
Do Not Use This Material Without Permission from Author19
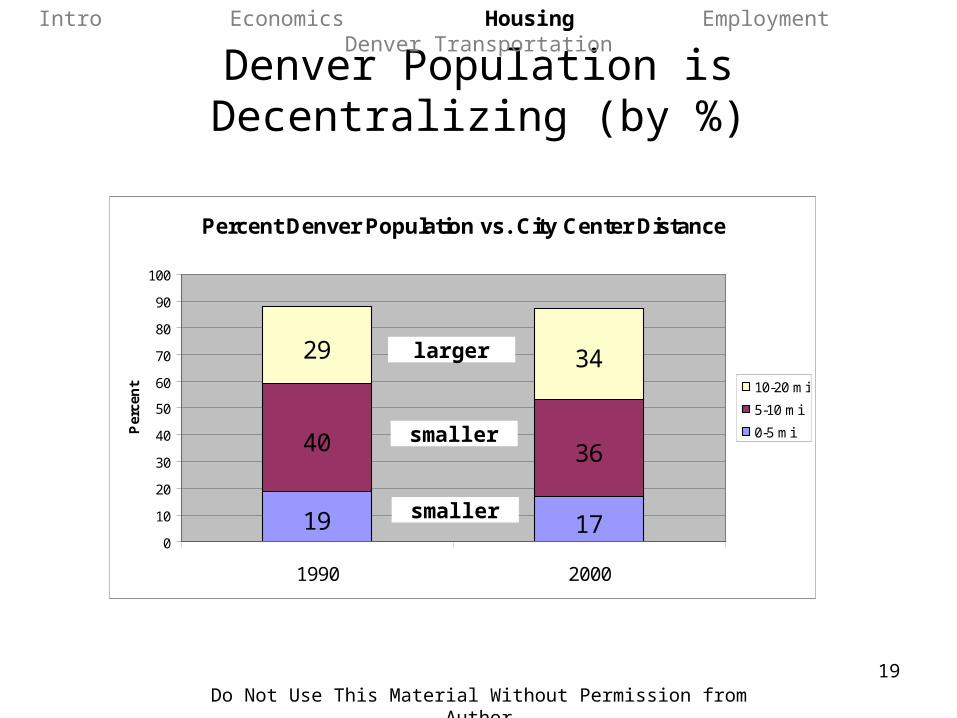
Denver Population is Decentralizing (by %)
Percent Denver Population vs. City Center Distance
19 17
40 36
29 34
0
10
20
30
40
50
60
70
80
90
100
1990 2000
Per
cen
t 10-20 mi
5-10 mi
0-5 mi
larger
smaller
smaller
Intro Economics Housing Employment Denver Transportation
Do Not Use This Material Without Permission from Author20
Analysis
• Trend is decentralized, less-dense housing.
• Fastest growing housing areas are outside of cities (although strongly connected to the economies of the anchor cities).
Intro Economics Housing Employment Denver Transportation
Do Not Use This Material Without Permission from Author21
Outline
• Economy and Transportation
• Decentralization of Housing
• Decentralization of Employment
• Denver Transportation
Intro Economics Housing Employment Denver Transportation
Do Not Use This Material Without Permission from Author22
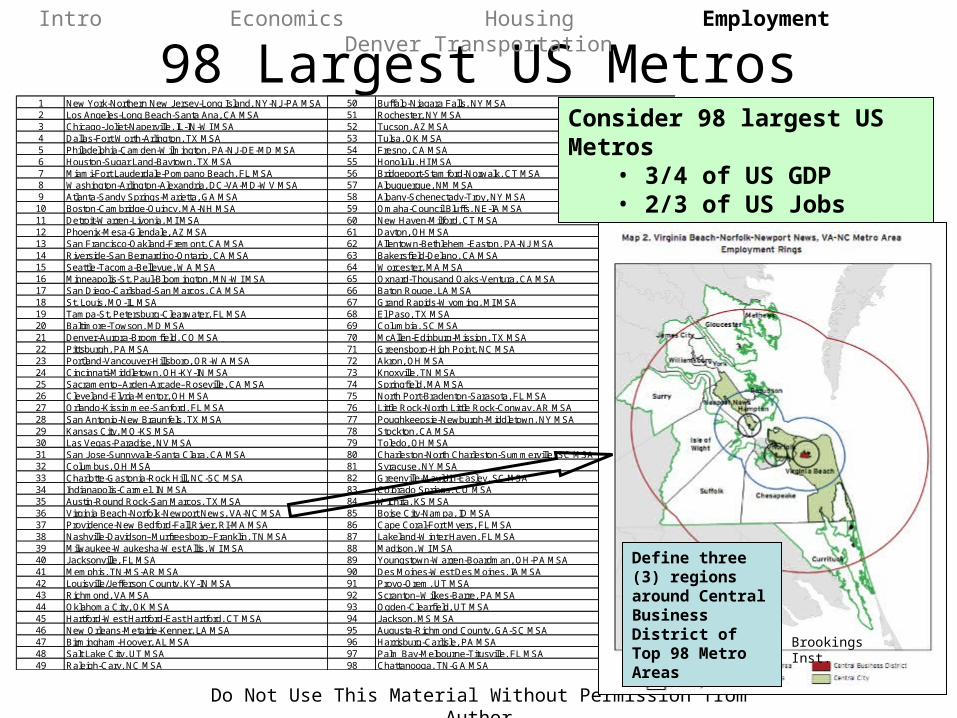
98 Largest US Metros1 New York-Northern New Jersey-Long Island, NY-NJ-PA MSA2 Los Angeles-Long Beach-Santa Ana, CA MSA3 Chicago-Joliet-Naperville, IL-IN-WI MSA4 Dallas-Fort Worth-Arlington, TX MSA5 Philadelphia-Camden-Wilmington, PA-NJ-DE-MD MSA6 Houston-Sugar Land-Baytown, TX MSA7 Miami-Fort Lauderdale-Pompano Beach, FL MSA8 Washington-Arlington-Alexandria, DC-VA-MD-WV MSA9 Atlanta-Sandy Springs-Marietta, GA MSA
10 Boston-Cambridge-Quincy, MA-NH MSA11 Detroit-Warren-Livonia, MI MSA12 Phoenix-Mesa-Glendale, AZ MSA13 San Francisco-Oakland-Fremont, CA MSA14 Riverside-San Bernardino-Ontario, CA MSA15 Seattle-Tacoma-Bellevue, WA MSA16 Minneapolis-St. Paul-Bloomington, MN-WI MSA17 San Diego-Carlsbad-San Marcos, CA MSA18 St. Louis, MO-IL MSA19 Tampa-St. Petersburg-Clearwater, FL MSA20 Baltimore-Towson, MD MSA21 Denver-Aurora-Broomfield, CO MSA22 Pittsburgh, PA MSA23 Portland-Vancouver-Hillsboro, OR-WA MSA24 Cincinnati-Middletown, OH-KY-IN MSA25 Sacramento–Arden-Arcade–Roseville, CA MSA26 Cleveland-Elyria-Mentor, OH MSA27 Orlando-Kissimmee-Sanford, FL MSA28 San Antonio-New Braunfels, TX MSA29 Kansas City, MO-KS MSA30 Las Vegas-Paradise, NV MSA31 San Jose-Sunnyvale-Santa Clara, CA MSA32 Columbus, OH MSA33 Charlotte-Gastonia-Rock Hill, NC-SC MSA34 Indianapolis-Carmel, IN MSA35 Austin-Round Rock-San Marcos, TX MSA36 Virginia Beach-Norfolk-Newport News, VA-NC MSA37 Providence-New Bedford-Fall River, RI-MA MSA38 Nashville-Davidson–Murfreesboro–Franklin, TN MSA39 Milwaukee-Waukesha-West Allis, WI MSA40 Jacksonville, FL MSA41 Memphis, TN-MS-AR MSA42 Louisville/Jefferson County, KY-IN MSA43 Richmond, VA MSA44 Oklahoma City, OK MSA45 Hartford-West Hartford-East Hartford, CT MSA46 New Orleans-Metairie-Kenner, LA MSA47 Birmingham-Hoover, AL MSA48 Salt Lake City, UT MSA49 Raleigh-Cary, NC MSA
50 Buffalo-Niagara Falls, NY MSA51 Rochester, NY MSA52 Tucson, AZ MSA53 Tulsa, OK MSA54 Fresno, CA MSA55 Honolulu, HI MSA56 Bridgeport-Stamford-Norwalk, CT MSA57 Albuquerque, NM MSA58 Albany-Schenectady-Troy, NY MSA59 Omaha-Council Bluffs, NE-IA MSA60 New Haven-Milford, CT MSA61 Dayton, OH MSA62 Allentown-Bethlehem-Easton, PA-NJ MSA63 Bakersfield-Delano, CA MSA64 Worcester, MA MSA65 Oxnard-Thousand Oaks-Ventura, CA MSA66 Baton Rouge, LA MSA67 Grand Rapids-Wyoming, MI MSA68 El Paso, TX MSA69 Columbia, SC MSA70 McAllen-Edinburg-Mission, TX MSA71 Greensboro-High Point, NC MSA72 Akron, OH MSA73 Knoxville, TN MSA74 Springfield, MA MSA75 North Port-Bradenton-Sarasota, FL MSA76 Little Rock-North Little Rock-Conway, AR MSA77 Poughkeepsie-Newburgh-Middletown, NY MSA78 Stockton, CA MSA79 Toledo, OH MSA80 Charleston-North Charleston-Summerville, SC MSA81 Syracuse, NY MSA82 Greenville-Mauldin-Easley, SC MSA83 Colorado Springs, CO MSA84 Wichita, KS MSA85 Boise City-Nampa, ID MSA86 Cape Coral-Fort Myers, FL MSA87 Lakeland-Winter Haven, FL MSA88 Madison, WI MSA89 Youngstown-Warren-Boardman, OH-PA MSA90 Des Moines-West Des Moines, IA MSA91 Provo-Orem, UT MSA92 Scranton–Wilkes-Barre, PA MSA93 Ogden-Clearfield, UT MSA94 Jackson, MS MSA95 Augusta-Richmond County, GA-SC MSA96 Harrisburg-Carlisle, PA MSA97 Palm Bay-Melbourne-Titusville, FL MSA98 Chattanooga, TN-GA MSA
Consider 98 largest US Metros• 3/4 of US GDP• 2/3 of US Jobs
Define three (3) regions around Central Business District of Top 98 Metro Areas Brookings Inst.
Intro Economics Housing Employment Denver Transportation
Do Not Use This Material Without Permission from Author23
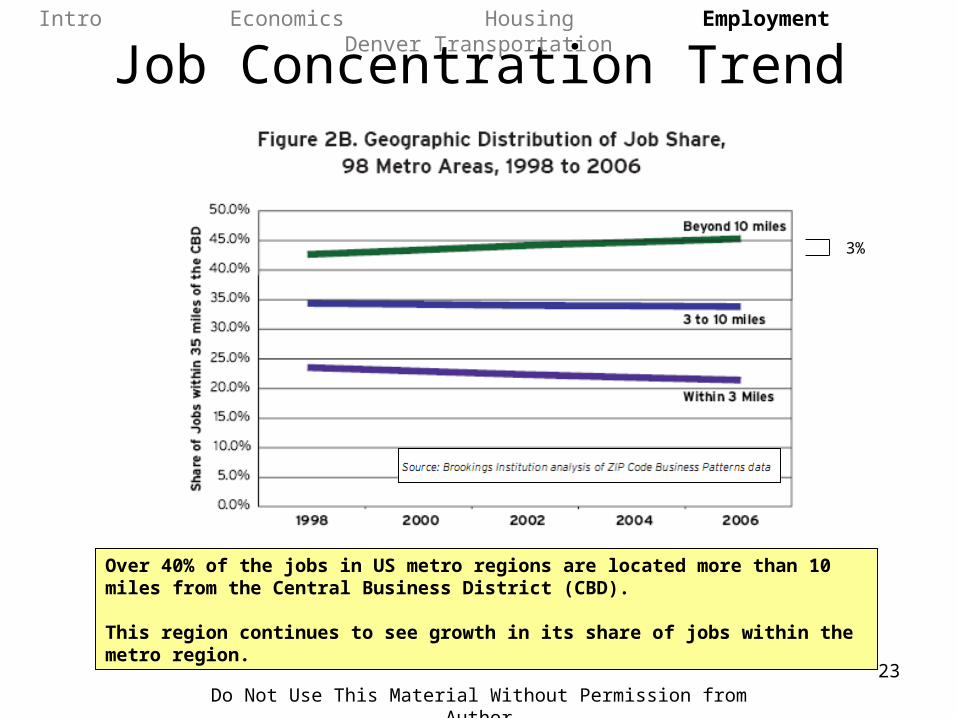
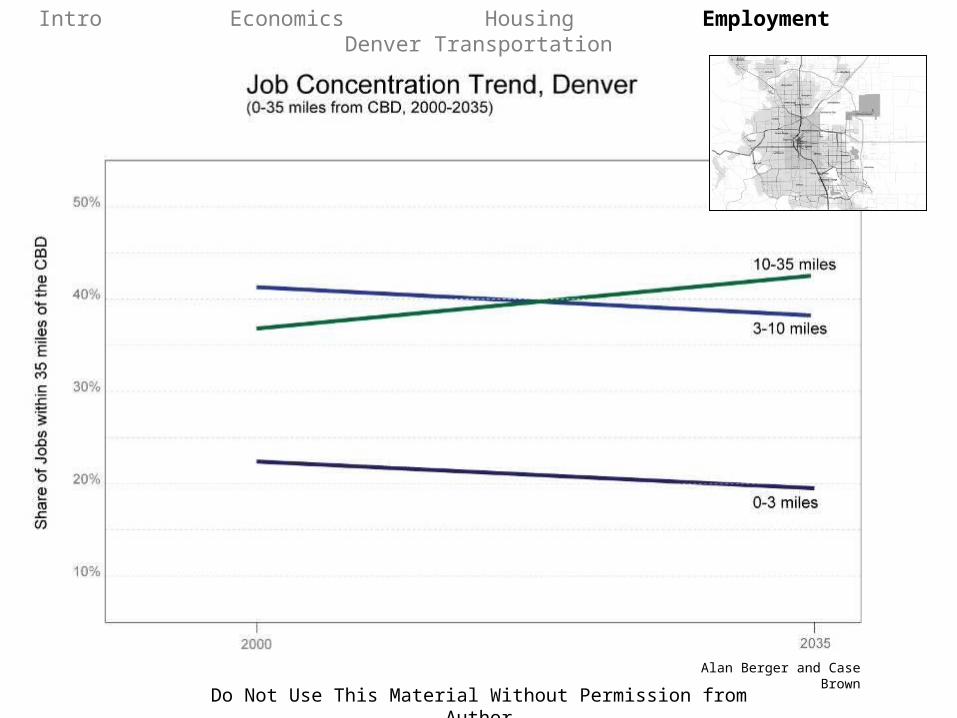
Job Concentration Trend
Over 40% of the jobs in US metro regions are located more than 10 miles from the Central Business District (CBD).
This region continues to see growth in its share of jobs within the metro region.
Intro Economics Housing Employment Denver Transportation
3%
Do Not Use This Material Without Permission from Author24
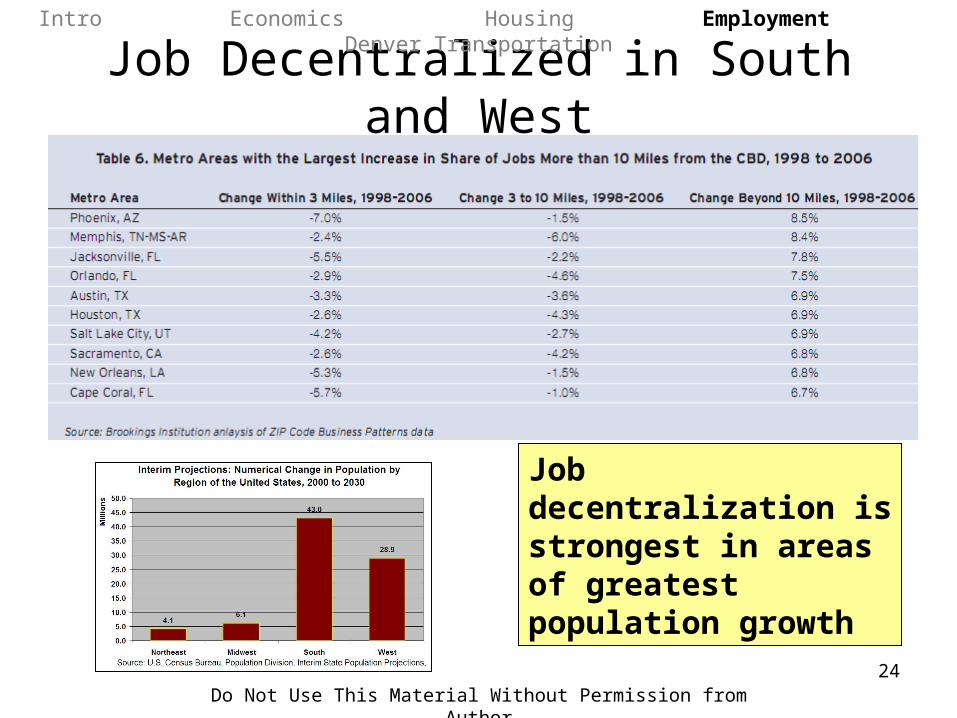
Job Decentralized in South and West
Job decentralization is strongest in areas of greatest population growth
Intro Economics Housing Employment Denver Transportation

Do Not Use This Material Without Permission from Author25
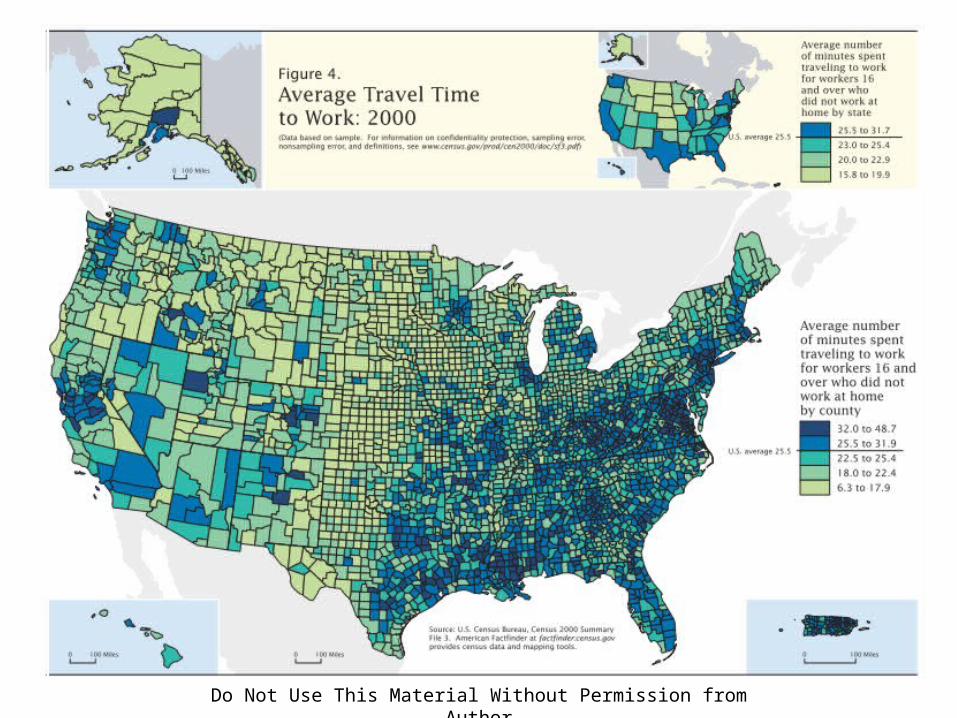
Commute Distances Increasing
One Way Commute distance from 1983-2005. In that time, the distance nearly doubled, from 8.5 miles to 16 miles.
National Highway Travel Survey 2001, US Bureau of TransportationStatistics Omnibus Household Survey 2003, ABC News/Time
magazine/Washington Post poll 2005
One-way Commute Distance
0
5
10
15
20
1981 1991 2001Pe
rso
n T
rip
Le
ng
th (
mile
s)
Intro Economics Housing Employment Denver Transportation
Do Not Use This Material Without Permission from Author26
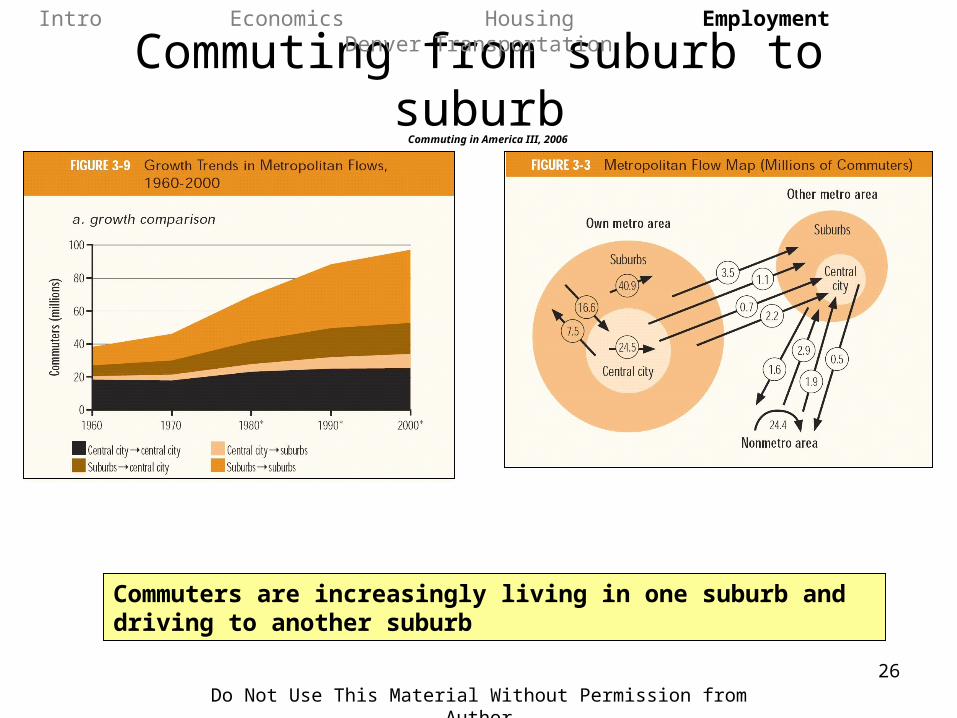
Commuting from suburb to suburb
Commuters are increasingly living in one suburb and driving to another suburb
Intro Economics Housing Employment Denver Transportation
Commuting in America III, 2006
Do Not Use This Material Without Permission from Author27
Intro Economics Housing Employment Denver Transportation
Alan Berger and Case Brown
Do Not Use This Material Without Permission from Author28
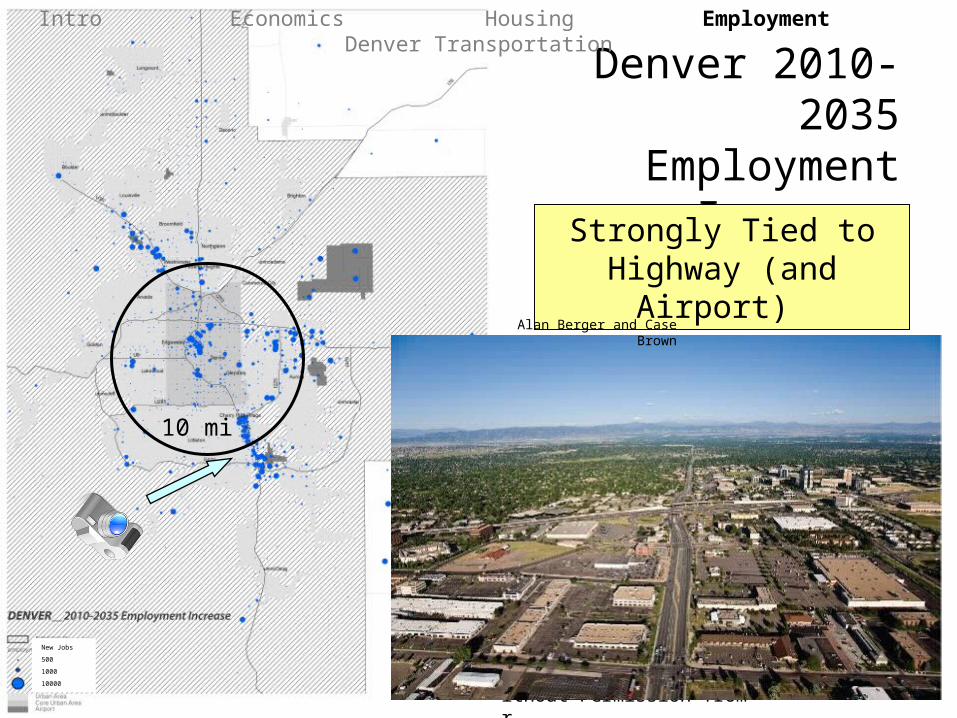
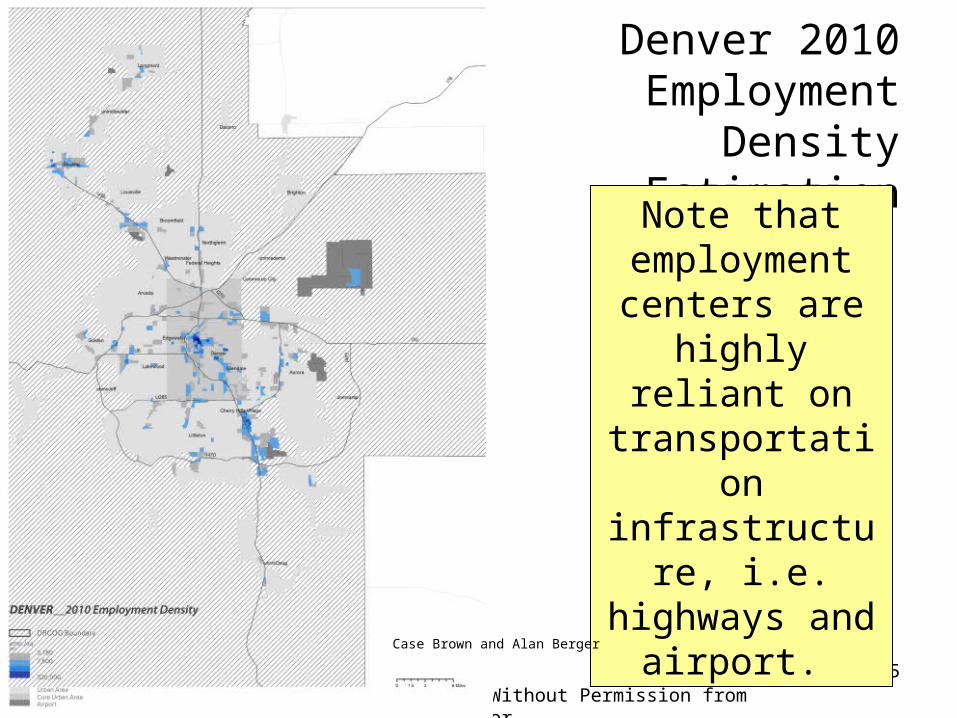
Denver 2010-2035 Employment
IncreaseStrongly Tied to Highway
(and Airport)
10 mi
New Jobs
500
1000
10000
Intro Economics Housing Employment Denver Transportation
Alan Berger and Case Brown

Do Not Use This Material Without Permission from Author29
Car dominates Denver Commute
2007 Denver City Commuter Method
Mass transit
Drive Alone
Carpool
Intro Economics Housing Employment Denver Transportation
Do Not Use This Material Without Permission from Author30
Analysis
• All indications point to decentralization of employment in US Metro regions.
• Suburb-to-suburb commute dominates—Metro Hub-and-Spoke transportation is not an ideal match.
Intro Economics Housing Employment Denver Transportation
Do Not Use This Material Without Permission from Author31
Outline
• Economy and Transportation
• Decentralization of Housing
• Decentralization of Employment
• Denver Transportation
Intro Economics Housing Employment Denver Transportation
Do Not Use This Material Without Permission from Author32
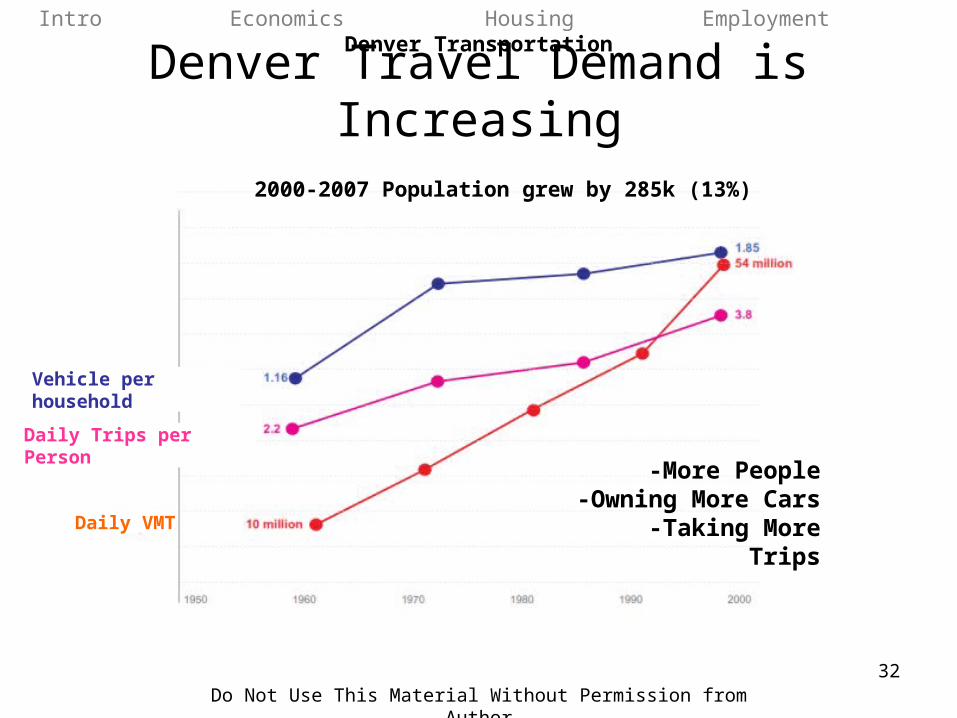
Denver Travel Demand is Increasing
Vehicle per household
Daily Trips per Person
Daily VMT
-More People-Owning More Cars-Taking More Trips
2000-2007 Population grew by 285k (13%)
Intro Economics Housing Employment Denver Transportation
Do Not Use This Material Without Permission from Author33
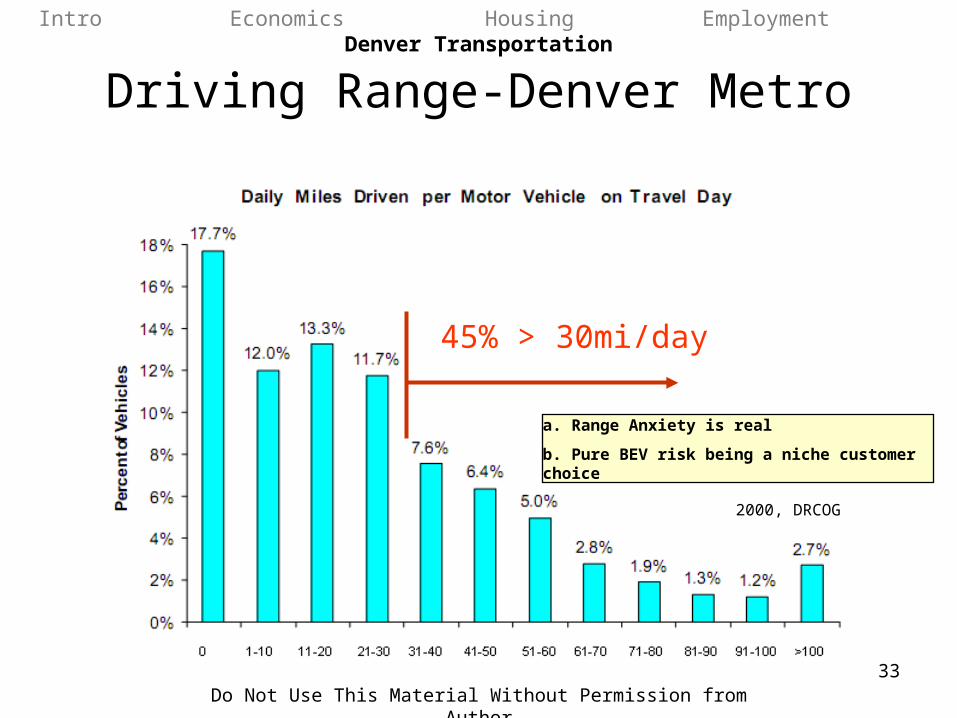
Driving Range-Denver Metro
45% > 30mi/day
a. Range Anxiety is real
b. Pure BEV risk being a niche customer choice
2000, DRCOG
Intro Economics Housing Employment Denver Transportation
Do Not Use This Material Without Permission from Author34
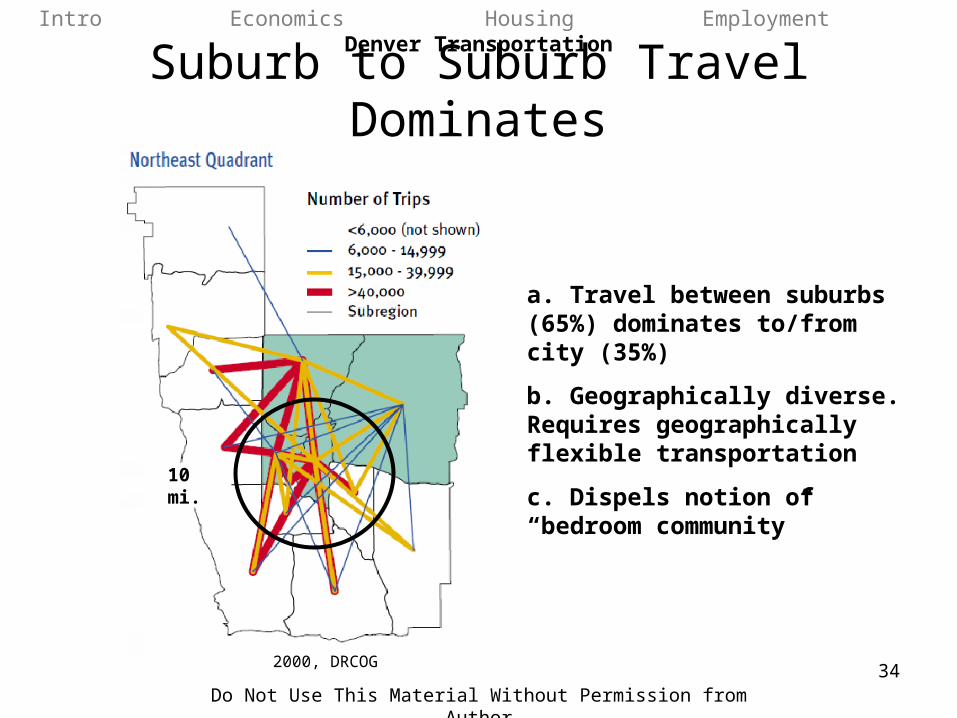
Suburb to Suburb Travel Dominates
a. Travel between suburbs (65%) dominates to/from city (35%)
b. Geographically diverse. Requires geographically flexible transportation
c. Dispels notion of “bedroom community”
10 mi.
2000, DRCOG
Intro Economics Housing Employment Denver Transportation
Do Not Use This Material Without Permission from Author35
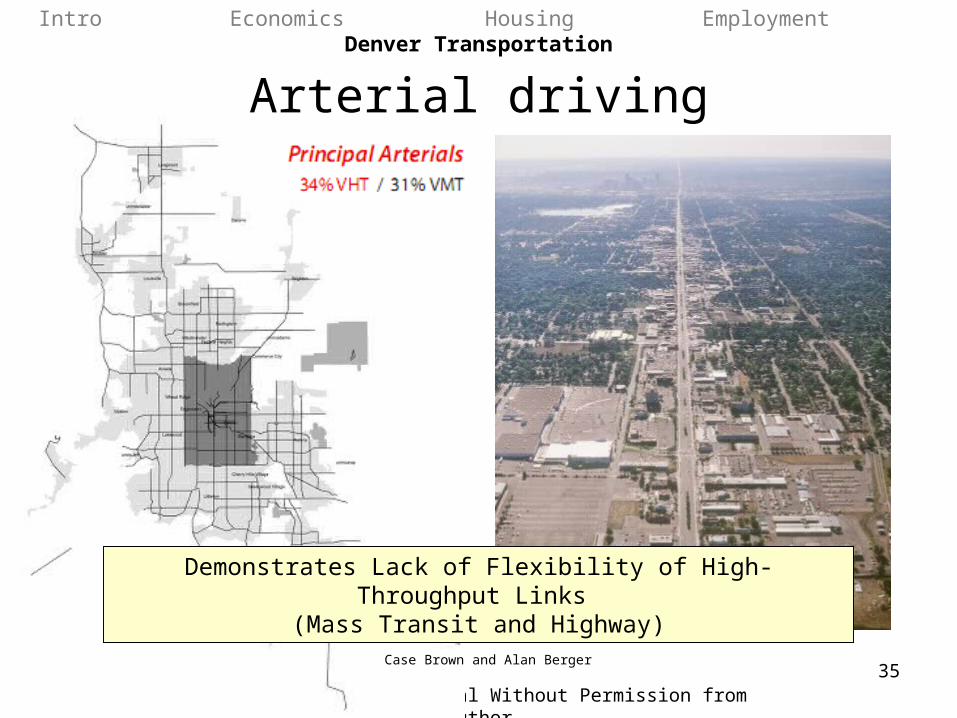
Demonstrates Lack of Flexibility of High-Throughput Links (Mass Transit and Highway)
Intro Economics Housing Employment Denver Transportation
Arterial driving
Case Brown and Alan Berger
Do Not Use This Material Without Permission from Author36
Summary-US
• Vehicle Miles Traveled (VMT) tend to grow with US Economy. Although currently unclear, no convincing evidence it will change.
• US Employment is decentralizing.• US Housing is decentralizing.
• Main Result: Car-focus culture likely to continue/grow in US
Do Not Use This Material Without Permission from Author37
Summary-Denver
This mapping of the Denver Metro Area reinforces:1. Housing continues to grow at the periphery
(suburbs).2. Employment centers are highly dependent on
transportation infrastructure.3. Suburb-to-suburb trips dominate trips to and
from the central business district.4. City layout requires most people use highly
flexible transportation, mostly car.

Do Not Use This Material Without Permission from Author38
Contact
+1-734-995-4307

Do Not Use This Material Without Permission from Author39
Backup Slides
Do Not Use This Material Without Permission from Author40
Boomtown relation to Central City
24 largest US Boomtowns, super-imposed in relationship to their city center.
Ave. distance of these top 24=35 km, whereas the Top 10=42 km.
19 of top 24, and all of the top 10, are in South and Western US.
Case Brown and Alan Berger
Do Not Use This Material Without Permission from Author41White Line-Western US; Black Line-Eastern US
Do Not Use This Material Without Permission from Author42
Do Not Use This Material Without Permission from Author43
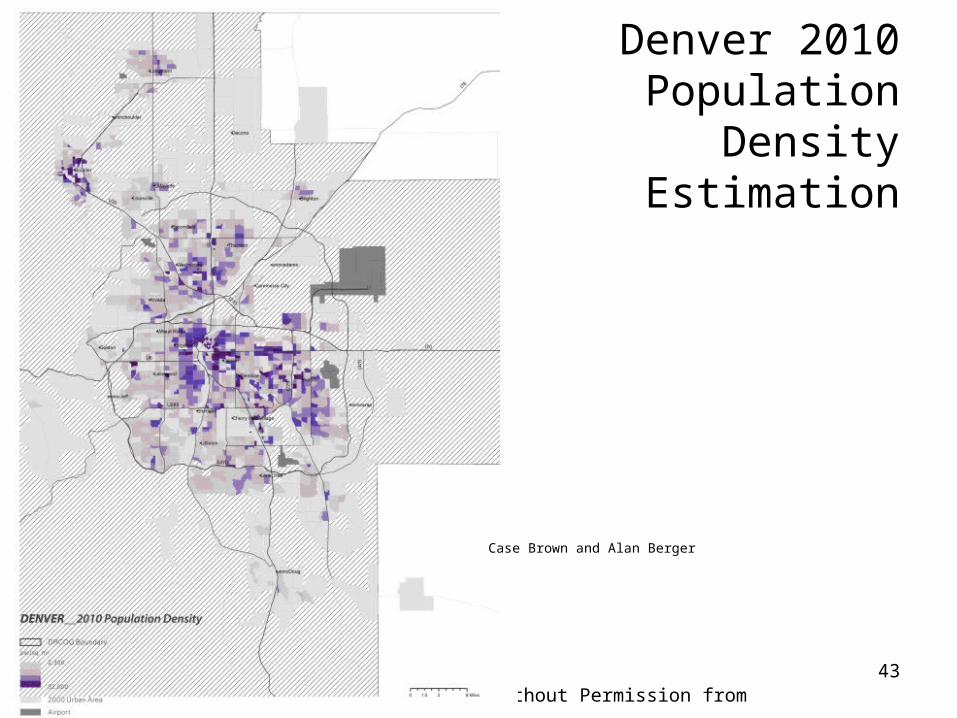
Denver 2010 Population Density
Estimation
Case Brown and Alan Berger
Do Not Use This Material Without Permission from Author44
Denver 2035 Population Density
Estimation
Case Brown and Alan Berger
Do Not Use This Material Without Permission from Author45
Denver 2010 Employment
Density Estimation
Note that employment centers are
highly reliant on transportation infrastructure, i.e. highways and airport.
Case Brown and Alan Berger
Do Not Use This Material Without Permission from Author46
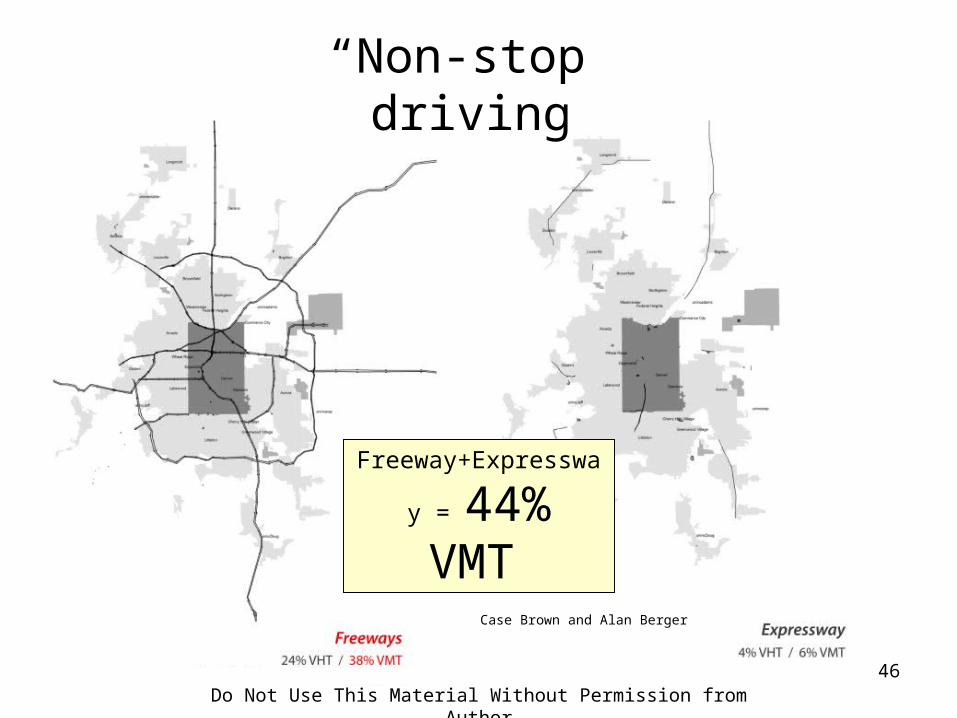
“Non-stop” driving
Freeway+Expressway
= 44% VMT
Case Brown and Alan Berger
Do Not Use This Material Without Permission from Author47
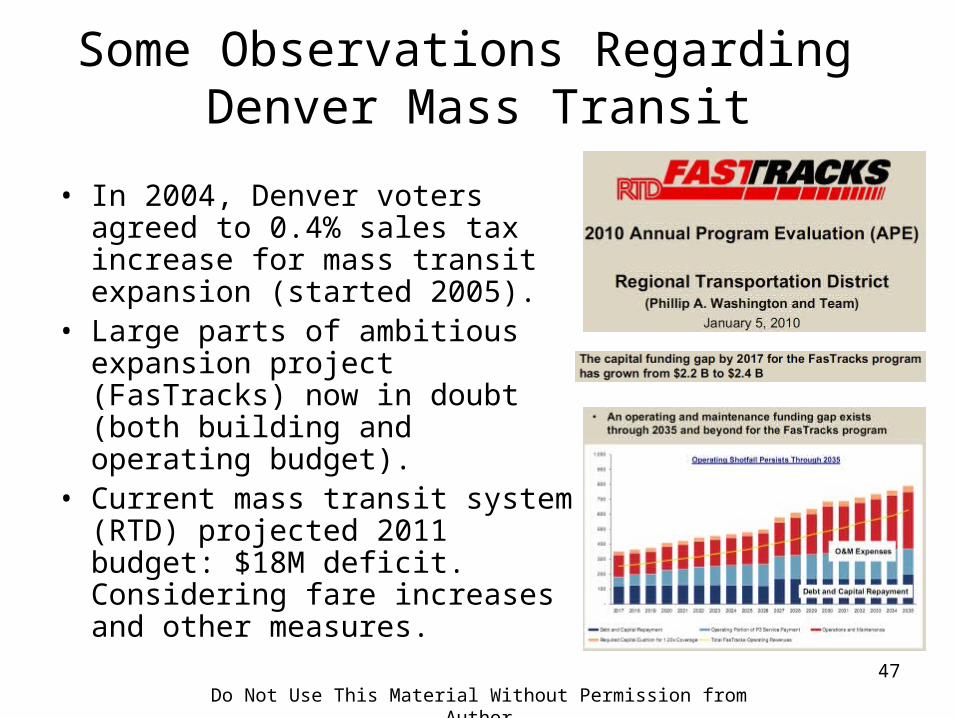
Some Observations Regarding Denver Mass Transit
• In 2004, Denver voters agreed to 0.4% sales tax increase for mass transit expansion (started 2005).
• Large parts of ambitious expansion project (FasTracks) now in doubt (both building and operating budget).
• Current mass transit system (RTD) projected 2011 budget: $18M deficit. Considering fare increases and other measures.

Do Not Use This Material Without Permission from Author48
Selection Criteria (1/2)A) Top 100 Metropolitan Area by population: Rationale: Vast majority
of the American economy found within this set (75% of U.S. economy, 62% of population, 9.2% growth from 2000-2008).
B) Located in South or West regions Rationale: Growth potential is at least triple that of North or Midwest (South and West grew at 12% from 2000-2008, East and Midwest only 3%).
C) Metropolitan Area, not Micropolitan Area Rationale: Growth in Metros is twice that of Micros (9.2% for Metros vs. 4.5% for Micros from 2000-2008).
D) Should not be limited on more than 1 side geographically Rationale: Oceans, mountains, geographical limitations for expansion can exert strong natural controls on urbanization that will not be typical of the overall set.
Do Not Use This Material Without Permission from Author49
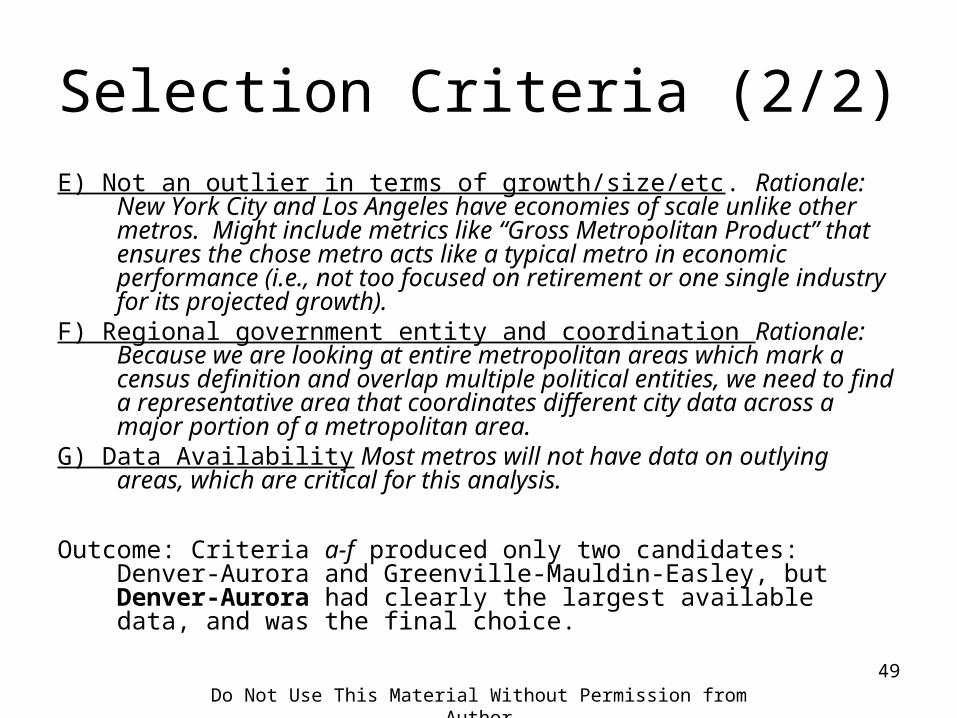
Selection Criteria (2/2)E) Not an outlier in terms of growth/size/etc. Rationale: New York City
and Los Angeles have economies of scale unlike other metros. Might include metrics like “Gross Metropolitan Product” that ensures the chose metro acts like a typical metro in economic performance (i.e., not too focused on retirement or one single industry for its projected growth).
F) Regional government entity and coordination Rationale: Because we are looking at entire metropolitan areas which mark a census definition and overlap multiple political entities, we need to find a representative area that coordinates different city data across a major portion of a metropolitan area.
G) Data Availability Most metros will not have data on outlying areas, which are critical for this analysis.
Outcome: Criteria a-f produced only two candidates: Denver-Aurora and Greenville-Mauldin-Easley, but Denver-Aurora had clearly the largest available data, and was the final choice.
Do Not Use This Material Without Permission from Author50
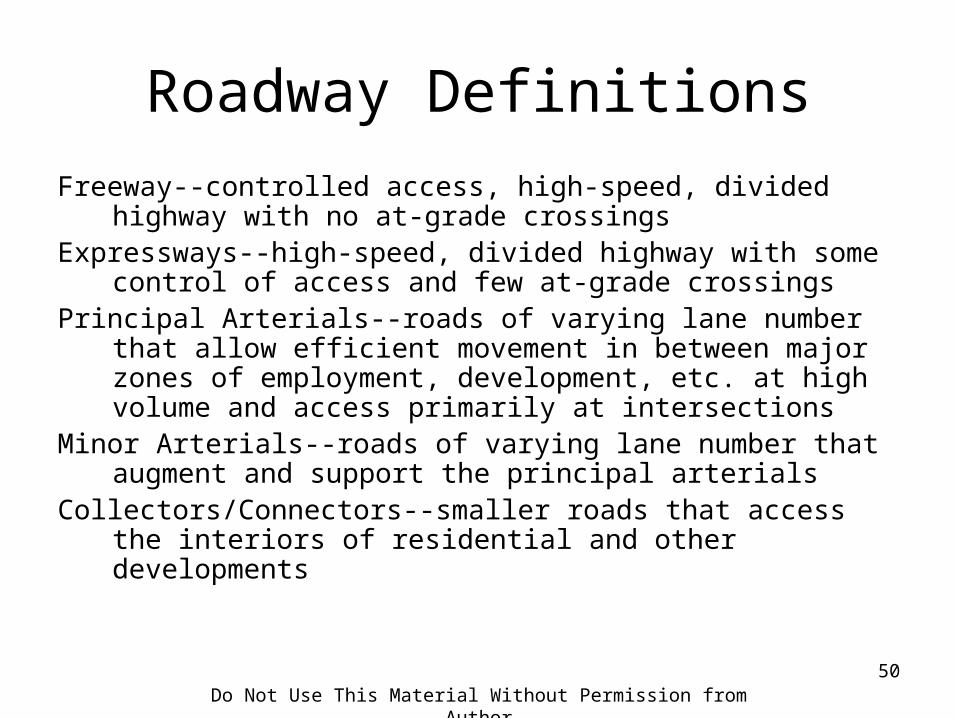
Roadway Definitions
Freeway--controlled access, high-speed, divided highway with no at-grade crossings
Expressways--high-speed, divided highway with some control of access and few at-grade crossings
Principal Arterials--roads of varying lane number that allow efficient movement in between major zones of employment, development, etc. at high volume and access primarily at intersections
Minor Arterials--roads of varying lane number that augment and support the principal arterials
Collectors/Connectors--smaller roads that access the interiors of residential and other developments