Embed Size (px)
Citation preview
1
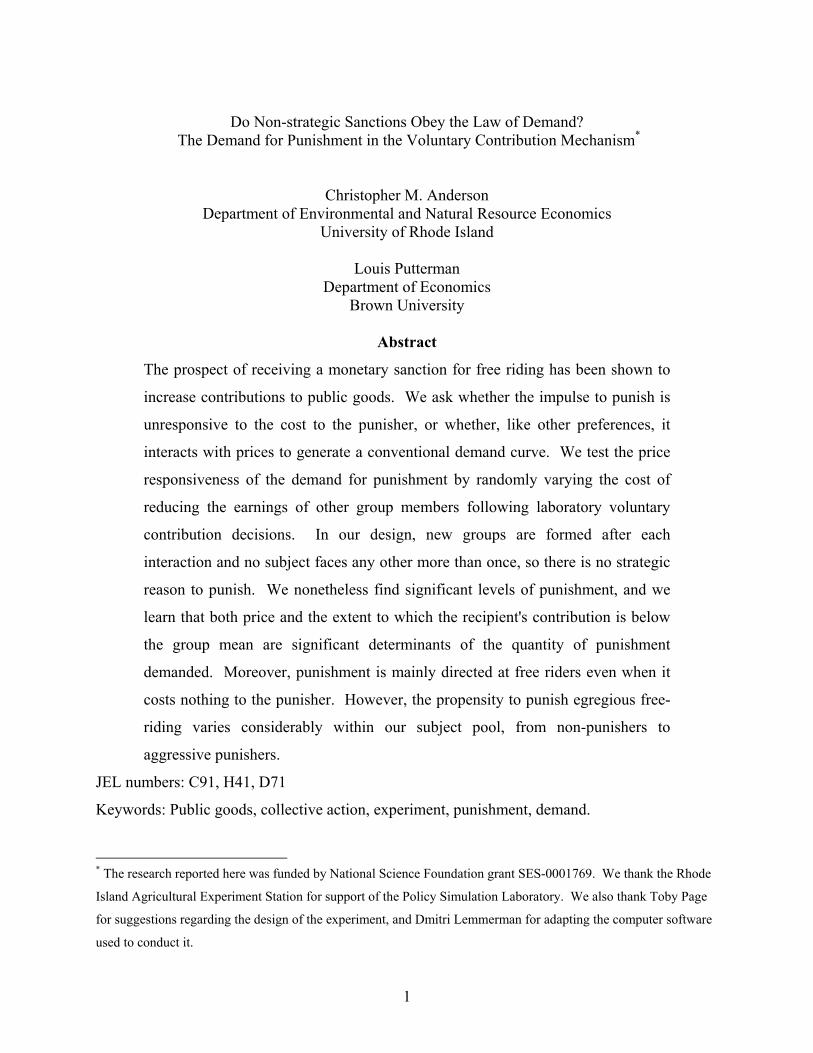
Do Non-strategic Sanctions Obey the Law of Demand?
The Demand for Punishment in the Voluntary Contribution Mechanism*
Christopher M. Anderson Department of Environmental and Natural Resource Economics
University of Rhode Island
Louis Putterman Department of Economics
Brown University
Abstract
The prospect of receiving a monetary sanction for free riding has been shown to
increase contributions to public goods. We ask whether the impulse to punish is
unresponsive to the cost to the punisher, or whether, like other preferences, it
interacts with prices to generate a conventional demand curve. We test the price
responsiveness of the demand for punishment by randomly varying the cost of
reducing the earnings of other group members following laboratory voluntary
contribution decisions. In our design, new groups are formed after each
interaction and no subject faces any other more than once, so there is no strategic
reason to punish. We nonetheless find significant levels of punishment, and we
learn that both price and the extent to which the recipient's contribution is below
the group mean are significant determinants of the quantity of punishment
demanded. Moreover, punishment is mainly directed at free riders even when it
costs nothing to the punisher. However, the propensity to punish egregious free-
riding varies considerably within our subject pool, from non-punishers to
aggressive punishers.
JEL numbers: C91, H41, D71
Keywords: Public goods, collective action, experiment, punishment, demand.
* The research reported here was funded by National Science Foundation grant SES-0001769. We thank the Rhode
Island Agricultural Experiment Station for support of the Policy Simulation Laboratory. We also thank Toby Page
for suggestions regarding the design of the experiment, and Dmitri Lemmerman for adapting the computer software
used to conduct it.
2
1. Introduction The voluntary contribution mechanism is a linear n-person dilemma game that experimentalists
use to study, in the laboratory, problems of collective action such as the voluntary provision of a
public good. Subjects are put in groups and asked to divide endowments between group and
personal accounts. Although the socially efficient outcome is attained when all contribute their
full endowment to the group account, individuals maximize their payoff by retaining their
endowments, regardless of what others do. In trials, subjects typically contribute an average of
over 50% of their endowments in one-shot play or in the initial round of repeated play. In
repeated play, contributions then tend to decay toward zero (Ledyard, 1995; Davis and Holt,
1993).
Recently, a number of experiments have been inspired by Fehr and Gächter’s (2000a)
demonstration that this decay in contributions can be mitigated or reversed by allowing subjects
to direct costly monetary punishments at other group members after learning of their
contributions. The qualitative findings that many subjects engage in costly punishment, that it is
aimed mainly at low contributors, and that contributions accordingly stabilize or rise, has been
confirmed by a number of studies including Bochet, Page and Putterman (2002), Carpenter
(2000), Falk, Fehr and Fischbacher (2001), Fehr and Gächter (2002), Masclet, Noussair, Tucker
and Villeval (2003), Page, Putterman and Unel (2003), and Sefton, Shupp and Walker (2002).
Fehr and Gächter (2000b) interpret the evidence as suggesting that substantial numbers of
individuals have a propensity to punish free riding, perhaps because it violates a norm of, or a
predisposition towards, reciprocity.
While most of these experimental designs make it possible for subjects to interact more than
once, so punishment could be motivated by the desire to induce higher contributions in later
periods, there is evidence that at least some costly punishment is nonstrategic. For example,
many subjects pay to punish free riders in the last period of finitely repeated interactions. And
there is considerable punishment in the perfect stranger treatment of Fehr and Gächter (2000a) in
which no subject encounters another more than once.
3
Two characterizations of this nonstrategic behavior have been offered. When A contributes
more to the public good than does B, A earns less than B in the contribution stage of their
interaction. Given this, it might appear to be irrational for A to further lower his earnings to
retaliate against B, if they will not be grouped for future play. According to the first
characterization, A may feel so much anger at B that A seizes the opportunity to punish B
without pausing to weigh the consequences. Punishment, on this account, is an act that is not
amenable to economic analysis, although it needs to be factored into that analysis to adequately
predict the outcomes of certain types of interaction. An alternative characterization is that A’s
desire to punish B is a preference similar to others. Imposing a loss on B will give A satisfaction,
and although the feeling of satisfaction is not itself rational, this is equally true of other tastes,
and, as with other tastes, the degree of satisfaction anticipated can be reasonably weighed against
the cost of acquiring it, to determine the amount that should be purchased to maximize subjective
well-being. On this second account, there would be a downward sloping demand curve for
punishing free riders just as there is for consuming boysenberry jam or hot fudge sundaes. The
desire to punish free riding can then be thought of as a conventional preference.
We report the results of an experiment to test which characterization is more accurate. To study
the demand for punishment, we asked subjects to make contribution and punishment decisions at
several prices. To rule out a strategic incentive to punish, we used a perfect stranger design. Our
experiment provides further evidence that nonstrategic punishment of free riding is common, and
it demonstrates that the demand for punishment does obey the Law of Demand. It also sheds
light on some related issues. Based on our results, we extend to the case of zero cost punishment
the finding that individuals use punishment mainly to reduce the earnings of free riders. We
demonstrate a partial violation of the Fehr-Schmidt (1999) inequality-aversion explanation of
punishment by showing that punishment occurs even at higher cost to the punisher than to the
target. We also detect considerable differences among subjects in the propensity to punish free
riders.
2. Experimental Design
To test the extent to which monetary factors are considered in determining the quantity of
punishment demanded, our experimental design places subjects in a series of five one-shot
4
voluntary contribution games with two stages. In the first stage, subjects are anonymously
grouped and choose their level of contribution to the public good. In the second stage, each
subject learns the contribution levels of other members of her group and her price for each dollar
she chooses to reduce the earnings of other group members. Based on this information, each
subject chooses the amount she wishes to reduce each other group member's earnings. Her own
earnings are reduced by the cost of the reductions she purchases, and by the total amount of
reductions purchased for her by the other group members. After each learns her payoff, the
subject is assigned to a completely new group, containing no subject she faced in any previous
round.
After extra subjects were dismissed (and paid their $5 appearance fee), 18 subjects were seated
in the laboratory, each at a private computer. The experiment moderator read the instructions (in
Appendix A) out loud as subjects read along. The instructions were divided into two parts, one
for each stage of the game. After each part, subjects calculated the payoffs given hypothetical
practice problems to ensure they understood how decisions mapped to payoffs.
The first stage of the game is a standard voluntary contribution mechanism. Subjects were
endowed ten experimental dollars at the beginning of each period. In the first stage, each makes
an allocation, xi, to her group's account, and (10- xi) to her own personal account. For each
member of the three member group, the group account returns 0.6 Σi=13 xi , or 0.6 times the total
assigned to the group account. Subjects earned this fraction of the group account allocation
regardless of how much they themselves contributed to the group account. Therefore, each
subject's earnings from the first stage of the game is πi=(10- xi)+0.6 Σi=13 xi . Given this payoff
function, it is dominant strategy to set xi =0 since the private return on a dollar in the personal
account is one dollar, but only sixty cents in the group account. Subjects indicated their
decisions by typing an integer allocation to the group, xi into an input box in the experimental
software interface. Once all group members made their first stage allocation, the second stage of
the game began with each subject being shown how much each other member of the group
allocated to the group account. Each was also shown, her (but not other members’) private per-
unit punishment cost, pi. In each period, pi could take on one of five possible values. The five
values were 0, 30, 60, 90 and 120 cents in treatment 1; 0, 5, 10, 20 and 30 cents in treatment 2;
5
and 30, 40, 50 ,60 and 70 cents in treatment 3. Each subject faced each of the five values in a
random order throughout the five periods, and subjects' orderings were determined
independently, so subjects could infer nothing about the prices of others in their group based on
pi. Subjects were told only that their pi was chosen randomly from among the five values, and
that other subjects' prices were equally likely to be each of the five values in any given period.
We assigned punishment costs in this way so that those costs could affect the choice of
punishment only directly, and not also by influencing the choice of contribution in a given
period. Three different sets of punishment costs were used to see whether the same or different
qualitative results would hold over different ranges of values.
With the contribution and price information presented, subjects made two decisions, one level of
punishment (possibly zero) for each of the other two members of their group. Each subject i
indicated her a choice by typing an integer number of units of punishment, rij, in to a box for
each other subject, j, in the group. Subjects may choose any number of punishment units so long
as (a) the punishment given to any one subject is not greater than that subject’s earnings for the
period and (b) the total cost of the units purchased does not exceed πi, the amount earned by the
punisher in the first stage of the game in the same period.
Once all group members make their second stage punishment decisions, each subject learns the
aggregate amount he or she was punished by other members of the group, and his or her final
earnings for the period. Subject i's earnings for the period are
Earningsi = (10- xi)+0.6 Σj=13 xj - pi Σj≠i rij - Σj≠i rji
The first two terms represent i's earnings in the voluntary contribution mechanism stage of the
game. The third term is the amount i spent punishing other members of her group. The fourth
term is the amount i was punished by the other members of her group. Money that is “punished
away” is returned to the research fund.1 If this equation yields a negative number, i’s earnings
for the period are set to zero.
1 The structure of the contribution and punishment stages is identical to that used in Bochet et al. (2002) and Page et
al. (2002) except that in those experiments, groups consist of four subjects, the MPCR is set to 0.4 rather than 0.6,
6
Subjects participated in this two-stage game five times. After each game, subjects were
reassigned to completely new groups, such that they never faced the same subject twice.2 This
matching protocol ensures there is no strategic benefit to punishment: altering others’ behavior
will not benefit a subject, for she will never encounter that opponent again, with certainty.3
After the five rounds, subjects answered a debriefing questionnaire with basic demographic
information and a narrative description of their strategy in the game. Subjects' earnings were
converted from experimental dollars to U.S. dollars at a rate of 1 experimental dollar = $0.25, $5
was added as a flat fee for participation, and subjects were paid privately. Earnings averaged
$20.61, with a standard deviation of $3.58, for sessions which lasted about 75 minutes.
Three sessions of each treatment were run in the Policy Simulation Laboratory at the University
of Rhode Island, and one session of each treatment was run in a computer classroom at Brown
University. Subjects were recruited from e-mail lists of students who had expressed interest in
participating in experiments, from courses, and from on-campus advertisements. Subjects did
not necessarily have any training in economics, and, with the exception of a few subjects at
Brown, none had experience with similar experiments.4
and the punishment cost is uniformly 0.25. Having a fixed cost of taking one monetary unit from the person
targeted differs from Fehr and Gächter (2000), in which there is a rising marginal cost of deducting fixed fractions
of the targeted person’s earnings. A fixed cost per monetary unit deducted is used in Fehr and Gächter (2002). 2 Five is the maximum number of ways to allocate 18 subjects into groups of three such that no subject is ever
grouped with any other subject more than once. 3 During periods 1 through 4, one cannot rule out altruistic motivation to help other participants in later periods.
However, the coefficient on a round 5 indicator variable in random effects tobit regression, like that in Table 2, is
insignificant, indicating that last-round punishment is indistinct from the first four rounds, controlling for
punishment price and target contributions. 4 The few exceptions, at Brown, had participated in 10 or 20 period partner-group experiments with a single fixed
cost of punishment.
7
3. Results
Average Contribution Levels Across Rounds
0
1
2
3
4
5
6
7
8
9
10
1 2 3 4 5
Round
1 (0-120)2 (0-30)3 (30-70)
Treatment
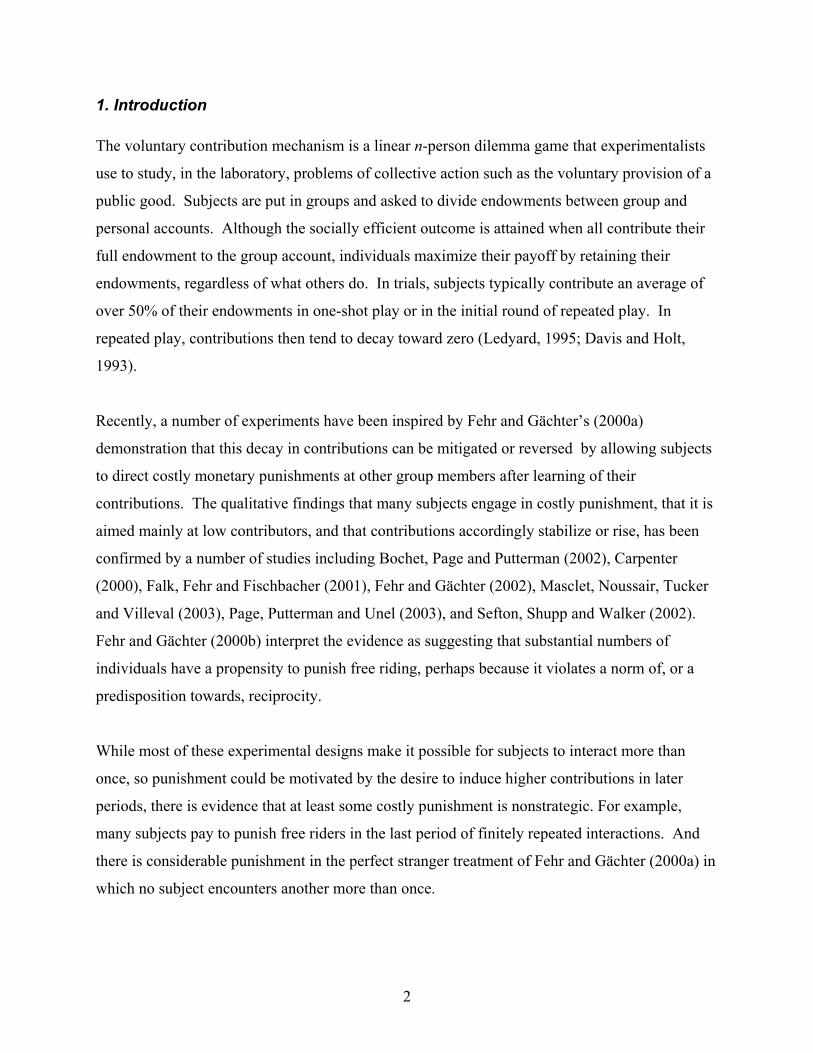
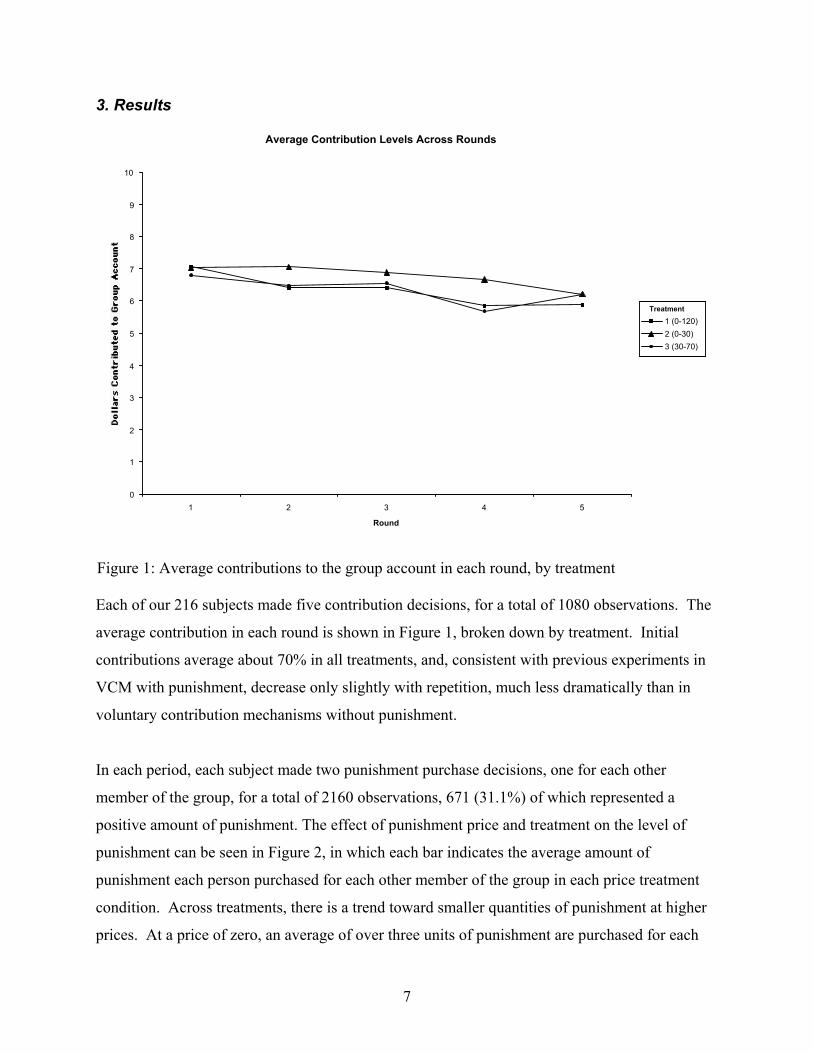
Figure 1: Average contributions to the group account in each round, by treatment Each of our 216 subjects made five contribution decisions, for a total of 1080 observations. The
average contribution in each round is shown in Figure 1, broken down by treatment. Initial
contributions average about 70% in all treatments, and, consistent with previous experiments in
VCM with punishment, decrease only slightly with repetition, much less dramatically than in
voluntary contribution mechanisms without punishment.
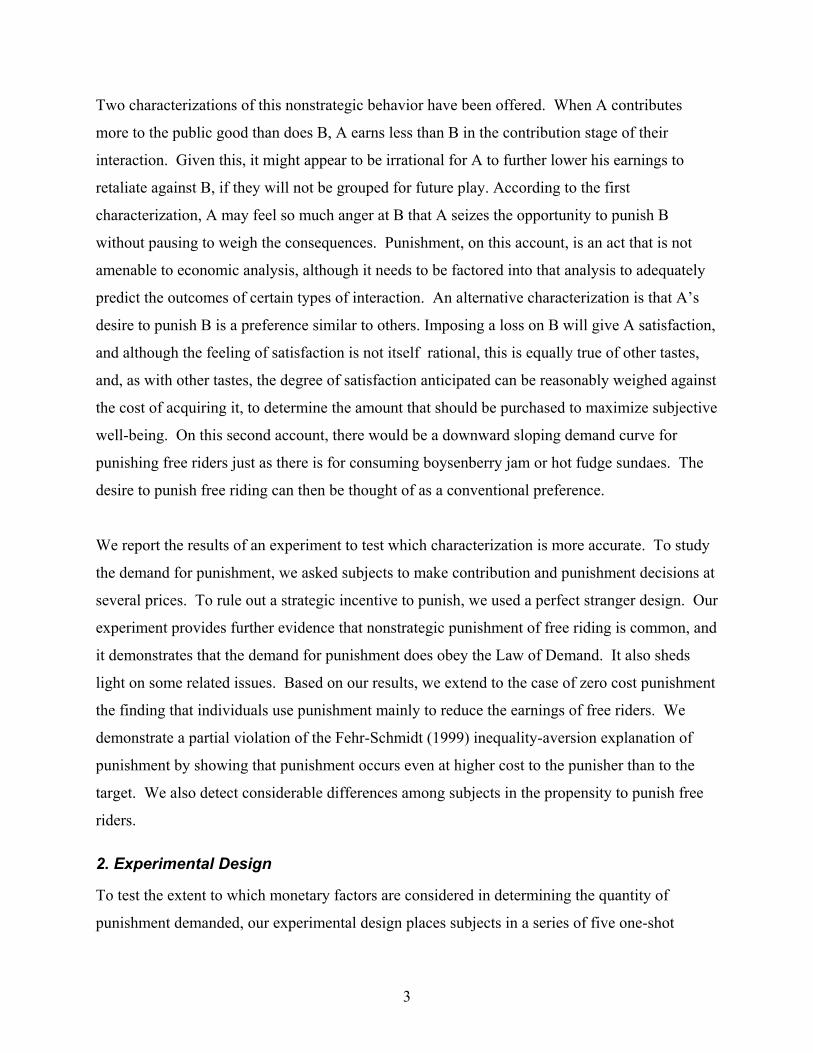
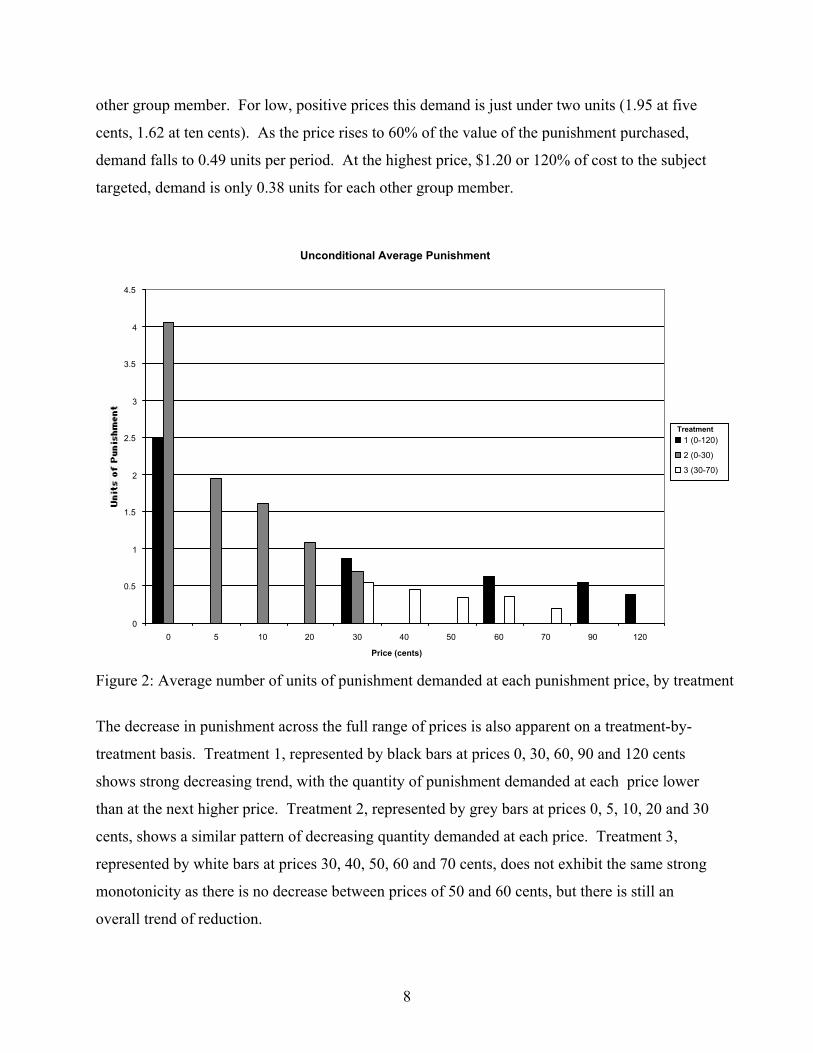
In each period, each subject made two punishment purchase decisions, one for each other
member of the group, for a total of 2160 observations, 671 (31.1%) of which represented a
positive amount of punishment. The effect of punishment price and treatment on the level of
punishment can be seen in Figure 2, in which each bar indicates the average amount of
punishment each person purchased for each other member of the group in each price treatment
condition. Across treatments, there is a trend toward smaller quantities of punishment at higher
prices. At a price of zero, an average of over three units of punishment are purchased for each
8
other group member. For low, positive prices this demand is just under two units (1.95 at five
cents, 1.62 at ten cents). As the price rises to 60% of the value of the punishment purchased,
demand falls to 0.49 units per period. At the highest price, $1.20 or 120% of cost to the subject
targeted, demand is only 0.38 units for each other group member.
Unconditional Average Punishment
0
0.5
1
1.5
2
2.5
3
3.5
4
4.5
0 5 10 20 30 40 50 60 70 90 120
Price (cents)
1 (0-120)
2 (0-30)
3 (30-70)
Treatment
Figure 2: Average number of units of punishment demanded at each punishment price, by treatment
The decrease in punishment across the full range of prices is also apparent on a treatment-by-
treatment basis. Treatment 1, represented by black bars at prices 0, 30, 60, 90 and 120 cents
shows strong decreasing trend, with the quantity of punishment demanded at each price lower
than at the next higher price. Treatment 2, represented by grey bars at prices 0, 5, 10, 20 and 30
cents, shows a similar pattern of decreasing quantity demanded at each price. Treatment 3,
represented by white bars at prices 30, 40, 50, 60 and 70 cents, does not exhibit the same strong
monotonicity as there is no decrease between prices of 50 and 60 cents, but there is still an
overall trend of reduction.
9
The remainder of the results section attempts to establish the visibly apparent features of the data
statistically. The major result, result 2, establishes the statistical link between price and the
quantity of punishment demanded. Result 3 shows that, in addition to price, punishment
demanded is increased by the target’s level of free riding, a regularity result 4 extends to
decisions with zero punishment price, and result 5 shows that punishment occurs even when the
cost to the punisher exceeds that to the person punished. That the demand for punishment varies
considerably through the population is established in result 6 by allowing for different “types” of
people. Result 7 relates these punishment patterns to earnings and efficiency differences across
treatments.
Result 1. Subjects made use of the punishment opportunity, even when it was costly.
In 2160 punishment purchase observations, 671 (31.1%) represented a positive amount of
punishment by 161 different subjects, 74.5% of the subject pool as a whole. In the 1872
observations in which punishment was costly, 147 different subjects (68.1% of the pool) paid
from their own earnings to reduce others’ earnings 510 times (27.2% of overall opportunities).
Therefore, despite a design which ensures that there is no strategic benefit to punishment,
positive levels of punishment are still observed at positive prices, replicating previous
experimental results.
Having established that punishment occurs, our subsequent investigation focuses on factors
which affect, and motivations for, punishment.
Result 2: The level of punishment is decreasing in price, even after controlling for the
significant effect of the level of free-riding.
Figure 2 illustrates that the demand for punishment is responsive to price. To establish the
statistical significance of this result and investigate related questions, we turn to multivariate
analysis. We begin by estimating a regression equation in which the amount of punishment that
a subject i gave to a subject j is the dependent variable, and the price to the punisher per unit of
punishment is an explanatory variable. Another likely explanatory variable whose effect is not
10
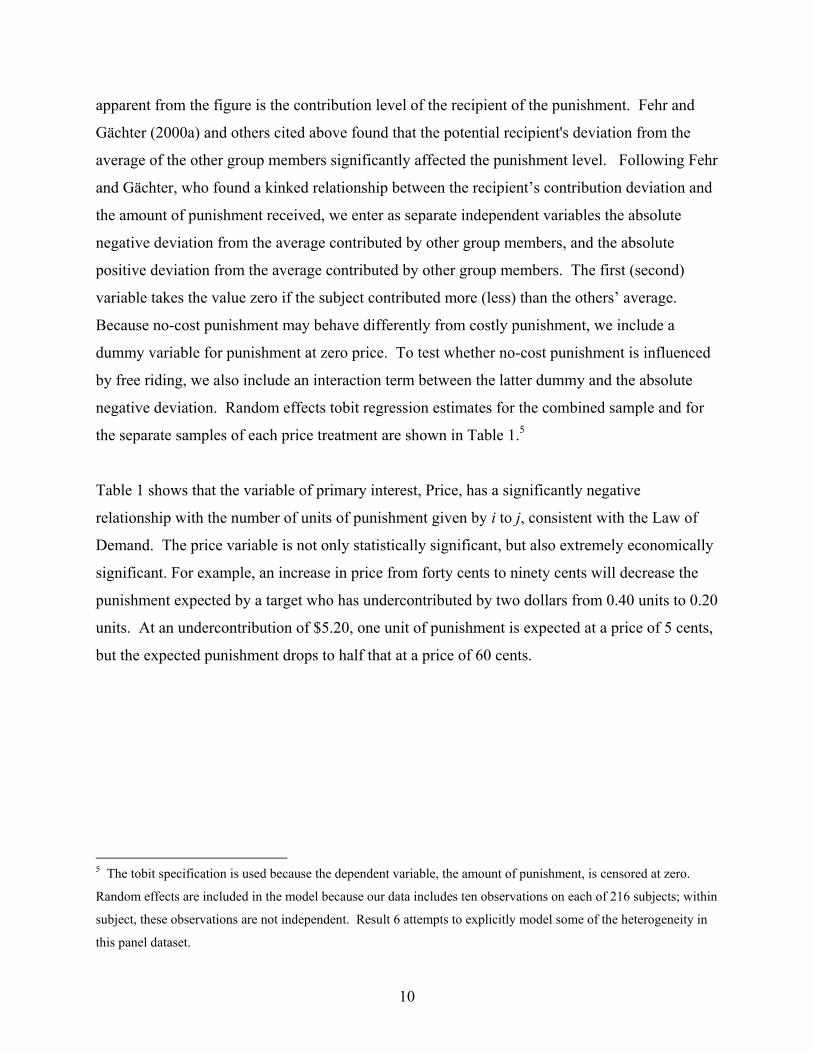
apparent from the figure is the contribution level of the recipient of the punishment. Fehr and
Gächter (2000a) and others cited above found that the potential recipient's deviation from the
average of the other group members significantly affected the punishment level. Following Fehr
and Gächter, who found a kinked relationship between the recipient’s contribution deviation and
the amount of punishment received, we enter as separate independent variables the absolute
negative deviation from the average contributed by other group members, and the absolute
positive deviation from the average contributed by other group members. The first (second)
variable takes the value zero if the subject contributed more (less) than the others’ average.
Because no-cost punishment may behave differently from costly punishment, we include a
dummy variable for punishment at zero price. To test whether no-cost punishment is influenced
by free riding, we also include an interaction term between the latter dummy and the absolute
negative deviation. Random effects tobit regression estimates for the combined sample and for
the separate samples of each price treatment are shown in Table 1.5
Table 1 shows that the variable of primary interest, Price, has a significantly negative
relationship with the number of units of punishment given by i to j, consistent with the Law of
Demand. The price variable is not only statistically significant, but also extremely economically
significant. For example, an increase in price from forty cents to ninety cents will decrease the
punishment expected by a target who has undercontributed by two dollars from 0.40 units to 0.20
units. At an undercontribution of $5.20, one unit of punishment is expected at a price of 5 cents,
but the expected punishment drops to half that at a price of 60 cents.
5 The tobit specification is used because the dependent variable, the amount of punishment, is censored at zero.
Random effects are included in the model because our data includes ten observations on each of 216 subjects; within
subject, these observations are not independent. Result 6 attempts to explicitly model some of the heterogeneity in
this panel dataset.
11
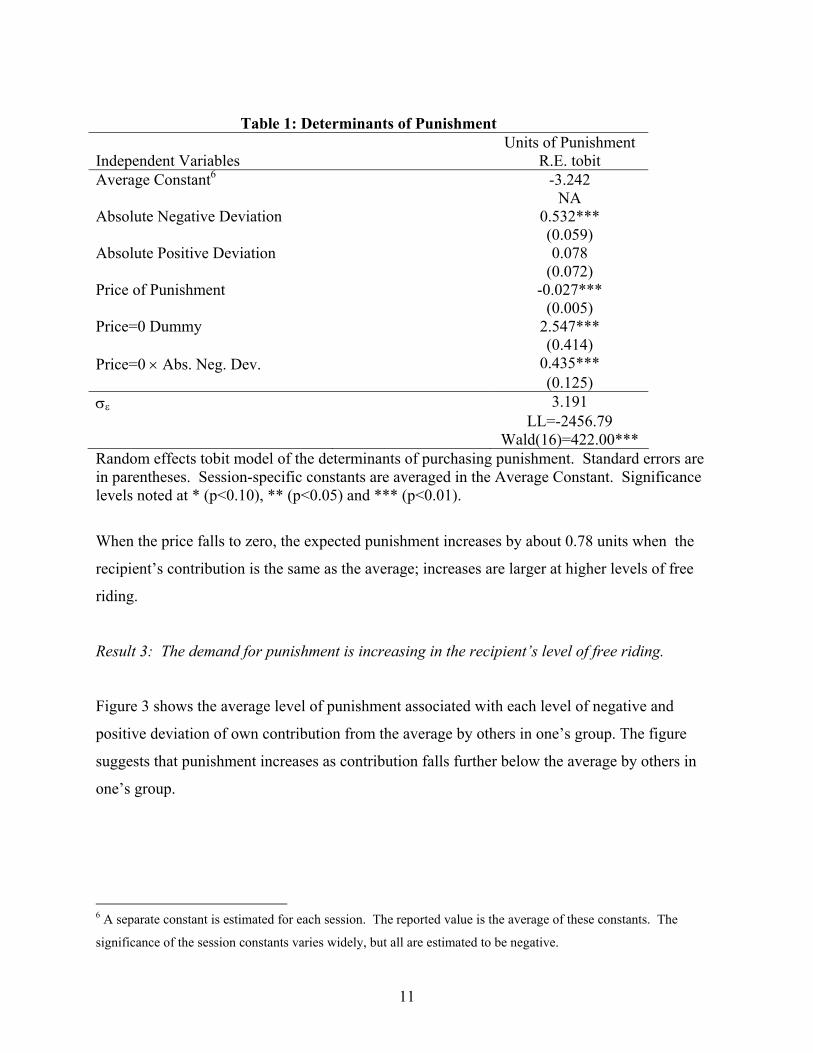
Table 1: Determinants of Punishment
Units of Punishment Independent Variables R.E. tobit Average Constant6 -3.242 NA Absolute Negative Deviation 0.532*** (0.059) Absolute Positive Deviation 0.078 (0.072) Price of Punishment -0.027*** (0.005) Price=0 Dummy 2.547*** (0.414) Price=0 × Abs. Neg. Dev. 0.435*** (0.125) σε 3.191 LL=-2456.79 Wald(16)=422.00*** Random effects tobit model of the determinants of purchasing punishment. Standard errors are in parentheses. Session-specific constants are averaged in the Average Constant. Significance levels noted at * (p<0.10), ** (p<0.05) and *** (p<0.01).
When the price falls to zero, the expected punishment increases by about 0.78 units when the
recipient’s contribution is the same as the average; increases are larger at higher levels of free
riding.
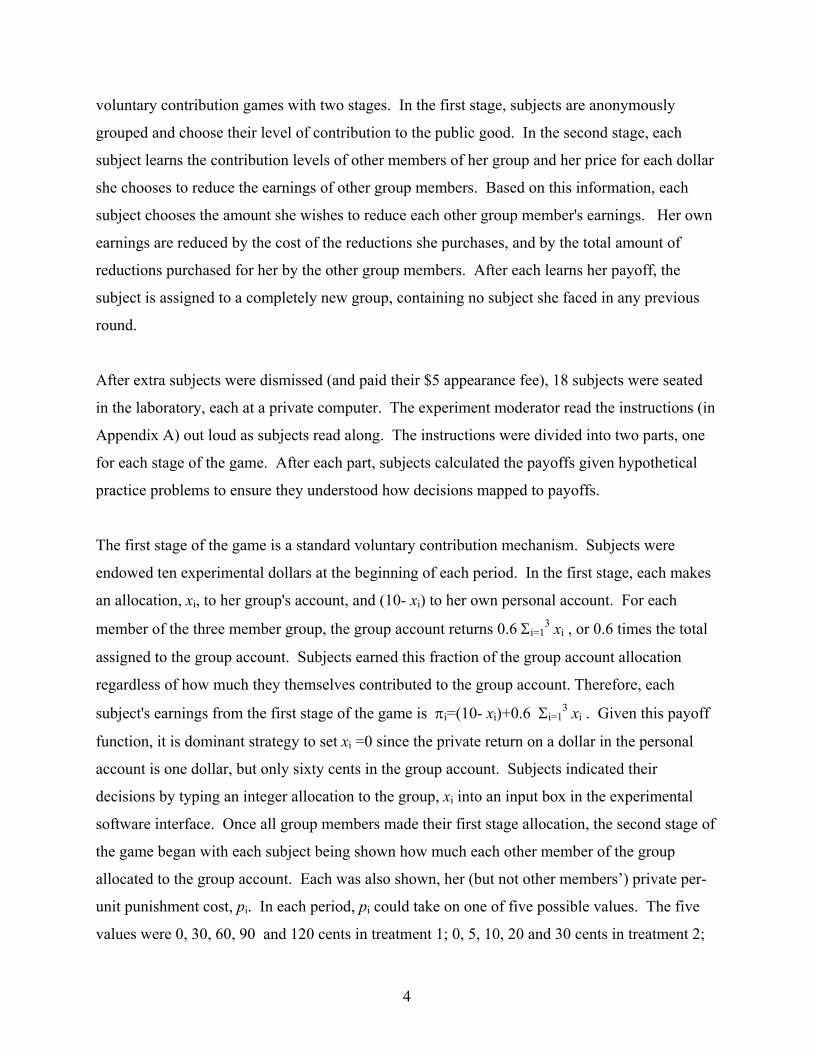
Result 3: The demand for punishment is increasing in the recipient’s level of free riding.
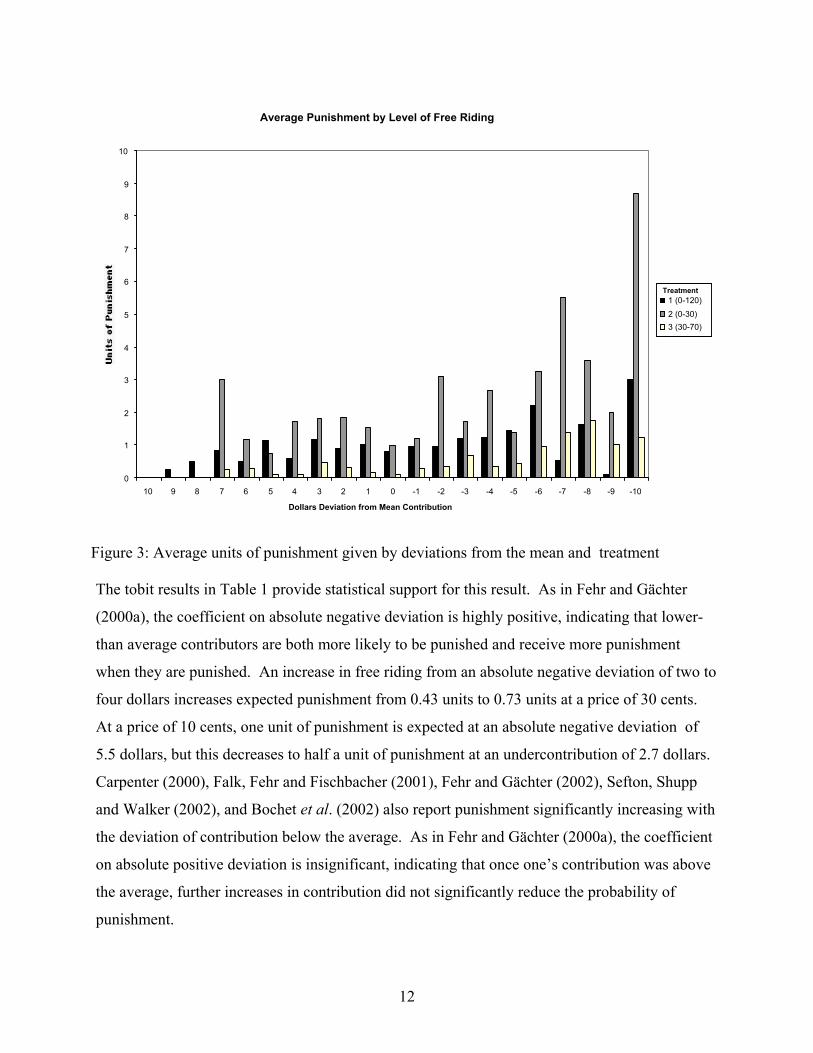
Figure 3 shows the average level of punishment associated with each level of negative and
positive deviation of own contribution from the average by others in one’s group. The figure
suggests that punishment increases as contribution falls further below the average by others in
one’s group.
6 A separate constant is estimated for each session. The reported value is the average of these constants. The
significance of the session constants varies widely, but all are estimated to be negative.
12
Average Punishment by Level of Free Riding
0
1
2
3
4
5
6
7
8
9
10
10 9 8 7 6 5 4 3 2 1 0 -1 -2 -3 -4 -5 -6 -7 -8 -9 -10
Dollars Deviation from Mean Contribution
1 (0-120)2 (0-30)3 (30-70)
Treatment
Figure 3: Average units of punishment given by deviations from the mean and treatment The tobit results in Table 1 provide statistical support for this result. As in Fehr and Gächter
(2000a), the coefficient on absolute negative deviation is highly positive, indicating that lower-
than average contributors are both more likely to be punished and receive more punishment
when they are punished. An increase in free riding from an absolute negative deviation of two to
four dollars increases expected punishment from 0.43 units to 0.73 units at a price of 30 cents.
At a price of 10 cents, one unit of punishment is expected at an absolute negative deviation of
5.5 dollars, but this decreases to half a unit of punishment at an undercontribution of 2.7 dollars.
Carpenter (2000), Falk, Fehr and Fischbacher (2001), Fehr and Gächter (2002), Sefton, Shupp
and Walker (2002), and Bochet et al. (2002) also report punishment significantly increasing with
the deviation of contribution below the average. As in Fehr and Gächter (2000a), the coefficient
on absolute positive deviation is insignificant, indicating that once one’s contribution was above
the average, further increases in contribution did not significantly reduce the probability of
punishment.
13
10
7
4
1
-2
-5-8
0
1
2
3
4
5
6
Price
Mean Deviation
Average Punishment Demanded
Predicted Average Punishment Demanded
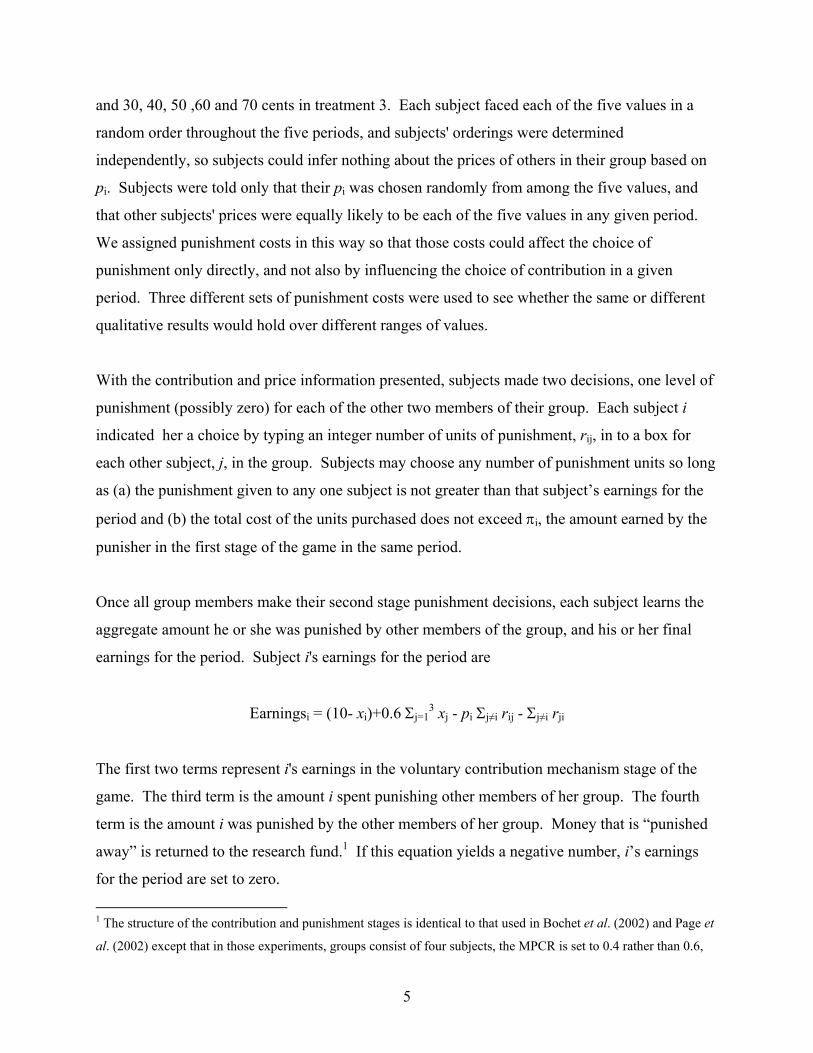
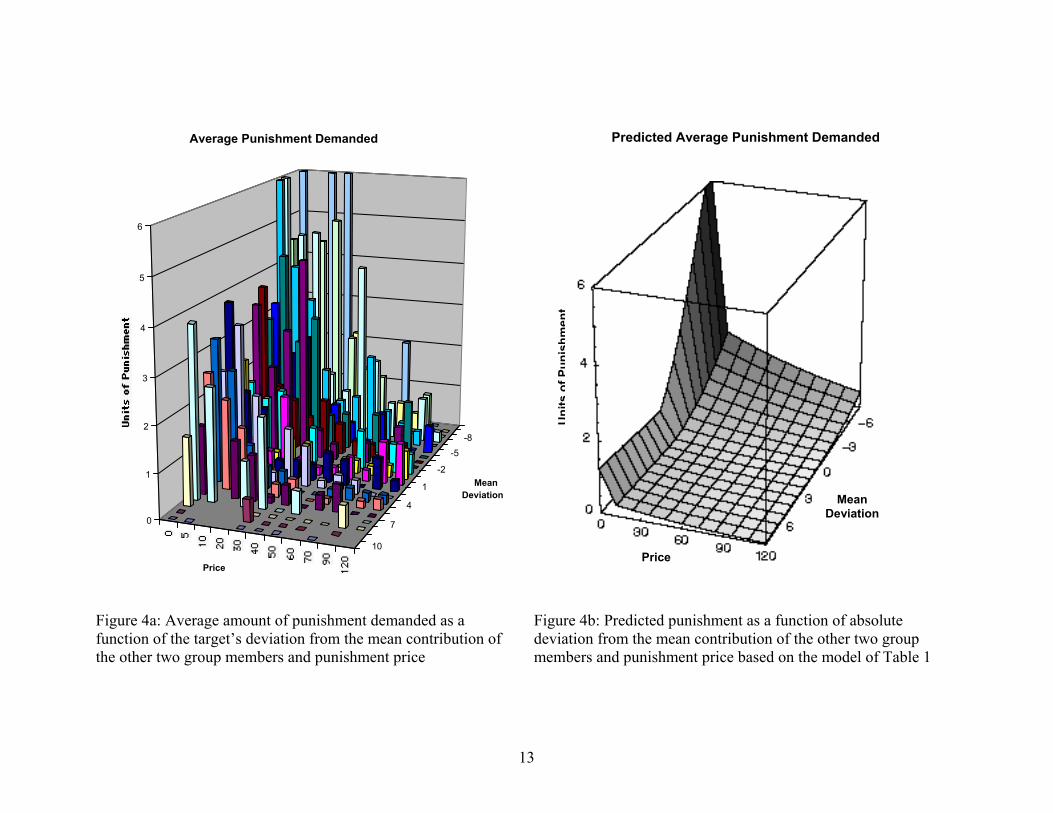
Figure 4a: Average amount of punishment demanded as a function of the target’s deviation from the mean contribution of the other two group members and punishment price
Figure 4b: Predicted punishment as a function of absolute deviation from the mean contribution of the other two group members and punishment price based on the model of Table 1
Uni
tsof
Puni
shm
ent
Price
MeanDeviation
14
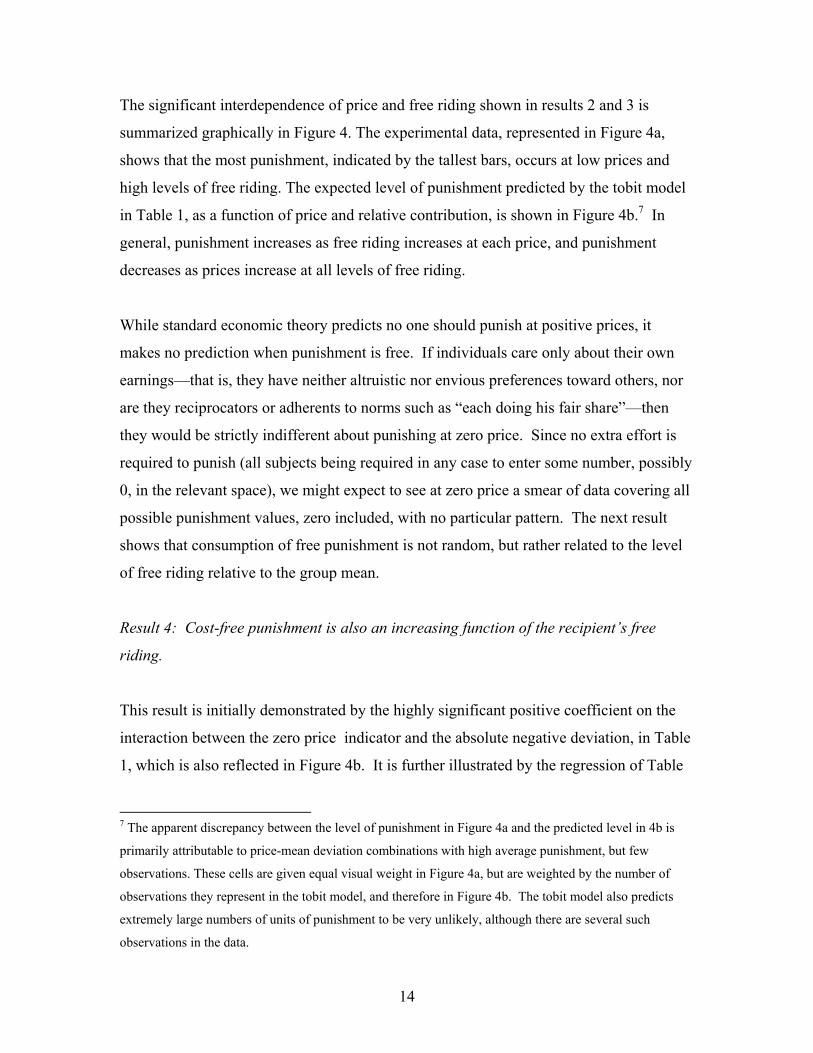
The significant interdependence of price and free riding shown in results 2 and 3 is
summarized graphically in Figure 4. The experimental data, represented in Figure 4a,
shows that the most punishment, indicated by the tallest bars, occurs at low prices and
high levels of free riding. The expected level of punishment predicted by the tobit model
in Table 1, as a function of price and relative contribution, is shown in Figure 4b.7 In
general, punishment increases as free riding increases at each price, and punishment
decreases as prices increase at all levels of free riding.
While standard economic theory predicts no one should punish at positive prices, it
makes no prediction when punishment is free. If individuals care only about their own
earnings—that is, they have neither altruistic nor envious preferences toward others, nor
are they reciprocators or adherents to norms such as “each doing his fair share”—then
they would be strictly indifferent about punishing at zero price. Since no extra effort is
required to punish (all subjects being required in any case to enter some number, possibly
0, in the relevant space), we might expect to see at zero price a smear of data covering all
possible punishment values, zero included, with no particular pattern. The next result
shows that consumption of free punishment is not random, but rather related to the level
of free riding relative to the group mean.
Result 4: Cost-free punishment is also an increasing function of the recipient’s free
riding.
This result is initially demonstrated by the highly significant positive coefficient on the
interaction between the zero price indicator and the absolute negative deviation, in Table
1, which is also reflected in Figure 4b. It is further illustrated by the regression of Table
7 The apparent discrepancy between the level of punishment in Figure 4a and the predicted level in 4b is
primarily attributable to price-mean deviation combinations with high average punishment, but few
observations. These cells are given equal visual weight in Figure 4a, but are weighted by the number of
observations they represent in the tobit model, and therefore in Figure 4b. The tobit model also predicts
extremely large numbers of units of punishment to be very unlikely, although there are several such
observations in the data.
15
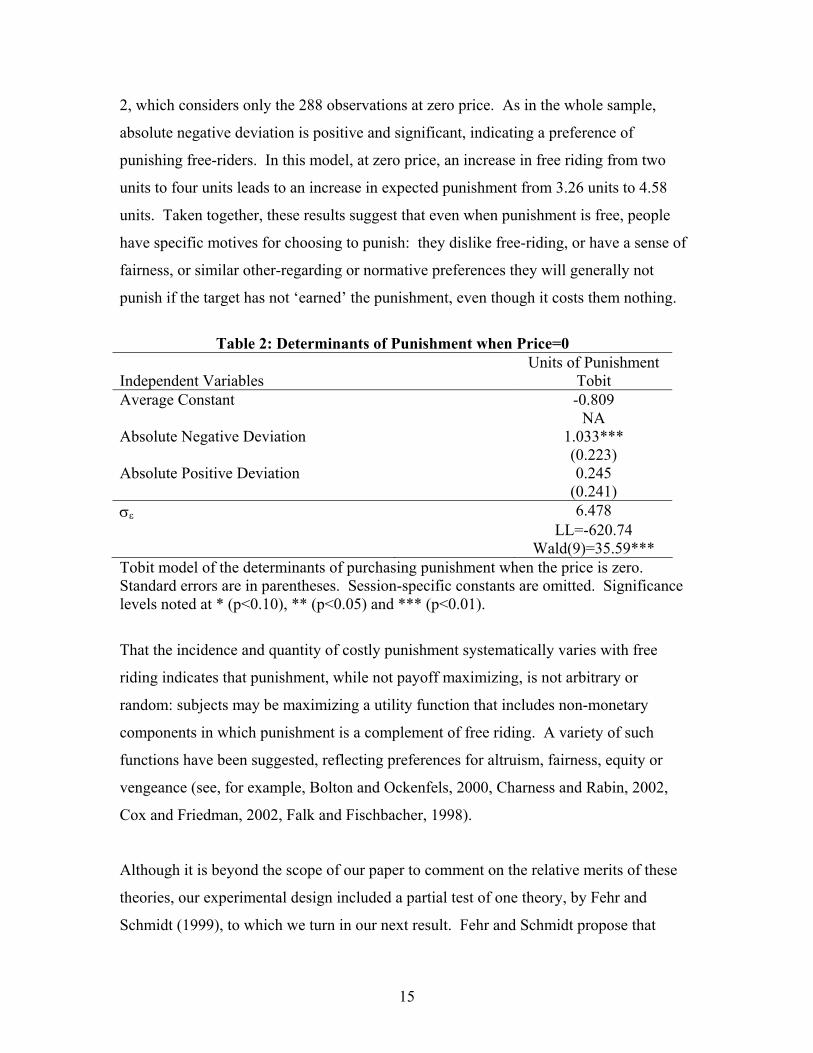
2, which considers only the 288 observations at zero price. As in the whole sample,
absolute negative deviation is positive and significant, indicating a preference of
punishing free-riders. In this model, at zero price, an increase in free riding from two
units to four units leads to an increase in expected punishment from 3.26 units to 4.58
units. Taken together, these results suggest that even when punishment is free, people
have specific motives for choosing to punish: they dislike free-riding, or have a sense of
fairness, or similar other-regarding or normative preferences they will generally not
punish if the target has not ‘earned’ the punishment, even though it costs them nothing.
Table 2: Determinants of Punishment when Price=0
Units of Punishment Independent Variables Tobit Average Constant -0.809 NA Absolute Negative Deviation 1.033*** (0.223) Absolute Positive Deviation 0.245 (0.241) σε 6.478 LL=-620.74
Wald(9)=35.59*** Tobit model of the determinants of purchasing punishment when the price is zero. Standard errors are in parentheses. Session-specific constants are omitted. Significance levels noted at * (p<0.10), ** (p<0.05) and *** (p<0.01).
That the incidence and quantity of costly punishment systematically varies with free
riding indicates that punishment, while not payoff maximizing, is not arbitrary or
random: subjects may be maximizing a utility function that includes non-monetary
components in which punishment is a complement of free riding. A variety of such
functions have been suggested, reflecting preferences for altruism, fairness, equity or
vengeance (see, for example, Bolton and Ockenfels, 2000, Charness and Rabin, 2002,
Cox and Friedman, 2002, Falk and Fischbacher, 1998).
Although it is beyond the scope of our paper to comment on the relative merits of these
theories, our experimental design included a partial test of one theory, by Fehr and
Schmidt (1999), to which we turn in our next result. Fehr and Schmidt propose that
16
agents dislike inequality, especially when it is disadvantageous to them. In the Fehr-
Schmidt theory, inequality-averse high contributors would punish free riders when the
cost to the person punished exceeds that to the punisher, since the free rider earns more
than the high contributor prior to punishment and the punishment reduces this inequality.
The next result shows that this equity-based theory of punishment is inconsistent with
some of our data.
Result 5: A positive amount of punishment is observed at a price greater than $1.00,
most of which is inconsistent with Fehr and Schmidt’s equity-based explanation for
punishment.
In Treatment I, each subject had one period with a price of $1.20 to punish another group
member by subtracting one dollar from his or her earnings. The average amount of
punishment in this condition is 0.381 units of punishment, representing a positive amount
of punishment in 23 of 144 decisions by 14 of 72 subjects. In 17 of these 23 cases, the
person targeted had contributed the same amount as or less than the punisher, so earnings
inequality could only be created or exacerbated by punishment. This suggests that, at
least for a subset of our subjects, equity is not the primary motivating factor in the
punishment decision.8
While the population as a whole is responsive to price and negative deviation of
contribution, post-experiment debriefing questionnaires suggest that there was
considerable heterogeneity in subjects' punishment strategies. Articulated strategies
ranged from people who punished whenever someone contributed below a certain
amount or who punished only when the price was zero to people who provided a
straightforward argument that punishment did not benefit them, and therefore was
irrational. Given this systematic variation, inference based on aggregate data may not
fully capture the effect of price variation on punishment.
8 A weaker form of the same conclusion could be drawn from Falk, Fehr and Fischbacher’s (2001) data,
where they observe a significant amount of punishment when the punishment price equals the recipient’s
reduction in earnings.
17
To investigate subject heterogeneity with regard to punishment, we apply El-Gamal and
Grether's (1995, 1997) estimation-classification algorithm to estimate model parameters
for different groups of subjects. The estimation-classification algorithm assumes the
choices of each person in the sample are described by a function F(θ), where θ is a vector
of unknown model parameters. Heterogeneity is introduced by allowing that the
population contains K segments, or “types” of person, with each type described by one of
K different θs. The θks which describe each type and which subjects are which type are
estimated simultaneously. In estimation, person i’s contribution to the likelihood
function, given Θ=(θ1,…, θK), is the maximum of the joint likelihood of all i’s
observations across the K types.9 Conventional maximization algorithms can be used to
identify the Θ which maximizes the likelihood of the observed data, with care taken to
ensure the global maximum is identified in a likelihood function which often has many
local maxima.
Result 6: Sensitivity to punishment price and free-riding varies considerably within our
sample.
Support comes from Table 3, which reports the two- and three-segment estimation-
classification tobit models (single-segment results are in Table 2).10 Each column of the
table reports the estimated coefficients, the proportion of the sample best described by
9 The log-likelihood function is
lnL(Y;X|Θ,Κ)=Σi argmaxk{Σt Σj lnL(Yijt; Xijt|θk)}
where Y are the observed punishment choices, X the independent variables, and Θ=θ1,…,θK, the parameter
vectors for each of the K types. The log-likelihood function is the sum over all individuals of the best log-
likelihood of the joint probability of their observed choices, levels of punishment for each other group
member j and period t, across the k possible types. 10 Maximization was carried out using Gauss. To maximize the chance we identified the global maximum
among many local maxima, we repeated the maximization from a 1000 starting points randomly drawn
from a large neighborhood around a starting vector based on the single-segment parameters, modified to
reflect patterns which emerged from debriefing questionnaires.
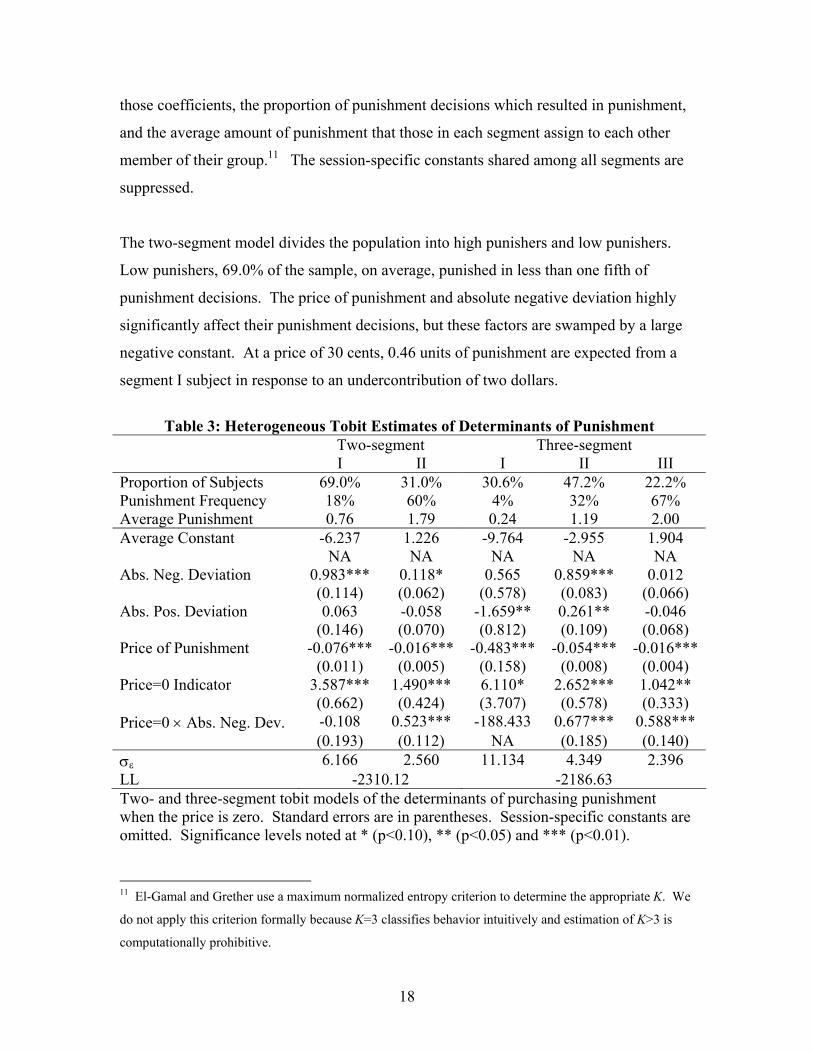
18
those coefficients, the proportion of punishment decisions which resulted in punishment,
and the average amount of punishment that those in each segment assign to each other
member of their group.11 The session-specific constants shared among all segments are
suppressed.
The two-segment model divides the population into high punishers and low punishers.
Low punishers, 69.0% of the sample, on average, punished in less than one fifth of
punishment decisions. The price of punishment and absolute negative deviation highly
significantly affect their punishment decisions, but these factors are swamped by a large
negative constant. At a price of 30 cents, 0.46 units of punishment are expected from a
segment I subject in response to an undercontribution of two dollars.
Table 3: Heterogeneous Tobit Estimates of Determinants of Punishment
Two-segment Three-segment I II I II III Proportion of Subjects 69.0% 31.0% 30.6% 47.2% 22.2% Punishment Frequency 18% 60% 4% 32% 67% Average Punishment 0.76 1.79 0.24 1.19 2.00 Average Constant -6.237 1.226 -9.764 -2.955 1.904 NA NA NA NA NA Abs. Neg. Deviation 0.983*** 0.118* 0.565 0.859*** 0.012 (0.114) (0.062) (0.578) (0.083) (0.066) Abs. Pos. Deviation 0.063 -0.058 -1.659** 0.261** -0.046 (0.146) (0.070) (0.812) (0.109) (0.068) Price of Punishment -0.076*** -0.016*** -0.483*** -0.054*** -0.016*** (0.011) (0.005) (0.158) (0.008) (0.004) Price=0 Indicator 3.587*** 1.490*** 6.110* 2.652*** 1.042** (0.662) (0.424) (3.707) (0.578) (0.333) Price=0 × Abs. Neg. Dev. -0.108 0.523*** -188.433 0.677*** 0.588*** (0.193) (0.112) NA (0.185) (0.140) σε 6.166 2.560 11.134 4.349 2.396 LL -2310.12 -2186.63 Two- and three-segment tobit models of the determinants of purchasing punishment when the price is zero. Standard errors are in parentheses. Session-specific constants are omitted. Significance levels noted at * (p<0.10), ** (p<0.05) and *** (p<0.01).
11 El-Gamal and Grether use a maximum normalized entropy criterion to determine the appropriate K. We
do not apply this criterion formally because K=3 classifies behavior intuitively and estimation of K>3 is
computationally prohibitive.
19
The second segment, 31.0% of the sample, averages two and a half times more
punishment per punishment decision than the low punishers. The high punishers’
significantly positive constant suggests a much greater tendency to punish small
deviations, leading to more frequent punishment. At a price of 30 cents, 1.59 units of
punishment are expected from a segment II subject in response to an undercontribution of
two dollars.
Adding the third segment to the model allows a clearer division between subjects who
need significant provocation to punish and those who simply never punish. In our
debriefing questionnaires, many subjects expressed the view that punishment was
irrational (since it cost but could not benefit) or that punishment was simply wrong. The
three segment model groups these people, 30.6% of the sample, into segment I. The
average punishment level of 0.24 units per punishment decision represents only 26
decisions to punish by 11 of 66 subjects. Six of the 11 only punish at prices of zero or 5
cents, and only three choose to punish in more than one round. All of these observations
occur when the zero price-absolute negative interaction is zero, leading to the enormous
magnitude and undefined standard error on the zero price-absolute negative deviation
interaction.
With non-punishers and near-non-punishers estimated to be in their own segment, the
punishers are divided into two segments. Segment II characterizes 47.2% of subjects
who are responsive both to free riding and to the price of punishing. The negative
constant indicates that this segment forgives contributions somewhat less than the group
mean, though significant free-riders are likely to receive punishment. There is also a
significant although smaller positive coefficient on positive deviation, indicating that
some subjects in this segment punished more those who contributed significantly more
than their group average. In the face of such subjects, the surest way to avoid punishment
would be to contribute the group average while avoiding “standing out” by contributing
substantially more.12
12 Bochet et al. describe the punishment of high contributors as “perverse” because it tends to discourage
contributions, thus working against efficiency. Perverse punishment typically accounts for about 20% of
20
The estimate of segment III shows the remaining 22.2% of subjects to be aggressive and
(from a normative standpoint) somewhat indiscriminate punishers. The significantly
positive constant and insignificant coefficients on the contribution deviation terms
suggest a considerable propensity toward high levels of punishment, unrelated to the
level of free riding. When the price is zero, the level of punishment further increases and,
interestingly, becomes sensitive to the level of free riding in the conventional direction,
consistent with Result 4.
Taken together, these three segments indicate that a significant portion of the sample does
not routinely punish, and almost never does so at positive prices. However, the
remaining 70% of the sample does punish. About two thirds of these subjects are
primarily responsive to free riding at all prices, and the others punish aggressively at all
levels of free riding. Importantly, both punishing groups are responsive to price.
Result 7: Contributions remain higher than is typical with repetition in the VCM without
punishment, although there is a mild declining trend in all treatments. Across treatments,
contributions tend to be higher but earnings lower when the cost of punishment is lower,
reflecting the trade-off between the incentive effect of the threat of punishment, and the
toll on efficiency from punishments carried out.
Figure 1 shows the time path of average contributions in each of the three price
treatments. All treatments show a statistically significant although economically mild
tendency toward lower contributions in later periods. A random effects regression
all instances of punishment in the partner group treatments of Fehr and Gächter (2000a), and Page et al.
(2003), but is less in Fehr and Gächter’s’s stranger and perfect stranger treatments, evidently because
“blind revenge” motive underlies it in partner groups and is absent when group composition changes.
Despite the perfect stranger character of the present experiment, punishment of a group’s highest
contributor (or of a subject tied for that position) nevertheless accounts for 23.1% overall of all instances of
punishment, and 22.7% of the instances of punishment at positive prices, in our own data. The higher
incidence than in the Fehr-Gächter stranger treatment may be partly attributed to the fact that groups have
only three members in the present experiment versus four in theirs and the others cited.
21
indicates all time slopes are significantly different from zero.13 This is consistent with
patterns observed in the VCM with punishment in Page et al. (2002), but different from
that observed by Fehr and Gächter (2000a,2002), who find contributions to rise with
repetition.
Turning to the differences across treatments, recall that subjects in a given treatment
knew only the distribution of punishment costs, not the particular costs faced by other
group members in given periods, so price realizations could not affect current
contributions. With the set of possible costs varying among the three treatments,
however, the price set could influence the average contribution in a treatment as a whole.
Our results suggest that anticipated and actual punishments had small but in some cases
statistically significant effects on contributions and earnings. These differences are
interesting, because they provide insight into the dilemma that while the presence of a
punishment option significantly deters free riding, efficiency may either be increased or
reduced, depending on the degree to which the punishment threat must actually be
executed and the amount of punishment perversely aimed at high contributors,14 which
never serves efficiency.
Table 4 summarizes the components of contributions and earnings in each treatment. The
highest average contributions were in the low punishment price treatment, and the lowest
were in the high variance punishment price treatment, with the mid-price punishment
treatment in the middle. Contributions in the VCM stage of the game are significantly
higher in the 0-30 treatment than in the other two treatments, which are not statistically
distinct from each other. Pairwise Wilcoxon signed-rank tests comparing the level of
contributions in each treatment show the 0-30 treatment has weakly higher contributions
than either the 0-120 or 30-70 treatment (with p=0.048 and p=0.047 respectively). The
13 To confirm statistical significance, we estimated the model Ci=Σj=1
3 {aj Tji +bj Tji Periodi}, where Ci is i’s
contribution, Tj is an indicator variable which equals one if observation i is from treatment j and zero
otherwise, Periodi is the period number from which observation i was observed, and aj and bj are model
parameters. A random effects regression indicates all ajs and bjs are significantly different from zero. 14 See footnote 12.
22
distribution of contributions in the 0-120 treatment is statistically indistinct from that in
the 30-70 treatment, with Wilcoxon test p=0.98.
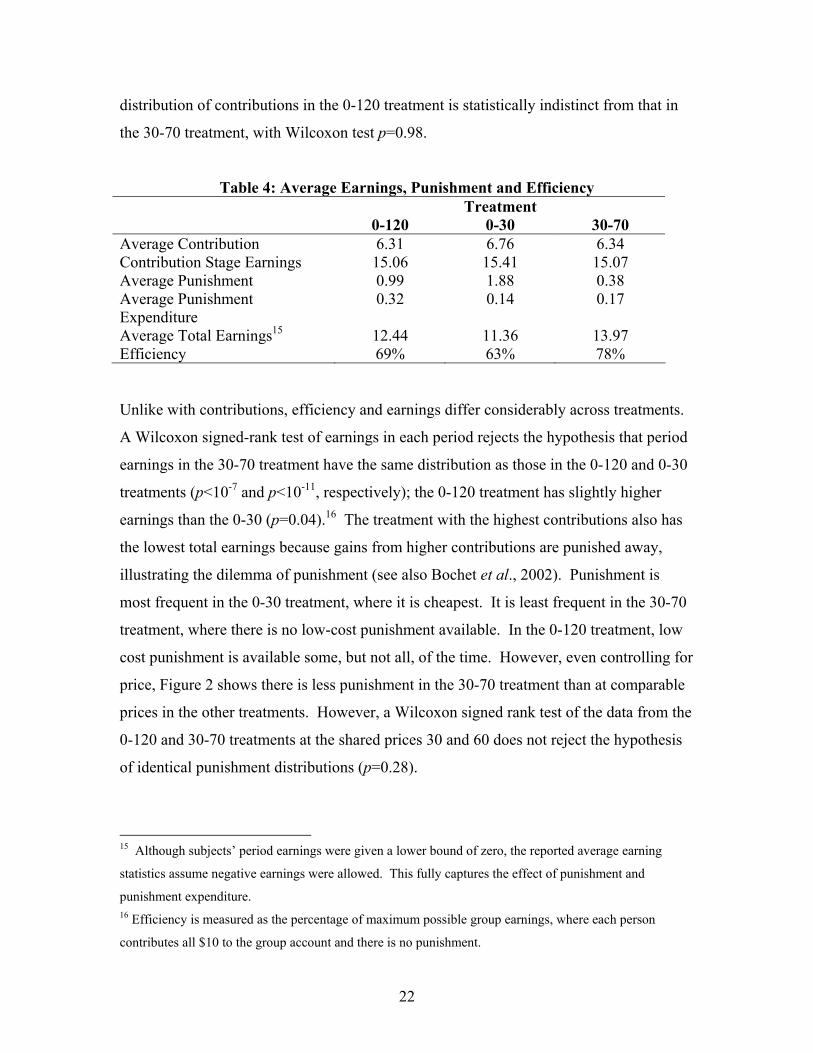
Table 4: Average Earnings, Punishment and Efficiency Treatment 0-120 0-30 30-70 Average Contribution 6.31 6.76 6.34 Contribution Stage Earnings 15.06 15.41 15.07 Average Punishment 0.99 1.88 0.38 Average Punishment Expenditure
0.32 0.14 0.17
Average Total Earnings15 12.44 11.36 13.97 Efficiency 69% 63% 78% Unlike with contributions, efficiency and earnings differ considerably across treatments.
A Wilcoxon signed-rank test of earnings in each period rejects the hypothesis that period
earnings in the 30-70 treatment have the same distribution as those in the 0-120 and 0-30
treatments (p<10-7 and p<10-11, respectively); the 0-120 treatment has slightly higher
earnings than the 0-30 (p=0.04).16 The treatment with the highest contributions also has
the lowest total earnings because gains from higher contributions are punished away,
illustrating the dilemma of punishment (see also Bochet et al., 2002). Punishment is
most frequent in the 0-30 treatment, where it is cheapest. It is least frequent in the 30-70
treatment, where there is no low-cost punishment available. In the 0-120 treatment, low
cost punishment is available some, but not all, of the time. However, even controlling for
price, Figure 2 shows there is less punishment in the 30-70 treatment than at comparable
prices in the other treatments. However, a Wilcoxon signed rank test of the data from the
0-120 and 30-70 treatments at the shared prices 30 and 60 does not reject the hypothesis
of identical punishment distributions (p=0.28).
15 Although subjects’ period earnings were given a lower bound of zero, the reported average earning
statistics assume negative earnings were allowed. This fully captures the effect of punishment and
punishment expenditure. 16 Efficiency is measured as the percentage of maximum possible group earnings, where each person
contributes all $10 to the group account and there is no punishment.
23
4. Conclusion
This experiment gave subjects in small groups the opportunity to reduce one another’s
earnings after learning of their contributions to a public good. The game was played five
times, each time in a completely new group and with a different price encountered in a
random and not pre-announced order. Consistent with other experiments, subjects
engaged in costly punishment even though no strategic gain was possible. Also
consistent with those experiments, contributions to the public good remained at relatively
high levels despite repetition. The amount of punishment was found to be significantly
negatively related to its cost to the punisher, and significantly positively related to the
amount of free riding (absolute negative deviation from others’ average contribution) by
the person targeted. Punishment was mainly used to punish free riding even when it cost
nothing to the punisher. Some punishment was also purchased even when it cost the
punisher more than the person punished, in violation of Fehr and Schmidt’s (1999)
inequality-aversion explanation for punishment.17
Concurrent with our research, similar research was undertaken by Carpenter (2003).
Carpenter also finds that the demand for punishment is decreasing in its price. His
experimental design differs from ours in various ways, including (a) use of a stranger, but
not a perfect stranger, protocol, (b) all subjects in a treatment faced the same set of prices
in the same pre-announced order, which could thus affect contribution levels, (c) prices-
penalty ratios which range from 0.25 to four, with much less emphasis on ratios less than
one and (d) no zero price. Carpenter’s analysis complements ours by isolating income
and wealth effects at the set of higher prices designed to generate income effects.18
17 Fehr and Fischbacher (forthcoming) recognize that the inequality-aversion theory is only an imperfect
approximation, but may be good enough for many purposes and has the advantage of tractability. Our
discovery of an empirical exception to the theory should not be seen as ruling out its use in some
circumstances in such a spirit. 18 The coefficients on same-period and cumulative earnings variables in the tobit model of Table 2 are not
significant, indicating we have no such income effect. This is likely because punishment is much cheaper,
relative to earnings and penalties imposed, in our experiment than in Carpenter’s, reflecting the different
purposes of the experimental designs.
24
Apart from reconfirming that subjects will punish free riders at cost to themselves
without strategic gain, and that the anticipation and experience of such punishment can
help to sustain contributions to a public good, our experiment sheds light on the nature of
the preferences that underlie such punishment. Most importantly, our results suggest that
subjects obtain definite amounts of satisfaction from punishment, similar to that from
other goods, and thus amenable to rational comparison with cost to reach decisions on the
number of units to purchase. In the standard terminology of economics, the desire to
punish free riders is a taste, not rational in itself, but an unexceptional input to the
rational decision calculus. While we have not established definitively why punishment
brings utility, we confirmed that it is directed mainly at free riders, and found evidence
that the main goal of punishment is not to redress inequalities per se. In addition, like
tastes for other goods, the taste for punishment varies considerably in the population.
25
References
Andreoni, James, 1988, “Why Free Ride? Strategies and Learning in Public Goods Experiments,” J. of Public Economics 37: 291-304. Bochet, Olivier, Talbot Page and Louis Putterman, 2002, “Communication and Punishment in Voluntary Contribution Experiments,” Working Paper No. 2002-29, Department of Economics, Brown University, available at http://www.econ.brown.edu/2002/. Bolton, Gary and Axel Ockenfels, 2000, “ERC: A Theory of Equity, Reciprocity and Competition,” American Economic Reivew 90: 166-93. Carpenter, Jeffrey, 2000, “Mutual Monitoring in Teams: Theory and Experimental Evidence,” unpublished paper, Middlebury College. Carpenter, Jeffrey, 2003, “The Demand for Punishment,” unpublished paper, Department of Economics, Middlebury College, January. Charness, Gary and Matthew Rabin, 2002, “Understanding Social Preferences with Simple Tets,” Quarterly Journal of Economics 117 (3): 817-69. Cox, James C. and Daniel Friedman, 2002, “A Tractable Model of Reciprocity and Fairness,” unpublished paper, University of Arizona and University of California Santa Cruz. Davis, Douglas D. and Charles A. Holt, 1993, Experimental Economics. Princeton: Princeton University Press. Falk, Armin, Ernst Fehr, and Urs Fischbacher, 2001, “Driving Forces of Informal Sanctions,” Working Paper No. 59, Institute for Empirical Research in Economics, University of Zurich, September. Falk, Armin and Urs Fischbacher, 1998, “A Theory of Reciprocity,” mimeo, University of Zurich. Fehr, Ernst and Simon Gächter, 2000a, “Cooperation and Punishment,” American Economic Review 90: 980-94. Fehr, Ernst and Simon Gächter, 2000b, “Fairness and Retaliation: The Economics of Reciprocity,” Journal of Economic Perspectives 14 (3): 159-81. Fehr, Ernst and Simon Gächter, 2002, “Altruistic Punishment in Humans,” Nature 415: 137-40.
26
Fehr, Ernst and Klaus Schmidt, 1999, “A Theory of Fairness, Competition, and Cooperation,” Quarterly Journal of Economics 114: 817-68. Ledyard, John, 1995, “Public Goods: A Survey of Experimental Research,” pp. 111-94 in John Kagel and Alvin Roth, eds., Handbook of Experimental Economics. Princeton: Princeton University Press. Masclet, David, Charles Noussair, Steven Tucker and Marie-Claire Villeval, 2003, “Monetary and Non-Monetary Punishment in the Voluntary Contributions Mechanism,” American Economic Review 93 (1): 366-80. Page, Talbot, Louis Putterman and Bulent Unel, 2002, “Voluntary Association in Public Goods Experiments: Reciprocity, Mimicry, and Efficiency,” Working Paper No. 2002-19, Department of Economics, Brown University, available at http://www.econ.brown.edu/2002/. Sefton, Martin, Robert Shupp and James Walker, 2002, “The Effect of Rewards and Sanctions in Provision of Public Goods,” Working Paper, University of Nottingham and Indiana University.
27
Appendix A: Experimental Instructions The instructions were read aloud by an experimenter as the students followed along on their computer screens. This is an experiment, funded by a research foundation, to study decision making. You will be earning money in “experimental dollars” during the experiment. At the end of the experiment you will be paid in cash in real dollars. Each experimental dollar is worth a real $0.25 (twenty-five cents). The amount you earn will depend on your and others’ decisions. The maximum possible earning is $32.50 (real dollars) and the minimum possible is $5. You are likely to earn an amount in between. Please make sure you understand the decision process.
Groups
There are eighteen participants in this experiment, and the experiment consists of five decision periods. During each decision period, you will be placed in a group with two other participants, hence a group of three. After every period, you will be put in a completely new group. You will not know the identities of the other two members of your group in any given decision period, nor will you be told their identities after the experiment is over.
Earnings
Each of the five periods in the experiment is structured as follows: At the beginning of the period each member of your group will receive $10 (experimental dollars). Each of you must decide how to divide this amount between a group account and a personal account. The money you assign to your personal account goes directly into your earnings. An amount equal to 0.6 times the group’s total assignment to the group account goes into your earnings.
Earnings = (amount in personal account) + (0.6)(total in group account) Every group member earns 0.6 times the total in the group account, regardless of how much they personally put into that account. The next four screens are designed to help you test your understanding of the experiment so far. Corresponding to each screen, there is a sheet of paper on your desk labeled
28
Practice 1, Practice 2, etc. We will fill in the first paper worksheet together, then the first screen. Please note that these are practice exercises only, and do not affect your actual earnings in the experiment. At this point, an experimenter walked subjects through computing their voluntary contribution game payoffs when all three members of the group contribute $10 to the group account. The exercise is first completed on paper, and then using the experimental software. Following that, subjects computed, on their own using first paper and then the experimental software, their payoffs for the case where every member assigns $0 to the group account, and for the case where the subject assigns $5 to the group account, a second member assigns $5 to the group account, and a third member assigns $10 to the group account. Once these exercises were reviewed by an experimenter, the instructions resumed. Consider what would happen in practice 3 if you increase your assignment to the group account by $1. Your personal account would go down by $1, reducing your earnings by $1. Your group account would go up by $1, increasing your earnings by $0.60, for a net reduction of $0.40 But each of the other people in your group would increase their earnings by $0.60, for a total increase of $1.20 for the others in your group.
Reductions
There is another decision that affects your earnings. Once you learn the others’ assignments to the group account, you have a chance to reduce others’ earnings, and others have a chance to reduce your earnings. Suppose, in the last example, that you decide to reduce B’s earnings by $3, and C’s earnings by $5. The total amount of reductions you make on others’ earnings is therefore $8. In most periods, it costs something to reduce another group member’s earnings. The cost will vary randomly from one period to another during the experiment. There are five possible costs per dollar of reductions: [0, 5 cents, 10 cents, 20 cents, and 30 cents; varies with treatment]. Each group member is equally likely to be faced with any of these five costs in a given period. Each period, you will be told your own cost for imposing reductions that period, but you will not know the reduction costs facing the other two members of your group, which are likely to be different. As an example, suppose that in this period it costs you 30 cents for each dollar by which you reduce others’ earnings. Then in this example, it costs you (0.30)($8) = $2.40 to impose the total of $8 of reductions on B and C.
29
Just as you can reduce others’ earnings, others can reduce yours. Suppose B reduces your earnings by $1 and C reduces your earnings by $3. The total reduction of your earnings by others is then ($1 + $3) = $4. You will learn that your earnings have been reduced by a total of $4 but you will not learn who has reduced your earnings by what amount, how many group members have participated in reducing your earnings, or what it cost them to make these reductions. Similarly none of the others will learn whether you as an individual have reduced their earnings, by how much, or at what cost, only the total reductions. Practice sheet 4 takes you through an example of the reduction process. Let’s fill out this sheet together, and then enter the information in the corresponding screen. The experimenter then led subjects through computing their payoffs when they had chosen to punish others, and others had chosen to punish them. The exercise was carried out first on paper, then using the experimental software.
Your Net Earnings
Your net earnings for a period will be: Amount in personal account + (0.6)(Total in group account) – (Your cost of reducing others’ earnings)*(Total of your reductions of others) - Total of reductions of your earnings made by others In this formula, your cost of reducing another person’s earnings is the one that is displayed on your screen for that period. If your earnings in a given period are ever negative, they will be reset to zero. Also, the maximum that you can spend on reductions in a given period is the amount of earnings you have for that period before the reduction process begins. Note that each period is independent of the others in that you begin each one with $10 to allocate, and you can earn as little as zero and as much as $22 (experimental dollars) in that period, depending on your decisions and those of the others in your group. Remember that you will be told what your reduction cost is at the beginning of each period, but you will not learn what the reduction costs that face the others in your group are. (That is, knowing your own cost tells your nothing about their costs, since for each of them, any one of the five possible costs is equally likely in any given period). At the end of the experiment, the net earnings for the five periods will be totaled and converted from experimental dollars to real dollars. Then $5 will be added for your participation.
30
Conclusion
It is important that you understand the procedures and formulas that will be used in the experiment. Once the experiment begins, there will be no further discussion, and no communication of any kind among the participants is permitted, apart from the transmission of the decisions by computer. So please review the experiment in your mind now and raise your hand if you have any questions. Once all questions have been answered, the experiment will begin.