Embed Size (px)
Citation preview

PRIMCED Discussion Paper Series, No. 31
Do Natural Disasters Affect the Poor
Disproportionately?
The Case of Typhoon Milenyo in the Rural Philippines
Yoko Sakai, Jonna P. Estudillo, Nobuhiko Fuwa, Yuki Higuchi,
and Yasuyuki Sawada
November 2012
Research Project PRIMCED Institute of Economic Research
Hitotsubashi University 2-1 Naka, Kunitatchi Tokyo, 186-8601 Japan
http://www.ier.hit-u.ac.jp/primced/e-index.html

1
Do Natural Disasters Affect the Poor Disproportionately?
The Case of Typhoon Milenyo in the Rural Philippines
by
Yoko Sakaia
Jonna P. Estudilloa Nobuhiko Fuwab
Yuki Higuchia Yasuyuki Sawadac
November 2012
Abstract
This paper illustrates the sharp contrast in welfare impacts between the rich and the poor caused by
typhoon Milenyo in a Philippine village. Fish price dropped sharply after a large volume of cultured
fish was set loose due to the damage caused to fish pens near the village, leading to positive net
welfare gains among the wealthy. Among the poor, however, the negative effects of food (other than
fish) price increase outweighed the positive benefit of the fish price decrease, and the poor
non-agricultural households (who receive their income by cash rather than by rice) were the most
severely hit.
aNational Graduate Institute for Policy Studies; bWaseda University; cUniversity of Tokyo
Acknowledgements
The authors would like to thank Joel Reaño, Teodora Malabanan, Ester Marciano, Vivencio Marciano,
Mena Aguilar, Sylvia Sardido, Perla Cristobal, Freia Sardido, Florie Suguitan, and the staff of the
Social Sciences Division of the International Rice Research Institute (IRRI) for the survey
implementation and useful suggestions. The authors would also like to thank Yujiro Hayami, Hidehiko
Ichimura, Keijiro Otsuka, and Kei Kajisa for their valuable comments and suggestions. The usual
disclaimers apply.

2
1. INTRODUCTION
Recently, a number of devastating natural disasters have hit both developed and developing
countries. Hundreds of thousands of lives were lost in the Indian Ocean tsunami, Hurricane Katrina,
and the earthquakes in central Chile, Haiti, Sichuan province of China, and northern Pakistan. We see
vividly the 2011 devastating earthquake and tsunami in Japan that killed tens of thousands of people
and resulted in damages of around 200 to 300 billion USD dollars (Cabinet Office, 2011). In 2011, the
floods in Thailand involved relatively few human calamities but caused US$45.7 billion in damages
mainly in the manufacturing sector, as seven major industrial estates were inundated by floods (World
Bank, 2011). Accordingly, disasters can have serious negative effects not only on lives, but also on the
survivors' livelihoods in the aftermath (Barro, 2009).
To identify effective policies to facilitate livelihood recovery of the victims of a disaster, it is
imperative to clarify whether the disaster affects the poor disproportionately. Yet, there exist few
rigorous studies on this issue. One notable exception known to us is the study by Friedman and
Levinsohn (2002) which develops a methodology to measure the welfare effects of price changes and
which analyzes the case of the Indonesian economic crisis in 1997. The study found that poor urban
households were the most fragile and suffered damage caused by price shock. While recent work has
begun to investigate the welfare impacts of price changes [Porto (2008 and 2010); Wood, Nelson and
Nogueira (2011); and Ferreira et. al (2011)], to the best of our knowledge, no study has examined the
welfare impacts of price changes caused by a natural disaster in a rural setting. This paper is the first
attempt in the literature to fill this gap. We use a unique data set collected from a village in the
Philippines, which was hit by a strong typhoon in 2006, to quantify heterogeneous welfare impacts of
the typhoon. Our focus is on the overall welfare impact of the typhoon, which reflects people’s
responses to the shocks caused by the typhoon, as well as agricultural and other price changes that
emerged through market and non-market adjustment mechanisms. Indeed, the Philippines suffer from
tropical depression nearly every year. The country experiences about 20 tropical storms usually
occurring during the monsoon season (June to December). While there are empirical studies on
household behavior toward risks (Fafchamps, 2003; Dercon, 2005), changes in household behavior

3
caused by disasters have not been well understood. Therefore, our research also contributes to reveal
household’s coping mechanisms with disasters especially in developing countries that are frequently
affected by natural disasters.
In our analysis, we first divide households into two groups—agricultural and
non-agricultural households—in order to capture the heterogeneous impacts of the shocks caused by
the typhoon, which were mainly crop damages. To preview our empirical results, we find that the
short-term price changes due to the typhoon led to sharply contrasting welfare consequences between
the poorer and the wealthier households. For the relatively wealthier households, the positive welfare
effects outweighed the negative effects of price increase in other food items, leading to a net positive
short-term impact. In contrast, for the poorer households, especially for poor non-agricultural laborer
households, the net welfare impact was negative.
The rest of the paper is organized as follows. In Section 2, we select some related literatures
and give a brief review. Section 3 presents an analytical framework for our empirical analysis, which
is followed by a description of the typhoon Milenyo and our data in Section 4. In Section 5, we exhibit
our empirical results, and Section 6 summarizes the concluding remarks.
2. A BRIEF REVIEW OF THE RELATED LITEARUTES
The research on the impact of food price changes on household welfare has been developed
for a long time. Deaton (1988) develops a technique to estimate demand system by using unit value of
actual food prices in Cote d’Ivoire, and Deaton (1989) analyzes the effects of rice prices on
distribution of household welfare in Thailand by non-parametric analysis. This non-parametric
approach is based on first-order approximation in consumption and production. To assess the welfare
impacts, he considers how household’s expenditure on each commodity changes directly by price
changes of goods across geographical areas and income distributions.
Friedman and Levinsohn (2002) examine how price changes affected household’s welfare
during the Asian economic crisis in Indonesia. They basically follow Deaton (1980, 1990, and 1997)
and include substitution effects. They capture total welfare changes due to both direct and indirect

4
impacts. Households change their consumption by substituting away from expensive goods to cheaper
ones. They estimate own and cross price elasticities that substitution effects depend on. They use the
data from Indonesian SUSENAS for 21 aggregate food goods. From the results, damages on
household welfare decrease with substitution effects than without these effects in every household.
They also show that urban poor households get more damages from price changes of foods. It is
related to their results which say welfare loss with self consumption is lower than without self
consumption.
In Latin America, there are studies that analyze the relationships between household welfare
and price changes of foods. Robles and Torero (2010) investigate the effects of food price changes on
consumption across different types of households in Latin America; Guatemala, Honduras, Nicaragua,
and Peru. In Latin America, both demand and supply had been driven by the 2007-08 food price crisis.
The Price of commodities, not only of foods but also of energy, increased with negative welfare
effects on households. Robles and Torero (2010) analyzed the effects in both urban and rural areas,
and find that the negative impacts were larger in urban areas than rural in every countries. This result
is consistent with Friedman and Levinsohn (2002). In rural areas, most of the households are engaged
in agricultural works and they would have benefited from higher food prices. They also find the food
price shock increases poverty rates. Their results show a 2 percent rise in poverty for a 10 percent
increase in food prices.
Porto (2010) studies the impact of price changes through three types of adjustment. In the
first step, the households change their consumption behaviors adjusting production and consumption
when price of goods increase. The next possible step is intra-household spillovers. The Changes in
food prices affect other activities of households. He assumes that agricultural income increases with
higher food prices. In that case, the agricultural households may be able to invest in more
technological instruments. The third step is inter-household spillovers such as impacts on local labor
markets. Porto uses a dataset from Mexico and estimates how price changes impact on consumption,
production, and labor market. He finds that agricultural households benefit from higher food prices
after the shock, because they tend to sell their own production which they used to consume before the
shock.

5
Ferreira et. al (2011) examine household welfare loss due to rising international food prices
in 2007-2008 in a similar manner as in Friedman and Levinsohn (2002) and Robles and Torero (2010)
by using data from Brazil. They estimate compensating variation and find that negative impact on
consumption was large. On the other hand, agricultural households had positive income effects in rural
areas. Brazil is a net exporter of food, so households gain from increasing food prices. However,
positive income effects are found only for the agricultural households. In contrast, the urban poor
households are found to suffer from serious welfare losses.
In this paper, we contribute to these literatures in at least two ways. First, we study the
impacts of price changes on household welfare in the context of a natural disaster. There is no paper to
adopt these methodologies for estimating damages from natural disasters. As we see in section 4, we
find that consumption reallocation was one of the main coping strategies in our survey village. In the
village, households got shocks not only on houses or crops but also from changes in food prices. We
need to understand how households are affected by a shock from many aspects in order to set up an
effective support system for the households affected by the shock. We adopt a methodology to
estimate household welfare and to capture direct and indirect effects on households. Second, we use
unique data on consumer prices and on the volume of consumptions in a Philippine village. The data
allow us to observe changes in the prices of 11 food categories between one week before and one
week after Milenyo. The data reveal immediate damages suffered by the households. Our data also
include detailed information on the coping strategies and the damages suffered for each household.
Based on this dataset, we focus on the contrast between the poor and the wealthy households in the
welfare consequences caused by the natural disaster.
3. DIRECT AND INDIRECT WELFARE IMPACTS: AN ANALYTICAL FRAMEWORK
We follow Friedman and Levinsohn (2002) to construct a framework to capture the welfare
impacts of price changes caused by the typhoon. The starting point for our analysis is to estimate the
resulting change in consumer surplus. We denote by 𝐸ℎ(u, P) the standard minimum expenditure

6
function for household h to satisfy a certain utility level, u, given a price vector, P. Taking a first-order
Taylor approximation to the logged expenditure function around the prices before the typhoon, P0, we
get the compensating variation for household h, CVh, which measures the amount of expenditure
needed to sustain the initial level of utility given price change:
(1) 𝐶𝑉ℎ ≈ ∑ 𝑤𝑖ℎ∆ln 𝑝𝑖ℎ𝑛𝑖=1 ,
where 𝐶𝑉ℎ≡∆ ln𝐸ℎ ; Δ is a first-difference operator; 𝑤𝑖ℎ denotes the budget share of the household h
to good i before the crisis; and 𝑝𝑖ℎ is the price of good i, that is, an element of the price vector, P.
Note that we employ Shephard’s lemma to derive equation (1).
Equation (1) quantifies the impact of the typhoon under an assumption of invariable
consumption demand. The compensating variation value based on equation (1) shows direct welfare
impacts arising from price changes. We may interpret this value as direct welfare impacts arising from
the typhoon through market and non-market mechanisms. Yet, facing price changes, households
naturally reallocate consumption. To capture such an ex post risk coping behavior of households, we
incorporate the substitution behavior of households toward relatively less costly products. More
specifically, we follow Friedman and Levinsohn (2002) to employ a second-order Taylor expansion of
the logged expenditure function:
(2) 𝐶𝑉ℎ ≈ ∑ 𝑤𝑖ℎ∆lnp𝑖ℎ + 12
𝑛𝑖=1 ∑ ∑ 𝑤𝑖ℎ𝑛
𝑗=1𝑛𝑖=1 𝜃𝑖𝑗∆lnp𝑖ℎ∆lnp𝑗ℎ.
where 𝜃𝑖𝑗 is the price elasticity of good i. The second term of equation (2) shows substitution effects
due to the household’s risk coping behaviors or indirect welfare impacts of the typhoon through such
behaviors. The substitution effect is represented as a function of the full vector of price changes.
To estimate price elasticity 𝜃𝑖𝑗, we follow the steps that Deaton (1989; 1990; 1997)
developed. He estimates the demand system for all products initially. To estimate cross-price
elasticities, we consider how household income, other characteristics, and the price of good j which

7
households face, affect the consumption of good i. Then, we aggregate the results of all goods. In this
study, since we focus on one village, which is affected by a typhoon, we have no regional variation of
damages. The main problem in the data is that each household reported only the unit price of goods
that they face, so we need to correct the measurement error of a household's unit price of goods. We
use the methodology that Griliches and Hausman (1986) introduced, and then we construct a
consistent estimator in (3) of the true parameter 𝜃𝑖𝑗 according to the formula:
𝜃𝑖𝑗 =2𝜑𝑖𝑗𝑣𝑎𝑟(𝑣�)−𝑇−1𝑇 𝜑′𝑖𝑗𝑣𝑎𝑟(∆𝑣)
2𝑣𝑎𝑟(𝑣′)−𝑇−1𝑇 𝑣𝑎𝑟(∆𝑣), where T = 2, 𝒗′ is the deviation of the log of price in time t for each
household from the mean log of price of goods across whole time periods, and Δ𝒗 denotes first
difference of log of price. We plug 𝜃𝑖𝑗 into equation (2) to quantify compensating variation with
substitution effects. We report CV obtained by (1) and (2) in section 5 by using our data and compare
household welfare losses with and without substitution effects.
4. THE TYPHOON MILENYO AND THE DATA
(a) Typhoon Milenyo
The super typhoon Milenyo hit the Philippines on September 28, 2006. The Philippine
Atmospheric, Geophysical, and Astronomical Services Administration (PAGASA) reported that
Milenyo had maximum sustained winds of 130 kilometers per hour and gusts of up to 160 kilometers
per hour, thereby classifying it as a severe tropical storm. The National Disaster Risk Reduction and
Management Council reported that Milenyo affected 277 municipalities and caused damages worth
US$ 137M (PhP 6.6 billion). The average amount of losses per household was estimated to be more
than US$ 230. The Bicol region suffered most heavily accounting for more than half of the total
amount of damages followed by the CALABARZON region including the provinces of Cavite,
Laguna, Batangas, Rizal, and Quezon. Government and non-government organizations provided
assistance amounting to only US$ 1.9M. This means that Milenyo inflicted an enormous amount of

8
damage on the lives and livelihoods of many Filipinos, with a substantial amount of damages borne by
households (Sawada et al., 2009).
Our study village is located in one of the affected provinces, the Laguna province, about 70
kilometers southeast of Manila, facing the east coast of Laguna de Bay. The village, called the East
Laguna village, has been surveyed repeatedly since 1966 (Hayami and Kikuchi, 2000).1 Therefore, the
village has an enormous amount of benchmark information collected and compiled earlier by Hayami
and Kikuchi (1981), Hayami and Kikuchi (2000), and later by Fuwa et al. (2006), and Kajisa
(2007).Our survey was conducted in this village from January 20 to February 15, 2007 (Sawada et al.,
2009). At the time of survey, there were 404 households, and our survey covers all the households
(Table 1). The questionnaire consists of five modules: (1) household characteristics such as
landholding and characteristics of each household member such as age, schooling, gender, occupation,
and membership in an organization; (2) damages of Milenyo to households’ physical and human assets
including farm endowments and human lives; (3) household coping mechanisms in the aftermath of
Milenyo; (4) detailed expenditure on food and nonfood items as well as on utilities and tobacco; and
(5) prices of basic goods such as rice, chicken, pork, sugar, bread, and fish one week before the survey
and one week before and after Milenyo. We categorize the households into farmers, landless, and
non-agricultural households: the farmer households consist of those that own cultivated land; the
landless households consist of those that do not own cultivated land, most of who are agricultural
workers, and non-agricultural households include those whose main income sources are from
non-agricultural wage employment or self-employment. In the analysis, we treat farmer households
and landless households together as agricultural households.
(b) Damages
Table 2 shows the damages to the households in terms of assets and income lost due to
Milenyo in our studied village2. As regards human losses, there were no reported dead or seriously
injured household members, which can be attributed to extensive early warnings made by television

9
and radio broadcasts. Indeed, 33 percent of farmer households, 40 percent of landless households, and
50 percent of non-agricultural households reported no damages at all. Yet, Milenyo hit the village
during the rice-harvesting season, so the major damage to the rice crop was made by high wind as well
as water logging. According to the villagers, the decline in the unit value was because their paddy got
wet when the fields were submerged in water and wet paddy commanded a lower price in the market.
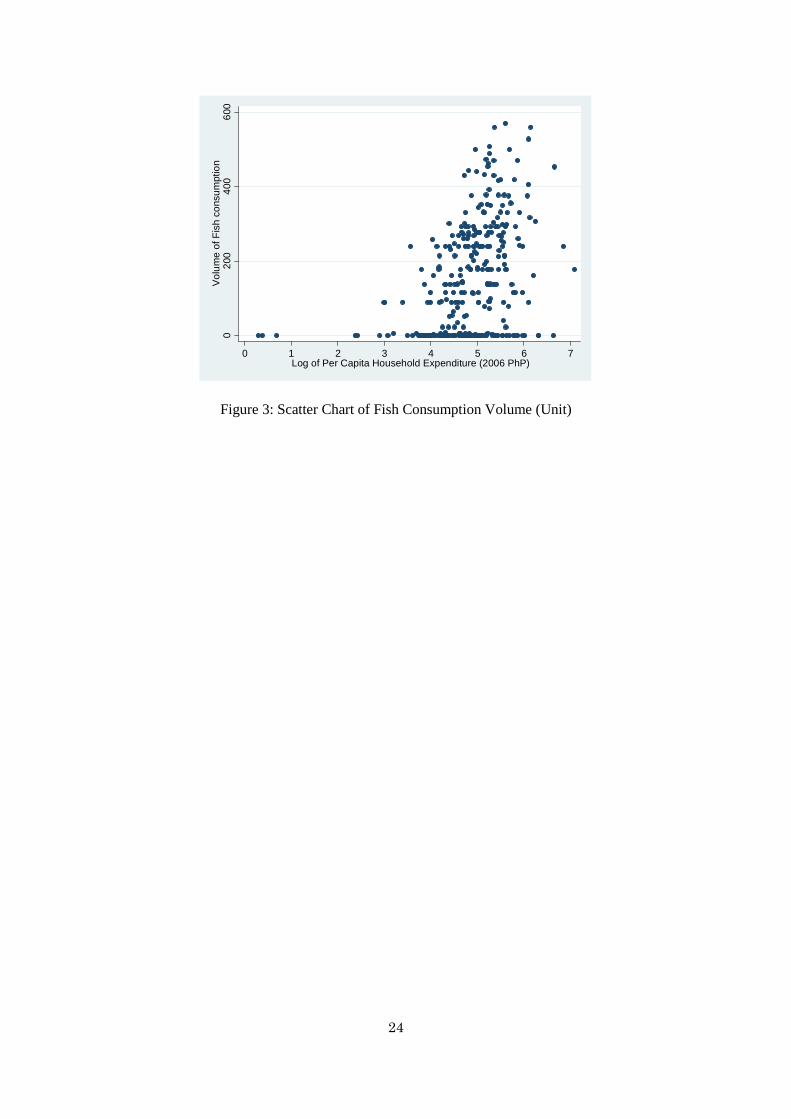
Table 3 shows the reported damage to crop income, which is the difference between the
counterfactual income without Milenyo and the actual income. To quantify the counterfactual income,
in our survey we asked about expected crop price and harvests without Milenyo damage. On average,
the expected crop income before Milenyo was PHP 36,819 while the actual crop income was PHP
20,261, based on the subjective assessments. Milenyo caused around an eighty percent decline in crop
income. On the other hand, there are few non-agricultural households that reported decline in income
after Milenyo. As we see in Table 2, only 5 percent of non-agricultural households experienced a
decline in their income. In contrast to existing literatures which analyzed household welfare changes
by financial shocks or increasing food prices, agricultural income had negative impacts from the shock
and non-agricultural one did not.
Overall, including the cases of multiple damages, more than half of the households in the
village reported having suffered damages from Milenyo. While typhoons occur in most parts of the
Philippines almost regularly during monsoon months, the extent of the damage caused by Milenyo in
our study village was by far exceptionally large. In fact, typhoon damage with severe economic
consequences appears to occur relatively infrequently, at least in the East Laguna village. The 2003
survey conducted in the village, for example, reveals that only 2 percent of the households
experienced crop damage due to typhoon and 8 percent reported property damage in the past ten years,
that is, 1994–2003 (Fuwa et al. 2006). This suggests that the damage caused by Milenyo was largely
an unexpected shock. In addition, during our informal interviews, a few of the long time residents
compared Milenyo with Rosing, a legendary typhoon which hit the village in the 1970s.

10
(c) Households’ coping mechanisms
In our survey, we asked how the households coped with the damage caused by Milenyo. As
summarized in Table 4, the main strategies with which the households coped with the Milenyo
damage were as follows: (1) reducing their food consumption; (2) switching consumption from
purchased food to own produce; (3) obtaining emergency loans from relatives and village
moneylenders; (4) receiving remittances; (5) receiving aid from the local government and private
individuals; and (6) engaging in non-farm employment. In particular, we find that non-agricultural
employment plays a key role as an effective insurance for households. As we have seen in 3(b),
Milenyo caused about an eighty percent decline in agricultural income. Non-agricultural income is not
associated with fluctuations in agricultural income.
Table 5 shows the primary occupation of economically active household members (15 to 65
years old who are not in school at the time of the survey) before and after Milenyo. The agricultural
workers account for the largest portion of primary occupations in the village except for housekeeping
and no primary occupation. We do not find major changes in the primary occupation after Milenyo.
With respect to secondary occupation, we see a relatively larger number in carpentry and construction
work among those who were employed even after Milenyo perhaps because of the greater demand for
house repair after the typhoon. Also, the number of workers who engaged in fishing as secondary
occupation increased after Milenyo. As we see in 3(c), fish pens for tilapia farms were destroyed in the
part of Laguna Lake. Therefore, people could catch fish easily in the bay than before and tried to enter
the local fish market.
As shown in Table 4, more than half of the households received aid from the local
government and NGOs. The local government, through the village chieftain, immediately responded
to the disaster by opening the village meeting hall as a temporal shelter to households that lost their
roofs or were affected by flash floods. In addition, the local government and a political candidate for a
local post released food baskets to the affected families. The food bags contained rice, noodles, and
canned goods and were valued at about US$2 per household. These food bags were distributed to the
households through the office of the village chieftain purposely to effectively identify the poor and the

11
severely affected households. The village chieftain immediately identified the badly affected families
because of his many years of association with the village people. Therefore, he could report to and get
aid from the local town mayor. The food basket was one of the most important coping mechanisms
especially for poor households in our study village. It is clear that the role of the local government is
effective and important during disaster.
Some households coped with the damages by borrowing money and receiving private
transfers, consistent with past studies. (Glewwe and Hall, 1998; Shoji, 2006; Sawada and Shimizutani,
2008) . The portion is higher for the landless households. Interestingly, the money lenders played a
role to support households that got damages as sources of emergency funds. For the landless, nearby
sari-sari (village variety) stores provided either in the form of credit or cash purchase the most basic
needs such as rice, canned goods, candles, and kerosene. It shows there may be risk sharing
mechanism between households in the village. Estudillo, Sawada and Otsuka (2008) states remittances
have become an important source of income in the rural Philippines as a result of the increasing
number of OFWs (Overseas Filipino Workers). As shown in Table 4, 25 percent of the farmer
households, 16 percent of the landless households, and 21 percent of the non-agricultural households
reported to have received remittances after Milenyo. In brief, the availability of emergency borrowing
and remittances indicate the importance of personal network in surviving a crisis.
A larger proportion (76 percent) of the landless households compared to farmers (27 percent)
and non-agricultural households (47 percent) reported to have decreased their food consumption
(Table 4). Reducing protein intake was the more common coping strategy among the landless while
about one fourth of the farmer households have reduced their consumption of food taken outside,
which is more expensive than home prepared food. Switching consumption to own produce, which is
cheaper than those bought in the market, is another coping strategy for 34 percent of the landless, 22
percent of the non-agricultural, and 12 percent of the farmer households. Perishable fruits of backyard
trees such as mangos, banana, and rambutan, which were fallen by Milenyo became substitute to fruits
bought in the market shortly after Milenyo. Indeed, prices of these fruits decreased after Milenyo
(Table 6). Because fish prices went down sharply, many households shifted to own fish catch (or given
by relatives) to fill up their daily protein requirements. 3

12
To compare with the results from the 2003 survey which included a set of questions
regarding the type of shocks and coping behavior during the previous decade (Fuwa 2006), we find
some major and minor differences. From the 2003 survey, “own savings and income” and “help from
relatives” were the main coping mechanisms while sales of physical assets, such as land or animals,
and consumption reallocation played minor roles regardless of the type of shocks (e.g. natural
calamities, demographic shocks including the death or illness of household members).
Comparing household responses to Milenyo as reported above with the responses to the typhoon
damage to crops or property as reported in the 2003 survey, we find that the minor role of physical
asset liquidation and the important roles of borrowing and receipts of assistances/remittances were
found in both the responses to Milenyo and those to earlier typhoons in the 1990s. A major difference,
however, appears to be the importance of the reduction in food consumption (as well as consumption
reallocation) in response to Milenyo in contrast with the conspicuous absence of such behavior in
response to earlier typhoon shocks in the 1990s. Such a contrast appears to reflect the sheer magnitude
of the damage due to Milenyo, which was likely to be much larger than that of the typhoons in 1994-
2003, as suggested by our informal interviews with village residents. This interpretation is also
consistent with the fact that a much larger proportion of households reported government aid as a
coping mechanism after Milenyo compared to those found in the 2003 survey. The severity of the
Milenyo damage, combined with the prospect of the then-upcoming local elections, probably
necessitated a larger scale relief operation on the part of the government. While village households
were mostly able to shield their consumption from income fluctuations caused by earlier typhoons
through various informal insurance schemes (including own savings and incomes, borrowings and
assistance from relatives), the extent of income shock due to Milenyo was sufficiently large so that
many households were forced to reduce their food consumption. Therefore, it is easy to expect that
household’s welfare is affected negatively by changing food consumption.

13
(d) Price and consumption changes
As described in 4(c), consumption reallocation is one of the main coping mechanisms. In this
subsection, we describe detailed prices of food items and household’s consumption behaviors before
and after Milenyo. We collected detailed data on price and consumption before and after Milenyo
respectively. Consumption is further disaggregated into purchased quantity (expenditure) and
self-consumption quantity. Table 6 shows price changes of basic food items faced by households in
the village one week before and one week after Milenyo. In our analysis, we focus on the consumption
of main food items, that is, rice, bread pandesal, noodle soup, fresh chickens, fresh pork, egg, bangus,
tilapia, and sugar, because we have sufficient variation in price of only these items.4 Expenditure on
these items accounts for 45 percent of a household’s total expenditure. According to our data, the price
of rice, bread pandesal, noodle soup, fresh chicken, fresh pork, egg, and sugar increased while the
price of fish (bangus and tilapia) decreased. Importantly, the price of National Food Authority (NFA)
rice did not change substantially, indicating that the food program of the country worked effectively
after Milenyo.
Table 7 shows expenditure on major food items. Remarkably, the expenditure on NFA rice
rose by 25%, while the expenditure on special rice and ordinary rice declined, indicating the
substitution of cheaper NFA rice for the more expensive rice. Indeed, while the expenditure for NFA
rice and bangus increased, we found that expenditure for other goods declined. Bangus and tilapia are
the most widely consumed fish in the Philippines because of their affordable prices. When the typhoon
hit the village, fish pens for tilapia farms were destroyed in the part of Laguna de Bay that is adjacent
to the village. A large volume of tilapia was set loose, and nearby residents were able to catch the fish
by themselves. As a result, the amount of self-consumption of tilapia increased sharply in the locality.
Moreover, in the market, the supply of tilapia increased, pulling down its price.5
We have so far described the major short-term price changes and consumption behavior at the village
aggregate level. As we see in the next section, however, such an aggregate analysis can mask
important heterogeneity among the village social strata in the welfare impact of price changes due to
the typhoon. We now turn to an examination of the distributional consequences of the price changes

14
and consumption behavior in response to such price changes, with a focus on the differential impact
between the poor and the wealthy in the village.
5. EMPIRICAL RESULTS
(a) Direct welfare impacts
First, based on Equation (1), we compute compensating variations (CV) to quantify the
direct impacts of the typhoon. We calculate CV for agricultural households and non-agricultural
households separately because there is important heterogeneity in the amount of self-production of
goods between the two household types. In our data, agricultural households have a relatively larger
amount of consumption of self-produced goods than non-agricultural households. Agricultural
households can cope with price risk by changing consumption of self-produced foods: for example,
consumption of self-produced special rice by agricultural households increased to about 4.5 kilograms
from 1.8 kilograms before the typhoon. Similarly, consumption of self-produced ordinary rice doubled
after the shock. On the other hand, self-consumption by non-agricultural households did not change
before and after Milenyo. Therefore, we analyze the possibility that the reaction to the shock was
different between agricultural and non-agricultural households. Price changes triggered by natural
disasters could affect household welfare disproportionally, as was found in the case of the Indonesian
economic crisis studied by Friedman and Levinsohn (2002).
Figure 1 here.
Figure 1 shows the estimated CV (Equation (1)) at different levels of per capita consumption
expenditure among the village households. While the total magnitude of the welfare impacts of price
changes was relatively smaller than that during the financial crisis in Indonesia as reported in
Friedman and Levinsohn (2002), it seems obvious that the poor non-agricultural households faced a
larger welfare decline than other groups.

15
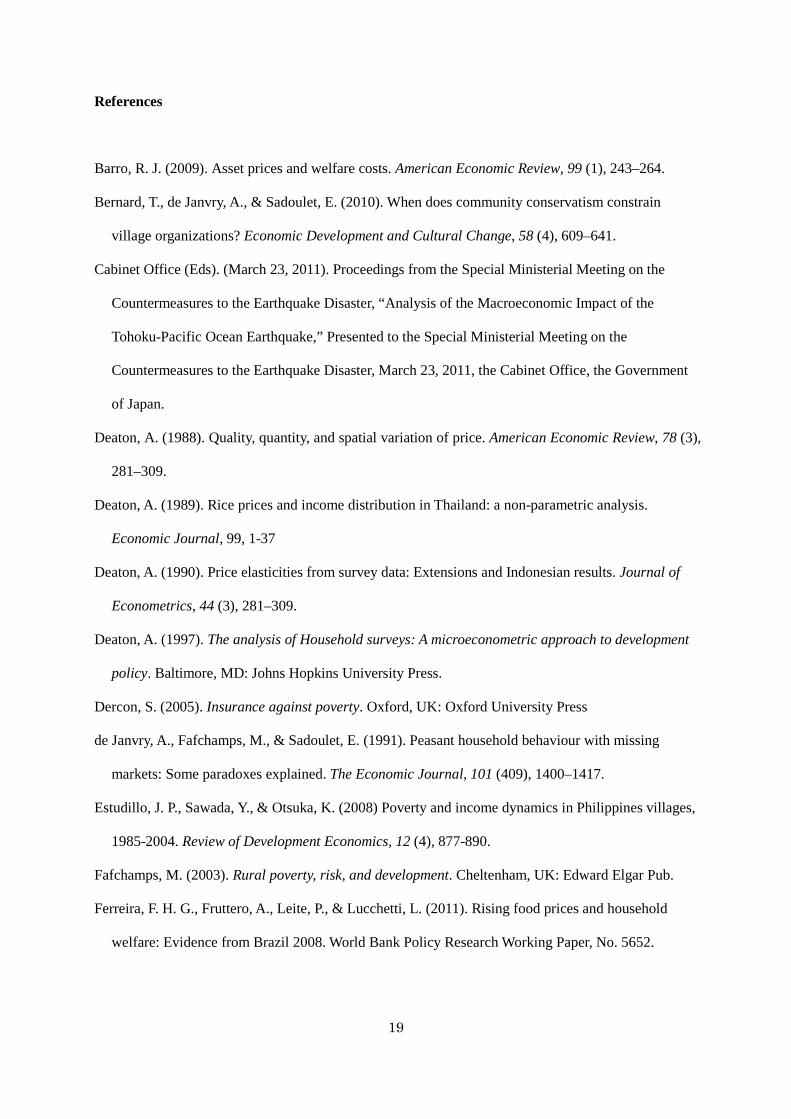
Surprisingly, the middle and high-income households gained from the price changes caused
by the typhoon. Basically, this welfare gain was generated by a sharp price drop of bangus and tilapia
(Table 6). To verify this, we calculated the CV with and without the consumption of fish; the results
are shown in Figure 2. In Figure 2, CV with fish consumption is much lower than CV without fish for
middle and high-income households. Indeed, fish consumption is concentrated among richer
households (Figure 3).
Figure 2 here.
Figure 3 here.
Along with the damages to the standing rice crop, another major damage caused by Milenyo
was the felling of fruit trees, such as mango trees, leading to a sharp increase in the supply of both
mango fruit and firewood. As described in Sawada et al. (2009), the village households increased their
consumption of mango and shifted their source of fuel from charcoal and LPG to firewood. In order to
examine the welfare effects of such price declines, we calculated the CV with and without the
consumption of mango fruit. Unfortunately, we have not been able to conduct a similar analysis for
firewood because firewood was mostly self-produced rather than purchased and thus no price data
were available.
Figure 4 here.
The CV computed with and without mango consumption is reported in Figure 4, where we
can see a negligible welfare impact of the decline in the prices of mango. Indeed, Table 6 shows that
the price of mango decreased after Milenyo. However, there were relatively few cases of mango
consumption reported by the village households. We observe that the number of households that
reported receipt of mango “as gift” from other households increased by threefold after the typhoon.
The average amount of mangos received as gift was 12 kilograms and 25 kilograms before and after
Milenyo, respectively. This is consistent with the mutual insurance hypothesis that village households
helped each other after the typhoon by sharing the fallen fruit in their attempt to mitigate the negative
shocks, albeit that such insurance effect is small for mango transactions.

16
(b) Indirect welfare impacts
Figure 5 here.
Figure 6 here.
In order to investigate whether and how direct negative welfare impacts are weathered
indirectly by ex post risk coping behaviors of consumption reallocation, we compare estimated CV
with and without consumption substitution quantified by Equation (1) and (2), respectively6. Figure 5
and 6 show the CV with and without substitution effects for agricultural and non-agricultural
households, respectively. These results are consistent with Friedman and Levinsohn (2002) in the
sense that households improve their welfare (or mitigate welfare losses) with substitution effects in
response to changing food prices. According to Figure 5 for agricultural households, CV with
substitution effects is lower than CV without substitution effects. This indicates that there are
additional welfare improvements by shifting consumption away from those goods whose prices
increased and toward those goods whose prices dropped.
Figure 6 shows that CV for non-agricultural households also decreases with substation
effects, indicating the effective risk coping of households by reallocating consumption. Yet, among the
poor, we can find a striking difference between agricultural households in Figure 5 and
non-agricultural households in Figure 6. Whilesubstitution effects are at most marginal or zero among
the poor agricultural households, welfare improves significantly among the poor non-agricultural
households. This suggests the importance of the consumption reallocation of the poor non-agricultural
as an ex post risk coping strategy. Yet, unlike the agricultural poor, the non-agricultural poor still
encounter the overall negative welfare impact even after the consumption substitution effect is taken
into account. A possible reason for such a differential welfare impact of food price increase between
agricultural and non-agricultural households among the poor is the way they receive their income. One
of the main income sources for the poor agricultural laborers is rice harvesting where wages are often,
if not always, paid in rice paddy, while non-agricultural laborers are frequently paid in cash. As a

17
result, the poor agricultural households were likely to be somewhat shielded from the negative effects
of food price increases. On the other hand, poor non-agricultural households were directly hit by price
increases leading to the net negative welfare impact as shown in Figure 6. In fact, as Figures 5 and 6
make clear, the poor non-agricultural households were the only household category whose net welfare
impact arising from the food price changes was negative, while the net welfare impact among
non-poor households, both agricultural and non-agricultural, and poor agricultural households was
either positive or zero.
6. CONCLUSION
While the damages caused by various natural disasters have been well documented, the
distributional consequences due to such damages among different income strata and especially among
the poor have not been well understood. Our case study in a Philippine village that was hit by a strong
typhoon in 2006 is an attempt to address such a lacuna in the literature. We focused on the
distributional welfare impact of the food price changes caused by the typhoon.
We found that the negative income shock due to the typhoon consisted mainly of damages to
the standing rice crop and to fruit trees, principally affecting farm households, which are the wealthier
group in the village. While the price of most food items (including rice) rose, the price of fish (tilapia
and bangus) dropped sharply, as its supply increased after a large volume of cultured fish in the nearby
lake was set loose when the typhoon damaged the fish pond facilities. As a consequence, at the village
level, the positive welfare effects of the fall in fish prices outweighed the negative effects of price
increase in other food items. Such average welfare effects, however, mask the sharp contrast in the
welfare impacts of price changes between the poor and the wealthy in the village. While the net
welfare impact among the wealthy households was in fact positive, thanks to their higher consumption
share of fish, the net welfare impact on the poor households was negative. Among the poor, the
negative effects of the food price increase, other than fish price, seemed to outweigh the small or
negligible positive benefit of the sharp drop in the price of fish because the fish consumption share
was negligible among them. Among the poor households, however, agricultural households appear to

18
have been somewhat shielded from the food price increase because they often receive their wages in
rice paddy rather than in cash, while such was not the case for the poor non-agricultural households.
Thus, the poor non-agricultural households were the most severely hit by the changes in food prices
caused by the typhoon. We also found the importance of consumption reallocation as ex post risk
coping, especially among the non-agricultural poor, who are least protected against the typhoon. The
government’s targeted interventions such as food transfers and food discount vouchers to the
non-agricultural poor could be an effective and efficient strategy to ease negative welfare impacts
arising from a typhoon disaster.
One caveat in our analysis, however, is that our analysis focuses on the relatively localized
and short-term welfare effects arising from the typhoon but does not consider the longer-term impact
due to asset damages. The damages to fruit trees are likely to have some negative impacts on the future
income stream of their owners. Also, the short-term gains from the increased fish supply need to be
balanced against the negative impact on the fish farm owners. Despite such limitations, this study
illustrates the critical importance of distributional analysis of even such a short-term impact of natural
disasters.
19
References
Barro, R. J. (2009). Asset prices and welfare costs. American Economic Review, 99 (1), 243–264.
Bernard, T., de Janvry, A., & Sadoulet, E. (2010). When does community conservatism constrain
village organizations? Economic Development and Cultural Change, 58 (4), 609–641.
Cabinet Office (Eds). (March 23, 2011). Proceedings from the Special Ministerial Meeting on the
Countermeasures to the Earthquake Disaster, “Analysis of the Macroeconomic Impact of the
Tohoku-Pacific Ocean Earthquake,” Presented to the Special Ministerial Meeting on the
Countermeasures to the Earthquake Disaster, March 23, 2011, the Cabinet Office, the Government
of Japan.
Deaton, A. (1988). Quality, quantity, and spatial variation of price. American Economic Review, 78 (3),
281–309.
Deaton, A. (1989). Rice prices and income distribution in Thailand: a non-parametric analysis.
Economic Journal, 99, 1-37
Deaton, A. (1990). Price elasticities from survey data: Extensions and Indonesian results. Journal of
Econometrics, 44 (3), 281–309.
Deaton, A. (1997). The analysis of Household surveys: A microeconometric approach to development
policy. Baltimore, MD: Johns Hopkins University Press.
Dercon, S. (2005). Insurance against poverty. Oxford, UK: Oxford University Press
de Janvry, A., Fafchamps, M., & Sadoulet, E. (1991). Peasant household behaviour with missing
markets: Some paradoxes explained. The Economic Journal, 101 (409), 1400–1417.
Estudillo, J. P., Sawada, Y., & Otsuka, K. (2008) Poverty and income dynamics in Philippines villages,
1985-2004. Review of Development Economics, 12 (4), 877-890.
Fafchamps, M. (2003). Rural poverty, risk, and development. Cheltenham, UK: Edward Elgar Pub.
Ferreira, F. H. G., Fruttero, A., Leite, P., & Lucchetti, L. (2011). Rising food prices and household
welfare: Evidence from Brazil 2008. World Bank Policy Research Working Paper, No. 5652.

20
Friedman, J., & Levinsohn, J. (2002). The distributional impacts of Indonesia’s financial crisis on
household welfare: A “rapid response” methodology. World Bank Economic Review, 16 (3),
397–423.
Fuwa, N., Esther, M., & Reaño, J. (2006). Report on the 2003 livelihood systems of rural households
survey in the Philippines. Los Baños: International Rice Research Institute.
Glewwe, P., & Hall, G. (1998). Are some groups more vulnerable to macroeconomic shocks than
others? Hypothesis tests based on panel data from Peru. Journal of Development Economics, 56 (1),
181-206.
Griliches, Z., & Hausman, J. A. (1986). Errors in variables in panel data. Journal of Econometrics, 31
(1), 93–118.
Hayami. Y., & Kikuchi, M. (1981). Asian village ecnomy at the crossroads: an economic approach to
institutional change. Tokyo: University of Tokyo Press.
Hayami, Y., & Kikuchi, M. (2000). A rice village saga: Three decades of green revolution in the
Philippines. Lanham, MD: Barnes & Noble.
Kajisa, K. (2007). Personal networks and non-agricultural employment: the case of a farming village
in the Philippines. Economic Development and Cultural Change, 55 (4), 699-707.
Jensen, R. T., & Miller, N. H. (2008). Giffen behavior and subsistence consumption. American
Economic Review, 98 (4), 1553–1577.
Levinsohn, J., Berry, S., & Friedman, J. (2003). Impacts of the Indonesian economic crisis. Price
changes and the poor. In P. D. Michael, & A. F. Jeffrey (Eds.), Managing currency crisis in
emerging markets (pp. 393–428). Chicago: University of Chicago Press.
National Economic and Development Authority. (November 15, 2006). Government’s response to
Milenyo. Retrieved August 5, 2012 from
http://www.neda.gov.ph/devpulse/pdf_files/devpulse%20%2015%20Nov.%202006.pdf
Porto, G. G. (2008). Estimating household responses to trade reform: Net consumers and net
producers in rural Mexico, Mimeo. Washington, DC: World Bank.
Porto, G. G. (2010). Food prices: Household responses and spillovers. In M. A. Aksoy, & B. Hoekman
(Eds.), Food prices and rural poverty (pp. 167–184). Washington, DC: World Bank.

21
Republic of the Philippines (Eds.) (January 19-24, 2009). Proceedings from ESCAP/WMO Typhoon
Committee 41st Session. Republic of the Philippines, Philippines.
Robles, M., & Maximo, T. (2010). Understanding the impact of high food prices in Latin America.
Economia, 10 (2), 117–164.
Sakai, Y. (2012). The analysis of impact on household welfare from the typhoon Milenyo in the
Philippines. Unpublished master’s thesis, The University of Tokyo, Tokyo.
Sawada, Y., Estudillo, J. P., Fuwa, N., & Kajisa, K. (2009). How do people cope with a natural
disaster? The case of super typhoon Milenyo in the Philippines. In L. S. Gabanilla & G. P. Carnaje
(Eds.), Development, Natural Resources and the Environment (pp. 116–150). Los Banos: College
of Economics and Management University of the Philippines.
Sawada, Y., & Shimizutani, S. (2008). How do people cope with natural disasters? Evidence from the
great Hansin-Awaji (Kobe) earthquake. Journal of Money, Credit, and Banking, 40 (2-3), 463-488.
Sawada, Y., Higuchi, Y., Kajisa, K., Fuwa, N., Esther, M. B. M., & Estudillo, J. P. (2012). The East
Laguna Village: Four decades of studies in a Filipino village. PRIMCED discussion paper no. 18.
Shoji, M. (2006). Limitation of quasi-credit as mutual insurance: coping strategies for covariate shocks
in Bangladesh. COE Discussion Paper F-138. Retrieved
from http://www2.e.u-tokyo.ac.jp/cemano/research/DP/documents/coe-f-138.pdf
Townsend, R. M. (1994). Risk and insurance in village India. Econometrica, 62 (3), 539–591.
Wood, B. D. K., Nelson, C. H., & Nogueira, L. (2012). Poverty effects of food price escalation: The
importance of substitution effects in Mexican households. Food Policy, 37 (1), 77–85.
World Bank. (2011). The World Bank supports Thailand’s post-floods recovery effort, a rapid needs
and impacts assessment of the floods by the World Bank and GFDRR (Global Facility for Disaster
Reduction and Recovery), with development partners, in collaboration with the Ministry of Finance
and over 40 other government agencies in Thailand, December 13, 2011
<http://go.worldbank.org/1FYZRPKI60>.

22
Figures
Figure 1: Compensating Variation for Agricultural and Non-agricultural Households
-6-5
-4-3
-2-1
01
23
0 1 2 3 4 5 6 7Log of Per Capita Household Expenditure (2006 PhP)
CV for Agricultural HouseholdsCV for Non-agricultural Households

23
Figure 2: Compensating Variation with and without Bangus and Tilapia Fish
-6-4
-20
24
0 1 2 3 4 5 6 7Log of Per Cpita Household Expenditure (2006 PhP)
CV with Fish CV without Fish
24
Figure 3: Scatter Chart of Fish Consumption Volume (Unit)
020
040
060
0V
olum
e of
Fis
h co
nsum
ptio
n
0 1 2 3 4 5 6 7Log of Per Capita Household Expenditure (2006 PhP)

25
Figure 4: Compensating Variation with and without Mango Consumption
-6-4
-20
24
0 1 2 3 4 5 6 7Log of Per Capita Household Expenditure (2006PhP)
CV with Mango CV without Mango

26
Figure 5: Compensating Variation with and without Substitution Effects
for Agricultural Households
-6-4
-20
24
0 1 2 3 4 5 6 7Log of Per Cpita Household Expenditure (2006 PhP)
Substitution Non substitution

27
Figure 6: Compensating Variation with and without Substitution Effects
for Non-agricultural Households
-6-4
-20
24
0 1 2 3 4 5 6 7Log of Per Cpita Household Expenditure (2006 PhP)
Substitution Non substitution

28
Tables
Table 1: The Number of Respondent Households, East Laguna Village, Philippines, 2006
Description Number %
Agricultural Households Farmer Households 40 9.9
Landless Households 142 35.15
Non-agricultural
Households 206 50.99
Others
16 3.96
Total
404 100

29
Table 2: Description of Milenyo Damages to the Households, 2006
Kind of Damage
Agricultural Households Non-agricultural Households
Farmer Landless
Number percent Number Percent Number Percent
None (0) 13 32.5 57 40.1 103 50
Lost house (1) 0 0 0 0 1 0.5
House seriously damaged (2) 2 5 11 7.7 16 7.8
Lost utensils (3) 0 0 0 0 0 0
Lost productive assets (4) 1 2.5 1 0.7 1 0.5
Lost job (5) 0 0 1 0.7 5 2.4
Income declined (6) 8 20 15 10.6 5 2.4
Lost members (7) 0 0 0 0 0 0
Members got injured or sick (8) 0 0 0 0 0 0
Crop damage (9) 2 5 5 3.5 13 6.3
Roof damage (10) 2 5 27 19 42 20.4
Other damage (11) 1 2.5 8 5.6 15 7.3
(2) and (5) 1 2.5 0 0 0 0
(2) and (6) 2 5 4 2.8 1 0.5
(2) and (9) 1 2.5 0 0 2 1
(4) and (6) 0 0 2 1.4 0 0
(6) and (9) 5 12.5 9 6.3 1 0.5
(6) and (10) 0 0 1 0.7 0 0
(1), (6) and (9) 0 0 0 0 1 0.5
(2), (6) and (9) 2 5 1 0.7 0 0
Total 40 100 142 100 206 100
30
Table 3: Damages to Crop (Average)
Expected price without Milenyo PHP 8.88
Actual price PHP 7.25
Expected harvest without Milenyo Kg 3644.23
Actual harvest Kg 2412.77

31
Table 4: Household Coping Mechanisms for Milenyo
Agricultural Households
Non-agricultural Households
Coping Mechanism Farmer Landless
(%) (%) (%)
1. Reduce food consumption 27 76 47 1.1 Rice 0 15 8 1.2 Protein 5 27 13 1.3 Food taken outside 22 34 26 2. Switch consumption to own produce 12 34 22 3. Reducing child schooling 2 1 4 4. Reduce medical expenses 0 3 3 5. Sale of valuable items 0 4 6 6. Emergency borrowing 33 50 30 6.1 Bank 5 3 2 6.2 Relatives 12 13 10 6.3 Friends 3 7 3 6.4 Neighbors 0 6 0 6.5 Moneylender 10 6 5 6.6 Pawnshop 0 0 0 6.7 Sari-sari store 3 15 10 7. Emigration 0 0 0 8. Received remittances 25 16 21 9. Aid from local government and NGO 46 65 58 10. Non-farm employment 85 60 94

32
Table 5: Primary Occupation of Economically Active Population (15 to 65 years old
who are not in school) Before and After Milenyo
Primary Occupation Before Milenyo After Milenyo
Number % Number %
Self-emloyed
Farm: Rice production
21 3 22 3
Duck raising
5 1 5 1
Fishing and fish ponds
1 0 1 0
Non-farm: Commerce and trade
28 4 29 4
Transportation
42 6 42 6
Carpentery and electrical
36 5 37 5
Rural industry
4 1 4 1
Hired work:
Farm hired work
157 22 152 21
Paid domestic work
13 2 11 2
Personal services
4 1 4 1
Causal work
88 12 87 12
Religious
1 0 1 0
Factory work
35 5 35 5
Professional services
14 2 14 2
Education and government
17 2 16 2
Overseas work
31 4 31 4
Housekeeping/none
230 32 236 32
Total 727 100 727 100

33
Table 6: Price Change of Food Items
Food Item Unit
Price before
Milenyo
(PHP)
Price after
Milenyo
(PHP)
% change
Special rice kg 23.04 24.67 7.08
Ordinary rice kg 22.41 22.89 2.15
NFA rice kg 19.89 19.95 0.32
Pandesal bread piece 1.18 1.21 2.26
Noodle soup pack 6.03 6.07 0.58
Fresh chicken kg 105.35 101.05 -4.08
Fresh pork kg 122.92 127.33 3.59
Egg piece 4.53 4.62 2.02
Fish (bangus) kg 83.71 26.22 -68.68
Fish (tilapia) kg 71.13 61.59 -13.41
Sugar (brown) kg 31.96 31.61 -1.09
Mango kg 65 60.49 -6.93

34
Table 7: Change in Expenditure between before and after Milenyo
Food Item [A] One week
before Milenyo
[B] One week
after Milenyo
% change
from [A] to
[B]
Special rice 20.41 19.32 -5.34
Ordinary rice 114.12 94.52 -17.17
NFA rice 4.63 5.81 25.58
Pandesal bread 62.18 48.68 -21.70
Noodle soup 99.74 78.76 -21.03
Fresh chicken 55.98 39.52 -29.40
Fresh pork 84.01 57.18 -31.94
Egg 112.73 96.28 -14.59
Fish (bangus) 24.84 74.24 198.80
Fish (tilapia) 85.15 74.03 -13.06
Sugar (brown) 142.42 115.72 -18.74
Mango 7.66 4.33 -43.47

35
Table 8: Expenditure per capita (for 11 goods, one week)
Unit
One week
before Milenyo
One week after
Milenyo
Agricultural Households PhP 183.53 156.47
Non-agricultural Households PhP 219.61 177.79

36
1 Sawada et al. (2012) lists the total 18 rounds of survey conducted in the village since 1966.
2 Sawada et al. (2009) reported the detailed description of damages.
3 Sawada et al. (2009) reported the detailed food expenditures.
4 In our analysis, we omit households that reported that the consumption of any rice and bread
including self-consumption is zero, because rice and bread are main foods in the Philippines; this
leaves us 353 households.
5 In addition, as can be seen in Table 6, the price of bangus, another type of local fish that can be
thought of as a tilapia substitute, also declined sharply.
6 The results of estimated elasticities are available from the corresponding author upon request.