Embed Size (px)
Citation preview
100
Do Motorists See Business Signs? Maybe. Maybe Not.
A Study of the Probability that Motorists View On-Premise Signs
Manuscript submitted for review to the International Journal of Signage and Wayfinding
Christopher Auffrey1 Henry Hildebrandt2
1School of Planning, University of Cincinnati 2School of Architecture and Interior Design, University of Cincinnati Abstract:
This study sought to answer questions about the extent to which on-premise signs (OPS) along US roadways attract the attention of passing motorists, based on a sample of OPS and roadway contexts captured in photo images from along the 3,073 mile length of highway US 50. 3M’s Visual Analysis Software (VAS) was used to predict the probability that the selected OPS would be viewed by passing motorists. Results show that for all signs (n=467), the average probability of being viewed was about 57%, with that rising to about 66% for a “primary signs” group (n=100). These results are consistent with early research of motorist detection of on-premise signs in real-world contexts. The findings suggest that a substantial proportion (approximately one-third) of the on-premise signs along roadways in the US are not being viewed by motorists as business intended, and both the businesses and their communities are foregoing the benefits that more effective signage would provide. This study also sought to determine whether the OPS of national and regional businesses are better able to attract the attention of passing motorists compared to the OPS of locally-based businesses. The results show the average probability of being viewed for the national and regional business OPS is significantly higher than for the local businesses, though both business types showed substantial variation in the probability of viewing. These results suggest an opportunity for the OPS of local businesses to be improved. Both findings here raise important implication for understanding how both local sign regulations and industry design and location standards factor into causing and resolving the problem. Finally, VAS was found to provide quick and inexpensive objective analysis of OPS in real-world contexts. Future research is needed to develop advanced protocols for the use of VAS in analyzing OPS in complex environmental contexts.
Key Words: On-premise signs; probability of viewing; Visual Attention Software
Do Motorists See Business Signs? Maybe. Maybe Not. Aufftrey, C. and Hildebrandt, H. Interdisciplinary Journal of Signage and Wayfinding; Volume 1; Issue 2
101
INTRODUCTION
On-premise signs (OPS)1 provide a cost-effective and efficient mechanism for directing drivers to businesses (Kuhn et al., 1997; Ellis et al. 1997). OPS provide direction to current and new customers, build brand awareness and facilitate impulse sales (Conroy, 2004; Taylor and Sarkees, 2016; Taylor, Claus and Claus, 2005; Calori and Vanden-Eynden, 2015). They also contribute to an area’s sense of place, whether it is the Las Vegas strip, New York’s Times Square, a neighborhood business district, a historic downtown, or a suburban commercial corridor (Jakle, 2004; Baines & Dixon, 2008; Rickard & Stedman, 2015). The economic value of OPS for both businesses and communities makes them important tools for job creation and generators of the property, sales and income taxes that fund essential local services such as schools, police, fire, and roads (Auffrey, Hildebrandt & Rexhausen, 2011; Ellis, et al., 1997; Taylor & Sarkees, 2016).
The most effective OPS for both message communication and economic impact, are those that best capture the attention of their intended audience. There are a number of ways to increase the likelihood that a sign will be noticed. Size, illumination, contrast and location can all make a difference (Hawkins, 2011). Yet, the built and natural contexts in which a signs are located, and how the sign design and location respond to these, may be the most important factors for determining whether a sign captures viewers’ attention, as evidence by different rates of detection of identical signs in different context (Auffrey & Hildebrandt, 2014; Garvey et al, 2002). A sign must be considered in the context of its environment, as it must draw attention away from the visual distractions that surround it. This is especially important for OPS along arterial highways where car and truck traffic, pedestrians, parked vehicles, trees and bushes, buildings, poles, wires and other signs, all compete for motorists’ attention. Ultimately, to optimize the impact of any sign, there is a need to carefully consider the unique contextual elements of its use (Conroy, 2004).
How a sign attracts viewers’ attention has important implications for interpreting studies of the return on investment (ROI) and the economic value of signage (EVOS). Studies that fail to carefully control for the contextual elements of OPS locations may falsely assume that all signs are equally effective in getting attention, and therefore understate the ROI and EVOS of those signs that have been carefully designed and located with respect to their unique contextual environments. Similarly, studies that only involve well designed and placed signs may overstate the ROI and EVOS for signs more generally.
Building on research demonstrating the importance of context, Kellaris and Machleit (2016) propose a conceptual model of signage as a marketing communication tool. Their model seeks to provide a framework for pulling together decades of signage research into a “big picture” so that “missing pieces of the puzzle” might be identified and pursued (10). As such, they identify five elements: 1) signage design; 2) viewer traits; 3) environmental context; 4) mediating processes; and 5) response variables. With respect to the environmental context, three issues are identified: 1) distance from viewers; 2) perspective or angle of view; and 3) relationship to 1On-premisesignsaresigns“erected,maintainedorusedintheoutdoorenvironmentforthepurposeofthedisplayofmessagesappurtenanttotheuseof,productssoldon,orthesaleorleaseof,thepropertyonwhichitisdisplayed”(BertucciandCrawford,2016,21).
Do Motorists See Business Signs? Maybe. Maybe Not. Aufftrey, C. and Hildebrandt, H. Interdisciplinary Journal of Signage and Wayfinding; Volume 1; Issue 2
102
surrounding environment. This study focuses specifically on the relationship of OPS to their surrounding environment, and seeks to build a basis for measuring, assessing and understanding the relationship of a sign’s environmental context to its effectiveness.
Signage design guidelines often assume that signs will be visible and commands sufficient attention so that issues related to distance and perspective are emphasized (Morris et al., 2001). Yet, research of signs in real-world contexts suggests that many OPS fail to capturing the attention of passing motorists (Auffrey and Hildebrandt, 2014; Hawkins, 2011; Garvey et al., 2002). This is consistent with the work of Chrysler et al. (2001), who demonstrated that street signage legibility distances on a test track were substantially longer that those measured in real-world driving. Similarly, Garvey et al. (2002) extended this research to OPS by demonstrating that up to 81% of their experimental OPS were not detected when placed in complex real-world contexts, and that legibility distances were substantially shorter for their real-world signs compared test track measurements. Yet, there is no published research of how actual commercial OPS perform in attracting motorists’ attention in real-world roadway contexts. Clearly there is a need to better understand the extent to which OPS are effective in capturing viewer attention within the complex viewing environments in which they are used. That is what this study seeks to do. Toward this end, this study asks two fundamental but important research questions:
1) To what extent do the OPS along US roadways2 capture the attention of passing motorists? 2) Are the OPS of major national and regional businesses, which are presumably better
designed and located to accommodate their environmental context, better able to capture the attention of passing motorists than the OPS of locally-based businesses?
Answering these questions is important because if real-world OPS are failing to capture the attention of large numbers of motorists at appropriate distances because their design and placement inadequately responds to the competing visual stimuli within the environmental context of a motorist’s viewshed, both traffic safety and customer access issues may result. Motorists require an adequate viewer reaction distance, based on vehicle speed and the complexity of the driving environment, in order to safely respond (slow, change lanes, turn toward business) to any OPS, once it is seen (Bertucci, 2006; Bertucci and Crawford, 2015). Motorists’ whose attention is captured at less than the minimum reaction distance could brake excessively or make unsafe turns in order to respond to the OPS. Further, some of the opportunities afforded to business from effective OPS by communicating with customers, and to communities by a strong retail business base, may be missed. Differences in how the OPS of national/regional retailers capture the attention of motorists compared with local retailers may suggest the need for local economic development agencies to provide better OPS education and services to local businesses. Also, such findings could raise questions about OPS design and location practices, and the impact of local sign regulations on OPS effectiveness. It is in this sense that this research intends to identify one of the missing pieces of the signage research puzzle noted by Kellaris and Machleit (2016).
2Forpurposesofthisstudy,theroadwaysofinterestarethosedesignatedstateandUShighways,notpartoftheInterstateHighwaySystem,intendedtoconnectpopulationcentersandactivities,andalongwhichbusinessesarelocatedbecauseofthevehicleaccessaffordedtoexistingandpotentialcustomers.
Do Motorists See Business Signs? Maybe. Maybe Not. Aufftrey, C. and Hildebrandt, H. Interdisciplinary Journal of Signage and Wayfinding; Volume 1; Issue 2
103
TOOLS FOR MEASURING MOTORISTS’ ATTENTION TO ON-PREMISE SIGNS
The conventional research approach for measuring motorists’ attention to signs real-world contexts (apart from test track studies) has involved researchers riding with drivers and recording their recall of signs, or the use of eye-tracking cameras. While methods these afford a scientific standard of measurement, they are relatively expensive and time consuming, and have the problem of limited generalization of results to other locations, as environmental contexts are described only in broad ways (e.g. high, medium or low complexity). This research sought to use an alternative tool that is scientifically valid and reliable, yet relatively quick and inexpensive. As such, it could be used to measure many motorists’ attention to signs in multiple environmental contexts. 3M Corporation’s Visual Analysis Software meets these requirements and was selected for this study (3M Visual Attention Software, 2017).
VAS was created to better understand what will be noticed from among the various visual elements that are part of signage, retail displays and advertising, by measuring visual attention based on how a typical human eye responds to a visual field. As such, it is intended to inform design decisions by adding objective information into what are often subjective design processes. VAS predicts visual attention based on the presence in an image of five elements: edges, intensity, red/green color contrast, blue/yellow color contrast, and faces. 3M’s studies have concluded that these five elements are the primary drivers for attracting human visual attention (3M Visual Attention Software, 2017).
For signage researchers, VAS predicts the probability of whether a sign in its real-world context will be seen during the pre-attentive vision occurring during the first 3-5 seconds of viewing (3M Visual Attention Software, 2017). Pre-attention vision is innate to all humans, and is known not to be affected by gender, age or culture. Importantly, it is considered to be predictive of post-attentive vision as one consciously interprets what is being seen (3M Visual Attention Software, 2017). 3M’s validation studies show VAS results to be 90-96% accurate when compared with eye-tracking studies, yet VAS offers tremendous efficiency compared to eye-tracking (3M Commercial Graphics Division, 2017; Zhang, et al., 2008; Tseng et al. 2009).
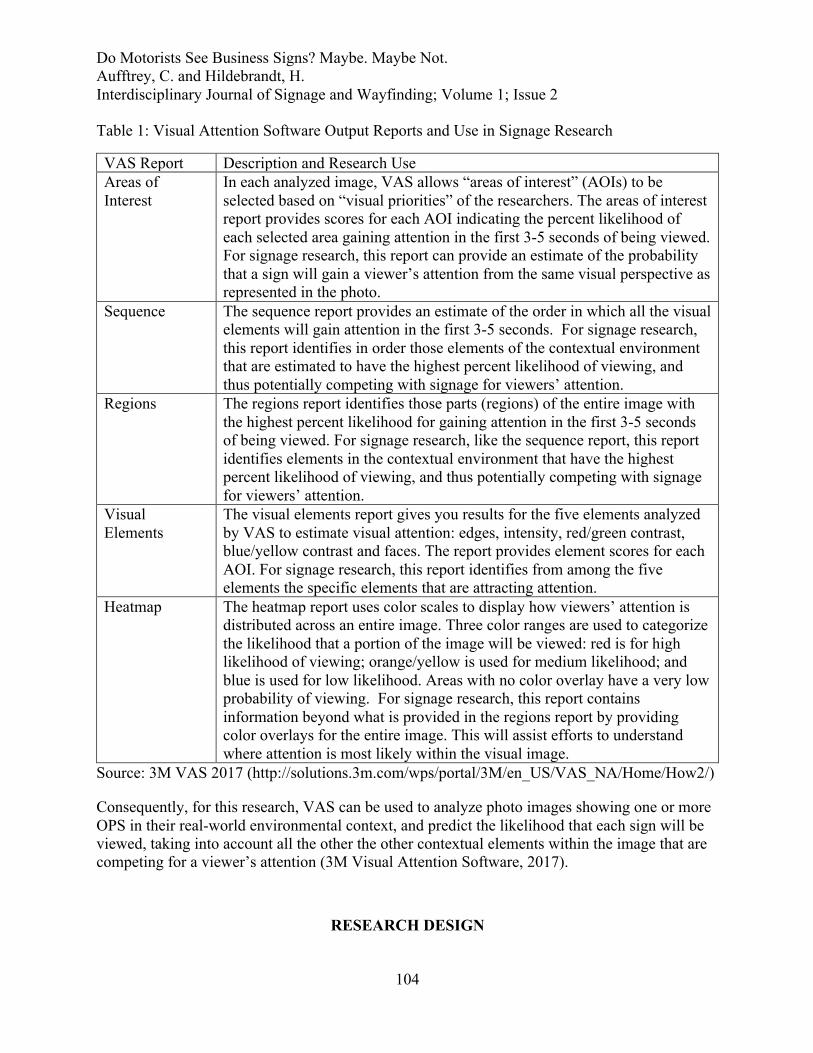
VAS provides five output products for assessing the probability that elements in a visual field will be seen in the first 3-5 seconds of viewing. Table 1 describes each of the output products and briefly describes their utility for signage research.
Do Motorists See Business Signs? Maybe. Maybe Not. Aufftrey, C. and Hildebrandt, H. Interdisciplinary Journal of Signage and Wayfinding; Volume 1; Issue 2
104
Table 1: Visual Attention Software Output Reports and Use in Signage Research
VAS Report Description and Research Use Areas of Interest
In each analyzed image, VAS allows “areas of interest” (AOIs) to be selected based on “visual priorities” of the researchers. The areas of interest report provides scores for each AOI indicating the percent likelihood of each selected area gaining attention in the first 3-5 seconds of being viewed. For signage research, this report can provide an estimate of the probability that a sign will gain a viewer’s attention from the same visual perspective as represented in the photo.
Sequence
The sequence report provides an estimate of the order in which all the visual elements will gain attention in the first 3-5 seconds. For signage research, this report identifies in order those elements of the contextual environment that are estimated to have the highest percent likelihood of viewing, and thus potentially competing with signage for viewers’ attention.
Regions The regions report identifies those parts (regions) of the entire image with the highest percent likelihood for gaining attention in the first 3-5 seconds of being viewed. For signage research, like the sequence report, this report identifies elements in the contextual environment that have the highest percent likelihood of viewing, and thus potentially competing with signage for viewers’ attention.
Visual Elements
The visual elements report gives you results for the five elements analyzed by VAS to estimate visual attention: edges, intensity, red/green contrast, blue/yellow contrast and faces. The report provides element scores for each AOI. For signage research, this report identifies from among the five elements the specific elements that are attracting attention.
Heatmap The heatmap report uses color scales to display how viewers’ attention is distributed across an entire image. Three color ranges are used to categorize the likelihood that a portion of the image will be viewed: red is for high likelihood of viewing; orange/yellow is used for medium likelihood; and blue is used for low likelihood. Areas with no color overlay have a very low probability of viewing. For signage research, this report contains information beyond what is provided in the regions report by providing color overlays for the entire image. This will assist efforts to understand where attention is most likely within the visual image.
Source: 3M VAS 2017 (http://solutions.3m.com/wps/portal/3M/en_US/VAS_NA/Home/How2/)
Consequently, for this research, VAS can be used to analyze photo images showing one or more OPS in their real-world environmental context, and predict the likelihood that each sign will be viewed, taking into account all the other the other contextual elements within the image that are competing for a viewer’s attention (3M Visual Attention Software, 2017).
RESEARCH DESIGN
Do Motorists See Business Signs? Maybe. Maybe Not. Aufftrey, C. and Hildebrandt, H. Interdisciplinary Journal of Signage and Wayfinding; Volume 1; Issue 2
105
This study has used an exploratory research design to answer fundamental questions about the extent that OPS attract the attention of motorists. Such an approach is considered appropriate when the understanding of problems is in a preliminary stage, and when analytic methods are not well-developed. Further, an exploratory research design provides flexibility to address research questions to explore whether and to what extent do differences exist, and can be used to generate new research questions and hypotheses that explore the causes and solutions for those differences (Babbie, 2010).
Early studies established that OPS, when viewed in their real-world context, had wide variation in their likelihood of attracting motorist’s attention, and could be altered to substantially increase motorist’s attention though relatively minor design changes (Garvey et al., 2002; Auffrey & Hildebrandt, 2014). Yet, that work was based on a relatively small sample from limited contexts within two Midwestern cities. The purpose of the current research is to extend that earlier work to a larger, nationwide sample of OPS. In order to accomplish this, it was essential to have access to: 1) a nationwide database of OPS in a wide variety of environmental contexts; and 2) an analytic tool that can provide valid and reliable estimates of the probability motorists will view specific OPS within those environmental contexts. The design of this research has met both these conditions.
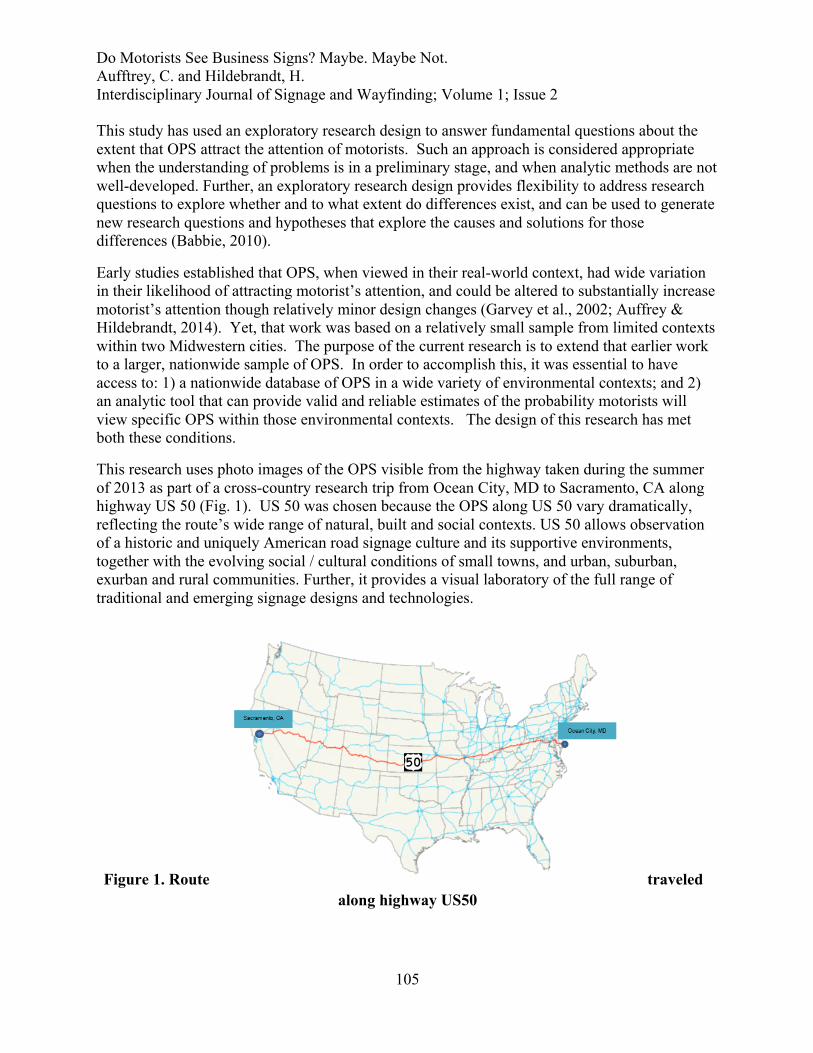
This research uses photo images of the OPS visible from the highway taken during the summer of 2013 as part of a cross-country research trip from Ocean City, MD to Sacramento, CA along highway US 50 (Fig. 1). US 50 was chosen because the OPS along US 50 vary dramatically, reflecting the route’s wide range of natural, built and social contexts. US 50 allows observation of a historic and uniquely American road signage culture and its supportive environments, together with the evolving social / cultural conditions of small towns, and urban, suburban, exurban and rural communities. Further, it provides a visual laboratory of the full range of traditional and emerging signage designs and technologies.
Figure 1. Route traveled along highway US50
Do Motorists See Business Signs? Maybe. Maybe Not. Aufftrey, C. and Hildebrandt, H. Interdisciplinary Journal of Signage and Wayfinding; Volume 1; Issue 2
106
Earlier US 50 research documented the interplay of three critical factors for the communication effectiveness of on-premise signage: signage, buildings and context (Auffrey, Hildebrandt & Mehta, 2015). That research found that the important contextual elements were a result of the land use and land forms of the immediate and surrounding areas (including changes in elevation and sightlines), and the presence of potential visual obstructions from the presence of vegetation, poles, wires, vehicles, building and other signs. Other factors included the styles, heights, conditions and setbacks of buildings, and the width, alignment, profile and allowed speed of the road. The findings of the US 50 research project included: • The environmental context of an on-premise sign has a major impact on whether a seemingly
well-designed and located OPS can be seen by motorists; • Many OPS use seemingly standard designs and placements, often based on national franchise
requirements, are difficult to see because they fail to account for environmental context; • Many of the OPS that are difficult to see could be redesigned and/or moved, seemingly within
the scope of commonly accepted sign regulations, to better account for their environmental context and thereby improve their communication effectiveness.
(Auffrey & Hildebrandt, 2014)
DATA
One hundred photo images were selected from among a collection of 4,122 digital photo images of OPS visible from the highway taken during the trip along highway US 50. Each photo image contains from two to eight clearly visible OPS, with an average 4.67 OPS per photo and a total of 467 OPS that were part of this analysis. All the selected photos images were taken in full-daylight through the passenger side of the front windshield of a car while driving at near-posted speeds, or at the speed at which traffic conditions safely allowed, along small town, urban, suburban, exurban and rural sections of US 50. Photo were intentional taken in such a way to capture the visual images from the perspective of the motorists at which the OPS were directed. While the photos were taken from the passenger side of the vehicle, given that small sedans were used for the trip (2013 Hyundai Elantra, 2012 Fiat 500, and 2013 Chevrolet Cruze) it is assumed that the perspective of the photos is reasonably representative of what would be seen by both the driver and front seat passenger. The researchers sought to record images of OPS that included the natural and built environmental contexts in which the OPS were placed. Images were collected for both older and newer sign designs and styles. All photos were taken using a Nikon D50 with autofocus, 1/500 second exposure, no flash, using a 180mm telephoto lens and varying levels of magnification.
The intent of the field research was to collect representative photo images to build a comprehensive and representative digital database to document and analyze the multiple and varied types of OPS generally found in the US, and the full range of visual contexts in which those OPS compete for motorists’ attention. US 50 was selected for collecting the photo images of OPS because it is a major coast-to-coast highway that is not part of the Interstate highway system. For most of its 3,073 mile length, US 50 provides direct access to roadside businesses and travels through a mix of development conditions (rural, small town, exurban, suburban and urban), landforms (plains, rolling hills, mountains and deserts), and OPS types (pylon, pole, monument, wall/roof/parapet, projecting, awning, sidewalk, window, buildings as signs) with a variety of types of illumination (unlit, internally illuminated and externally illuminated). As
Do Motorists See Business Signs? Maybe. Maybe Not. Aufftrey, C. and Hildebrandt, H. Interdisciplinary Journal of Signage and Wayfinding; Volume 1; Issue 2
107
such, US 50 was considered to serve as a comprehensive visual laboratory of OPS types and the multiple contexts in which OPS are displayed.
All of the 100 selected photo images for the current research are forward-facing as would be viewed by a front-seated passenger or the driver, approximately centered horizontally on a “primary sign” within a 60 to 120 degree horizontal and 60 to 80 degree vertical visual field. Each image’s primary sign was so designated because it was positioned to be clearly visible, and given road conditions and posted speeds, there would be adequate viewer reaction time (4-6 seconds, depending on driving environment, according to the US Sign Council) for a driver to safely respond to the sign by turning off the road toward the associated business (Bertucci and Crawford, 2015). Consideration of likely vehicle speeds is essential because it is the combination of viewer reaction time and speed that determine the viewer reaction distance. At 35 MPH, a distance of about 200-300 feet (depending on the complexity of traffic environments) is need for motorists to react to seeing an OPS. At 55 MPH, the necessary viewer reaction distance of about 325 to 485 feet. As such, the images selected for this analysis were chosen because they were considered to approximate these distances and as such, reflect the range of real-world conditions under which business owners expect motorists to view their signs.
3M’s VAS software was used to analyze each of the 100 photos images. In each of the images, up to eight OPS were selected to be analyzed using VAS’s Area of Interest (AOI) tool, with a total of 467 OPS selected for AOI analysis, or an average of 4.67 OPS per photo image. Use of the AOL tool was especially useful for this research because it allows separate estimates of the probability of viewing for each sign in a photo image.
The number of OPS selected in each image varied depending on the number of “prominently visible” OPS in each image. In each image, the OPS were selected in order, from the most prominent (primary sign) to the least prominent OPS, based on the researcher’s judgement of each sign’s relative proximity to the center of the visual field, and the degree to which it commanded a viewer’s attention. This selection was based on the researcher’s judgment of the probability that a sign would be seen by a passing motorist, based on what can be seen in the image. The researchers consider that under these conditions, our analysis can provide valid and reliable estimates of the likelihood that the signs would capture a driver’s attention, based on the perspective afforded by the image.
Also, as indicated earlier, the selection of the primary sign in each image required that the point at which the sign is viewed (from where the photo image was taken) must allow adequate time for a motorist to safely respond to the sign, should they choose to do so. While this last condition is not required for the branding functions of OPS, it is critical for wayfinding and generating impulse sales. As such, this research differentiated the “primary OPS” from the other “non-primary OPS” in each image.
Further, it was considered that primary signs, being so designated because they are more centered and prominently visible in the images, may better conform to the VAS algorithm for the probability of viewing, and as such, any difference in their probability of viewing compared to the non-primary signs may reflect camera angle (or viewing angle), as opposed to differences in sign design or environmental context issues. To this end, all signs were assigned to one of three
Do Motorists See Business Signs? Maybe. Maybe Not. Aufftrey, C. and Hildebrandt, H. Interdisciplinary Journal of Signage and Wayfinding; Volume 1; Issue 2
108
probability categories, based on the VAS estimate of their probability of being viewed. Similar to the categories used in the VAS Heatmap output, signs with probabilities of 0% to less than 40% were assigned to the low probability of viewing category, 40% to less than 70% were assigned to the medium probability of viewing category, and signs with probabilities of 70% or more were assigned to the high probability of viewing category.
Finally, it was considered that the signs of national and regional businesses may have better access to sign design and placement services, and therefore have a higher probability of being viewed, compared to the signs of local businesses. Consequently, each of the 100 primary signs was reviewed and as designated representing either a national/regional business or a local business.
Data was collected and entered into an SPSS database for each sign’s attributes: 1) designation as a primary or non-primary sign, 2) probability of viewing, 3) low, medium or high probability of viewing category, and 4) whether it represented a national/regional business of a local business. SPSS then was used to perform the following three analyses:
1. For the probability of viewing a sign among the three sign groups (primary, non-primary, or all signs), descriptive statistics were calculated and a difference of means analysis used for to test for significant differences in the mean probability of viewing between the primary and non-primary groups;
2. For the proportion of signs in either the low, medium of high probability of viewing categories, descriptive statistics were calculated and a difference of proportions analysis used to test for significant differences in the proportion of primary signs in each category compared with the non-primary signs;
3. For the probability of viewing the signs of national and regional businesses compared with the signs of local businesses, descriptive statistics were calculated and a difference of means analysis used to test for significant differences in the probabilities of viewing the signs of national and regional businesses compared to the signs of local businesses.
FINDINGS
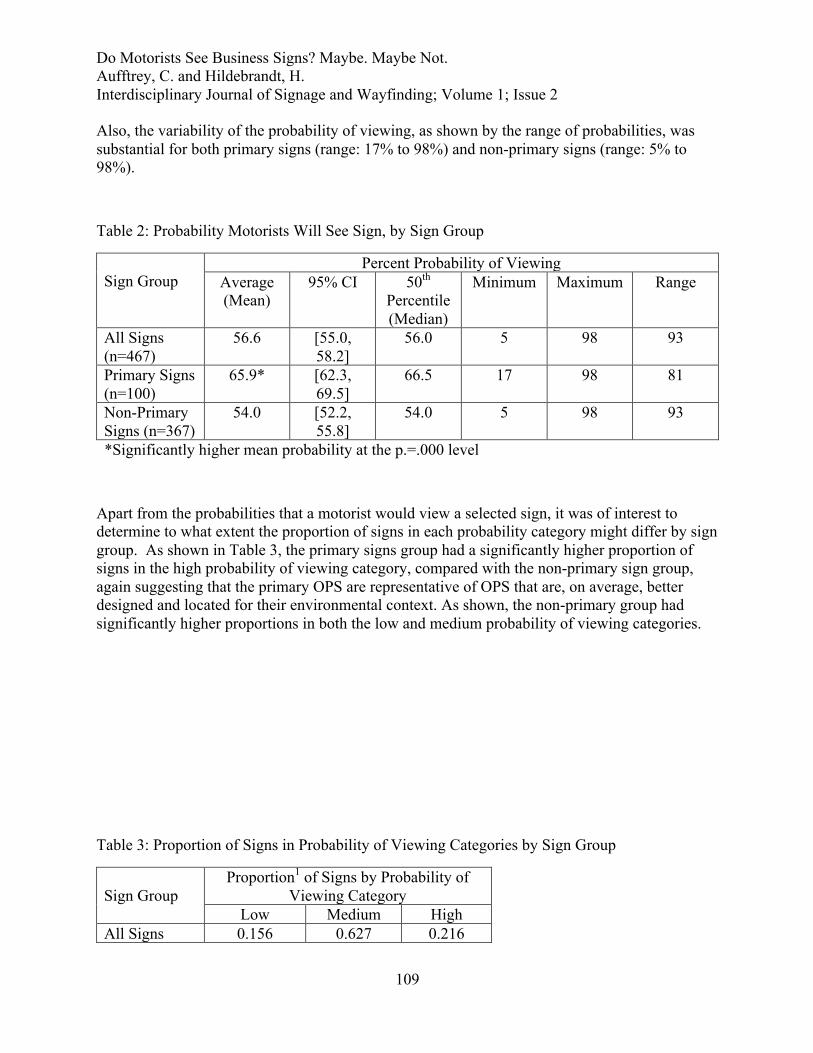
The results of the VAS analysis were tabulated using SPSS software. As show in Table 2, for all 467 signs, the average (mean) probability that a motorist would view one of the signs was 56.6%, indicating there was a 43.4% chance, on average, that motorists would not have viewed one of the signs. The average probability of viewing was 65.9% for the primary signs (n=100) and 54.0% for the non-primary signs (n=367).
In addition, the average probability of viewing for the primary signs was found to be significantly higher than the average probability for the non-primary signs. This suggests that the primary OPS may be better designed and/or located within their environmental context, at least from the visual perspective provided by the photo image, compared with the non-primary signs in the same photo image.
Do Motorists See Business Signs? Maybe. Maybe Not. Aufftrey, C. and Hildebrandt, H. Interdisciplinary Journal of Signage and Wayfinding; Volume 1; Issue 2
109
Also, the variability of the probability of viewing, as shown by the range of probabilities, was substantial for both primary signs (range: 17% to 98%) and non-primary signs (range: 5% to 98%).
Table 2: Probability Motorists Will See Sign, by Sign Group
Sign Group
Percent Probability of Viewing Average (Mean)
95% CI 50th Percentile (Median)
Minimum Maximum Range
All Signs (n=467)
56.6 [55.0, 58.2]
56.0 5 98 93
Primary Signs (n=100)
65.9* [62.3, 69.5]
66.5 17 98 81
Non-Primary Signs (n=367)
54.0 [52.2, 55.8]
54.0 5 98 93
*Significantly higher mean probability at the p.=.000 level
Apart from the probabilities that a motorist would view a selected sign, it was of interest to determine to what extent the proportion of signs in each probability category might differ by sign group. As shown in Table 3, the primary signs group had a significantly higher proportion of signs in the high probability of viewing category, compared with the non-primary sign group, again suggesting that the primary OPS are representative of OPS that are, on average, better designed and located for their environmental context. As shown, the non-primary group had significantly higher proportions in both the low and medium probability of viewing categories.
Table 3: Proportion of Signs in Probability of Viewing Categories by Sign Group
Sign Group
Proportion1 of Signs by Probability of Viewing Category
Low Medium High All Signs 0.156 0.627 0.216
Do Motorists See Business Signs? Maybe. Maybe Not. Aufftrey, C. and Hildebrandt, H. Interdisciplinary Journal of Signage and Wayfinding; Volume 1; Issue 2
110
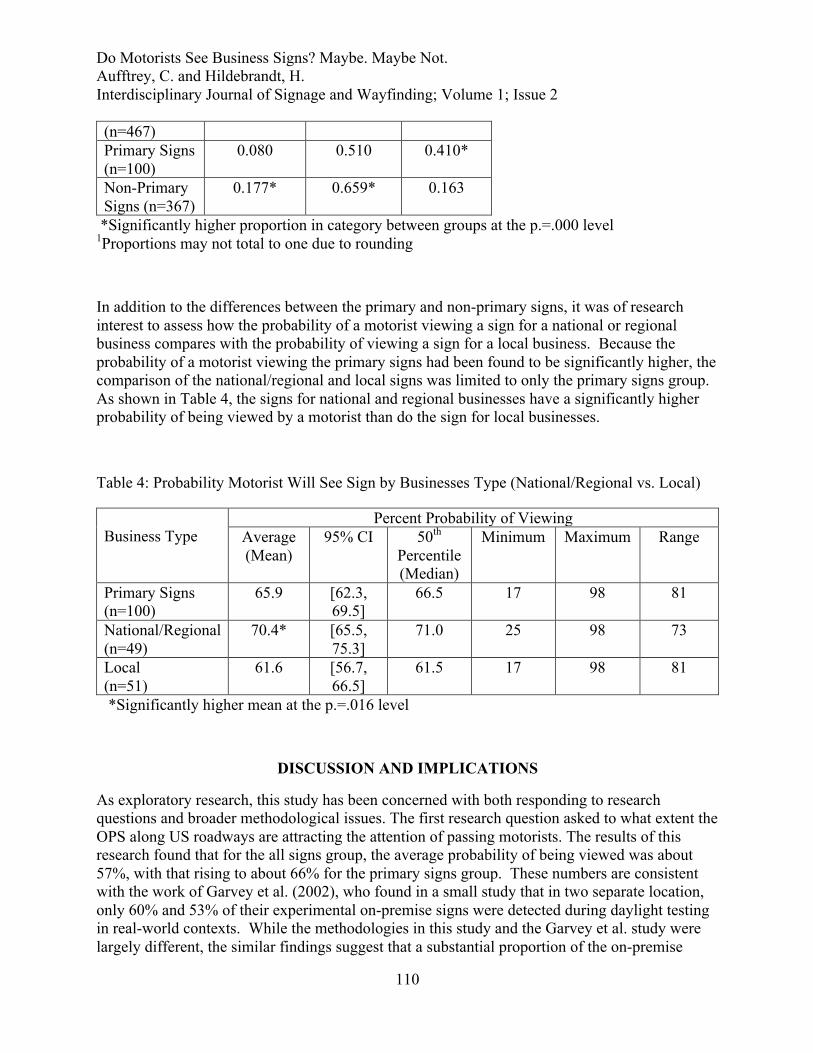
(n=467) Primary Signs (n=100)
0.080 0.510 0.410*
Non-Primary Signs (n=367)
0.177* 0.659* 0.163
*Significantly higher proportion in category between groups at the p.=.000 level 1Proportions may not total to one due to rounding
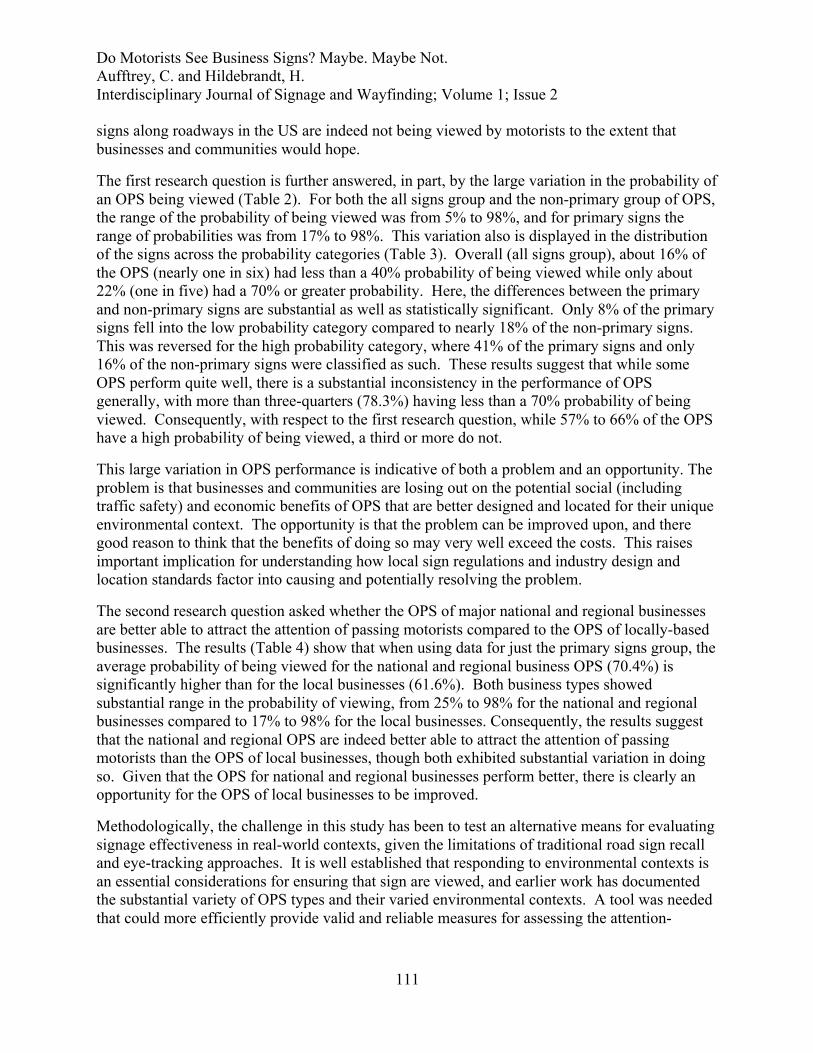
In addition to the differences between the primary and non-primary signs, it was of research interest to assess how the probability of a motorist viewing a sign for a national or regional business compares with the probability of viewing a sign for a local business. Because the probability of a motorist viewing the primary signs had been found to be significantly higher, the comparison of the national/regional and local signs was limited to only the primary signs group. As shown in Table 4, the signs for national and regional businesses have a significantly higher probability of being viewed by a motorist than do the sign for local businesses.
Table 4: Probability Motorist Will See Sign by Businesses Type (National/Regional vs. Local)
Business Type
Percent Probability of Viewing Average (Mean)
95% CI 50th Percentile (Median)
Minimum Maximum Range
Primary Signs (n=100)
65.9 [62.3, 69.5]
66.5 17 98 81
National/Regional (n=49)
70.4* [65.5, 75.3]
71.0 25 98 73
Local (n=51)
61.6 [56.7, 66.5]
61.5 17 98 81
*Significantly higher mean at the p.=.016 level
DISCUSSION AND IMPLICATIONS
As exploratory research, this study has been concerned with both responding to research questions and broader methodological issues. The first research question asked to what extent the OPS along US roadways are attracting the attention of passing motorists. The results of this research found that for the all signs group, the average probability of being viewed was about 57%, with that rising to about 66% for the primary signs group. These numbers are consistent with the work of Garvey et al. (2002), who found in a small study that in two separate location, only 60% and 53% of their experimental on-premise signs were detected during daylight testing in real-world contexts. While the methodologies in this study and the Garvey et al. study were largely different, the similar findings suggest that a substantial proportion of the on-premise
Do Motorists See Business Signs? Maybe. Maybe Not. Aufftrey, C. and Hildebrandt, H. Interdisciplinary Journal of Signage and Wayfinding; Volume 1; Issue 2
111
signs along roadways in the US are indeed not being viewed by motorists to the extent that businesses and communities would hope.
The first research question is further answered, in part, by the large variation in the probability of an OPS being viewed (Table 2). For both the all signs group and the non-primary group of OPS, the range of the probability of being viewed was from 5% to 98%, and for primary signs the range of probabilities was from 17% to 98%. This variation also is displayed in the distribution of the signs across the probability categories (Table 3). Overall (all signs group), about 16% of the OPS (nearly one in six) had less than a 40% probability of being viewed while only about 22% (one in five) had a 70% or greater probability. Here, the differences between the primary and non-primary signs are substantial as well as statistically significant. Only 8% of the primary signs fell into the low probability category compared to nearly 18% of the non-primary signs. This was reversed for the high probability category, where 41% of the primary signs and only 16% of the non-primary signs were classified as such. These results suggest that while some OPS perform quite well, there is a substantial inconsistency in the performance of OPS generally, with more than three-quarters (78.3%) having less than a 70% probability of being viewed. Consequently, with respect to the first research question, while 57% to 66% of the OPS have a high probability of being viewed, a third or more do not.
This large variation in OPS performance is indicative of both a problem and an opportunity. The problem is that businesses and communities are losing out on the potential social (including traffic safety) and economic benefits of OPS that are better designed and located for their unique environmental context. The opportunity is that the problem can be improved upon, and there good reason to think that the benefits of doing so may very well exceed the costs. This raises important implication for understanding how local sign regulations and industry design and location standards factor into causing and potentially resolving the problem.
The second research question asked whether the OPS of major national and regional businesses are better able to attract the attention of passing motorists compared to the OPS of locally-based businesses. The results (Table 4) show that when using data for just the primary signs group, the average probability of being viewed for the national and regional business OPS (70.4%) is significantly higher than for the local businesses (61.6%). Both business types showed substantial range in the probability of viewing, from 25% to 98% for the national and regional businesses compared to 17% to 98% for the local businesses. Consequently, the results suggest that the national and regional OPS are indeed better able to attract the attention of passing motorists than the OPS of local businesses, though both exhibited substantial variation in doing so. Given that the OPS for national and regional businesses perform better, there is clearly an opportunity for the OPS of local businesses to be improved.
Methodologically, the challenge in this study has been to test an alternative means for evaluating signage effectiveness in real-world contexts, given the limitations of traditional road sign recall and eye-tracking approaches. It is well established that responding to environmental contexts is an essential considerations for ensuring that sign are viewed, and earlier work has documented the substantial variety of OPS types and their varied environmental contexts. A tool was needed that could more efficiently provide valid and reliable measures for assessing the attention-
Do Motorists See Business Signs? Maybe. Maybe Not. Aufftrey, C. and Hildebrandt, H. Interdisciplinary Journal of Signage and Wayfinding; Volume 1; Issue 2
112
capturing performance of similar signs in dissimilar real-world contexts. The use of VAS has allowed this assessment through objective analyses that would not have been possible otherwise.
Yet, despite the advantages of VAS, significant challenges remain for its use in fully understanding how OPS capture the attention of passing motorists. In the current research, VAS was used to analyze images reflecting a single moment in time in what is an inherently dynamic process of viewing signage (and other things) while driving. In a real-world context, as a motorist proceeds on the roadway, the views of OPS and their environmental context are continually changing. As such, the extent to which a particular OPS is capturing the attention of a motorist is continually changing, as well. The VAS estimate of the likelihood that an OPS will capture the motorist’s attention will change as the vehicles moves and the sign’s visual context changes. As such, the VAS results must be interpreted with these limitations in mind.
This research used VAS to analyze photo images of OPS taken at approximately the minimum viewing distance (based on vehicle speed and traffic conditions) that would allow the motorist to safely respond to the OPS by getting off the highway and going to the business. It is assumed that at shorter distances to the OPS, many motorists could not safely respond, and the OPS is less useful for wayfinding or attracting impulse customers. At longer distances, while motorists would be better able to respond to the OPS if it were to capture their attention, the added distance may increase the potential for visual complexity with competing elements that direct attention away from the OPS.
Future signage research using VAS would benefit from the development of advanced protocols for its use in the dynamic visual environments found along roadways. For example, a more valid and reliable measure of a sign’s ability to capture motorists’ attention might be reflected in an average (mean) likelihood of viewing calculated over the distance from when the sign is first visible until the minimum viewing distance is reached. Automated versions of such a tool could be extremely useful for sign companies in the design and placement of OPS in real-world contexts. Also, such a tool may be helpful for local and state transportation departments in the placement of traffic safety and directional signage. In addition, planning agencies could use such a tool to model the impact of sign codes on OPS effectiveness.
Disclosure Statement:
Funding for data collection for this research was provided by a grant from the University of Cincinnati Communication in the Urban Environment (CUE) initiative. Access to VAS was provided by the 3M Corporation’s Commercial Graphics Division.
Do Motorists See Business Signs? Maybe. Maybe Not. Aufftrey, C. and Hildebrandt, H. Interdisciplinary Journal of Signage and Wayfinding; Volume 1; Issue 2
113
Bibliography
1. 3M Commercial Graphics Division. (2017), 3M Visual Attention Service Validation Study. Maplewood, MN: 3M Corporation. Accessed April 2, 2017 at http://multimedia.3m.com/mws/media/1006827O/3msm-visual-attention-software-vas-validation-study.pdf?fn=VAS_%20Validation%20Study.pdf
2. 3M Visual Attention Software. (2017), How VAS Works. Maplewood, MN: 3M Corporation. Accessed March 29, 2017 at http://solutions.3m.com/wps/portal/3M/en_US/VAS_NA/Home/How2/.
3. Auffrey, C., Hildebrandt, H., & Rexhausen J. (2011), Economic Value of On-Premise Signs. Proceeding of the National Signage Research and Education Conference, Signage Foundation, Inc. Cincinnati, October.
4. Auffrey, C., & Hildebrandt, H. (2013), Assessment of the Impacts of Contextual Elements of On-Premise Signage. Proceeding of the National Signage Research and Education Conference, Signage Foundation, Inc. Cincinnati, October.
5. Auffrey, C., & Hildebrandt, H. (2014), Utilizing 3M’s Visual Attention Service software to assess on-premise signage conspicuity in complex signage environments. Proceeding of the National Signage Research and Education Conference, Signage Foundation, Inc. Cincinnati, October.
6. Auffrey, C., Hildebrandt, H., & Mehta, V. (2015), Context and Signage Effectiveness. Proceeding of the National Sign Research and Education Conference, Signage Foundation, Inc., Norman, OK. October.
7. Babbie, E. (2010), The Practice of Social Research. Belmont, CA: Wadsworth Cengage. 8. Baines, P. & Dixon C. (2008), Signs: Lettering the Environment. London: Laurence King
Publishing. 9. Bertucci, A. (2006), Sign Legibility Rules of Thumb. Bristol, PA: United States Sign Council. 10. Bertucci, A. & Crawford, R. (2016), Model Code for the Regulation of On-Premise Signs.
Bristol, PA: United States Sign Council. 11. Calori, C. & Vanden-Eynden, D. (2015), Signage and Wayfinding Design: A Complete
Guide to Creating Environmental Graphic Design Systems, 2nd Ed. Hoboken, NJ: John Wiley & Sons.
12. Conroy, D. (2004), What’s Your Signage? Albany: New York Small Business Development Center.
13. Ellis, S., Johnson, R. & Murphy, R. (1997), The Economic Value of On-Premise Signage. San Diego: California Electric Sign Association.
14. Garvey, P., Zineddin, A., Porter, R. and Pietrucha, M. (2002), Real World On-Premise Sign Visibility: The Impact of the Driving Task on Sign Detection and Legibility. University Park, PA: Pennsylvania Transportation Institute.
15. Hawkins, H.G. (2011), Sign Legibility Considerations for On-Premise Signs Technical Report, in A Legal and Technical Exploration of On-Premise Sign Regulation: An Evidence Based Model Sign Code, eds. D. Jourdan, H.G. Hawkins, R. Abrams & K. Winson-Geideman, College Station, TX: Urban Design Associates, 14-30.
16. Jakle, J. (2004), Signs in America's auto age: signatures of landscape and place. Iowa City, IA: University of Iowa Press.
Do Motorists See Business Signs? Maybe. Maybe Not. Aufftrey, C. and Hildebrandt, H. Interdisciplinary Journal of Signage and Wayfinding; Volume 1; Issue 2
114
17. Jourdan, D., Hurd, K., Hawkins, H.G., Abrams, R. & Winson-Geideman, K., (2013), Evidence-Based Sign Regulation: Regulating on the Basis of Empirical Wisdom (2013). Urban Lawyer, 45(2), 327-348.
18. Kellaris, J. & Machleit, K., 2016. Signage as Marketing Communication: A Conceptual Model and Research Proposition, Interdisciplinary Journal of Signage and Wayfinding, 1 (1).
19. Kuhn, B., Garvey, P. & Pietrucha, M. (1997), Model Guidelines for Visibility of On-Premise Advertisement Signs, Transportation Research Record, 1605, Paper No. 970507, 80-87.
20. Morris, M., Hinshaw, M., Mace, D. & Weinstein A. (2001), Context-Sensitive Signage Design, Chicago: American Planning Association.
21. Pegler, M. (2015), Designing the Brand Identity of Retail Spaces, New York: Fairchild Books.
22. Rickard, L. N., & Stedman, R. C. (2015), From ranger talks to radio stations: The role of communication in sense of place. Journal of Leisure Research, 47(1), 15-33.
23. Taylor, C.R. & Sarkees, M.E. (2016), Do bans on illuminated on-premise signs matter? Balancing environmental impact with the impact on businesses. International Journal of Advertising, 35(1): 61-73.
24. Tseng, P., Carmi, R., Cameron, I., Munoz, D. & Itti, L. (2009), Quantifying center bias of observers in free viewing of dynamic natural scenes. Journal of Vision, 9(7): 1-16.
25. Wheeler, A. (2012), Designing Brand Identity: An Essential Guide for the Whole Branding Team, 4th Ed. Hoboken, NJ: John Wiley & Sons.
26. Zhang, L., Tong, M., Marks, T., Shan, H., & Cottrell, G. (2008), SUN: A Bayesian framework for saliency using natural statistics. Journal of Vision, 8(7): 1-20.