Embed Size (px)
Citation preview

1
DO MICRO START-UPS FUEL JOB CREATION? CROSS-COUNTRY EVIDENCE FROM
THE DYNEMP EXPRESS DATABASE
Chiara Criscuolo1, Peter N. Gal
2 and Carlo Menon
3
This version: November 2014
VERY PRELIMINARY – PLEASE DO NOT CIRCULATE
Abstract: Exploiting a novel database recently built from national business registers by the OECD
with the support of an international network of experts, this paper investigates the growth dynamics
of micro-firms (employing less than 10 workers) across 16 countries. Results show that only a small
proportion of micro-firms manage to grow beyond ten employees, but those contribute
disproportionately to job creation. Econometric analysis focusing in particular to the role of age
confirms that young micro-firms – especially those below three years of age – are much more likely
to grow above 10 employees than older firms.
Keywords: Micro firms; Start-ups; Employment dynamics.
JEL codes: D22; L25; L26.
1 OECD, Science, Technology and Innovation Directorate. Email: [email protected]
2 OECD, Economics Department. Email: [email protected]
3 OECD, Science, Technology and Innovation Directorate; and Spatial Economics Research Center, LSE, UK. Email:
2
1. Introduction: up or out dynamics and the importance of start-ups for job creation
Start-ups are considered to be an important driver of job creation in all countries, as a significant
share of jobs is created by new entrants; furthermore, incumbent young firms are also generally net
job creators (Criscuolo, Gal and Menon, 2014; Lawless, 2014). However, it is also known that a
significant share of them die within the very first years of life (Anyadike-Danes et al., 2013).
Therefore, the net contribution to job creation of start-ups needs to take into account both of these
phenomena that characterise the up-or-out-dynamics of young firms growth.
Cross-country evidence on the growth dynamics of start-ups is extremely limited (with Anyadike-
Danes et al., 2013 being a noteworthy exception). This paper investigates the growth dynamics of
micro-firms, i.e., firms employing less than 10 workers, over the time intervals 2001-4, 2004-7, and
2007-10 and across 16 countries.4 We look in particular at the differential growth patterns of micro-
firms (below ten employees) according to their age profile. This is possible thanks to a novel
database called DynEmp Express, recently constructed using national business registers by the
OECD with the support of an international network of experts. It contains detailed information on
transition dynamics for firms according to their age and size profiles.
The results show that only a tiny proportion – on average around 5% – of micro-firms, i.e. firms that
have between 1 and 9 employees, grow above 10 employees over a three-year period, and that this
share is almost twice as much for younger firms (less than three years old) than for firms aged 11
years or more. The substantially higher dynamism of start-ups is remarkably constant over time and
is not significantly affected by the crisis.
The reason for looking at micro-firms is manifold. First, micro-firms are an important component of
industrialized economies. They represent 70 to 90% of the firm population across 18 countries in the
sample, and they account for 10 to 40% of employment (Criscuolo, Gal, and Menon, 2014). Second,
existing evidence also suggests that among micro-firms, those that are young – and start-ups in
particular – contribute significantly to net job creation. Third, the nature of the data for micro-firms
in the DynEmp Express database is particularly well suited for such a targeted analysis, since it
relates to a narrowly-defined and at the same time densely populated group of firms. Potential
measurement issues related to firm age are also somewhat mitigated in the case of this group, as new
firm creation by mergers and acquisitions is more likely to occur at larger sizes.
There are important cross-country differences in the degree to which young firms contribute to
employment growth. While entrants do not show remarkable differences in average size across
countries, enabling the most productive start-ups to scale up is key to aggregate employment and
productivity growth (Criscuolo, Gal and Menon, 2014; Hsieh and Klenow, 2012). Also, start-up rates
present some interesting differences across countries and a decreasing trend over time in most
countries (Haltiwanger, Jarmin and Miranda, 2013 for the US; Criscuolo, Gal and Menon, 2014 for
evidence across 18 countries).
4 Included countries are Austria, Belgium, Brazil, Canada, Finland, France, Hungary, Italy, Japan, Luxembourg, the
Netherlands, Norway, New Zealand, Portugal, Sweden and the United Kingdom.

3
By inspecting the growth pattern of micro firms, and especially micro start-ups, our paper provides
useful evidence for economic policies aimed at increasing business dynamism. In dynamic
economies, small start-ups are characterized by an “up or out” pattern: low entry barriers mean that
many ventures enter the market, experimenting with new business ideas. Most entrants exit few years
after birth, while a handful of very successful businesses grow very rapidly (Haltiwanger, Jarmin and
Miranda, 2013). Conversely, in more stagnant economies high entry barriers reduce the number of
entrants; the few new businesses who do manage to enter tend to be bigger and better capitalized.
However, stronger economic frictions and obstacles to resource reallocations may limit their ability
to attract employment and capital and to grow if successful (Andrews, Criscuolo, and Menon, 2014).
This results in lower exit rates but also lower growth, both at the firm and at the aggregate level.
Our work is also closely related to the debate on the “cleansing” vs. “scarring” effects of recessions.
Recessions may spur a cleansing process in the economy, as unproductive firms exit the market and
free up resources which could be employed by more productive firms, consistent with the well-
known theory of “creative destruction” (Schumpeter,1939). There is some evidence for the United
States suggesting that this process is actually in place. For instance, Davis and Haltiwanger (1992
and 1999) and Davis, Faberman and Haltiwanger (2006, 2012) find evidence of increased
reallocation in the manufacturing and service sector during recessions which occurred in the second
half of the 20th
century.
On the other hand, recessions may also have a “scarring” effect on the economy, impeding the
developments of potentially successful firms by destroying them during their infancy. The
disproportionate deaths among infant businesses which is often found during recessions may be
highly detrimental to growth also in the medium to long run. The reason is that some of these young
firms are the ones who have the highest potential to achieve high productivity growth over time,
even if appearing less productive in the short run (Ouyang, 2009). Our paper tests for differential
effects of the crisis along the age dimension and does not find either significant cleansing or scarring
effects.
Section 2 below describes the data, followed by the descriptive and econometric analysis in Sections
3 and 4, respectively. The final section concludes.
2. Data
2.1. DynEmp: a distributed micro-data analysis approach
The OECD has embarked on a project called the Dynamics of Employment (DynEmp) based on
confidential firm level data from national business registers. The project aims at providing new
empirical evidence on firm employment growth dynamics; the contribution to job creation and
destruction by different groups of firms; and the upscaling of young businesses, with a particular
emphasis on the cross-country dimension of both the data collection exercise – and therefore on
harmonization - and of the analysis. A detailed description of the project is available in Criscuolo,
Gal, and Menon (2014).
4
2.2. The DynEmp Express database
The dataset used for this paper has been produced during the first phase of the DynEmp project, and
is based on the “DynEmp Express” Stata routine.5 The routine has been run by national
representatives on business registers or comparable data sources during the first quarter of 2013, a
methodology often referred to as distributed microdata analysis (Bartelsman, Haltiwanger and
Scarpetta, 2004).
The “DynEmp Express” database includes data for the following economies: Austria, Belgium,
Brazil, Canada, Finland, France, Hungary, Italy, Japan, Luxembourg, the Netherlands, New Zealand,
Norway, Portugal, Spain, Sweden, the United Kingdom and the United States. The default period is
2001-2011, however for some countries the late or early years are not available. There are some
qualifications regarding the coverage, which are reported in Table A1. Spain is not included in this
paper as transition matrices have been produced in a different format and were not exactly
comparable with those of other countries.
DynEmp Express collects statistics aggregated to the level of the three broad macroeconomic sectors
(manufacturing, construction, and market services excluding financial services), by year, size class
or/and age class and distinguishing between entry, incumbent and exiting firm status.
2.2.1. The transition matrices
This paper focuses on one specific output of the DynEmp Express routine, which is a set of
transition matrices for three time periods: 2001-2004; 2004-2007 and 2007-2010. For each age class,
these matrices report the number of units completing a transition from employment size class j to
size class k, their total employment at the beginning and at the end of the period, and their median
size. The “entering” category includes those firms which did not exist at the beginning of the period;
symmetrically, the “exiting” category at the end of the period includes those firms which do not exist
or are inactive at the end of the three year period under consideration.
2.3. Caveats
The dataset comes with some caveats stemming from the inherent difficulties in harmonizing certain
definitions across countries, despite our best efforts to homogenize the data collection by use of a
single program routine. One of this involves the issue of confidentiality blanking. For the great
majority of countries in the database cells that are scarcely populated – i.e., which contain less than a
specified number of units (e.g., 5 or 10) – are blanked. In addition, disclosure also conforms to
secondary disclosure and dominance rules, i.e. at possible disclosure due to residual confidentiality
and to presence of high concentration amongst very few firms. When looking at micro-firms the
issue is generally negligible, due to the sheer size of the reference population. However, in the
specific case of the United States the blanking is much more prevalent than in all other countries as it
follows more complex criteria that are themselves confidential, and that do not only depend on the
number of units contained in the cell. To the extent that coverage for the United States is selected by
5 See the documentation of the DynEmp v2 routine in Criscuolo, Gal and Menon (2014b), which also includes as an
option the DynEmp Express run.
5
the blanking in a non-random manner, this could lead to a bias in the results. We were therefore
forced to exclude United States from the main database to ensure comparability, but we report the
results from the full data in the robustness section.
A second caveat relates to the age variable and to the definition of entry and exit. Firms that enter,
i.e. that appear for the first time in the business registers, may or may not indicate genuine economic
births of new businesses, in the traditional sense of being created de-novo by entrepreneurial
managers. They may reflect spurious births due to problems of coding errors in the source data, or
breaks in the registers’coding. They may also reflect the birth of new legal entities such as spinoffs
from a larger company; a creation of a new firm as part of an enterprise group (e.g. a greenfield
investment); the merger of more companies; the restructuring of an existing firm or the renaming of a
company under a different name. Similar issues apply for the definition of exit. To the extent that in
some countries, sectors, or time periods, spurious entry and/or exit events are more frequent, the data
may show more churning activity and a younger business population than what would actually be
recorded with better quality data. However, the work done so far on the DynEmp Express database
(Criscuolo, Gal, and Menon, 2014) has shown that most of the general findings are robust to limiting
the sample to those countries for which the entry and exit information is considered to be more
precise. Moreover, the group of micro-firms below ten employees – the main focus of the current
analysis – is less prone to some of these issues, as they are less likely to be a result of mergers or
acquisitions, typically occurring among larger firms.
Finally, a third caveat relates specifically to the transition matrices. The category of firms that are
classified as “inactive” at the end of the period include firms that are not in the business register both
because they have ended business, and because their employment record is missing in that particular
year. Those firms could be only temporarily inactive. As a consequence, the fraction of firms
appearing as inactive may overstate true exit rates. This is the reason we prefer to use the term
inactive rather than exiting for this group of firms. However, the focus of our analysis is on within
country patterns by firm age and over time, and not on the comparison of inactivity rates per se
across countries.
3. Descriptive analysis
The analysis of the transition matrices across employment in different size classes allows for a
detailed description of the growth dynamics of firms of different age, initial size, sector, and country.
The fact that most firms remain in the same size class over the three year period considered might
partly reflect the tendency for the initial median size of businesses in each size class to be towards
the lower bracket of the size interval. However, the econometric analysis in the next section also
shows that stable firms have a much lower weight in terms of net job creation than the smaller
number of firms which are growing (as in the case of micro start-ups discussed above). This suggests
that stable firms also grow less, on average, than those who move up to a higher size class.
Significant differences exist in the share of these fast growing firms and in their weight in terms of
employment both within and across countries.

6
3.1. The dynamics of micro start-ups
This Section focuses on a specific subset of the transition matrix dataset, i.e., the transition dynamics
of start-ups (firms aged 0 to 2 at the beginning of the period) with less than 10 employees.
In a dynamic economy, a substantial share of start-ups exit within the first few years of activity, but
those who survive grow very rapidly, more than compensating the jobs destroyed by those that fail.
These “up or out” dynamics have been recently documented for young firms in the US, but Figure 2
shows the importance of this phenomenon in all 16 countries considered as well as differences across
them both in terms of number of firms and jobs involved.
Figure 2 and Figure 3 further disentangle the analysis for micro start-ups for the three cohorts over
time. Figure 1 panel a and Figure 2 reports the share of firms in each transition group (moving above
10 employees, staying below 10 employees, becoming inactive) in the total number of firms, while
Figure 1 panel b and Figure 3 report the relative contribution to net job creation (CNJC) for each
transition group i, calculated as follows:
𝐶𝑁𝐽𝐶𝑖 =𝑁𝑒𝑡𝐽𝑜𝑏𝑉𝑎𝑟𝑖
∑ |𝑁𝑒𝑡𝐽𝑜𝑏𝑉𝑎𝑟𝑖|𝑖 (1)
where NetJobVari is the net job variation (equal to the difference between gross job creation and
gross job destruction) in the transition group i, and the denominator is the sum of the absolute values
of the net job variations across the three groups.
Three main features are worth noting: firstly, very few micro start-ups – between 2% and 9% –
grow above 10 employees, but their contribution to employment change ranges from 19% to 54%;
secondly, stable firms still create a reasonable amount of jobs, but their contribution is less than
proportional to their weight in terms of number of firms, and for some cohorts and countries they
actually contribute negatively to net job creation; thirdly, the extent to which micro start-ups survive
is very different across countries.
Figure 1. Three-year survival and growth performance of micro start-ups
a. Share of firms b. Share of jobs affected
-80
-60
-40
-20
0
20
40
60
80
100
Moving above 10 Staying below 10 Inactive%
100
%
-80
-60
-40
-20
0
20
40
60
80
100
Moving above 10 Staying below 10 Inactive%

7
Notes: Average over the three 3-year periods. Figures refer to the group of firms which have between 0 and 9 employees
in the beginning of the period and which are less than 3 years old. Inactive firms do not report information on
employment at the end of the three year period, either because they are temporarily inactive or because they have
permanently exited. Sectors covered are: manufacturing, construction, and non-financial business services. Owing to
methodological differences, figures may deviate from officially published national statistics. For Japan data are at the
establishment level, for other countries at the firm level.
Source: OECD DynEmp database.
Figure 2. Three-year survival and growth performance of micro start-ups, 2001, 2004, 2007
Share of firms by status 3 years later
Notes: stable firms belong to the same size category (0-9) at the end of the three year period; growing firms belong to a
higher size category at the end of the three year period; inactive firms do not report information on employment at the
end of the three year period, either because they are temporarily inactive or because they have permanently exited.
Sectors covered are: manufacturing, construction, and non-financial business services. Owing to methodological
differences, figures may deviate from officially published national statistics. For Japan data are at the establishment level,
for other countries at the firm level.
Source: OECD DynEmp database.
8
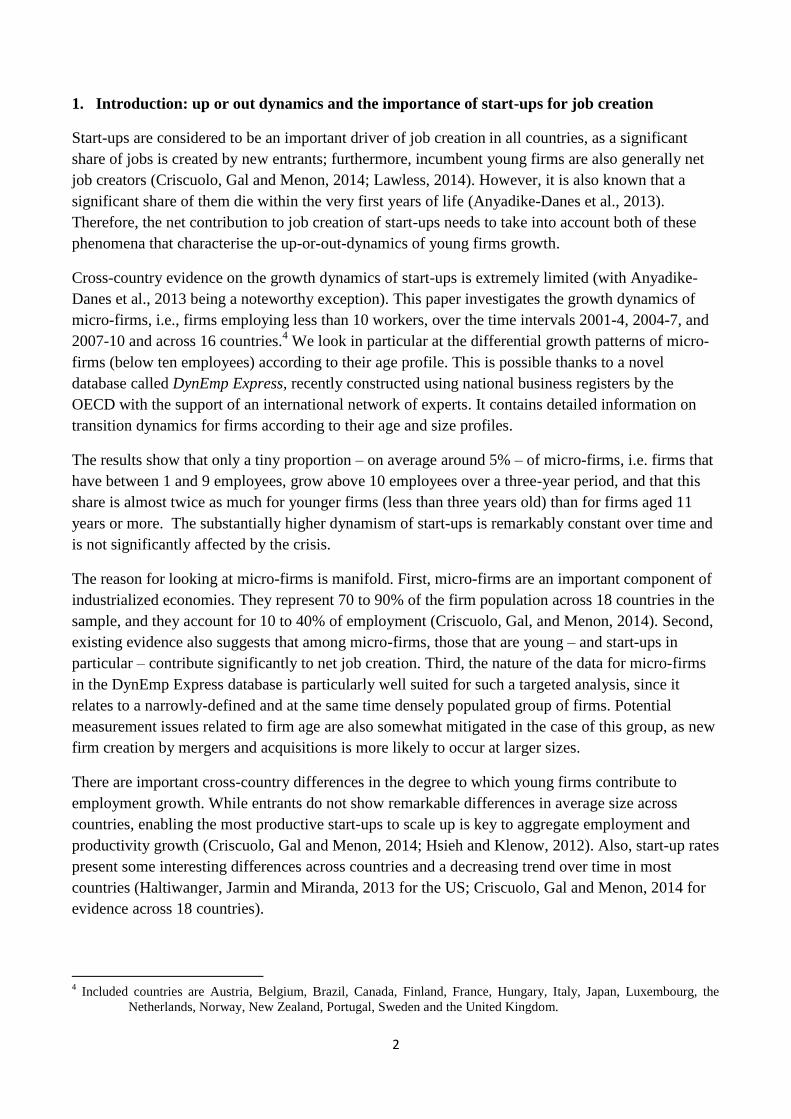
Figure 3. Three-year survival and growth performance of micro start-ups, 2001, 2004, 2007
Contribution to employment change by firm status 3 years later
Notes: stable firms belong to the same size category (0-9) at the end of the three year period; growing firms belong to a
higher size category at the end of the three year period; inactive firms do not report information on employment at the
end of the three year period, either because they are temporarily inactive or because they have permanently exited.
Sectors covered are: manufacturing, construction, and non-financial business services. Owing to methodological
differences, figures may deviate from officially published national statistics. For Japan data are at the establishment level,
for other countries at the firm level. Data for Canada refer only to organic employment changes and abstract from merger
and acquisition activity.
Source: OECD DynEmp database.
3.1.1. Changes over time
The probability of becoming inactive has increased in the period 2007-2010, affected by the outburst
of the international financial crisis in late 2007 and the subsequent enduring recession or slow
recovery in many countries (Figure 3 panel a.). On the contrary, the share of growing firms appears
to be more stable over the three periods. This pattern, therefore, suggests that the crisis had a stronger
impact on the exit margin in the economy, with a stronger selection process leading to higher exit
rates and and only minor effects on upscaling start-ups. This seems in line with the presence of a
cleansing process whereby low productivity firms are let out of the market. To answer the question
of whether this increased exit rates were productivity enhancing one should look at whether the firms

9
that exit where on average the least productive and whether average productivity increased after the
recession. Recent evidence from the US suggest that the crisis was accompanied productivity
enhancing reallocation; for Europe recent evidence (Andrews et al., 2015) suggests that for Europe
this was also the case.The subsequent econometric analysis takes a closer look at these patterns.
Figure 4. Three-year survival and growth performance of micro start-ups over time
a. Share of firms b. Share of jobs affected
Notes: Average across countries, excluding those for which data is not available in all three periods (France, Japan,
Portugal and the United Kingdom). Figures refer to the group of firms which have between 0 and 9 employees in the
beginning of the period and which are less than 3 years old. Inactive firms do not report information on employment at
the end of the three year period, either because they are temporarily inactive or because they have permanently exited.
Sectors covered are: manufacturing, construction, and non-financial business services. Owing to methodological
differences, figures may deviate from officially published national statistics. For Japan data are at the establishment level,
for other countries at the firm level.
Source: OECD DynEmp database.
4. Econometric analysis
This section explores in more detail the descriptive findings illustrated so far with a simple set of
regression models. The unit of observation is each age class × macrosector × country × time period
combination available in the dataset for the size class of 1-9 employees. The dependent variables are
the shares of the different transition groups (moving above 10; staying below 10; becoming inactive)
and their contribution to net job variation. The main independent variables are a set of dummies for
age categories and possibly their interactions with dummies for time periods or sectors.
Formally, the estimated equations have the following form:
𝑦𝑖𝑘𝑐𝑡 = 𝛼 + 𝛽 ∗ l og(𝑎𝑣𝑠𝑖𝑧𝑒)𝑖𝑘𝑐𝑡 + 𝛾𝑖 + 𝛿𝑘 + 𝜏𝑡 + 𝜑𝑐 (2)
where i indexes age classes, k macrosectors, c countries, and t time periods. The dependent variable
is either the share of firms moving up; the share of firms staying in the same size-class or the share of
20
25
30
35
40
45
50
30
35
40
45
50
55
60
2001-2004 2004-2007 2007-2010
Ina
cti
ve
Mo
vin
g a
bo
ve 1
0
Moving above 10
Inactive% %
15
18
21
24
27
30
0
3
6
9
12
15
2001-2004 2004-2007 2007-2010
Ina
cti
ve
Mo
vin
g a
bo
ve 1
0
Moving above 10
Inactive% %
10
firms becoming inactive. The analogues of these measures for job variation are also potential
dependent variables: the net job contribution of firms moving up; of those staying in the same size-
class; or of those becoming inactive. Net job contributions are defined as the net job variation of the
specific transition group over the total employment (average of initial and final value) of all
transition groups in the same country, sector, period, age and size class.
γ is a set of age class dummies, with age classes equal to 0-2; 3-5; 6-10; and 11 or more. δ is a set of
macro-sector dummies (manufacturing, non-financial business services, construction). τ is a set of
dummies for each of the three time period considered: 2001-4, 2004-7, 2007-10. Finally, the variable
avsize measures the average size of the firms in the specific cell, and is meant to control for the
higher probability of bigger firms to move up.
4.1. Main results for micro firms (0-9)
The equation is estimated by a two-limit Tobit model when the dependent variables are the shares of
firms, as those are bounded between zero and one. When the dependent variable is instead the job
contribution, a traditional Ordinary Least Squares (OLS) model is used.
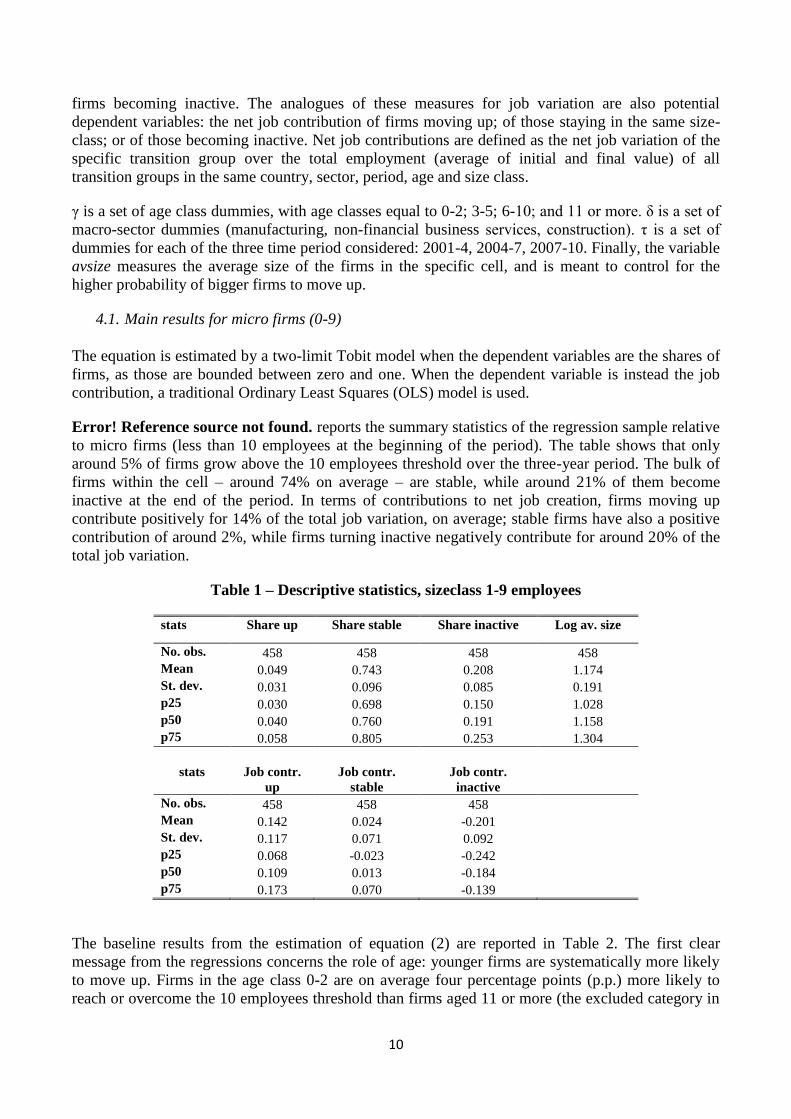
Error! Reference source not found. reports the summary statistics of the regression sample relative
to micro firms (less than 10 employees at the beginning of the period). The table shows that only
around 5% of firms grow above the 10 employees threshold over the three-year period. The bulk of
firms within the cell – around 74% on average – are stable, while around 21% of them become
inactive at the end of the period. In terms of contributions to net job creation, firms moving up
contribute positively for 14% of the total job variation, on average; stable firms have also a positive
contribution of around 2%, while firms turning inactive negatively contribute for around 20% of the
total job variation.
Table 1 – Descriptive statistics, sizeclass 1-9 employees
stats Share up Share stable Share inactive Log av. size
No. obs. 458 458 458 458
Mean 0.049 0.743 0.208 1.174
St. dev. 0.031 0.096 0.085 0.191
p25 0.030 0.698 0.150 1.028
p50 0.040 0.760 0.191 1.158
p75 0.058 0.805 0.253 1.304
stats Job contr.
up
Job contr.
stable
Job contr.
inactive
No. obs. 458 458 458
Mean 0.142 0.024 -0.201
St. dev. 0.117 0.071 0.092
p25 0.068 -0.023 -0.242
p50 0.109 0.013 -0.184
p75 0.173 0.070 -0.139
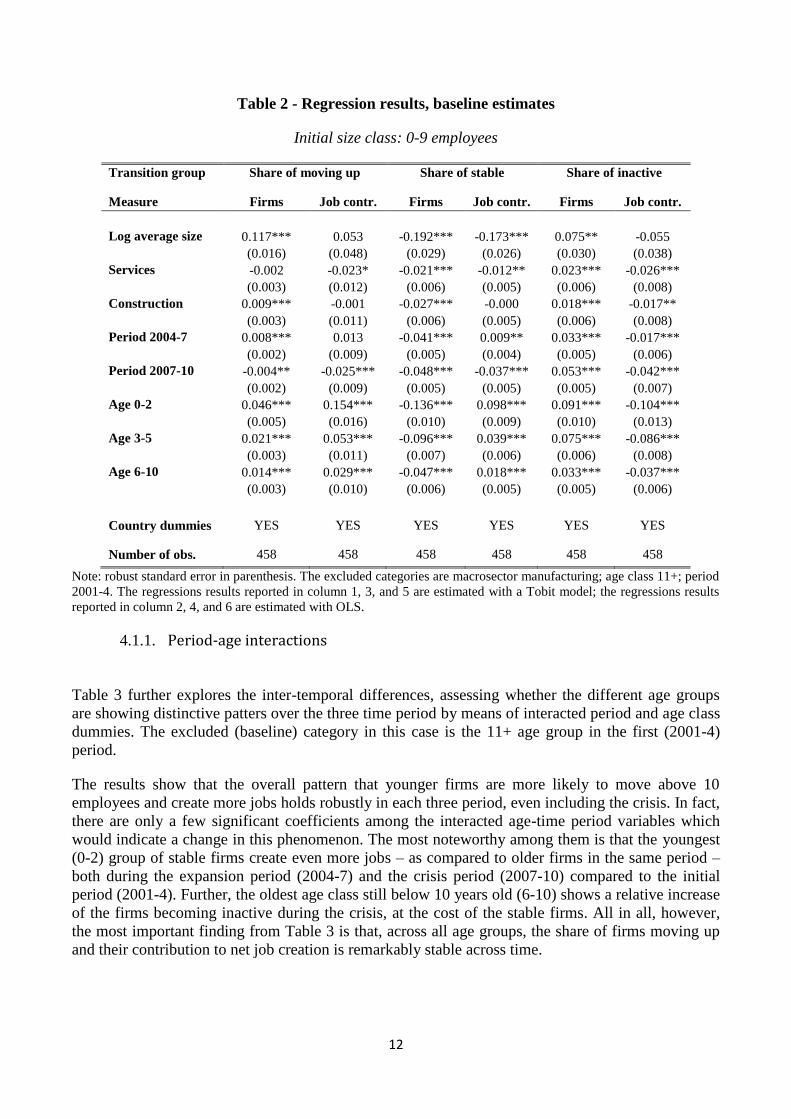
The baseline results from the estimation of equation (2) are reported in Table 2. The first clear
message from the regressions concerns the role of age: younger firms are systematically more likely
to move up. Firms in the age class 0-2 are on average four percentage points (p.p.) more likely to
reach or overcome the 10 employees threshold than firms aged 11 or more (the excluded category in

11
the regression). Firms in the age class 3-5 and 6-10 are two and one p.p. more likely to move up,
respectively, than firms in the 11+ class.
Younger firms are also less likely to stay in the same size class, and more likely to become inactive
at the end of the period. Namely, firms below aged two or less are 13 p.p. less likely to be stable than
firms aged 11 or more; while are 9 p.p. more likely to be inactive at the end of the period.
The higher probability of younger firms to move up is also reflected in the analysis of the job
variation contribution. Among the group of firms that move up, those in the age class 0-2 contribute
to job variation for 15 p.p. more than firms in the age class 11+. The same is true also for firms aged
3-5 and 6-10, although the difference is quantitatively much smaller (equal to five and three p.p.,
respectively). This implies that, among younger firms, the contribution to net job growth is
relatively more important than among older firms.
The results on the relative job contribution also show that, among stable firms, i.e. firms that do not
overcome the threshold of 10 employees over the three year period, younger firms are growing much
more than older firms. This can be deducted from the positive coefficients on net job contribution on
age class dummies. Put differently, although there are fewer stable firms in younger age classes, they
create relatively more employment (or destroy less) than firms aged 11 or more.
Table 2 also shows interesting differences across time periods, enriching the patterns presented in
Figure 3. In the expansion period (2004-7), there was a tiny – but statistically significant – increase
in the number of firms moving up, and a larger increase – of around three p.p. – in the number of
inactive firms, counterbalanced by a contraction of around four p.p. of the share of stable firms. In
the period mostly dominated by the Great Recession (2007-10), there was a marginal contraction of
the share of firms moving up, and a more significant decrease in the share of stable firms, mirrored
by a substantial increase (four p.p.) of the share of firms becoming inactive. The decrease of the
share of firms moving up and of stable firms is also reflected by a correspondent decline in their
respective job creation; symmetrically, the increase in the share of firms becoming inactive is
reflected by a negative coefficient on the job contribution of inactive firms during the crisis. Finally,
the sum of the three coefficients on the different age class dummies across the three transition groups
gives the total contribution to net job creation with respect to the excluded category, i.e., the 11+ age
class. The value is equal to around 15 p.p. for the age class 0-2, and it is very close to zero for the 3-5
and 6-10 age classes.
12
Table 2 - Regression results, baseline estimates
Initial size class: 0-9 employees
Transition group Share of moving up Share of stable Share of inactive
Measure Firms Job contr. Firms Job contr. Firms Job contr.
Log average size 0.117*** 0.053 -0.192*** -0.173*** 0.075** -0.055
(0.016) (0.048) (0.029) (0.026) (0.030) (0.038)
Services -0.002 -0.023* -0.021*** -0.012** 0.023*** -0.026***
(0.003) (0.012) (0.006) (0.005) (0.006) (0.008)
Construction 0.009*** -0.001 -0.027*** -0.000 0.018*** -0.017**
(0.003) (0.011) (0.006) (0.005) (0.006) (0.008)
Period 2004-7 0.008*** 0.013 -0.041*** 0.009** 0.033*** -0.017***
(0.002) (0.009) (0.005) (0.004) (0.005) (0.006)
Period 2007-10 -0.004** -0.025*** -0.048*** -0.037*** 0.053*** -0.042***
(0.002) (0.009) (0.005) (0.005) (0.005) (0.007)
Age 0-2 0.046*** 0.154*** -0.136*** 0.098*** 0.091*** -0.104***
(0.005) (0.016) (0.010) (0.009) (0.010) (0.013)
Age 3-5 0.021*** 0.053*** -0.096*** 0.039*** 0.075*** -0.086***
(0.003) (0.011) (0.007) (0.006) (0.006) (0.008)
Age 6-10 0.014*** 0.029*** -0.047*** 0.018*** 0.033*** -0.037***
(0.003) (0.010) (0.006) (0.005) (0.005) (0.006)
Country dummies YES YES YES YES YES YES
Number of obs. 458 458 458 458 458 458
Note: robust standard error in parenthesis. The excluded categories are macrosector manufacturing; age class 11+; period
2001-4. The regressions results reported in column 1, 3, and 5 are estimated with a Tobit model; the regressions results
reported in column 2, 4, and 6 are estimated with OLS.
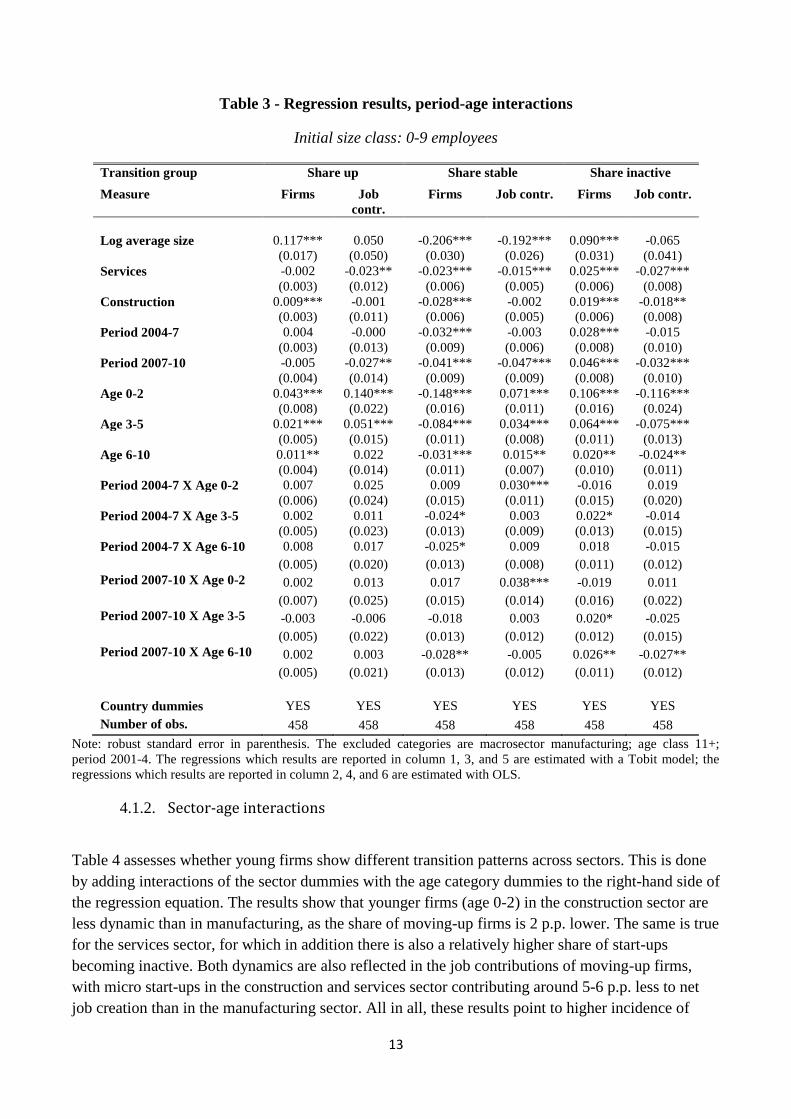
4.1.1. Period-age interactions
Table 3 further explores the inter-temporal differences, assessing whether the different age groups
are showing distinctive patters over the three time period by means of interacted period and age class
dummies. The excluded (baseline) category in this case is the 11+ age group in the first (2001-4)
period.
The results show that the overall pattern that younger firms are more likely to move above 10
employees and create more jobs holds robustly in each three period, even including the crisis. In fact,
there are only a few significant coefficients among the interacted age-time period variables which
would indicate a change in this phenomenon. The most noteworthy among them is that the youngest
(0-2) group of stable firms create even more jobs – as compared to older firms in the same period –
both during the expansion period (2004-7) and the crisis period (2007-10) compared to the initial
period (2001-4). Further, the oldest age class still below 10 years old (6-10) shows a relative increase
of the firms becoming inactive during the crisis, at the cost of the stable firms. All in all, however,
the most important finding from Table 3 is that, across all age groups, the share of firms moving up
and their contribution to net job creation is remarkably stable across time.
13
Table 3 - Regression results, period-age interactions
Initial size class: 0-9 employees
Transition group Share up Share stable Share inactive
Measure Firms Job
contr.
Firms Job contr. Firms Job contr.
Log average size 0.117*** 0.050 -0.206*** -0.192*** 0.090*** -0.065
(0.017) (0.050) (0.030) (0.026) (0.031) (0.041)
Services -0.002 -0.023** -0.023*** -0.015*** 0.025*** -0.027***
(0.003) (0.012) (0.006) (0.005) (0.006) (0.008)
Construction 0.009*** -0.001 -0.028*** -0.002 0.019*** -0.018**
(0.003) (0.011) (0.006) (0.005) (0.006) (0.008)
Period 2004-7 0.004 -0.000 -0.032*** -0.003 0.028*** -0.015
(0.003) (0.013) (0.009) (0.006) (0.008) (0.010)
Period 2007-10 -0.005 -0.027** -0.041*** -0.047*** 0.046*** -0.032***
(0.004) (0.014) (0.009) (0.009) (0.008) (0.010)
Age 0-2 0.043*** 0.140*** -0.148*** 0.071*** 0.106*** -0.116***
(0.008) (0.022) (0.016) (0.011) (0.016) (0.024)
Age 3-5 0.021*** 0.051*** -0.084*** 0.034*** 0.064*** -0.075***
(0.005) (0.015) (0.011) (0.008) (0.011) (0.013)
Age 6-10 0.011** 0.022 -0.031*** 0.015** 0.020** -0.024**
(0.004) (0.014) (0.011) (0.007) (0.010) (0.011)
Period 2004-7 X Age 0-2 0.007 0.025 0.009 0.030*** -0.016 0.019
(0.006) (0.024) (0.015) (0.011) (0.015) (0.020)
Period 2004-7 X Age 3-5 0.002 0.011 -0.024* 0.003 0.022* -0.014
(0.005) (0.023) (0.013) (0.009) (0.013) (0.015)
Period 2004-7 X Age 6-10 0.008 0.017 -0.025* 0.009 0.018 -0.015
(0.005) (0.020) (0.013) (0.008) (0.011) (0.012)
Period 2007-10 X Age 0-2 0.002 0.013 0.017 0.038*** -0.019 0.011
(0.007) (0.025) (0.015) (0.014) (0.016) (0.022)
Period 2007-10 X Age 3-5 -0.003 -0.006 -0.018 0.003 0.020* -0.025
(0.005) (0.022) (0.013) (0.012) (0.012) (0.015)
Period 2007-10 X Age 6-10 0.002 0.003 -0.028** -0.005 0.026** -0.027**
(0.005) (0.021) (0.013) (0.012) (0.011) (0.012)
Country dummies YES YES YES YES YES YES
Number of obs. 458 458 458 458 458 458
Note: robust standard error in parenthesis. The excluded categories are macrosector manufacturing; age class 11+;
period 2001-4. The regressions which results are reported in column 1, 3, and 5 are estimated with a Tobit model; the
regressions which results are reported in column 2, 4, and 6 are estimated with OLS.
4.1.2. Sector-age interactions
Table 4 assesses whether young firms show different transition patterns across sectors. This is done
by adding interactions of the sector dummies with the age category dummies to the right-hand side of
the regression equation. The results show that younger firms (age 0-2) in the construction sector are
less dynamic than in manufacturing, as the share of moving-up firms is 2 p.p. lower. The same is true
for the services sector, for which in addition there is also a relatively higher share of start-ups
becoming inactive. Both dynamics are also reflected in the job contributions of moving-up firms,
with micro start-ups in the construction and services sector contributing around 5-6 p.p. less to net
job creation than in the manufacturing sector. All in all, these results point to higher incidence of
14
fast-growing firms in manufacturing, and to a higher inactivity rate at the end of the period in the
service sector.
4.2. Comparison with small firms (10-49)
In this section we compare the results obtained for the size class 1-9 with the results obtained by
estimating exactly the same specification on the size class 10-49. Compared with the size class 1-9,
the size class 10-49 is characterized by a lower share of firms moving up, although this is to some
extent probably an immediate result from the latter size class being much wider. (see
Table 5).
Another substantial difference with respect to the size class 1-9 is that now firms can also “move
down”, i.e., they can go below the 10 employees threshold. The results from the estimation of
Equation (2) on the size 10-49 sample for the baseline model are reported in Table 6. The new set of
results is remarkably similar; in particular, younger firms are still significantly more likely to move
to a higher size class (in this case, above the 49 employees threshold) at the end of the 3-year period.
Furthermore, younger firms are less likely to be stable and to move down, and are substantially more
likely to become inactive.
The results with contributions to net job variation by the different transition groups as dependent
variables basically mirror those with shares of firms, and are again aligned with the correspondent
results from the sample with the 1-9 sizeclass. Younger firms moving up – especially those less than
three years old – contribute significantly more to job creation than older firms in the same transition
group. Symmetrically, younger firms becoming inactive contribute much more to job destruction
than older firms sharing the same trajectory. Among stable firms, younger firms show a higher net
job contribution than older firms, similarly to the 1-9 size class.

15
Table 4 - Regression results, age-sector interactions
Initial size class: 0-9 employees
Transition group Share up Share stable Share inactive
Measure Firms Job
contr.
Firms Job
contr.
Firms Job
contr.
Log average size 0.119*** 0.054 -0.196*** -0.170*** 0.078*** -0.058
(0.016) (0.049) (0.029) (0.026) (0.030) (0.038)
Services 0.006* -0.008 -0.027*** 0.000 0.021** -0.021*
(0.004) (0.014) (0.009) (0.008) (0.009) (0.011)
Construction 0.016*** 0.017 -0.023** 0.001 0.007 0.000
(0.004) (0.016) (0.009) (0.008) (0.007) (0.008)
Period 2004-7 0.008*** 0.014 -0.042*** 0.009** 0.033*** -0.017***
(0.002) (0.009) (0.005) (0.004) (0.005) (0.006)
Period 2007-10 -0.004** -0.025*** -0.048*** -0.036*** 0.053*** -0.042***
(0.002) (0.009) (0.005) (0.005) (0.005) (0.007)
Age 0-2 0.060*** 0.194*** -0.137*** 0.106*** 0.077*** -0.081***
(0.006) (0.020) (0.011) (0.011) (0.011) (0.014)
Age 3-5 0.023*** 0.057*** -0.098*** 0.047*** 0.075*** -0.084***
(0.004) (0.014) (0.008) (0.008) (0.008) (0.010)
Age 6-10 0.017*** 0.028** -0.047*** 0.022*** 0.030*** -0.033***
(0.004) (0.013) (0.009) (0.007) (0.007) (0.008)
Construction X Age 0-2 -0.023*** -0.056*** 0.013 -0.021* 0.009 -0.017
(0.005) (0.021) (0.013) (0.011) (0.012) (0.015)
Construction X Age 3-5 -0.003 -0.005 0.006 -0.018** -0.003 0.001
(0.004) (0.020) (0.012) (0.009) (0.012) (0.014)
Construction X Age 6-
10 -0.005 -0.001 0.002 -0.010 0.003 -0.004
(0.004) (0.018) (0.012) (0.009) (0.010) (0.011)
Services X Age 0-2 -0.020*** -0.066** -0.015 0.001 0.035** -0.057***
(0.007) (0.026) (0.015) (0.014) (0.015) (0.021)
Services X Age 3-5 -0.003 -0.005 -0.000 -0.004 0.004 -0.007
(0.006) (0.025) (0.013) (0.012) (0.012) (0.014)
Services X Age 6-10 -0.004 0.002 -0.002 0.000 0.006 -0.008
(0.006) (0.022) (0.013) (0.011) (0.011) (0.011)
Country dummies YES YES YES YES YES YES
Number of obs. 458 458 458 458 458 458
Note: robust standard error in parenthesis. The excluded categories are macrosector manufacturing; age class 11+;
period 2001-4. The regressions which results are reported in column 1, 3, and 5 are estimated with a Tobit model; the
regressions which results are reported in column 2, 4, and 6 are estimated with OLS.
16
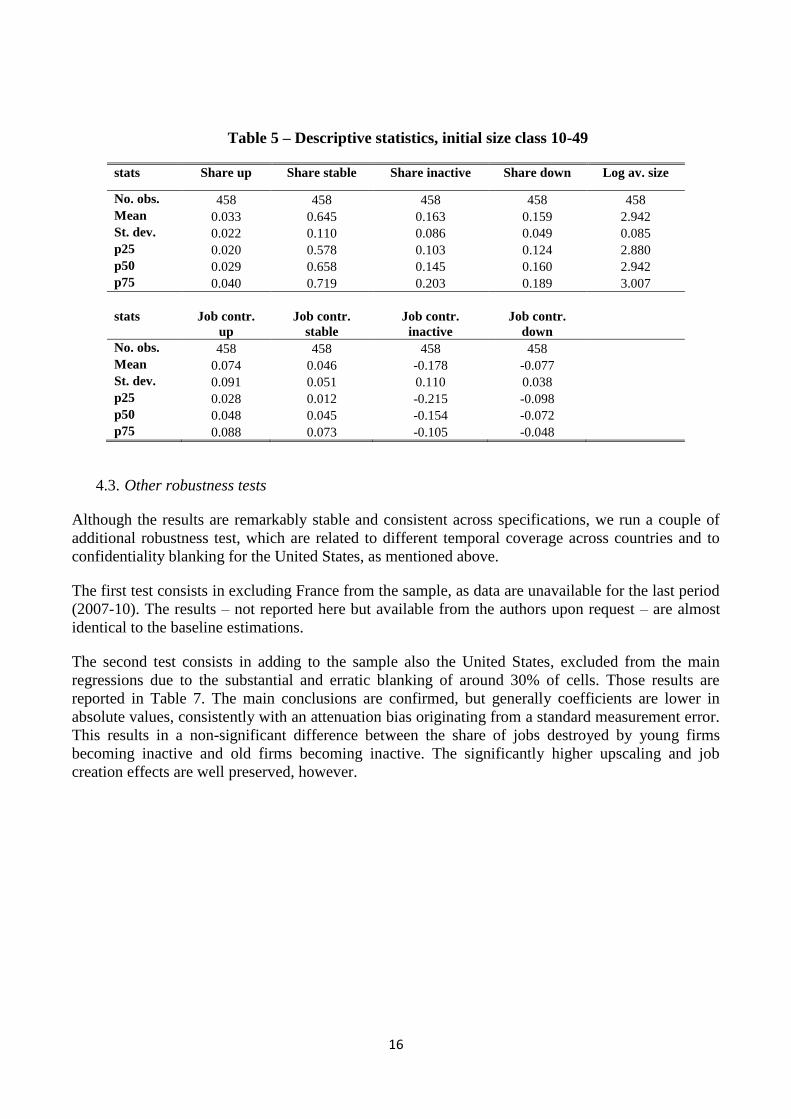
Table 5 – Descriptive statistics, initial size class 10-49
stats Share up Share stable Share inactive Share down Log av. size
No. obs. 458 458 458 458 458
Mean 0.033 0.645 0.163 0.159 2.942
St. dev. 0.022 0.110 0.086 0.049 0.085
p25 0.020 0.578 0.103 0.124 2.880
p50 0.029 0.658 0.145 0.160 2.942
p75 0.040 0.719 0.203 0.189 3.007
stats Job contr.
up
Job contr.
stable
Job contr.
inactive
Job contr.
down
No. obs. 458 458 458 458
Mean 0.074 0.046 -0.178 -0.077
St. dev. 0.091 0.051 0.110 0.038
p25 0.028 0.012 -0.215 -0.098
p50 0.048 0.045 -0.154 -0.072
p75 0.088 0.073 -0.105 -0.048
4.3. Other robustness tests
Although the results are remarkably stable and consistent across specifications, we run a couple of
additional robustness test, which are related to different temporal coverage across countries and to
confidentiality blanking for the United States, as mentioned above.
The first test consists in excluding France from the sample, as data are unavailable for the last period
(2007-10). The results – not reported here but available from the authors upon request – are almost
identical to the baseline estimations.
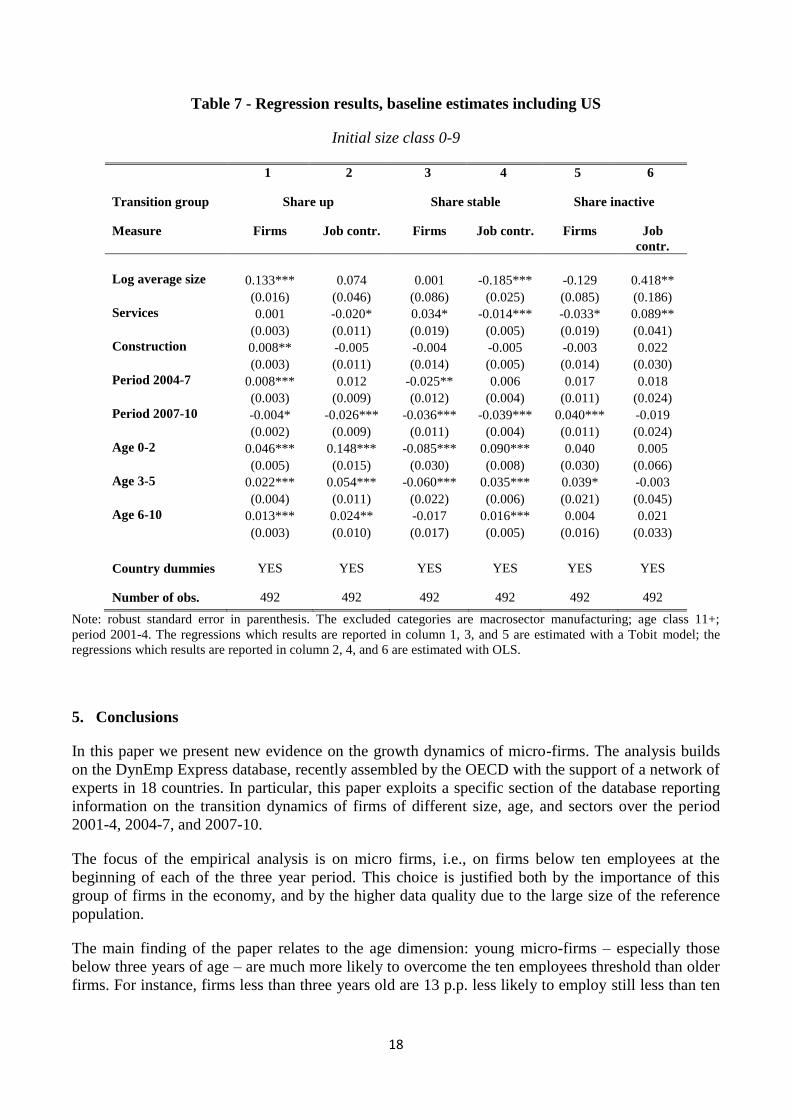
The second test consists in adding to the sample also the United States, excluded from the main
regressions due to the substantial and erratic blanking of around 30% of cells. Those results are
reported in Table 7. The main conclusions are confirmed, but generally coefficients are lower in
absolute values, consistently with an attenuation bias originating from a standard measurement error.
This results in a non-significant difference between the share of jobs destroyed by young firms
becoming inactive and old firms becoming inactive. The significantly higher upscaling and job
creation effects are well preserved, however.

17
Table 6 - Regression results, baseline estimates, small firms
Initial size class: 10-49 employees
1 2 3 4 5 6 7 8
Transition group Share up Share stable Share inactive Share down
Measure Firms Job
contr. Firms
Job
contr. Firms
Job
contr. Firms
Job
contr.
Log average size 0.206*** 0.410*** 0.109 -0.180*** -0.168*** 0.316*** -0.132*** 0.067**
(0.022) (0.091) (0.078) (0.036) (0.062) (0.088) (0.039) (0.031)
Services 0.017*** 0.053*** -0.035*** -0.001 -0.006 0.020* 0.027*** -0.018***
(0.002) (0.011) (0.009) (0.004) (0.008) (0.011) (0.005) (0.003)
Construction 0.012*** 0.040*** -0.040*** 0.004 0.005 0.000 0.024*** -0.017***
(0.003) (0.014) (0.011) (0.005) (0.009) (0.013) (0.006) (0.004)
Period 2004-7 0.008*** 0.002 0.010 0.021*** -0.009* 0.017** -0.009*** 0.005**
(0.002) (0.010) (0.007) (0.004) (0.005) (0.007) (0.004) (0.003)
Period 2007-10 -0.002 -0.013 -0.033*** -0.023*** 0.015** -0.024*** 0.021*** -0.014***
(0.002) (0.010) (0.007) (0.004) (0.006) (0.009) (0.004) (0.003)
Age 0-2 0.032*** 0.106*** -0.161*** 0.054*** 0.121*** -0.129*** 0.008 -0.025***
(0.003) (0.017) (0.010) (0.006) (0.008) (0.011) (0.005) (0.004)
Age 3-5 0.021*** 0.052*** -0.097*** 0.036*** 0.064*** -0.065*** 0.011** -0.019***
(0.003) (0.015) (0.010) (0.005) (0.007) (0.010) (0.005) (0.004)
Age 6-10 0.013*** 0.029** -0.052*** 0.020*** 0.028*** -0.024*** 0.011** -0.012***
(0.002) (0.013) (0.008) (0.004) (0.006) (0.008) (0.005) (0.004)
Country dummies YES YES YES YES YES YES YES YES
Number of obs. 458 458 458 458 458 458 458 458
Note: robust standard error in parenthesis. The excluded categories are macrosector manufacturing; age class 11+;
period 2001-4. The regressions which results are reported in column 1, 3, and 5 are estimated with a Tobit model; the
regressions which results are reported in column 2, 4, and 6 are estimated with OLS.
18
Table 7 - Regression results, baseline estimates including US
Initial size class 0-9
1 2 3 4 5 6
Transition group Share up Share stable Share inactive
Measure Firms Job contr. Firms Job contr. Firms Job
contr.
Log average size 0.133*** 0.074 0.001 -0.185*** -0.129 0.418**
(0.016) (0.046) (0.086) (0.025) (0.085) (0.186)
Services 0.001 -0.020* 0.034* -0.014*** -0.033* 0.089**
(0.003) (0.011) (0.019) (0.005) (0.019) (0.041)
Construction 0.008** -0.005 -0.004 -0.005 -0.003 0.022
(0.003) (0.011) (0.014) (0.005) (0.014) (0.030)
Period 2004-7 0.008*** 0.012 -0.025** 0.006 0.017 0.018
(0.003) (0.009) (0.012) (0.004) (0.011) (0.024)
Period 2007-10 -0.004* -0.026*** -0.036*** -0.039*** 0.040*** -0.019
(0.002) (0.009) (0.011) (0.004) (0.011) (0.024)
Age 0-2 0.046*** 0.148*** -0.085*** 0.090*** 0.040 0.005
(0.005) (0.015) (0.030) (0.008) (0.030) (0.066)
Age 3-5 0.022*** 0.054*** -0.060*** 0.035*** 0.039* -0.003
(0.004) (0.011) (0.022) (0.006) (0.021) (0.045)
Age 6-10 0.013*** 0.024** -0.017 0.016*** 0.004 0.021
(0.003) (0.010) (0.017) (0.005) (0.016) (0.033)
Country dummies YES YES YES YES YES YES
Number of obs. 492 492 492 492 492 492
Note: robust standard error in parenthesis. The excluded categories are macrosector manufacturing; age class 11+;
period 2001-4. The regressions which results are reported in column 1, 3, and 5 are estimated with a Tobit model; the
regressions which results are reported in column 2, 4, and 6 are estimated with OLS.
5. Conclusions
In this paper we present new evidence on the growth dynamics of micro-firms. The analysis builds
on the DynEmp Express database, recently assembled by the OECD with the support of a network of
experts in 18 countries. In particular, this paper exploits a specific section of the database reporting
information on the transition dynamics of firms of different size, age, and sectors over the period
2001-4, 2004-7, and 2007-10.
The focus of the empirical analysis is on micro firms, i.e., on firms below ten employees at the
beginning of each of the three year period. This choice is justified both by the importance of this
group of firms in the economy, and by the higher data quality due to the large size of the reference
population.
The main finding of the paper relates to the age dimension: young micro-firms – especially those
below three years of age – are much more likely to overcome the ten employees threshold than older
firms. For instance, firms less than three years old are 13 p.p. less likely to employ still less than ten

19
workers at the end of the period (i.e., to be stable) than firms aged 11 or more; while the former are 9
p.p. more likely to be inactive at the end of the period than the latter.
This paper also contributes to the debate of the “scarring” and “cleansing” effects of recessions.
During and in the aftermath of the Great Recession (i.e., over the period 2007-10) there was a
marginal contraction of the share of firms moving up, and a more significant contraction of the share
of stable firms, counterbalanced by a substantial increase of the share of firms becoming inactive.
Importantly, this pattern is substantially undifferentiated across age groups. Therefore, these results
suggest that the crisis had more a cleansing effect, rather than a scarring one. Indeed, micro-firms of
any age tend to exit more frequently, but young fast growing firms are only slightly affected.
This study opens a number of avenues for future research. First, it would be interesting to explore
these dynamics at a more disaggregated sectoral level (e.g., 2-digit industries) in order to assess
whether industry-specific characteristics – e.g., capital intensity, natural barrier to entries, innovation
activity – are linked to higher and lower dynamism and to different transition dynamics. Second, it
would be extremely informative to better characterize the scaling-up process of cohorts of small
start-ups over a longer time horizon across countries, in order to assess whether the “up-or-out”
process documented in great detail for the United States also holds in other countries. Finally, since
we know that fast-growing start-ups contribute disproportionally to job creation, it would of
paramount importance to better gauge how national polices and framework conditions affect their
birth and growth pattern.

20
References
Andrews D., C. Criscuolo and C. Menon (2014), “Do resources flow to Patenting Firms? Cross-
Country Evidence from Microdata”. OECD Economics Department Working Paper, no. 1127, June.
Bartelsman, E., J. Haltiwanger and S. Scarpetta (2004), “Microeconomic Evidence of Creative
Destruction in Industrial and Developing Countries”, TheWorld Bank, Policy Research Working
Paper Series: 3464.
Criscuolo, C., P. N. Gal and C. Menon (2014), "The Dynamics of Employment Growth: New
Evidence from 18 Countries", OECD Science, Technology and Industry Policy Papers, No. 14,
OECD Publishing.
Criscuolo, C., P. N. Gal and C. Menon (2014b), “DynEmp: A Stata® Routine for Distributed Micro-
data Analysis of Business Dynamics”, OECD Science, Technology and Industry Working Papers
2014/2, OECD Publishing.
Davis, S. J. and J. Haltiwanger (1992), “Gross Job Creation, Gross Job Destruction, and Employment
Reallocation.” The Quarterly Journal of Economics 107 (3): 819–63.
Davis, S. J., R. J. Faberman and J. Haltiwanger (2006), “The Flow Approach to Labor Markets: New
Data Sources and Micro–Macro Links.” Journal of Economic Perspectives 20 (3): 3–26.
Davis, S. J., R. J. Faberman and J. Haltiwanger (2012), “Labor Market Flows in the Cross Section
and over Time.” Journal of Monetary Economics, Carnegie-NYU-Rochester Conference Series on
Public Policy at New York University on April 15-16, 2011, 59 (1): 1–18
Davis, S. J. and J. Haltiwanger (1999), "Gross job flows," Handbook of Labor Economics, in:
O. Ashenfelter and D. Card (ed.), Handbook of Labor Economics, edition 1, volume 3, chapter 41,
pages 2711-2805.
Haltiwanger, J., R.S. Jarmin and J. Miranda (2013), “Who Creates Jobs? Small Versus Large Versus
young”, The Review of Economics and Statistics 95(2) 347-361
Hsieh, C.-T. and P. J. Klenow (2012), “The life cycle of plants in India and Mexico”. National
Bureau of Economic Research, Working Paper n. 18133.
Lawless, M., (2013), “Age or Size? Determinants of Job Creation,” Research Technical Papers
02/RT/13, Central Bank of Ireland.
Ouyang, M., (2009). "The scarring effect of recessions." Journal of Monetary Economics 56.2: 184-
199.

21
APPENDIX A: ADDITIONAL TABLES
Table A1. Data coverage of the DynEmp Express database
Country Period
covered Note
Austria 2001-2010 Companies have the choice of reporting either at the
enterprise or at the establishment level (see Stiglbauer, 2003).
Belgium 2001-2011
Brazil 2002-2010
Canada 2001-2011 Only a subset of statistics has been produced and
therefore the country could not be included in all graphs; see graph notes for further detail.
Finland 2001-2011
France 2002-2007
Hungary 2001-2011
Italy 2001-2010
Japan 2001-2009 Sectoral coverage is limited to manufacturing in the case of yearly job flow data for most years in the sample. Data
are at establishment level.
Luxembourg 2001-2010
Netherlands 2001-2011 Results are preliminary and data might be affected by
breaks in the longitudinal structure of the business register.
Norway 2001-2010
New Zealand 2001-2009
Portugal 2006-2011
Spain 2003-2009
Sweden 2001-2010
United Kingdom
2001-2011
United States 2001-2011