Embed Size (px)
Citation preview

Do Long-Term Investors Improve Corporate Decision Making?
JARRAD HARFORD, AMBRUS KECSKÉS, and SATTAR MANSI*
Abstract
We study the effect of investor horizons on a comprehensive set of corporate decisions. Long-term investors have the means and motive to monitor corporate managers, which generates corporate decisions that are consistent with shareholder value maximization. We find that long-term investors restrain numerous corporate misbehaviors such as earnings management and financial fraud and strengthen internal governance. They discourage a range of investment and financing activities but encourage payouts. Shareholders benefit through higher stock returns, greater profitability, and lower risk. Firms diversify their operations. We use a popular identification strategy to establish causality of our results.
February 1, 2015
JEL classification: G23, G31, G32, G34, G35 Keywords: Agency problems; Corporate governance; Monitoring; Managerial myopia; Institutional investors; Investor horizons; Corporate misbehavior; Internal governance; Investment; Financing; Off balance sheet debt; Debt maturity; Payouts; Valuation; Profitability; Volatility; Credit events; Organizational structure
* Harford is at the University of Washington, Kecskés is at the Schulich School of Business, York University, and Mansi is at Virginia Tech. We greatly appreciate the comments of Harrison Hong, Jon Karpoff, Alexander Ljungqvist, Paul Malatesta, Costanza Meneghetti, Lukasz Pomorski, Ed Rice, Vijay Singal, Roberto Wessels, and seminar participants at the 2013 Financial Management Association European Conference, the Hong Kong University of Science and Technology, and the University of Washington. We especially thank Laura Starks for her guidance. We are grateful to Patricia Dechow and the Center for Financial Reporting and Management for sharing data with us.

1
"Companies are most likely to describe their ideal shareholder as having a "long-term investment
horizon" but about half of companies' shareholder base has a short- or medium-term horizon …
Companies want long-term shareholders in particular because it allows them to implement their
corporate strategy and make long-term investments without the distraction and short-term
performance pressures that come from active traders." (Beyer, Larcker, and Tayan (2014))
1. Introduction
It is well established that managers of publicly traded firms, left to their own devices,
tend to maximize their private benefits of control rather than the value of their shareholders'
stake in the firm (Berle and Means (1932) and Jensen and Meckling (1976)). At the same time,
imperfectly informed market participants can lead managers to make myopic investment
decisions (Stein (1988)). Indeed, most managers admit that they are willing to sacrifice long-
term shareholder value for short-term profits (Graham, Harvey, and Rajgopal (2005)). Numerous
mechanisms have been proposed to counter this mismanagement problem. One of the most
important of these is monitoring by investors with long investment horizons (Drucker (1986),
Porter (1992), and Monks and Minow (1995)). By spreading both the costs and benefits of
ownership over a long period of time, such investors can be very effective at monitoring
managers (Gaspar, Massa, and Matos (2005) and Chen, Harford, and Li (2007)).
In this paper, we ask two basic questions. First, do long-term investors in publicly traded
firms improve corporate behavior? Second, does their influence on managerial decision making
improve returns to shareholders of the firm? To this end, we study a wide swath of corporate
behaviors.
According to theory, if long-term investors exert a positive influence on managers, we
should observe a decline in corporate misbehavior (such as financial fraud). We should also

2
observe an improvement in internal governance (for instance, in the quality of the board of
directors). However, regarding investment, financing, and payout decisions, the predictions of
theory are somewhat less clear (e.g., see Bebchuk and Stole (1993) regarding managerial
horizons and corporate investment).
The dominant view in the literature on manager-shareholder conflicts is that poorly
monitored managers will destroy shareholder value by overinvesting (Baumol (1959) and
Williamson (1964)). This empire building hypothesis has broad empirical support (e.g., Morck,
Shleifer, and Vishny (1990) and Gompers, Ishii, and Metrick (2003)). Another view holds that
managers will underinvest, under certain conditions, thereby also destroying shareholder value
(Holmström (1979) and Grossman and Hart (1983)). This quiet life hypothesis is supported
empirically as well (e.g., Bertrand and Mullainathan (2003) and Giroud and Mueller (2010)). We
let the data settle this debate about whether managers invest too much or too little.
Our view of financing, like that of Stulz (1990), is that it is determined by management's
investment decisions. In other words, managers that overinvest also raise too much financing,
and those that underinvest raise too little. Payouts should follow the opposite pattern to
financing, but only if managers mainly pursue a residual payout policy. If instead they
accumulate corporate resources in any event, then payouts should be higher with sufficient
monitoring by investors. Finally, theory clearly predicts that, on the whole, greater monitoring
should increase shareholder value, whether as a result of greater profitability or lower risk.
We test these predictions using a large panel of firm-years comprising an average of
roughly three thousand firms annually over close to thirty years. We follow the literature (e.g.,
Gaspar, Massa, and Matos (2005) and Chen, Harford, and Li (2007)), and we use portfolio
turnover to capture the investment horizons of investors and then group investors into short-term

3
or long-term categories based according to their investment horizons. We measure investor
horizons of firms as the ownership of their long-term investors. We also control for the total
ownership of institutional investors because their monitoring role is widely recognized in the
literature (Grossman and Hart (1980) and Shleifer and Vishny (1986)).
Since our study uses panel data, we design our empirical analysis from the start with the
objective of demonstrating causality. To this end, we perform all of our tests using not only long-
term investor ownership as a whole but also its plausibly exogenous part (while controlling for
its possibly endogenous part). Specifically, we establish causality based on the ownership of
long-term investors that index their portfolios (motivated by Aghion, Van Reenen, and Zingales
(2013) and several others). We describe our procedure in detail below.
In our analysis, we first examine corporate misbehavior. We find that long-term investors
reduce not only earnings management but also accounting misconduct, financial fraud, and
option backdating. Underscoring their monitoring role, we also find that long-term investors
improve internal governance. Specifically, they increase shareholder proposals, board quality,
and executive turnover.
Next, we examine investment. We find that long-term investors reduce investment, both
in tangible and intangible assets as well as through both organic and inorganic growth. They also
encourage firms to provide less trade credit to their suppliers and stockpile less inventory.
Altogether, firms invest less by about 2.0 percentage points of total assets.1 These results on
investment are consistent with the empire building hypothesis rather than the quiet life
hypothesis. Additionally, firms use relatively more labor than capital and spend comparatively
more on the former than the latter, consistent with the importance of human capital as a factor of
production in the modern economy (Zingales (2000)). 1 We report the effect of a one-standard deviation change in long-term investor ownership.

4
Long-term investors also reduce financing by roughly 1.4 percentage points. Balance
sheet and off balance sheet debt financing decrease, as does equity financing. These changes
coupled with a decrease in the maturity of debt leave firms more dependent on external financing
and thus more disciplined. At the same time, long-term investors increase payouts, both
dividends and share repurchases, by a total of approximately 0.6 p.p.
Next, we examine the value implications of long-term investors on corporate behavior by
looking at stock returns. In time-series regressions, a long-short portfolio formed based on
investor horizons earns positive abnormal returns of roughly 30 basis points per month. Excess
returns from cross-sectional regressions are also higher, by approximately one percentage point
per year.
We dig deeper to discover the source of these higher returns to shareholders: profitability
versus risk. We find that realized earnings are higher by about 0.5 percentage points of total
assets and are generated by sales growing faster than costs. The higher earnings of firms with
longer investor horizons are somewhat of a surprise to stock market participants. We also find
that earnings volatility is also lower by about 3.9% and is driven by a decrease in the volatility of
both sales and costs. Stock return volatility is lower as well, by roughly 2.7%, and is
corroborated by a decrease in extreme stock returns as well as a lower rate of covenant
violations, defaults, and bankruptcies.
Furthermore, we examine organizational structure to better understand the reduction in
risk. While theory has long argued that diversification can lower financial distress costs by
overcoming market imperfections (Lewellen (1971)), the conventional wisdom holds that
diversification should not affect shareholder value. Indeed, the early evidence has found that
diversification is value destroying (Lang and Stulz (1994) and Berger and Ofek (1995)), but

5
recent evidence has found the opposite (Denis, Denis, and Yost (2002), Mansi and Reeb (2002),
and Hann, Ogneva, and Ozbas (2013)). We find that long-term investors lead to greater
diversification along business, industry, and geographic lines as well as across customers and
products. Our results are consistent with inadequately monitored managers taking too much risk.
In summary, long-term investors increase shareholder value by raising profitability and lowering
risk.
We establish causality of our results using indexing by investors. Several recent papers
show that the ownership of investors that are indexers and investors in index firms affects
various market prices and corporate policies (see Kecskés, Mansi, and Nguyen (2014) for
details). As the literature shows, long-term investors that index their portfolios are relevant to
corporate behavior because they can influence corporate managers, but they are exogenous to
corporate behavior because they have no control over the composition of their portfolio. (We
explain this further below.) We implement our identification strategy by splitting long-term
investor ownership in two components: one that is exogenous and another that may be
endogenous. Using two different splits, our results are similar for both the plausibly exogenous
and possibly endogenous components, which suggests that our results are causal. Interpreted
another way, these splits establish that we are not simply identifying the effect of being in an
index, nor are our results driven by long-term investors choosing to invest in certain types of
firms.
The principal contributions of our paper are several. First, a large literature shows that
governance improvements lead to a decrease in corporate investment and growth (e.g., Morck,
Shleifer, and Vishny (1990), Lang, Poulsen, and Stulz (1995), Allen and McConnell (1998), and
Harford (1999)) and an increase in payouts (e.g., Denis (1990) and La Porta, Lopez-de-Silanes,

6
Shleifer, and Vishny (2000)). We show that long-term investors are an additional force for good
governance. Moreover, our findings indicate that corporate diversification and the accompanying
reduction in risk is value enhancing when managers are monitored, for instance, by long-term
investors. This contrasts with the generally unfavorable assessment of corporate diversification
(e.g., Amihud and Lev (1981), Aggarwal and Samwick (2003), and Low (2009)).
Second, investors have historically voted with their feet rather than voicing their
dissatisfaction with corporate management (Admati and Pfleiderer (2009) and Edmans (2009)).
Our findings show that long-term investors affect corporate behavior by occupying the middle
ground between exit and voice. They achieve similar results to other institutional investors
(Holderness and Sheehan (1985), Barclay and Holderness (1991), Bethel, Liebeskind, and Opler
(1998), Brav, Jiang, Partnoy, and Thomas (2008), and Klein and Zur (2009)). However, the
effect of long-term investors on corporate investment, financing, payouts, and performance takes
place with little publicity or confrontation.
Finally, we contribute to the growing literature on investor horizons, which examines
some specific consequences of long-term investors. For example, such investors relieve pressure
on firms to cut research and development expenditures to meet short-term earnings expectations
(Bushee (1998)). They also improve the outcomes of takeovers (Gaspar, Massa, and Matos
(2005) and Chen, Harford, and Li (2007)) and influence the tradeoff between dividends and
share repurchases (Gaspar, Massa, Matos, Patgiri, and Rehman (2012)). Likewise, they attenuate
the effect of mispricing on corporate policies (Derrien, Kecskés, and Thesmar (2013)). Indeed,
being publicly traded may distort corporate investment, innovation, and leadership behavior
(Asker, Farre-Mensa, and Ljungqvist (2014), Gao, Hsu, and Li (2014), and Gao, Harford, and Li

7
(2014)). Our paper is the first to show that long-term investors restrain a wide range of corporate
behaviors in publicly traded firms and thus prevent a significant destruction of shareholder value.
The rest of this paper is organized as follows. Section 2 presents the sample, data, and
variable measurements. Section 3 and Section 4 present the results for corporate decision making
and its value implications, respectively. Section 5 concludes.
2. Sample and Data
2.1. Sample Construction and Data Sources
We construct our sample as follows. We begin with all publicly traded U.S. firms in
CRSP and Compustat between 1985 and 2012. We keep U.S. operating firms defined as firms
with CRSP share codes of 10 or 11. We drop firms that are financials or utilities. This leaves our
sample of 95,463 firm-year observations comprising 11,206 unique firms between 1985 and
2012.
Our investor portfolio data are from Thomson's 13f filings, stock trading data are from
CRSP, factor returns data are from Ken French's website, accounting data are from Compustat,
and analyst data are from I/B/E/S. We use accounting misconduct data from the SEC AAER
database (see Dechow, Ge, Larson, and Sloan (2011) for details); financial fraud data from the
Stanford Securities Class Action Lawsuit database; and option backdating data from Lucian
Bebchuk's website (see Bebchuk, Grinstein, and Peyer (2010) for details). We also use
shareholder proposals data from RiskMetrics, director data from IRRC and RiskMetrics, and
executive turnover data from Execucomp. Covenant violations data are from Michael Roberts'
website (see Roberts and Sufi (2009) for details); default data are from the Compustat credit
ratings database; and bankruptcy data are from the SDC bankruptcy database. Segment data are
from the Compustat segments database. For brevity, we refer to institutional investors in

8
Thomson's 13f filings as "investors" unless otherwise specified. We winsorize all continuous
variables at the 1st and 99th percentiles.
2.2. Measuring Investor Horizons
Like Gaspar, Massa, and Matos (2005) and Chen, Harford, and Li (2007), we argue that
the costs of monitoring are lower and the benefits are higher for investors with longer horizons,
so they engage in greater monitoring. These costs include gathering information about firms and
influencing their behavior, and the benefits include better information, more efficient usage of
information, and greater influence with managers. As long as there are fixed costs of monitoring,
the net benefit of monitoring increases with the time an investor holds a firm in its portfolio.
We follow the aforementioned literature to measure investor horizons. We start at the
investor level by measuring the horizons of investors based on their portfolio turnover. For every
investor and every year, we look back three years and compute the fraction of the investor's
portfolio that is no longer held at the end of the period. This measure of the investor's portfolio
turnover ranges from zero to one. We then classify investors as short-term or long-term based on
their horizons. To this end, we use a portfolio turnover cutoff of 35% (similar to Froot, Perold,
and Stein (1992)). The distribution of investor horizons is stable over time, and our cutoff is
approximately the bottom quartile of investor turnover. By construction, short-term and long-
term investors collectively comprise all institutional investors. Finally, we measure investor
horizons at the firm level by aggregating the ownership of long-term investors in the firm. We
refer the reader to Derrien, Kecskés, and Thesmar (2013) for details.2
2 They also provide evidence of the validity of our measure of investor horizons by showing that it captures what is generally considered to be the horizon of many well known investors. For example, our measure typically classifies pension funds as long-term investors, consistent with pension funds being widely perceived to be long-term investors (80%-90% of the time). Similarly, hedge funds are usually classified as short-term by our measure, consistent with the widespread perception that hedge funds are short-term investors (95% of the time). (See Beyer, Larcker, and Tayan (2014) for these statistics.)

9
Furthermore, we replicate Figure 1 and Figure 3 of Derrien, Kecskés, and Thesmar
(2013) to demonstrate the persistence of investor horizons. First, at the investor level, we sort
investors into quartiles based on portfolio turnover and then compute the mean portfolio turnover
of the investors in each quartile during each of next twenty quarters. Our Figure 1 shows that
turnover increase gradually over time, but the relative ranking of investors by portfolio turnover
persists.
[Insert Figure 1 about here]
Second, at the firm level, we sort firms into quartiles based on long-term investor
ownership and then compute the mean long-term investor ownership of the firms in each quartile
during each of the next twenty quarters. Our Figure 2 shows that although there are slight
changes in ownership over time, the relative ranking of firms by long-term investor ownership
persists. The results are similar for short-term investor ownership. In summary, the results show
that it reasonable to treat horizons as characteristics at both the investor and firm levels.
[Insert Figure 2 about here]
2.3. Identifying Investor Horizons
We establish that investor horizons lead to improved corporate decision making by using
indexing by investors. This approach has been used to study, among other outcomes, capital
structure, payouts, and governance (Michaely and Vincent (2013), Crane, Michenaud, and
Weston (2014), Mullins (2014), and Appel, Gormley, and Keim (2014)). We refer the reader to
Kecskés, Mansi, and Nguyen (2014) for arguments and references supporting this identification
strategy. In this paper, we only provide a brief summary of this material.
Several early papers argue that indexers can affect corporate behavior (Carleton, Nelson,
and Weisbach (1998), Del Guercio and Hawkins (1999), and Gillan and Starks (2000)).

10
Engagements with firms by such investors tend to occur privately, which minimizes the public
attention they receive. These investors also interact with firms through shareholder votes, often
strengthened by block voting, vote trading, and advisory voting (Christoffersen, Geczy, Musto,
and Reed (2007), Matvos and Ostrovsky (2010), and Appel, Gormley, and Keim (2014)). These
low profile, high potency approaches can minimize the costs to investors of producing
information and exerting influence.
To implement our identification strategy, we split long-term investor ownership in two
components: one that is exogenous and another that may be endogenous. Our first split uses
indexers and non-indexers determined by Cremers and Petajisto (2009)'s active share measure.
Active share measures the difference in weights between the firms in the investor's portfolio and
the firms in the benchmark index. We use the CRSP value weighted index as the benchmark
index because institutional investors combine disparate lines of businesses (more akin to a
mutual fund family than an individual fund), so their holdings are best compared to the most
general stock market index available. We take this cross-sectional approach because we only
have holding data and not returns data for our investors and thus we cannot take a time-series
approach. To classify investors as indexers, we use an active share cutoff of 25% (similar to
Harford, Jenter, and Li (2011)).
Our second split uses index and non-index firms determined by their membership in the
S&P 500. If we use a split based on memberships in the Russell 1000 versus the Russell 2000,
we obtain similar results. However, since regression discontinuity design based on index
reconstitutions is still being explored (Appel, Gormley, and Keim (2014)), we use an indirect
implementation of this methodology. As the final step, we compute the ownership of firms by

11
long-term indexers and non-indexers as well as the long-term investor ownership of index firms
and non-index firms.
While we examine a large panel of firm-years, the ownership structure of a given firm is
relatively stable over time. This is evidenced by our finding that horizons at both the investor and
firm levels are highly persistent (Figure 1 and Figure 2, respectively). Therefore, rather than
attempting to identify corporate outcomes based merely on cross-sectional and/or time-series
changes in long-term investor ownership, our identification strategy ultimately depends on long-
term investors that index their portfolios and long-term investors in index firms.
2.4. Descriptive Statistics
[Insert Table 1 about here]
Table 1 presents descriptive statistics for our main independent and dependent variables.
We define all variables in Appendix Table 1, and we multiply them by 100. Institutional
ownership is 38.0% on average, and long-term investor ownership is 13.6% on average. The
latter breaks down into 4.9% and 8.7% for indexers and non-indexers, respectively. For index
firm and non-index firm ownership, the breakdown is 2.7% and 10.8%, respectively. In terms of
the distribution of our dependent variables, it is representative for a large sample of publicly
traded firms.
3. Results for Corporate Decision Making
3.1. Corporate Misbehaviors and Internal Governance
We begin our analysis by examining whether long-term investors reduce the occurrence
of corporate misbehaviors. We include earnings management as a mild manifestation of such
activities. We then proceed to accounting misconduct and financial fraud, which are well known
to destroy considerable shareholder value when they are eventually discovered (Dechow, Sloan,

12
and Sweeney (1996) and Karpoff, Lee, and Martin (2008)). We also include option backdating as
another instance of corporate behavior with significant economic ramifications (Yermack (1997),
Lie (2005), Heron and Lie (2007), and Narayanan and Seyhun (2008)).
As is customary, we measure earnings managements using discretionary accruals,
accounting misconduct using enforcement actions by the SEC, financial fraud using shareholder
lawsuits, and option backdating using suspiciously well timed option grants. The first variable is
expressed as a percentage of total assets and the next three variables are dummy variables that
equal one if they occur in a given firm-year and zero otherwise.
Throughout our empirical analysis, we regress each outcome of interest on long-term
investor ownership, which is the focus of our analysis. To avoid data mining concerns, we use a
specification that is standard in the literature as well as consistent across our analyses. In
particular, we begin by controlling for total institutional ownership.3 As additional controls, we
include size, market-to-book, cash-flow-to-total assets, stock returns, and volatility. We use
industry-year fixed effects to control for unobserved heterogeneity at the industry-year level.4
Finally, we cluster standard errors by industry-year to capture clustering across industries
and years concurrently. We multiply the dependent variables by 100. We standardize the
independent variables so that each coefficient estimate captures the effect of a one-standard
deviation change in long-term investor ownership.5
3 Total institutional ownership equals the sum of short-term and long-term investor ownership. By controlling for total institutional ownership in our regressions, long-term investor ownership isolates the effect of investor horizons. 4 On econometric grounds, the popular approach of including industry-year fixed effects dominates adjusting by the industry-year mean (Gormley and Matsa (2014)). 5 We are mindful of the possibility that investor horizons may be correlated with other governance mechanisms that affect corporate behavior. In untabulated robustness tests, we control for various prominent governance variables. Investor concentration does not appear to be an alternative explanation because we control for blockholder ownership and find similar results. Other governance variables include dual class stock ownership, antitakeover provisions, managerial incentive compensation, and managerial ownership. We control for these variables as well and find that they too are unable to explain our results. Data availability is the reason we do not include these variables in our empirical analysis. Including these variables decreases the sample size dramatically, by about 75%-

13
[Insert Table 2 about here]
Table 2 presents the results. For expositional simplicity, we only tabulate selected results.
Panel A shows that long-term investor ownership significantly reduces corporate misbehavior. In
particular, earnings management decreases by 0.28% of total assets or about 3% relative to its
mean. The rates of accounting misconduct and financial fraud decrease by 0.33 and 1.62,
respectively, or roughly 28% and 33% compared to their means. Finally, the incidence of option
backdating decreases by 1.45 or about 10% relative to its mean.6 The results are similar for long-
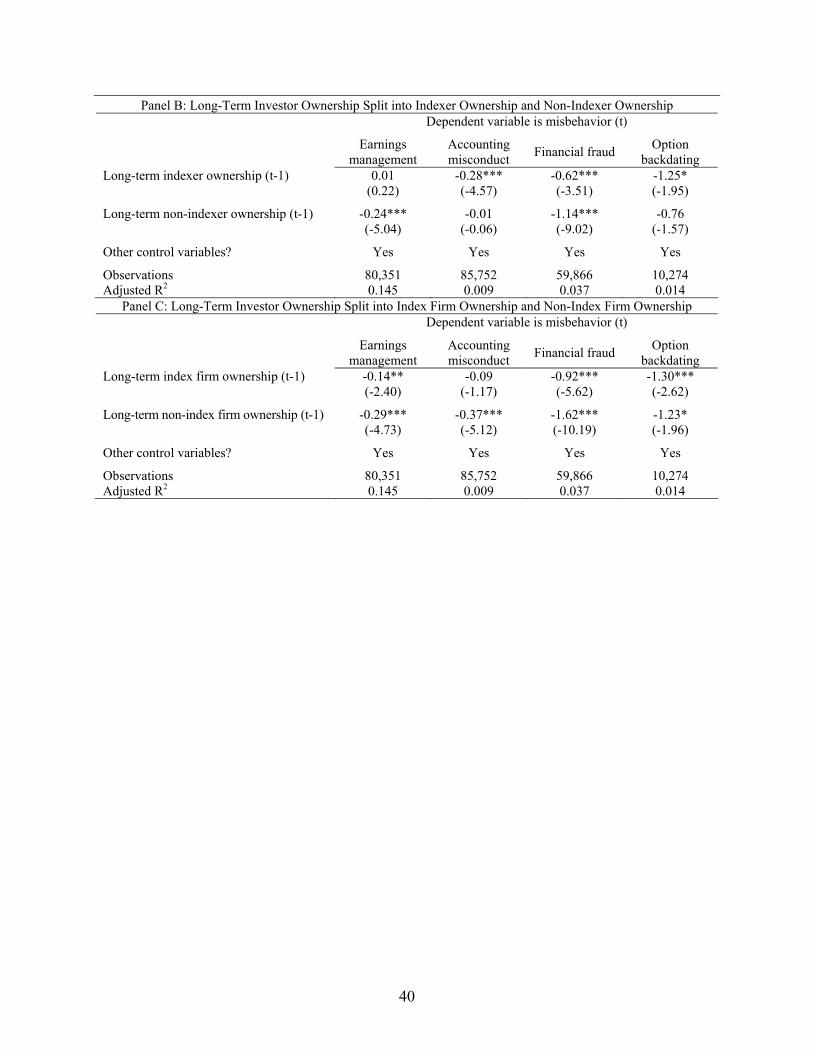
term indexer and non-indexer ownership (Panel B) as well as for long-term index firm and non-
index firm ownership (Panel C). This supports a causal interpretation of our results.
We also examine whether long-term investors improve internal governance. Specifically,
we look at shareholder proposals because they are well known to influence operating
performance (Del Guercio, Seery, and Woidtke (2008) and Ertimur, Ferri, and Muslu (2011)).
We also look at the quality of the board of directors because it is through the board that
shareholders can affect the behavior of management. Finally, we look at executive turnover
because it is a well known consequence of shareholder activism (Holderness and Sheehan (1985)
and Barclay and Holderness (1991)).
For shareholder proposals, we use the natural logarithm of one plus the number of
proposals. For board quality, we use board independence and board attendance measured as the
fraction of directors that are independent and the fraction of directors that attend at least three-
quarters of board meetings, respectively. We also use board experience measured as the mean
number of other directorships held by directors. Finally, for executive turnover, we use a dummy
variable that equals one if it occurs in a given firm-year and zero otherwise.
80%, because the data are not available during the first decade of our sample period, they are only available for roughly 1,500 of our 3,500 firms per year, and they are tilted toward firms that are bigger, older, etc. 6 If we examine options granted to the firm's directors rather than its CEO, the results are similar (not tabulated).

14
[Insert Table 3 about here]
Table 3 presents the results. Long-term investor ownership increases the number of
shareholder proposals by 3.5%. In addition to all shareholder proposals, we examine successful
shareholder proposals. Following Bauer, Moers, and Viehs (2012), we do not ignore withdrawn
shareholder proposals but rather treat them as passed. We do so because investors frequently use
shareholder proposals to attract the attention of corporate managers, which often leads to
remedial action by managers. In this case, the proposal is ultimately withdrawn but is
nevertheless effective. Our results for successful proposals (not tabulated) are similar to our
results for all proposals. This is also the case if we examine the net effect of shareholder
proposals that pass minus those that fail (not tabulated).
Similarly, long-term investor ownership improves the quality of the board of directors.
Independence increases by 1.36 or about 2% relative to its mean. Attendance increases by a more
modest 0.16 or 0.2% compared to its mean. Board experience increases by more meaningful
2.0%.7 Finally, long-term investor ownership increases the rate of executive turnover by 0.87 or
roughly 7% compared to its mean.
For shareholder proposals, board quality, and executive turnover, the results are similar in
Panel B and Panel C, which underscores our causal interpretation of the results in Panel A. In
summary, our results thus far are consistent with long-term investors improving corporate
behavior and internal governance.
3.2. Corporate Investment, Financing, and Payouts
Next, we examine whether long-term investors affect a range of corporate investment:
internal and external, short-term and long-term. We use the usual measures of long-term
investment: capital expenditures, research and development expenditures, and acquisitions 7 The results are similar if we measure board experience as the mean age of directors.

15
expenditures. Additionally, we consider investment in trade credit and inventories: two measures
of short-term investment that are essential to the daily operations of firms. We express all of
these variables as a percentage of total assets. Our specification is the same as before.
Consequently, each coefficient estimate captures the effect of a one-standard deviation change in
long-term investor ownership.
[Insert Table 4 about here]
Table 4 presents the results. As before, we only tabulate selected results for expositional
simplicity. Panel A shows that long-term investor ownership reduces capital, research and
development, and acquisitions expenditures by 0.41%, 0.51%, and 0.26% of total assets,
respectively. Trade credit and inventories decrease by 0.49% and 0.33% of total assets,
respectively. In other words, investment in capital decreases by about 2.0 percentage points in
total. To put this decrease in investment into perspective, it amounts to approximately $36
million for the average firm with total assets of $1,819 million. Similar results for long-term
indexer and non-indexer ownership (Panel B) as well as for long-term index firm and non-index
firm ownership (Panel C) support our causal interpretation of the results. In summary, long-term
investors cause a generalized reduction in investment, which is consistent with corporate
managers engaging in empire building if they are not adequately monitored.
We also consider the effect of long-term investors on the factors of production used by
firms. Specifically, we examine the amount of labor used by firms compared to capital as well as
the amount spent by firms on the former versus the latter. We measure labor and capital intensity
as the number of employees and property, plant, and equipment, respectively (Dewenter and
Malatesta (2001)). We compute their relative intensity as the ratio of the former to the latter
(MacKay and Phillips (2005)). Similarly, we measure labor and capital costs as wages and

16
depreciation, respectively, and their relative costs as the ratio of the former to the latter.8 We
express the intensity and costs variables (i.e., except the ratio variables) as a percentage of sales.
The specification is the same as before.
[Insert Table 5 about here]
Table 5 presents the results. Labor and capital intensity are in the first three columns of
each panel, while the last three columns contain labor and capital costs. Starting with intensity,
long-term investor ownership increases labor intensity by 0.18 employees per million dollars of
sales, or about 2% compared to its mean. By contrast, capital intensity decreases by 3.3% of
sales or roughly 7% relative to its mean. The relative intensity of labor versus capital increases
by 2.7 employees million dollars of property, plant, and equipment, which equals approximately
4% of its mean.
Proceeding to costs, long-term investor ownership does not significant increases labor
costs, but it does reduce capital costs by about 0.63% of sales or roughly 8% compared to its
mean. The relative costs of labor versus capital are higher by 1.1% or about 12% relative to its
mean. The results are similar for long-term indexer and non-indexer ownership (Panel B) and
also for long-term index firm and non-index firm ownership (Panel C), which supports a causal
interpretation of the results. By way of summary, production structure under long-term investors
includes more labor and less capital, consistent with their relative importance in today's
economy.
We now turn to the effect of long-term investors on financing. We examine financing
from a variety of sources: the issuance of short-term and long-term debt on the balance sheet, the
use of off balance sheet debt, equity issuance, and the accumulation of internal funds. We
include off balance sheet debt because it is a significant source of financing for many firms and 8 The data on wages is unfortunately sparse.

17
an important alternative to balance sheet debt (Eisfeldt and Rampini (2009) and Rampini and
Viswanathan (2013)).9 To capture off balance sheet debt, we use operating leases, as is common.
All of these variables are expressed as a percentage of total assets. We also examine the maturity
of debt on the balance sheet, which we measure as long-term debt expressed as a percentage of
total debt. We use the same specification as before.
[Insert Table 6 about here]
Table 6 presents the results. According to Panel A, long-term investor ownership reduces
balance sheet debt issuance by 0.48% of total assets of which 0.05% comes from short-term debt
and 0.43% is attributable to long-term debt. Incremental off balance sheet debt usage also falls,
by 0.34% of total assets. Equity issuance diminishes by 0.58% of total assets. The accumulation
of internal funds, however, is unaffected. Overall, total financing decreases by about 1.4
percentage points. To put this decrease in financing into context, it amounts to roughly $26
million for the average firm. Furthermore, debt maturity also decreases, by 1.32 p.p. or roughly
2% relative to its mean. Panel B and Panel C show that the results are similar for long-term
indexer and non-indexer ownership as well as for long-term index firm and non-index firm
ownership, respectively. This supports our causal interpretation of the results. To summarize, the
generalized reduction in financing caused by long-term investors along with the shorter maturity
of debt suggests that firms become more exposed to financial market discipline.
Lastly, we examine the effect that long-term investors have on payouts. To this end, we
consider both dividends and share repurchases, and we express them as a percentage of total
assets. Our specification is the same as before.
[Insert Table 7 about here]
9 Moreover, new regulations are expected to require firms to treat operating leases as liabilities on the balance sheet (The Economist (2013)).

18
Table 7 presents the results. Panel A indicates that long-term investor ownership
increases both dividends and share repurchases by 0.29% and 0.35% of total assets, respectively.
Put another way, total payouts are higher by about 0.6 percentage points. For the average firm,
this amounts to a rise in payouts of approximately $12 million. The results in Panel B and Panel
C support our causal interpretation of these results. To summarize, the increase in payouts
generated by long-term investors is consistent with managers being more carefully watched with
respect to their use of corporate funds.
4. Results for Value Implications
4.1. Stock Returns
Taken as a whole, our results thus far show that, absent monitoring by long-term
investors, corporate managers are more likely to engage in misbehavior ranging from earnings
management to financial fraud, and they tend to invest too much, raise too much financing, and
pay out too little cash to shareholders. We now examine whether the countervailing influence of
long-term investors is beneficial to shareholders. To this end, we follow the literature (e.g.,
Gompers, Ishii, and Metrick (2003)) and examine stock returns both in the time-series and the
cross-section.
We start with the time-series stock returns analysis. We sort our firm-year observations
into quintiles based on investor horizons. Investor horizons are the difference between various
measures of long-term investor ownership and short-term investor ownership. These measures
include not just long-term investor ownership itself but also long-term indexer and non-indexer
ownership as well as long-term index firm and non-index firm ownership. Each month during the
year after portfolio formation, i.e., between January 1985 and December 2012, we compute mean
raw returns for portfolios formed based on quintiles of investor horizons. Finally, each month,

19
we compute mean raw returns for the portfolio that is long the top quintile and short the bottom
quintile of investor horizons.
We run a monthly time-series regression of the excess stock returns of this portfolio on
the returns of the four factors. We measure excess stock returns as raw returns minus the risk-
free rate. We measure all returns variables in percentages.
[Insert Table 8 about here]
Table 8 presents the results.10 For the long-term investors portfolio, abnormal returns are
30 basis points per month, meaning that firms with long investor horizons outperform firms with
short investor horizons by roughly 3.6% per year. Splitting long-term investor ownership into
that of indexers and non-indexers as well as index firms and non-index firms produces similar
results. Indeed, the long-term indexers portfolio has abnormal returns of 60 basis points per
month while for the long-term index firms portfolio the corresponding figure is 50 basis points.
This supports our causal interpretation of the results.
Additionally, we compute the information ratio to capture the return-risk tradeoff of an
investor horizons trading strategy. Using monthly returns, the ratio is approximately 0.20 for the
long-term investors portfolio. For the long-term indexers and non-indexers portfolios, it is 0.11
and 0.15, respectively. Similarly, for the long-term index firms and non-index firms portfolios,
the corresponding figures are 0.09 and 0.22, respectively.
[Insert Figure 3 about here]
We also examine the monotonicity of our time-series results. Figure 3 shows the alphas
of the four-factor model regressions for each quintile of investor horizons. The results are similar
10 We examine the possibility that long-term investors reduce liquidity and thus our abnormal returns are simply compensation for lower liquidity. We control for Pastor and Stambaugh (2003)'s traded liquidity factor and find that our results are similar. We also consider the possibility that long-term investors increase profitability and so our abnormal returns capture a premium for greater profitability. When we control for Novy-Marx (2013)'s profitability factor, our results are actually stronger.

20
whether we consider the ownership of long-term investors, indexers and non-indexers, or index
firms and non-index firms. Abnormal returns are negligible for the lowest quintile of investor
horizons, and they generally increase in successively higher quintiles. For the highest quintiles,
abnormal returns are about 30 basis points per month. The results also suggest that it is possible
to implement a profitable trading strategy based on long-term investor ownership of firms.
We continue with the cross-sectional stock returns analysis. We run cross-sectional
regressions for each month between January 1985 and December 2012, and we compute the
means and t-statistics of the resulting time-series of 336 monthly coefficient estimates. More
precisely, we regress excess stock returns on long-term investor ownership. We measure excess
stock returns as raw returns minus industry returns. Our specification includes institutional
ownership. We also follow Brennan, Chordia, and Subrahmanyam (1998) and control for market
capitalization, book-to-market, lagged returns, volume, the dividend yield, and the stock price.
We standardize the investor ownership variables, so each coefficient estimate captures the
change in excess stock returns in percentage points of a one-standard deviation increase in long-
term investor ownership.
[Insert Table 9 about here]
Table 9 presents the results. Long-term investor ownership increases excess returns by 8
basis points per month. For long-term indexer ownership and long-term index firm ownership,
the results are economically larger at 16 and 14 basis points, respectively. In other words, excess
returns are higher by 1 percentage points per year, very roughly. We note that differences in the
magnitude of our time-series and cross-sectional returns results are not surprising. In part, they
may be due to our focus on extreme quintiles of investor horizons in our time-series analysis in
contrast to our focus on a one-standard change in investor horizons in the cross-sectional

21
analysis. The differences may also be partly due to firm characteristics in the cross-sectional
analysis capturing risk that is not captured by risk factors in the time-series analysis, thereby
overstating abnormal returns relative to excess returns. Overall, our results show that long-term
investors lead to higher stock returns.
4.2. Profitability
We examine whether the increase in shareholder value generated by long-term investors
is the result of greater profitability. We begin with realizations of profitability. Specifically, we
look at earnings as well as sales and costs. We do so because we are interested in whether firms
boost earnings by selling more products and services at higher prices or by cutting costs instead.
We express these variables as a percentage of total assets. We use the same specification as in
Table 4, so each coefficient estimate captures the effect of a one-standard deviation change in
long-term investor ownership.
[Insert Table 10 about here]
Table 10 present the results in the first three columns of each panel. Panel A shows that
long-term investor ownership increases earnings by 0.49% of total assets or by roughly $9
million for the average firm. Both sales and costs rise, but the former increases by more than the
latter, so the net effect is higher earnings for firms with greater long-term investor ownership.
Panel B and Panel C show similar results for long-term indexers and index firms, respectively,
which validates our causal interpretation.
Next, we look at whether stock market participants correctly anticipate the increase in
profitability caused by long-term investors. To this end, we use analysts' earnings forecast errors
as well as stock returns around earnings announcements. We regress our measures of earnings
surprises on long-term investor ownership and control for institutional ownership. We follow the

22
literature (e.g., Core, Guay, and Rusticus (2006)) and also control for market capitalization and
book-to-market (both in natural logarithms). Additionally, we include industry-year fixed effects.
As before, we multiple the dependent variables by 100 and standardize the independent
variables.
The results are presented in the last two columns of each panel in Table 10. Panel A
shows that stock market participants are positively surprised by the profitability of firms with
greater long-term investor ownership. Both earnings forecast errors and earnings announcement
returns are higher, by 0.07% and 0.11%, respectively. These modest profitability surprises also
manifest themselves for long-term indexers and index firms (Panel B and Panel C, respectively).
This validates our causal interpretation of the results. In other words, stock market participants
slightly underestimate the increase in profitability caused by long-term investors, which is
consistent with the higher stock returns of firms with longer investor horizons.
4.3. Risk
Finally, we examine whether the increase in shareholder value generated by long-term
investors is the result of lower risk. Like for profitability, we look at the volatility of earnings as
well as sales and costs. Our definition of the volatility of profitability follows the literature (e.g.,
Minton and Schrand (1999) and Rountree, Weston, and Allayanis (2008)). Specifically, we
measure the volatility of profitability as the coefficient of variation of quarterly earnings per
share. We also look at the volatility of stock returns because it should at least partly capture cash
flow risk. We use the same specification as in Table 4. As a consequence, each coefficient
estimate captures the effect of a one-standard deviation change in long-term investor ownership.
[Insert Table 11 about here]

23
Table 11 presents the results. Panel A shows that long-term investor ownership reduces
the volatility of earnings by 3.9%. Sales and costs also become less volatile by 4.5% and 4.8%,
respectively. Moreover, this decrease in cash flow risk manifests itself in lower stock return
volatility, which falls by 2.7%. We find generally similar results for long-term indexer and non-
indexer ownership (Panel B) as well as for long-term index firm and non-index firm ownership
(Panel C). Therefore, our interpretation is that long-term investors reduce the volatility of both
profitability and stock returns.
In a closely related analysis, we return to our point of departure and look at extreme stock
returns as well as covenant violations, defaults, and bankruptcies. The decrease in the occurrence
of corporate misbehavior should show up in a lower incidence of devastating corporate news
(e.g., the revelation of accounting misconduct). As a result, we should see fewer extreme
negative stock returns for the firm's owners and adverse credit events for its creditors. Moreover,
Cella, Ellul, and Giannetti (2013) provide evidence that long-term investors soften the blow of
negative systematic shocks to the stock prices of firms that they own. More generally, the
presence of long-term investors should alter the profile of corporate news and stock returns away
from the very negative and toward the very positive.
Motivated by these arguments, we repeat our preceding analysis for extreme stock returns
and credit events. We capture extreme stock returns using two popular measures from the
literature. In particular, we use the negative skewness of returns (Chen, Hong, and Stein (2001))
as well as stock price plunges and surges (Hutton, Marcus, and Tehranian (2009)). We estimate
extreme negative and positive returns as dummy variables that equal one if weekly stock returns
are three standard deviations below or above their mean, respectively, during at least one week
of the year.

24
To capture credit events, we use covenant violations, defaults, and bankruptcies. These
variables equal one if they occur for a firm following a given year and zero otherwise. For
covenant violations, we use our customary horizon of one year because these events occur
frequently and they usually lead to renegotiation rather than default or bankruptcy (Roberts and
Sufi (2009)). By contrast, defaults and bankruptcies are rare events and they are generally
irreversible. However, they can take years to occur, so we use a horizon of three years for these
events. Nevertheless, our findings are similar over horizons of one, two, and three years.
[Insert Table 12 about here]
Table 12 presents the results. Panel A shows that long-term investor ownership reduces
the negative skewness of stock returns as well as extreme stock returns. The incidence of stock
price plunges decreases by 1.60% or about 8% relative to its mean. For stock price surges, the
corresponding figures are an increase of 2.05% or roughly 7%, respectively. The rate of credit
events is also lower. The rate of covenant violations is 0.58 percentage points lower or
approximately 10% less than its mean. The default rate is 0.46 p.p. lower or about 40% less
relative to its mean while the bankruptcy rate is 0.53 p.p. lower or roughly 20% less compared to
its mean. (Although default and bankruptcy can occur at the same time, neither one necessarily
implies the other.)
Additionally, we look at whether firms are more likely to be acquired. Firms that perform
poorly usually become takeover targets. Conversely, firms that are well run, owing to monitoring
by long-term investors, for instance, are unlikely to become takeover targets. This is indeed what
we find: firms with greater long-term investor ownership are roughly 20% less likely to become
takeover targets during the next three years (not tabulated). Long-term investors thus have the
opposite effect of hedge funds with respect to acquisitions: firms targeted by hedge funds with

25
activist intentions are likely to be acquired (Greenwood and Schor (2009)). The lower likelihood
of being taken over together with the lower likelihood of going bankrupt suggests that long-term
investors increase the firm's survival. This is consistent with the superior stock and operating
performance that we also document.
Panel B and Panel C show results for extreme stock returns that are somewhat weaker but
broadly comparable for long-term indexers and non-indexers as well as for long-term index firms
and non-index firms. For credit events, Panel B and Panel C show results that, on the whole, are
stronger than the results in Panel A. The results are also similar for takeovers (not tabulated).
This provides support for interpreting our results causally. Taken together, our results indicate
that long-term investors mitigate the occurrence of devastating corporate outcomes and they
thereby reduce risk.
4.4. Organizational Structure
To better understand the reduction in risk, we examine organizational structure. In
frictionless markets, diversification should not affect shareholder value, but in the presence of
market frictions, diversification can create value by lowering financial distress costs. We
examine whether long-term investors encourage an organizational structure that is diversified
rather than concentrated. Specifically, we compute the Herfindahl-Hirschman index of the firm's
segment sales relative to the firm's total sales for business, industry, and geographic segments.
These variables capture process diversification. We also capture global diversification using a
dummy variable that equals one if the firm has foreign operations and zero otherwise. Finally,
we compute the HHI of the firm's major customers and key products in order to capture output
diversification. The specification we use is the same as in Table 4. Accordingly, each coefficient
estimate captures the effect of a one-standard deviation change in long-term investor ownership.

26
[Insert Table 13 about here]
Table 13 presents the results using the Herfindahl-Hirschman index as our measure of
concentration. The results using the number of segments are similar (not tabulated). Panel A
shows that long-term investor ownership increases diversification across the board. Business
segment concentration is 2.8 percentage points lower or about 3% relative to its mean. For
industry segment concentration, the corresponding figures are 1.2 p.p. and roughly 1.5%.
Similarly, geographic segment concentration is 0.56 percentage points lower or roughly
1% compared to its mean, and the prevalence of foreign operations is 2.8 p.p. higher or about
8%. Finally, customer concentration is lower, by 0.61 p.p. or roughly 15% relative to its mean, as
is product concentration, by 1.9 p.p. or about 4%. The results in Panel B (long-term indexer and
non-indexer ownership) and Panel C (long-term index firm and non-index firm ownership) are
similar, which lends support to our causal interpretation of the results. Overall, our results
indicate that long-term investors encourage managers to reduce risk by diversifying their firms
along business, industry, and geographic lines as well as customers and products.
5. Conclusion
In this paper, we examine whether long-term investors improve corporate decision
making. We argue that these investors have the means and motive to better monitor corporate
managers. As a result, managers are induced to make corporate policy choices that increase
shareholder value.
We find that long-term investors restrain corporate misbehavior and strengthen internal
governance. We also find they cause a decrease in various types of investment activity as well as
external financing, but they lead to an increase in payouts to shareholders. As a consequence of
these corporate policies, shareholders earn higher returns on their investment as a result of both

27
higher profitability and lower risk. We adopt a recent but widespread identification strategy to
establish causality of our results. Our overarching conclusion is that long-term investors lead to a
range of corporate behaviors that increase shareholder value.

28
References
Admati, Anat R., and Paul Pfleiderer, 2009, The "Wall Street Walk" and shareholder activism:
Exit as a form of voice, Review of Financial Studies 22, 2445-2485.
Aggarwal, Rajesh K., Andrew A. Samwick, 2003, Why do managers diversify their firms?
Agency reconsidered, Journal of Finance 58, 71-118.
Allen, Jeffrey W., and John J. McConnell, 1998, Equity carve-outs and managerial discretion,
Journal of Finance 53, 163-186.
Amihud, Yakov, and Baruch Lev, 1981, Risk reduction as a motive for conglomerate mergers,
Bell Journal of Economics 12, 605-617.
Appel, Ian R., Todd A. Gormley, and Donald B. Keim, 2014, Passive investors, not passive
owners, working paper.
Asker, John, Joan Farre-Mensa, and Alexander Ljungqvist, 2014, Corporate investment and
stock market listing: A puzzle?, forthcoming Review of Financial Studies.
Barclay, Michael J., and Clifford G. Holderness, 1991, Negotiated block trades and corporate
control, Journal of Finance 46, 861-878.
Bauer, Rob, Frank Moers, and Michael Viehs, 2012, The determinants of withdrawn shareholder
proposals, working paper.
Baumol, William J., 1959, Business Behavior, Value and Growth (Macmillan, New York).
Bebchuk, Lucian A., Yaniv Grinstein, and Urs Peyer, 2010, Lucky CEOs and lucky directors,
Journal of Finance 65, 2363-2401.
Bebchuk, Lucian Arye, and Lars A. Stole, 1993, Do short-term objectives lead to under- or
overinvestment in long-term projects, Journal of Finance 48, 719-729.

29
Berger, Philip G., and Eli Ofek, 1995, Diversification's effect on firm value, Journal of Financial
Economics 37, 39-65.
Berle, Adolf, and Gardiner Means, 1932, The Modern Corporation and Private Property
(MacMillan, New York).
Bertrand, Marianne, Sendhil Mullainathan, 2003, Enjoying the quiet life? Corporate governance
and managerial preferences, Journal of Political Economy 111, 1043-1075.
Bethel, Jennifer, Julia Liebeskind, and Tim Opler, 1998, Block share purchases and corporate
performance, Journal of Finance 53, 605-634.
Beyer, Anne, David F. Larcker, and Brian Tayan, 2014, Study on How Investment Horizon and
Expectations of Shareholder Base Impact Corporate Decision-Making, National Investor
Relations Institute and The Rock Center for Corporate Governance.
Brav, Alon, Wei Jiang, Frank Partnoy, and Randall Thomas, 2008, Hedge fund activism,
corporate governance, and firm performance, Journal of Finance 63, 1729-1775.
Brennan, Michael J., Tarun Chordia, and Avanidhar Subrahmanyam, 1998, Alternative factor
specifications, security characteristics, and the cross-section of expected returns, Journal
of Financial Economics 49, 345-373.
Bushee, Brian, J., 1998, The influence of institutional investors on myopic R&D investment
behavior, Accounting Review 73, 305-333.
Carleton, Willard T., James M. Nelson, and Michael S. Weisbach, 1998, The influence of
institutions on corporate governance through private negotiations: Evidence from TIAA-
CREF, Journal of Finance 53, 1335-1362.
Cella, Cristina, Andrew Ellul, and Mariassunta Giannetti, 2013, Investors' horizons and the
amplification of market shocks, Review of Financial Studies 26, 1607-1648.

30
Chen, Joseph, Harrison Hong, and Jeremy C. Stein, 2001, Forecasting crashes: Trading volume,
past returns, and conditional skewness in stock prices, Journal of Financial Economics
61, 345-381.
Chen, Xia, Jarrad Harford, and Kai Li, 2007, Monitoring: Which institutions matter?, Journal of
Financial Economics 86, 279-305.
Christoffersen, Susan E. K., Christopher C. Geczy, David K. Musto, and Adam V. Reed, 2007,
Vote trading and information aggregation, Journal of Finance 62, 2897-2929.
Crane, Alan D., Sébastien Michenaud, and James P. Weston, 2014, The effect of institutional
ownership on payout policy: Evidence from index thresholds, working paper.
Cremers, K. J. Martijn, and Antti Petajisto, 2009, How active is your fund manager? A new
measure that predicts performance, Review of Financial Studies 22, 3329-3365.
Dechow, Patricia M., Richard G. Sloan, and Amy P. Sweeney, 1995, Detecting earnings
management, Accounting Review 70, 193-225.
Dechow, Patricia M., Richard G. Sloan, and Amy P. Sweeney, 1996, Causes and consequences
of earnings manipulation: An analysis of firms subject to enforcement actions by the
SEC, Contemporary Accounting Research 13, 1-36.
Dechow, Patricia M., Weili Ge, Chad R. Larson, Richard G. Sloan, 2011, Predicting material
accounting misstatements, Contemporary Accounting Research 28, 17-82.
Del Guercio, Diane, and Jennifer Hawkins, 1999, The motivation and impact of pension fund
activism, Journal of Financial Economics 52, 293-340.
Del Guercio, Diane, Laura Seery, and Tracie Woidtke, 2008, Do boards pay attention when
institutional investor activists "just vote no"?, Journal of Financial Economics 90, 84-
103.

31
Denis, David J., 1990, Defensive changes in corporate payout policy: Share repurchases and
special dividends, Journal of Finance 45, 1433-1456.
Denis, David J., Diane K. Denis, and Keven Yost, 2002, Global diversification, industrial
diversification, and firm value, Journal of Finance 57, 1951-1979.
Derrien, François, Ambrus Kecskés, and David Thesmar, 2013, Investor horizons and corporate
policies, Journal of Financial and Quantitative Analysis 48, 1755-1780.
Dewenter, Kathryn L., and Paul H. Malatesta, 2001, State-owned and privately owned firms: An
empirical analysis of profitability, leverage, and labor intensity, American Economic
Review 91, 320-334.
Drucker, Peter, 1986, A crisis of capitalism, The Wall Street Journal, September 30, 32.
Edmans, Alex, 2009, Blockholder trading, market efficiency, and managerial myopia, Journal of
Finance 64, 2481-2513.
Eisfeldt, Andrea L., and Adriano A. Rampini, 2009, Leasing, ability to repossess, and debt
capacity, Review of Financial Studies 22, 1621-1657.
Ertimur, Yonca, Fabrizio Ferri, and Volkan Muslu, 2011, Shareholder activism and CEO pay,
Review of Financial Studies 24, 535-592.
Froot, Kenneth A., Andre F. Perold, and Jeremy C. Stein, 1992, Shareholder trading practices
and corporate investment horizons, Journal of Applied Corporate Finance Summer, 42-
58.
Gao, Huasheng, Jarrad Harford, and Kai Li, 2014, Investor horizon and CEO turnover-
performance sensitivity, working paper.
Gao, Huasheng, Po-Hsuan Hsu, and Kai Li, 2014, Managerial short-termism and corporate
innovation strategies, working paper.

32
Gaspar, José-Miguel, Massimo Massa, and Pedro Matos, 2005, Shareholder investment horizons
and the market for corporate control, Journal of Financial Economics 76, 135-165.
Gaspar, José-Miguel, Massimo Massa, Pedro Matos, Rajdeep Patgiri, and Zahid Rehman, 2012,
Payout policy choices and shareholder investment horizons, Review of Finance 17, 261-
320.
Gillan, Stuart L., and Laura T. Starks, 2000, Corporate governance proposals and shareholder
activism: The role of institutional investors, Journal of Financial Economics 57, 275-305.
Giroud, Xavier, and Holger M. Mueller, 2010, Does corporate governance matter in competitive
industries?, Journal of Financial Economics 95, 312-331.
Gompers, Paul, Joy Ishii, and Andrew Metrick, 2003, Corporate governance and equity prices,
Quarterly Journal of Economics 118, 107-155.
Gormley, Todd A., and David A. Matsa, 2014, Common errors: How to (and not to) control for
unobserved heterogeneity, Review of Financial Studies 27, 617-661.
Graham, John R., Campbell R. Harvey, and Shiva Rajgopal, 2005, The economic implications of
corporate financial reporting, Journal of Accounting and Economics 40, 3-73.
Greenwood, Robin, and Michael Schor, 2009, Investor activism and takeovers, Journal of
Financial Economics 92, 362-375.
Grossman, Sanford J., and Oliver D. Hart, 1980, Takeover bids, the free-rider problem, and the
theory of the corporation, Bell Journal of Economics 11, 42-54.
Grossman, Sanford J., and Oliver Hart, 1983, An analysis of the principal-agent problem,
Econometrica 51, 7-46.
Hann, Rebecca N., Maria Ogneva, and Oguzhan Ozbas, 2013, Corporate diversification and the
cost of capital, Journal of Finance 68, 1961-1999.

33
Harford, Jarrad, 1999, Corporate cash reserves and acquisitions, Journal of Finance 54, 1969-
1997.
Harford, Jarrad, Dirk Jenter, and Kai Li, 2011, Institutional cross-holdings and their effect on
acquisition decisions, Journal of Financial Economics 99, 27-39.
Heron, Randall A., and Erik Lie, 2007, Does backdating explain the stock price pattern around
executive stock option grants?, Journal of Financial Economics 83, 271-295.
Holderness, Clifford G., and Dennis P. Sheehan, 1985, Raiders or saviors? The evidence on six
controversial investors, Journal of Financial Economics 14, 555-579.
Holmström, Bengt, 1979, Moral hazard and observability, Bell Journal of Economics 10, 74-91.
Hutton, Amy P., Alan J. Marcus, and Hassan Tehranian, 2009, Opaque financial reports, R2, and
crash risk, Journal of Financial Economics 94, 67-86.
Jensen, Michael C., and William H. Meckling, 1976, Theory of the firm: Managerial behavior,
agency costs and ownership structure, Journal of Financial Economics 3, 305-360.
Karpoff, Jonathan M., D. Scott Lee, and Gerald S. Martin, 2008, The cost to firms of cooking the
books, Journal of Financial and Quantitative Analysis 43, 581-612.
Kecskés, Ambrus, Sattar Mansi, and Phuong-Anh Nguyen, 2014, Does corporate investment in
stakeholder capital create value for shareholders? The importance of long-term investors,
working paper.
Klein, April, and Emanuel Zur, 2009, Entrepreneurial shareholder activism: Hedge funds and
other private investors, Journal of Finance 64, 187-229.
La Porta, Rafael, Florencio Lopez-de-Silanes, Andrei Shleifer, and Robert W. Vishny, 2000,
Agency problems and dividend policies around the world, Journal of Finance 55, 1-33.

34
Lang, Larry H. P., and René M. Stulz, 1994, Tobin's q, corporate diversification, and firm
performance, Journal of Political Economy 102, 1248-1280.
Lang, Larry H. P., Annette B. Poulsen, and René M. Stulz, 1995, Asset sales, firm performance,
and the agency costs of managerial discretion, Journal of Financial Economics 37, 3-37.
Lewellen, Wilbur G., 1971, A pure financial rationale for the conglomerate merger, Journal of
Finance 26, 527-537.
Lie, Erik, 2005, On the timing of CEO stock option awards, Management Science 51, 802-812.
Low, Angie, 2009, Managerial risk-taking behavior and equity-based compensation, Journal of
Financial Economics 92, 470-490.
MacKay, Peter, and Gordon M. Phillips, 2005, How does industry structure affect firm financial
structure?, Review of Financial Studies 18, 1433-1466.
Mansi, Sattar A., and David M. Reeb, 2002, Corporate diversification: What gets discounted?,
Journal of Finance 57, 2167-2183.
Matvos, Gregor, and Michael Ostrovsky, 2010, Heterogeneity and peer effects in mutual fund
proxy voting, Journal of Financial Economics 98, 90-112.
Michaely, Roni, and Christopher Vincent, 2013, Do institutional investors influence capital
structure decisions?, working paper.
Minton, Bernadette A., and Catherine Schrand, 1999, The impact of cash flow volatility on
discretionary investment and the costs of debt and equity financing, Journal of Financial
Economics 54, 423-460.
Monks, Robert A. G., and Nell Minow, 1995, Corporate Governance (Blackwell, Cambridge,
Massachusetts).

35
Morck, Randall, Andrei Shleifer, and Robert W. Vishny, 1990, Do managerial objectives drive
bad acquisitions?, Journal of Finance 45, 31-48.
Mullins, William, 2014, The governance impact of index funds: Evidence from regression
discontinuity, working paper.
Narayanan, M. P., and H. Nejat Seyhun, 2008, The dating game: Do managers designate option
grant dates to increase their compensation?, Review of Financial Studies 21, 1907-1955.
Novy-Marx, Robert, 2013, The other side of value: The gross profitability premium, Journal of
Financial Economics 108, 1-28.
Pastor, Lubos, Robert F. Stambaugh, 2003, Liquidity risk and expected stock returns, Journal of
Political Economy 111, 642-685.
Porter, Michael E., 1992, Capital Choices: Changing the Way America Invests in Industry
(Council on Competitiveness/Harvard Business School, Boston).
Rampini, Adriano A., S. Viswanathan, 2013, Collateral and capital structure, Journal of
Financial Economics 109, 466-492.
Roberts, Michael R., and Amir Sufi, 2009, Control rights and capital structure: An empirical
investigation, Journal of Finance 64, 1657-1695.
Rountree, Brian, James P. Weston, and George Allayanis, 2008, Do investors value smooth
performance?, Journal of Financial Economics 90, 237-251.
Shleifer, Andrei, and Robert W. Vishny, 1986, Large shareholders and corporate control, Journal
of Political Economy 94, 461-488.
Stein, Jeremy C., 1988, Takeover threats and managerial myopia, Journal of Political Economy
96, 61-80.

36
Stulz, René M., 1990, Managerial discretion and optimal financing policies, Journal of Financial
Economics 26, 3-27.
The Economist, 2013, Company accounts: The lease bad solution, November 16.
Williamson, Oliver E., 1964, The Economics of Discretionary Behavior (Prentice-Hall,
Englewood Cliffs, New Jersey).
Yermack, David, 1997, Good timing: CEO stock option awards and company news
announcements, Journal of Finance 52, 449-476.
Zingales, Luigi, 2000, In search of new foundations, Journal of Finance 55, 1623-1653.

37
Table 1 Descriptive Statistics
This table presents descriptive statistics for investor ownership variables and all dependent variables. The sample comprises 95,463 firm-year observations corresponding to 11,206 unique firms between 1985 and 2012. The firms in the sample are publicly traded U.S. operating firms excluding financials and utilities. With the exception of excess stock returns, all variables are defined in Appendix Table 1. Excess stock returns are raw returns minus market returns, and they are annualized. All variables except labor intensity, relative labor versus capital intensity, and relative labor versus capital costs are multiplied by 100.
Mean Standard deviation
25th percentile
Median 75th
percentile
Investor ownership variables - Long-term investor ownership 13.6 13.0 3.0 9.4 21.3 - Long-term indexer ownership 4.9 5.3 1.0 2.8 7.0 - Long-term non-indexer ownership 8.7 9.2 1.3 5.7 13.2 - Long-term index firm ownership 2.7 8.6 0.0 0.0 0.0 - Long-term non-index firm ownership 10.8 12.2 1.0 6.4 16.3 - Institutional ownership 38.0 29.3 11.4 33.5 61.4
Corporate misbehavior variables - Earnings management 8.6 10.4 2.2 5.2 10.7 - Accounting misconduct 1.2 10.9 0.0 0.0 0.0 - Financial fraud 4.9 21.5 0.0 0.0 0.0 - Option backdating 14.6 35.3 0.0 0.0 0.0
Internal governance variables - Shareholder proposals 22.8 85.6 0.0 0.0 0.0 - Board independence 68.5 17.9 57.1 71.4 83.3 - Board attendance 98.5 4.3 100.0 100.0 100.0 - Board experience 83.6 57.2 40.0 75.0 120.0 - Executive turnover 11.7 32.1 0.0 0.0 0.0
Investment variables - Capital expenditures 6.0 6.4 1.9 4.0 7.6 - Research and development expenditures 5.0 10.2 0.0 0.0 5.4 - Acquisitions expenditures 2.1 5.7 0.0 0.0 0.6 - Change in trade credit -0.9 18.8 -4.9 0.5 6.3 - Change in inventory 0.3 5.8 -0.5 0.0 2.0
Production structure variables - Labor intensity 9.2 11.1 3.7 6.3 10.4 - Capital intensity 46.7 90.0 9.4 19.0 39.9 - Relative labor versus capital intensity 62.6 91.4 16.3 36.3 70.7 - Labor costs 34.1 26.2 21.8 29.9 40.0 - Capital costs 7.9 14.0 2.3 3.9 7.0 - Relative labor versus capital costs 9.1 10.5 3.9 6.4 10.2
Financing variables - Change in short-term debt 0.0 3.9 0.0 0.0 0.0 - Change in long-term debt 1.0 9.1 -1.6 0.0 1.6 - Debt maturity 70.4 32.5 52.7 84.1 96.5 - Change in off balance sheet debt 0.6 4.9 -0.5 0.0 1.3 - Change in equity 4.0 11.5 0.0 0.3 1.6 - Internal financing 0.0 11.0 -2.3 0.1 3.0

38
Payout variables - Dividends 0.7 1.5 0.0 0.0 0.8 - Share repurchases 1.4 3.7 0.0 0.0 0.6
Excess stock returns 2.1 58.2 -29.2 0.3 29.9
Profitability variables - Earnings -4.5 26.1 -5.0 2.9 7.3 - Sales 121.4 82.2 65.0 107.7 158.1 - Costs 115.6 80.9 60.0 99.0 149.2 - Earnings forecast errors 0.8 3.7 -0.1 0.0 0.3 - Earnings announcement returns 0.2 4.8 -2.4 0.1 2.6
Volatility variables - Earnings 319.2 750.4 48.3 112.1 255.7 - Sales 27.2 29.3 11.2 17.7 30.2 - Costs 24.7 23.1 10.7 17.1 29.9 - Stock returns 59.5 38.3 32.6 49.1 74.2
Extreme stock returns and credit event var.s - Negative skewness -11.1 119.8 -59.7 -18.2 20.9 - Extreme negative returns 19.7 39.8 0.0 0.0 0.0 - Extreme positive returns 28.6 45.2 0.0 0.0 100.0 - Covenant violations 5.9 23.6 0.0 0.0 0.0 - Default 1.1 10.5 0.0 0.0 0.0 - Bankruptcy 2.8 16.5 0.0 0.0 0.0
Organizational structure variables - Business concentration 82.7 24.6 60.4 100.0 100.0 - Industry concentration 90.8 18.0 96.1 100.0 100.0 - Geographic concentration 82.0 23.9 61.7 100.0 100.0 - Foreign operations 36.0 48.0 0.0 0.0 100.0 - Customer concentration 4.0 11.3 0.0 0.0 1.0 - Product concentration 45.5 27.1 25.0 44.3 64.2

39
Table 2 The Effect of Investor Horizons on Corporate Misbehavior
This table presents the results of regressions of corporate misbehavior on long-term investor ownership. The sample comprises 95,463 firm-year observations corresponding to 11,206 unique firms between 1985 and 2012. The firms in the sample are publicly traded U.S. operating firms excluding financials and utilities. All variables are defined in Appendix Table 1. The dependent variables are expressed as follows. Earnings management is discretionary accruals as a percentage of total assets. Accounting misconduct, financial fraud, and option backdating are dummy variables that equal one if they occur in a given firm-year and zero otherwise. The dependent variables are multiplied by 100. The independent variables are standardized. Standard errors are clustered by industry-year. ***, **, and * indicate statistical significance at the 1%, 5%, and 10% levels, respectively. In Panel A, all results are tabulated, whereas in Panel B and Panel C, only selected results are tabulated.
Panel A: All Long-Term Investor Ownership Dependent variable is misbehavior (t)
Earnings
management Accounting misconduct
Financial fraud Option
backdating Long-term investor ownership (t-1) -0.28*** -0.33*** -1.62*** -1.45** (-4.18) (-4.22) (-9.54) (-2.33)
Institutional ownership (t-1) -0.33*** 0.54*** 2.08*** 1.82*** (-4.90) (6.08) (9.72) (2.64)
ln(Total assets) (t-1) -1.11*** 0.51*** 2.66*** -2.30*** (-12.11) (5.83) (13.17) (-3.82)
Market-to-book (t-1) 1.03*** 0.19*** 1.71*** -0.27 (16.12) (4.26) (14.02) (-0.70)
Cash flow-to-total assets (t-1) -1.17*** -0.01 -0.15 0.14 (-14.81) (-0.14) (-1.25) (0.33)
Stock returns (t-1) -0.04 0.17*** 0.76*** -0.11 (-0.50) (3.23) (6.51) (-0.23)
Volatility (t-1) 1.27*** 0.04 0.75*** 1.11* (14.84) (0.85) (6.58) (1.74)
Industry-year fixed effects? Yes Yes Yes Yes
Observations 80,351 85,752 59,866 10,274 Adjusted R2 0.145 0.009 0.037 0.014
40
Panel B: Long-Term Investor Ownership Split into Indexer Ownership and Non-Indexer Ownership Dependent variable is misbehavior (t)
Earnings
management Accounting misconduct
Financial fraud Option
backdating Long-term indexer ownership (t-1) 0.01 -0.28*** -0.62*** -1.25* (0.22) (-4.57) (-3.51) (-1.95)
Long-term non-indexer ownership (t-1) -0.24*** -0.01 -1.14*** -0.76 (-5.04) (-0.06) (-9.02) (-1.57)
Other control variables? Yes Yes Yes Yes
Observations 80,351 85,752 59,866 10,274 Adjusted R2 0.145 0.009 0.037 0.014
Panel C: Long-Term Investor Ownership Split into Index Firm Ownership and Non-Index Firm Ownership Dependent variable is misbehavior (t)
Earnings
management Accounting misconduct
Financial fraud Option
backdating Long-term index firm ownership (t-1) -0.14** -0.09 -0.92*** -1.30*** (-2.40) (-1.17) (-5.62) (-2.62)
Long-term non-index firm ownership (t-1) -0.29*** -0.37*** -1.62*** -1.23* (-4.73) (-5.12) (-10.19) (-1.96)
Other control variables? Yes Yes Yes Yes
Observations 80,351 85,752 59,866 10,274 Adjusted R2 0.145 0.009 0.037 0.014

41
Table 3 The Effect of Investor Horizons on Internal Governance
This table presents the results of regressions of internal governance on long-term investor ownership. The sample comprises 95,463 firm-year observations corresponding to 11,206 unique firms between 1985 and 2012. The firms in the sample are publicly traded U.S. operating firms excluding financials and utilities. All variables are defined in Appendix Table 1. The dependent variables are expressed as follows. The shareholder proposals and board experience variables are expressed as the natural logarithm of one plus the variable. Board independence and board experience are expressed as a fraction. Executive turnover is a dummy variable that equals one if it occurs in a given firm-year and zero otherwise. The dependent variables are multiplied by 100. The independent variables are standardized. Standard errors are clustered by industry-year. ***, **, and * indicate statistical significance at the 1%, 5%, and 10% levels, respectively. In Panel A, all results are tabulated, whereas in Panel B and Panel C, only selected results are tabulated.
Panel A: All Long-Term Investor Ownership Dependent variable is internal governance (t)
Shareholder proposals
Board independence
Board attendance
Board experience
Executive turnover
Long-term investor 3.50*** 1.36*** 0.16** 2.03*** 0.87** ownership (t-1) (10.66) (6.02) (2.51) (4.68) (2.20)
Institutional ownership (t-1) -7.61*** 4.39*** -0.02 0.98* -1.62*** (-16.76) (13.87) (-0.20) (1.68) (-3.48)
ln(Total assets) (t-1) 20.52*** 3.39*** -0.29*** 20.70*** 1.41*** (31.05) (17.58) (-5.23) (60.79) (3.80)
Market-to-book (t-1) 2.15*** 0.57*** -0.07 3.15*** -0.06 (10.15) (4.65) (-1.61) (15.06) (-0.24)
Cash flow-to-total assets -1.59*** -0.64** 0.12 -3.44*** -3.51*** (t-1) (-5.63) (-2.20) (1.64) (-6.02) (-6.50)
Stock returns (t-1) -0.64*** -0.70*** -0.01 -0.69* -3.01*** (-3.00) (-3.79) (-0.10) (-1.91) (-7.52)
Volatility (t-1) -0.76* -0.55* -0.16* -0.29 2.58*** (-1.95) (-1.82) (-1.92) (-0.50) (4.19)
Industry-year fixed effects? Yes Yes Yes Yes Yes
Observations 28,632 19,233 19,233 17,070 23,172 Adjusted R2 0.239 0.301 0.035 0.279 0.015

42
Panel B: Long-Term Investor Ownership Split into Indexer Ownership and Non-Indexer Ownership Dependent variable is internal governance (t)
Shareholder proposals
Board independence
Board attendance
Board experience
Executive turnover
Long-term indexer 6.18*** 2.88*** 0.23*** 4.38*** 0.33 ownership (t-1) (13.35) (11.45) (3.70) (10.12) (0.86)
Long-term non-indexer 1.10*** 0.45*** 0.07 0.49 0.64** ownership (t-1) (4.70) (2.73) (1.42) (1.56) (2.12)
Other control variables? Yes Yes Yes Yes Yes
Observations 28,632 19,233 19,233 17,070 23,172 Adjusted R2 0.247 0.307 0.035 0.284 0.015
Panel C: Long-Term Investor Ownership Split into Index Firm Ownership and Non-Index Firm Ownership Dependent variable is internal governance (t)
Shareholder proposals
Board independence
Board attendance
Board experience
Executive turnover
Long-term index firm 7.28*** 1.63*** 0.16*** 2.65*** 0.79** ownership (t-1) (22.16) (10.09) (3.22) (7.99) (2.52)
Long-term non-index firm 0.61** 0.84*** 0.12* 1.09** 0.73* ownership (t-1) (2.24) (3.56) (1.94) (2.52) (1.92)
Other control variables? Yes Yes Yes Yes Yes
Observations 28,632 19,233 19,233 17,070 23,172 Adjusted R2 0.284 0.306 0.035 0.284 0.015

43
Table 4 The Effect of Investor Horizons on Investment
This table presents the results of regressions of investment on long-term investor ownership. The sample comprises 95,463 firm-year observations corresponding to 11,206 unique firms between 1985 and 2012. The firms in the sample are publicly traded U.S. operating firms excluding financials and utilities. All variables are defined in Appendix Table 1. The dependent variables are expressed as a percentage of total assets. The independent variables are standardized. Standard errors are clustered by industry-year. ***, **, and * indicate statistical significance at the 1%, 5%, and 10% levels, respectively. In Panel A, all results are tabulated, whereas in Panel B and Panel C, only selected results are tabulated.
Panel A: All Long-Term Investor Ownership Dependent variable is investment (t)
Capital
expenditures Res. and dev. expenditures
Acquisitions expenditures
Change in trade credit
Change in inventory
Long-term investor -0.41*** -0.51*** -0.26*** -0.49*** -0.33*** ownership (t-1) (-9.84) (-7.18) (-5.86) (-4.08) (-8.87)
Institutional ownership (t-1) 0.43*** 1.23*** 0.76*** 1.30*** 0.44*** (8.25) (14.94) (15.18) (10.49) (11.82)
ln(Total assets) (t-1) -0.20*** -1.22*** -0.15*** -0.70*** -0.53*** (-4.33) (-15.90) (-4.40) (-6.76) (-14.42)
Market-to-book (t-1) 0.49*** 1.05*** -0.02 1.21*** 0.16*** (16.20) (19.05) (-1.24) (10.37) (5.86)
Cash flow-to-total assets 0.82*** -4.24*** 0.39*** 3.50*** 0.57*** (t-1) (15.99) (-17.89) (14.85) (14.92) (11.78)
Stock returns (t-1) 0.23*** 0.06 0.25*** 3.15*** 0.94*** (7.62) (0.84) (10.17) (25.19) (19.79)
Volatility (t-1) -0.31*** -0.06 -0.29*** -1.32*** -0.81*** (-9.14) (-0.70) (-10.37) (-9.85) (-17.92)
Industry-year fixed effects? Yes Yes Yes Yes Yes
Observations 90,564 90,564 90,564 90,564 90,564 Adjusted R2 0.272 0.420 0.048 0.107 0.099

44
Panel B: Long-Term Investor Ownership Split into Indexer Ownership and Non-Indexer Ownership Dependent variable is investment (t)
Capital
expenditures Res. and dev. expenditures
Acquisitions expenditures
Change in trade credit
Change in inventory
Long-term indexer -0.30*** -0.30*** -0.01 -0.48*** -0.15*** ownership (t-1) (-8.11) (-3.54) (-0.19) (-3.85) (-3.99)
Long-term non-indexer -0.24*** -0.55*** -0.22*** -0.24*** -0.24*** ownership (t-1) (-7.69) (-10.14) (-6.65) (-2.75) (-8.46)
Other control variables? Yes Yes Yes Yes Yes
Observations 90,564 90,564 90,564 90,564 90,564 Adjusted R2 0.272 0.421 0.048 0.107 0.099
Panel C: Long-Term Investor Ownership Split into Index Firm Ownership and Non-Index Firm Ownership Dependent variable is investment (t)
Capital
expenditures Res. and dev. expenditures
Acquisitions expenditures
Change in trade credit
Change in inventory
Long-term index firm -0.35*** 0.03 -0.30*** -0.45*** -0.19*** ownership (t-1) (-10.63) (0.56) (-8.49) (-4.83) (-7.20)
Long-term non-index firm -0.36*** -0.64*** -0.19*** -0.41*** -0.34*** ownership (t-1) (-8.99) (-9.17) (-4.27) (-3.46) (-9.02)
Other control variables? Yes Yes Yes Yes Yes
Observations 90,564 90,564 90,564 90,564 90,564 Adjusted R2 0.272 0.421 0.048 0.107 0.099

45
Table 5 The Effect of Investor Horizons on Production Structure
This table presents the results of regressions of production structure on long-term investor ownership. The sample comprises 95,463 firm-year observations corresponding to 11,206 unique firms between 1985 and 2012. The firms in the sample are publicly traded U.S. operating firms excluding financials and utilities. All variables are defined in Appendix Table 1. The first, second, fourth, and fifth dependent variables are expressed as a percentage of sales. The third and sixth dependent variables are expressed as a ratio multiplied by 100. The independent variables are standardized. Standard errors are clustered by industry-year. ***, **, and * indicate statistical significance at the 1%, 5%, and 10% levels, respectively. In Panel A, all results are tabulated, whereas in Panel B and Panel C, only selected results are tabulated.
Panel A: All Long-Term Investor Ownership Dependent variable is production structure (t)
Labor
intensity Capital
intensity
Relative labor vs. capital
intensity
Labor costs Capital costs
Relative labor vs. capital costs
Long-term investor 18.05** -3.26*** 2.67*** 1.28 -0.63*** 1.08*** ownership (t-1) (2.54) (-5.69) (4.15) (1.55) (-6.80) (3.03)
Institutional -10.11 -1.06 -5.37*** 2.65*** 0.26** -0.08 ownership (t-1) (-1.18) (-1.61) (-7.65) (3.39) (2.48) (-0.28)
ln(Total assets) (t-1) -140.33*** 4.37*** -18.02*** -3.30*** 0.45*** -1.35*** (-20.83) (7.75) (-26.75) (-5.92) (2.82) (-6.34)
Market-to-book (t-1) 0.49 0.03 -3.11*** 0.21 0.25*** -0.89*** (0.09) (0.06) (-7.65) (0.35) (2.89) (-4.58)
Cash flow-to-total assets -256.87*** -16.16*** -0.36 -12.82*** -4.02*** -0.43 (t-1) (-12.59) (-12.73) (-0.62) (-7.67) (-16.56) (-1.45)
Stock returns (t-1) 21.16*** 1.05* 1.48*** 0.01 -0.26** 0.82*** (2.65) (1.75) (3.12) (0.02) (-2.16) (2.81)
Volatility (t-1) -43.45*** -0.12 -0.30 -0.86 0.77*** -0.62** (-6.00) (-0.21) (-0.52) (-1.29) (6.27) (-2.03)
Industry-year fixed effects? Yes Yes Yes Yes Yes Yes
Observations 88,391 89,663 88,811 6,362 89,642 6,381 Adjusted R2 0.243 0.315 0.188 0.345 0.262 0.149

46
Panel B: Long-Term Investor Ownership Split into Indexer Ownership and Non-Indexer Ownership Dependent variable is production structure (t)
Labor
intensity Capital
intensity
Relative labor vs. capital
intensity
Labor costs Capital costs
Relative labor vs. capital costs
Long-term indexer 29.79*** -3.65*** 1.32** 1.23 -0.19** 1.51*** ownership (t-1) (4.58) (-6.47) (2.44) (1.42) (-2.03) (4.51)
Long-term non-indexer 2.15 -1.44*** 1.58*** 0.76 -0.48*** 0.35 ownership (t-1) (0.39) (-3.48) (3.20) (1.34) (-6.91) (1.32)
Other control variables? Yes Yes Yes Yes Yes Yes
Observations 88,391 89,663 88,811 6,362 89,642 6,381 Adjusted R2 0.243 0.315 0.188 0.345 0.262 0.153
Panel C: Long-Term Investor Ownership Split into Index Firm Ownership and Non-Index Firm Ownership Dependent variable is production structure (t)
Labor
intensity Capital
intensity
Relative labor vs. capital
intensity
Labor costs Capital costs
Relative labor vs. capital costs
Long-term index firm 27.82*** -4.10*** 4.73*** 1.41*** -0.60*** 0.82*** ownership (t-1) (5.48) (-8.96) (10.38) (2.75) (-6.59) (3.73)
Long-term non-index firm 9.80 -2.36*** 1.19* 0.71 -0.53*** 1.05*** ownership (t-1) (1.41) (-4.29) (1.89) (0.80) (-6.26) (2.75)
Other control variables? Yes Yes Yes Yes Yes Yes
Observations 88,391 89,663 88,811 6,362 89,642 6,381 Adjusted R2 0.243 0.315 0.190 0.346 0.262 0.149

47
Table 6 The Effect of Investor Horizons on Financing
This table presents the results of regressions of financing on long-term investor ownership. The sample comprises 95,463 firm-year observations corresponding to 11,206 unique firms between 1985 and 2012. The firms in the sample are publicly traded U.S. operating firms excluding financials and utilities. All variables are defined in Appendix Table 1. The dependent variables are expressed as a percentage of total assets except for debt maturity. Debt maturity is long-term debt expressed as a percentage of total debt. The independent variables are standardized. Standard errors are clustered by industry-year. ***, **, and * indicate statistical significance at the 1%, 5%, and 10% levels, respectively. In Panel A, all results are tabulated, whereas in Panel B and Panel C, only selected results are tabulated.
Panel A: All Long-Term Investor Ownership Dependent variable is financing (t)
Change in short-term
debt
Change in long-term
debt
Debt maturity
Change in off balance sheet debt
Change in equity
Internal financing
Long-term investor -0.05** -0.43*** -1.32*** -0.34*** -0.58*** -0.01 ownership (t-1) (-2.13) (-6.99) (-5.44) (-10.61) (-8.34) (-0.15)
Institutional 0.02 0.62*** 3.74*** 0.49*** 0.85*** 0.37*** ownership (t-1) (0.75) (9.35) (14.87) (14.38) (10.75) (5.08)
ln(Total assets) (t-1) -0.08*** -0.25*** 5.85*** -0.43*** -1.55*** -0.18** (-3.92) (-4.82) (28.52) (-15.88) (-19.89) (-2.49)
Market-to-book (t-1) 0.01 0.39*** -0.41*** 0.29*** 2.19*** 0.47*** (0.72) (9.58) (-2.98) (10.27) (29.20) (7.16)
Cash flow-to-total assets 0.03* -0.03 1.25*** 0.68*** -4.74*** 1.44*** (t-1) (1.67) (-0.66) (6.21) (13.03) (-20.20) (10.12)
Stock returns (t-1) 0.04** 0.38*** 1.17*** 0.38*** 1.77*** 0.88*** (2.28) (8.53) (7.10) (15.38) (18.15) (13.59)
Volatility (t-1) -0.08*** -0.63*** -2.61*** -0.43*** -0.66*** -0.27*** (-3.37) (-12.92) (-14.87) (-12.83) (-9.04) (-3.41)
Industry-year fixed effects? Yes Yes Yes Yes Yes Yes
Observations 90,564 90,564 77,445 90,564 90,564 90,564 Adjusted R2 0.004 0.035 0.141 0.104 0.297 0.034

48
Panel B: Long-Term Investor Ownership Split into Indexer Ownership and Non-Indexer Ownership Dependent variable is financing (t)
Change in short-term
debt
Change in long-term
debt
Debt maturity
Change in off balance sheet debt
Change in equity
Internal financing
Long-term indexer -0.06*** -0.06 -0.35 -0.16*** -0.54*** -0.02 ownership (t-1) (-2.99) (-0.94) (-1.47) (-5.27) (-9.97) (-0.25)
Long-term non-indexer -0.02 -0.36*** -0.98*** -0.23*** 0.06 0.01 ownership (t-1) (-1.11) (-7.61) (-5.06) (-10.03) (0.89) (0.17)
Other control variables? Yes Yes Yes Yes Yes Yes
Observations 90,564 90,564 77,445 90,564 90,564 90,564 Adjusted R2 0.005 0.035 0.141 0.104 0.297 0.034
Panel C: Long-Term Investor Ownership Split into Index Firm Ownership and Non-Index Firm Ownership Dependent variable is financing (t)
Change in short-term
debt
Change in long-term
debt
Debt maturity
Change in off balance sheet debt
Change in equity
Internal financing
Long-term index firm -0.01 -0.30*** -3.26*** -0.26*** -0.12** -0.06 ownership (t-1) (-0.75) (-5.95) (-17.72) (-11.16) (-2.35) (-1.15)
Long-term non-index firm -0.05** -0.41*** -0.06 -0.31*** -0.69*** 0.02 ownership (t-1) (-2.43) (-6.89) (-0.24) (-9.99) (-10.23) (0.33)
Other control variables? Yes Yes Yes Yes Yes Yes
Observations 90,564 90,564 77,445 90,564 90,564 90,564 Adjusted R2 0.004 0.035 0.148 0.104 0.298 0.034

49
Table 7 The Effect of Investor Horizons on Payouts
This table presents the results of regressions of payouts on long-term investor ownership. The sample comprises 95,463 firm-year observations corresponding to 11,206 unique firms between 1985 and 2012. The firms in the sample are publicly traded U.S. operating firms excluding financials and utilities. All variables are defined in Appendix Table 1. The dependent variables are expressed as a percentage of total assets. The independent variables are standardized. Standard errors are clustered by industry-year. ***, **, and * indicate statistical significance at the 1%, 5%, and 10% levels, respectively. In Panel A, all results are tabulated, whereas in Panel B and Panel C, only selected results are tabulated.
Panel A: All Long-Term Investor Ownership Dependent variable is payouts (t)
Dividends Share repurchases Long-term investor ownership (t-1) 0.29*** 0.35*** (18.85) (10.70)
Institutional ownership (t-1) -0.38*** 0.08*** (-24.68) (2.69)
ln(Total assets) (t-1) 0.26*** 0.16*** (15.95) (6.21)
Market-to-book (t-1) 0.16*** 0.41*** (14.64) (19.59)
Cash flow-to-total assets (t-1) 0.21*** 0.54*** (13.72) (23.48)
Stock returns (t-1) -0.01** -0.12*** (-2.25) (-7.20)
Volatility (t-1) -0.31*** -0.18*** (-32.92) (-9.76)
Industry-year fixed effects? Yes Yes
Observations 90,564 90,564 Adjusted R2 0.188 0.103

50
Panel B: Long-Term Investor Ownership Split into Indexer Ownership and Non-Indexer Ownership Dependent variable is payouts (t)
Dividends Share repurchases Long-term indexer ownership (t-1) 0.12*** 0.76*** (7.18) (16.58)
Long-term non-indexer ownership (t-1) 0.20*** 0.02 (16.63) (0.78)
Other control variables? Yes Yes
Observations 90,564 90,564 Adjusted R2 0.188 0.113
Panel C: Long-Term Investor Ownership Split into Index Firm Ownership and Non-Index Firm Ownership Dependent variable is payouts (t)
Dividends Share repurchases Long-term index firm ownership (t-1) 0.36*** 0.57*** (23.36) (16.64)
Long-term non-index firm ownership (t-1) 0.20*** 0.19*** (15.56) (6.49)
Other control variables? Yes Yes
Observations 90,564 90,564 Adjusted R2 0.200 0.112

51
Table 8 The Effect of Investor Horizons on Stock Returns: Time-Series Analysis
This table presents the results of four-factor model regressions. Monthly time-series regressions are run for portfolios formed based on investor horizons. The sample comprises 95,463 firm-year observations corresponding to 11,206 unique firms between 1985 and 2012. The firms in the sample are publicly traded U.S. operating firms excluding financials and utilities. Observations are sorted into quintiles based on investor horizons. Investor horizons are the difference between various measures of long-term investor ownership and short-term investor ownership. Each month during the year after portfolio formation, mean raw returns are computed for portfolios formed based on quintiles of investor horizons. Finally, each month, mean raw returns are computed for the portfolio that is long the top quintile and short the bottom quintile of investor horizons. A time-series regression is run of the excess stock returns of this portfolio on the returns of the four factors, and the results are presented. Excess stock returns are raw returns minus the risk-free rate. All returns variables are measured in percentages. ***, **, and * indicate statistical significance at the 1%, 5%, and 10% levels, respectively.
Dependent variable is excess stock returns
Measure of investor horizons
Long-term investor
ownership minus short-term investor
ownership
Long-term indexer
ownership minus short-term investor
ownership
Long-term non-indexer ownership
minus short-term investor
ownership
Long-term index firm ownership
minus short-term investor
ownership
Long-term non-index firm
ownership minus short-term investor
ownership 0.29* 0.59** 0.41** 0.47* 0.34* (1.80) (2.06) (2.10) (1.91) (1.88)
(MKT) -0.24*** -0.29*** -0.28*** -0.30*** -0.23*** (-5.88) (-4.75) (-6.00) (-5.48) (-5.54)
(SMB) 0.13** 0.34*** 0.22*** 0.12 0.45*** (2.04) (3.33) (2.92) (1.32) (6.24)
(HML) 0.27*** -0.09 0.15 -0.06 0.20** (3.33) (-0.67) (1.50) (-0.52) (2.30)
(UMD) -0.02 -0.15 -0.01 -0.08 -0.06 (-0.52) (-1.28) (-0.26) (-0.82) (-1.06)
Observations 336 336 336 336 336

52
Table 9 The Effect of Investor Horizons on Stock Returns: Cross-Sectional Analysis
This table presents the results of Fama-MacBeth regressions of excess stock returns on long-term investor ownership. Cross-sectional regressions are run for each month, and the means and t-statistics of the resulting time-series of monthly coefficient estimates are computed. The sample comprises 1,128,483 firm-month observations corresponding to 11,206 unique firms between January 1985 and December 2012. The firms in the sample are publicly traded U.S. operating firms excluding financials and utilities. Excess stock returns are raw returns minus industry returns, and they are measured during month t. Industry is defined using two-digit SIC codes. Investor ownership variables are defined in Appendix Table 1, and they are measured as of the calendar year before the current year. Size is the natural logarithm of market capitalization, and it is measured at the end of month t-2. Book-to-market is the natural logarithm of book-to-market. Returns 2-3, returns 4-6, and returns 7-12 are the natural logarithm of cumulative raw stock returns from month t-3 to month t-2, month t-6 to month t-4, and month t-12 to month t-7, respectively. Volume is the natural logarithm of the dollar value of trading during month t-2. Dividend yield is the ratio of dividends paid during the fiscal year to market capitalization at the end of the fiscal year. Stock price is the natural logarithm of the stock price, and it is measured at the end of month t-2. Both book-to-market and dividend yield are measured as of the most recent fiscal year. The dependent variables are multiplied by 100. Investor ownership variables are standardized. ***, **, and * indicate statistical significance at the 1%, 5%, and 10% levels, respectively.

53
Dependent variable is excess stock returns (t) Long-term investor ownership (t-1) 0.08* (1.70)
Long-term indexer ownership (t-1) 0.16*** (2.68)
Long-term non-indexer ownership (t-1) 0.04 (1.09)
Long-term index firm ownership (t-1) 0.14*** (2.91)
Long-term non-index firm ownership (t-1) 0.03 (0.66)
Institutional ownership (t-1) 0.14** 0.12* 0.17** (2.13) (1.80) (2.59)
Size (t-1) 0.11* 0.09 0.07 (1.72) (1.48) (1.17)
Book-to-market (t-1) 0.22*** 0.22*** 0.22*** (5.56) (5.44) (5.41)
Returns month t-3 to month t-2 0.42* 0.44* 0.44* (1.70) (1.79) (1.76)
Returns month t-6 to month t-4 0.61*** 0.63*** 0.63*** (3.18) (3.32) (3.26)
Returns month t-12 to month t-7 0.62*** 0.64*** 0.62*** (4.66) (4.82) (4.72)
Volume (t-1) -0.10 -0.11* -0.10 (-1.59) (-1.65) (-1.57)
Dividend yield (t-1) 1.53 0.87 0.95 (0.94) (0.55) (0.61)
Stock price (t-1) -0.32*** -0.31*** -0.29*** (-3.07) (-3.03) (-2.82)
Constant 1.59** 1.79** 1.71** (2.37) (2.58) (2.45)
Observations 1,067,592 1,067,592 1,067,592 Number of groups 336 336 336

54
Table 10 The Effect of Investor Horizons on Profitability
This table presents the results of regressions of profitability on long-term investor ownership. The sample comprises 95,463 firm-year observations corresponding to 11,206 unique firms between 1985 and 2012. The firms in the sample are publicly traded U.S. operating firms excluding financials and utilities. All variables are defined in Appendix Table 1. The first three dependent variables are expressed as a percentage of total assets. The last two dependent variables are expressed as the natural logarithm of one plus the variable and are multiplied by 100. The independent variables are standardized. Standard errors are clustered by industry-year. ***, **, and * indicate statistical significance at the 1%, 5%, and 10% levels, respectively. In Panel A, all results are tabulated, whereas in Panel B and Panel C, only selected results are tabulated.
Panel A: All Long-Term Investor Ownership Dependent variable is profitability (t)
Earnings Sales Costs Earnings forecast errors
Earnings announcement
returns Long-term investor 0.49*** 4.46*** 4.19*** 0.07*** 0.11*** ownership (t-1) (3.35) (8.88) (8.51) (2.98) (3.05)
Institutional ownership (t-1) 0.74*** -6.97*** -7.83*** -0.26*** 0.16*** (5.62) (-12.91) (-14.98) (-9.84) (4.40)
ln(Total assets) (t-1) 0.18 -8.40*** -10.23*** (0.98) (-14.43) (-18.13)
Market-to-book (t-1) -0.40*** -0.61* -0.65* (-3.24) (-1.75) (-1.92)
Cash flow-to-total assets 14.18*** 13.48*** -2.15*** (t-1) (45.39) (21.21) (-4.06)
Stock returns (t-1) 3.07*** -0.80 -2.20*** (18.67) (-1.64) (-5.02)
Volatility (t-1) -3.69*** 1.05** 2.11*** (-16.72) (2.23) (4.77)
ln(Market capitalization) (t-1) -0.55*** -0.10*** (-19.04) (-3.33)
ln(Book-to-market) (t-1) 0.22*** 0.25*** (8.85) (10.91)
Industry-year fixed effects? Yes Yes Yes Yes Yes
Observations 90,465 90,466 90,465 56,789 84,879 Adjusted R2 0.444 0.331 0.307 0.075 0.009

55
Panel B: Long-Term Investor Ownership Split into Indexer Ownership and Non-Indexer Ownership Dependent variable is profitability (t)
Earnings Sales Costs Earnings forecast errors
Earnings announcement
returns Long-term indexer 0.20 1.96*** 1.97*** 0.10*** 0.10*** ownership (t-1) (1.24) (3.64) (3.77) (3.74) (3.31)
Long-term non-indexer 0.37*** 3.17*** 2.92*** 0.03 0.06** ownership (t-1) (3.48) (7.88) (7.56) (1.38) (2.16)
Other control variables? Yes Yes Yes Yes Yes
Observations 90,465 90,466 90,465 56,789 84,879 Adjusted R2 0.444 0.331 0.307 0.075 0.010
Panel C: Long-Term Investor Ownership Split into Index Firm Ownership and Non-Index Firm Ownership Dependent variable is profitability (t)
Earnings Sales Costs Earnings forecast errors
Earnings announcement
returns Long-term index firm 0.43*** 3.32*** 3.40*** 0.16*** 0.12*** ownership (t-1) (3.52) (8.08) (8.40) (9.13) (4.78)
Long-term non-index firm 0.44*** 4.22*** 3.83*** 0.01 0.08** ownership (t-1) (3.22) (8.73) (8.09) (0.35) (2.32)
Other control variables? Yes Yes Yes Yes Yes
Observations 90,465 90,466 90,465 56,789 84,879 Adjusted R2 0.444 0.331 0.307 0.077 0.010

56
Table 11 The Effect of Investor Horizons on Volatility
This table presents the results of regressions of volatility on long-term investor ownership. The sample comprises 95,463 firm-year observations corresponding to 11,206 unique firms between 1985 and 2012. The firms in the sample are publicly traded U.S. operating firms excluding financials and utilities. All variables are defined in Appendix Table 1. The dependent variables are multiplied by 100. The independent variables are standardized. Standard errors are clustered by industry-year. ***, **, and * indicate statistical significance at the 1%, 5%, and 10% levels, respectively. In Panel A, all results are tabulated, whereas in Panel B and Panel C, only selected results are tabulated.
Panel A: All Long-Term Investor Ownership Dependent variable is ln(volatility) (t)
Earnings Sales Costs Stock returns Long-term investor ownership (t-1) -3.94*** -4.51*** -4.75*** -2.69*** (-3.66) (-7.98) (-9.45) (-12.95)
Institutional ownership (t-1) -1.32 1.52** -1.02* 2.51*** (-1.27) (2.43) (-1.85) (15.00)
ln(Total assets) (t-1) -6.87*** -13.07*** -5.72*** -6.70*** (-8.99) (-26.40) (-12.05) (-34.14)
Market-to-book (t-1) -10.98*** 5.03*** 3.51*** 0.51*** (-16.20) (15.27) (12.34) (5.57)
Cash flow-to-total assets (t-1) 0.86 -19.53*** -10.77*** 0.30 (0.81) (-24.00) (-26.00) (1.54)
Stock returns (t-1) -9.43*** 0.30 -0.94*** -1.67*** (-14.95) (0.70) (-2.65) (-12.06)
Volatility (t-1) 20.41*** 10.06*** 10.57*** 45.76*** (29.58) (20.25) (22.94) (130.92)
Industry-year fixed effects? Yes Yes Yes Yes
Observations 84,478 84,110 84,480 90,654 Adjusted R2 0.089 0.256 0.191 0.908

57
Panel B: Long-Term Investor Ownership Split into Indexer Ownership and Non-Indexer Ownership Dependent variable is ln(volatility) (t)
Earnings Sales Costs Stock returns Long-term indexer ownership (t-1) -5.73*** -0.05 -0.75 -0.30 (-5.64) (-0.08) (-1.42) (-1.32)
Long-term non-indexer ownership (t-1) -1.09 -3.93*** -3.83*** -2.21*** (-1.31) (-9.15) (-9.88) (-15.11)
Other control variables? Yes Yes Yes Yes
Observations 84,478 84,110 84,480 90,654 Adjusted R2 0.089 0.257 0.191 0.908
Panel C: Long-Term Investor Ownership Split into Index Firm Ownership and Non-Index Firm Ownership Dependent variable is ln(volatility) (t)
Earnings Sales Costs Stock returns Long-term index firm ownership (t-1) -10.02*** -2.76*** -3.52*** -3.54*** (-12.49) (-5.93) (-8.50) (-19.31)
Long-term non-index firm ownership (t-1) -0.45 -4.64*** -4.54*** -1.77*** (-0.43) (-8.54) (-9.30) (-9.60)
Other control variables? Yes Yes Yes Yes
Observations 84,478 84,110 84,480 90,654 Adjusted R2 0.093 0.257 0.191 0.909

58
Table 12 The Effect of Investor Horizons on Extreme Stock Returns and Credit Events
This table presents the results of regressions of extreme stock returns and credit events on long-term investor ownership. The sample comprises 95,463 firm-year observations corresponding to 11,206 unique firms between 1985 and 2012. The firms in the sample are publicly traded U.S. operating firms excluding financials and utilities. All variables are defined in Appendix Table 1. Extreme negative and positive returns as well as covenant violation, default, and bankruptcy are dummy variables that equal one if they occur in a given firm-year and zero otherwise. The dependent variables are multiplied by 100. The independent variables are standardized. Standard errors are clustered by industry-year. ***, **, and * indicate statistical significance at the 1%, 5%, and 10% levels, respectively. In Panel A, all results are tabulated, whereas in Panel B and Panel C, only selected results are tabulated.
Panel A: All Long-Term Investor Ownership Dep. var. is extreme stock returns (t) Dep. var. is credit event (t)
Negative skewness
Extreme negative returns
Extreme positive returns
Covenant violation
Default Bankruptcy
Long-term investor -5.92*** -1.60*** 2.05*** -0.58*** -0.46*** -0.53*** ownership (t-1) (-6.42) (-5.37) (6.59) (-3.01) (-5.23) (-4.34)
Institutional 22.42*** 4.53*** -5.61*** -1.13*** 0.04 -0.40*** ownership (t-1) (20.71) (14.23) (-17.98) (-5.49) (0.45) (-3.26)
ln(Total assets) (t-1) -1.44* -1.43*** -4.14*** -1.32*** 1.18*** 1.30*** (-1.96) (-5.92) (-16.43) (-7.84) (12.18) (12.50)
Market-to-book (t-1) 6.68*** 0.82*** -1.63*** -0.45*** -0.03 0.10 (14.04) (5.46) (-9.52) (-3.94) (-0.58) (1.34)
Cash flow-to-total assets 6.14*** 0.36* -1.49*** 0.51*** -0.08* -0.86*** (t-1) (9.53) (1.90) (-6.24) (3.17) (-1.92) (-8.26)
Stock returns (t-1) 6.07*** 1.12*** -2.97*** -1.65*** -0.48*** -1.07*** (11.62) (6.81) (-15.26) (-9.68) (-8.02) (-10.43)
Volatility (t-1) -1.71** -1.71*** -0.14 1.96*** 0.79*** 1.66*** (-2.29) (-8.36) (-0.50) (9.67) (9.13) (13.84)
Industry-year fixed effects? Yes Yes Yes Yes Yes Yes
Observations 89,744 89,755 89,755 45,765 74,094 74,094 Adjusted R2 0.049 0.027 0.039 0.043 0.039 0.047

59
Panel B: Long-Term Investor Ownership Split into Indexer Ownership and Non-Indexer Ownership Dep. var. is extreme stock returns (t) Dep. var. is credit event (t)
Negative skewness
Extreme negative returns
Extreme positive returns
Covenant violation
Default Bankruptcy
Long-term indexer -1.11 0.43 1.77*** -1.16*** -0.67*** -0.76*** ownership (t-1) (-1.18) (1.55) (5.77) (-6.93) (-7.21) (-5.56)
Long-term non-indexer -5.39*** -1.49*** 1.05*** -0.11 -0.15** -0.19** ownership (t-1) (-7.89) (-6.38) (4.51) (-0.72) (-2.25) (-2.15)
Other control variables? Yes Yes Yes Yes Yes Yes
Observations 89,744 89,755 89,755 45,765 74,094 74,094 Adjusted R2 0.049 0.027 0.040 0.044 0.040 0.048
Panel C: Long-Term Investor Ownership Split into Index Firm Ownership and Non-Index Firm Ownership Dep. var. is extreme stock returns (t) Dep. var. is credit event (t)
Negative skewness
Extreme negative returns
Extreme positive returns
Covenant violation
Default Bankruptcy
Long-term index firm -3.96*** -1.14*** 1.38*** -0.45*** -0.84*** -0.98*** ownership (t-1) (-5.05) (-4.74) (5.39) (-3.29) (-9.88) (-9.74)
Long-term non-index firm -5.44*** -1.40*** 1.94*** -0.58*** -0.15* -0.18 ownership (t-1) (-6.08) (-4.74) (6.41) (-3.02) (-1.88) (-1.56)
Other control variables? Yes Yes Yes Yes Yes Yes
Observations 89,744 89,755 89,755 45,765 74,094 74,094 Adjusted R2 0.049 0.027 0.039 0.043 0.043 0.049

60
Table 13 The Effect of Investor Horizons on Organizational Structure
This table presents the results of regressions of organizational structure on long-term investor ownership. The sample comprises 95,463 firm-year observations corresponding to 11,206 unique firms between 1985 and 2012. The firms in the sample are publicly traded U.S. operating firms excluding financials and utilities. All variables are defined in Appendix Table 1. All of the dependent variables except the fourth range from zero to one. The fourth dependent variable is a dummy variable that equals one if the firm has foreign operations and zero otherwise. The dependent variables are multiplied by 100. The independent variables are standardized. Standard errors are clustered by industry-year. ***, **, and * indicate statistical significance at the 1%, 5%, and 10% levels, respectively. In Panel A, all results are tabulated, whereas in Panel B and Panel C, only selected results are tabulated.
Panel A: All Long-Term Investor Ownership Dependent variable is organizational structure (t)
Business
concentration Industry
concentration Geographic concentration
Foreign operations
Customer concentration
Product concentration
Long-term investor -2.77*** -1.24*** -0.56*** 2.79*** -0.61*** -1.89*** ownership (t-1) (-15.64) (-8.88) (-3.02) (7.56) (-7.97) (-5.45)
Institutional 4.18*** 2.99*** -0.84*** 1.27*** 0.33*** 3.72*** ownership (t-1) (22.52) (21.44) (-3.90) (3.21) (3.52) (9.89)
ln(Total assets) (t-1) -9.20*** -5.09*** -8.46*** 16.72*** -0.97*** -7.81*** (-46.40) (-34.88) (-40.86) (49.94) (-13.18) (-19.51)
Market-to-book (t-1) 1.34*** 0.93*** -0.61*** -0.35* -0.13** 1.61*** (14.75) (15.17) (-6.39) (-1.91) (-2.40) (7.42)
Cash flow-to-total assets -0.05 0.50*** -0.31* 1.98*** -0.34*** -1.02*** (t-1) (-0.32) (6.62) (-1.93) (9.03) (-5.01) (-3.58)
Stock returns (t-1) -0.55*** -0.53*** 0.15 0.30 0.10* -0.29 (-4.81) (-6.82) (1.27) (1.30) (1.72) (-1.08)
Volatility (t-1) 1.27*** 1.23*** -0.73*** -0.54** 0.01 1.62*** (8.39) (12.82) (-6.88) (-2.15) (0.23) (4.43)
Industry-year fixed effects? Yes Yes Yes Yes Yes Yes
Observations 89,495 89,475 82,271 90,565 90,107 18,228 Adjusted R2 0.213 0.135 0.363 0.258 0.108 0.165

61
Panel B: Long-Term Investor Ownership Split into Indexer Ownership and Non-Indexer Ownership Dependent variable is organizational structure (t)
Business
concentration Industry
concentration Geographic concentration
Foreign operations
Customer concentration
Product concentration
Long-term indexer -1.81*** -0.07 -0.50*** 2.10*** -0.48*** -1.48*** ownership (t-1) (-9.82) (-0.47) (-2.64) (5.66) (-6.70) (-4.09)
Long-term non-indexer -1.69*** -1.04*** -0.33** 1.73*** -0.35*** -1.06*** ownership (t-1) (-12.71) (-9.94) (-2.28) (6.26) (-5.86) (-4.05)
Other control variables? Yes Yes Yes Yes Yes Yes
Observations 89,495 89,475 82,271 90,565 90,107 18,228 Adjusted R2 0.213 0.135 0.364 0.258 0.108 0.166
Panel C: Long-Term Investor Ownership Split into Index Firm Ownership and Non-Index Firm Ownership Dependent variable is organizational structure (t)
Business
concentration Industry
concentration Geographic concentration
Foreign operations
Customer concentration
Product concentration
Long-term index firm -2.78*** -1.44*** -1.01*** 3.52*** -0.46*** -2.29*** ownership (t-1) (-17.64) (-10.56) (-6.72) (11.13) (-8.00) (-7.95)
Long-term non-index firm -2.30*** -0.94*** -0.26 2.10*** -0.56*** -1.53*** ownership (t-1) (-13.67) (-7.40) (-1.51) (5.90) (-7.36) (-4.56)
Other control variables? Yes Yes Yes Yes Yes Yes
Observations 89,495 89,475 82,271 90,565 90,107 18,228 Adjusted R2 0.215 0.136 0.364 0.259 0.108 0.167

62
0%
10%
20%
30%
40%
50%
60%
70%
80%
90%
t+1
t+2
t+3
t+4
t+5
t+6
t+7
t+8
t+9
t+10
t+11
t+12
t+13
t+14
t+15
t+16
t+17
t+18
t+19
t+20
Quarters after measurement of investor portfolio turnover
Mea
n pe
rcen
t of
port
foli
o tu
rned
ove
r
Quartile 4 (short-term investors) Quartile 3Quartile 2 Quartile 1 (long-term investors)
Figure 1. Future investor turnover as a function of past investor turnover. This figure presents future portfolio turnover as a function of past portfolio turnover. The sample comprises 104,306 investor-quarters consisting of 3,491 unique investors between 1984 and 2011. Each calendar quarter, investors are sorted into quartiles based on their portfolio turnover. Next, for each calendar quarter and each investor portfolio turnover quartile, the mean portfolio turnover of investors is computed for each of the next twenty event quarters. Finally, for each event quarter and each investor portfolio turnover quartile, the mean investor portfolio turnover is computed over all calendar quarters.

63
0%
5%
10%
15%
20%
25%
30%
t+1
t+2
t+3
t+4
t+5
t+6
t+7
t+8
t+9
t+10
t+11
t+12
t+13
t+14
t+15
t+16
t+17
t+18
t+19
t+20
Quarters after measurement of investor ownership
Mea
n pe
rcen
t of
firm
ow
ned
Quartile 1 (least long-term investors) Quartile 2Quartile 3 Quartile 4 (most long-term investors)
Figure 2. Future long-term investor ownership as a function of present long-term investor ownership. This figure presents future long-term investor ownership as a function of present long-term investor ownership. The sample comprises 95,463 firm-year observations corresponding to 11,206 unique firms between 1985 and 2012. The firms in the sample are publicly traded U.S. operating firms excluding financials and utilities. All variables are defined in Appendix Table 1.

64
-0.10
0.00
0.10
0.20
0.30
0.40
0.50
0.60
0.70
Q1 (shortest) Q2 Q3 Q4 Q5 (longest)
Investor horizons quintiles
Alp
ha
LT-ST LT_I-ST LT_NI-ST LT_IF-ST LT_NIF-ST
Figure 3. Investor horizons and risk-adjusted abnormal returns. This figure presents the alphas of four-factor model regressions. Monthly time-series regressions are run for portfolios formed based on investor horizons like in Table 8. In this figure, alphas for each quintile of investor horizons are presented. By comparison, in Table 8, the alphas presented are for a portfolio that is long the top quintile of investor horizons (longest investor horizons) and short the bottom quintile of investor horizons (shortest investor horizons). Investor horizons are the difference between various measures of long-term investor ownership and short-term investor ownership. The abbreviations for the investor ownership measures are as follows. "ST" and "LT" are short-term and long-term investor ownership, respectively. "LT_I" and "LT_NI" are long-term indexer and non-indexer ownership, respectively. "LT_IF" and "LT_NIF" are long-term index and non-index firm ownership, respectively.

65
Appendix Table 1 Variable Definitions
This table presents variable definitions. Variables are computed for each firm and each year. Industry is defined using two-digit SIC codes. * indicates that the variable is defined using Compustat data items.
Name Definition
Investor ownership variables - Long-term investor ownership Fraction of shares owned by institutional investors that are long-term
investors. Investors with three-year portfolio turnover of 35% or less are classified as "long-term investors". See Gaspar, Massa, and Matos (2005) and Chen, Harford, and Li (2007) for computing investor portfolio turnover.
- Long-term indexer ownership Fraction of shares owned by institutional investors that are both long-term investors and indexers. Investors with active share of 25% or less are classified as "indexers". See Cremers and Petajisto (2009) for computing active share.
- Long-term non-indexer ownership Fraction of shares owned by institutional investors that are both long-term investors and non-indexers
- Long-term index firm ownership Fraction of shares owned by institutional investors that are long-term investors for S&P 500 firms, and zero for non-S&P 500 firms
- Long-term non-index firm ownership Fraction of shares owned by institutional investors that are long-term investors for non-S&P 500 firms, and zero for S&P 500 firms
- Institutional ownership Fraction of shares owned by institutional investors
Corporate misbehavior variables - Earnings management Absolute value of discretionary accruals divided by total assets. See
Dechow, Sloan, and Sweeney (1995) for estimating discretionary accruals.
- Accounting misconduct Dummy variable for whether the firm's financial statements in the current year are the subject of an enforcement action by the SEC
- Financial fraud Dummy variable for whether the firm is the subject of a securities class action lawsuit in the current year
- Option backdating Dummy variable for whether the firm's CEO receives a backdated option grant. See Bebchuk, Grinstein, and Peyer (2010) for estimating option backdating.
Internal governance variables - Shareholder proposals Total number of shareholder proposals in the current year - Board independence Fraction of independent directors on the board - Board attendance Fraction of directors that attend at least three-quarters of board
meetings - Board experience Mean number of directorships held by directors at other publicly
traded firms - Executive turnover Dummy variable for whether the CEO in the current year is new
Investment variables - Capital expenditures CAPX/AT * - Research and development expenditures XRD/AT * - Acquisitions expenditures AQC/AT * - Change in trade credit ∆(ACT-LCT)/AT * - Change in inventory ∆INVT/AT *

66
Production structure variables - Labor intensity (1000EMP)/SALE * - Capital intensity PPENT/SALE * - Relative labor versus capital intensity (1000EMP)/PPENT * - Labor costs XLR/SALE * - Capital costs DP/SALE * - Relative labor versus capital costs XLR/DP *
Financing variables - Change in short-term debt DLCCH/AT * - Change in long-term debt (DLTIS-DLTR)/AT * - Debt maturity DLTT/(DLC+DLTT) * - Change in off balance sheet debt ∆(XRENT+MRC1+MRC2+MRC3+MRC4+MRC5)/AT * - Change in equity SSTK/AT * - Internal financing CHECH/AT *
Payout variables - Dividends DV/AT * - Share repurchases PRSTKC/AT *
Profitability variables - Earnings NI/AT * - Sales SALE/AT * - Costs (COGS+XSGA)/AT * - Earnings forecast errors Mean of quarterly earnings forecast errors. Earnings forecast errors
are measured as analysts' earnings estimates minus earnings reported by the firm all divided by the stock price.
- Earnings announcement returns Mean of quarterly earnings announcement returns. Earnings announcement returns are measured as raw returns minus market returns during the three days centered on the earnings announcement date.
Volatility variables - Earnings Coefficient of variation of quarterly earnings per share computed
using three years of quarterly data. Quarterly earnings per share is measured as EPSPXQ/AJEXQ. *
- Sales Coefficient of variation of quarterly sales per share computed using three years of quarterly data. Quarterly sales per share is measured as (SALEQ/CSHOQ)/AJEXQ. *
- Costs Coefficient of variation of quarterly costs per share computed using three years of quarterly data. Quarterly costs per share is measured as ((COGSQ+XSGAQ)/CSHOQ)/AJEXQ. *
- Stock returns Annualized standard deviation of daily stock returns
Extreme stock returns and credit event var.s - Negative skewness Negative of skewness of daily excess stock returns. Excess stock
returns are raw returns minus market returns. - Extreme negative and positive returns Weekly excess stock returns are greater or less, respectively, than
3.09 standard deviations of their mean during at least one week of the year. Excess stock returns are the residuals from the regression of raw returns on market returns. See Hutton, Marcus, and Tehranian (2009) for details.
- Covenant violations The firm violates a debt covenants in the next year - Default The firm defaults on its debt in the next three years - Bankrupt The firm is the subject of a bankruptcy filing in the next three years

67
Organizational structure variables - Business, industry, geographic, customer, and product concentration
Herfindahl-Hirschman index of the firm's segment sales relative to the firm's total sales for business, industry, geographic, customer, and product segments *
- Foreign operations Dummy variable for whether PIFO is not equal to zero *
Control variables - Total assets AT * - Market-to-book (PRCC_FCSHO)/(TXDITC+CEQ) * - Cash flow-to-total assets (IB+DP)/AT * - Stock returns Annualized daily stock returns - Volatility Annualized standard deviation of daily stock returns