Embed Size (px)
Citation preview
1
Do Household Definitions Matter in Survey Design? Results from a Randomized Survey Experiment in Mali
Lori Beaman* Northwestern University
Andrew Dillon†
International Food Policy Research Institute
June 2011 Abstract Household definitions used in multi-topic household surveys vary between surveys but have potentially significant implications for household composition, production, and poverty statistics. Standard definitions of the household usually include some intersection of keywords relating to residency requirements, common food consumption, and intermingling of income or production decisions. Despite best practices intending to standardize the definition of the household, it is unclear which types of definitions or which intersections of keywords in a definition result in different household compositions. This paper conducts a randomized survey experiment of four different household definitions in Mali to examine the implications for household-level statistics. This approach permits analysis of the trade-offs between alternative definition types. We find that additional keywords in definitions increase rather than decreases household size and significantly alters household composition. Definitions emphasizing common consumption or joint production increase estimates of the levels of household assets and consumption statistics, but not on per adult equivalency asset and consumption statistics, relative to open-ended definitions of the household. In contrast, definition type did not affect production statistics in levels, though we observe significant differences in per adult equivalency terms. Our findings suggest that variations in household definition have implications for measuring household welfare and production. Keywords: household definition, randomized experiment, assets, consumption JEL codes: C81, C93, J12 * Department of Economics, Northwestern University. Email: [email protected] † International Food Policy Research Institute. Email: [email protected] Acknowledgments
Funding from the Millennium Challenge Corporation (MCC) is gratefully acknowledged, along with the helpful assistance of Madeleine Gauthier and Annette Richter. Nouhoum Traore and Aissatou Ouedraogo provided excellent research assistance. We thank the editors, Kathleen Beegle, Kristen Himelein, three anonymous referees, seminar participants at IFPRI, and conference participants at the Survey Design and Measurement Conference sponsored by the Enterprise Institute, Yale University, and the World Bank for insightful comments. These findings do not reflect the position or opinions of MCC. All errors are our own.
2
1. Introduction
Household definitions used in multitopic household surveys vary between surveys, but have
potentially significant implications for household composition as well as statistics generated for
household units. Standard definitions of the household usually include some intersection of
keywords relating to residency requirements, common food consumption, and common
intermingling of income or production decisions. Many explicitly require that the listing of
persons cited as household members acknowledge a common household head. Despite best
practices to standardize the definition of the household, it is unclear which types of definitions or
which intersections of keywords in a definition result in differences in household composition or
size. More problematic, the reported household listing may not capture the relevant economic
unit, and that could bias household statistics such as consumption aggregates, assets, or
household production. Although different household definitions may be used to address different
economic units of interest, it is unclear whether comparing results from surveys using different
definitions would affect empirical analysis. Further comparisons within countries over time or
across countries may be biased if alternative household definitions were used when collecting the
data. The existence or extent of biases is difficult to assess, however, as there is no rigorous
evidence on how sensitive household statistics are to the chosen definition.
We investigate this question using a survey experiment in rural Mali where four recent national
surveys used four different household definitions, resulting in varying reported household sizes
from 5.7 to 9.1. Most households in rural Mali, like in many developing country contexts,
depend on subsistence agriculture, and households live in close proximity to extended family
members in shared family compounds. Given the rather complex structure of household
arrangements in Mali, it is an excellent setting to examine whether measures of household
structure, assets, food consumption and agricultural production are sensitive to the definition of
the household used in a standard household survey. The problem of correctly classifying
individuals into household units is a problem that may be particularly acute in societies where
extended families cohabitate together in shared family compounds.
The paper conducts a randomized survey experiment of four different household definitions to
examine the implications for household statistics. This approach permits analysis of the trade-
3
offs between alternative definition types.1 We chose to vary definition types by adding or
removing specific conditions or keywords commonly used in the household definition to test the
effect of those requirements on household composition and statistics. The first definition requires
only that members of the household live in the same dwelling space and acknowledge a common
household head. The second includes the criteria of the first definition but adds the criterion that
households eat commonly prepared food together. The third definition includes the criteria from
the first definition and adds the stipulation that members must work together on at least one
agricultural plot or in one revenue-generating activity. The fourth definition combines the eating
and production requirements of the second and third definitions with the criteria from the first
definition.
We find that different household definitions have significant implications for household
composition as well as for assets and consumption statistics. In particular, household size
changes when common income generating and production keywords (definition 3) are added to
the open-ended definition (definition 1). We also find variation in household composition even
among definition types that have no effect on total household size. Each of the definitions 2, 3,
and 4 leads to more adults (aged 16-60) reported within the household, relative to definition 1. In
particular, the number of married brothers and married sons within the household also varies by
household definition. This suggests that how “nuclear” conjugal units are combined into a
household is sensitive to the formulation of the household definition.2
These changes in household size and structure have consequences on household statistics,
especially those statistics that are paramount to the measurement of household welfare.
Household asset holdings are higher in definition 3 households: on average such households
have 0.3 of a standard deviation more of common agricultural items, 0.2 of a standard deviation
1 Fundamentally, we do not know what the “true” household size is when comparing alternative definitions, or whether in extended cohabitating families, members can be assigned into “true” households, since the criteria of economic production and mutual production of public goods that define an economic household become blurred. 2 Another important question is whether everyone in the village is counted under each definition—that is, whether a change in the definition of the household just re-allocates individuals into different households or whether some definitions leave out individuals altogether. Since the survey experiment randomized the definition at the household level and there are no reliable population figures for these villages, it is challenging for us to directly address this question. We provide some suggestive evidence below that in the majority of households in the sample, additional keywords in definitions are likely leading to the inclusion of omitted persons, rather than double counting below.
4
of additional animals, and 0.2 of a standard deviation more of non-farm household durable
goods. Households asked to use the common consumption definition (definition 2) also report
more livestock holdings. However, there is little evidence that per adult equivalency measures of
assets vary by household definition. An emphasis on common food consumption in definition 2
leads to reports of higher consumption of grains in the last seven days. These patterns are largely
consistent with an increase in household size and the change in the composition of the household
altering measured assets, livestock and consumption figures.
We do not observe differences across the definitions for the levels of agricultural production and
inputs, but do note that production statistics measured in per adult equivalents differ significantly
for definition 4 relative to definition 1. The fact that per adult equivalency measures are sensitive
to household definition for some outcomes of interest suggests that both changes in household
size and composition drive differences across the consumption, asset and production modules
and that respondents do not “scale” their responses uniformly across the different modules. This
may be due to asymmetric information among household members as consumption and asset
holdings may be relatively more observable when food is consumed and assets stored in
common, while agriculture may be decentralized across multiple plots by several different
decision makers. A simpler explanation may be that individuals always report output from
agricultural plots they work on or benefit from, irrespective of who was reported to be household
members in conjunction with a given household definition. Finally, differences in recall periods
across the modules could also affect measurement.
The choice of household definition used in a survey may be particularly important in an
environment such as Mali where people live in compounds. Although this is common in West
Africa, potential ambiguities may arise in other settings with multigenerational or extended
families. Therefore, the next section provides a background on the existence of complex
household structures in many low-income societies around the world. Nevertheless, the lessons
from this survey experiment are particularly relevant for household surveys conducted in Sub-
Saharan Africa, particularly West Africa.
The rest of the paper is organized as follows: in the second section, we provide some background
on household structure in Mali, including a description of previous household definitions used in
prominent Malian surveys which motivated our choice of definitions in this study. The study
5
design and the data collected to conduct this experiment are also described in this section. In the
third section, we present our results. The last section concludes with a more detailed discussion
of the implications of this experiment for future household surveys.
2. Background, Experimental Design, and Data
Background and Context
Whereas the most commonly used definition of the household is one that relates to the notion of
consumption from the “common pot,” there are a range of ambiguities related to the definition in
almost all country contexts. These include problems of classification related to residency
requirements, kinship, and the differentiation between income contributions to the common pot
and informal social insurance such as transfers between family members. Part-time residents,
boarding students, temporary migrants, and domestic help are categories of potential household
members that are difficult to categorize, but whose classification as household members is often
determined by duration of residency and financial contribution of income for the household’s
expenditures. These questions about classification can be important for analyzing economic
questions. Schiff (2006), for example, highlights how including migrants as members of the
household when calculating the per capita income leads to significant distortions in estimating
the impact of migration on poverty.
Despite best-practice recommendations on the classification of some types of individuals,
definitions of the household commonly used by economists have often been critiqued by
economic anthropologists whose detailed ethnographies document the multiple and interlinked
family, social, and economic relationships among people. Jane Guyer’s (1981) work
demonstrates how “‘lineage’ and ‘household’ as concepts share the problem of designating
complex collectivities as units,” particularly in Africa. She also points out that the study of
household vulnerability in agriculture may be sensitive to how the household is constructed,
particularly in the context where substantial flows of resources occur within and across
households. Her work serves as motivation for this study’s objective of looking at how
household measures of assets, consumption, and agriculture may be sensitive to the choice of the
household definition. Furthermore, Polly Hill (1986) has argued, more forcefully, that common
6
production is an essential element of the household definition and has questioned the very idea
that there can be a common household definition that would apply to all contexts.
In fact, many early recommendations by anthropologists have become incorporated into
economic household surveys as they have evolved, despite the inevitability that definitions need
to be standardized to conduct large-scale surveys. In their recommendations, Glewwe and Grosh
(2000, 135), citing a United Nations study, note, “For the purposes of conducting a household
survey, the standard definition of a household is a group of people who live together, pool their
money, and eat at least one meal together each day.” Nevertheless, they remark in a footnote that
sufficient flexibility should be incorporated in the definition to adapt to local context. The
ambiguity of the definition of a household is particularly acute in many African settings.
Economists increasingly confront these concepts in their household surveys, acknowledging that
households are flexible and fluid. A small but important literature investigates the economic
implications of the heterogeneity of household structures.3
In the Segou region of Mali, the context for this study, household structure is complex—as it is
in many parts of the world. Individuals exchange resources among multiple types of familial and
social relationships. Oftentimes, a household lives in proximity to members of its extended
family within a common area, called a compound or concession4, enclosed by a single wall. In
other cases, the extended family lives in multiple concessions which are located in close
proximity and may be less clearly demarcated. Food preparation, sanitation, and dwelling
maintenance tasks may be undertaken jointly within the concession, and economies of scale in
production are exploited. Two essential aspects of economic decision-making are food
preparation and agricultural production, and we discuss each in turn. First, with respect to food
consumption, individuals live in households that share concessions where food production may
be centralized, at least for certain meals. The division of labor is gender-based, and women may
3 For example, Akresh (2009) investigates the effects of child fostering across households along kinship lines in Burkina Faso. Hosegood and Timaeus (2005) investigate how household composition has changed over time in South Africa. From a more methodological perspective, Christiaensen and Hoddinott (2001) compare the effect of rapid appraisals and community-based listing exercises on household size and village population with updated census information.
4 Concession is the term used in Mali, so we retain it for the purposes of this paper. In English, it is equivalent to compound or homestead.
7
have use rights over multiple granaries, including a household and central concession granary,
from which they may draw grain to prepare common meals. Men may contribute to their own
granaries and have obligations to contribute grain to communal granaries. With respect to
production, a group of family members may work together on common familial lands, but the
division of common plot harvests into individual granaries varies from family to family. Many
families prepare their food separately out of these reserves, whereas some completely store and
consume the harvest communally. These complexities make identifying one definition for the
household difficult: there are ethnic differences that generate differences in norms, but also
family-specific heterogeneity in the costs and benefits of aggregate living and preferences over
household structure.
This problem is certainly not unique to Mali. Matlon (1988; as quoted by Udry 1996) remarks
the following in reference to the frequently used ICRISAT (International Crops Research
Institute for the Semi-Arid Tropics) data from Burkina Faso:
An entirely unambiguous, consistent, and universal definition of the “household” for use in sampling, data collection and analysis, proved to be elusive. . . . As a working definition we defined the household as the smallest group of persons usually, but not exclusively kin related who form a more or less independent production and consumption unit during the cropping season. To operationalize this definition we set two conditions based on observed group behavior and consistent with farmers’ own criteria for defining households: first, that members of the household work jointly on at least one common field under the management of a single decision-maker, and second, that members draw an important share of their staple foodstuffs from one or more granaries which are under the control of that same decision-maker. Because both of these criteria sometimes tended to vary in a continuous rather than discrete manner, for [ambiguous] individuals the final boundaries used to delimit household from nonhousehold members were drawn by the household heads themselves.
Indeed, evaluating whether a “household” reaches Pareto efficiency depends critically on who is
considered a household member according to the definition of the household chosen. Udry
(1990) also references the difficulty in choosing an appropriate unit of analysis in northern
Nigeria, while Van de Walle and Gaye (2005) describe the complex household structure in
Senegal and the Gambia. In their work, they summarize how the censuses in the respective
8
countries have attempted to capture that complexity. In Senegal, the census enumerates
concessions, then households, and then nuclear units.
Although acute, the difficulty in determining household membership is not limited to West
Africa. In Tanzania, a mixed-method survey has suggested that household structure is
complicated and varies by region within Tanzania, and that the 2004 Demographic and Health
Survey definition—with its emphasis on residency and a common source of food—is often
inconsistent with the “true” household as determined by in-depth interviews (Leone, Coast, and
Randall 2009).5 Muga and Onyango-Ouma (2009) describe how the Luo people of western
Kenya live in homesteads where multiple generations cohabit, although the extended family is
shrinking over time. Hill (1986) suggests that the determination of the household head is difficult
even in southern India.
In low-income societies, some demographers have posited a positive relationship between lower-
income and multigenerational household structures, although exceptions exist (Vimard and
Fassassi 2005; Ruggles and Heggeness 2008). This makes the relevant economic unit
challenging as it may change over time and with economic development. In low income settings,
nonnuclear household structures benefit from larger size and economies of scale in market and
domestic production activities. For example, Saito (2000) describes extended family households
in pre-industrial Japan where two generations of nuclear households lived together in the same
compound. After the industrialization, however, there are few incidences of this household
structure. Complex household arrangements continue in other parts of Asia: Bryant (1996)
describes contemporary differences between northern and southern Vietnamese household
structure related to differences in intergenerational residency norms. However, there is a debate
in the demographic literature whether extended family structures - such as intergenerational
residency - have been stable or increasing over time, particularly in a sample of Latin American
countries (Ruggles and Heggeness 2008).
5 The study focused on three areas with particularly challenging populations in terms of the concept of the household: Longido (primarily Maasai), urban Dar es Salaam, and Rufiji in the south. They also find household sizes which are similar to those we find in Mali: average household size is much smaller using the standard DHS definition (5.86) compared to household size estimated using the mixed method approach (11.23).
9
As mentioned previously, four recent national surveys in Mali have used different household
definitions. The Demographic and Health Survey (DHS) of Mali 2006 uses the following
definition: “Please list the names of the people who normally live in your household and the
visitors who passed the last night here, beginning with the head of household” (Samaké et al.
2007). The Rapid Household Survey (RHS) 2006 uses the following, more extensive definition:
(translated by the authors into English) (Republic of Mali 2007):
A household is a group of people who normally live and eat their meals together in the household. Members must acknowledge the authority of one person as head of household and that person must actually live with the rest of the household members. In polygamous households, each wife is treated as a distinct household when the wives live in different houses, cook separately and take decisions independently. . . . The household is an economic unit in which the members possess certain economic ties. They may participate together in the same productive activity, earning income together. The survey permits the use of all information which includes key events which illustrate this type of economic behavior. It is essential that all people who participate in the decisions or are affected by the results of these decisions are included in the household.
For official population measures, the Malian Census in 1998 and 2008 used the following
definition:
The household is a group of persons related or not, living under the same roof, under the responsibility of a head whose authority is acknowledged by all the members. The ordinary household is composed of a head of household, his spouse(s), his unmarried children, and possibly his relatives or other persons to whom he is unrelated. The household can be limited to only one person or a person with his children. Particular cases:
1) In a polygamous household where all the spouses do not live in the same concession as their husband, each of the spouses living elsewhere will be listed as a separate household with the persons they live with (the spouse being the head of that household).
2) A tenant who does not take his meals where he lives is considered as a separate household.
3) In a case where a man lives in a concession with his spouse(s) and his children among which some are married, each of the married sons with his spouse(s), his children, and other unmarried dependents under his responsibility will form a separate household.
10
4) In a group of unmarried people living together where everyone has his own means of livelihood, each member of the group will form his own household.
Finally, work done by independent researches have used a definition quite similar in spirit to one
of the definitions used in this paper. Work by Azam and Gubert (2005) in the Kayes region of
Mali uses the definition “a group of individuals who produce in common on at least one field,
receive food out of a common store and eat from a single pot” and acknowledges the complexity
of household structure by saying “In the Sahelian area, it is typically comprised of the family
head, his wives, his young brothers, and their dependents over two or three generations.”
The Census, the Rapid Household Survey and the Kayes survey definitions include the idea that
a household eats together and has shared productive activity. However, these concepts are
applied in a potentially ad hoc manner in only some settings. For example, a tenant is considered
separate if he eats meals separately in the Census definition but a wife who eats separately within
a polygamous family is not considered a separate unit. In the DHS, individuals undertaking the
same productive activity ‘may’ constitute a household. The Census attempts to delineate
extended families into separate households (particular case 3) while the DHS and the RHS are
more open to interpretation.
The Demographic and Health Survey reports an average size of 5.7 while the Rapid Household
Survey 2006 reports an average rural household size of 9.6 in the complete sample, and 8.9 in the
region of Mali we study.6 Official statistics for the 2008 Malian Census have not been released
to date.7 Although the surveys are not perfectly compatible in all other aspects, particularly
6 Household size in the RHS is smaller than that measured in our sample, which is between 11 and 12. While the two surveys do not use the same sampling strategy, it is more likely that the differences in household size arise from differences in how the household definition was implemented in the field. Enumerators were instructed in the RHS to use available information to make their own determination of household membership, whereas we trained our enumerators to simply read the household definition to the respondent and let the respondent determine who is a member of the household. Given that other surveys in Mali use a more nuclear definition, we think it is likely that enumerators’ inclination to use a more nuclear definition resulted in slightly smaller reported households in the RHS than in our sample.
7 While not a household survey per se, the Malian Agricultural Census of 2005 uses the FAO recommended definition of an agricultural holding which states: “An agricultural holding is an economic unit of agricultural production under single management comprising all livestock kept and all land used wholly or partly for agricultural production purposes, without regard to title, or legal form of households. Single management may be exercised by
11
sampling methodology, the differences in measured household size may be at least partly due to
the different household definitions. Variation in requirements of household membership,
keywords included in the definition, or even the sequencing of those keywords could potentially
influence the respondent in organizing the list of people included in a household roster. The
concept of the household used by economists in survey research may therefore not intersect
perfectly with the social concept of the household. The complexities in Malian household
structure and observed differences in household sizes motivated our interest to test the
consequences of using different definitions on household statistics.8
Experimental Design
To test differences in definition types on household composition, consumption, and production,
we created four different definitions that focus on keywords relating to two of the key factors
often found in household definitions—namely, common food-sharing requirements and common
agriculture or income-generating activity requirements. In our experimental approach, we
randomly vary including common food requirements and/or joint agricultural or other income-
generating requirements in administering a standard questionnaire. The inclusion or exclusion of
these criteria creates four different definitions. The first definition is open-ended with only the
requirement that all members acknowledge the same household head and live in the same
dwelling space. The second and third definitions impose one of the two requirements, either
common food or common agriculture and income generation. The fourth definition is the
combination of both requirements.
an individual or household jointly by two or more individuals or households, by a clan or tribe, or by a juridical person such as a corporation cooperative or government agency ” (Government of Mali 2006). Households are then defined implicitly through this definition of an agricultural holding and sampling units are determined by households and not by plots of land. The 2005 Agricultural Census reported an average household size of 6.
8 Using different definitions is not unique to Mali. In Cote d’Ivoire, the government has used different household definitions over time. The following are examples of household definitions used as described in Vimard and Fassassi (2005). In 1975 and 1988, the following definition was used: to define the household as the “ the group of persons, related or not, who acknowledge the authority of one individual entitled ‘head of household’ and who hold part of their resources in common. They live in the same building.” In 1998, the definition was altered such that the household was defined as “a group of persons who sleep usually in the same dwelling and who have shared their meals during three months at least during the 12 months that preceded the interview.”
12
Enumerators were given instructions to read the randomly allocated definition to respondents.9
Each enumerator administered each definition in every village they surveyed. The definitions
were translated into local languages, and enumerators were tested on their understanding of the
definition before the fieldwork commenced. Here are the definitions,10 translated into English,
with the key differences between them italicized, emphasis here only for exposition:
Definition 1: A household is composed of the group of people living in the same dwelling space and who acknowledge the authority of a man or woman who is the head of household.
Definition 2: A household is composed of the group of people living in the same dwelling space who eat meals together and acknowledge the authority of a man or woman who is the head of household.
Definition 3: A household is composed of the group of people living in the same dwelling space who have at least one common plot together or one income-generating activity together (for example, herding, business, or fishing) and acknowledge the authority of a man or woman who is the head of household.
Definition 4: A household is composed of the group of people living in the same dwelling space who eat meals together and have at least one common plot together or one income-generating activity together (for example, herding, business, or fishing) and acknowledge the authority of a man or woman who is the head of household.
In many household definitions, the idea of “co-mingling” of incomes is used instead of explicitly
requiring common productive activities as we did in definitions three and four. We felt this
9 The following instructions were given to each enumerator and listed on the cover page of each questionnaire: “At the beginning of the interview, read the following definition to the head of household and other household members present. For the purposes of this interview, take the following definition as the definition of the household.” Enumerators were paid a daily rate and were not incentivized by payment per questionnaire completed. Enumerators undertook a three-day training course led by the authors to ensure comprehension of the 13-page questionnaire with an emphasis on comprehension and memorization of the household definitions. A piloting exercise was conducted after enumerator training to test the questionnaire and enumerator quality. We check for potential enumerator biases in our estimates by including enumerator indicators in our specifications as a robustness check. The inclusion of such variables does not alter our results, which are available upon request.
10 Although not explicitly stated, the household definition normally refers to the set of adults that should be included in the household, after which their children are accounted. Children are ascribed to a household if the adults in that household have primary caretaking responsibility.
13
definition was clearer, easy to translate into the local language, similar in spirit to the “same
productive activity” used in the RHS, and fit well with the setting since the vast majority of
households undertook farming where almost all household members (including children)
contribute to the farming effort. Note that we will often refer to common income generation as
common agriculture in the subsequent sections of the paper.
The definition of the household was randomized within each village at the finest sampling unit.
In particular, since dwellings are organized into concessions, the definition was randomly
assigned to sampled concessions. When an enumerator entered the concession, he or she would
speak to the head of the concession and read the selected household definition. Using that
definition, the enumerator would write down a list of household heads within that concession and
then randomly select one.11 An equal number of household definitions were allocated among the
concessions selected per village.
Villages were selected from a sampling frame developed based on the latest available census
data in Mali, the Recensement general de la Population 1998,12 and updated by local government
officials for the purpose of this and a related study. Since the randomized survey experiment was
conducted as part of a pilot for an evaluation of a large-scale irrigation project, the sample was
divided into three strata within the sampling universe, which included all villages in 3 cercles
(Macina, Niono, and Segou) - an administrative unit one level below a region - in the region of
Segou. The three strata include a subsample of the intervention zone called the Alatona, those
villages with access to a large-scale irrigation scheme in the Office du Niger,13 and those with
only rainfed plots in the three cercles. Ten villages were randomly selected in the Alatona strata.
Twenty-two villages were randomly selected in the Office du Niger strata and 24 villages in the
11 The random selection of households within selected concessions implies that households who reside in large concessions are under-represented. Therefore, to compute village-level statistics, the observations would need to be re-weighted to correct for this sampling method. 12 The Census information is summarized in the software package Cartographie du Mali 1998, distributed by the Government of Mali, Mission for the Decentralization, produced by Fox Media, and financed by UNICEF (Republic of Mali 1999). 13 The Office du Niger was originally constructed in 1932 as a gravity irrigation scheme during French colonialism. Since Malian independence, the government of Mali has managed the system.
14
periphery groups with up to 20 concessions selected per village.14 All villages were selected with
probability proportional to size.
Without a list of individuals within sampled villages, concessions were chosen using a circular
sampling technique, where enumerators started at a common location in the village and were
randomly assigned a household definition with which to start. The survey instruments were
designed with a common set of core modules on household composition, assets and livestock
holdings, agricultural production and inputs, and food consumption.
Despite the fact that definitions were allocated randomly to households, most field experiments
verify empirically that there are no differences between treatment and control households along
observable characteristics. In our experiment, the household and descriptive statistics of the
household are the very object of our analysis. The nature of the treatment is that all
characteristics collected in the household survey are endogenous. We collected one measure at
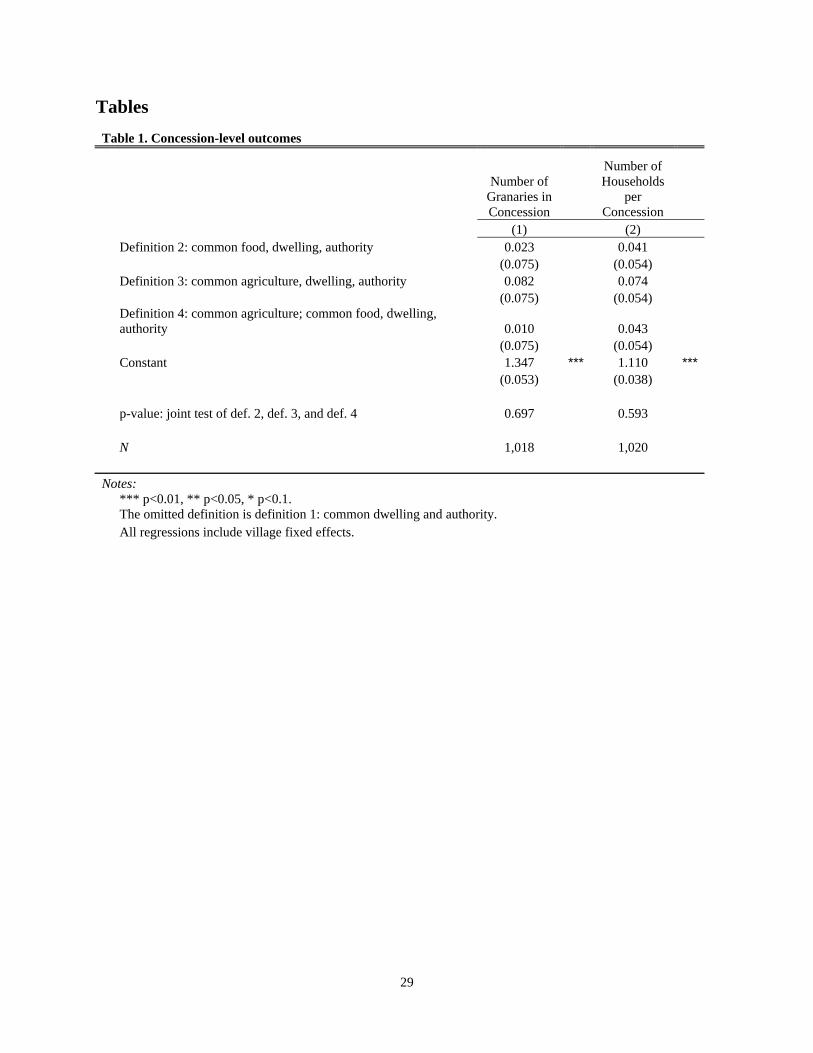
the concession level - the number of granaries - which is presented in column one of Table 1.
Concessions are a physical space defined by an outer wall, observable by all, and not subject to
the definition of the household. When we compare the number of granaries found in the
household’s concession, no significant variation exists between the four definition types. That is
consistent with the randomization generating balance across treatment and control, although this
one result is of course far from a full randomization check. The results of the experiment are
described in the next section.
Results
All results are shown using the following specification:
0 42 32 3 4ij ij ij ij j ijy Def Def Def X ,
where Def2, Def3, and Def4 are indicators for the definitions used in the interview of household i
in village j: definitions 2, 3, and 4 as defined above in our discussion of the experimental design.
Definition 1, the open-ended definition that requires only common residency and
acknowledgment of a household head, is the excluded definition. Coefficients are naturally
interpreted as the consequence of adding additional keyword restrictions on the household
14 Some of the villages are very small, and there were not 20 concessions in the village.
15
listing. Xij are village-level indicators to control for unobservable village characteristics such as
differences in rainfall, farming systems, ethnicity, or access to infrastructure across villages.15
Summary statistics of the key variables across definition types are reported in Appendix Table
A.1.
The first outcome of interest is whether the number of households within a concession differ
according to the definition used. Column two of Table 1 shows that the number of households
within the concession is not significantly different across household definitions. In the following,
we investigate differences across household definitions in four key variable categories, all
measured at the household level: household composition, assets and livestock holdings, food
consumption, and agricultural production.
Household Composition
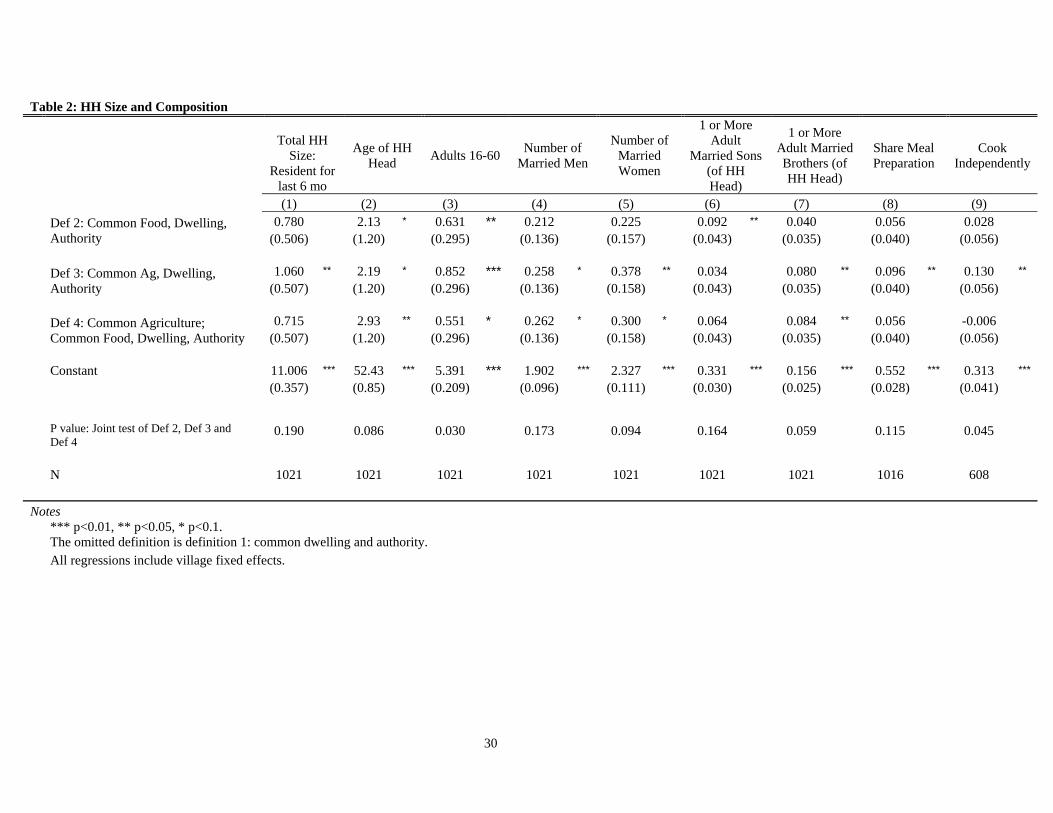
Table 2 presents our results on household composition. In our analysis, we report household size
for members of the household who are resident at least six months16 and disaggregate household
composition into the number of adults, the number of married men, number of married women,
number of married adult sons of the household head, and number of married brothers as reported
by the household head.
Household sizes vary across the definitions between 11 and 12 persons on average, which is
rather large but not unexpected in this area of Mali. In column one in Table 2, we find that the
effect of adding a common agricultural requirement to the household definition increases the
number of persons listed in the household by one household member. This constitutes an
increase of 0.17 of a standard deviation. Initially, we expected that an open-ended definition
would produce larger household sizes since we anticipated that the criteria in definitions 2
through 4 would put restrictions on household membership. However, additional keywords
prompted respondents to increase the number of members listed in the household in comparison
15 We also conducted analysis including enumerator indicators and day of the week indicators to control for potential unobservable variation across enumerators or the day of the week that an interview is taken. The results reported in this paper are robust to these additional specifications and to specifications without village fixed effects. These results are omitted for brevity and are available upon request. 16 Our results are robust to differing residency requirements, so we report this frequently used measure of household size with a six-month residency requirement.
16
to the first, open-ended definition, though not all increases in household size are statistically
significant. We interpret this as meaning that keywords ultimately prompt respondents to (a)
include people who fit the criteria who may have otherwise been forgotten and/or (b) report an
alternative grouping of people as the household.17 In an environment where overlapping groups
of people eat together and engage in common income-generating activities, both interpretations
are consistent.
In addition to the effect of definition type on total household size, variation in the composition of
the household is also significantly affected by alternative definitions. Altering definitions in our
household survey altered household composition, even for definitions where we did not observe
precisely estimated increases in total household size. Column three shows increases in the
number of adults aged 16–60, from 0.6 to 0.9 individuals, for all definition types relative to the
open-ended definition. In results not shown, no statistically significant increases in the number of
children under 16 or females were found, nor in the number of adults over the age of 60.
Changes in the number of married men in a household represent a qualitative change in
household structure. More married men within a household increases the complexity of decision-
making and resource allocation within the household, as Malian men officially control and
allocate their own resources not only for their wives and children, but in coordination with other
married men to provide household public goods. Columns four and five of Table 2 show that
definitions emphasizing common agriculture—definitions 3 and 4—result in a larger number of
married men and women within the household. In agricultural households where members of
17 An alternative interpretation of the data could be that different definition types lead to double counting of some household members, particularly in larger concessions. As mentioned above, we do not have village census data to compare differences between census and sampled household statistics. As a simple test to determine whether the likely mechanism is the inclusion of omitted members or double counting, we restricted the sample to the set of concessions which reported containing only 1 household. With this sub-sample, we believe double counting is less likely because there are fewer opportunities for multiple household heads to list the same individual within a concession. This of course assumes there is little ambiguity in the definition of a concession. In fact, 96% of households live in 1 concession-1 household units in our sample. We performed the same analysis as in Table 2 in this sub-sample to provide suggestive evidence that the results are likely driven by the inclusion of adults who were forgotten under definition 1. The results are robust with respect to household size and composition (full results are available upon request). Hence, conditional on the correct interpretation of the concession and the partition of households within concession by the concession head, we believe that differences in household size and composition are likely due to the inclusion of otherwise forgotten members, not double counting. In multiple household concessions, however, it is more challenging to determine the mechanism since there is more scope for double counting but forgetting individuals is also plausible. Further research is necessary to disentangle these effects.
17
certain families have use rights over common agricultural lands and the continuum of production
and consumption responsibilities overlaps such as in our sample, keywords in the definition of
the household may cause the reorganization of family members into households.
To investigate household structure further, columns six through nine of Table 2 look at the types
of marriage and cooking arrangements. A household could contain multiple married men within
a household if a household head lives with his adult married son(s) or if married brothers share
one household. Column six suggests that common food consumption leads to an increase in the
number of generations present within a household. The dependent variable is an indicator for one
or more adult married sons of the household head who reportedly live in the household.
Definition 2 results in a 9 percentage point increase in the likelihood that the household is
multigenerational.18 Since 33 percent of definition 1 households had at least one married son of
the head as a member, definition 2 prompted a 28 percent increase in incidence of
multigenerational households reported. A household definition that emphasizes common
agriculture generates households with multiple married men of the same generation. In column
seven, we see that definitions 3 and 4 result in an 8 percentage point increase in the probability
that multiple married brothers are considered as one household. Therefore, though there is only
weak evidence that the total number of married men varies across definition, a more detailed
analysis reveals that each definition (2, 3, and 4) reveals a distinctive type of household. As
discussed previously in the background section, the tradition in this part of Mali is for all married
sons to remain in the household of their fathers or for brothers to remain as one household,
sharing a common granary and farming the family land jointly. These results are suggestive that
different household definitions may identify different economic units within the same extended
family. For example, there may be a subset of an extended family that undertakes common food
consumption while another subset may act as a common unit for agricultural production. Varying
the household definition by emphasizing one type of activity (food consumption or a productive
activity) may solicit a listing of household members based on who undertakes that activity
together, which then generates both differences in household size and structure as measured by
the household roster.
18 Since the custom in Mali is that men stay in their natal village/household and women are married off into other
households, we focus here only on the number of married men.
18
A specific example of the complexities of household structure is that food preparation may be
shared within a household or a concession for at least some meals. Traditionally in Mali, when
multiple married couples constitute the same “household,” women take turns in cooking food for
the entire group. We therefore ask whether differences in household definitions would increase
variation in the types of food preparation practices households report. Columns eight and nine of
Table 2 investigate how meal preparation is organized within the household and whether the
cooking arrangement varies systematically with household definition. Column eight presents
estimates from a linear probability model where the dependent variable is an indicator for
whether the main female respondent reports that she shares the responsibility of meal preparation
for the household with another woman. We see that households that were randomly assigned
definition 3 are significantly more likely, compared with the open-ended definition, to have
multiple women within the same household sharing the duty of meal preparation. This result
suggests that an emphasis on common agriculture, as in definition 3, leads to reported
households with more complex structures. Column nine presents results, conditional on sharing
meal preparation, that the main female respondent also cooks for a subgroup of people within the
“household” when another woman is responsible for cooking for the larger unit. Although we
need to be cautious in interpreting these results, since they are conditional on sharing meal
preparation that is endogenous to the household definition used, we see that respondents assigned
definition 3 are more likely to report cooking independently within the shared meal preparation
setting. We interpret this as evidence that an emphasis on a common income activity in particular
generates reported households where there is some autonomous decision-making that occurs
within the larger household structure. It also highlights how the “common pot” definition can
potentially be too vague if some but not all meals are consumed together, which is likely to occur
in many settings.
Another complexity of household structure is polygamous relationships within families and
households. Polygamy is frequent in our sample with 39 percent of households reporting that the
household head practices polygamy. Variations in definition phrasing may screen out
polygamous household members, classifying them as separate households or as a single
household, depending on the criteria included in the definition. In our estimates of the effect of
definition type on household composition, we find no statistically significant differences in the
percentage of households reporting polygamy across definitions. We also do not find any effect
19
of household definition on the likelihood a household is female-headed19 or on the variability of
household size, as captured by the standard deviation of household size. There is weak evidence
that definition 3, emphasizing common agriculture or a common economic activity, resulted in a
higher percentage that the household included at least one farmer relative to definition 2, and that
definition 2, focusing on consumption, increased the likelihood of at least one herder or
fisherman in the household in comparison to the open-ended definition 1. Results not reported in
this paper are available from the authors upon request.
Assets
Table 3 shows the relationship between definition type and farm assets, livestock holdings, and
nonfarm assets both in levels and per adult equivalents.20 We find significant increases in the
farm and nonfarm asset indexes in levels among households assigned a definition with a
common agriculture requirement, and increases in livestock holdings among definition 2 and 3
households. The effect of definition 3 on the asset indexes in levels is relatively large. The farm
asset index in column one is a count index of the types of farm equipment, out of a potential 13,
that the household owns. The farm asset index increases by 0.6 among households administered
definition 3. Since the average number of farm assets owned by households in the sample is 6.9,
the agricultural definition increased measured farm assets by approximately 10 percent or 0.3 of
a standard deviation. Column three presents the effect of definition type on livestock holdings
measured in tropical livestock units (TLUs), which is the number of animals owned by the
household weighted by FAO TLU conversions. TLU livestock is higher among definition 3
households compared with definition 1 by 1.9 units or 0.2 of a standard deviation. Column five
shows that the emphasis on common agriculture increased the number of nonfarm asset types
owned by the household by 0.7. The average number of asset types owned by the household is
12, out of a possible 25; this constitutes 0.2 of a standard deviation change as well.
19 Though, since only a tiny fraction of the sample (2.5 percent) is reported to have a woman as the head, this may be the result of the cultural practice of not reporting women as household heads even if a woman does, de facto, act as the head. 20 Our adult equivalency scale uses the assumption that a child between the age of 0 and 5 consumes 0.4 of a full adult and children between 6 and 15 consume at 0.5. Everyone over the age of 15, including elderly, receive a value of 1. The adult equivalency scale was adopted based on results in Deaton (1997). The results are very similar if we use per capita measures.
20
Including a common food requirement (definition 2) also increases livestock holdings reported
by the household, and there is weak evidence that reported farm assets also increased. The
effects of definition 2 are smaller (0.14 of a standard deviation) than those observed for
definition 3 for farm assets, but much larger than the effect of definition 3 for livestock holdings.
Definition 2 resulted in an economically meaningful 0.25 increase in a standard deviation of
livestock holdings. This is consistent with the finding that definition 3 increased the probability
that at least one farmer resided in the household and definition 2 increased the probability that a
herder or fisherman was cited as a household member.21 As both definitions 2 and 3 were shown
to increase the number of married men (either son or brother of the head) listed in the household,
these increases in asset holdings reported by the household are consistent with the findings in
Table 2, even if household size does not increase significantly among the definitions. It is
surprising that there is no difference in assets between definition 4 and definition 1 households
given changes in composition seen in Table 2. Not only are the estimates not statistically
significantly but the point estimates are also small. The overall results illustrate that even if
household sizes are consistent over time within a country, fluctuations observed in welfare levels
may be driven by changes in household composition caused by altering household definitions or
the administration of a particular definition over time.
Scaling our asset indices using the adult equivalency scale does not produce the same
conclusions as the analysis in levels. We find no statistically significant effects of definition type
on farm assets per adult equivalent, and the point estimates are quite small. TLUs per adult
equivalent are still statistically significant, which is consistent with the results for TLUs in levels.
Definition 2 leads to a 32 percent increase in per adult equivalent livestock relative to definition
1 households. However, we find no effect of definition 3 on TLUs. Definition 3 lowers the per
adult equivalency nonfarm asset index by 12.5 percent, but given its marginal significance we do
not want to over-interpret this finding. Despite limited differences in per adult equivalent
measures of assets, the effect of household definition on levels of assets is striking. Fluctuations
in levels of assets measured using different household definitions do portray different profiles of
households in terms of asset ownership or control of particular assets within the household.
21 There are few fishermen in the sample.
21
Food Consumption
In Table 4, we again observe significant differences across definitions with respect to
consumption reported by households. We present three measures of food consumption over the
previous seven days, which are all related: a grain expenditure aggregate22 (in CFA francs
[FCFA],23, the local currency), kilograms of all grain consumed, and finally kilograms of millet
consumed. Millet is an important share of overall food consumption, and accounts for 69 percent
of the total quantity of grain consumed by the households in our sample. Including keywords
about common food requirements, as in definition 2, increases the grain expenditure aggregate
by 1,740 FCFA. The differences in statistics generated by definition 3 that we have observed for
other variables are absent with respect to household grain expenditure. However, the number of
kilograms of grain consumed by the household over the previous seven days does increase
significantly by including the common food requirement in definition 2 or the common
agriculture requirement in definition 3. Definition 2 increases the reported kilograms of grain
consumed by 9 kilograms, while the effect of definition 3 is 8 kilograms. When we turn to the
quantity of millet consumed, we find in column five that definition 2 has the effect of raising the
amount of millet consumed in the household by 7 kilograms.
These results are consistent with the explanation that variations in definitional keywords may
drive variation in household statistics. Though we did not observe an increase in total household
size for definition 2, which includes common food requirements, we did observe changes in
household structure (Table 2). By focusing definitional keywords on food consumption, we find
that household consumption statistics are significantly larger in both aggregate and quantities of
food reported in the consumption module. Differences in definitions have potential implications
on poverty statistics. As budget shares of food compose the largest class of expenditures
included in consumption aggregates, even small increases in expenditures and quantities of grain
can produce large variation in consumption aggregates. However, in columns two, four, and six
of Table 4, which report the results of the expenditure aggregate and grain consumed in per adult
equivalents, we find no statistically significant effect of variations in definition type on
22 The grain expenditure aggregate scales purchased and own-food grain consumption over the last seven7 days at median village prices following Deaton and Zaidi (2002). 23 The exchange rate is currently 450 FCFA to the dollar.
22
consumption statistics, similar to results that we see in per adult equivalent measured asset
indices.
Agricultural Production
The last set of variables with which we investigate the implications of alternative household
definitions are agricultural statistics, shown in Table 5. We calculate the number of plots and the
value of agricultural production of grains in FCFA reported by the household over the last
agricultural season conditional on someone in the household undertaking farming in the last
agricultural season in columns one through four. Approximately 8 percent of the sample did not
farm at all during the last agricultural season, reflective of the fact that pastoralism remains a
main activity of some households in this geographic area. We analyze land size (columns five
and six) and the total value of inputs, including seed, organic fertilizer, chemical fertilizer, and
herbicide (columns six and seven), both in levels and in per adult equivalent units. Table 5
illustrates that there are no statistically significant differences in the agricultural statistics for any
of the definitions in levels. This may be because production statistics are reported at the plot
level and reported landholdings are invariant to definition type, despite increases in the number
of men reported in our household composition results. In the Segou region of Mali, the main
agricultural work is done on communal family land where the family would include all married
sons and married brothers of the household head. Therefore there may be little changes—or it
may be difficult to detect relatively small changes—in production and inputs from the addition of
one extra household member.
Although we observe no variation in agricultural statistics reported in levels, we observe a small
reduction of the number of plots reported per adult equivalent by agricultural households in both
definitions 3 and 4. In fact, households that were presented with definition 4 reported fewer plots
and lower values of grain production (column four) and land size per adult equivalent. Definition
4 households report 22 percent lower per capita grain production values, or 0.2 of a standard
deviation, than definition 1 households.
In our empirical analysis, we find few effects on either the consumption or assets variables in per
adult equivalent units. Production statistics, including number of plots, value of grain produced,
23
and land size, in per adult equivalent units become smaller when further restrictions on
household membership are imposed by the definition used. This is consistent with increasing
numbers of men and women reported in Table 2. However, these results contrast with those
found when analyzing consumption and asset indices in per adult equivalent units. In interpreting
these results, it is difficult to precisely isolate whether increases in household size or composition
drive the results. A priori, we expect increases in household size to reduce per adult equivalent
statistics, but the effects of household composition are less straightforward. Our findings suggest
that the reflection process through which respondents contemplate their responses may be quite
different for consumption and asset questions compared to agricultural production. This may
occur for a number of reasons, none of which is mutually exclusive. First, as mentioned above, it
may simply be that reports of agricultural output and plots are not affected by the household
definition since one always remembers the land that one works on or benefits from even if some
individuals were forgotten in the household roster.
Second, imperfect information among household members may affect accounting of
consumption, assets holdings, and production. Consumption, in particular, is directly observed
by all household members as households eat together communally. Asset holdings may also be
readily observable by other household members as assets are often stored within the walls of the
concession. However, agricultural production occurs outside of the household concession, by
multiple decision makers on plots that are often not congruently located which may increase
informational asymmetries among household members. These information asymmetries could
be further reinforced because consumption and agricultural production modules are normally
administered to different respondents. This is particularly important if household definitions
which emphasize different common activities – such as food consumption or agriculture – reveal
different economic units. Information asymmetries may mean that the subsequent measures of
household size, structure, consumption and production may vary in levels or in per capita terms
depending on the information the respondent has about the activity in question.
A third possibility arises because of differences in the recall periods in consumption, asset and
agricultural modules. Recall periods for food consumption follow the best practice of asking
about food consumed over the previous 7 days, while agricultural production is recalled over the
24
previous agricultural season which may span the previous year. Asset holdings are recalled
based on current possession of an item. These differences in recall periods may reduce the
reliability of agricultural data relative to the consumption and asset data as posited in the recall
bias literature (Beckett et al. 2001).
4. Conclusion
In this paper, we present the results of a survey experiment designed to measure the
consequences of altering the definition of the household on a wide range of measures frequently
collected in multi-topic household surveys. Despite the fundamental importance of the unit of
analysis in any type of research, the “household” remains something of a black box for
economists. Efforts to standardize the definition using the commonly accepted “common pot”
definition still meet operational complications in the field as noted by Udry (1996). Variation in
household definition is common among surveys fielded within countries and between countries,
yet we know little about the consequences of alternative definition types on key household
statistics.
Our results tell a cautionary tale, suggesting that the selection of the household definition
deserves more attention in the design of future surveys and the analysis of previously collected
surveys. We assumed that including additional keywords and criteria in our definitions would
impose a logical consistency on the subset of household members that were generated by these
definitions, with households assigned definitions with more criteria for membership producing
smaller household units. What we observed from this experiment is that definitional criteria
intended to produce this consistency increased household size in some cases and always altered
household composition, which had implications for household-level consumption and asset
statistics and per adult equivalent agricultural production measures in particular. This may be
because the keywords prompt respondents to remember individuals who would otherwise be
forgotten and/or because the keywords change the concept of the household and prompt a
different set of individuals to be reported as the ‘household’. Variation in composition was
driven mainly by the inclusion or exclusion of adult men and women among the alternative
household definitions tested. Hence, even when definitions did not change household size, the
relevant economic unit measured differed across definition type.
25
Although variation in the household definition did not in every case affect household or per adult
equivalent statistics, variation in assets, livestock holdings, and grain consumption is striking and
economically meaningful. Since food expenditure composes 50 to 80 percent of a household’s
budget share (Seale et al. 2003, Banerjee and Duflo 2007), our findings on grain consumption
and the variation that different definition types may have on poverty statistics merit further
investigation, especially in the context of cross-country or panel analysis.
The results from this survey experiment suggest two, potentially conflicting implications for the
collection of household survey data. First, a consistent household definition is required in order
to make comparisons over time in a given population and across populations. Second, over time
for a given population, the definition must also identify the correct economic or decision making
unit, which may in fact differ according to the research question. Therefore, it is difficult to
prescribe “best practice” given these two competing objectives. On the one hand using a
common definition is paramount for comparability across datasets, but on the other researchers
may need to alter the definition used in a particular survey to cater to the specific research
questions under study. The latter creates difficulties in evaluating the external validity of
particular studies or the aggregation of multiple household surveys for cross-country analysis.
Why might we want to tailor the household definition to the needs of a given study? First, in
order to identify the relevant economic unit: for example, a study focused on agricultural input
use, such as fertilizer, may want a definition that emphasizes an economic production unit that
farms together. Accordingly, this study is also relevant for the growing number of field
experiments seeking to identify the causal effect of a program on household welfare or other
outcomes across populations. Since the choice of the household definition affects which people
are grouped together into a household, it is necessary for the household definition used in data
collection to correspond to the relevant group of people affected by a program. Household
definitions that group the “wrong” set of people together reduce the likelihood that a program
impact is detectable. In addition, important spillovers may be missed if benefits are spread across
individuals who are allocated into separate households—some designated as control and others
as treatment. In an environment where the group of people who undertake joint agricultural
activities may differ from the group that undertakes common food consumption, the research
26
must identify the right group in order to look at the impact of a program on agricultural income
and/or food consumption.
Second, since we often assume that all household members have access to public goods within
the household, the household definition capturing the “wrong group” would then erroneously
ascribe use-rights over assets to some individuals and exclude others. Accurate estimates of
household size or asset holdings are important in and of themselves as policy tools to measure
welfare and potentially target government or non-governmental organization’s interventions, but
these measurement issues are also fundamental to the estimation of economic relationships.
This study shows that in one part of one developing country, changes in the definition of the
household altered household and per adult equivalency statistics that are frequently collected in
multitopic household surveys. Future research is required to understand how other variations in
household definitions, including alternative definition types and definition phrasing, can alter
how individuals are grouped into households and the resulting measures of household and
individual welfare, and whether the household definition remains an important issue in contexts
other than Mali where the concept of the household may be clearer.
References
Akresh, R. 2009. Flexibility of household structure: Child fostering decisions in Burkina Faso. Journal of Human Resources 44 (4): 976–997.
Azam, J. and F. Gubert (2005). Those in Kayes: the impact of remittances on their recipients in Africa. Revue économique 56 (6): 1331-1358.
Banerjee, A., and E. Duflo. 2007. The economic lives of the poor. Journal of Economic Perspectives 21 (1): 141–168.
Beckett, M., J. DaVanzo, J, N. Sastry, C. Panis C, and C. Peterson. 2001. The Quality of Retrospective Data: An Examination of Long-Term Recall in a Developing Country. The Journal of Human Resources 36 (3): 593-625.
Bryant, John. 1996. Northern Vietnamese households. Journal of Population Research 13 (2): 169–186.
Christiaensen, L., and J. Hoddinott. 2001. Comparing village characteristics derived from rapid appraisals and household surveys: A tale of northern Mali. Journal of Development Studies 37 (3): 1–20.
Deaton, A. 1997. The analysis of household surveys. Baltimore, Md., U.S.A.: John Hopkins University Press.
27
Deaton, A., and S. Zaidi. 2002. Guidelines for constructing consumption aggregates for welfare analysis. World Bank: LSMS Working Paper No. 135 < http://www-wds.worldbank.org/external/default/WDSContentServer/WDSP/IB/2002/07/31/000094946_02071304010552/Rendered/PDF/multi0page.pdf >. Accessed June 16, 2010.
Glewwe, P., and M. Grosh, eds. 2000. Designing household survey questionnaires for developing countries: Lessons from 15 years of the Living Standards Development Study. Washington, DC: Oxford University Press (for the World Bank). Quoting United Nations, Household income and expenditure surveys: A technical study (New York: National Household Survey Capability Program, 1989).
Guyer, J. 1981. Household and community in African studies. African Studies Review 24 (2/3): 87–128. Hill, P. 1986. Development economics on trial: The anthropological case for prosecution. Cambridge,
England: Cambridge University Press. Hosegood, V., and I. M. Timaeus. 2005. Household composition and dynamics in KwaZulu Natal, South
Africa: Mirroring social reality in longitudinal data collection. In African households: Censuses and surveys, ed. E. Van de Walle, 58–77. Armonk, N.Y., U.S.A.: M. E. Sharpe.
Leone, T., E. Coast, and S. Randall. 2009. Did you sleep here last night? The impact of the household
definition in sample surveys: A Tanzanian case study. Presentation at British Society for Population Studies annual conference, September 9–11, Brighton, England.
Matlon, P. J. 1988. The ICRISAT Burkina Faso farm level studies: Survey methods and data files. Village
Level Studies Miscellaneous Papers Series, Economics Group. Hyderabad, India: ICRISAT. Quoted by C. Udry, Gender, agricultural production, and the theory of the household, Journal of Political Economy 104, no. 5 (1996): 1010–1046.
Muga, G. O., and W. Onyango-Ouma. 2009. Changing household composition and food security among
the elderly caretakers in rural western Kenya. Journal of Cross-Cultural Gerontology 24: 259–272.
Republic of Mali. 1999. Cartographie du Mali 1998. UNICEF and Fox Media.
________. 2006. Recensement général de l’agriculture (RGA)—Campagne agricole 2004–2005 Résultats définitifs—Volume 1 Rapport de synthèse. Food and Agriculture Organization of the United Nations, Coopération Française. Mimeo.
________. 2007. Enquete legere integree aupres des menages (elim) 2006. Vol. 1–3. World Bank,
European Union. Mimeo.
Ruggles, S., and M. Heggeness. 2008. Intergenerational coresidence in developing countries. Population and Development Review 34 (2): 253–281.
Saito, O. 2000. Marriage, family labour, and the stem family household: Traditional Japan in a
comparative perspective. Continuity and Change 15 (1): 17–45. Samaké, S., Traoré, S., Ba, S., Dembélé, E., Diop, M., Mariko, S., Libité, P. 2007. Enquête
démographique et de santé du Mali 2006. Full report. Macro International : Calverton, MD. Mimeo.
28
Schiff, M. Migration’s income and poverty impact has been underestimated. IZA Discussion Paper Series No 2088.
Seale, Jr., J., A. Regmi, and J. Bernstein. 2003. International Evidence on Food Consumption Patterns. USDA Economic Research Service Technical Bulletin Number 1904. http://www.ers.usda.gov/publications/tb1904/tb1904.pdf. Accessed June 16, 2010.
Udry, C. 1990. Credit markets in northern Nigeria: Credit as insurance in a rural economy. World Bank Economic Review 4 (3): 251–269.
________. 1996. Gender, agricultural production, and the theory of the household. Journal of Political Economy 104 (5): 1010–1046.
Van de Walle, E., and A. Gaye. 2005. Household structure, polygyny, and ethnicity in Senegambia: A comparison of census methodologies. In African households: Censuses and surveys, ed. E. Van de Walle, 3-21, Armonk, N.Y., U.S.A.: M. E. Sharpe.
Vimard, P., and R. Fassassi. 2005. The family at the heart of the household: Evolution and differentiation of household structure in Cote d’Ivoire, 1975–98. In African households: Censuses and surveys, ed. E. Van de Walle, 102-128, Armonk, N.Y.: M. E. Sharpe.
29
Tables
Table 1. Concession-level outcomes
Number of Granaries in Concession
Number of Households
per Concession
(1) (2)
Definition 2: common food, dwelling, authority 0.023 0.041 (0.075) (0.054) Definition 3: common agriculture, dwelling, authority 0.082 0.074 (0.075) (0.054)
Definition 4: common agriculture; common food, dwelling, authority 0.010 0.043
(0.075) (0.054) Constant 1.347 *** 1.110 *** (0.053) (0.038) p-value: joint test of def. 2, def. 3, and def. 4 0.697 0.593 N 1,018 1,020
Notes: *** p<0.01, ** p<0.05, * p<0.1.
The omitted definition is definition 1: common dwelling and authority. All regressions include village fixed effects.
30
Table 2: HH Size and Composition
Total HH Size:
Resident for last 6 mo
Age of HH Head
Adults 16-60 Number of
Married Men
Number of Married Women
1 or More Adult
Married Sons (of HH Head)
1 or More Adult Married Brothers (of HH Head)
Share Meal Preparation
Cook Independently
(1) (2) (3) (4) (5) (6) (7) (8) (9)
0.780 2.13 * 0.631 ** 0.212 0.225 0.092 ** 0.040 0.056 0.028
Def 2: Common Food, Dwelling, Authority (0.506) (1.20) (0.295) (0.136) (0.157) (0.043) (0.035) (0.040) (0.056)
1.060 ** 2.19 * 0.852 *** 0.258 * 0.378 ** 0.034 0.080 ** 0.096 ** 0.130 **
Def 3: Common Ag, Dwelling, Authority (0.507) (1.20) (0.296) (0.136) (0.158) (0.043) (0.035) (0.040) (0.056)
0.715 2.93 ** 0.551 * 0.262 * 0.300 * 0.064 0.084 ** 0.056 -0.006
Def 4: Common Agriculture; Common Food, Dwelling, Authority (0.507) (1.20) (0.296) (0.136) (0.158) (0.043) (0.035) (0.040) (0.056)
Constant 11.006 *** 52.43 *** 5.391 *** 1.902 *** 2.327 *** 0.331 *** 0.156 *** 0.552 *** 0.313 ***
(0.357) (0.85) (0.209) (0.096) (0.111) (0.030) (0.025) (0.028) (0.041)
P value: Joint test of Def 2, Def 3 and Def 4
0.190
0.086 0.030 0.173 0.094 0.164 0.059 0.115 0.045
N 1021 1021 1021 1021 1021 1021 1021 1016 608
Notes *** p<0.01, ** p<0.05, * p<0.1.
The omitted definition is definition 1: common dwelling and authority. All regressions include village fixed effects.
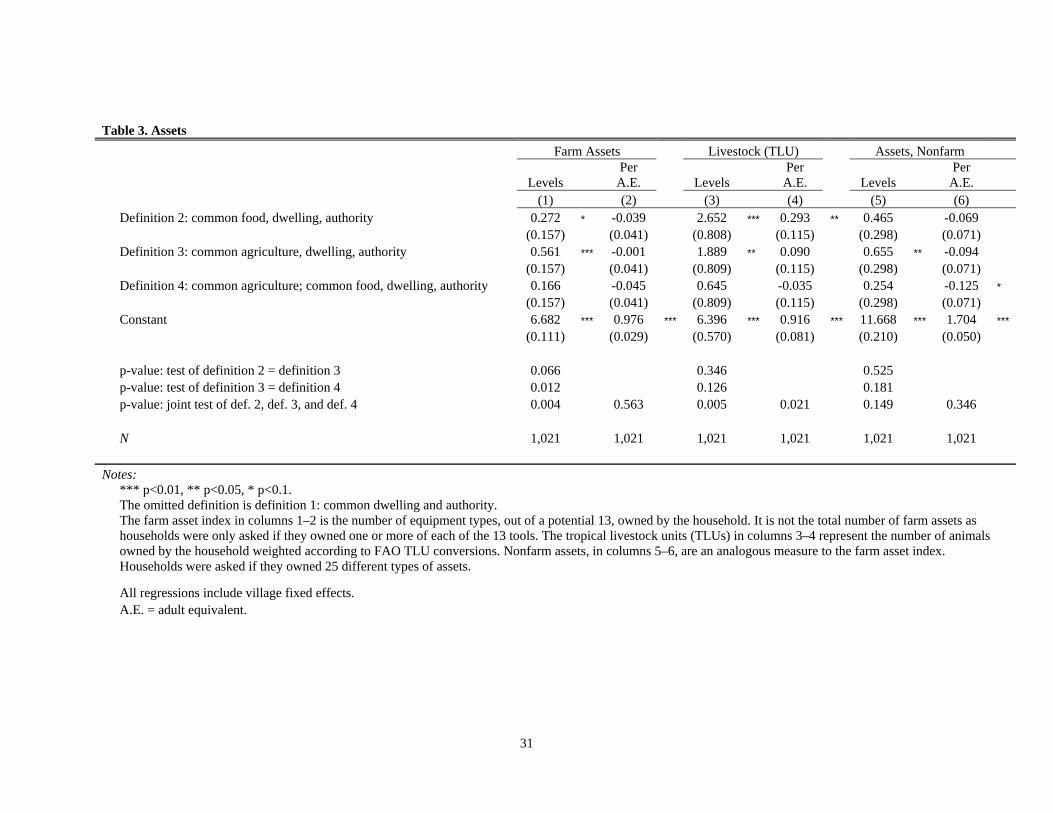
31
Table 3. Assets
Farm Assets Livestock (TLU) Assets, Nonfarm
Levels Per
A.E. Levels Per
A.E. Levels Per
A.E. (1) (2) (3) (4) (5) (6) Definition 2: common food, dwelling, authority 0.272 * -0.039 2.652 *** 0.293 ** 0.465 -0.069 (0.157) (0.041) (0.808) (0.115) (0.298) (0.071) Definition 3: common agriculture, dwelling, authority 0.561 *** -0.001 1.889 ** 0.090 0.655 ** -0.094 (0.157) (0.041) (0.809) (0.115) (0.298) (0.071) Definition 4: common agriculture; common food, dwelling, authority 0.166 -0.045 0.645 -0.035 0.254 -0.125 * (0.157) (0.041) (0.809) (0.115) (0.298) (0.071) Constant 6.682 *** 0.976 *** 6.396 *** 0.916 *** 11.668 *** 1.704 *** (0.111) (0.029) (0.570) (0.081) (0.210) (0.050) p-value: test of definition 2 = definition 3 0.066 0.346 0.525 p-value: test of definition 3 = definition 4 0.012 0.126 0.181 p-value: joint test of def. 2, def. 3, and def. 4 0.004 0.563 0.005 0.021 0.149 0.346 N 1,021 1,021 1,021 1,021 1,021 1,021 Notes: *** p<0.01, ** p<0.05, * p<0.1.
The omitted definition is definition 1: common dwelling and authority. The farm asset index in columns 1–2 is the number of equipment types, out of a potential 13, owned by the household. It is not the total number of farm assets as
households were only asked if they owned one or more of each of the 13 tools. The tropical livestock units (TLUs) in columns 3–4 represent the number of animals owned by the household weighted according to FAO TLU conversions. Nonfarm assets, in columns 5–6, are an analogous measure to the farm asset index. Households were asked if they owned 25 different types of assets.
All regressions include village fixed effects. A.E. = adult equivalent.
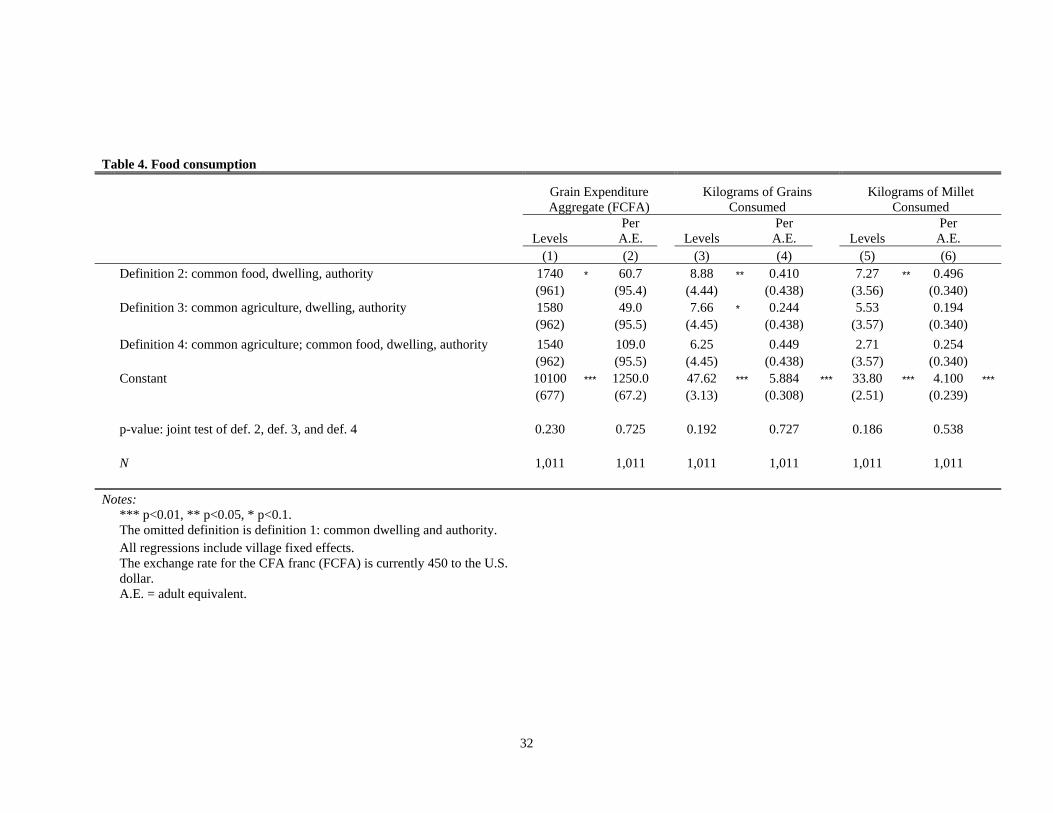
32
Table 4. Food consumption
Grain Expenditure Aggregate (FCFA)
Kilograms of Grains Consumed
Kilograms of Millet Consumed
Levels Per A.E. Levels
Per A.E. Levels
Per A.E.
(1) (2) (3) (4) (5) (6) Definition 2: common food, dwelling, authority 1740 * 60.7 8.88 ** 0.410 7.27 ** 0.496 (961) (95.4) (4.44) (0.438) (3.56) (0.340) Definition 3: common agriculture, dwelling, authority 1580 49.0 7.66 * 0.244 5.53 0.194 (962) (95.5) (4.45) (0.438) (3.57) (0.340)
Definition 4: common agriculture; common food, dwelling, authority 1540 109.0 6.25 0.449 2.71 0.254 (962) (95.5) (4.45) (0.438) (3.57) (0.340) Constant 10100 *** 1250.0 47.62 *** 5.884 *** 33.80 *** 4.100 *** (677) (67.2) (3.13) (0.308) (2.51) (0.239) p-value: joint test of def. 2, def. 3, and def. 4 0.230 0.725 0.192 0.727 0.186 0.538 N 1,011 1,011 1,011 1,011 1,011 1,011 Notes: *** p<0.01, ** p<0.05, * p<0.1.
The omitted definition is definition 1: common dwelling and authority. All regressions include village fixed effects.
The exchange rate for the CFA franc (FCFA) is currently 450 to the U.S. dollar.
A.E. = adult equivalent.
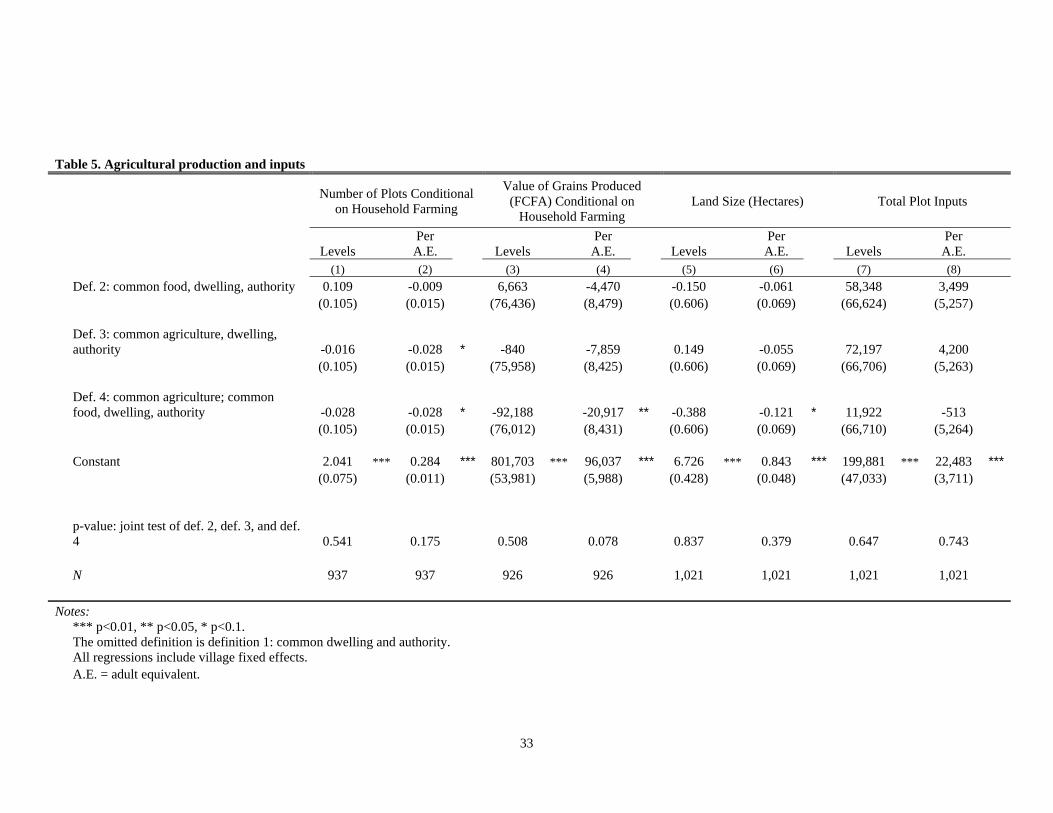
33
Table 5. Agricultural production and inputs
Number of Plots Conditional on Household Farming
Value of Grains Produced (FCFA) Conditional on
Household Farming Land Size (Hectares) Total Plot Inputs
Levels Per A.E. Levels
Per A.E. Levels
Per A.E. Levels
Per A.E.
(1) (2) (3) (4) (5) (6) (7) (8) Def. 2: common food, dwelling, authority 0.109 -0.009 6,663 -4,470 -0.150 -0.061 58,348 3,499 (0.105) (0.015) (76,436) (8,479) (0.606) (0.069) (66,624) (5,257)
Def. 3: common agriculture, dwelling, authority -0.016 -0.028 * -840 -7,859 0.149 -0.055 72,197 4,200
(0.105) (0.015) (75,958) (8,425) (0.606) (0.069) (66,706) (5,263)
Def. 4: common agriculture; common food, dwelling, authority -0.028 -0.028 * -92,188 -20,917 ** -0.388 -0.121 * 11,922 -513
(0.105) (0.015) (76,012) (8,431) (0.606) (0.069) (66,710) (5,264) Constant 2.041 *** 0.284 *** 801,703 *** 96,037 *** 6.726 *** 0.843 *** 199,881 *** 22,483 *** (0.075) (0.011) (53,981) (5,988) (0.428) (0.048) (47,033) (3,711)
p-value: joint test of def. 2, def. 3, and def. 4 0.541 0.175 0.508 0.078 0.837 0.379 0.647 0.743
N 937 937 926 926 1,021 1,021 1,021 1,021
Notes: *** p<0.01, ** p<0.05, * p<0.1.
The omitted definition is definition 1: common dwelling and authority. All regressions include village fixed effects.
A.E. = adult equivalent.
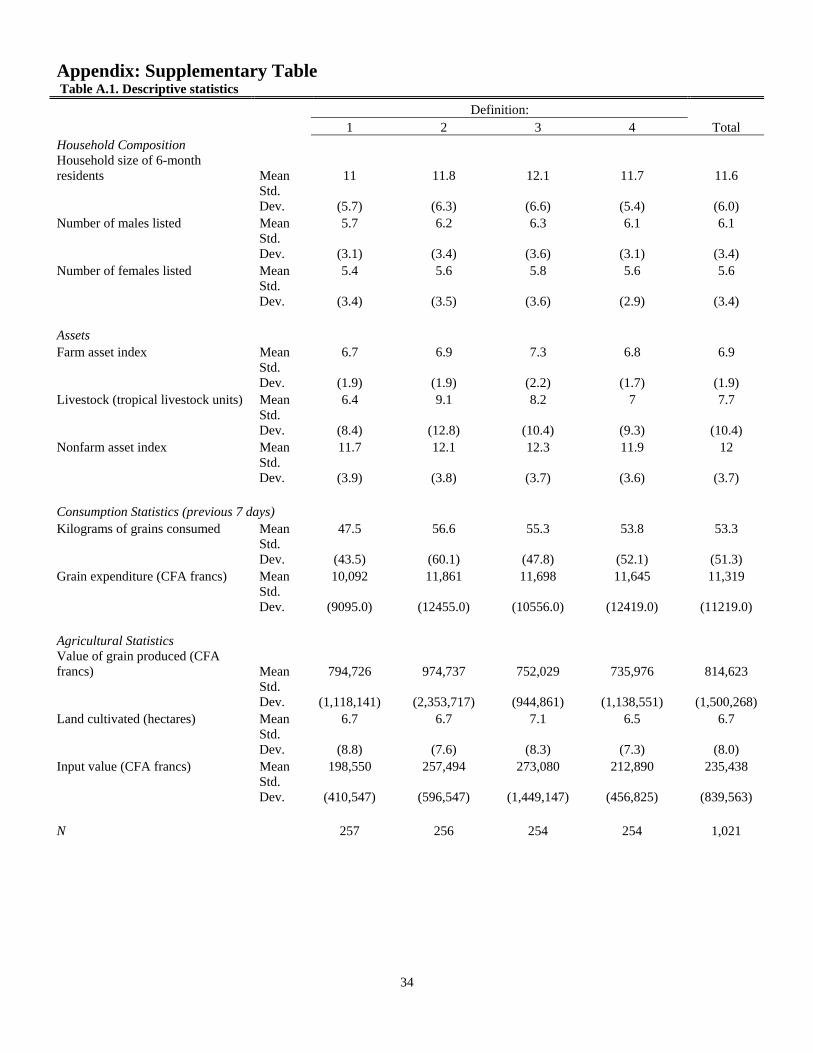
34
Appendix: Supplementary Table Table A.1. Descriptive statistics
Definition: 1 2 3 4 Total Household Composition Household size of 6-month residents Mean 11 11.8 12.1 11.7 11.6
Std. Dev. (5.7) (6.3) (6.6) (5.4) (6.0)
Number of males listed Mean 5.7 6.2 6.3 6.1 6.1
Std. Dev. (3.1) (3.4) (3.6) (3.1) (3.4)
Number of females listed Mean 5.4 5.6 5.8 5.6 5.6
Std. Dev. (3.4) (3.5) (3.6) (2.9) (3.4)
Assets Farm asset index Mean 6.7 6.9 7.3 6.8 6.9
Std. Dev. (1.9) (1.9) (2.2) (1.7) (1.9)
Livestock (tropical livestock units) Mean 6.4 9.1 8.2 7 7.7
Std. Dev. (8.4) (12.8) (10.4) (9.3) (10.4)
Nonfarm asset index Mean 11.7 12.1 12.3 11.9 12
Std. Dev. (3.9) (3.8) (3.7) (3.6) (3.7)
Consumption Statistics (previous 7 days) Kilograms of grains consumed Mean 47.5 56.6 55.3 53.8 53.3
Std. Dev. (43.5) (60.1) (47.8) (52.1) (51.3)
Grain expenditure (CFA francs) Mean 10,092 11,861 11,698 11,645 11,319
Std. Dev. (9095.0) (12455.0) (10556.0) (12419.0) (11219.0)
Agricultural Statistics Value of grain produced (CFA francs) Mean 794,726 974,737 752,029 735,976 814,623
Std. Dev. (1,118,141) (2,353,717) (944,861) (1,138,551) (1,500,268)
Land cultivated (hectares) Mean 6.7 6.7 7.1 6.5 6.7
Std. Dev. (8.8) (7.6) (8.3) (7.3) (8.0)
Input value (CFA francs) Mean 198,550 257,494 273,080 212,890 235,438
Std. Dev. (410,547) (596,547) (1,449,147) (456,825) (839,563)
N 257 256 254 254 1,021

![[Definitions] - maff.go.jp · Individual management entities (farm household) or a single-household corporation (a farm household that is incorporated). Organized management entities](https://img.pdfslide.us/doc/110x75/5f11f511dfc1d778be10ea34/definitions-maffgojp-individual-management-entities-farm-household-or-a.jpg)