Embed Size (px)
Citation preview
iapc
FaFXEB
Ig
MtwetbceoaF
R(iomdarBc
Chas
DgASD
Iwctct
Mi
sfars2c
RstpWcp
T
2
N
O
U
P
G
O
V
O
A
D
R
I
F
O
P
E
�
�
Ctdaa
PiCCCH
Imna
S115Vol. 209, No. 3S, September 2009 Surgical Forum Abstracts
mplementation of a simple robotic platform using currently avail-ble technology is feasible and may alleviate the growing need ofroviding subspecialty care in clinical environments where subspe-ialty surgical care is not readily available.
aculty preceptors benefit students’ experience insurgery clerkship
lorencia Beleniski MD, Heather Rosen MD, MPH,iangmei Gu MS, Stuart R Lipsitz ScD, PhD, Janet P Hafler EdD,lizabeth M Breen MDrigham and Women’s Hospital, Boston, MA
NTRODUCTION: We examined the impact of an innovative pro-ram that redistributed the preceptors in the surgery clerkship.
ETHODS: In July 2006, we introduced assigned faculty precep-ors to the surgical clerkship. Prior to the introduction, 79 studentsere assigned to resident teams, with assignment of OR and clinic
xperiences distributed among different faculty. Following the insti-ution of preceptors, 115 students were paired with 2 faculty mem-ers and attended their OR cases and clinics. At the end of thelerkship, students filled out a survey with Likert-type and open-nded questions. They were queried regarding the 3 major strengthsf the clerkship. At completion of the academic year, students weressessed via an Objective Structured Clinical Examination (OSCE).isher exact test was used to compare pre and post data.
ESULTS: 175 clerkship assessment questionnaires were returnedresponse rate 90.2%). Quantitative analysis revealed that after thentervention, students viewed the clerkship as having a higher qualityf teaching (80.2% post vs 63.51% pre; p� 0.036) and faculty asore accessible (85.15% post vs 70.27% pre; p� 0.024). The stu-
ents more often listed relationships with faculty and faculty qualitys important (60% post vs 36.5% pre; p� 0.003), and qualitativeesults triangulated with these results. Student OSCE scores on thereast Disease Station also improved significantly following thehanges (mean score 67.55 post vs 64.39 pre; p� 0.003).
ONCLUSIONS: Consistent faculty preceptors led to significantlyigher levels of student satisfaction with the faculty and the teaching,s well as improved scores of student’s performance in an OSCEtation.
o higher paying surgical specialties createreater competition for residency positions?bhishek Chatterjee MD, MBA, Zhen Huang BS,amuel RG Finlayson MD, MPH, FACSartmouth Hitchcock Medical Center, Lebanon, NH
NTRODUCTION: Since the advent of an enforced 80-hour workeek in 2003 and a perceived change in factors influencing career
hoices, there have been few studies analyzing the relationship be-ween income and demand for surgical specialties. Our goal is toalculate the future income for surgical specialties and assess its rela-ionship to demand for residency positions.
ETHODS: We calculated the net present value (NPV) and hourly
ncome of 8 surgical specialties and 8 medical specialties using 2007 opecialty-specific salary data and weekly physician work hours datarom published surveys. Demand for residency positions was defineds the number of total residency applicants divided by the number ofesidency positions offered. These data were obtained from the re-ults of the 2008 NRMP, the 2008 San Francisco Match, and the008 Urology Match. We used regression analysis to demonstrate theorrelation of salary and demand for medical and surgical specialties.
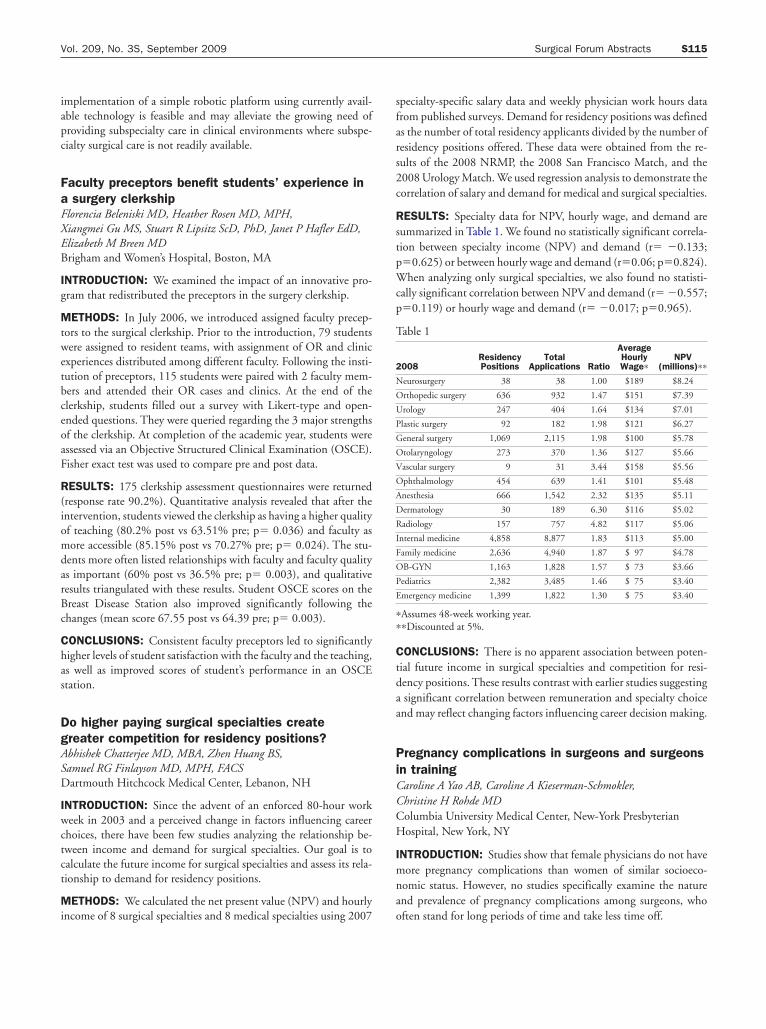
ESULTS: Specialty data for NPV, hourly wage, and demand areummarized in Table 1. We found no statistically significant correla-ion between specialty income (NPV) and demand (r� �0.133;�0.625) or between hourly wage and demand (r�0.06; p�0.824).hen analyzing only surgical specialties, we also found no statisti-
ally significant correlation between NPV and demand (r� �0.557;�0.119) or hourly wage and demand (r� �0.017; p�0.965).
able 1
008ResidencyPositions
TotalApplications Ratio
AverageHourlyWage�
NPV(millions)��
eurosurgery 38 38 1.00 $189 $8.24
rthopedic surgery 636 932 1.47 $151 $7.39
rology 247 404 1.64 $134 $7.01
lastic surgery 92 182 1.98 $121 $6.27
eneral surgery 1,069 2,115 1.98 $100 $5.78
tolaryngology 273 370 1.36 $127 $5.66
ascular surgery 9 31 3.44 $158 $5.56
phthalmology 454 639 1.41 $101 $5.48
nesthesia 666 1,542 2.32 $135 $5.11
ermatology 30 189 6.30 $116 $5.02
adiology 157 757 4.82 $117 $5.06
nternal medicine 4,858 8,877 1.83 $113 $5.00
amily medicine 2,636 4,940 1.87 $ 97 $4.78
B-GYN 1,163 1,828 1.57 $ 73 $3.66
ediatrics 2,382 3,485 1.46 $ 75 $3.40
mergency medicine 1,399 1,822 1.30 $ 75 $3.40
Assumes 48-week working year.�Discounted at 5%.
ONCLUSIONS: There is no apparent association between poten-ial future income in surgical specialties and competition for resi-ency positions. These results contrast with earlier studies suggestingsignificant correlation between remuneration and specialty choice
nd may reflect changing factors influencing career decision making.
regnancy complications in surgeons and surgeonsn trainingaroline A Yao AB, Caroline A Kieserman-Schmokler,hristine H Rohde MDolumbia University Medical Center, New-York Presbyterianospital, New York, NY
NTRODUCTION: Studies show that female physicians do not haveore pregnancy complications than women of similar socioeco-
omic status. However, no studies specifically examine the naturend prevalence of pregnancy complications among surgeons, who
ften stand for long periods of time and take less time off.