Embed Size (px)
Citation preview

Do Health Savings Account Generate Favorable Selection in a Large Employer Setting? Stephen T Parente, Ph.D.
Associate Professor of Finance and Director, Medical Industry Leadership
InstituteUniversity of Minnesota, Carlson School of
Management
Sponsored by the Robert Wood Johnson Foundation’s Health Care Financing &
Organization Initiative (HCFO), the U.S. Department of Health and Human Services
Presentation Overview
• CDHP Models– Health Reimbursement Arrangements (HRA)– Health Savings Account (HSA)
• Employer Study Setting– Plan design for 2006 HSA offer against
competing PPOs, EPOs and HRAs
• Descriptive Statistics• Plan Choice Results• Summary
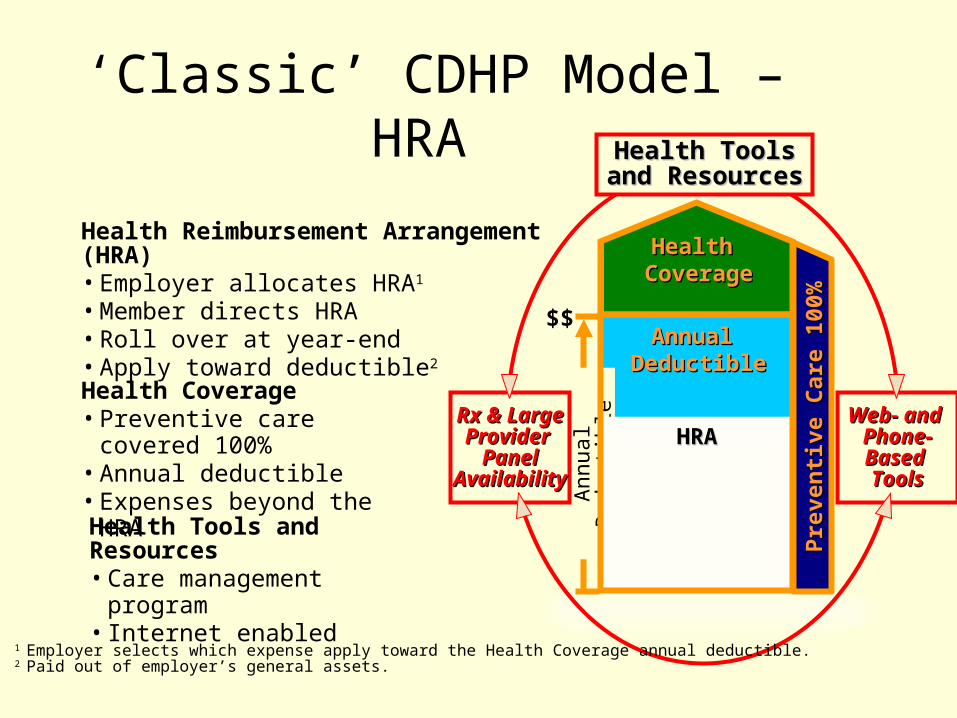
‘Classic’ CDHP Model – HRA
Rx & LargeRx & LargeProvider Provider
PanelPanelAvailabilityAvailability
Web- and Web- and Phone-Phone-Based Based ToolsTools
Health ToolsHealth Toolsand Resourcesand Resources
Health Tools and Resources• Care management
program• Internet enabled
Health Coverage• Preventive care covered
100%• Annual deductible• Expenses beyond the
HRA
Health Reimbursement Arrangement (HRA)• Employer allocates HRA1
• Member directs HRA• Roll over at year-end • Apply toward deductible2
Annual Annual DeductibleDeductible
Annual Annual DeductibleDeductible
Pre
ven
tive
Care
10
0%
Pre
ven
tive
Care
10
0%
Health Health CoverageCoverage
An
nu
al
Ded
uct
ible
1 Employer selects which expense apply toward the Health Coverage annual deductible.2 Paid out of employer’s general assets.
HRAHRAHRAHRA
$$
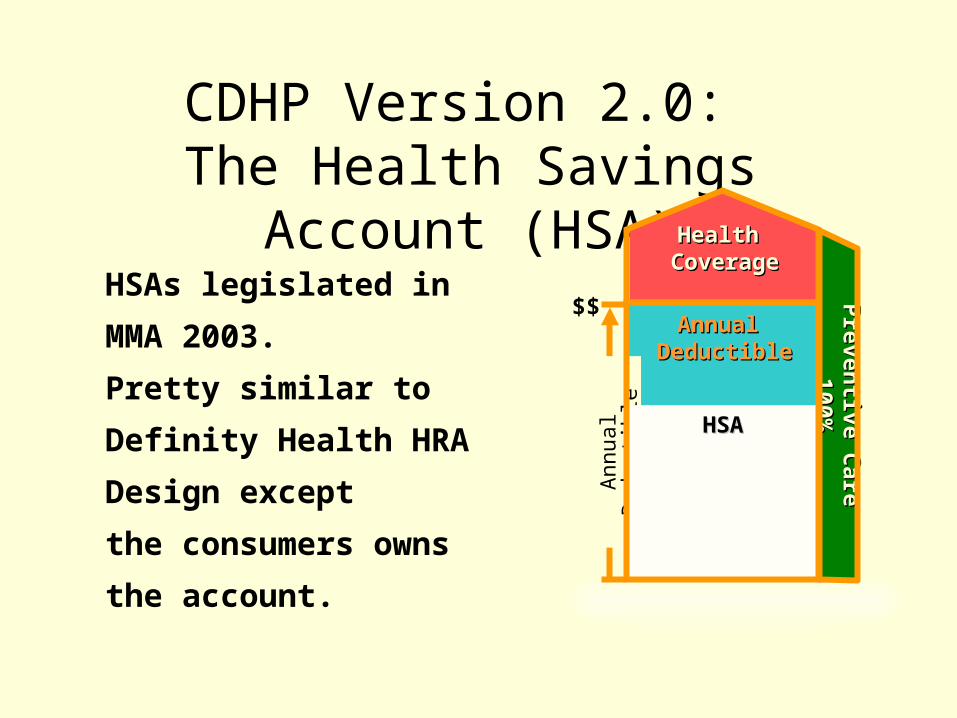
CDHP Version 2.0: The Health Savings Account
(HSA)HSAs legislated in
MMA 2003.
Pretty similar to
Definity Health HRA
Design except
the consumers owns
the account.
Annual Annual DeductibleDeductible
Annual Annual DeductibleDeductible
Pre
ven
tive C
are
P
reven
tive C
are
1
00
%1
00
%
Health Health CoverageCoverage
An
nu
al
Ded
uct
ible
HSAHSAHSAHSA
$$
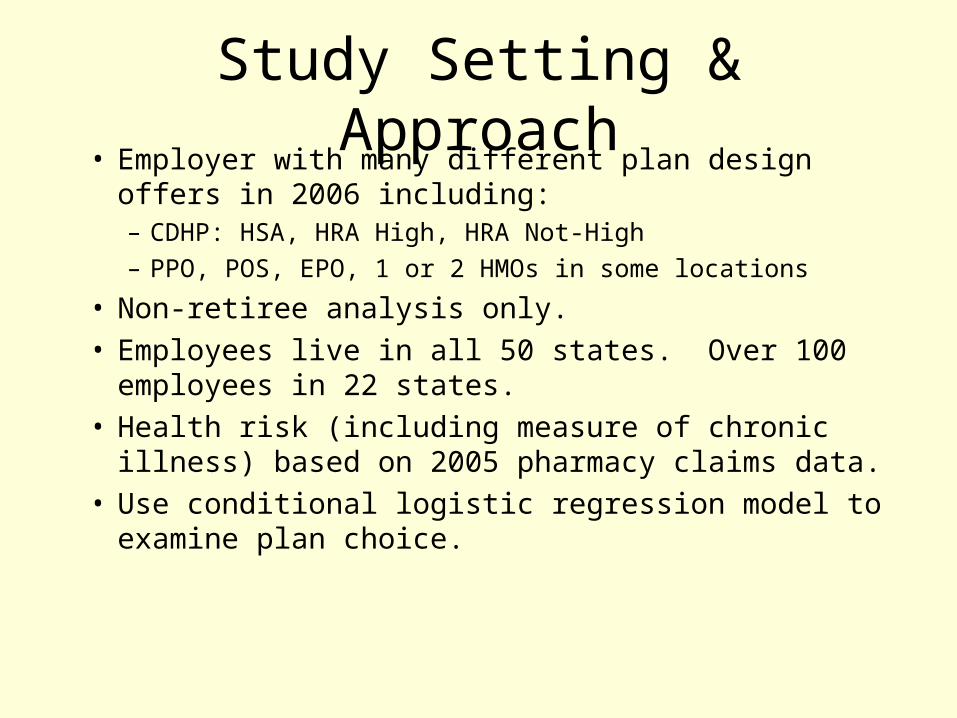
Study Setting & Approach• Employer with many different plan design offers
in 2006 including:– CDHP: HSA, HRA High, HRA Not-High– PPO, POS, EPO, 1 or 2 HMOs in some locations
• Non-retiree analysis only.• Employees live in all 50 states. Over 100
employees in 22 states.• Health risk (including measure of chronic illness)
based on 2005 pharmacy claims data.• Use conditional logistic regression model to
examine plan choice.
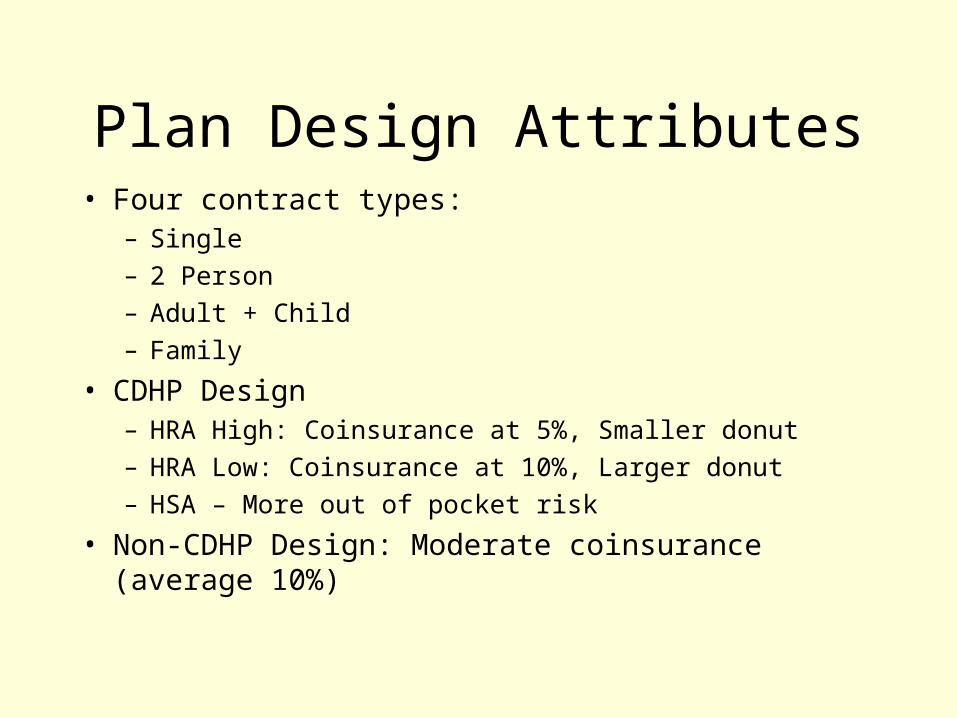
Plan Design Attributes• Four contract types:
– Single– 2 Person– Adult + Child– Family
• CDHP Design – HRA High: Coinsurance at 5%, Smaller donut– HRA Low: Coinsurance at 10%, Larger donut– HSA – More out of pocket risk
• Non-CDHP Design: Moderate coinsurance (average 10%)
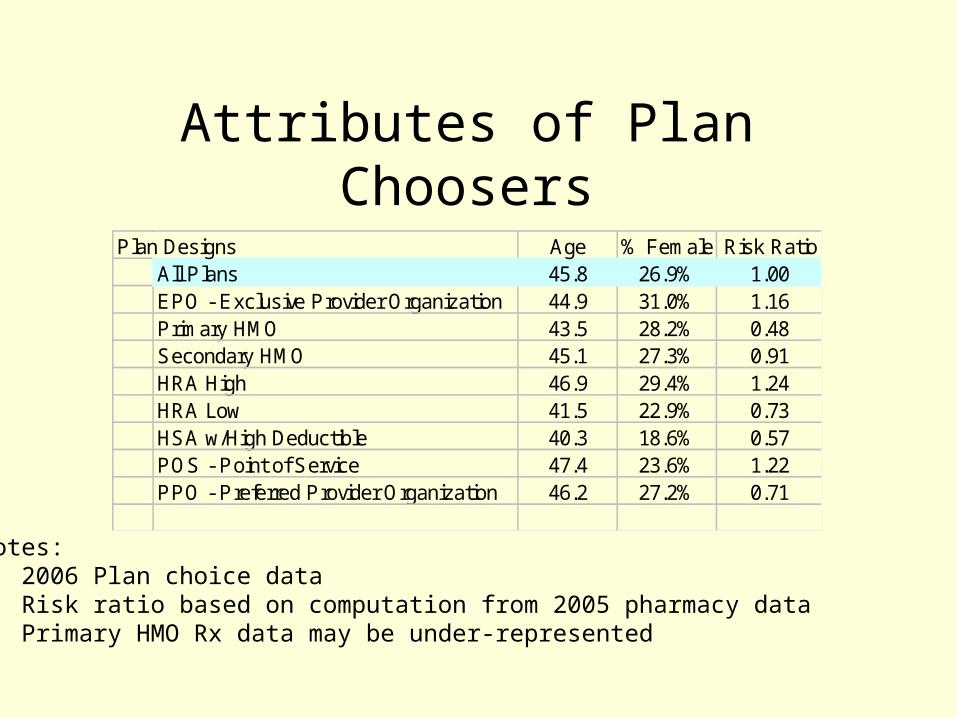
Attributes of Plan Choosers
Plan Designs Age % Female Risk RatioAll Plans 45.8 26.9% 1.00EPO - Exclusive Provider Organization 44.9 31.0% 1.16Primary HMO 43.5 28.2% 0.48Secondary HMO 45.1 27.3% 0.91HRA High 46.9 29.4% 1.24HRA Low 41.5 22.9% 0.73HSA w/High Deductible 40.3 18.6% 0.57POS - Point of Service 47.4 23.6% 1.22PPO - Preferred Provider Organization 46.2 27.2% 0.71
Notes: • 2006 Plan choice data• Risk ratio based on computation from 2005 pharmacy data• Primary HMO Rx data may be under-represented
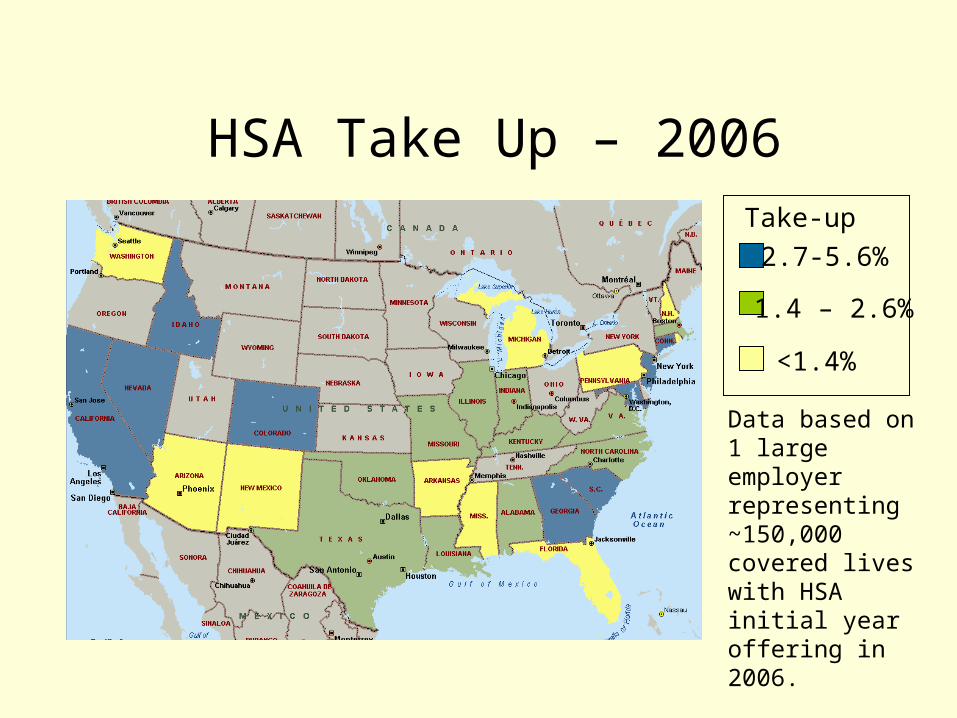
HSA Take Up – 2006
2.7-5.6%
1.4 – 2.6%
<1.4%
Take-up
Data based on 1 large employer representing ~150,000 covered lives with HSA initial year offering in 2006.
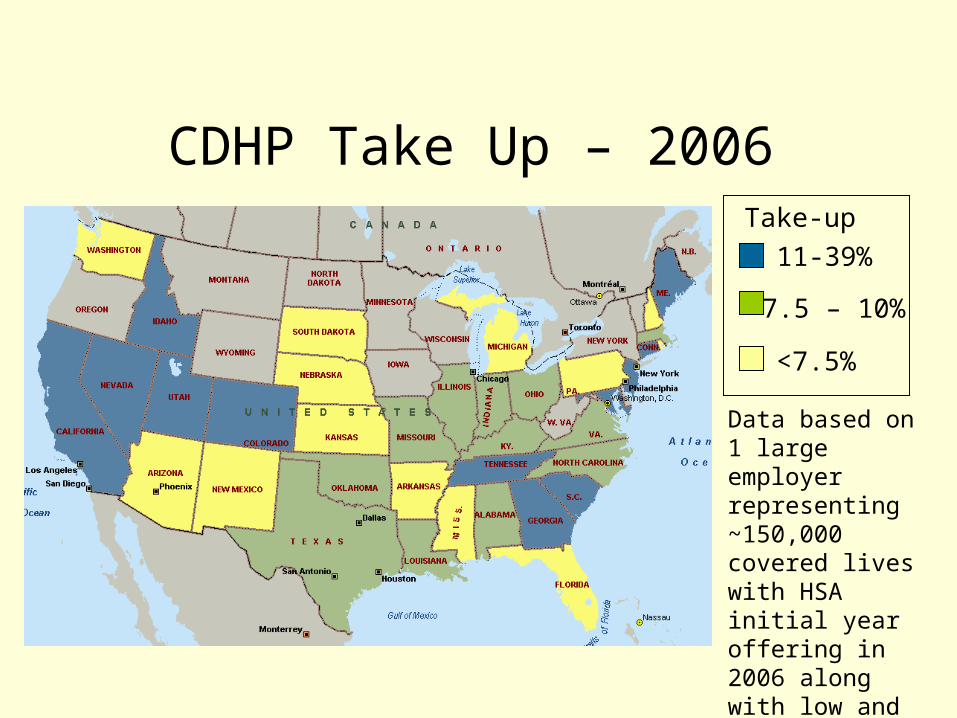
CDHP Take Up – 2006
Data based on 1 large employer representing ~150,000 covered lives with HSA initial year offering in 2006 along with low and high HRAs.
11-39%
7.5 – 10%
<7.5%
Take-up
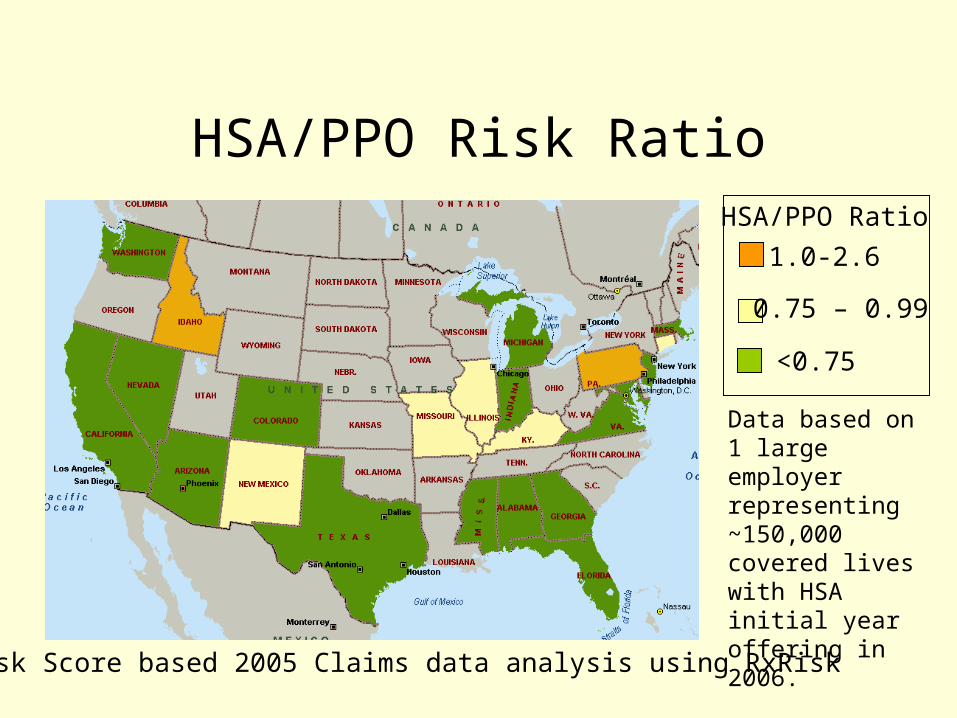
HSA/PPO Risk Ratio
Data based on 1 large employer representing ~150,000 covered lives with HSA initial year offering in 2006.
1.0-2.6
0.75 – 0.99
<0.75
HSA/PPO Ratio
Risk Score based 2005 Claims data analysis using RxRisk
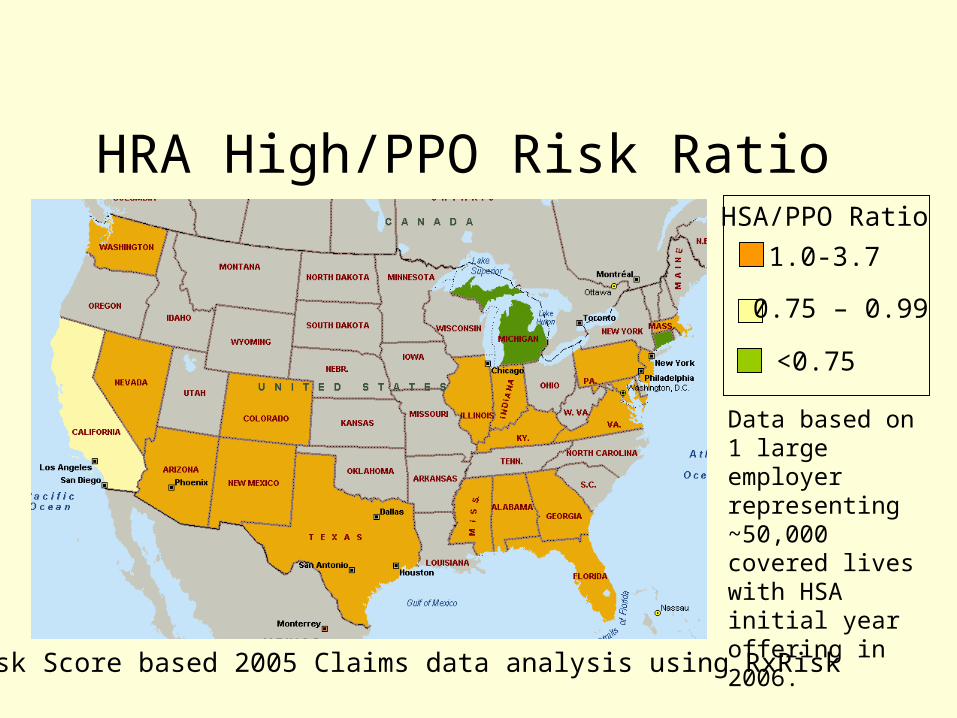
HRA High/PPO Risk Ratio
Data based on 1 large employer representing ~50,000 covered lives with HSA initial year offering in 2006.
1.0-3.7
0.75 – 0.99
<0.75
HSA/PPO Ratio
Risk Score based 2005 Claims data analysis using RxRisk
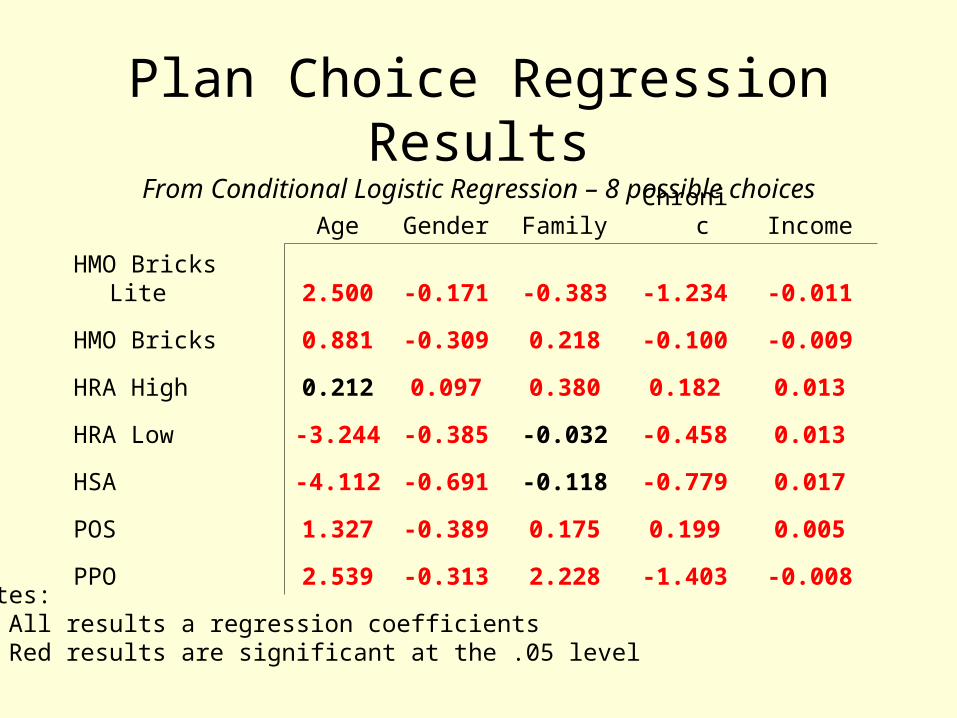
Plan Choice Regression Results
From Conditional Logistic Regression – 8 possible choices
Notes: • All results a regression coefficients• Red results are significant at the .05 level
Age Gender FamilyChroni
c Income
HMO Bricks Lite 2.500 -0.171 -0.383 -1.234 -0.011
HMO Bricks 0.881 -0.309 0.218 -0.100 -0.009
HRA High 0.212 0.097 0.380 0.182 0.013
HRA Low -3.244 -0.385 -0.032 -0.458 0.013
HSA -4.112 -0.691 -0.118 -0.779 0.017
POS 1.327 -0.389 0.175 0.199 0.005
PPO 2.539 -0.313 2.228 -1.403 -0.008
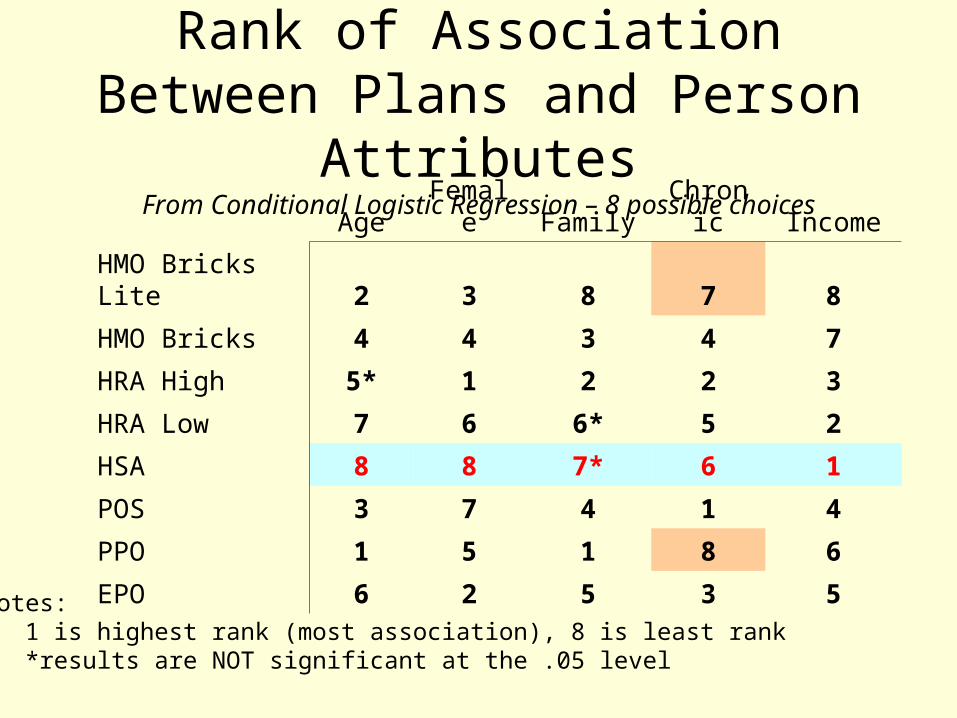
Rank of Association Between Plans and Person Attributes
From Conditional Logistic Regression – 8 possible choicesAge
Female Family
Chronic Income
HMO Bricks Lite 2 3 8 7 8
HMO Bricks 4 4 3 4 7
HRA High 5* 1 2 2 3
HRA Low 7 6 6* 5 2
HSA 8 8 7* 6 1
POS 3 7 4 1 4
PPO 1 5 1 8 6
EPO 6 2 5 3 5Notes: • 1 is highest rank (most association), 8 is least rank• *results are NOT significant at the .05 level
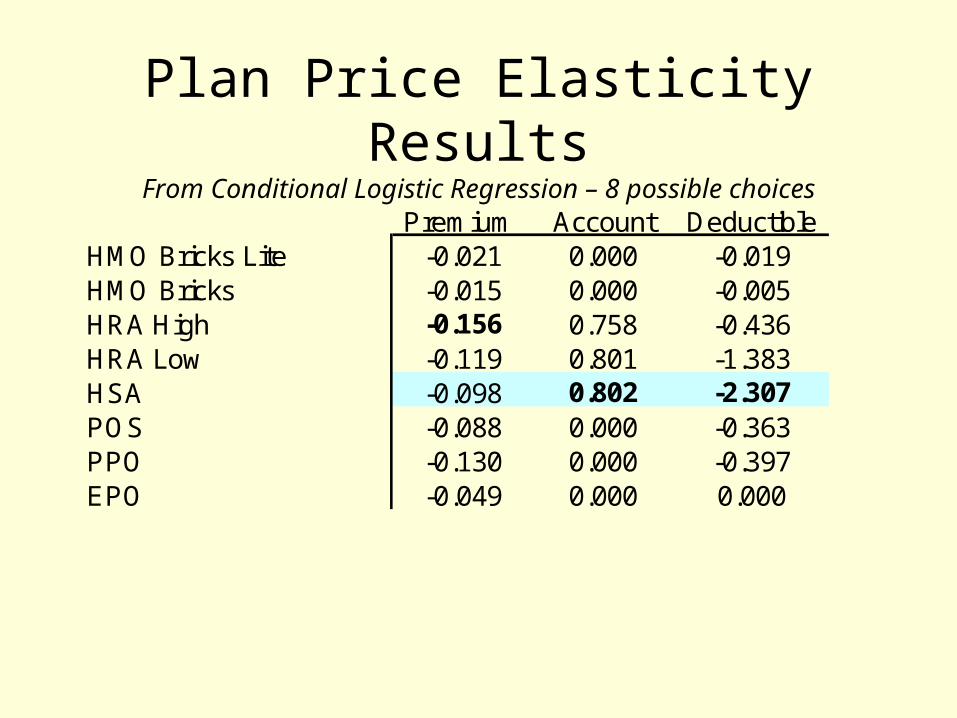
Plan Price Elasticity ResultsFrom Conditional Logistic Regression – 8 possible choices
Premium Account DeductibleHMO Bricks Lite -0.021 0.000 -0.019HMO Bricks -0.015 0.000 -0.005HRA High -0.156 0.758 -0.436HRA Low -0.119 0.801 -1.383HSA -0.098 0.802 -2.307POS -0.088 0.000 -0.363PPO -0.130 0.000 -0.397EPO -0.049 0.000 0.000

Attributes of Plan Choosers
Plan Designs Age % Female Risk RatioAll Plans 45.8 26.9% 1.00EPO - Exclusive Provider Organization 44.9 31.0% 1.16Primary HMO 43.5 28.2% 0.48Secondary HMO 45.1 27.3% 0.91HRA High 46.9 29.4% 1.24HRA Low 41.5 22.9% 0.73HSA w/High Deductible 40.3 18.6% 0.57POS - Point of Service 47.4 23.6% 1.22PPO - Preferred Provider Organization 46.2 27.2% 0.71
Notes: • 2006 Plan choice data• Risk ratio based on computation from 2005 pharmacy data• Primary HMO Rx data may be under-represented
Summary of HSA Choice when HRA and PPO are
Also Choices• Risk-splitting between HRA and HSA• Clearly an issue of benefit design.• Selection not only limited to HSAs.
Favorable selection goes to the HMOs too.• Is the risk segmentation of value? Is too
difficult to fix short of full-replacement?• Next big question: Do HSAs have
better/neutral outcomes and satisfaction, adjusted for risk?

Thank You!For more information on our
research, please visit:
www.ehealthplan.org
and come to Johns Hopkins next week (6/14 & 6/15)
Stephen T. Parente, Ph.D., M.P.H., M.S.Associate Professor, Department of Finance
Director, Medical Industry Leadership InstituteCarlson School of Management
University of Minnesota321 19th Ave. South, Room 3-122
Minneapolis, MN 55455612-624-1391 (v), [email protected]
http://www.tc.um.edu/~paren010