Embed Size (px)
Citation preview

Do Green Buildings Make Dollars and Sense?
(USD-BMC Working Paper 09-11) Draft: November 6, 2009
Please do not reproduce or distribute in part without full citation and credit.

1
Do Green Buildings Make Dollars and Sense?
Draft: November 6, 2009
By Norm G. Miller, PhD, University of San Diego, Burnham-Moores Center for Real Estate
[[email protected]] and Dave Pogue, LEED AP and National Director of Sustainability, CBRE [[email protected]]
With assistance from Myla Wilson and Jeryldine Tully, both from the University of San Diego; Lisa Colicchio, CBRE Director of Operations, Sustainability CBRE; Judy Hill, CBRE; and Melissa Sharick, Quiana D. Gough, Susan Davis, Kristin Bush and Mahsa Allandet who performed much of the data analysis during the summer and fall of 2009. Abstract: An analysis of operating costs, energy impacts, productivity and tenant attitudes from a major real estate portfolio. The results provided here are based on a survey of 154 green buildings and an additional similar-sized set of peer buildings along with over 700 tenants who have moved into primarily Energy Star-labeled buildings managed by CBRE. Results suggest that many tenants find such space more productive, and these buildings do save money on energy costs although total operating expenses tended to run similar to the peer set. Results also suggest that green management practices are increasingly important to tenants.
2
Introduction Green is not a niche, but a future way of doing business. We expect the term “green” to fade as it becomes mainstream, but for now we remain early in the process of conversion. As a result, there remains a payoff to owners from more efficient management including facilities, operations and within firms. We recognize that the green movement is partially cultural, driven by young people and those with left-of-center political view who share a new value system for determining where and with whom they will work. The rhetoric of the triple bottom line is real but most commercial market participants are driven, not by culture or triple bottom lines, but by economics. The business world is comprised of skeptics, justifiably, given the fear of regulations passed without sufficient study.1 At the same time, the world of business is a world of status quo maintenance and a degree of ignorance spiked by a dose of generalizations drawn from a few case studies and experiences. Collectively, we tend to do what the law requires or what policies have suggested from past experience. But experiences derived in the arena of sustainable real estate from more than three years ago are often obsolete and sometimes we discover simple truths that make intrinsic sense, but were never questioned. For example, running an underground garage fan 24/7 (24 hours a day and 7 days a week) does not make sense if no one is moving into or out of the garage and yet we waste tens of thousands of dollars on such activities because that is the way we operate garages or what the building code suggests. Technologies and management have continued to advance, and so it is in this context of a changing world that we provide an update on research into the pay off from greener buildings for owners and tenants. We have made continued efforts to study the impact of green buildings on rents, values and more, focusing mostly on Energy Star and LEED as the standard bearers.2 There are other standards of green features out there including BREEAM, CASBEE, GBTool, Green Point, Green Star, Green Globes, STAR and many more which we do not review here.3 We have from 2005 through late 2009 consistently found rental premiums, higher occupancy levels and lower capitalization rates, which imply higher selling prices per unit of current income. See, for example, recent papers by Eicholtz, Kok and Quigley; Miller, Spivey and Florance; Fuerst and McAllister; or Wiley, Benefield and Johnson all of which found premiums in rents and occupancy rates for green buildings.4 Rental premiums and higher occupancy rates should lead to higher values generally by more than the extra costs to go green; however, data on LEED-
1 NAIOP has been a leader in providing resources on sustainable development, but also an opponent to regulations and design burdens that impose new costs on building owners and tenants. See www.naiop.org/resourcecenter/gr.cfm 2 LEED is a term from the USGBC (United States Green Building Council) that stands for Leadership in Energy & Environmental Design. Energy Star is a label provided by standards set by the EPA (Environmental Protection Agency) based on meeting a set of on-going energy saving standards. 3 See Karl-Werner Schulte and Richard Reed “International Comparison of Sustainable Rating Tools” in the Journal of Sustainable Real Estate, Vol. 1, No. 1, 2009. 4 Eicholtz, Kok, and Quigley “Doing Well By Doing Good? Green Office Buildings” forthcoming in the American Economic Review. Fuerst, Franz and Patrick McAllister, “Pricing Sustainability: An Empirical Investigation of the Value Impacts of Green Building Certification” working paper presented at ARES, April, 2008. Miller, Spivey and Florance (2008) “Does Green Pay Off?” Journal of Real Estate Portfolio Management, Vol. 14, 4, Oct-Dec. pp 385-401.Wiley, Benefield and Johnson, “Green Design and the Market for Commercial Office Space” forthcoming in the Journal of Real Estate Finance and Economics.
3
certified property sales has been particularly difficult to come by as there have been few sales over the past few years. The same holds true for Energy Star-labeled properties.5 This may imply that owners of green buildings are longer term oriented and less likely to sell as quickly as merchant builders who care less about long term values.6 These early studies have found premiums in rents and values that eliminated any doubt about exceeding the costs of such improvements, raising questions as to how these results could represent equilibrium differentials. The net present value of investments in green features is often very positive, although it will differ by feature, and such nuances remain for future study. We do not defend here the positive rent, occupancy and value differentials as permanent, as we expect green features to become mainstream and thus rent differentials should disappear over time. As of 2009 the supply of green buildings, however defined, is so small a proportion of the total stock that those seeking greener industrial, office or retail properties must search hard to find LEED-certified space or Energy Star-labeled buildings despite the fact that the premiums for becoming or converting to a greener building is modest compared with the payback. For new construction, there is no significant premium in costs at all to hit silver levels of certification as long as the developer starts early and has an experienced team.7 In a recent review study and book by Greg Kats he suggests that “green buildings cost roughly 2% more to build than conventional buildings” which is quite nominal compared to the benefits.8 Typical of the reports now provided on costs are a recent 2009 Urban Green Council study which includes the statement: “We must prioritize greening our cities, and cost is not the barrier some have made it out to be.” Prepared for the UGC by Davis Langdon, the study looked at construction costs for 38 high-rise multifamily buildings and 25 commercial interiors in New York City. It found that LEED-certified high-rises came in at an average of $440 per square foot, compared to $436 pr square foot for non-LEED projects. The differential was less than 1%, according to the report. On commercial interiors, the cost of $191 per square foot for LEED construction was actually 6% lower than the $204 per square foot cost of non-LEED. We acknowledge that there remain some certification processing costs that may deter some owners from applying.9
But if the cost differential to produce better buildings is modest, why is the overall office stock percentage of green buildings so low, not to mention other property types? Blame this on the fact that real estate lasts a long time, and we typically build no more than about 2 percent of the existing stock in any one year. As we see existing building owners ramp up with retrofits, such
5 Energy Star labels require a score of 75+ on a 0-100 scale as determined by the EPA. See http://www.energystar.gov/ia/business/evaluate_performance/pm_pe_guide.pdf 6 On those few sales which have occurred we estimate about a 50 basis point lower cap rate compared to similar non-green sales. As of October 29, 2009 there were 3608 LEED or Energy Star Class A or B office buildings in the CoStar data base and of these only 43 were for sale. With sales activity low it is unlikely all for sale will sell quickly and so it is a challenge to provide a significant sample of LEED or Energy Star property sales in 2009. 7 See Paul Bubny in Globest.com on the Green Premium Disappears, Oct. 6, 2009 8 Greg Kats, Greening Our Built World: Costs, Benefits, and Strategies, Island Press, 2009. 9 For example in 2010 the cost of new construction certification fees for a 100,000 sq ft building will be $5,500 plus $10,000 for an expedited process for design and construction review along with fees for a LEED consultant to assist in the process which could run several thousand dollars.

4
as the famous Empire State Building the percentage will grow rapidly.10 The Empire State Building is getting a $20 million energy efficiency retrofit that is expected to save $4.4 million in annual energy costs, reduce its energy consumption by close to 40%, repay its net extra cost in about three years, and cut its overall carbon output. Perhaps the Empire State Building retrofit will mark a turning point for other property owners.
The study at hand focuses upon the operation and management of green buildings along with tenant perspectives. Several studies cited in a recent paper by Miller and Pogue in the Journal of Sustainable Real Estate focus on improved worker productivity from better environments.11 Such improvements as better lighting, cleaner air and no volatile organic compounds (VOCs) are shown to improve productivity or reduce sick time. But few studies focus on professional work environments. One well-cited study by Greg Kats (2003) had a sample of 33 green building projects and suggested present value benefits of $37 to $55 U.S. dollars per square foot as a result of productivity gains from less sick time and greater worker productivity. These results stemmed primarily from better ventilation, lighting and general environment. The Miller and Pogue study suggests present value benefits that could equal hundreds of dollars depending on the time horizon for discounting, yet even this study is early and does not cover much range of green features. These early results beg the question why more corporations aren’t putting more effort into insisting upon better worker environments. A more recent working paper by Eicholtz, Kok and Quigley (2009) identified four determinants of the penetration of Corporate Social Responsibility in real estate decision-making. 12 They develop six propositions about which firms or industries are willing to rent green space and to pay a rental premium. Using a comprehensive description of the tenants in U.S. office buildings with a green label, awarded by Energy Star or the USGBC, their results show that the oil industry is a major consumer of green office space, which follows from a general proposition that firms in environmentally sensitive industries will actively incorporate sustainability in strategic decisions, such as headquarters selection (perhaps merely to enhance reputation, “green-washing”). Firms in the legal and financial services industry lease a substantial share of green office space as well. For some of these firms, further investigation shows support for the notion of productivity benefits from green buildings. However, they conclude it is likely that many firms lease green space as a result of the preference for high-quality buildings, rather than a conscious act of “responsible behavior,” since green buildings are usually higher-quality buildings. Data: Here we collect data from 154 green buildings nearly all of which are Energy Star-labeled properties and six are LEED-certified.13 Property managers, all working for CBRE, responded to surveys on detailed operating expenses and operations for this subject property database collected in the spring of 2009. A peer set of data, also managed by CBRE, was used for
10 See http://www.greenrightnow.com/kabc/2009/04/07/empire-state-building-will-be-retrofitted-into-a-green-giant/ 11 See “Green Buildings and Productivity” by Miller and Pogue, 2009, Journal of Sustainable Real Estate, Vol. 1, No.1. 12 See Eicholtz, Piet, Nils Kok, John Quigley “Why Do Companies Rent Green? Real Property and Corporate Social Responsibility” Working Paper, Fisher Center for Real Estate and Urban Economics, UC Berkeley, July 2009. 13 “We” refers to a team from CBRE and the University of San Diego’s Burnham-Moores Center for Real Estate.
5
comparisons along with a national data base of office property. Within these buildings are over 2,000 tenants of which 534 responded to the initial survey with a second follow-up in the summer landed 221 more tenants responded, providing very similar answers. These tenants had generally moved from non-green buildings to these mostly Energy Star-labeled buildings. There were a few exceptions, which may explain some negative experiences after the move. We provide detailed analysis of the results from these surveys along with the attributes of the sample in the latter part of this report. Findings: Among the most significant findings in this study are that:
Green buildings are more intensively managed than non-green buildings; therefore, the total operating expenses are not that different.
Green buildings typically use less energy and gas, so other expense items may run more than average.
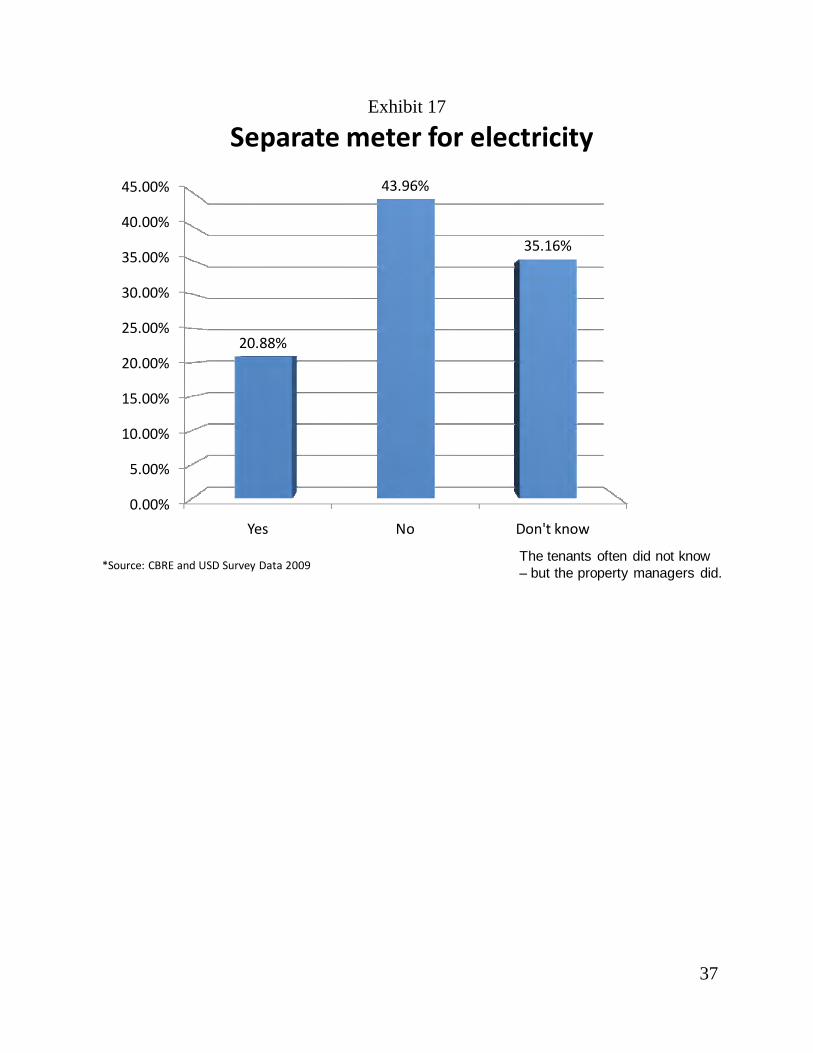
Separate metering means almost as much as a significantly improved Energy Star score for saving energy. A separately metered building, where tenants pay for what they consume, will have lower energy costs by 21% on average even if the Energy Star score is the same. That is, when you pay for what you consume, you become much more frugal.
Green buildings, even if only Energy Star-labeled tend to be occupied by higher than average wage tenants who generally feel more productive and take fewer sick days.
Most tenants will not admit to being willing to pay more for a green building, yet empirical evidence suggests they will and do.
Green leases and green operational practices are important to tenants. Public image, recruitment of and retention of employees are enhanced in green buildings.
6
Part 1: Do green buildings improve productivity? This section is a recap of our separate paper on green buildings and productivity. We start with a review of some of the literature. Kemmila and Lonnqvist (2003) state: “Productivity is an important success factor for all organizations. Improvements in productivity have been recognized to have a major impact on many economic and social phenomena, e.g. economic growth and higher standard of living. Companies must continuously improve productivity in order to stay profitable…There are several different methods for productivity measurement. Most of the methods are based on quantitative data on operations. In many cases, it is quite difficult and sometimes even impossible to collect the data needed for productivity measurement. An example of this situation is the work of professionals and experts. Their work is knowledge-intensive and the inputs and outputs are not easily quantifiable. Therefore, the traditional productivity measures are not applicable…An old but scarcely used approach to productivity measurement is subjective productivity measurement. Subjective productivity measures are not based on quantitative operational information. Instead, they are based on personnel’s subjective assessments. The data is collected using survey questionnaires.”14 Essentially, Kemmila and Lonnqvist point out that measuring productivity directly is a great challenge. This is because direct measurement for professionals in an office environment requires the ability to monitor things like the ability to focus and think, synthesize and add value to the firm, measure the contribution of individuals that likely work in a team environment, and monitor quality of work as well as efficiency and output. While productivity itself could be measured using financial and economic measures for the entire system, firm or division using statistics like revenues, billable hours, net income or market share gained there are leads and lags from the input of capital and labor to the output effects based on measureable indicators. Even if these indicators can be measured in real time there is the question of external and internal influences that must be controlled. We do not live in a status quo world so controlling for external changes is a challenge. Last, assuming you could control for all external changes, you need to be able to divvy up the output by internal inputs as well as vendors and others that contribute to the firm’s revenue generation or production of services. Direct measures may be useful such as customers served by a cash register operator or calls taken by a customer service representative and certainly management does use such measures. But often these are hard to apply to professional service environments where many participants contribute to a process and service. Most commonly we use indirect measures such as:
absenteeism hours worked tardiness safety rule violations number of grievances filed employee turnover
14 Kemppila, S., & Lonnqvist, A. Subjective Productivity Measure. Institute of Industrial Management, 1-8.
7
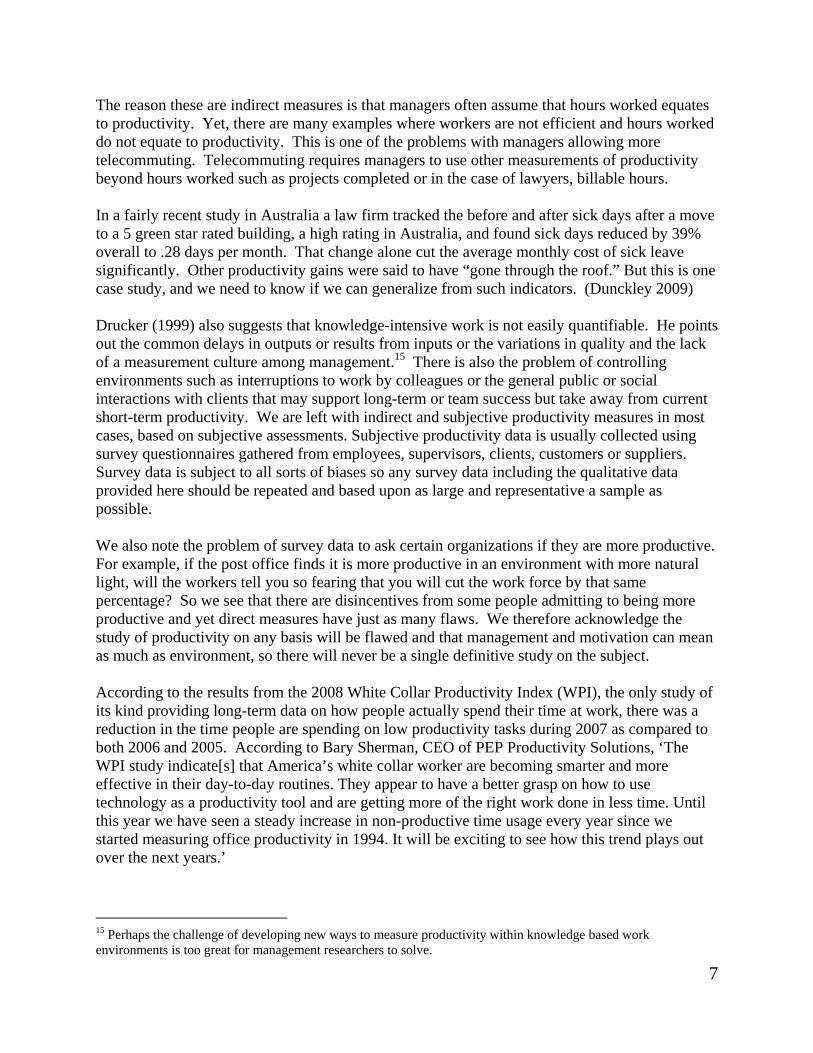
The reason these are indirect measures is that managers often assume that hours worked equates to productivity. Yet, there are many examples where workers are not efficient and hours worked do not equate to productivity. This is one of the problems with managers allowing more telecommuting. Telecommuting requires managers to use other measurements of productivity beyond hours worked such as projects completed or in the case of lawyers, billable hours. In a fairly recent study in Australia a law firm tracked the before and after sick days after a move to a 5 green star rated building, a high rating in Australia, and found sick days reduced by 39% overall to .28 days per month. That change alone cut the average monthly cost of sick leave significantly. Other productivity gains were said to have “gone through the roof.” But this is one case study, and we need to know if we can generalize from such indicators. (Dunckley 2009) Drucker (1999) also suggests that knowledge-intensive work is not easily quantifiable. He points out the common delays in outputs or results from inputs or the variations in quality and the lack of a measurement culture among management.15 There is also the problem of controlling environments such as interruptions to work by colleagues or the general public or social interactions with clients that may support long-term or team success but take away from current short-term productivity. We are left with indirect and subjective productivity measures in most cases, based on subjective assessments. Subjective productivity data is usually collected using survey questionnaires gathered from employees, supervisors, clients, customers or suppliers. Survey data is subject to all sorts of biases so any survey data including the qualitative data provided here should be repeated and based upon as large and representative a sample as possible. We also note the problem of survey data to ask certain organizations if they are more productive. For example, if the post office finds it is more productive in an environment with more natural light, will the workers tell you so fearing that you will cut the work force by that same percentage? So we see that there are disincentives from some people admitting to being more productive and yet direct measures have just as many flaws. We therefore acknowledge the study of productivity on any basis will be flawed and that management and motivation can mean as much as environment, so there will never be a single definitive study on the subject.
According to the results from the 2008 White Collar Productivity Index (WPI), the only study of its kind providing long-term data on how people actually spend their time at work, there was a reduction in the time people are spending on low productivity tasks during 2007 as compared to both 2006 and 2005. According to Bary Sherman, CEO of PEP Productivity Solutions, ‘The WPI study indicate[s] that America’s white collar worker are becoming smarter and more effective in their day-to-day routines. They appear to have a better grasp on how to use technology as a productivity tool and are getting more of the right work done in less time. Until this year we have seen a steady increase in non-productive time usage every year since we started measuring office productivity in 1994. It will be exciting to see how this trend plays out over the next years.’
15 Perhaps the challenge of developing new ways to measure productivity within knowledge based work environments is too great for management researchers to solve.
8
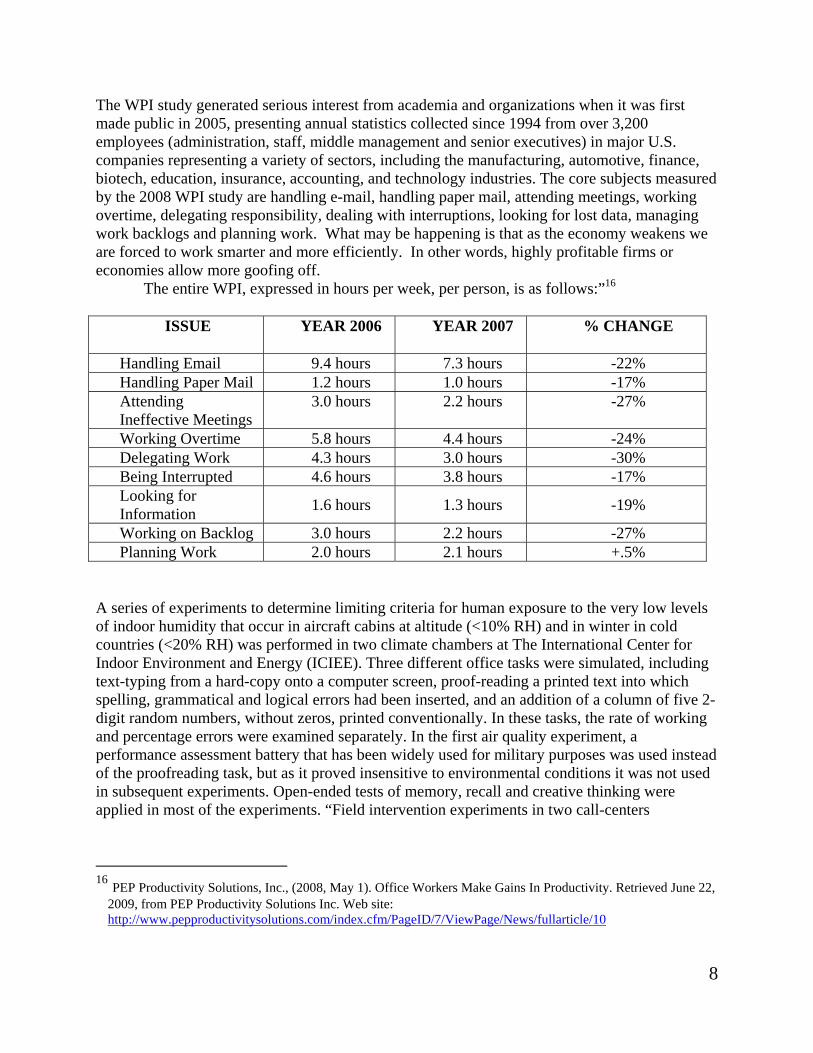
The WPI study generated serious interest from academia and organizations when it was first made public in 2005, presenting annual statistics collected since 1994 from over 3,200 employees (administration, staff, middle management and senior executives) in major U.S. companies representing a variety of sectors, including the manufacturing, automotive, finance, biotech, education, insurance, accounting, and technology industries. The core subjects measured by the 2008 WPI study are handling e-mail, handling paper mail, attending meetings, working overtime, delegating responsibility, dealing with interruptions, looking for lost data, managing work backlogs and planning work. What may be happening is that as the economy weakens we are forced to work smarter and more efficiently. In other words, highly profitable firms or economies allow more goofing off.
The entire WPI, expressed in hours per week, per person, is as follows:”16
ISSUE
YEAR 2006
YEAR 2007
% CHANGE
Handling Email 9.4 hours 7.3 hours -22% Handling Paper Mail 1.2 hours 1.0 hours -17% Attending Ineffective Meetings
3.0 hours
2.2 hours
-27%
Working Overtime 5.8 hours 4.4 hours -24% Delegating Work 4.3 hours 3.0 hours -30% Being Interrupted 4.6 hours 3.8 hours -17% Looking for Information 1.6 hours 1.3 hours -19%
Working on Backlog 3.0 hours 2.2 hours -27% Planning Work 2.0 hours 2.1 hours +.5%
A series of experiments to determine limiting criteria for human exposure to the very low levels of indoor humidity that occur in aircraft cabins at altitude (<10% RH) and in winter in cold countries (<20% RH) was performed in two climate chambers at The International Center for Indoor Environment and Energy (ICIEE). Three different office tasks were simulated, including text-typing from a hard-copy onto a computer screen, proof-reading a printed text into which spelling, grammatical and logical errors had been inserted, and an addition of a column of five 2-digit random numbers, without zeros, printed conventionally. In these tasks, the rate of working and percentage errors were examined separately. In the first air quality experiment, a performance assessment battery that has been widely used for military purposes was used instead of the proofreading task, but as it proved insensitive to environmental conditions it was not used in subsequent experiments. Open-ended tests of memory, recall and creative thinking were applied in most of the experiments. “Field intervention experiments in two call-centers
16 PEP Productivity Solutions, Inc., (2008, May 1). Office Workers Make Gains In Productivity. Retrieved June 22,
2009, from PEP Productivity Solutions Inc. Web site: http://www.pepproductivitysolutions.com/index.cfm/PageID/7/ViewPage/News/fullarticle/10
9
demonstrate that the decrement in performance can be larger in practice than it is in realistic laboratory simulation experiments.”17 “It has now been shown beyond reasonable doubt that poor indoor air quality in buildings can decrease productivity in addition to causing visitors to express dissatisfaction. There is an approximate 20% to 70% linear relationship between the percentage dissatisfied with indoor air quality and the measured decrement in performance. The size of the effect on most aspects of office work performance appears to be as high as 6 - 9%, the higher value being obtained in field validation studies. It is usually more energy-efficient to eliminate sources of pollution than to increase outdoor air supply rates. The experiments summarized by Wyon (2004) documented and quantified relationships that can be used in making cost-benefit analyses of either solution for a given building. The high cost of labor per unit floor area ensures that payback times will usually be as low as 2 years.”18
Could the results in this study be a placebo effect? What is the impact on worker productivity of an organization physically moving their office into a new space from a pre-existing space? This question is important as we could have a placebo effect and thus biased results when asking about worker productivity after moving into a green building. A Montreal corporation chose to relocate its office to provide employees with an open atmosphere for increased communication, collaboration, teamwork, and overall increase the quality of the company’s services. The new office was designed to increase productivity through the creation of accessible space for employees to share and generate new ideas. “The study showed that the two buildings differ slightly in their effects on work, with workstation comfort being more supportive in the new building. Air quality is rated positively in both buildings, but more so in the new building. Thermal comfort and lighting quality are neutral in both buildings but draw no energy away from the performance of work. Privacy (or lack of it) is drawing energy away from task performance in both buildings, and in the new building, poor acoustic conditions are also having a negative effect.”19 Overall, survey results indicate that the newer workspaces are more supportive of workers but that new buildings often had chemicals that polluted the air from concrete, paint or carpets. So new buildings do not necessarily increase worker productivity and often decrease it when the presence of pollutants is temporarily increased.20
17 Wyon, D.P. (2004). The effects of indoor air quality on performance and productivity. Indoor Air. 14, 92-101. 18 Wyon, D.P. (2004). The effects of indoor air quality on performance and productivity. Indoor Air. 14, 92-101. 19 Vischer, J.C. (2005). Measuring the Impact of Moving on Building Users. EcoLibrium. September, 22-27. 20 Ibid

10
According to the U.S. Environmental Protection Agency Sick Building Syndrome, SBS, is caused by four major categories as listed below:21
Inadequate ventilation: In the early and mid-1900’s, building ventilation standards called for approximately 15 cubic feet per minute (cfm) of outside air for each building occupant, primarily to dilute and remove body odors. As a result of the 1973 oil embargo, however, national energy conservation measures called for a reduction in the amount of outdoor air provided for ventilation to 5 cfm per occupant. In many cases these reduced outdoor air ventilation rates were found to be inadequate to maintain the health and comfort of building occupants. Inadequate ventilation, which may also occur if heating, ventilating, and air conditioning (HVAC) systems do not effectively distribute air to people in the building, is thought to be an important factor in SBS. In an effort to achieve acceptable IAQ while minimizing energy consumption, the American Society of Heating, Refrigerating and Air-Conditioning Engineers (ASHRAE) revised its ventilation standard to provide a minimum of 15 cfm of outdoor air per person (20 cfm/person in office spaces). Up to 60 cfm/person may be required in some spaces (such as smoking lounges) depending on the activities that normally occur in that space (See ASHRAE Standard 62-1989).
Chemical contaminants from indoor sources: Most indoor air pollution comes from sources inside the building. For example, adhesives, carpeting, upholstery, manufactured wood products, copy machines, pesticides, and cleaning agents may emit volatile organic compounds (VOCs), including formaldehyde. Environmental tobacco smoke contributes high levels of VOCs, other toxic compounds, and respirable particulate matter. Research shows that some VOCs can cause chronic and acute health effects at high concentrations, and some are known carcinogens. Low to moderate levels of multiple VOCs may also produce acute reactions. Combustion products such as carbon monoxide, nitrogen dioxide, as well as respirable particles, can come from unvented kerosene and gas space heaters, woodstoves, fireplaces, and gas stoves.
Chemical contaminants from outdoor sources: The outdoor air that enters a building can be a source of indoor air pollution. For example, pollutants from motor vehicle exhausts; plumbing vents, and building exhausts (e.g., bathrooms and kitchens) can enter the building through poorly located air intake vents, windows, and other openings. In addition, combustion products can enter a building from a nearby garage.
Biological contaminants: Bacteria, molds, pollen, and viruses are types of biological contaminants. These contaminants may breed in stagnant water that has accumulated in ducts, humidifiers and drain pans, or where water has collected on ceiling tiles, carpeting, or insulation. Sometimes insects or bird droppings can be a source of biological contaminants. Physical symptoms related to biological contamination include cough, chest tightness, fever, chills,
21 See http://www.epa.gov/iaq/pubs/sbs.html#Causes of Sick Building Syndrome
11
muscle aches, and allergic responses such as mucous membrane irritation and upper respiratory congestion. One indoor bacterium, Legionella, has caused both Legionnaire’s Disease and Pontiac Fever.
These elements may act in combination, and may supplement other complaints such as inadequate temperature, humidity, or lighting.
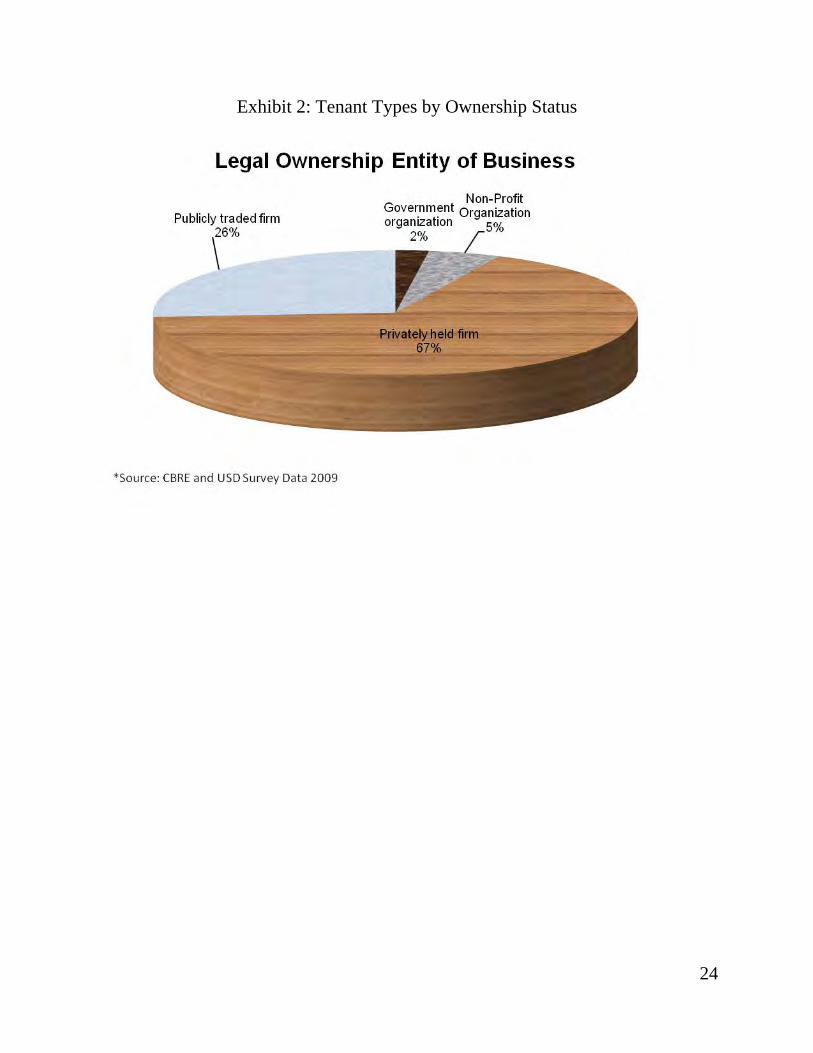
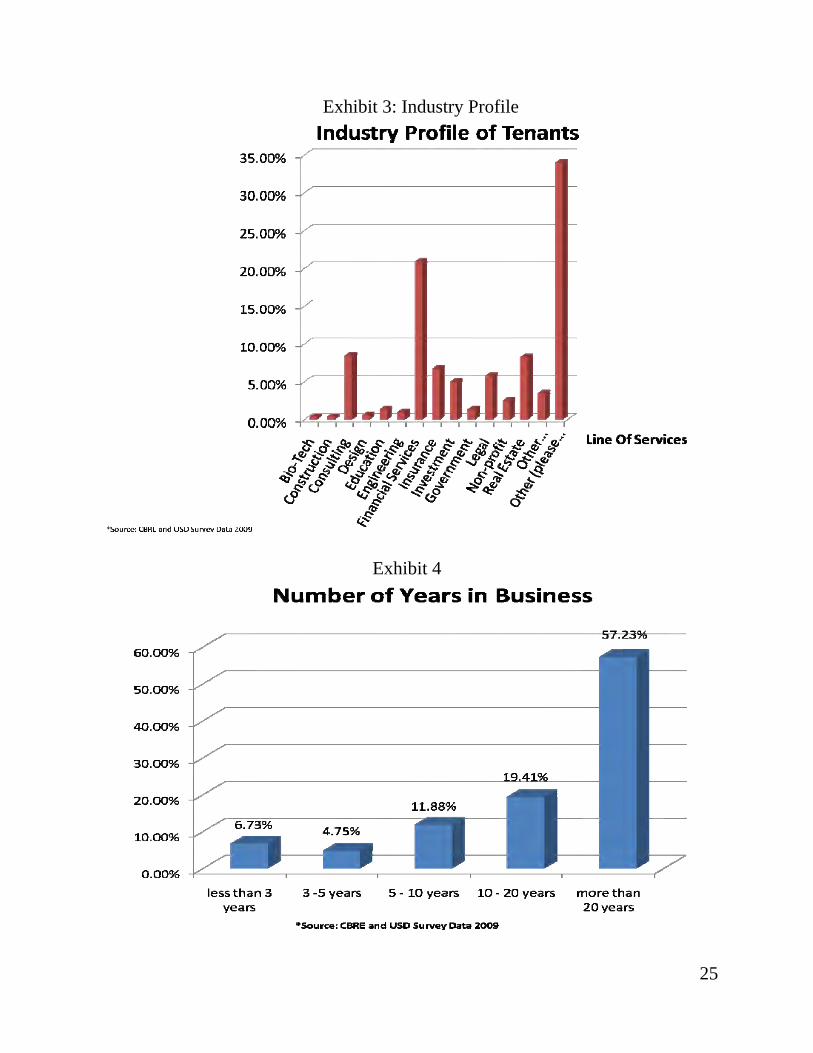
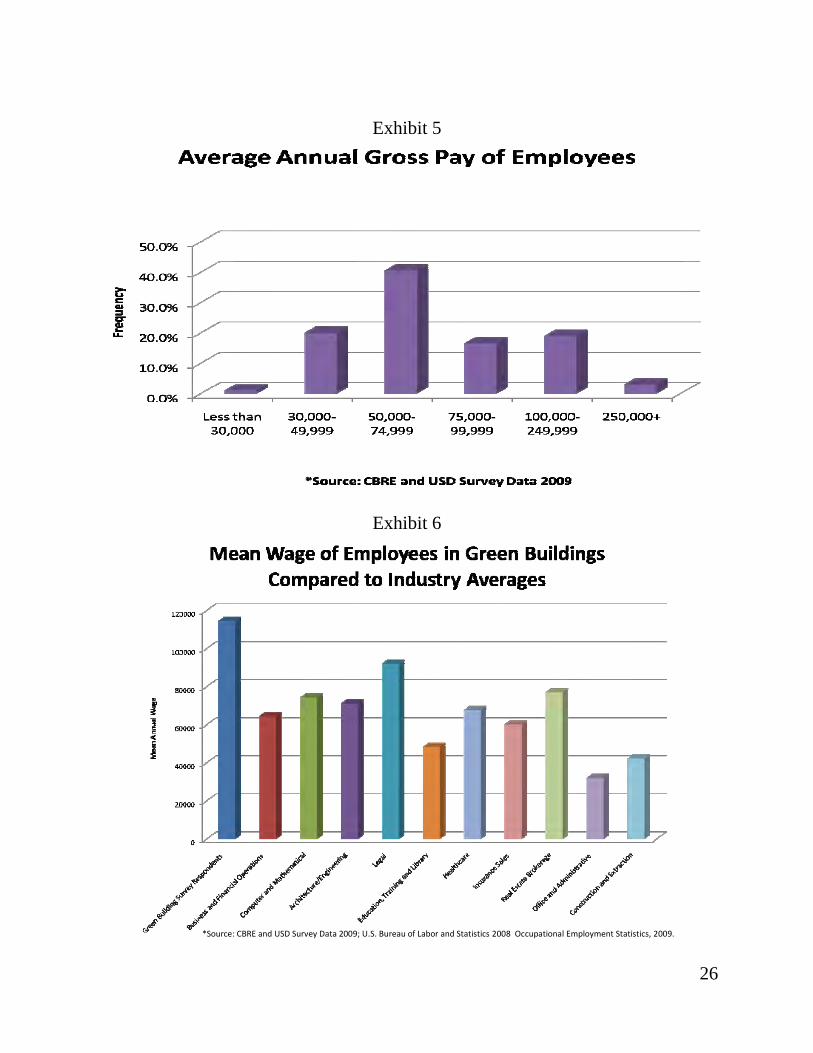
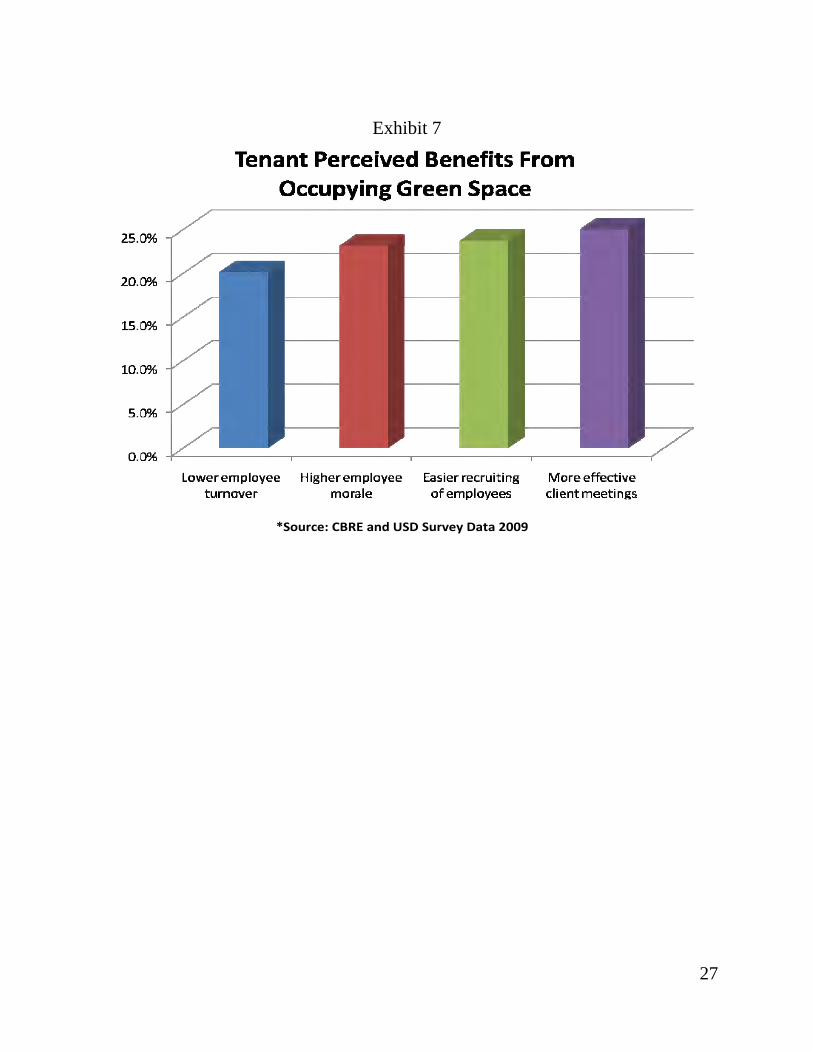
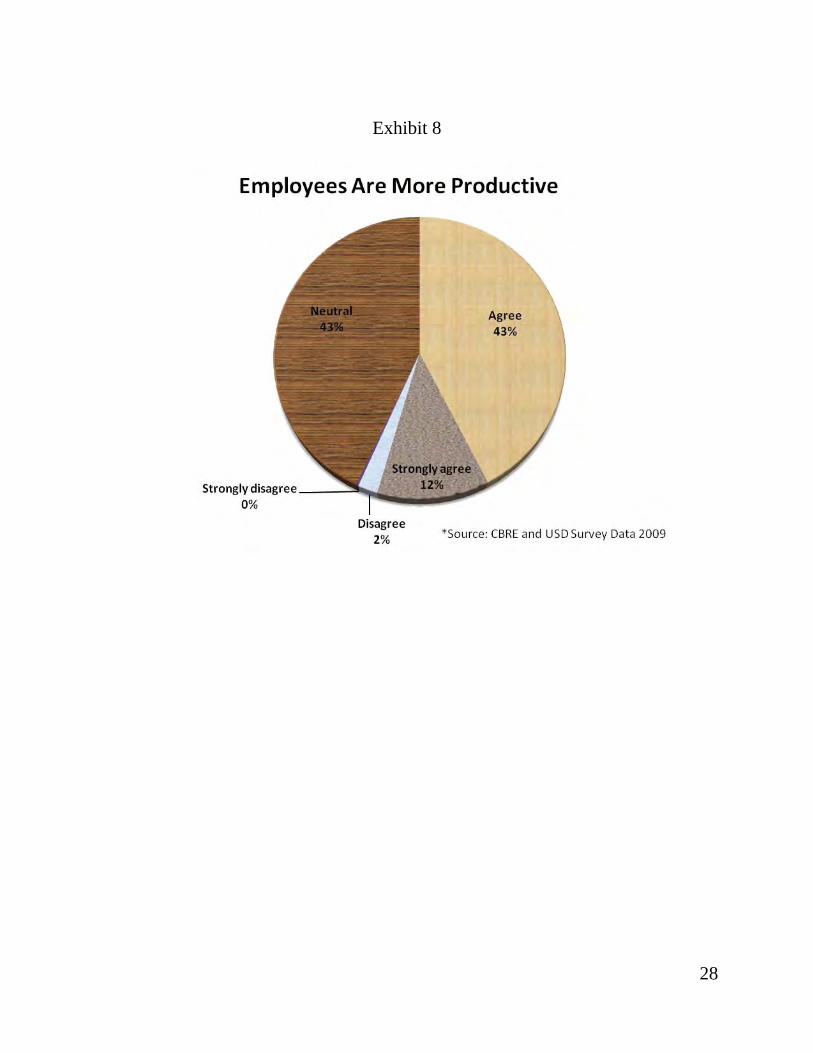
Research discussed above suggests that new buildings may often result in sickness-inducing environments as pollutants are generated from carpets, paint, concrete and constructed without regard to chemical compound release. Thus, it is not uncommon for newly occupied buildings not meeting modern ASHRAE standards or LEED standards to result in an increase in SBS where occupants report higher levels of illness. Energy Star-labeled buildings do not necessarily have healthier environments, although we know that the Energy Star label is correlated with healthier buildings. Our hypothesis: Green buildings (Energy Star-labeled or LEED-certified) provide more productive environments for workers than non-green buildings. Methodology: We use two measurements of productivity: sick days and the self-reported productivity percentage change after moving into a new building. We admit that this is preliminary, but the data set is far larger than any other previously collected from Energy Star or LEED-certified buildings. 534 tenant responses were collected from 154 buildings in the first survey from buildings spread across the country as shown in Exhibit 1. 44% of the buildings were located in the CBD (central business district) while 56% were midtown or suburban. 94% of the buildings were multi-tenant. Most were Class A or A-. Exhibit 2 shows the legal status of the tenant types, predominantly private sector. Exhibit 3 shows the breakdown of tenants by industry type with the largest being Other at 33%, suggesting we need to pin this down in further research. Of standard categories, financial services and legal were the largest groups. Exhibit 4 shows the years in business, and we can see that most firms have been in business a long time, more than 20 years. Exhibit 5 shows the Gross Annual Pay of employees; the mode group is in the $50,000 to $75,000 range while the average was about $106,644. As shown in Exhibit 6 (see the left bar for our sample group) this figure is far above industry averages suggesting green-occupying tenants tend to be from more productive industries. In Exhibit 7 we see some other benefits of occupying green buildings, among these are higher employee morale, less turnover, and greater ease of recruitment. With respect to those all important questions on productivity and sick days, we show Exhibit 8 in which 12% strongly agree that employees are more productive, 42.5% agree that employees are more productive, and 45% suggest no change. In Exhibit 9 we see that 45% agree that workers are taking fewer sick days since moving, 45% find it is the same as before, while 10% of those find more sick days. We need to do further work on this 10% to verify why they ran into more sick time but they were not in isolated buildings. Some of the tenants who reported more sick time were in the same buildings as tenants reporting less sick time. Of those who did find less

12
sick time than before, the mode was 2 days less sick time followed by 5 days less sick time as shown in Exhibit 10. While we should note that not all tenants found productivity increases and the literature suggests that behavioral influences such as management mean as much or more than environmental factors and we should also note that these buildings are for the most part Energy Star-labeled buildings and not necessarily LEED buildings. If we take only those tenants who claimed an increase in productivity we observe economic impacts based on salaries that approach the cost of rent using a very conservative square feet per worker assumption. Total revenue enhancement may be more or less. If we used 200 square feet per worker the results would be closer to or exceed typical rents from this one single impact. The LEED results were slightly better at 5.24% increased productivity but we use the entire sample here since the LEED sample is too small on its own. We expect that future data on LEED buildings, which score high on environmental dimensions, will see similar if not better results. Productivity Impact for Those Tenants Who Claimed Greater Productivity Average Productivity Increase 4.88% Average Salary (Note: There are other ways to measure this) $106,644 Average Impact Per Worker in Value Add $5,204 Net impact at 250 Sq Ft Per Worker Using Salary as Index (Note: Impact could be more on marginal revenues than this) $20.82
Repeating the same analysis using the average sick day declines and excluding the 10% that claimed an increase in sick days, we find potentially another nearly $5 PSF in economic impact. Again, it would be better to have real productivity impacts based on longer-term revenues, but these are nearly impossible to estimate. We also recognize that simply being an Energy Star building does not ensure less sick time. We do know that highly rated LEED buildings (Gold, Platinum) should exhibit fewer sick days with better light, ventilation, and less contaminated, cleaner air. Productivity Impact of Fewer Sick Days Using Average Survey Results Average Fewer Sick Days 2.88 Working Days Per Year 250 Average Salary $106,644 Average Impact Per Worker in Value Add $1,228.54 Net Impact at 250 Sq Ft Per Worker $4.91 In the extreme, tenants tend to look for two kinds of space: as cheap as possible or high-quality space. Those who fall in the middle are often in space they have either occupied a long time or they have placed greater weight on location and other features. Healthier space need not be new space. In fact, some new buildings are extremely unhealthy as chemicals leach out into the air from glues, carpets, concrete, and paint. There is no reason this must be the case. The cost to provide healthier environments is modest compared to the benefits.

13
Healthier buildings reduce sick time and increase productivity. The steps required to provide a healthier building are not that much of a design and engineering challenge. Generally natural light, good ventilation and the absence of organic compounds insures happier, healthier workers. Appropriate temperature ranges or localized controls is also a big plus to workers and past research does support the notion of greater productivity from any or all of these improvements. Sick building syndrome should be a thing of the past, but it is not. Energy Star-labeled buildings need not also be healthier although generally they appear to be and more recently we are finding a surge in LEED buildings which tend to require better and safer environments. We now have some evidence that there is an economic pay-off to tenants who pay attention to space quality. If you consider the benefits in terms of recruitment, retention of employees, less sick time and greater productivity, tenants should be willing to pay more rent for such space or require steep discounts for less healthy space. We have significant evidence of rent differentials, even if tenants do not admit to being willing to pay more, and now we see economic support for a differential which will likely persist until all buildings improve environmental workspace quality. What is increased productivity and reduced sick time worth in net present value terms? The early study by Greg Kats (2003) suggested NPV benefits in the range of $37 to $55 per square foot. For an owner-occupied building we can easily imagine NPVs equal to much more than these figures. For example, discounting $25 per year per square foot for 10 years at 10%, based on the sum of the two benefits shown above and rounded and assuming a 10-year differential for such benefits and a fairly conservative discount rate, we get a present value of $153 per square foot. It costs much less than this to building a better environment for workers, so the net present value certainly could reach $100 per square foot or more when an owner-occupant captures those benefits.22 But when the productivity and lower sick time benefits accrue to a tenant who does not receive the higher residual building value created by a better building within an informed market, the NPV to tenants is less clear. Tenants should be willing to pay more rent for better buildings and even though most tenants won’t admit to this (84% or more say “No”) we have found evidence in past studies that suggests they do pay premiums and based on the results here these premiums of only 5% to 10% are a bargain.
22 We will discuss leasing and the alignment of owner and tenant incentives later in this paper.
14
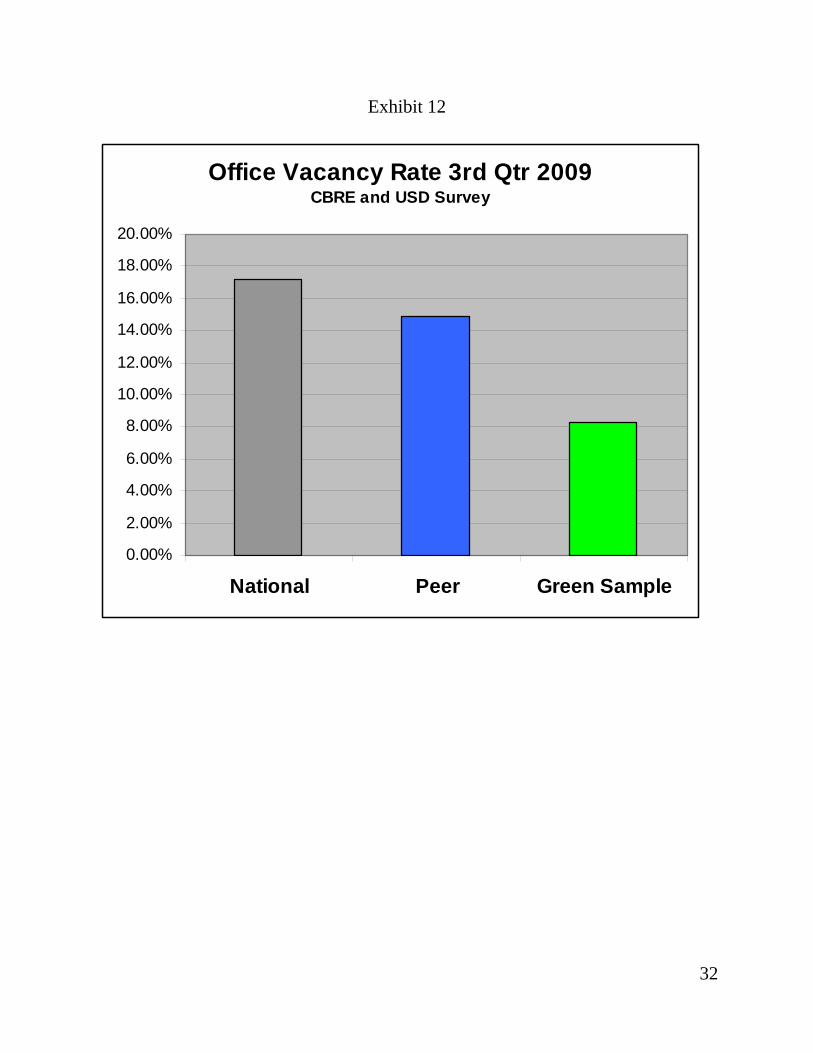
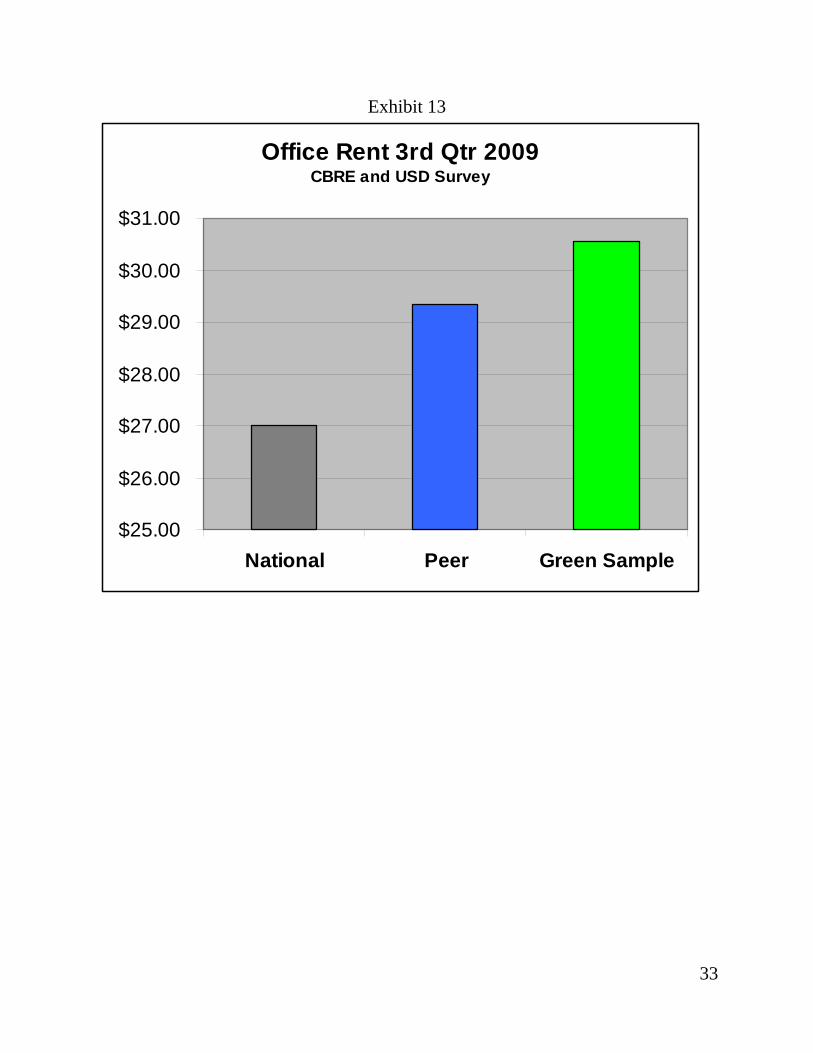
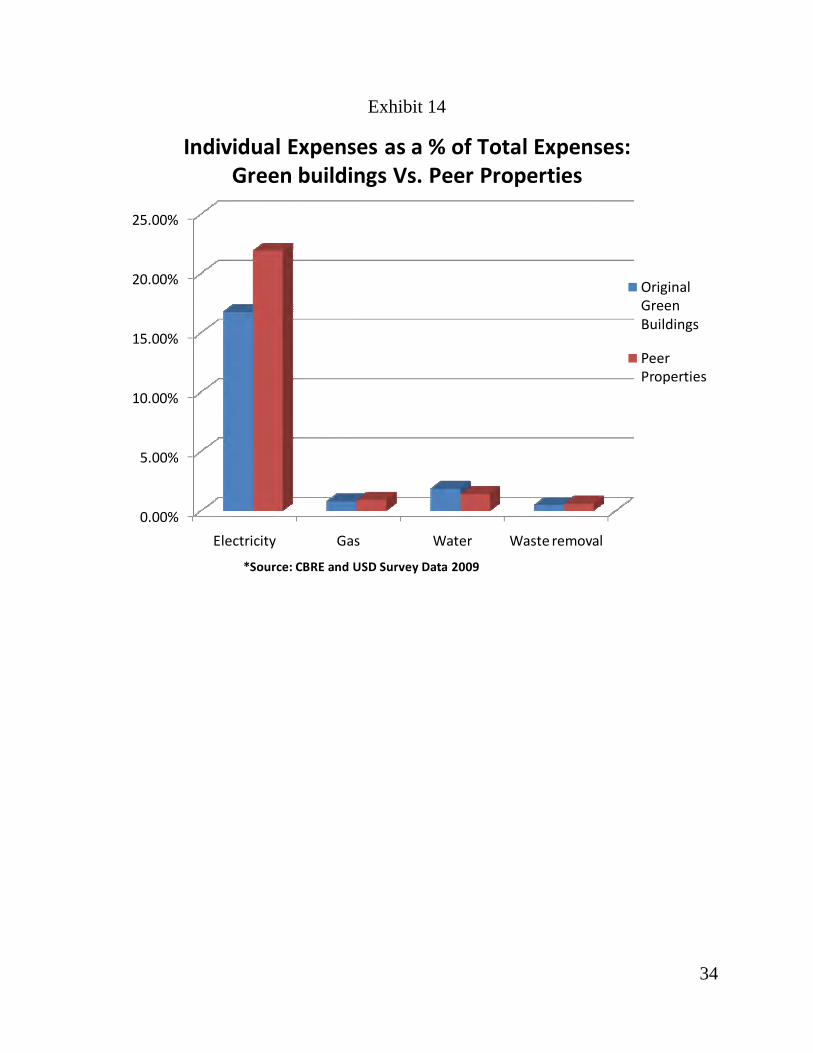
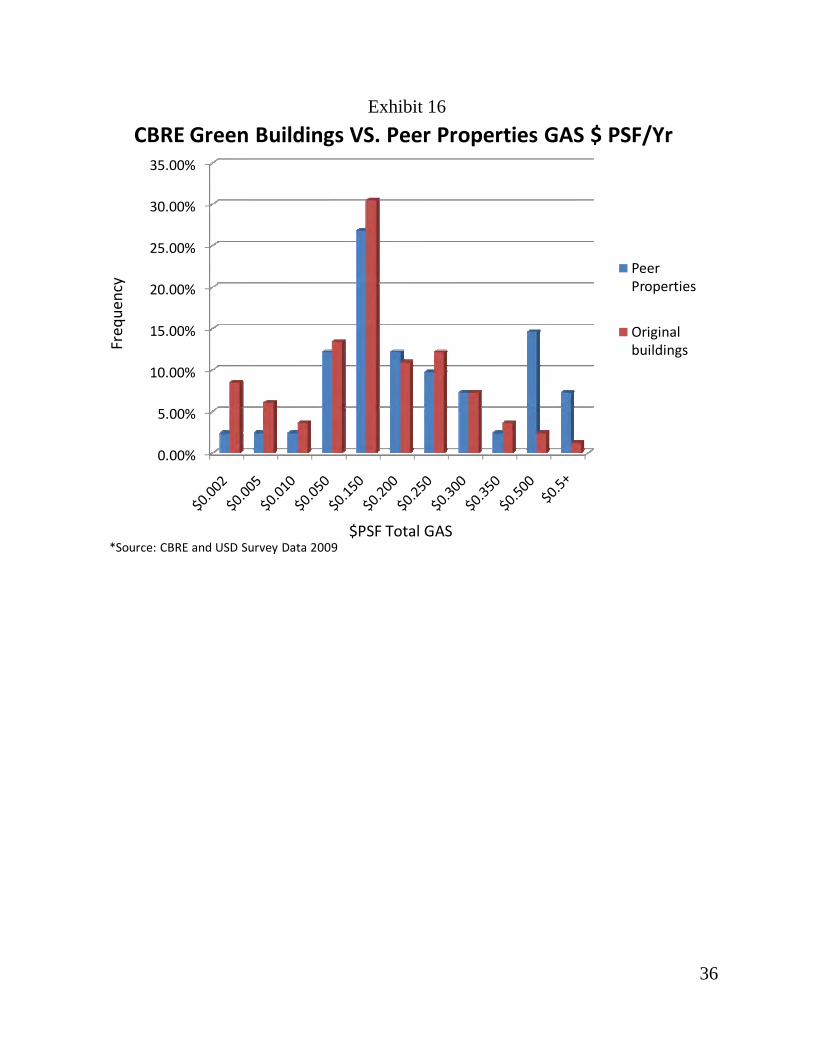
Part 2: Comparing Operations and Expenses Vacancy Rates: Prior to comparing operating expenses, we review the data on occupancy and rent differences which have been shown in prior studies (i.e. Miller, Spivey and Florance 2008) to suggest significant value premiums for green buildings even if operating expenses are the same. In Exhibit 12 we show the differences in occupancy rates for our sample of green properties compared to the peer group and the national group of similar office property. The results for the third quarter of 2009 were a vacancy rate of 17.2% nationally while the peer group ran 14.9% and the green sample (154 properties) were at 8.3% vacancy. In the last survey by Miller, Spivey and Florance the differential in occupancy rates for energy star buildings versus peer properties in early 2009 was 2.5% but the sample shown here some two quarters later suggests that during the recent economic downturn, vacancy rates have increased more for non-green peers. If for no other reason than maintaining occupancy rates it would be well worth investing in energy star improvements and or LEED certification. Rents: Recall that most tenants (82%) said “No” when asked if they would pay more rent for a green building, but empirical evidence counters this view. National office market gross rents were running $27.00 for the entire CBRE office portfolio during the third quarter of 2009. Our peer properties which averaged energy star ratings only several points below our green set, showed gross rents per square foot per year of $29.33 while our green sample ran $30.54 or $1.21 more than the peer set. This is shown in Exhibit 13. Again, such differentials alone would support property values that would run 3 to 5% more for green properties, but when combined with the higher vacancy rates justify values in excess of 10% more than non green properties. This finding is consistent with earlier studies in 2008 by Eicholtz, Kok, and Quigley, Fuerst and McAllister, and Wiley, Benefield and Johnson. Tenant Improvements: Not shown in the Exhibits here but asked was the related question “Would you pay more in up front tenant improvement costs for LEED CI (Commercial Interior) space?” 24% of the tenants said “Yes” however the amount they are willing to pay is generally modest with 13% of respondents saying only 2% more, 4% saying 3% more and about 4% saying 4% or more. Operating Expenses: We observe in Exhibit 14 the lower electric and gas expense in our green properties compared to peers. Yet in Exhibit 15 we see that the distributions of total operating expenses shown by ranges are essentially the same. That is, while our green properties were lower on electric and gas expenses, other operating expenses were higher so that essentially the overall operating expenses were similar. We cannot based on the results here state that it will be cheaper to operate Energy Star-labeled properties except on the basis of lower electric and gas bills. A sample of mostly LEED-certified properties may show different results and we hope to see such comparisons as the number of LEED buildings with some operating histories becomes available. In Exhibit 16 we see that non-green buildings have fatter tails for gas expenses. This means that some of the non-green buildings had extremely high gas expenses. We saw the same thing for electric costs and many other items. Electric Expenses, Separate Metering and Energy Star Scores: Only 31 of 154 buildings had separate metering versus master electric meters but on these buildings we found that electric

15
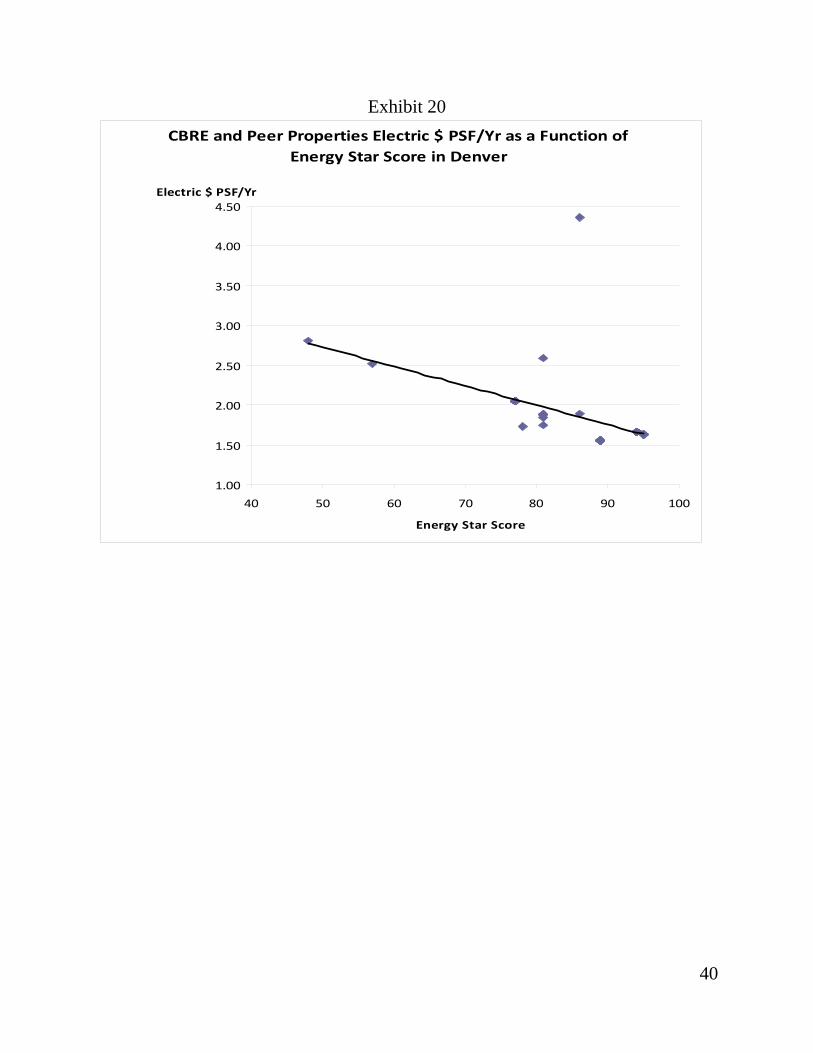
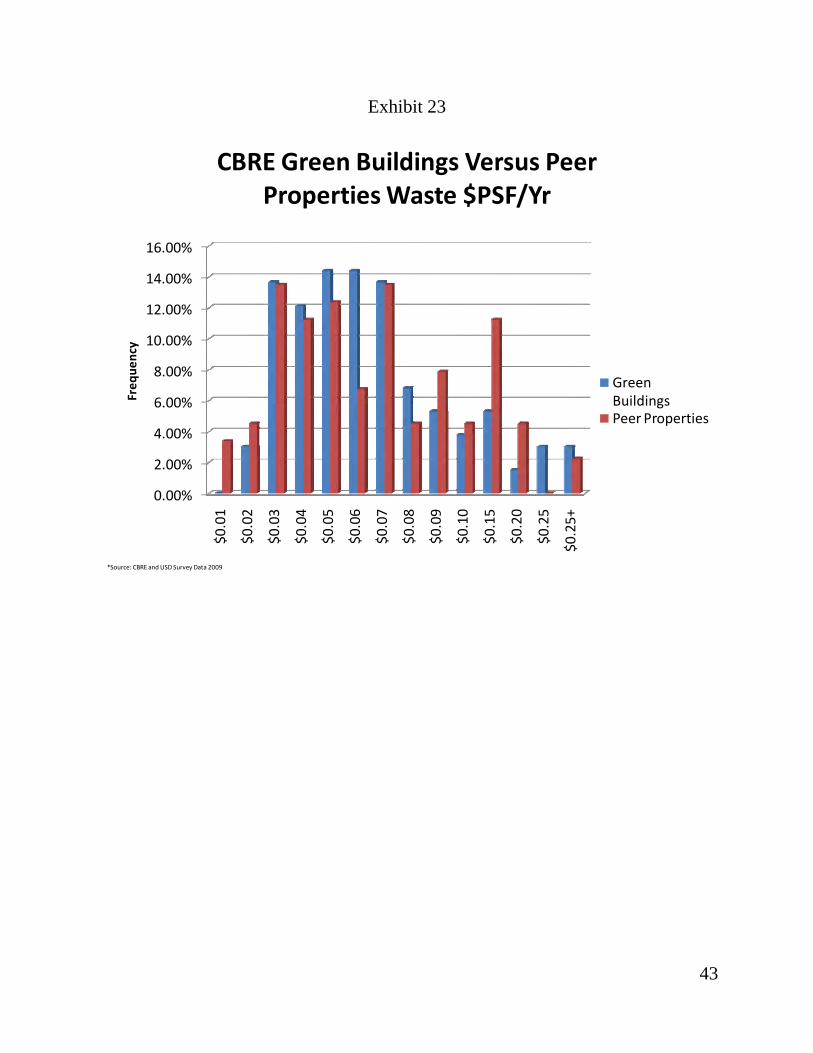
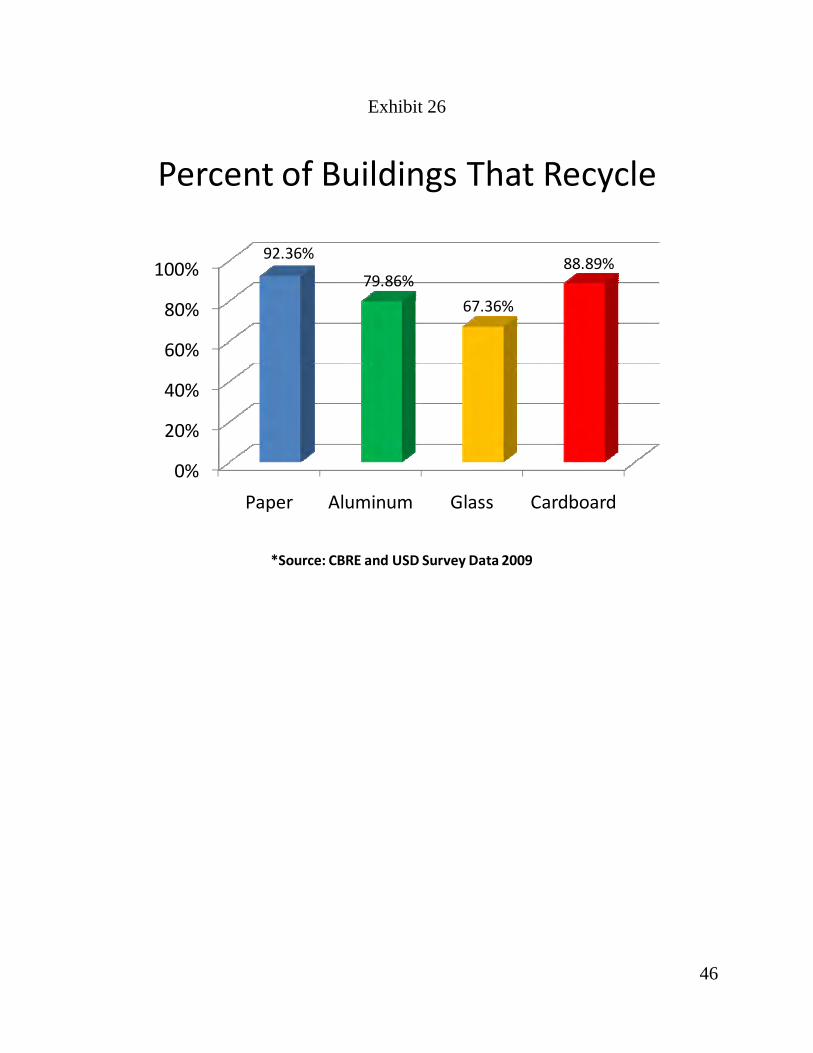
costs ran 21% less than comparable buildings. This is a significant sample and sufficient to draw some conclusions from data shown in Exhibits 17 and 18. That is, even when compared against our master metered properties, green or otherwise, separate metering provides a significant incentive to save power. It was not unusual to see electric costs run $1.00 PSF per year or less on separately metered buildings versus the more typical $1.50 to $2.50 PSF for many non-separately metered properties. So separate metering is as powerful as an increase in energy star scores by 30 points for saving energy. We ran energy star scores against the price per square foot per year for electrical costs using simple linear regression and found that each extra point of energy star score saved .83 of 1% in electrical costs. This is shown in Exhibit 19. We also realized that energy costs vary by city so that would add noise to our results. While we do not have enough data by city to draw strong generalizations, many of the city results looked like Exhibits 20 and 21. For many other cities the results were similar to the Denver and Atlanta results shown here. We did not control for the intensity of electrical use which may vary by the type of tenant and could also affect results. Still it is fairly clear that Energy Star ratings work well to predict a general decline in energy costs as the score increases. Water: Our green sample of properties used less water than their peer set by about 5 cents PSF per year, some 10% less on average. We note that some LEED-certified buildings do much better than this but our sample was too small to break out LEED buildings. Distributions for water consumption are shown in Exhibit 22. Waste: Exhibit 23 shows the distributions of waste cost PSF on these mostly Energy Star-labeled buildings, many of which have recycling programs. While our “green” set of buildings had slightly lower waste costs they also had very high recycling rates on paper, glass, aluminum, and cardboard as seen in Exhibit 26. This suggests that while total waste costs may be similar or go down, the recycling programs do add labor costs and until society has a greater appetite for recycled output which helps offset these costs, the net effect appears to be somewhat neutral on total costs.
16
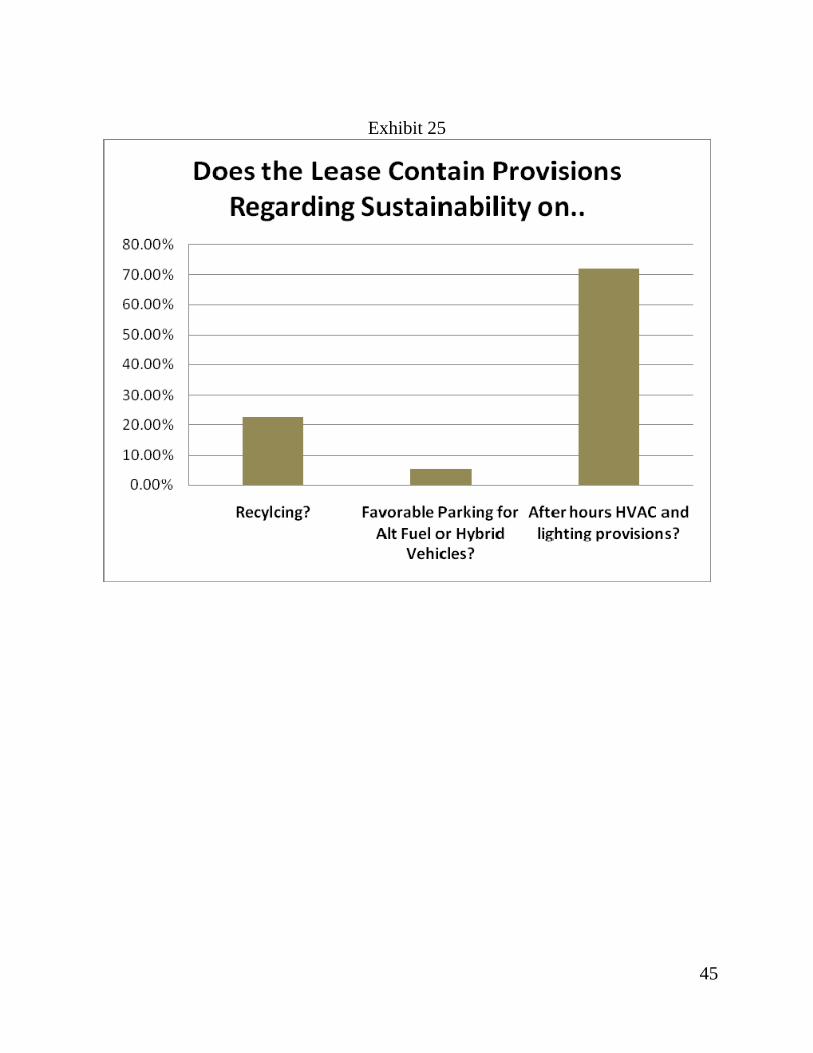
Part 3: Management CBRE as one of the largest manager of green buildings in the world is dedicated to sustainable business and improving property management practice. This entails improvements in practice affecting how buildings are cleaned, when they are cleaned, and what provisions are included in leases that require certain behaviors on the part of tenants or landlords. As the notion of green leases is rather new we have yet to see many cases in courts which will sort out good green lease provisions from those which are poorly written or unenforceable. Ronald W. Ruth, a lawyer with Sherin Lodgen, notes that until now the primary issues in green leases have been the interplay of investing in energy savings features and reaping the benefits from those investments via more rent for the landlord and or less operating expenses. A pure gross lease aligns the incentives better than a triple net lease where all expenses are passed through to the tenant. We have seen in recent years within the CoStar data a movement towards more gross “full service” leases by landlords who made significant investments in energy saving features which tenants did not believe would reduce expense to the extent claimed. A modified gross lease which requires the tenants to pay usage costs above a define base is best suited for green leases according to Freidenberg.23 Today the green lease is becoming more common. The GSA (Government Services Administration) requires prospective landlords to deliver a structure which satisfies LEED Silver Standards. Many states, such as California, or cities like San Francisco have similar, if not more stringent requirements. Green lease provisions may require a tenant to separate trash for recycling, maintain operational limits for thermostat temperature controls, use occupancy sensors for lighting, use window blinds, limit water or electrical consumption per square foot and require landlords to have cleaning staff use only green certified products, arrange for recycling of trash and maintain certain LEED standards with respect to building commissioning.24 Remedies for failure on the part of the tenant or the landlord to live up to these provisions are not always clear. Enforceability will be determined by the courts in cases yet to be heard. It is unlikely that failure on the part of a tenant or a slight breach by a cleaning crew turning on too many lights will result in the same severity of claims or actions as not paying rent. Awareness of the provisions and communication of green management requirements and or tenant obligations are an evolving process. We see in Exhibit 24 just how important sustainable business practices are in this green building sample. 54% of the tenants say sustainable management practices are important and 15% say they are very important while 29% suggest they are not important. Yet, while sustainable management practices are important we see that most of the green operating policies practiced by CBRE are not embedded in the leases as shown in Exhibit 25. Only 22% of the leases require recycling, only 5% mention parking for alternative fuel vehicles or hybrids, and yet 72% do discuss after hour use of HVAC and lighting. Again in Exhibit 26 we 23 See Peter Friedenberg, “Green Leases”, Green Development News, April, 2009. 24 From Ronald W. Ruth, Sherin Lodgen, Newsletter, November, 2009.

17
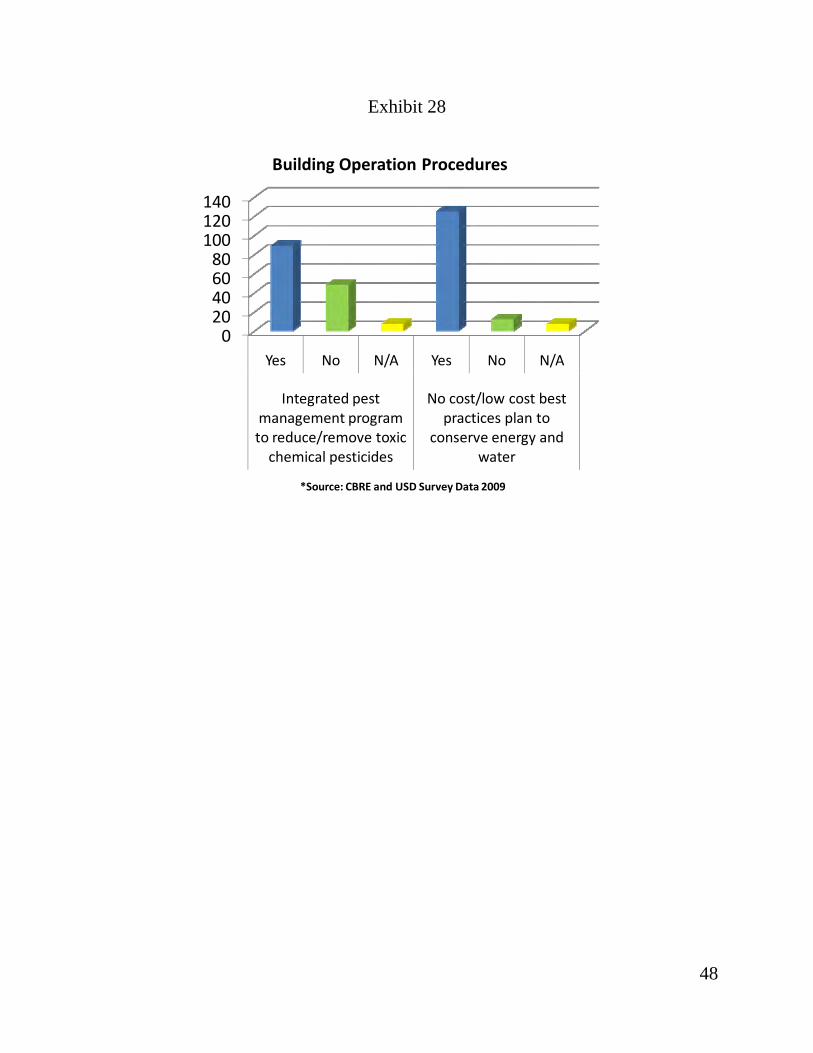
see that while the leases seldom require recycling it is a very common practice in the sample of green buildings surveyed here including paper, glass, aluminum and cardboard. In Exhibit 27 we show the common use of restrictive plumbing at over 80% of our green sample of 154 buildings and the use of motion sensors for lighting at 41%. Other building operating policies include 66% of the managers using integrated pest management programs to reduce or remove toxic chemicals as shown in Exhibit 28. 90% of the buildings included policies to reduce water and energy consumption. Cleaning products without VOCs were fairly extensive as shown in Exhibit 29. In Exhibit 30 we provide the following summary of tenant policies: 20% of the tenants had employees that were members of sustainable business groups such as the USGBC, 32% had dedicated staff focused on sustainable business practices, 34% have shared sustainable goals with employees and 23% have shared these same goals with clients. Not shown
18
Conclusions Not all tenants want green space. Some merely want the cheapest space possible, but as profitability increases and firms start to consider triple bottom line concerns, they are very much interested in improved working environments. In this study we observe that many tenants are quite concerned about sustainable operations and policies. We also note some claims of higher productivity and less sick time. In fact, the average wages of employees in firms occupying green space appear to be far above average, which begs the question, do more-productive workers demand green space or do green buildings increase productivity? It is probably the former as much as the latter, but future studies will help sort this out. There are also scientific reasons why healthier buildings with better air quality would result in less sick time. More natural light is also correlated with positive feelings about work and productivity. Our evidence suggests green buildings are more intensively managed and, while they show savings on energy and water, the overall operating expenses are not that different from similar quality conventional buildings. Energy Star scores matter, and there is a direct correlation with Energy Star scores and total energy costs. Just as important are an alignment of incentives through green leases, modified lease provisions and, ideally, separate metering, which is shown here to save 21% on average per year for energy costs even with similar Energy Star scores. When tenants pay for what they consume, they use less power. Our results continue to support the notion of green paying off. We observe higher occupancy rates and higher rents, even though tenants will not admit to being willing to pay more. This more than offsets, on a present value basis, any reasonable cost premiums expected for either developing greener buildings or converting existing buildings and spaces into better workplaces. At the same time, we recognize the steep learning curve for many developers and investors who do not yet know much about a rapidly changing industry. Lighting systems, toilets, window glazes, roofing systems, motion sensors, xeriscaping and so many other factors must be understood by facilities and property managers—not to mention the landlords and investors—to produce an energy-efficient and healthy building. There are myriad choices, as evidenced by the several acres of exhibitors at USGBC’s GreenBuild conference, who all claim to have the latest and greatest widget to save energy or water or produce a better environment for workers. Property managers must not only consider the benefits of new products and services but also ask if these vendors and products will be in business in two or three years. In addition, they must also consider if the technology of 2009 will be eclipsed in 2010 or 2011, making what they are investing in now obsolete. Aside from the physical features of a building, we do now understand that tenants very much want to conserve resources and breathe clean air and that green management matters. Green leases and the obligations of tenants and landlords are now evolving, and we expect to learn a lot about best practices in the coming years. We also expect to see several studies like the one here repeated as it is still early-going in a rapidly upgrading industry.
19
References Aardex Corporation User Effective BuildingsTM 207-page soft cover book, 2004 Apte, M. G., Fisk, W., J., and Daisey, J. M. (2000). “Associations Between Indoor CO2 Concentration and Sick Building Syndrome Symptoms in US Office Buildings: An Analysis of the 1994-1996 BASE Study Data”. Indoor Air, 10: 256-227. Bansal, P. and Roth, K. 2000. Why Companies Go Green: A Model of Ecological Responsiveness. Academy of Management Journal, 43(4): 717-737. Big and Green: Toward Sustainable Architecture in the 21st Century, Edited by David Gissen, Princeton Architectural Press, New York, N.Y. 2002. Clemets-Croome, D. (2000). Creating the Productive Workplace. Oxford, UK: Taylor & Francis Group Ltd. Devinney, T. 2009. Is the Socially Responsible Corporation a Myth? The Good, Bad and Ugly of Corporate Social Responsibility. Academy of Management Perspectives, 23(2): 44-56. Drucker, P.F. (1999). Knowledge-Worker Productivity: The Biggest Challenge. California Management Review Vol. 41, No. 2, Winter, 79-94. Eicholtz, Piet, Nils Kok, John Quigley “Doing Well By Doing Good? Green Office Buildings” Working Paper, Fisher Center for Real Estate and Urban Economics, UC Berkeley, April, 2008 forthcoming in the American Economic Review. Eicholtz, Piet, Nils Kok, John Quigley “Why Do Companies Rent Green? Real Property and Corporate Social Responsibility” Working Paper, Fisher Center for Real Estate and Urban Economics, UC Berkeley, July 2009 Ellison, L., Sayce, S. and Smith, J. “Socially Responsible Property Investment: Quantifying the Relationship between Sustainability and Investment Property Worth,” Journal of Property Research, 2007, 24, 3, 191-219. Fisk, W., J. and Rosenfeld, A. H. (1997). Estimates of Improved Productivity and Health from Better Indoor Environments. Indoor Air, 7: 158-172. Fuerst, Franz and Patrick McAllister, “Pricing Sustainability: An Empirical Investigation of the Value Impacts of Green Building Certification” working paper presented at ARES, April, 2008. E-mail author at [email protected] “Green Review” by Building Design and Construction, November 2006 white paper.
20
Haynes, B.P. (2007). An Evaluation of Office Productivity Measurement. Journal of Corporate Real Estate. 9, 144-155. Haynes, B.P. (2007). Office Productivity: A Theoretical Framework. Journal of Corporate Real Estate. 9, 97-109. Heerwagen, J. (2000). Green Buildings, Organizational Success and Occupant Productivity. Building Research & Information. 28, 353-367. Hoffman, Georg (2008). Effects of Variable Lighting Intensities and Colour Temperatures on sulphatoxymelatonin and subjective mood in an experiment. Applied Ergonomics, 39 (6), 719-728. Jackson, Jerry, “Increasing Commercial Real Estate Returns With Energy Risk Management” working paper presented at ARES, April, 2008. E-mail author at [email protected] Johnson, K.H., S. Salter, L. Zumpano and R. Anderson (2006) “Exterior Insulation and Finish Systems: The Effect on Residential Housing Prices and Marketing Time”, Journal of Real Estate Finance and Economics, Vol. 33, No. 3. Kats, Greg, “The Costs and Benefits of Green” A Report to California’s Sustainable Building Task Force, Capital E Analytics, October 2003 and then in ppt form 2007. Kats, Greg, Greening Our Built World: Costs, Benefits, and Strategies, Island Press, 280 pages, 2009. Kaczmarczyk, S., and J. Murtough, (2002). Measuring the Performance of Innovative Workplaces. Journal of Facilities Management. 1, 163-176. Kemppilä, S. & Lönnqvist, (2003) A.: Subjective Productivity Measurement. Journal of American Academy of Business 2(2), 531-537. Kohlhepp, Dan, “The Greening of One Potomac Yard” 2006, ppt file. Crescent Resources LLC. Crescent Resources is the Master Developer of Potomac Yard, a-300 acre redevelopment of the former Richmond Fredericksburg and Potomac rail yard in Arlington and Alexandria, Va. This project includes 4.5 million square feet of office space, 3,000 residential units and 200,000 square feet of retail space, 1,250 hotel rooms and 92.4 acres of open or park space. Kwallek, Nancy (2007, April). Work Week Productivity, Visual Complexity, and Individual Environmental Sensitivity in Three Offices of Different Color Interiors. Color Research and Application, 32(2), 130-143 . Longdon, David “Costs of Green Revisited” July 2007 monograph. See http://www.davislangdon.com/USA/ Metropolis Magazine “The Green Leap Forward” October, 2007.

21
Miles, M. P. and Covin, J. G. 2000. Environmental Marketing: A Source of Reputational, Competitive, and Financial Advantage. Journal of Business Ethics, 23(3): 299-311. Miller, Norm, Jay Spivey and Andy Florance (2008) “Does Green Pay Off?” Journal of Real Estate Portfolio Management, Vol. 14, 4, Oct-Dec. pp 385-401. Miller, Norm and Dave Pogue, “Green Buildings and Productivity” Journal of Sustainable Real Estate, Vol. 1, No. 1. 2009. Muldavin, Scott, “A Strategic Response to Sustainable Property Investing” PREA Quarterly, Summer, 2007, pp. 33-37. Scott Muldavin is the founder of the Green Building Finance Consortium, See www.muldavin.com PEP Productivity Solutions, Inc., (May 1, 2008). Office Workers Make Gains In Productivity. Retrieved June 22, 2009, from PEP Productivity Solutions, Inc. Web site: http://www.pepproductivitysolutions.com/index.cfm/PageID/7/ViewPage/News/fullarticle/10 Porter, M. E. and Van der Linde, C. 1995. Green and Competitive: Ending the Stalemate. Harvard Business Review, 73(5): 120-134. Quigley, John (1984) “The Production of Housing Services and the Derived Demand for Residential Energy” The Rand Journal of Economics, Vol. 15, No. 4, 555-567. Ramus, C. A. and Montiel, I. 2005. When Are Corporate Environmental Policies a Form of Greenwashing? Business and Society, 44(4): 377-414. RICS “Green Value; Growing Assets” London, UK. (2005) Scheer, Roddy and Randy Woods, “Is There Green in Going Green?” SBM, April 2007. “Surveying Sustainability: A Short Guide for the Property Professional” by RICS, GLEEDS, and the Forum for the Future printed by Newnorth Printers, June, 2007. Taggart, Nina (2009, June).A New Competitive Advantage: Connecting the Dots between Employee Health and Productivity. Benefits & Compensation Digest, 522291 541612 923130, 20-23. The Costs and Benefits of High Performance Buildings: Lessons Learned, Produced by Earth Day, New York, 2007. Vischer, J.C. (2005). Measuring the Impact of Moving on Building Users. EcoLibrium. September, 22-27.
22
Wang, X. & Gianakis, G. A. (1999). Public Officials’ Attitudes Toward Subjective Performance Measures. Public Productivity & Management Review. Vol. 22, No. 4, 537-553. Woods, J., Drewry, G. and Morey, P. (1987). Office Worker Perceptions of Indoor Air Quality Effects on discomfort and performance. Proceedings of Indoor Air. Vol. 2, 464 - 468. Wiley, Jonathan A., Justin D. Benefield and Ken H. Johnson, “Green Design and the Market for Commercial Office Space” (2010 or 2011) Journal of Real Estate Finance and Economics, forthcoming. Wyon, D., Tham, K., Croxford, B. and Oreszczyn, T. (2000). The Effects on Health and Self-Estimated Productivity of Two Experimental Interventions which Reduced Airborne Dust Levels in Office Premises. Proceedings of Healthy Buildings. Vol. 1, 641-646. Wyon, D.P. (2004). The Effects of Indoor Air Quality on Performance and Productivity. Indoor Air. 14, 92-101. Yudelson, Jerry The Green Building Revolution, U.S. Green Building Council, 2008. Yudelson, Jerry “Green Building Incentives That Work: A Closer Look at How Local Governments Are Incentivizing Green Development,” for NAIOP Research Foundation, Nov. 2007.

23
Exhibit 1: Location of Buildings Surveyed Building Locations in the CBRE‐USD Survey
24
Exhibit 2: Tenant Types by Ownership Status
25
Exhibit 3: Industry Profile
Exhibit 4
26
Exhibit 5
Exhibit 6
*Source: CBRE and USD Survey Data 2009; U.S. Bureau of Labor and Statistics 2008 Occupational Employment Statistics, 2009.
27
Exhibit 7
*Source: CBRE and USD Survey Data 2009
28
Exhibit 8

29
Exhibit 9

30
Exhibit 10
31
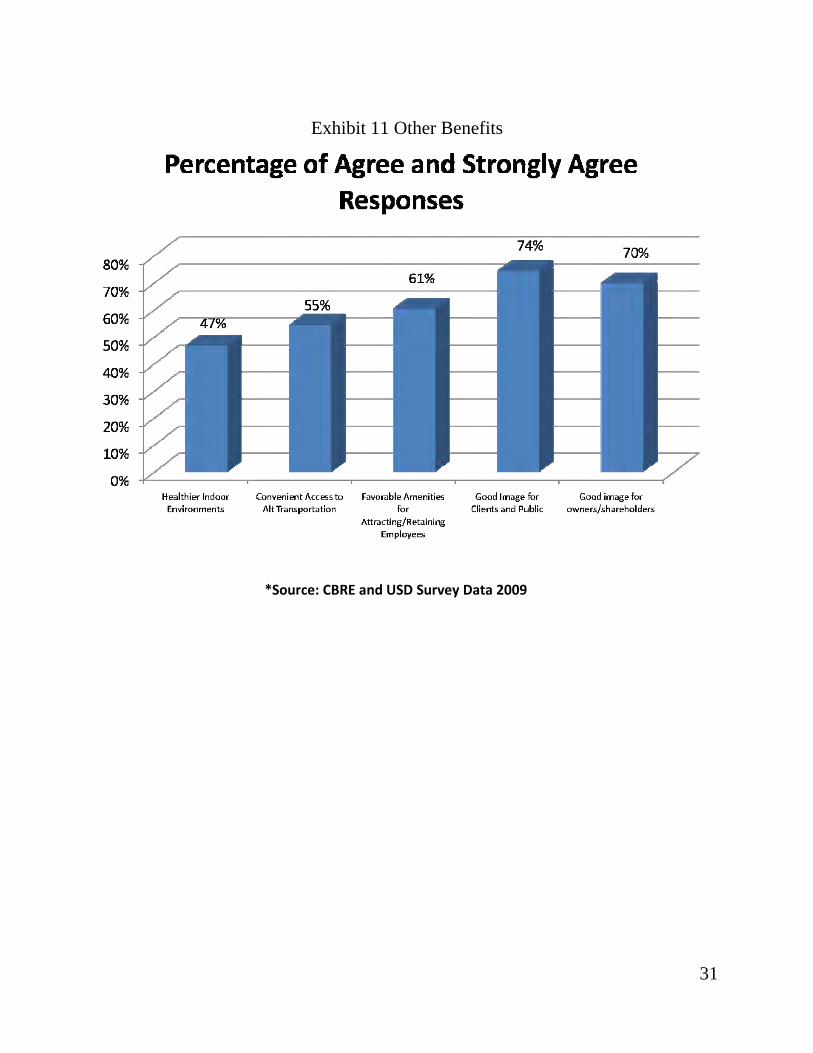
Exhibit 11 Other Benefits
*Source: CBRE and USD Survey Data 2009
32
Exhibit 12
Office Vacancy Rate 3rd Qtr 2009 CBRE and USD Survey
0.00%
2.00%
4.00%
6.00%
8.00%
10.00%
12.00%
14.00%
16.00%
18.00%
20.00%
National Peer Green Sample
33
Exhibit 13
Office Rent 3rd Qtr 2009 CBRE and USD Survey
$25.00
$26.00
$27.00
$28.00
$29.00
$30.00
$31.00
National Peer Green Sample
34
Exhibit 14
0.00%
5.00%
10.00%
15.00%
20.00%
25.00%
Electricity Gas Water Waste removal
Original Green Buildings
Peer Properties
*Source: CBRE and USD Survey Data 2009
Individual Expenses as a % of Total Expenses: Green buildings Vs. Peer Properties

35
Exhibit 15
0
5
10
15
20
25
30
35
40
$2 $4 $6 $8 $10 $12 $14 $16 $18 $20 $20+
Peer buildings
Original Green Buildings
CBRE Green Buildings VS. Peer Properties OPX $ PSF/Yr
$PSF Total OPX
Frequency
*Source: CBRE and USD Survey Data 2009
36
Exhibit 16
0.00%
5.00%
10.00%
15.00%
20.00%
25.00%
30.00%
35.00%
Peer Properties
Original buildings
*Source: CBRE and USD Survey Data 2009$PSF Total GAS
Freq
uency
CBRE Green Buildings VS. Peer Properties GAS $ PSF/Yr
37
Exhibit 17
0.00%
5.00%
10.00%
15.00%
20.00%
25.00%
30.00%
35.00%
40.00%
45.00%
Yes No Don't know
20.88%
43.96%
35.16%
Separate meter for electricity
*Source: CBRE and USD Survey Data 2009The tenants often did not know – but the property managers did.

38
Exhibit 18
0%
5%
10%
15%
20%
25%
30%
35%
40%
45%
0.5 1 1.5 2 2.5 3 3.5 4+
CBRE Individual Meter Vs. Master Meter Electricity $ PSF/Yr
Individual Meter
Master Meter

39
Exhibit 19
CBRE and Peer Property Electric $ PSF/Yr as a Function of Energy Star Scores
0.00
1.00
2.00
3.00
4.00
5.00
6.00
0 20 40 60 80 100 120
Energy Star Score
Electric $ PSF/Yr
Elec $PSF = 4.31 - .02879(ES) Adj R Sq = .171 and the t-stat on the Energy Score is -10.9 (highly significant)
CBRE and Peer Property Electric $ PSF/Yr as a Function of Energy Star Scores
0.00
1.00
2.00
3.00
4.00
5.00
6.00
0 20 40 60 80 100 120
Energy Star Score
Electric $ PSF/Yr
CBRE and Peer Property Electric $ PSF/Yr as a Function of Energy Star Scores
0.00
1.00
2.00
3.00
4.00
5.00
6.00
0 20 40 60 80 100 120
Energy Star Score
Electric $ PSF/Yr
40
Exhibit 20
CBRE and Peer Properties Electric $ PSF/Yr as a Function of Energy Star Score in Atlanta
1.00
1.20
1.40
1.60
1.80
2.00
2.20
2.40
2.60
60 70 80 90 100
Energy Star Score
Electric $ PSF/Yr
CBRE and Peer Properties Electric $ PSF/Yr as a Function of Energy Star Score in Denver
1.00
1.50
2.00
2.50
3.00
3.50
4.00
4.50
40 50 60 70 80 90 100
Energy Star Score
Electric $ PSF/Yr

41
Exhibit 21
CBRE and Peer Properties Electric $ PSF/Yr as a Function of Energy Star Score in Houston
1.00
1.50
2.00
2.50
3.00
3.50
60 65 70 75 80 85 90 95
Energy Star Score
Electric $ PSF/Yr
CBRE and Peer Properties Electric $ PSF/Yr as a Function of Energy Star Score in Atlanta
1.00
1.20
1.40
1.60
1.80
2.00
2.20
2.40
2.60
60 70 80 90 100
Energy Star Score
Electric $ PSF/Yr

42
Exhibit 22
0.00%
5.00%
10.00%
15.00%
20.00%
25.00%
30.00%
35.00%
$0.01
$0.02
$0.03
$0.04
$0.05
$0.06
$0.07
$0.08
$0.09
$0.10
$0.15
$0.20
$0.25
$0.30
$0.40
$0.40+
CBRE Green Buildings Versus Peer Properties Water $PSF/Yr
Green Buildings
Peer Properties
*Source: CBRE and USD Survey Data 2009
43
Exhibit 23
0.00%
2.00%
4.00%
6.00%
8.00%
10.00%
12.00%
14.00%
16.00%
$0.01
$0.02
$0.03
$0.04
$0.05
$0.06
$0.07
$0.08
$0.09
$0.10
$0.15
$0.20
$0.25
$0.25+
Freq
uency
CBRE Green Buildings Versus Peer Properties Waste $PSF/Yr
Green BuildingsPeer Properties
*Source: CBRE and USD Survey Data 2009

44
Exhibit 24
55.96%29.21%
14.83%
Importance of Sustainable Building Management Practices in Lease
Renewals In Percentage
Important
Not Important
Very Important
*Source: CBRE and USD Survey Data 2009
45
Exhibit 25
46
Exhibit 26
Percent of Buildings That Recycle
0%
20%
40%
60%
80%
100%
Paper Aluminum Glass Cardboard
92.36%
79.86%
67.36%
88.89%
*Source: CBRE and USD Survey Data 2009

47
Exhibit 27
020406080100120
Yes No N/A Yes No N/A
Restrictive plumbing devices (aerators) installed in common area restrooms?
Motion controlled lighting devices installed in ALL tenant spaces?
Use of Energy Saving Devices
*Source: CBRE and USD Survey Data 2009
48
Exhibit 28
020406080100120140
Yes No N/A Yes No N/A
Integrated pest management program to reduce/remove toxic chemical pesticides
No cost/low cost best practices plan to
conserve energy and water
Building Operation Procedures
*Source: CBRE and USD Survey Data 2009

49
Exhibit 29
0
20
40
60
80
100
120
140
Yes No Yes No Yes No Yes No
Green Cleaning Practices
Greenseal Certified Chemicals
MicroFiber Wipes
Green Label Certifited Floor Equipment
Cleaning Staff Use of Green Products
*Source: CBRE and USD Survey Data 2009

50
Exhibit 30 Policies Towards Sustainability Percentage
Answering “Yes”
Members of the firm belong to group(s) focused on sustainable practices
20.0%
Firm employs staff dedicated to sustainable business practices 32.3% Firm has written policies on sustainable goals that are shared with employees
34.4%
Firm has written policies on sustainable goals shared with clients 22.7%

51
Appendix
Exhibit A-1 Distribution of Green Office Buildings by State
CoStar Data, 2008 from Eicholtz, Kok, Quigley, 2009.
52
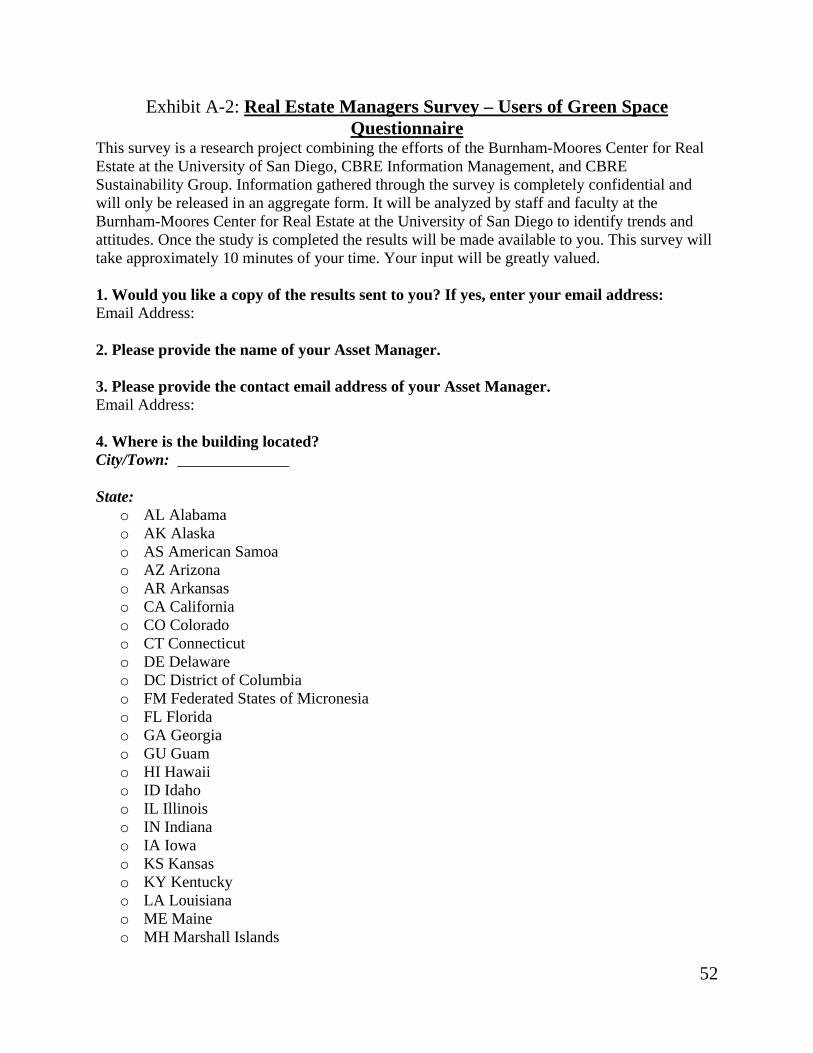
Exhibit A-2: Real Estate Managers Survey – Users of Green Space Questionnaire
This survey is a research project combining the efforts of the Burnham-Moores Center for Real Estate at the University of San Diego, CBRE Information Management, and CBRE Sustainability Group. Information gathered through the survey is completely confidential and will only be released in an aggregate form. It will be analyzed by staff and faculty at the Burnham-Moores Center for Real Estate at the University of San Diego to identify trends and attitudes. Once the study is completed the results will be made available to you. This survey will take approximately 10 minutes of your time. Your input will be greatly valued. 1. Would you like a copy of the results sent to you? If yes, enter your email address: Email Address: 2. Please provide the name of your Asset Manager. 3. Please provide the contact email address of your Asset Manager. Email Address: 4. Where is the building located? City/Town: ______________ State:
o AL Alabama o AK Alaska o AS American Samoa o AZ Arizona o AR Arkansas o CA California o CO Colorado o CT Connecticut o DE Delaware o DC District of Columbia o FM Federated States of Micronesia o FL Florida o GA Georgia o GU Guam o HI Hawaii o ID Idaho o IL Illinois o IN Indiana o IA Iowa o KS Kansas o KY Kentucky o LA Louisiana o ME Maine o MH Marshall Islands

53
o MD Maryland o MA Massachusetts o MI Michigan o MN Minnesota o MS Mississippi o MO Missouri o MT Montana o NE Nebraska o NV Nevada o NH New Hampshire o NJ New Jersey o NM New Mexico o NY New York o NC North Carolina o ND North Dakota o MP Northern Mariana Islands o OH Ohio o OK Oklahoma o OR Oregon o PW Palau o PA Pennsylvania o PR Puerto Rico o RI Rhode Island o SC South Carolina o SD South Dakota o TN Tennessee o TX Texas o UT Utah o VT Vermont o VI Virgin Islands o VA Virginia o WA Washington o WV West Virginia o WI Wisconsin o WY Wyoming
ZIP: ____________ 5. Building Information Client Name ____________________ i-Track ID Number _________________ 6. Building Footage Building size (rentable square feet) ________________

54
7. Geographic market of your space o Central Business District o Suburb
8. Quality Class of Building
o A o A- o B o C
9. Building Type
o Single Tenant o Multi-Tenant
10. Current Occupancy Rate (%) __________________ 11. Please identify the scheduled lease expirations by number of leases and total square foot in 2009. Number of leases ____________________ Total square footage __________________ 12. 2008 Operating Expenses ($) Overall Total Expense __________________ Electricity ____________________________ Gas _________________________________ Water _______________________________ Waste Removal _______________________ 13. ENERGY STAR Current ENERGY STAR Score ____________ Original ENERGY STAR Score ___________ What was the baseline period? ____________ 14. Please indicate, has: A preliminary study been completed?
o YES o NO
A gap analysis been completed? o YES o NO
The building registered with USGBC? o YES o NO

55
15. If gap analysis has been completed, check which level is anticipated o Certified o Silver o Gold o Platinum
16. Has the building already achieved LEED Certification?
o YES o NO
17. Please indicate the level achieved: LEED Existing Building O&M
Certified Silver Gold Platinum
LEED Core & Shell
Certified Silver Gold Platinum
LEED New Construction
Certified Silver Gold Platinum
18. Has a building policy been established requiring Tenant Improvements be constructed to LEED CI standards?
o YES o NO
19. Have any tenant build-outs been certified under LEED CI?
o YES o NO
20. If yes, how much square feet in total is certified under LEED CI? ______________ 21. Please indicate, are: Green cleaning practices utilized by the janitorial staff?
o YES o NO
56
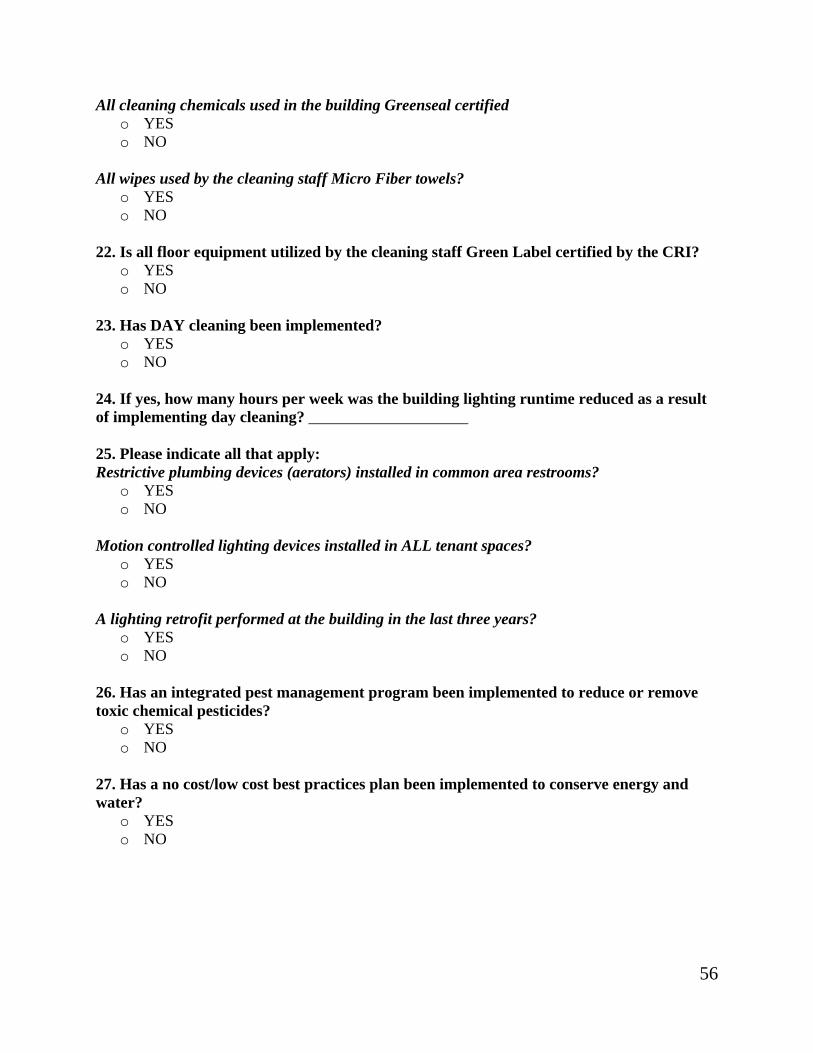
All cleaning chemicals used in the building Greenseal certified o YES o NO
All wipes used by the cleaning staff Micro Fiber towels?
o YES o NO
22. Is all floor equipment utilized by the cleaning staff Green Label certified by the CRI?
o YES o NO
23. Has DAY cleaning been implemented?
o YES o NO
24. If yes, how many hours per week was the building lighting runtime reduced as a result of implementing day cleaning? ____________________ 25. Please indicate all that apply: Restrictive plumbing devices (aerators) installed in common area restrooms?
o YES o NO
Motion controlled lighting devices installed in ALL tenant spaces?
o YES o NO
A lighting retrofit performed at the building in the last three years?
o YES o NO
26. Has an integrated pest management program been implemented to reduce or remove toxic chemical pesticides?
o YES o NO
27. Has a no cost/low cost best practices plan been implemented to conserve energy and water?
o YES o NO
57
28. Please check all that apply: The building has a recycling program in place for: Please check all that apply:
o Paper o Aluminum o Glass o Cardboard o Other (please specify)
29. Has a waste audit been conducted and a written plan put in place?
o YES o NO
30. Do paper products used in the common area restrooms meet the standards of the EPA Comprehensive Procurement Guidelines?
o YES o NO
- End of Survey - THANK YOU FOR YOUR PARTICIPATION!
The ENERGY STAR name and the ENERGY STAR symbol are registered trademarks of the United States Environmental Protection Agency. The LEED® (Leadership in Energy and Environmental Design) Green Building Rating System is the nationally accepted benchmark for the design, construction, and operation of high performance green buildings. LEED is a registered trademark of the U.S. Green Building Council.

58
Exhibit A-3: Tenant Survey - Users of Green Space Questionnaire This survey is a research project combining the efforts of the Burnham-Moores Center for Real Estate at the University of San Diego, CBRE Information Management, and CBRE Sustainability Group. Information gathered through the survey is completely confidential and will only be released in an aggregate form. It will be analyzed by staff and faculty at the Burnham-Moores Center for Real Estate at the University of San Diego to identify trends and attitudes. This survey will take approximately 5 minutes of your time. Your input will be greatly valued. 1. Please provide your name: 2. Please provide your job title: 3. Total square footage of your occupied suites in this building. 4. Type of Business
o Bio-Tech o Construction o Consulting o Design o Education o Engineering o Financial Services o Insurance o Investment o Government o Legal o Non-profit o Government organization o Real Estate o Other Technology o Other (please specify)
5. Type of Legal Entity
o Non-profit organization o Privately held firm o Publicly traded firm
6. Years in Business
o Less than 3 years o 3-5 years o 5-10 years o 10 to 20 years o More than 20 years
59
7. How many years have you occupied space in this building? o Less than 3 years o 3-5 years o 5-10 years o 10 to 20 years o More than 20 years
8. What is the total number of full-time employees in your occupied suites? 9. Does your firm employ staff dedicated to environmental or sustainable issues?
o YES o NO
10. Does your firm have a formal written policy on sustainable goals that is shared with your employees?
o YES o NO
11. Is it shared with your clients?
o YES o NO
12. Is your firm a member of any groups focused on sustainability?
o YES o NO
13. If yes, please list all group associations: ___________________________ 14. Does your firm assess environmental policies of suppliers and vendors?
o YES o NO
15. If yes, do you audit for compliance?
o YES o NO
16. How important will sustainable building management practices be in your lease renewal considerations?
o Very Important o Important o Not Important
17. What type of lease agreement do you have?
o Gross o Net o I Don’t Know
60
Corporate Sustainable Practices 18. Is your suite(s) separately metered for electricity?
o YES o NO o I Don’t Know Sustainable
19. Does your lease include requirements to participate in a recycling program?
o YES o NO
20. Does your lease include favorable parking considerations for alternative fuel or hybrid vehicles?
o YES o NO
21. Do you have after hour HVAC and lighting provisions?
o YES o NO
22. Would you say that your new space provides… (Rate questions on the scale provided based on your motivations for securing the kind of space you now occupy.) Healthier indoor environments
Strongly Agree Agree Neutral Disagree Strongly Disagree
Convenient access to alternative transportation Strongly Agree Agree Neutral Disagree Strongly Disagree
Favorable amenities for attracting/retaining employees Strongly Agree Agree Neutral Disagree Strongly Disagree
Good image for clients and public Strongly Agree Agree Neutral Disagree Strongly Disagree

61
Good image for owners/shareholders Strongly Agree Agree Neutral Disagree Strongly Disagree
23. Would you be willing to pay higher rent to be in a building that could demonstrate a higher level of sustainable practices?
o YES o NO
Green Motivations 24. If yes, how much more are you willing to pay?
o 2% o 3% o 4% o 5% o If more, please enter how much more…
25. Would you be willing to pay more to construct your interior improvements to achieve LEED CI certification?
o YES o NO
26. If yes, how much more are you willing to pay?
o 2% o 3% o 4% o 5% o If more, please enter how much more…
27. Please rate employee satisfaction... Compared to your other experiences, your employees and staff are more productive.
Strongly Agree Agree Neutral Disagree Strongly Disagree
28. Compared to your other experiences, your employees and staff take more or fewer sick days per year…
o More sick days per year o Fewer sick days per year o If fewer sick days, please enter (between 0 to 10) _____
62
29. The average annual gross pay for a typical employee defined as salary and typical bonus combined is: 30. Compared to your other experiences, your employees overall productivity decreased or increased by…
o Less productive than before o Same productivity level o Increased productivity by 1% o Increased productivity by 2% o Increased productivity by 3% o Increased productivity by 4% o Increased productivity by 5% o Increased productivity by 6% o Increased productivity by 7% o Increased productivity by 8% o Increased productivity by 9% o Increased productivity by 10% o Increased productivity by 11 - 15% o Increased productivity by more than 15% o Unknown
31. Other benefits observed as a result of your current space include… (Check all that apply)
o Lower employee turnover o Higher employee morale o Easier recruiting of employees o More effective client meetings
32. Please add any comments about your current space
- End of Survey - THANK YOU FOR YOUR PARTICIPATION!