Embed Size (px)
Citation preview
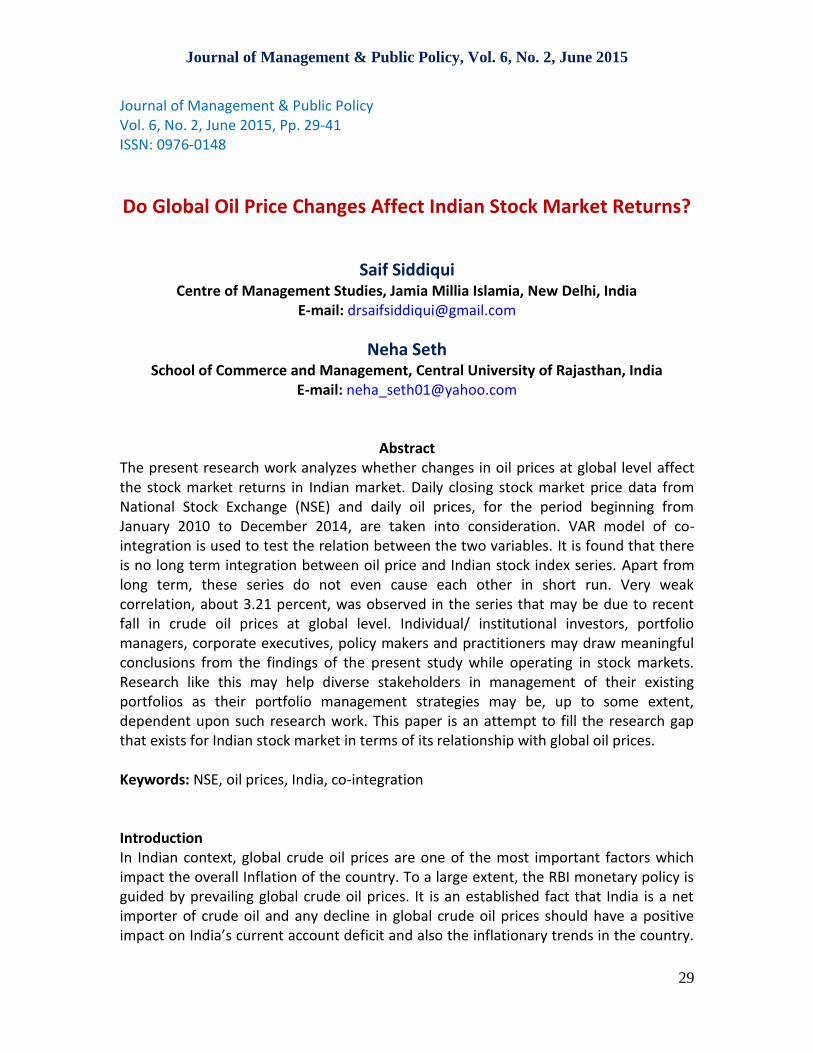
Journal of Management & Public Policy, Vol. 6, No. 2, June 2015
29
Journal of Management & Public Policy Vol. 6, No. 2, June 2015, Pp. 29-41 ISSN: 0976-0148
Do Global Oil Price Changes Affect Indian Stock Market Returns?
Saif Siddiqui
Centre of Management Studies, Jamia Millia Islamia, New Delhi, India E-mail: [email protected]
Neha Seth School of Commerce and Management, Central University of Rajasthan, India
E-mail: [email protected]
Abstract
The present research work analyzes whether changes in oil prices at global level affect the stock market returns in Indian market. Daily closing stock market price data from National Stock Exchange (NSE) and daily oil prices, for the period beginning from January 2010 to December 2014, are taken into consideration. VAR model of co-integration is used to test the relation between the two variables. It is found that there is no long term integration between oil price and Indian stock index series. Apart from long term, these series do not even cause each other in short run. Very weak correlation, about 3.21 percent, was observed in the series that may be due to recent fall in crude oil prices at global level. Individual/ institutional investors, portfolio managers, corporate executives, policy makers and practitioners may draw meaningful conclusions from the findings of the present study while operating in stock markets. Research like this may help diverse stakeholders in management of their existing portfolios as their portfolio management strategies may be, up to some extent, dependent upon such research work. This paper is an attempt to fill the research gap that exists for Indian stock market in terms of its relationship with global oil prices. Keywords: NSE, oil prices, India, co-integration
Introduction In Indian context, global crude oil prices are one of the most important factors which impact the overall Inflation of the country. To a large extent, the RBI monetary policy is guided by prevailing global crude oil prices. It is an established fact that India is a net importer of crude oil and any decline in global crude oil prices should have a positive impact on India’s current account deficit and also the inflationary trends in the country.
Journal of Management & Public Policy, Vol. 6, No. 2, June 2015
30
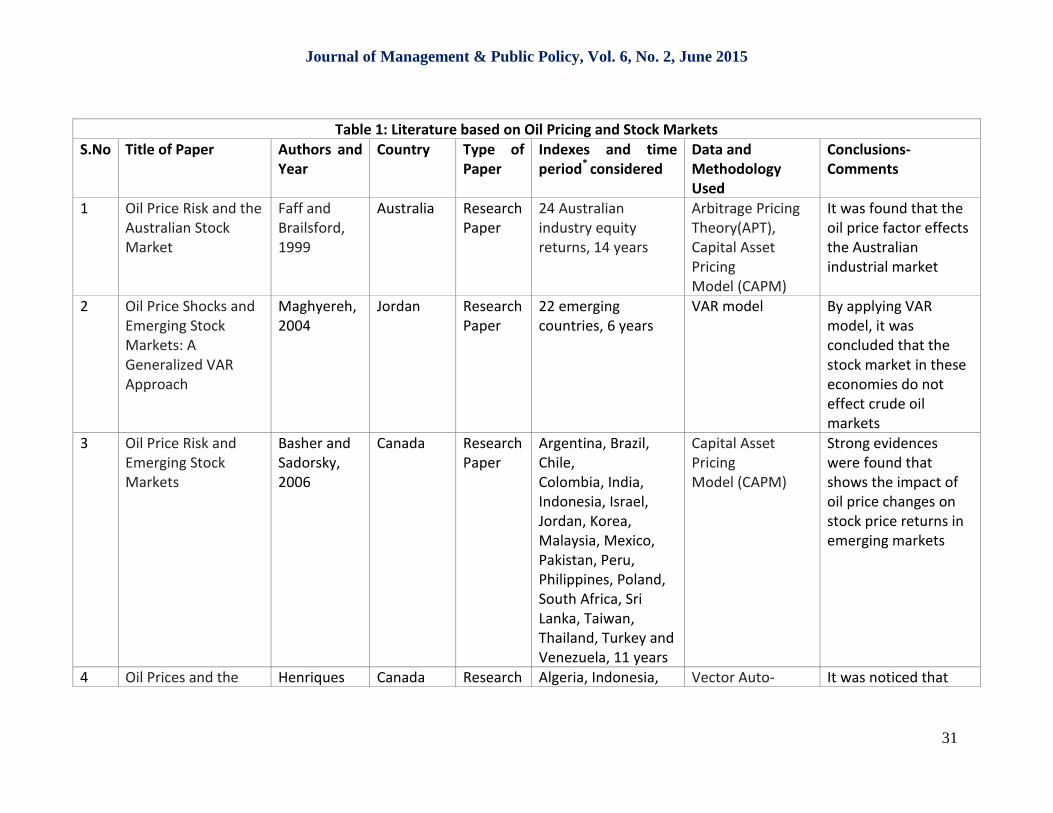
The recent sharp decline in global crude oil prices is a big boon for the country which has drastically brought down the Wholesale Price Index (WPI) and Consumer Price Index (CPI) inflation numbers, thereby giving a big cushion to the RBI Governor to start the interest rate reduction cycle and provide the necessary impetus to overall economic growth. However, in today’s open economy, where a large chunk of investments in Indian stock markets constitute foreign inflows in the form of Foreign Institutional Investors (FII) and Foreign Direct Index (FDI), a positive event for India can be a negative event for another country. For instance a sharp decline in crude oil prices is negative for crude oil exporting countries like Russia and other OPEC nations. It is also a well-known fact that India has a strong trade relation with Russia and it is regarded as India’s strategic international partner. So it becomes all the more important to study the relation between Indian stock market performance and crude oil prices. The organization of rest of the paper would be as follows. In the next section, review of the existing literature is provided. In section three, an explanation of the data and models used is given. Section four discusses the empirical findings and section five concludes the paper. Review of Literature The review of literature forms the base for any research. So, the papers based on oil prices and stock markets are searched and quoted to find the gap in research which forms the basis of this research work. Select papers relating to the similar work are listed in Table 1.
Journal of Management & Public Policy, Vol. 6, No. 2, June 2015
31
Table 1: Literature based on Oil Pricing and Stock Markets S.No Title of Paper Authors and
Year Country Type of
Paper Indexes and time period* considered
Data and Methodology Used
Conclusions- Comments
1 Oil Price Risk and the Australian Stock Market
Faff and Brailsford, 1999
Australia Research Paper
24 Australian industry equity returns, 14 years
Arbitrage Pricing Theory(APT), Capital Asset Pricing Model (CAPM)
It was found that the oil price factor effects the Australian industrial market
2 Oil Price Shocks and Emerging Stock Markets: A Generalized VAR Approach
Maghyereh, 2004
Jordan Research Paper
22 emerging countries, 6 years
VAR model By applying VAR model, it was concluded that the stock market in these economies do not effect crude oil markets
3 Oil Price Risk and Emerging Stock Markets
Basher and Sadorsky, 2006
Canada Research Paper
Argentina, Brazil, Chile, Colombia, India, Indonesia, Israel, Jordan, Korea, Malaysia, Mexico, Pakistan, Peru, Philippines, Poland, South Africa, Sri Lanka, Taiwan, Thailand, Turkey and Venezuela, 11 years
Capital Asset Pricing Model (CAPM)
Strong evidences were found that shows the impact of oil price changes on stock price returns in emerging markets
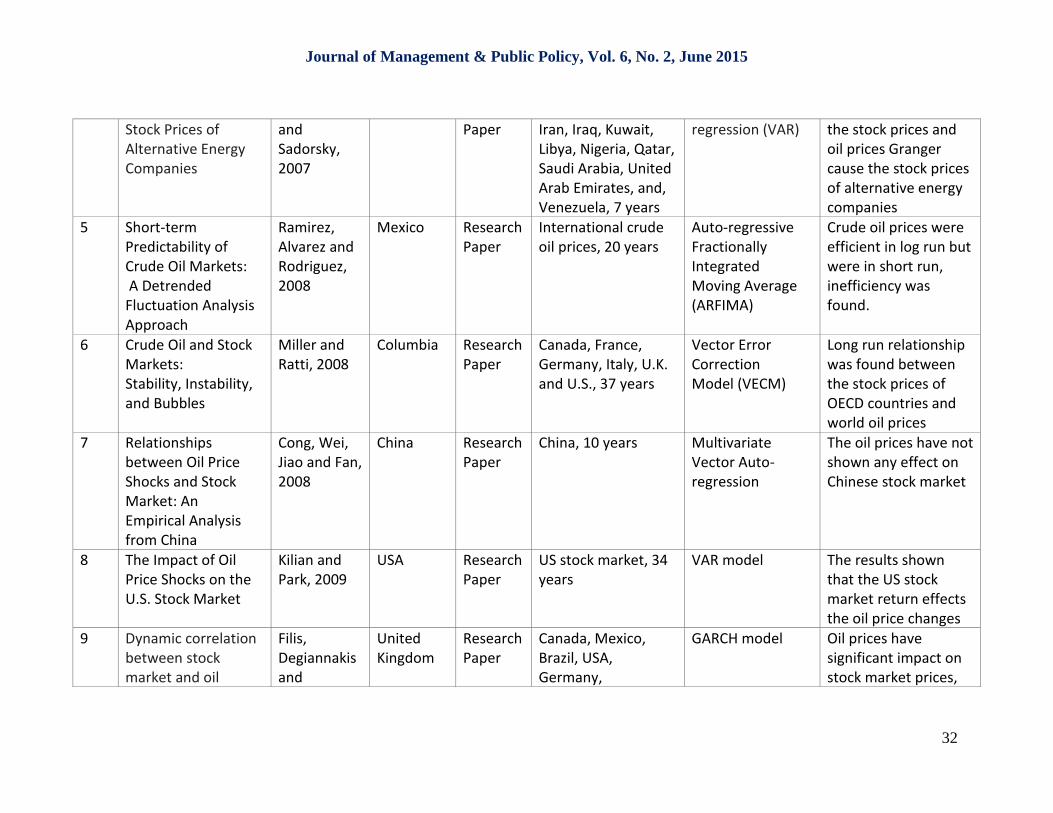
4 Oil Prices and the Henriques Canada Research Algeria, Indonesia, Vector Auto- It was noticed that
Journal of Management & Public Policy, Vol. 6, No. 2, June 2015
32
Stock Prices of Alternative Energy Companies
and Sadorsky, 2007
Paper Iran, Iraq, Kuwait, Libya, Nigeria, Qatar, Saudi Arabia, United Arab Emirates, and, Venezuela, 7 years
regression (VAR) the stock prices and oil prices Granger cause the stock prices of alternative energy companies
5 Short-term Predictability of Crude Oil Markets: A Detrended Fluctuation Analysis Approach
Ramirez, Alvarez and Rodriguez, 2008
Mexico Research Paper
International crude oil prices, 20 years
Auto-regressive Fractionally Integrated Moving Average (ARFIMA)
Crude oil prices were efficient in log run but were in short run, inefficiency was found.
6 Crude Oil and Stock Markets: Stability, Instability, and Bubbles
Miller and Ratti, 2008
Columbia Research Paper
Canada, France, Germany, Italy, U.K. and U.S., 37 years
Vector Error Correction Model (VECM)
Long run relationship was found between the stock prices of OECD countries and world oil prices
7 Relationships between Oil Price Shocks and Stock Market: An Empirical Analysis from China
Cong, Wei, Jiao and Fan, 2008
China Research Paper
China, 10 years Multivariate Vector Auto-regression
The oil prices have not shown any effect on Chinese stock market
8 The Impact of Oil Price Shocks on the U.S. Stock Market
Kilian and Park, 2009
USA Research Paper
US stock market, 34 years
VAR model The results shown that the US stock market return effects the oil price changes
9 Dynamic correlation between stock market and oil
Filis, Degiannakis and
United Kingdom
Research Paper
Canada, Mexico, Brazil, USA, Germany,
GARCH model Oil prices have significant impact on stock market prices,
Journal of Management & Public Policy, Vol. 6, No. 2, June 2015
33
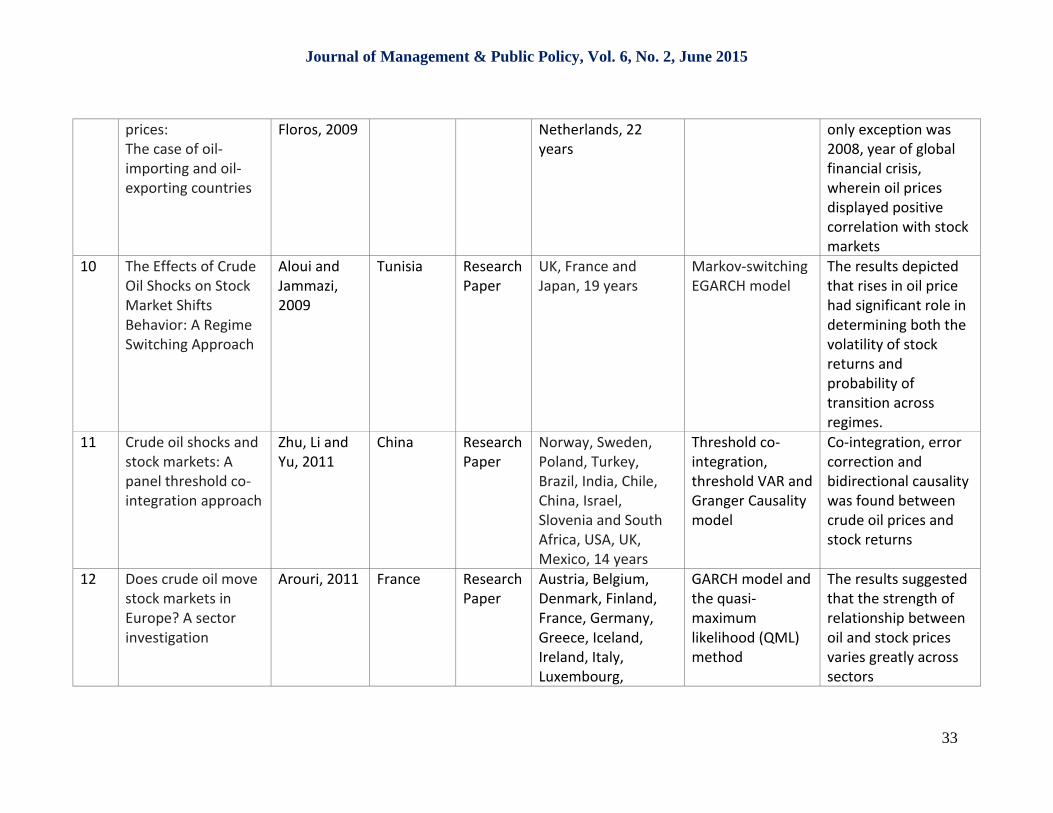
prices: The case of oil-importing and oil-exporting countries
Floros, 2009 Netherlands, 22 years
only exception was 2008, year of global financial crisis, wherein oil prices displayed positive correlation with stock markets
10 The Effects of Crude Oil Shocks on Stock Market Shifts Behavior: A Regime Switching Approach
Aloui and Jammazi, 2009
Tunisia Research Paper
UK, France and Japan, 19 years
Markov-switching EGARCH model
The results depicted that rises in oil price had significant role in determining both the volatility of stock returns and probability of transition across regimes.
11 Crude oil shocks and stock markets: A panel threshold co-integration approach
Zhu, Li and Yu, 2011
China Research Paper
Norway, Sweden, Poland, Turkey, Brazil, India, Chile, China, Israel, Slovenia and South Africa, USA, UK, Mexico, 14 years
Threshold co-integration, threshold VAR and Granger Causality model
Co-integration, error correction and bidirectional causality was found between crude oil prices and stock returns
12 Does crude oil move stock markets in Europe? A sector investigation
Arouri, 2011 France Research Paper
Austria, Belgium, Denmark, Finland, France, Germany, Greece, Iceland, Ireland, Italy, Luxembourg,
GARCH model and the quasi-maximum likelihood (QML) method
The results suggested that the strength of relationship between oil and stock prices varies greatly across sectors
Journal of Management & Public Policy, Vol. 6, No. 2, June 2015
34
the Netherlands, Norway, Portugal, Spain, Sweden, Switzerland, UK,
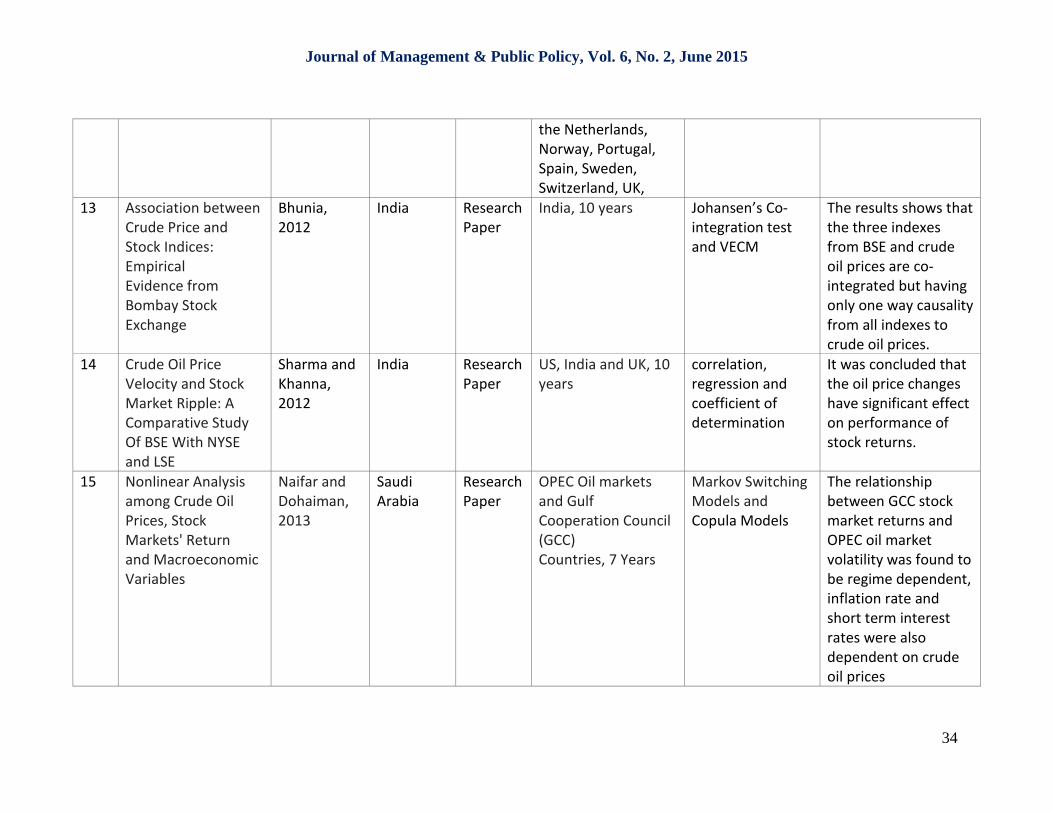
13 Association between Crude Price and Stock Indices: Empirical Evidence from Bombay Stock Exchange
Bhunia, 2012
India Research Paper
India, 10 years Johansen’s Co-integration test and VECM
The results shows that the three indexes from BSE and crude oil prices are co-integrated but having only one way causality from all indexes to crude oil prices.
14 Crude Oil Price Velocity and Stock Market Ripple: A Comparative Study Of BSE With NYSE and LSE
Sharma and Khanna, 2012
India Research Paper
US, India and UK, 10 years
correlation, regression and coefficient of determination
It was concluded that the oil price changes have significant effect on performance of stock returns.
15 Nonlinear Analysis among Crude Oil Prices, Stock Markets' Return and Macroeconomic Variables
Naifar and Dohaiman, 2013
Saudi Arabia
Research Paper
OPEC Oil markets and Gulf Cooperation Council (GCC) Countries, 7 Years
Markov Switching Models and Copula Models
The relationship between GCC stock market returns and OPEC oil market volatility was found to be regime dependent, inflation rate and short term interest rates were also dependent on crude oil prices
Journal of Management & Public Policy, Vol. 6, No. 2, June 2015
35
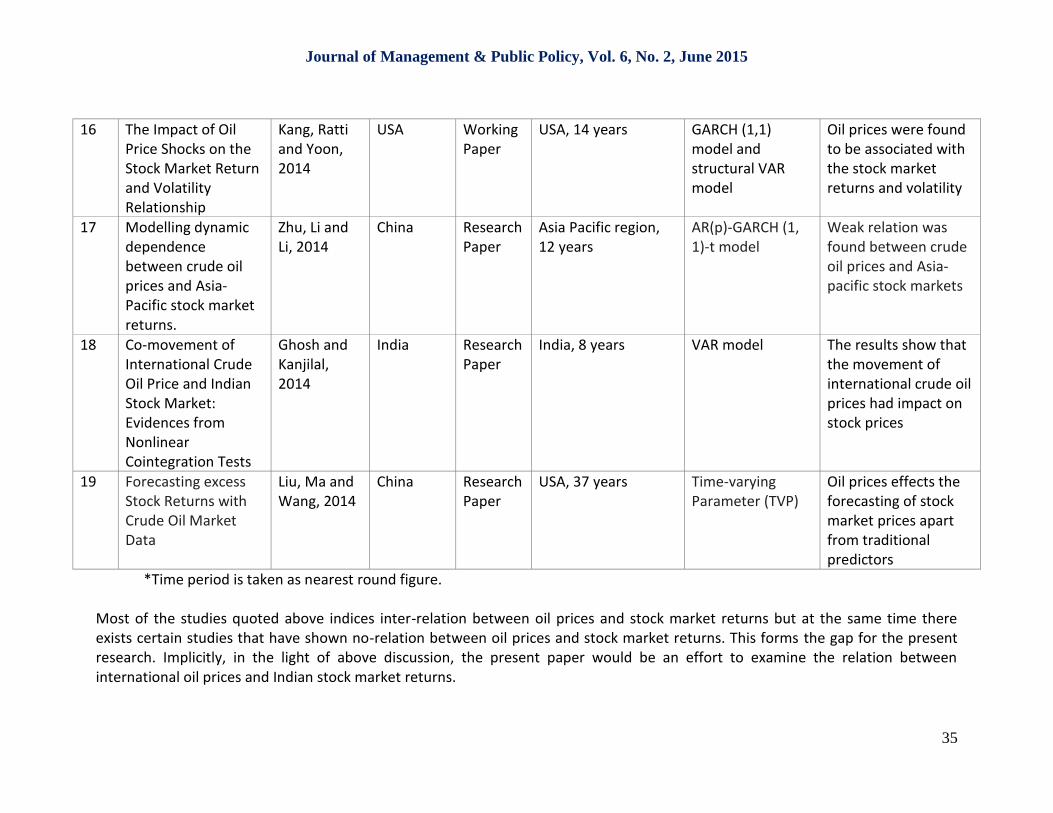
16 The Impact of Oil Price Shocks on the Stock Market Return and Volatility Relationship
Kang, Ratti and Yoon, 2014
USA Working Paper
USA, 14 years GARCH (1,1) model and structural VAR model
Oil prices were found to be associated with the stock market returns and volatility
17 Modelling dynamic dependence between crude oil prices and Asia-Pacific stock market returns.
Zhu, Li and Li, 2014
China Research Paper
Asia Pacific region, 12 years
AR(p)-GARCH (1, 1)-t model
Weak relation was found between crude oil prices and Asia-pacific stock markets
18 Co-movement of International Crude Oil Price and Indian Stock Market: Evidences from Nonlinear Cointegration Tests
Ghosh and Kanjilal, 2014
India Research Paper
India, 8 years VAR model The results show that the movement of international crude oil prices had impact on stock prices
19 Forecasting excess Stock Returns with Crude Oil Market Data
Liu, Ma and Wang, 2014
China Research Paper
USA, 37 years Time-varying Parameter (TVP)
Oil prices effects the forecasting of stock market prices apart from traditional predictors
*Time period is taken as nearest round figure. Most of the studies quoted above indices inter-relation between oil prices and stock market returns but at the same time there exists certain studies that have shown no-relation between oil prices and stock market returns. This forms the gap for the present research. Implicitly, in the light of above discussion, the present paper would be an effort to examine the relation between international oil prices and Indian stock market returns.
Journal of Management & Public Policy, Vol. 6, No. 2, June 2015
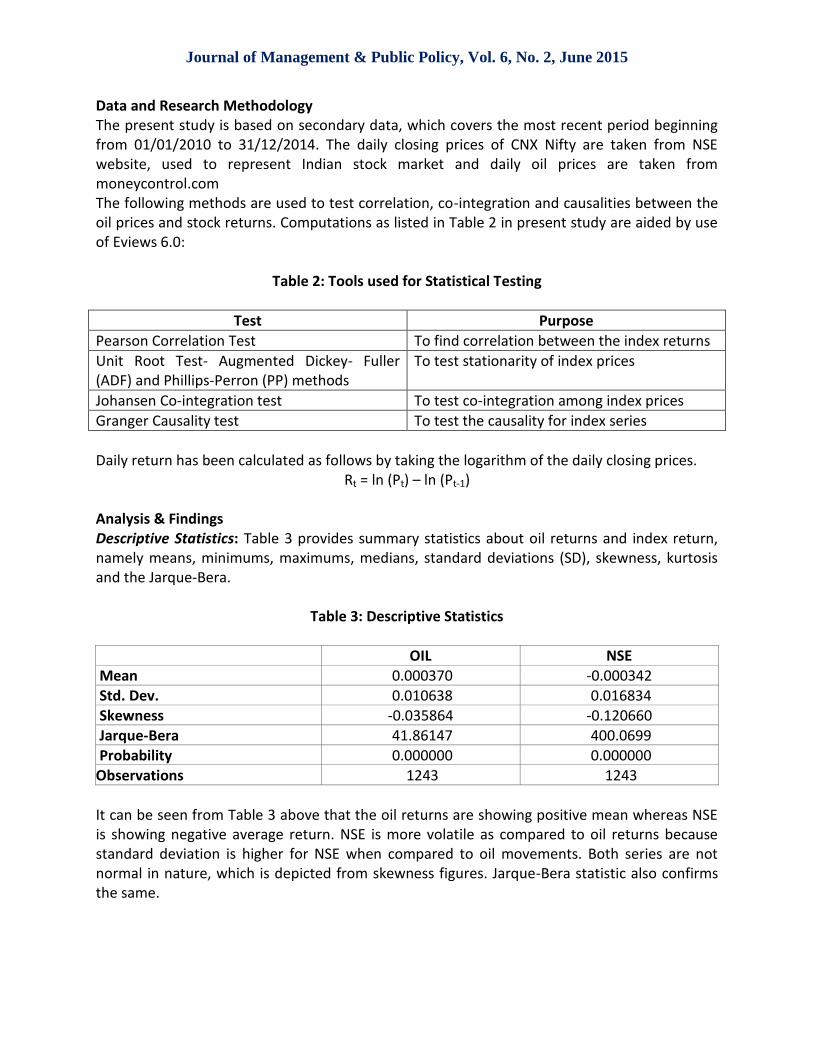
Data and Research Methodology The present study is based on secondary data, which covers the most recent period beginning from 01/01/2010 to 31/12/2014. The daily closing prices of CNX Nifty are taken from NSE website, used to represent Indian stock market and daily oil prices are taken from moneycontrol.com The following methods are used to test correlation, co-integration and causalities between the oil prices and stock returns. Computations as listed in Table 2 in present study are aided by use of Eviews 6.0:
Table 2: Tools used for Statistical Testing
Test Purpose
Pearson Correlation Test To find correlation between the index returns
Unit Root Test- Augmented Dickey- Fuller (ADF) and Phillips-Perron (PP) methods
To test stationarity of index prices
Johansen Co-integration test To test co-integration among index prices
Granger Causality test To test the causality for index series
Daily return has been calculated as follows by taking the logarithm of the daily closing prices.
Rt = ln (Pt) – ln (Pt-1)
Analysis & Findings Descriptive Statistics: Table 3 provides summary statistics about oil returns and index return, namely means, minimums, maximums, medians, standard deviations (SD), skewness, kurtosis and the Jarque-Bera.
Table 3: Descriptive Statistics
OIL NSE Mean 0.000370 -0.000342 Std. Dev. 0.010638 0.016834 Skewness -0.035864 -0.120660 Jarque-Bera 41.86147 400.0699 Probability 0.000000 0.000000 Observations 1243 1243
It can be seen from Table 3 above that the oil returns are showing positive mean whereas NSE is showing negative average return. NSE is more volatile as compared to oil returns because standard deviation is higher for NSE when compared to oil movements. Both series are not normal in nature, which is depicted from skewness figures. Jarque-Bera statistic also confirms the same.
Journal of Management & Public Policy, Vol. 6, No. 2, June 2015
37
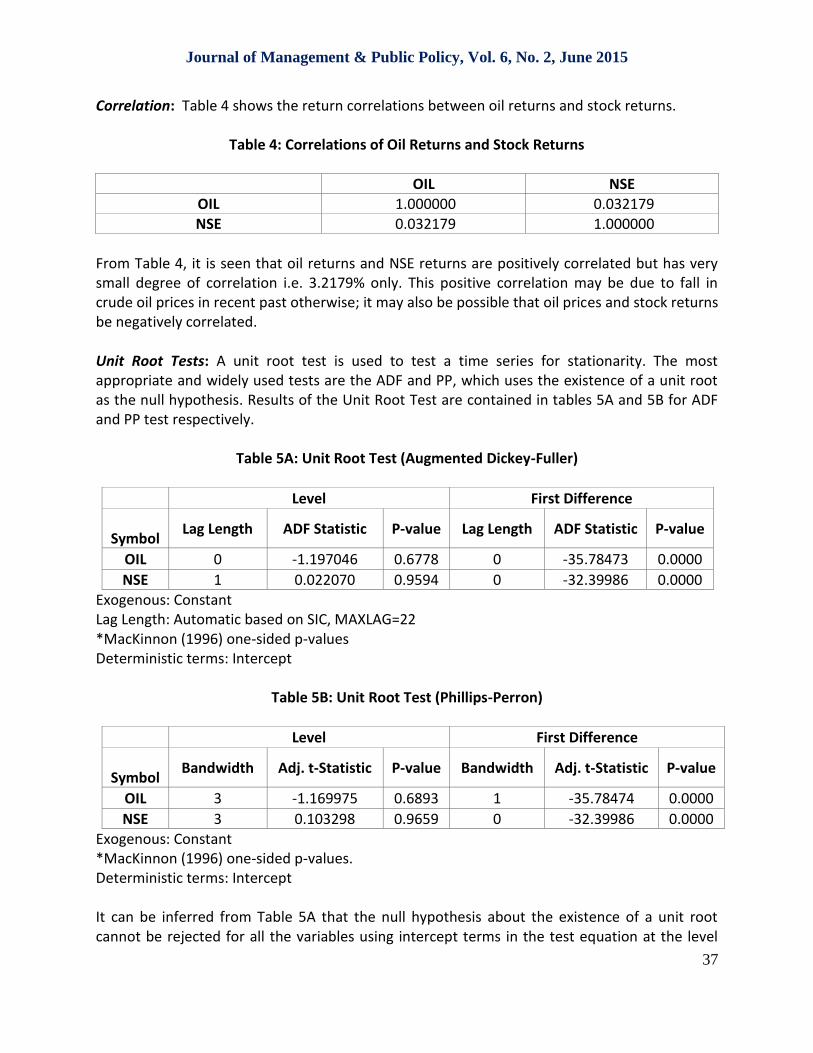
Correlation: Table 4 shows the return correlations between oil returns and stock returns.
Table 4: Correlations of Oil Returns and Stock Returns
OIL NSE OIL 1.000000 0.032179 NSE 0.032179 1.000000
From Table 4, it is seen that oil returns and NSE returns are positively correlated but has very small degree of correlation i.e. 3.2179% only. This positive correlation may be due to fall in crude oil prices in recent past otherwise; it may also be possible that oil prices and stock returns be negatively correlated. Unit Root Tests: A unit root test is used to test a time series for stationarity. The most appropriate and widely used tests are the ADF and PP, which uses the existence of a unit root as the null hypothesis. Results of the Unit Root Test are contained in tables 5A and 5B for ADF and PP test respectively.
Table 5A: Unit Root Test (Augmented Dickey-Fuller)
Level First Difference
Symbol
Lag Length ADF Statistic P-value Lag Length ADF Statistic P-value
OIL 0 -1.197046 0.6778 0 -35.78473 0.0000
NSE 1 0.022070 0.9594 0 -32.39986 0.0000 Exogenous: Constant Lag Length: Automatic based on SIC, MAXLAG=22 *MacKinnon (1996) one-sided p-values Deterministic terms: Intercept
Table 5B: Unit Root Test (Phillips-Perron)
Level First Difference
Symbol
Bandwidth Adj. t-Statistic P-value Bandwidth Adj. t-Statistic P-value
OIL 3 -1.169975 0.6893 1 -35.78474 0.0000
NSE 3 0.103298 0.9659 0 -32.39986 0.0000 Exogenous: Constant *MacKinnon (1996) one-sided p-values. Deterministic terms: Intercept It can be inferred from Table 5A that the null hypothesis about the existence of a unit root cannot be rejected for all the variables using intercept terms in the test equation at the level
Journal of Management & Public Policy, Vol. 6, No. 2, June 2015
38
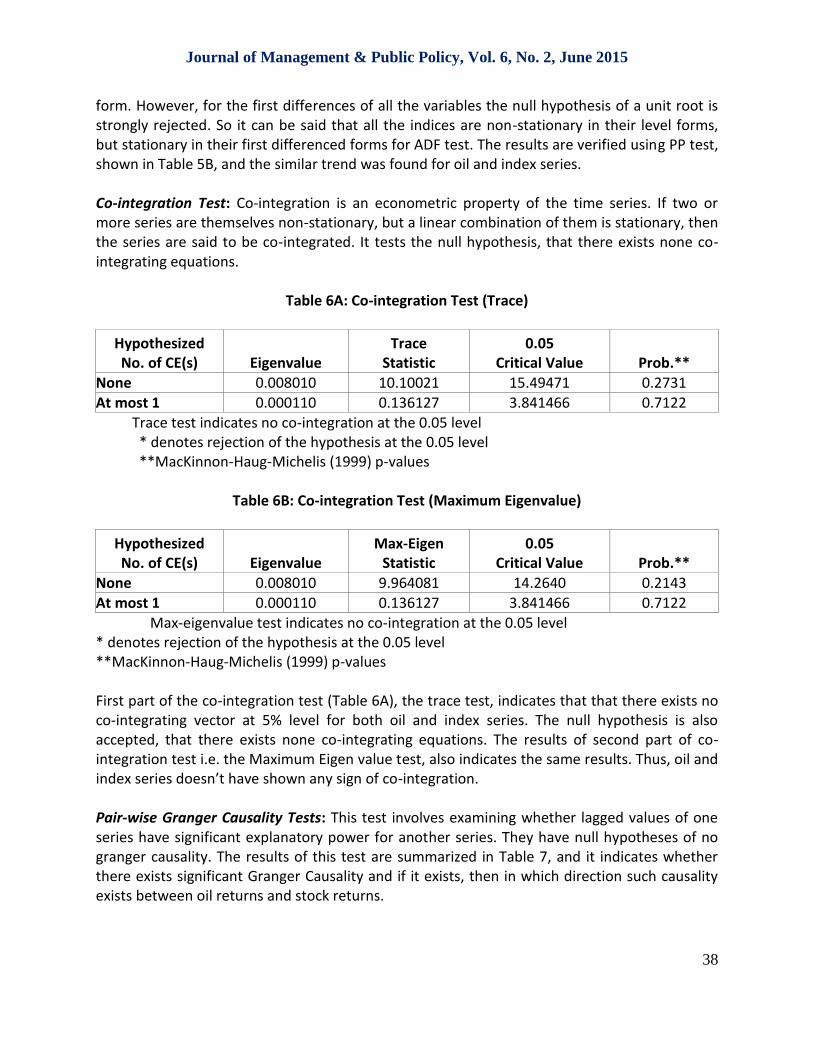
form. However, for the first differences of all the variables the null hypothesis of a unit root is strongly rejected. So it can be said that all the indices are non-stationary in their level forms, but stationary in their first differenced forms for ADF test. The results are verified using PP test, shown in Table 5B, and the similar trend was found for oil and index series. Co-integration Test: Co-integration is an econometric property of the time series. If two or more series are themselves non-stationary, but a linear combination of them is stationary, then the series are said to be co-integrated. It tests the null hypothesis, that there exists none co-integrating equations.
Table 6A: Co-integration Test (Trace)
Hypothesized No. of CE(s) Eigenvalue
Trace Statistic
0.05 Critical Value Prob.**
None 0.008010 10.10021 15.49471 0.2731 At most 1 0.000110 0.136127 3.841466 0.7122 Trace test indicates no co-integration at the 0.05 level * denotes rejection of the hypothesis at the 0.05 level **MacKinnon-Haug-Michelis (1999) p-values
Table 6B: Co-integration Test (Maximum Eigenvalue)
Hypothesized No. of CE(s) Eigenvalue
Max-Eigen Statistic
0.05 Critical Value Prob.**
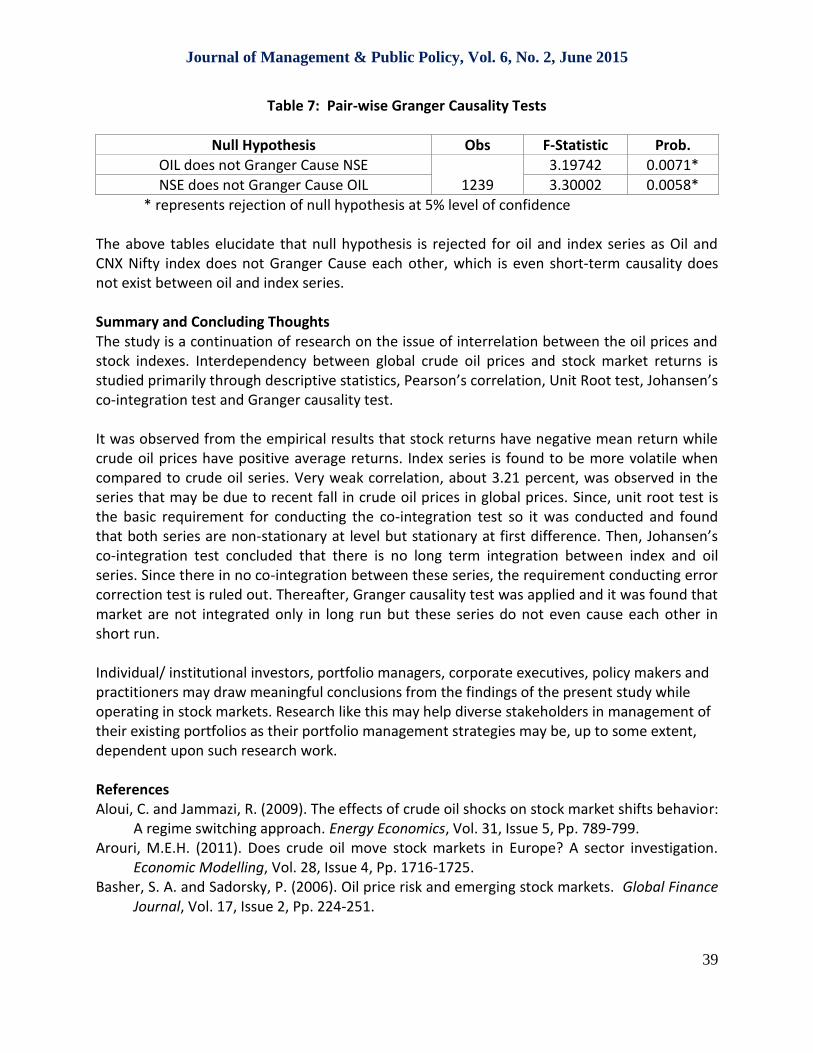
None 0.008010 9.964081 14.2640 0.2143 At most 1 0.000110 0.136127 3.841466 0.7122 Max-eigenvalue test indicates no co-integration at the 0.05 level * denotes rejection of the hypothesis at the 0.05 level **MacKinnon-Haug-Michelis (1999) p-values First part of the co-integration test (Table 6A), the trace test, indicates that that there exists no co-integrating vector at 5% level for both oil and index series. The null hypothesis is also accepted, that there exists none co-integrating equations. The results of second part of co-integration test i.e. the Maximum Eigen value test, also indicates the same results. Thus, oil and index series doesn’t have shown any sign of co-integration. Pair-wise Granger Causality Tests: This test involves examining whether lagged values of one series have significant explanatory power for another series. They have null hypotheses of no granger causality. The results of this test are summarized in Table 7, and it indicates whether there exists significant Granger Causality and if it exists, then in which direction such causality exists between oil returns and stock returns.
Journal of Management & Public Policy, Vol. 6, No. 2, June 2015
39
Table 7: Pair-wise Granger Causality Tests
Null Hypothesis Obs F-Statistic Prob. OIL does not Granger Cause NSE
1239 3.19742 0.0071*
NSE does not Granger Cause OIL 3.30002 0.0058* * represents rejection of null hypothesis at 5% level of confidence The above tables elucidate that null hypothesis is rejected for oil and index series as Oil and CNX Nifty index does not Granger Cause each other, which is even short-term causality does not exist between oil and index series. Summary and Concluding Thoughts The study is a continuation of research on the issue of interrelation between the oil prices and stock indexes. Interdependency between global crude oil prices and stock market returns is studied primarily through descriptive statistics, Pearson’s correlation, Unit Root test, Johansen’s co-integration test and Granger causality test. It was observed from the empirical results that stock returns have negative mean return while crude oil prices have positive average returns. Index series is found to be more volatile when compared to crude oil series. Very weak correlation, about 3.21 percent, was observed in the series that may be due to recent fall in crude oil prices in global prices. Since, unit root test is the basic requirement for conducting the co-integration test so it was conducted and found that both series are non-stationary at level but stationary at first difference. Then, Johansen’s co-integration test concluded that there is no long term integration between index and oil series. Since there in no co-integration between these series, the requirement conducting error correction test is ruled out. Thereafter, Granger causality test was applied and it was found that market are not integrated only in long run but these series do not even cause each other in short run. Individual/ institutional investors, portfolio managers, corporate executives, policy makers and practitioners may draw meaningful conclusions from the findings of the present study while operating in stock markets. Research like this may help diverse stakeholders in management of their existing portfolios as their portfolio management strategies may be, up to some extent, dependent upon such research work. References Aloui, C. and Jammazi, R. (2009). The effects of crude oil shocks on stock market shifts behavior:
A regime switching approach. Energy Economics, Vol. 31, Issue 5, Pp. 789-799. Arouri, M.E.H. (2011). Does crude oil move stock markets in Europe? A sector investigation.
Economic Modelling, Vol. 28, Issue 4, Pp. 1716-1725. Basher, S. A. and Sadorsky, P. (2006). Oil price risk and emerging stock markets. Global Finance
Journal, Vol. 17, Issue 2, Pp. 224-251.
Journal of Management & Public Policy, Vol. 6, No. 2, June 2015
40
Bhunia, A. (2012). Association between crude price and stock indices: Empirical evidence from bombay stock exchange. Journal of Economics and Sustainable Development, Vol. 3, No. 3, Pp. 25-34.
Cong, R. G., Wei, Y. M., Jiao, J. L. and Fan, Y. (2008). Relationships between oil price shocks and stock market: An empirical analysis from china. Energy Policy, Vol. 36, Issue 9, Pp. 3544–3553.
Faff, R.W. and Brailsford, T. J. (1999). Oil price risk and the Australian stock market. Journal of Energy Finance & Development, Vol. 4, Issue 1, Pp. 69-87.
Filis, G., Degiannakis, S. and Floros, C. (2009). Dynamic correlation between stock market and oil prices: The case of oil-importing and oil-exporting countries. International Review of Financial Analysis, Vol. 20, Issue 3, Pp. 152-164.
Ghosh, S. and Kanjilal, K. (2014). Co-movement of international crude oil price and Indian stock market: Evidences from non-linear co-integration tests. Energy Economics, downloaded from http://www.sciencedirect.com/science/article/pii/S0140988314002710 (accessed on 12th January 2015)
Henriques, I. and Sadorsky, P. (2007). Oil prices and the stock prices of alternative energy companies. Energy Economics, Vol. 30, Issue 3, Pp. 998-1010.
Kang, W., Ratt, R. A. and Yoon, K.H. (2014). The impact of oil price shocks on the stock market return and volatility relationship. http://papers.ssrn.com/sol3/papers.cfm?abstract_id=2522667 (accessed on 15th January 2015)
Kilian, L. and Park, C. (2009). The impact of oil price shocks on the U. S. stock market. International Economic Review, Vol. 50, Issue 4, Pp. 1267-1287.
Liu, L., Ma, F. and Wang, Y. (2014). Forecasting excess stock returns with crude oil market data. Energy Economics, downloaded from http://www.sciencedirect.com/science/article/pii/S0140988314003223 (accessed on 12th January 2015).
Maghyereh, A. (2004). Oil price shocks and emerging stock markets: A generalized VAR approach. International Journal of Applied Econometrics and Quantitative Studies, Vol. 1, Issue 2, Pp. 27-40.
Miller, J. I. and Ratti, R. A. (2008). Crude oil and stock markets: stability, instability, and bubbles. Energy Economics, Vol. 31, Issue 4, Pp. 559-568.
Naifar, N. and Dohaiman, M. S. A. (2013). Nonlinear analysis among crude oil prices, stock markets' return and macroeconomic variables. International Review of Economics & Finance, Vol. 27, Pp. 416–431.
Ramirez, J. A., Alvarez, J. and Rodriguez, E. (2008). Short-term predictability of crude oil markets: A detrended fluctuation analysis approach. Energy Economics, Vol. 30, Issue 5, Pp. 2645–2656.
Sharma, N. and Khanna, K. (2012). Crude oil price velocity and stock market ripple: A comparative study of BSE with NYSE and LSE. International Journal of Exclusive Management Research, Vol. 2, Issue 7, Pp. 1-7.
Journal of Management & Public Policy, Vol. 6, No. 2, June 2015
41
Zhu, H.M., Li, R. and Li, S. (2014). Modelling dynamic dependence between crude oil prices and Asia-Pacific stock market returns. International Review of Economics and Finance, Vol. 29, Pp. 208–223.
Zhu, H.M., Li, S.F. and Yu, K. (2011). Crude oil shocks and stock markets: A panel threshold co-integration approach. Energy Economics, Vol. 33, Issue 5, Pp. 987-994.