Embed Size (px)
Citation preview

Do Financial Counseling Mandates Do Financial Counseling Mandates Improve Mortgage Choice and Improve Mortgage Choice and
Performance?Performance?Evidence from a Legislative Evidence from a Legislative
ExperimentExperimentSumit Agarwal, Federal Reserve Bank of Chicago
Gene Amromin, Federal Reserve Bank of Chicago
Itzhak Ben-David, Finance Dept, Fisher College, Ohio State University
Souphala Chomsisengphet, Office of the Comptroller of the Currency
Douglas D. Evanoff, Federal Reserve Bank of Chicago
May 2009
The views expressed are those of the authors and are not necessarily those of the Federal Reserve Bank of Chicago, the Federal Reserve System, or the Office of Comptroller
of the Currency

Motivation Recent research
households fail to understand key features of financial contracts these mistakes are consequential
The ongoing credit crisis intensified policy focus on ensuring financial literacy
“People can make their own (optimal) choices” “People need to be protected from excessively easy credit”
How should it be done? President Obama, as part of the Homeownership Affordability
and Stabilization Plan of 2009, has proposed mandatory financial counseling to certain borrowers
Sheila Bair has also advocated increased intervention by policymakers in the credit markets

Financial Education MandatesFinancial Education Mandates Often take the form of disclosure requirements
and/or “anti-predatory” lending laws
“Anti-predatory” lending programs either impose outright prohibitions on certain credit products and/or practices or require people taking on such products to undergo counseling
The State of Illinois foray into this territory – The Illinois Predatory Lending Database Law of 2006 (HB 4050)

HB 4050: A Rough SketchHB 4050: A Rough Sketch Passed in 2005 “to curtail predatory lending practices”, went
into effect on September 1, 2006 as a “4-year pilot program”
Required “high-risk” borrowers working with state-licensed lenders to go through HUD-accredited loan counseling prior to closing
HB 4050 applied to the following …
Borrowers: If FICO < 620, counseling is mandatory
If 620 < FICO < 650, get counseling only for certain mortgage products
Interest-only loans, loans with negative amortization, loans adjustable within three years or less, loans with prepayment penalties, loans with less than 5 percent down payment, loans with closing costs in excess of five percent:
Lenders: all Illinois mortgage licensees – primarily mortgage bankers
Geographic areas: 10 contiguous ZIP codes on Chicago’s Southwest Side

HB-4050 Treated and Control HB-4050 Treated and Control Zip CodesZip Codes

HB 4050: Flow ChartHB 4050: Flow ChartApplication
(Application Fee)
Rejection by lender
Approval
($300 Counseling Fee)
CounselingExemption
Incomplete Application
Application Withdrawn
Renegotiation
Only if worse terms
Origination
Rejection by borrower
At each “blue” stage, information is recorded in a State database

Mobilization of aggrieved groups Borrowers and sellers in affected ZIPs – why us!!? Mortgage brokers and bankers – why us??? Real estate groups Outside parties (NAACP) – discrimination
Highly publicized lender withdrawals, public protests, lawsuits, and mayhem at public hearings
Claims that house prices and sales volume decline disproportionately (Bates and VanZandt 2007)
January 17, 2007 – HB 4050 is effectively killed
July 1, 2008 – resurrected in a modified (but permanent) form that covers all of Cook County First time buyers, and refinancers with “risky” products
The Short (Un)Happy Life of The Short (Un)Happy Life of HB4050HB4050
Research Questions Is mandatory financial counseling an effective
policy? Ex post loan performance Choice of “less risky” loans
What are the effects of financial counseling legislation on market participants?
Supply of credit Demand for credit
Why might financial counseling be effective? Selection of borrowers and lenders Change in the behavior of borrowers (better information)
and lenders (stricter oversight)

Main ResultsMain Results Effects of legislation:
Lower delinquency and default rates Some borrowers choose less risky products Lower market activity; no effect on house prices
Effects on market participants: Exit of lenders Exit of borrowers Higher rejection rate by lenders
What caused these effects? Not selection Avoiding counseling led borrowers to choose less risky products Tighter screening by lenders due to increased oversight through
counselors Not as much evidence for improvement due to informational content of
counseling

DataData1. HMDA (Home Mortgage Disclosure Act):
- All mortgage applications
- Includes: lender, loan characteristics, borrower income, outcome
2. Cook County Recorder of Deeds:
- All transactions and mortgages taken in the County
- Includes: prices, mortgage amounts
3. LoanPerformance (we are replicating results with McDash)
- All subprime and Alt-A mortgages that were securitized
- Includes: mortgage terms, borrower terms, foreclosure status
4. Counseling data:- From one agency
Data period: 2005 until 2007

Empirical Analysis: Approach Empirical Analysis: Approach (standard)(standard)
Difference-in-Differences Framework:
Responseijt = α + β1 Treatmentjt + γ1 Time dummiest
+ δ1 Zip codej + θ Controlsijt + εijt.
Set of time and location fixed effects, classic design
But treatment selection is patently non-random For instance, low-income ZIP codes may be inherently
more vulnerable to economic shocks and so time dummies will not be able to filter those out uniformly

Empirical Analysis: Approach Empirical Analysis: Approach (modified)(modified)
Take advantage of the pilot program design
Recall that only certain borrowers in treated areas were subject to treatment
This allows us to exploit within-ZIP code heterogeneity to identify treatment effects
Specifically, we treat each zip code × FICO range as “separate cells”
Results are robust to choosing alternative ways of doing this (e.g., zip code × month, or zip code × log of ZIP income fixed effects)

Main Result: Borrowers Perform Main Result: Borrowers Perform BetterBetter
Delinquency (x 100) Default (x 100)(1) (5)
HB 4050 x Low FICO -4.09** -3.19***(1.77) (1.17)
HB 4050 x Mid FICO 1.61 2.24(2.05) (1.52)
HB 4050 x High FICO -1.18 0.08(1.28) (1.04)
Borrower Controls Yes YesContract Controls Yes YesProperty Type FE Yes YesDate * FICO Range FE Yes YesZipcode * FICO Range FE Yes Yes
Observations 165,969 165,969Adj. R^2 0.09 0.06
Other controls include: FICO score, log of valuation, LTV, as well as indicators for full doc loans, ARM loans, negative amortization loans, investor loans, loans with prepayment penalties, cashout refi loans

Empirical Analysis: Control Empirical Analysis: Control SampleSample
HB 4050 ZIPs Comp ZIPs Rest of Cook County(10 zip codes) (10 zip codes) (148 zip codes)
Total population (18 plus) 499,966 537,745 3,156,397Total # of households 220,274 247,652 1,610,035
Subprime loansLoans issued since 2005 24913 20647 100717Delinquency rate (%) 34.2 32.3 30.8Default rate (%) 12.4 11.8 10.3
Alt-A loansLoans issued since 2005 5301 6326 41044Delinquency rate (%) 20.9 19.2 15.5Default rate (%) 7.2 6.2 4.6
Unemployment rate (%) 14.3 13.4 6.1Below poverty rate (%) 17.0 18.8 8.2Share on public assistance (%) 9.6 9.5 3.3Demographic characteristics are based on the 2000 Census data
Another (complementary) way to assuage non-random treatment sample concerns is to identify a set of “comparable” zip codes not subject to HB 4050

HB-4050 Treated and Control HB-4050 Treated and Control Zip CodesZip Codes

Main Result: Alternative SampleMain Result: Alternative Sample
Entire Cook Co. HB4050 + ComparableHB 4050 x Low FICO -3.19*** -4.09***
(1.17) (1.26)HB 4050 x Mid FICO 2.24 2.50
(1.52) (1.79)HB 4050 x High FICO 0.08 -0.52
(1.04) (1.17)
Borrower Controls Yes YesContract Controls Yes YesProperty Type FE Yes YesDate * FICO Range FE Yes YesZipcode * FICO Range FE Yes Yes
Observations 165,969 55,241Adj. R^2 0.06 0.08
Delinquency (x 100)

Explaining the ImprovementExplaining the ImprovementChanges in sample composition:
1. Selection of borrowers Low-credit borrowers do not apply We control for salient characteristics (FICO score, house
characteristics)
2. Selection of lenders Shady lenders exit We control for “Active” lenders, who remain in the market
Changes in behavior:
3. Change in behavior of borrowers Borrowers choose more suitable products
4. Change in the behavior of lenders Lenders screen better

Loan Application Volume by Loan Application Volume by SegmentSegment
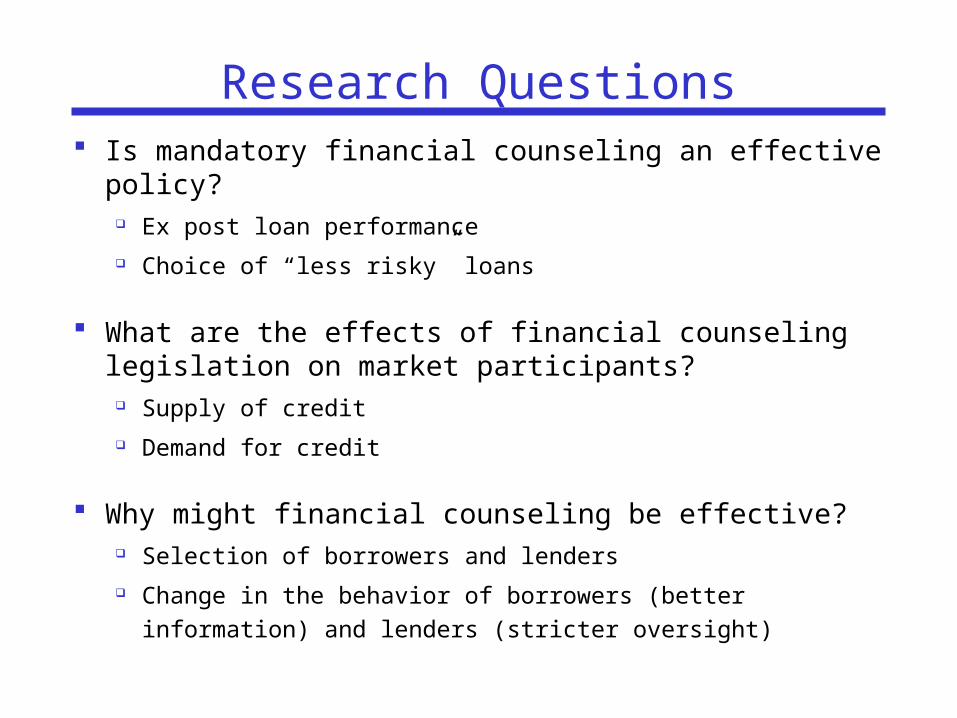
Evidence of Credit RationingEvidence of Credit Rationing
Share of sub-620 borrowers in treated ZIP codes shrank
by 10 pct points
0
0.2
0.4
0.6
0.8
1
430 450 470 490 510 530 550 570 590 610 630 650 670 690 710 730 750 770 790 810 830
Pre/HB4050
During/HB4050
Cumulative distribution of mortgages before and during the HB-4050 period in HB-4050 zip codes, as function of FICO
scores
0
0.2
0.4
0.6
0.8
1
430 450 470 490 510 530 550 570 590 610 630 650 670 690 710 730 750 770 790 810 830
Pre/Non HB4050
During/Non HB4050
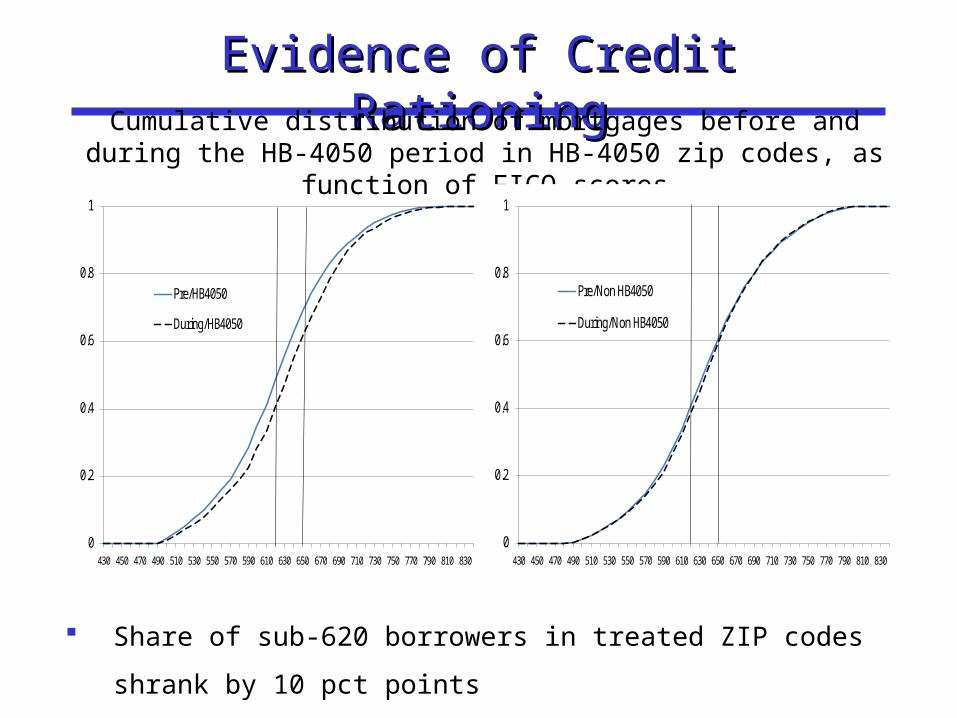
Main Result: more controls for Main Result: more controls for borrower qualityborrower quality
Entire Cook Co. HB4050 + ComparableHB 4050 x Low FICO -3.14*** -3.99***
(1.18) (1.27)HB 4050 x Mid FICO 2.20 2.40
(1.55) (1.82)HB 4050 x High FICO 0.26 -0.35
(1.04) (1.19)
Loan Spread (%) 1.16*** 1.22***(0.07) (0.12)
Lender FEBorrower Controls Yes YesContract Controls Yes YesProperty FE Yes YesDate * FICO Range FE Yes YesZipcode * FICO Range FE Yes Yes
Observations 165,969 55,241Adj. R^2 0.07 0.08
Delinquency (x 100)

Selection of Borrowers: Selection of Borrowers: SummarySummary
1. Number of applications declines
2. Greater application declines at lenders specializing in subprime applicants
3. Pool of approved mortgage applicants improves in terms of credit quality (FICO scores)
But…
The improvement in default rate is robust to salient characteristics of borrower credit quality

Selection of LendersSelection of Lenders Count the number of active lenders (> 20 loan applications per month)
Exit of lenders, especially those specializing in subprime loans and lack of substitution towards HB4050-exempt subprime lenders
Entire Cook Co.HB4050 +
Comparable Entire Cook Co.HB4050 +
Comparable(1) (2) (3) (4)
HB 4050 -0.216*** -0.286*** -0.036* -0.095***(0.028) (0.041) (0.019) (0.032)
Date FE Yes Yes Yes YesZipcode FE Yes Yes Yes Yes
Observations 5437 756 5472 756Adj. R^2 0.918 0.951 0.970 0.965# active lenders are defined as those filing at least 20 HMDA applicationsper month in HB4050 or Comp geographic areas, or 50 HMDA applications per month in the entire Cook Co.
Dependent: log(# Lenders)State-Licensed Lenders
Specializing in Subprime loans All Other Lenders

Selection of LendersSelection of LendersWhich Lenders Stayed in the Market?
(Source: HMDA) Mean Std Error Mean Std ErrorAverage # originations 235.91 31.96 105.84 19.91Mortgage amount ($k) 133.09 4.82 144.01 4.60Income ($k) 71.43 1.57 80.33 3.90Refi (%) 60.07 3.18 52.24 3.85Rejection rate (%) 25.09 2.05 20.58 1.90Second liens / Total originations (%) 23.70 2.06 21.11 2.15
(Source: LoanPerformance) Mean Std Error Mean Std ErrorAverage # originations 7173.44 3430.88 3336.00 1615.29Delinquency (%) 28.38 1.17 28.79 1.27Default (%) 9.85 1.52 9.40 1.17Loan Spread (%) 4.65 0.06 4.60 0.09Low FICO (%) 42.12 1.85 38.26 3.34Mid FICO (%) 20.99 0.74 19.14 1.44Full Documentation (%) 52.66 0.45 47.19 1.06Valuation ($k) 274.31 12.84 290.96 20.50LTV (%) 80.03 0.56 80.40 0.43FICO 632.19 1.47 639.99 1.68ARM Mortgages (%) 79.41 2.11 87.95 1.68IO Mortgages (%) 13.22 2.39 23.93 2.23Refi (%) 62.26 1.43 57.51 1.22Refi Cashout (%) 55.09 0.85 46.19 0.84Prepayment Penalty (%) 21.08 3.79 18.00 4.92
Stayed in the Market (N = 18) Left the Market (N = 17)
Stayed in the Market (N = 66) Left the Market (N = 45)

Main Result: control for lender Main Result: control for lender compositioncomposition
HB 4050 x Low FICO -3.73** -3.68**(1.61) (1.63)
HB 4050 x Mid FICO 3.03* 3.10*(1.72) (1.74)
HB 4050 x High FICO -0.99 -0.89(1.18) (1.18)
Loan Spread (%) 0.84***(0.11)
Lender FEBorrower Controls Yes YesContract Controls Yes YesProperty FE Yes YesDate * FICO Range FE Yes YesZipcode * FICO Range FE Yes Yes
Observations 63,563 63,556Adj. R^2 0.06 0.06
Delinquency (x 100)Entire Cook Co. Active Lenders Only

Selection of Lenders: SummarySelection of Lenders: Summary1. Lenders exited the market
2. No clear difference between those who left and those who stayed
But…
The improvement in default rate is robust to restricting sample to lenders who stayed in the market

Change in the Behavior of Change in the Behavior of BorrowersBorrowers
Did Borrowers Choose Lower Leverage?
Did Borrowers Negotiate Better Deals?
Full Comp Active Full Comp Active Full Comp Active(1) (2) (3) (4) (5) (6) (7) (8) (9)
HB 4050 x Low FICO -1.28*** -0.88** -1.24*** -0.61** -0.53 -0.16 -0.05 -0.09 -0.07(0.31) (0.34) (0.43) (0.28) (0.38) (0.35) (0.05) (0.05) (0.04)
HB 4050 x Mid FICO -0.25 -0.22 -0.86 -0.23 -0.08 -1.09 0.03 0.06 -0.09*(0.42) (0.55) (0.60) (0.62) (0.65) (0.82) (0.05) (0.06) (0.05)
HB 4050 x High FICO 0.62** 0.40 -0.14 -0.49 -0.53 -0.68* -0.15*** -0.14*** -0.12***(0.31) (0.51) (0.47) (0.34) (0.37) (0.38) (0.03) (0.04) (0.04)
Borrower Controls Yes Yes Yes Yes Yes Yes Yes Yes YesContract Controls Yes Yes Yes Yes Yes Yes Yes Yes YesProperty FE Yes Yes Yes Yes Yes Yes Yes Yes YesDate * FICO Range FE Yes Yes Yes Yes Yes Yes Yes Yes YesZipcode * FICO Range FE Yes Yes Yes Yes Yes Yes Yes Yes Yes
Observations 165969 55241 63563 114415 39121 53219 165962 55240 63556Adj. R^2 0.13 0.12 0.11 0.07 0.08 0.07 0.51 0.47 0.42
Loan-to-Value (%) Debt Service-to-Income (%) Loan-Spread (%)

Change in the Behavior of Change in the Behavior of BorrowersBorrowers
Did Borrowers Move Away From “Risky” Products?
Full Comp Active Full Comp Active Full Comp Active(1) (2) (3) (4) (5) (6) (7) (8) (9)
HB 4050 x Low FICO 0.14 -0.60 -0.06 -0.25 -0.37 -1.38** -4.89*** -7.16*** -3.92**(2.13) (2.21) (2.56) (0.66) (0.84) (0.59) (1.71) (1.99) (1.64)
HB 4050 x Mid FICO -6.60*** -6.66** -9.39*** -1.78 -2.97* -1.88 -5.39*** -4.55* -7.10***(1.76) (2.50) (1.96) (1.31) (1.62) (1.63) (1.88) (2.42) (2.67)
HB 4050 x High FICO -3.34** -3.04 -6.77*** 1.12 1.12 1.06 -2.17* -2.14 -3.02(1.63) (1.98) (1.99) (1.49) (1.92) (2.16) (1.31) (1.73) (2.59)
Borrower Controls Yes Yes Yes Yes Yes Yes Yes Yes YesContract Controls Yes Yes Yes Yes Yes Yes Yes Yes YesProperty FE Yes Yes Yes Yes Yes Yes Yes Yes YesDate * FICO Range FE Yes Yes Yes Yes Yes Yes Yes Yes YesZipcode * FICO Range FE Yes Yes Yes Yes Yes Yes Yes Yes Yes
Observations 165969 55241 63563 165969 55241 63563 165969 55241 63563Adj. R^2 0.14 0.15 0.13 0.16 0.13 0.17 0.22 0.23 0.20
Low Documentation (x 100)ARM (x 100) IO mortgage (x 100)
Low doc loans are drastically reduced – counseling requirement to bring income and asset documentation to the session

Change in the Behavior of Change in the Behavior of BorrowersBorrowers
Did Counseling Change Borrowers Decisions?
CategoryTotal
Mortgages No issues
Cannot afford or close to it
Indicia of fraud
Loan above market rate
Seek another bid
Total matched originations 97 54 23 14 4 2
No changes at all 50 34 8 5 1 2Loans with changes post counseling 47 20 15 9 3 0
(percent with changes) 37% 65% 64% 75% 0%
Lower monthly payments 15 9 4 3 0 (percent of all changed loans) 75% 60% 44% 100% -
Switch from ARM to fixed 1 5 2 0 0 (percent of all changed loans) 5% 33% 22% 0% -
Lower interest rate 14 10 3 3 - (percent of all changed loans) 70% 67% 33% 100%
Counselor recommendation

Change in Behavior of Borrowers: Change in Behavior of Borrowers: SummarySummary
1. Decline in mortgage rejections by borrowers
2. Minor decline in leverage
3. No effect on interest rates
4. No shift towards less risky products by counseled borrowers
5. Shift towards less risky products in order to avoid counseling
But… the improvement in default rate is robust to salient mortgage characteristics

Change in the Behavior of Change in the Behavior of LendersLenders
Share of HMDA loan applications rejected by lenders
Dramatic increase in lender rejections in HB 4050 zip codes
Consistent with stricter lender screening

Conclusion (I)Conclusion (I) What drives the decline in default and
delinquency? Selection of borrowers? Not entirely Selection of lenders? No Change in the behavior of borrowers? Not much;
awaiting counseling data Change in the behavior of lenders? Yes
Results are consistent with the idea that increased oversight drives lenders to screen
The heavy hand of legislation “helped” borrowers to choose less risky products. Less consistent evidence that informational content was helpful (more analysis required).

Conclusion (II)Conclusion (II) What will be the effects of a nationwide
implementation? Results should be generalized with caution Supply effects are probably overstated in the HB
4050 pilot Supply of mortgages less elastic in a nationwide
implementation (although capital could move to other segments of the economy)
Effects on demand and mortgage choice are likely to remain