Embed Size (px)
Citation preview
7/24/2019 Do Countries Falsify Economic Data Strategically - Some Evidence That They Might
http://slidepdf.com/reader/full/do-countries-falsify-economic-data-strategically-some-evidence-that-they 1/26
DOCOUNTRIES FALSIFY ECONOMICDATA STRATEGICALLY?
SOMEEVIDENCETHAT THEYMIGHT
Tomasz Michalski and Gilles Stoltz*
Abstract— Using Benford’s law, we find evidence supporting the hypothe-sis that countries at times misreport their economic data strategically. Wegroup countries withsimilar economic conditions and find that forcountries
with fixed exchange rate regimes, high negative net foreign asset positions,negative current account balances, or more vulnerable to capital flow rever-sals, we reject the first-digit law for the balance-of-payments data. Thiscorroborates the intuition of a simple economic model. The main results donot seem to be driven by countries in sub-Saharan Africa or those with lowinstitutional quality ratings.
I. Introduction
CONVENTIONAL wisdom tells us that governmentsmay lie strategically to the public about economic data
that they collect and later disseminate. The accusations thatGreece and Italy tinkered with their budget deficit figuresbefore joining the euro zone provide anecdotal examples.
Argentina hasbeensuspected of understating inflation figuressince mid–2007. The Hungarian government, according toits prime minister in a statement that leaked out, lied to thegeneral public about the state of the economy to win theelections in 2006. Ukraine misreported its level of reservesto the International Monetary Fund (IMF) between 1996 and1998. China is believed to embellish its GDP growth num-bers. Even the United States came under scrutiny after GDPgrowth revisions were consistently negative in the crisis thatstarted in 2008.1 At timesgovernments are caught red-handed(asHungaryandUkrainewere),butmostofthetime,itissim-ply unclear whether the data provided to the public are justinaccurate (because of, say, measurement errors or bad data
collection methods) or deliberately altered. In some cases,misinforming economic agents may bring tangible (possiblyshort-term) gains for a government; for example, Argentinaby misstating inflation figures avoided paying out higherinterest on government bonds indexed to inflation (whichshould have constituted in fact a partial default) and raising
Received for publication October 27, 2010. Revision accepted forpublication September 28, 2011.
*Michalski:HECParis;Stoltz:EcoleNormaleSupérieure,CNRS,INRIAand HEC Paris, CNRS.
We thank Ai-Ting Goh, Gilles Hillary, Bogumił Kaminski, Evren Örs,Martin Paldam, Romain Rancière, Tristan Tomala, Jaume Ventura, andthe participants at the ESSEC-HEC-INSEAD-PSE Workshop on FinancialEconomics, the Warsaw Economic Meetings 2010 conference, and theDEGIT XV conference for helpful comments and discussions. We aregrateful to the IMF for providing data. We thank two anonymous refereesfor their comments and suggestions. We are thankful to Dani Rodrik for theeditorial process.
A supplemental appendix is available online at http://www.mitpress journals.org/doi/suppl/10.1162/REST_a_00274.
1 For Greece’s actions beforejoining theeuro zone, see Miller(2004). Fora more recent account of releasing dodgy budget statistics, see Barber andHope (2010). For Italy, see Bream, Blitz, and Norman (2001). Argentina’sstory is described, for example, in Webber (2008)and O’Grady (2008). TheHungarian case is treated in Wagstyl (2007). Ukraine’s history is describedin IMF (2000). For accounts for China and the United States, see McSherry(2009).
the wages in the public sector. Greece enjoyed lower bor-rowing rates (close to Germany’s) on its government debt
because of its euro zone membership and because investorsdidnot know theentire extent ofGreek budget troubles. Giventhese examples, there are two important questions to ask. Is itpossible to find instances when countries or groups of coun-tries engage in misinforming economic agents? Is there somecommon characteristic that these countries share?
In this paper we use a statistical test based on the dis-tribution of first digits of economic accounting data (alsoknown as Benford’s law) to test whether countries falsify theeconomic figures that they report. Benford’s distribution of the first digits arises naturally for many different types of data. This is true for processes with exponential growth orproducts of independent random variables, that is, in appli-
cations for many economic data due to inflation, economic,or population growth in the presence of stochastic shocks.This property is preserved under multiplication by a commonfactor, so will survive conversions into different currencies.Benford’s distribution arises when data from many differenteconomic processes (that is, from many countries) are con-sidered together. Deviations from Benford’s distribution mayflag data reporting irregularities.
A. Our Data Set
In our tests, we use quarterly balance-of-payments (BoP)datafromtheIMFforyears1989to2007,forseveralreasons.2First, these accounting data are available for many countriesfrom the same source. Second, there were instances wherecountries were either caught (Ukraine) or suspected (Russia,The Gambia, China, Chad, Sierra Leone, Egypt, and oth-ers) of misreporting this particular kind of datum. Next, thefirst digits of each BoP entry should conform with the Ben-ford’s law, andthe more so when data from multiple countriesare considered (when heterogeneity is introduced). More-over, the data are somewhat standardized (among countriesand across time) as they should be prepared by providersaccording to an IMF manual. They offer a lot of data pointsrelative to other data on economic fundamentals. Also, theyarenottransformedmanytimes(andifthebalanceisrecordedin U.S. dollars, it is not transformed at all), something that
could worsen their statistical properties.3 Moreover, becausethe data are quarterly, they include series that are closelywatched by investors so that countries may have an incentiveto misrepresent them. One would wish naturally to extend
2 Section IIIA details why some other statistical series of interest were notchosen for scrutiny.
3 Nye and Moul (2007) found that economic series transformed manytimes with imprecise procedures (for example, relying on inaccurateexchange rates) may not obey Benford’s law. They advise working withthe raw, nominal data.
The Review of Economics and Statistics, May 2013, 95(2): 591–616© 2013 by the President and Fellows of Harvard College and the Massachusetts Institute of Technology
7/24/2019 Do Countries Falsify Economic Data Strategically - Some Evidence That They Might
http://slidepdf.com/reader/full/do-countries-falsify-economic-data-strategically-some-evidence-that-they 2/26
592 THE REVIEW OF ECONOMICS AND STATISTICS
our tests to other types of macroeconomic data, but the sizeof the task just for the series at hand is already substantialenough.
B. Detailed Methodology
We first advance theoretical arguments and review the lit-erature on why the economic processes of interest shouldadhereto Benford’s law. Then we show that forourentire dataset, we cannot rejecta Benford’s distribution of thefirst digits.Before putting our data to a closer test, we develop a simplemodel (taking into account the characteristics of our data set)that gives insight into why and when countries would strate-gically misinform investors (economic agents) on the serieswe study. Our story is simple: a country may want to hide itstrue state of the world to prevent capital outflows or attractinflows. Next, we group countries in different relevant cate-gories indicated by our model andinvestigate whether we canreject the hypothesis that the distribution of the first digits of data that they provide complies with Benford’s distribution,which would be consistent with data manipulation.
C. Results
Using BoP data, we find evidence that countries with fixedexchange rate regimes, those with high negative net foreignasset positions or negative current account balances, haveeconomic data that have irregular, non-Benford behavior of the first digits. We reject Benford’s law for series from manygroups of countries that would be more vulnerable to capitalflow reversals (those with fixed exchange rates and relativelyhigh capital openness; countries with both current and fiscaldeficits). Euro-adopting countries have unusual distributions
of first digits in the reported accounts after they join theeuro zone. Our main results do not seem to be driven byincluding countries in sub-Saharan Africa or those with lowinstitutional quality ratings in our samples.
D. Interpretation
Because the rejections of the Benford distribution for thefirst digits of data occur for specific groups only and notfor their complements in the data set (for fixed exchangerate regimes but not floating ones, or countries with low netforeign assets but not those with high net foreign assets),our results are consistent with the hypothesis that vulnerablecountries, as indicated by our model, strategically manipulatethe data. These rejections are rather category than countryspecific, as data from many countries for different quartersenter different categories. For example, if a country changesits exchange rate regime or the sign of the current accountwithin the range of our sample, its data will enter differentcategories for different quarters.4
4 We do not claim that necessarily all countries belonging to a particu-lar group are responsible for a discrepancy; this may be driven by a fewcountries only. We control whether the exclusion of one country at a timechanges our results.
These rejections of Benford’s law should not be drivenby some perverse statistical features of the data. We correctfor possible persistence or statistical breaks in the data bydeveloping a specific randomization procedure and developits critical test values by simulations. We want our rejectionsof the null hypothesis to be corroborated by both traditional
P-values of chi-square tests, but also with our developed testsbased on selecting a fraction of the data at random that wecall 1-in-5, 1-in-10, or 1-in-20 criteria. We group many coun-tries sharing similar economic characteristics together so thatdata heterogeneity and shorter time series for more countriesin each group are typically considered than in, for exam-ple, a purely geographical division of countries (we want tohave at least 1,100 observations so as to be able to use the1-in-10 criterion). This should allow a better adequation toBenford’s lawfor finitesamples(see section IVA).5 The rejec-tions for some categories (for example, among fixed versusfloating division) existfor groupscomprising a largernumberof countriesthan the nonvulnerablegroups,again favoringthe
strategic argument.We doubt that therejection of Benford’s distribution for thefirst digits of the data formany groupsof vulnerable countriesaccording to our model is due to just poor data collection andnoise in the data in those countries. Large positions in theerrors and omissions section of the BoP data may indicate,of course, that the data collection process in a given countryis of low quality or that there is a great amount of illicit orunrecorded transactions, but if there are no manipulations,the first digits of the series (even when incompletely regis-tering transactions) should still adhere to Benford’s Law (seesection C.2.1 in our 2011 working paper, published as anonline supplement, which we refer to as MSWP). When we
look at the tests based on the less persistent series, there islittle evidence thatcountrieswith poorinstitutions have unex-pected first-digit distributions. If the rejection of Benford’sdistribution were caused by poor data collection, the first-digit distribution of the less persistent series should be alsoaffected. Moreover, robustness checks show that excludingcountries in sub-Saharan Africa or those with low institu-tional quality ratings as measured by World Bank WorldGovernance Indicators (WGI), such as government effective-ness or rule of law, does notchange ourmain conclusions (seesection VF).6 Observing various vulnerable categories, weobtain stronger results for countries with more open capitalmarkets,which tend to be countrieswith betterdata collection
methods as well. Also, because we find evidence for coun-tries that would appear (at least in the short run, according toour model) to benefit from misinforming investors, we do notthink that the data suffer from rounding errors; if that were
5 For example, the subsets of countries that have fixed exchange rateregimes contain manycountries (49 countrieswith 26.6 quarters on averagefor the stable sample and 84 countries with 32.6 quarters on average for thefull sample), so we believe, based on section IVD, that neither persistencenor structural breaks are driving our results.
6 Young(2009) questions the quality of growth or price statistics providedbyofficialsourcesinsub-SaharanAfrica.Weexcludesuchcountriestoshowthat they do not drive our results.
7/24/2019 Do Countries Falsify Economic Data Strategically - Some Evidence That They Might
http://slidepdf.com/reader/full/do-countries-falsify-economic-data-strategically-some-evidence-that-they 3/26
DO COUNTRIES FALSIFY ECONOMIC DATA STRATEGICALLY? 593
so, we would find rejections of the null hypothesis across theboard. The irregularities may not be caused merely by regu-lar and expected interventions of authorities; for example, if we exclude the item of reserves, which is directly affected bycentral banks, we still draw the same conclusions for the firstdigit distributions of countries grouped by fixed and floating
exchange regimes.Relying on our evidence, which supports our economic
model, we conclude that countries at times may falsify eco-nomic data strategically when it suits their interest. Thiscalls for the inclusion of strategic information provision bygovernments in models where public signals are important.
E. Caveats on the Practicality of Our Method
Unfortunately, due to data limitations of macroeconomicseries (too few points per each series), our methods do notallow us to detect which country at what point provided falseinformation. We do not know how grave the possible infrac-tions were. Moreover, we cannot exclude that some of theobserved effects would be just price tag effects, though thelatter are likely to appear in nominal currency rather than inU.S. dollars. For example, a country might report instead of adeficit on the trade balance of 2.01 billion in a local currencyone that is slightly lower, say, at 1.99 billion. Our task is com-plicatedby the fact that countries may not cheat all of the time(serial cheaters might be found out quickly); detecting fraudin one or two quarters when many quarters of the data arepresent is then unlikely. Out of necessity, we are also work-ing with data that are sometimes revised and sent to the IMFseveral quarters after initial revelation. The tests also cannotdetect some instances of cheating—for example, if a coun-
try changes all its items by a common factor or if it changesthe numbers preserving the Benford’s first-digit distribution.It is also hard to envisage which digit would be favored inany potential infractions; this is because investors may pos-sess some information of their own and the country may notstray too far from either past values or investor expectationsin order to appear credible in its announcements.
F. Literature Review
The tests we employ are used by accounting practitionersto detect fraud in company accounts (see Nigrini, 1999, for
examples). Varian (1972) suggested using Benford’s law totest the naturalness of the data and adequacy of the numbersproduced by forecasting models. These tests were not widelyused in international (macroeconomic) comparisons; there istypically a lack of enough suitable data to boost the statisticalpowerof such tests that renderthese methods impractical,anduntil recently (for example, at the time of writing of Varian,1972) the theoretical processes generating this distributionwere not well understood.
To our knowledge, two studies use Benford’s distributionto inspect macroeconomic data so far. Nye and Moul (2007)
provide evidence (and also simulations of economic quan-tities) that widely used international macroeconomic datasuch as the GDP series in the Penn World Tables exhibitfirst digits that in general conform to Benford’s distribution.The data, however, do not conform to Benford’s law for non-OECD countries, posing questions about data quality; the
alteration of data might come from the source (falsificationor simply from an inefficient data collection infrastructure inthe considered countries) or inaccurate data transformations.Gonzalez-Garcia and Pastor (2009) follow a similar exer-cise and extend the analysis to annual IMF data. Their mainconclusions are threefold. First, they find that most macroe-conomic series theystudy follow Benford’s law. Second, afterobserving some series for individual countries (GDP for Fin-land and Japan), they claim that structural breaks in the datamay lead to a failure of Benford’s law to hold in practice (asthey work with a small number of observations) for countriesthat according to the IMF possess high-quality data.7 Third,and most interesting, they find no convincing link between
independent assessments of data quality collection methodsin country groups and rejections of Benford’s law for thefirst digits of data, which may be consistent with our story.None of these papers, however, provides a model as to whycountries would misreport data and do so strategically. Thefocus of these two papers is about assessing the quality of data used in empirical work. In these two studies, countriesaregrouped based on geographicalcriteria, which in fact maynot be useful (Why should all African countries be lumpedtogether?), whereas we use groupings based on relevant eco-nomic criteria, which allows drawing some conclusions oncategory-specific behavior. Our groupings also should havemore data heterogeneity because we consider shorter time
series for more countries in each group rather than in apurely geographical division of countries. This should allowbetter adequation to Benford’s law for finite samples (seesection IVA). It also appears that the indicated references donot correct for the possible persistence or structural breaksof the economic series, which could lead to false rejectionsof the conformity of the realized first-digit distribution withBenford’s law, while we address this issue; Gonzalez-Garciaand Pastor (2009) notice only the possibility of structuralbreaks for single series. We sidestep these issues by aggre-gating data across many countries and using a procedure toselect the series at different dates to be tested randomly (seesection IVD for details).
From the existing literature, it is clear that the public signalis important for economic agents. The research on countries’truthfulness in information provision, however, is meager todate. The problem is that economic agents cannot readilyverify whether the information issued by a government is
7 This qualification is important; the presence of structural breaks in thedatamaybeduetochangesindatacollectionmethodologyandawaytoblurthe measurement of some economic quantities. The discussions about theaccuracy of measures of unemploymentor the budget deficitunder differentmethodologies are perennial.
7/24/2019 Do Countries Falsify Economic Data Strategically - Some Evidence That They Might
http://slidepdf.com/reader/full/do-countries-falsify-economic-data-strategically-some-evidence-that-they 4/26
594 THE REVIEW OF ECONOMICS AND STATISTICS
of low quality (that is, imprecise) or whether the govern-ment in question is supplying deliberately false information.8
Each government or statistical authority has some leeway inproviding the various numbers describing the state of theeconomy as long as these are not too far off from the publicexpectations and as long as these subsequently can be put
in the errors or omissions sections. Related to our topic isthe literature on public signals and transparency under strate-gic uncertainty, represented by Morris and Shin (2002) orAngeletos and Pavan (2007) and explicitly in the contextof a currency attack by Heinemann and Illing (2002). How-ever, the notion of strategic investor misinformation has notbeen considered in this literature to our knowledge; a cen-tral authority can control at best the precision (the variance)of the public signal that the investors get, which is not thesame as what we mean here.9 Note, however, that changingthe precision of the signal would not constitute data manip-ulation and our tests would not pick it up, as the data thatwould be generated should still then adhere to Benford’s law
(see the arguments in section IVA). Angeletos, Hellwig, andPavan (2006) and Tarashev (2007) offer models where thegovernment chooses a signal (the interest rate) to inform thepublic about the state of its economy. This affects the costof the agent’s later decision. But providing false informa-tion is a different issue; the agents may not know well theinformation policy of the government and (provided that theagents do pay attention to what the government says), thisinformation may affect the belief formation in one way orthe other. Extending the work of Obstfeld (1986, 1996) andanalyzing a second-generation currency crisis model withoutany strategic uncertainty, Sbracia and Zaghini (2001) note,without modeling the strategic choices of a central author-
ity, that greater precision of public information may stop anotherwise imminent attack when the state of the economy isbad and that the contrary is true when the state is good. Thisopens up the question of whether the government would liketo use the information that is provided to its advantage. Ona different note, Sandleris (2008) argues that a country mayrepay sovereign debt in order not to reveal unfavorable infor-mation about the state of its economy. The literature on thestrategic delay of information release is related but does notapply here. The large literature on dynamic inconsistency andlimited commitment started by Kydland and Prescott (1977)is not relevant in this context, and neither is the literature onmoral hazard with ex post verifiable actions.
Successful misinformation by a government may seempuzzling and is rarely taken into account, as it appears atodds with the assumptions of rational expectations and theeconomic agents’ knowledge about the true state of the world
8 Institutions like the IMF and Eurostat can verify at least partially theinformation that is given out by the country, but this does not solve theproblem entirely.
9 Adifferentnotionisthatofvagueness,whenapolicymakerwouldreleasea set of signals containing the true one to be informative in the equilibrium.See Stein (1989), based on the model of Crawford and Sobel (1982). Gelosand Wei (2005) show empirically that funds invest less in less transparentcountries.
employed in many models.10 In some models with strate-gic uncertainty, information is aggregated through individualtrades into prices, and hence the government’s influenceover the information known to market participants may beextremely limited. This, however,may be nottrue allthe time;for example, in a fixed exchange regime where an important
price, the exchange rate, is fixed, the shadow price (the realexchange rate) must be calculated based on the statistics pro-vided by the government. A fundamental question is whyindividuals (knowing that the government may reveal infor-mation strategically) would pay attention to public signals atall. However, the basic conclusions of the literature on one-sided private information when signaling is not possible (seefor example, Aumann, Marschler, & Stearns, 1995; Craw-ford & Sobel, 1982; or Benabou & Laroque, 1992) are thatthis can be the case, and partial information revelation maybe an equilibrium. Another question is whether the abilityof governments to provide false information is permanent or
just temporary; in the long run, serial cheaters may be found
out. This paper, by providing some evidence on the strategiccharacter of government release of public signals, providesan incentive to continue and expand theoretical research inthese fields.
G. Organization of the Paper
The paper is constructed as follows. First, we discuss thereasons for which countries would want to misreport eco-nomic data. In section II, we lay out a model of internationalfinancial flows and country incentives to misinform investorsabout their state of the economy. In section III, we justifythe choice of our data set and describe the data we use.In section IV, we discuss the theory behind Benford’s lawand the statistical methodology for our data set. Section Vreports and interprets the evidence, and section VI concludes.The proofs of the results stated in section II are included inthe appendix. Other material, such as extended proofs, fullsample results, and robustness checks, is in MSWP.
II. Misreporting Economic Data to International
Investors: A Model
We provide a parsimonious open economy model wherewe study the incentives of countries to provide false infor-mation to investors. We study a one-shot game of incompleteinformation. (All proofs are relegated to the appendix). Sup-
pose first there is a continuum of identical countries indexedi ∈ [0, 1] with a population of immobile workers Li ≡ 1and endowed with immobile capital installed C i ≡ C > 0.There are in total K units of mobile capital in the world;for simplicity, these are owned by some agents that have no
10 The Billion Prices Project by Alberto Cavallo and Roberto Rigobon isan initiative by private agents to gather information in lieu of governmentagencies (in this case, on the evolution of prices). This way of substitutingthe government, however, is limited by what can be observed by economicagents themselves. In the case of the BoP or GDP data, a similar project ishard to envisage.
7/24/2019 Do Countries Falsify Economic Data Strategically - Some Evidence That They Might
http://slidepdf.com/reader/full/do-countries-falsify-economic-data-strategically-some-evidence-that-they 5/26
DO COUNTRIES FALSIFY ECONOMIC DATA STRATEGICALLY? 595
domicile but have to invest this capital in at least one of theaforementionedcountries. Thereare free capital flows amongall countries and perfectly competitive markets for the fac-tors of production within each country. The remuneration of factors equals their marginal productivity.
To model a country’s incentives, suppose that the news
about each country’s BoP data can be either good (g) or bad(b) reflecting the underlying state of a country’s economy. 11
For each country i ∈ [0, 1], we denote its state by si ∈ {g, b}.The state of the economy is modeled as a multiplicative pro-ductivity parameter, and denoting by A a common parameterfor all countries, one has A(g) > A(b). Each country hasthe same technology and the statistical process generating aperiod’s news, as well asΦ > 0, the present discounted valueof punishment for being caught lying.12
There is only one period. For all countries, a good stateoccurs with a common probability ρ̂, which is drawn fromsome distribution ρ on [0, 1]. Since there is a continuum of countries, this results, by the law of large numbers, in respec-
tive fractions ρ̂ and 1 − ρ̂ of the countries being in good andbad states. The distribution ρ is common knowledge, but theactual probability ρ̂ of a good state is initially unknown tothe countries and investors. The sequence of moves is thefollowing. Each country i ∈ [0, 1] learns its own true state of productivity si ∈ {g, b} and then declares it (truthfully or not)as d i ∈ {g, b} to investors simultaneously with other coun-tries; we denote by ρ̃ the fraction of countries declaring agood state. Investors observe country declarations and thenmake decisions on where and how much to invest. We denoteby K i(d i, ρ̃) the total capital invested in country i (includingthe immobile capital C ). Then the period ends, investmentsare realized, and the payouts (including punishments, if any)
are made.We assume that the production function in country i,
Y i = A(si) F
K i(d i, ρ̃), L i
= A(si)
K i(d i, ρ̃)
α Li
1−α, (1)
is Cobb–Douglas with the capital intensity 0 < α < 1. As Li = 1 for all countries i , we do not analyze the model inper capita form. Let R i(si, d i, ρ̃) be the return to a country,and let ERi(si, d i) = E
Ri(si, d i, ρ̃)
be its expectation (with
respect to the distribution ρ). We assume that each countryi cares about its gross national product (the remuneration of
domestic factors), Ri = wi Li + r iC i where wi is the wage andr i is the return to (domestically installed and owned) capital.
11 The model is stylized. The application to the BoP data we use can beunderstood that good or bad data about the BoP will increase or decreasepotential flows if declared truthfully by a country and the country desires(given the production functions and its objective to maximize GNP) toattract as many flows as possible. Good data about the BoP may mean thata country is less risky and offers higher returns to potential investors giventhe same level of flows.
12 This punishment may not occur with certainty. In reality, it may bevery difficult for investors collectively to learn that a country misstated itsinformation.
With the above assumption on the production function, thistranslates into
Ri(si, d i, ρ̃)
= A(si)(1 − α)
K i(d i, ρ̃)
α
+ α
K i(d i, ρ̃)
α−1
C
.
(2)
Country i’s payoff is increasing in the state of the world si
and in the installed (immobile) capital C .We discuss only an equilibrium when a fraction of coun-
tries always lies, but investors analyze the declarations,obtain information from these, and make rational investmentdecisions nevertheless.13
In this equilibrium, countries that receive a good statesi = g report truthfully g; a fraction ϕ ∈ [0, 1] of countriesthat receive a bad state si = b declare a good state g knowingthat they will obtain in expectations a penalty Φ; the rest of those receiving the bad state (1 − ϕ) declare it as such. As
we show in proposition 6 (in the appendix), at equilibrium,the investors deduce ϕ from the knowledge of Φ. Since, inaddition, countries’ strategies do not depend on ρ̂, which isunknown to them when making the declarations, one has thatρ̃ = ρ̂+ϕ(1 − ρ̂), and investors learn the true ρ̂ from observ-ing ρ̃. Investors wish to maximize their ex ante return frominvestment(thiswill be the characteristic of any equilibrium);hence, they will allocate capital K so that the marginal returnfrom investment in countries declaring a good or bad stateof the world is equalized: at equilibrium, the invested capitalK i(g, ρ̃) and K i(b, ρ̃) do not depend on the countries i (giventhat C i ≡ C for all i), and their common values K (g, ρ̃) andK (b, ρ̃) satisfy14
α ρ̂ρ̃
A(g) +ϕ(1 − ρ̂)
ρ̃ A(b)
K (g, ρ̃)
α−1
= α A(b)
K (b, ρ̃)α−1
. (3)
Existence of this equilibrium is shown in the appendix.When Φ is high enough, all countries always make a truthfuldeclaration about the state of their productivity and ϕ = 0.
Proposition 6 (stated in the appendix) guarantees the exis-tence of a one-to-one mapping ϕ ∈ (0, 1) → Φ, and thefollowing result indicates that this mapping, and its inverse,are decreasing: the weaker the punishment, the more thatcountries lie.
Proposition 1. The fraction ϕ ∈ (0, 1) of liars at equilib-
rium strictly increases as the punishment Φ decreases.
13 The “babbling” equilibrium, as in games of cheap talk (Crawford &Sobel, 1982), where countries randomize their declarations and investorsignore the messages sent by countries, does not exist here. This is becausethere is a positive punishmentΦ,socountriesthatwouldrandomlyliewouldbe punished: lying has consequences.
14 We assume that the endowments of capital C i are such that even whenbeing in the bad state b, each country would receive some internationalflows.
7/24/2019 Do Countries Falsify Economic Data Strategically - Some Evidence That They Might
http://slidepdf.com/reader/full/do-countries-falsify-economic-data-strategically-some-evidence-that-they 6/26
596 THE REVIEW OF ECONOMICS AND STATISTICS
In the analyzed equilibrium, investors maketheirdecisionsrationally; there is some information transmission betweencountries and the investors, and some fraction of countries islying about their state of the world.
Wenowperformsomecomparativestaticsandinterprettheimplications of the model for the data. We use the implica-
tions stemming from these propositions to partition countriesinto different groups that should display different behavior inmanipulating (or not) their messages.
Proposition 1 does not handle the case if there were differ-ent groups of countries with different levels of punishment(the size of which is common knowledge). Investors wouldview differently each group of countries, but still they wouldwant to equalize the ex ante return to capital on both groups.Suppose there are two groups that vary in the punishmentcosts of misreporting, respectively denoted by Φ < Φ:15
Proposition 2. Countries in the group with the lower pun-ishment cost Φ have a higher fraction of liars at equilibrium.
LetΘ be thecostof abandoning a fixed currency regime forcountry i if the period capital flows were low after the countrytruthfully declared si = b. This means, ceteris paribus, givena penalty Φ, that the effective penalty for misreporting forsuch a country is lower when the true state is si = b. Hence,proposition2showsthatifthecountrieshavethesamelevelof installed capital C ,acountrywithafixedexchangeratewouldmore likely provide false information than a country witha more flexible currency arrangement if they had the sameopenness to capital flows. Also, if some countries are facinghigher punishments because of their previous misreportingor sovereign defaults, proposition 2 tells us they would beless likely to misrepresent their statistics.
We now show that countries with less installed capital(lower C i) and therefore relying more on foreign investmentwill have higher incentives to lie. For clarity of expositionwe again assume that there are only two groups of countries,with respective installed capitals C < C .
Proposition 3. Countries in the group with the lower installed capital C have a higher fraction of liars at equi-librium.
When we turn to our data (see section IIIfor a description),we will interpret the last observations in the following way.Countries with high negative asset positions (that is, relyingstrongly on foreign capital), having a need to finance their
negative current account or a fiscal deficit and at the sametime open to capital flows, should have higher incentives tomisreport their true state of the economy.
In what we have assumed so far, capital flows were unre-stricted for the mobile international capital. Suppose nowthat there are barriers to capital flows to some countries, sothat only a fraction τ < 1 of any investment is obtainedex post. Then, ceteris paribus, a country with no barriers
15 Thearguments in propositions2 to 4 canbe extended tocountably manydifferent groups.
will have higher incentives to misinform investors in the badstate of the world because the resulting relative capital flows(when claiming the good versus the bad state) will be moreimportant:
Proposition 4. Countries with lower barriers to capital
flows have a higher fraction of liars at equilibrium.
When the economic state of the world (realized ρ̂) is lowerthan the expectation of ρ, the fraction of liars among allcountries is higher:
Proposition 5. The lower the ρ̂ , the more countries arelying.
This may not be the necessarily true during all “crisis”years when the fraction of countries receiving a bad state of productivity is high, if such an outcome was expected.
A. Punishments (possible extensions)
We assumed that the punishmentΦ is constant and that theinteraction is one shot only. A more complex model could bedelivered; for example, investors may punish a country thatlied by not investing in it in the future for at least some time.We chose not to model such an interaction, as in repeatedgames, there are many punishment structures that could sus-tain different equilibria. Which one investors would use isan empirical question that was not resolved even in the oft-studied sovereign debt literature. We also did not do it forparsimony. Benabou and Laroque (1992) provide a modelwith the stage game with similar features to ours (thoughwith players’ payoff functions that are easier to analyze)where many different equilibria with repeated interactionsare characterized depending on the initial assumptions.16
III. A Convenient Data Set: IMF’s Balance-of-Payments
Statistics
A. Choice of Data Set
We choose a data set to make detecting misreporting (if any occurs at all) possible given our methodology. We seekeconomicseriesthatcouldbemanipulatedbythegovernmentand at the same time easily observed by investors. The indi-cators in question should also theoretically follow Benford’s
law. For our tests to have rejection power (see section IV), werequire a lot of comparable data. Certain other characteris-tics are also desirable for a data set to be adequate (explainedbelow).
For theoretical reasons later described in section IV asproperties P1 to P3, we do not expect inflation, interest
16 These authors studied the problem of an informed agent that, exceptfor passing her private information to other noninformed traders, can tradeon this information herself. The game studied there is a game of cheap talkwhen regarded as a one-stage game, and then a repeated game analysis isprovided.
7/24/2019 Do Countries Falsify Economic Data Strategically - Some Evidence That They Might
http://slidepdf.com/reader/full/do-countries-falsify-economic-data-strategically-some-evidence-that-they 7/26
DO COUNTRIES FALSIFY ECONOMIC DATA STRATEGICALLY? 597
rates, the fiscal deficit (as a percentage of the GDP), orany indicators that are growth rates with some time-invariantexpectation (GDP growth, changes in industrial production)to follow Benford’s law. These series do not satisfy prop-erty P1 stated in section IV. In addition, for such series, itmight also be difficult to obtain enough heterogeneity so
that property P2 works. In contrast, we expect that moneysupply, public debt (stock), budgetary entries (data in lev-els), output (level data), and BoP entries should follow thelaw. Taking data from many countries (distributions) shouldincrease adherence to the Benford’s law (by property P2; seesection IV).
There are few statistics for GDP or industrial productionavailable for each quarter for a wide range of countries, andsome of these (fiscal data, for example) are available onlyyearly. Comparable public sector debt data for most of thecovered countries in the Public Sector Debt Statistics data-base from the World Bank/IMF are available only since 2009.For external debt in the World Bank/IMF Quarterly Exter-
nal Debt Statistics, more extensive quarterly coverage forcountries starts with 2003 to 2005.17 With a small numberof observations in the data sets, it is difficult to group coun-tries according to their economic characteristics and reducepersistence by considering randomly selected subsets.
A different issue is whether the data are measured (as aflow, for example) or artificially constructed (as an index).18
Industrial production and price levels are indices, so are not“natural” data. Geometrically increasing sequences like theBoP entries and fiscal data are convenient and guarantee ona theoretical side conformity to Benford’s law. Ideally, wewould likemeasuresthat are calculated usingsimilarmethod-ologies from country to country and that do not involve many
transformations of the data. Moreover, some macroeconomicdata are only one-of-a-kind and so do not comprise compre-hensive accounting data sets. Finally, possible persistence inthe series may make rejection of Benford’s law easier.
Data sets on BoP, fiscal data, and money supply sat-isfy most of these requirements. We chose to investigatequarterly BoP data from the IMF balance of payments statis-tics (BOPS) from the International Financial Statistics (IFS)database for the period 1989 to 2007.19 They had some addi-tional advantages over other data sets.20 Available quarterly,these are accounting data containing net values, which helpscounter the problem of persistence that could lead to eas-ier rejections of Benford’s distribution for the first digits in
finite samples (see section IVD). These data are provided
17 The troubling lack of availability (with speculations why such trans-parency could be caused by) of precise debt data even historically ishighlighted, for example, by Reinhart and Rogoff (2009).
18 Nye and Moul (2007) advise against using indices for testing the good-ness of fit to Benford’s law. Statistical methodologies used in constructingsuch indices and seasonal adjustment may worsen the “naturalness” of thedata.
19 The data were accessed at the IMF website on December 31, 2009.20 In further work, we analyze variousfiscal datasets to uncoverpatternsof
rejection of Benford’s law. Most fiscal data sets contain yearly data, whichleads to relatively few data points available for a large number of countries.
by statistical agencies of IMF member states and should beprepared in a standard way, using the IMF’s (1993) BoPmanual. The data are in U.S. dollars, which means that theywere minimally transformed (for the importance of this, seeNye & Moul, 2007) given the fact that most internationaltransactions are conducted in this currency. Moreover, many
countries keep track of the BoP in U.S. dollars (among themare Poland, Romania, and Taiwan). The fact that the BoPdata are converted to U.S. dollars should preserve the Ben-ford’s distribution of the digits if the original distributionindeed is Benford (section IVA), but the distribution wouldremain non-Benford if it were such initially. Currency con-version may also help to avoid some structural breaks likecurrency reforms, hyperinflation, or rapid disinflation thatwould appear in the domestic currency data.
Why would countries manipulate the BoP data? BoP dataare crucial for fixed exchange rate regimes and countries withhigh net foreign liabilities. In a fixed exchange regime, thevalue of the information coming from the BoP is even higher
to agents as the exchange rate (which would otherwise con-tain aggregate information about the underlying transactions)in a credible regime is expected not to change. A sustainedcurrent account imbalancemay point to a misalignmentof thereal exchangerate that maybe (abruptly) corrected by a deval-uation or depreciation of the country’s currency. A depletionof reserves without a possibility of borrowing liquidity maylead to a BoP crisis as in the literature started by Krugman(1979) or to a currency attack. Moreover, investors obtainvaluable information from the BoP that helps them assess thereturns to capital (and their riskiness) withinthe country in thenearest future.21 For example, changes in reserves or changesin the volume and composition of the current account items
have implications for the ability to retire capital (for possiblecapital flow restrictionsin thefuture),the probability of a suc-cessful speculative attack (that would diminish the valuationof the assets held in the local currency), or the solvency (orpossible illiquidity) of the country and the firms located thereand potential macroeconomic adjustment needed in case of arapid correction of any current account imbalances. Reinhartand Rogoff (2009) include among the best few predictors of banking and currency crashes (compiling from the rich liter-ature on early crisis indicators), respectively, the short-termcapitalinflowstoGDPratiocurrentaccountbalanceorinvest-ment, current account balance to GDP ratio, and exports. Inthe view of this, a government may want to lie on the BoP
21 For example, Standard and Poor’s (2008) analyzes the structure of thecurrent account, the composition of capital flows, and reserve adequacy toassess a sovereign’s rating. It usesindices composedof different itemsof theBoP (balance on trade, FDI, portfolio flows, reserves) in its assessments.Imperfect as it may be, the sets of indicators published in the economicpress may be telling as to what draws the most attention. For example, inThe Economist , the set of indices covered on a regular basis include GDPchange (%), industrial production change (%), consumer prices change(%), unemployment rate (%), trade balance (flow), current account (flowand % of GDP), budget balance (% of GDP), and interest rates (%). In theIMF World Economic Outlook issues, the main indicators include output,inflation, fiscal balances, trade volumes and prices, current account, capital,and financial account transactions.
7/24/2019 Do Countries Falsify Economic Data Strategically - Some Evidence That They Might
http://slidepdf.com/reader/full/do-countries-falsify-economic-data-strategically-some-evidence-that-they 8/26
598 THE REVIEW OF ECONOMICS AND STATISTICS
data, for example, to steer the market expectations to a goodequilibrium (as in second-generation currency crisis models),avoid capital flight, or attract investment to cover a currentaccount or a fiscal deficit.
Thereareseveralinstancesofcountriesthatweresuspectedof changing their BoP entries or caught doing so.22 Russia
and The Gambia were charged of being guilty of overstatingreserves,with Ukraine (see IMF, 2000) being the most blatantcase. Chad and Sierra Leone were not disclosing externalarrears that they ran in breach of the agreements with theIMF. China was accused of understating its trade surpluses.Analysts and commentators point in several cases to doubtsabout the veracity and accuracy of data (Egypt in 2005, butmany other instances can be found) when the size of the neterrors and omissions may seriously alter the current accountbalance shown by a country (for example, putting it into anegative territory). All of these cases, except for China (thecountry is not in the IFS data for 1989–2007), are found incountries that were at the time of the accusations dependent
on capital flows or international aid. B. Data Description
For our BOPS data set, we chose the initial date of 1989because prior to that year, the data are available for few coun-triesandinternationalcapitalflowswerethenrelativelysmall;also, after 1989, many new countries emerged that start pro-viding statistics. We use quarterly data that investors oftentake into account while making their decisions. Yearly dataoccur with a lag and may not be as informative (so maynot be actively falsified); moreover, we would get four timesfewer data points. Monthly data are available for only a fewcountries on a regular basis.
We take all the net figures from the BoP so as to lowerthe problem of persistence.23 We consider this to be aninnocuous but a helpful fix. Net values like the current orfinancial account balances are given by many countries toinvestors before any gross items are available. Theoretically(see section IVA), a difference of almost all two exponentialsequences (so, net values) will also have a Benford behaviorof the first digits. We consider all entries (also net errors andomissions); because the BoP items should sum up to 0, a typ-ical manipulation would require changing at least two series.Net errors and omissions is an item that can be inflated to hideunfavorable current account data (“Egypt 2004/5,” 2005). Allin all, we have at most thirteen entries per country for each
quarter, so 76 quarters of data, at most 988 observations foreach country.24 More detailed statistics for the BoP are not
22 ForRussia,Jack (1999); forChina, Ruskin(2003). For Chad, TheGam-bia, andSierraLeone, seetheIMF pressreleasesfrom 2003,2005,and2006,respectively. Doubts about Egypt’s figures are “Egypt 2004/5” (2005).
23 Some items,like neterrorsand omissionsor,for many countries, capitalaccount: net are reported only in net values.
24 These are current account: net; goods: net; services: net; income: net;current transfers: net; capital account: net; financial account: net; directinvestment: net; Portfolio investment: net; other investment: net; financialderivatives: net; reserve assets: net; net errors and omissions. We have notinvestigated any non-net series.
available for a large set of countries and often come with aconsiderable lag.25
We have data for 103 countries for the period 1989 to 2007with 69,287 observations on the first digits. Because the max-imum number of observations is then 101,764 (103 countrieswith 13 items reported over 76 quarters), a considerable num-
berof observationsare missing. Many of these missing valuesappear not to be random, stemming from the fact that coun-tries did not report all BoP entries (especially those that weresmall) for several consecutive quarters (or at all) at the begin-ning of the studied period, but started doing so regularly withtime. In the first quarter of 1989, we have 517 observations;for the last quarter of 2007, we have 1,167. An example of an entry that has this pattern is “Financial Derivatives: Net,”with only 3 countries reporting it in the first quarter of 1989and 45 countries in the last quarter of 2007. We find 32,456missing observations that are missing in consecutive quar-ters (so that only 21 of the missing observations occur inone quarter only). Among them, we lose at least 4,628 obser-
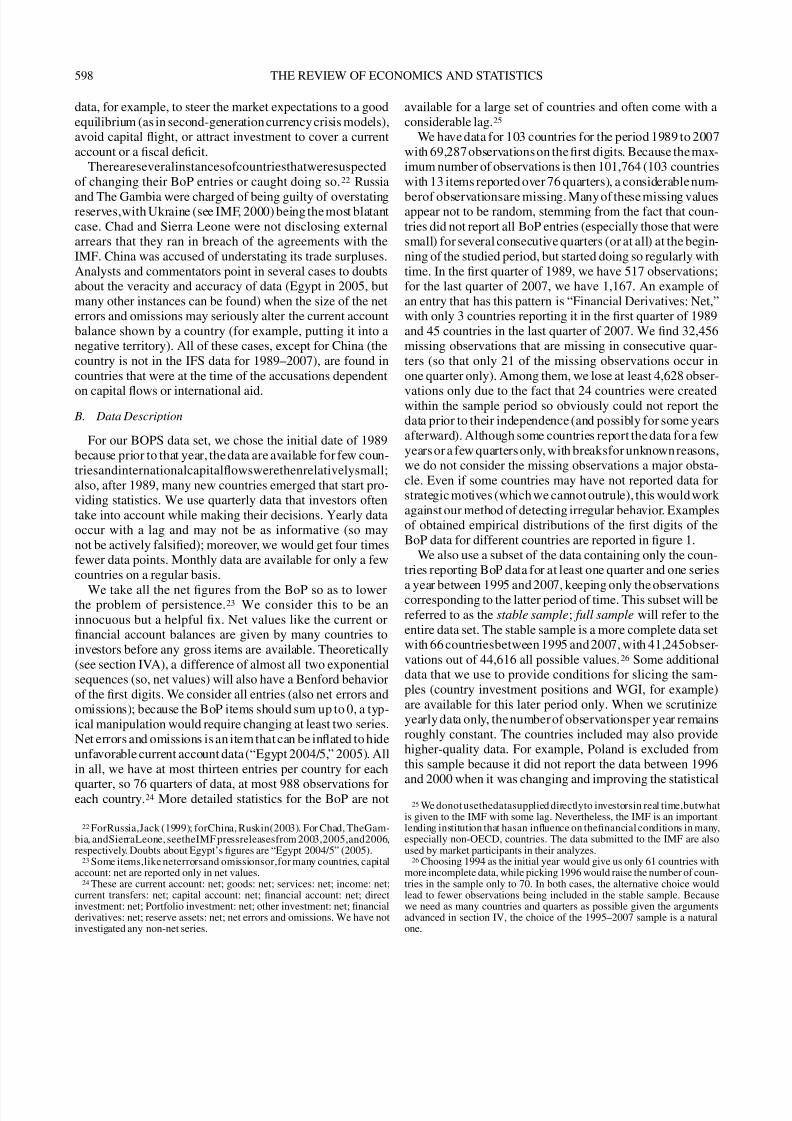
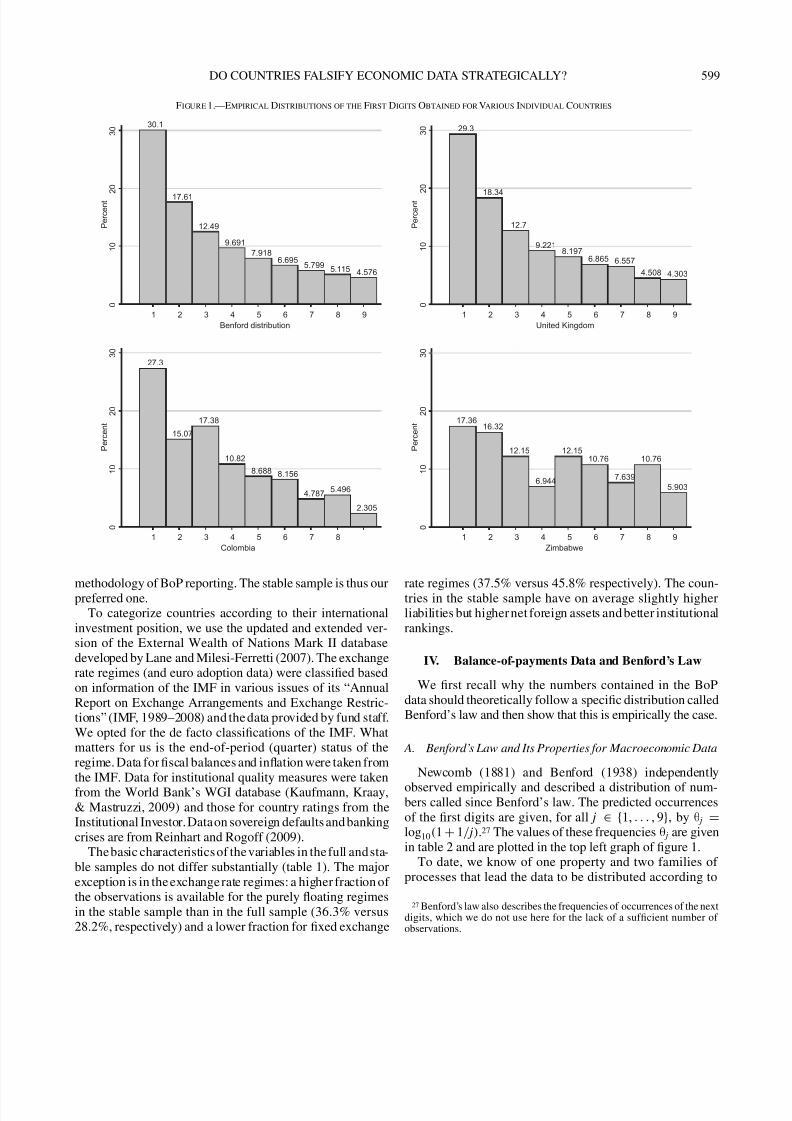
vations only due to the fact that 24 countries were createdwithin the sample period so obviously could not report thedata prior to their independence (and possibly for some yearsafterward). Although some countries report the data for a fewyears or a few quarters only, with breaksfor unknown reasons,we do not consider the missing observations a major obsta-cle. Even if some countries may have not reported data forstrategic motives (which we cannot outrule), this would workagainst our method of detecting irregular behavior. Examplesof obtained empirical distributions of the first digits of theBoP data for different countries are reported in figure 1.
We also use a subset of the data containing only the coun-tries reporting BoP data for at least one quarter and one series
a year between 1995 and 2007, keeping only the observationscorresponding to the latter period of time. This subset will bereferred to as the stable sample; full sample will refer to theentire data set. The stable sample is a more complete data setwith 66 countriesbetween 1995 and 2007, with 41,245obser-vations out of 44,616 all possible values.26 Some additionaldata that we use to provide conditions for slicing the sam-ples (country investment positions and WGI, for example)are available for this later period only. When we scrutinizeyearly data only, the numberof observationsper year remainsroughly constant. The countries included may also providehigher-quality data. For example, Poland is excluded fromthis sample because it did not report the data between 1996
and 2000 when it was changing and improving the statistical25 We donot usethedatasupplied directlyto investorsin real time,butwhat
is given to the IMF with some lag. Nevertheless, the IMF is an importantlending institution that hasan influence on thefinancial conditions in many,especially non-OECD, countries. The data submitted to the IMF are alsoused by market participants in their analyzes.
26 Choosing 1994 as the initial year would give us only 61 countries withmore incomplete data, while picking 1996 would raise the number of coun-tries in the sample only to 70. In both cases, the alternative choice wouldlead to fewer observations being included in the stable sample. Becausewe need as many countries and quarters as possible given the argumentsadvanced in section IV, the choice of the 1995–2007 sample is a naturalone.
7/24/2019 Do Countries Falsify Economic Data Strategically - Some Evidence That They Might
http://slidepdf.com/reader/full/do-countries-falsify-economic-data-strategically-some-evidence-that-they 9/26
DO COUNTRIES FALSIFY ECONOMIC DATA STRATEGICALLY? 599
Figure 1.—Empirical Distributions of the First Digits Obtained for Various Individual Countries
30.1
17.61
12.49
9.691
7.9186.695
5.7995.115 4.576
0
1 0
2 0
3 0
P e r c e n t
1 2 3 4 5 6 7 8 9
Benford distribution
29.3
18.34
12.7
9.2218.197
6.865 6.557
4.508 4.303
0
1 0
2 0
3 0
P e r c e n t
1 2 3 4 5 6 7 8 9
United Kingdom
27.3
15.07
17.38
10.82
8.688 8.156
4.787 5.496
2.305
0
1 0
2 0
3 0
P e r c e n t
1 2 3 4 5 6 7 8
17.3616.32
12.15
6.944
12.1510.76
7.639
10.76
5.903
0
1 0
2 0
3 0
P e r c e n t
1 2 3 4 5 6 7 8 9
ZimbabweColombia
methodology of BoP reporting. The stable sample is thus ourpreferred one.To categorize countries according to their international
investment position, we use the updated and extended ver-sion of the External Wealth of Nations Mark II databasedeveloped by Lane and Milesi-Ferretti (2007). The exchangerate regimes (and euro adoption data) were classified basedon information of the IMF in various issues of its “AnnualReport on Exchange Arrangements and Exchange Restric-tions” (IMF, 1989–2008) and the data provided by fund staff.We opted for the de facto classifications of the IMF. Whatmatters for us is the end-of-period (quarter) status of theregime. Data for fiscal balances and inflation were taken fromthe IMF. Data for institutional quality measures were takenfrom the World Bank’s WGI database (Kaufmann, Kraay,& Mastruzzi, 2009) and those for country ratings from theInstitutional Investor. Dataon sovereign defaults and bankingcrises are from Reinhart and Rogoff (2009).
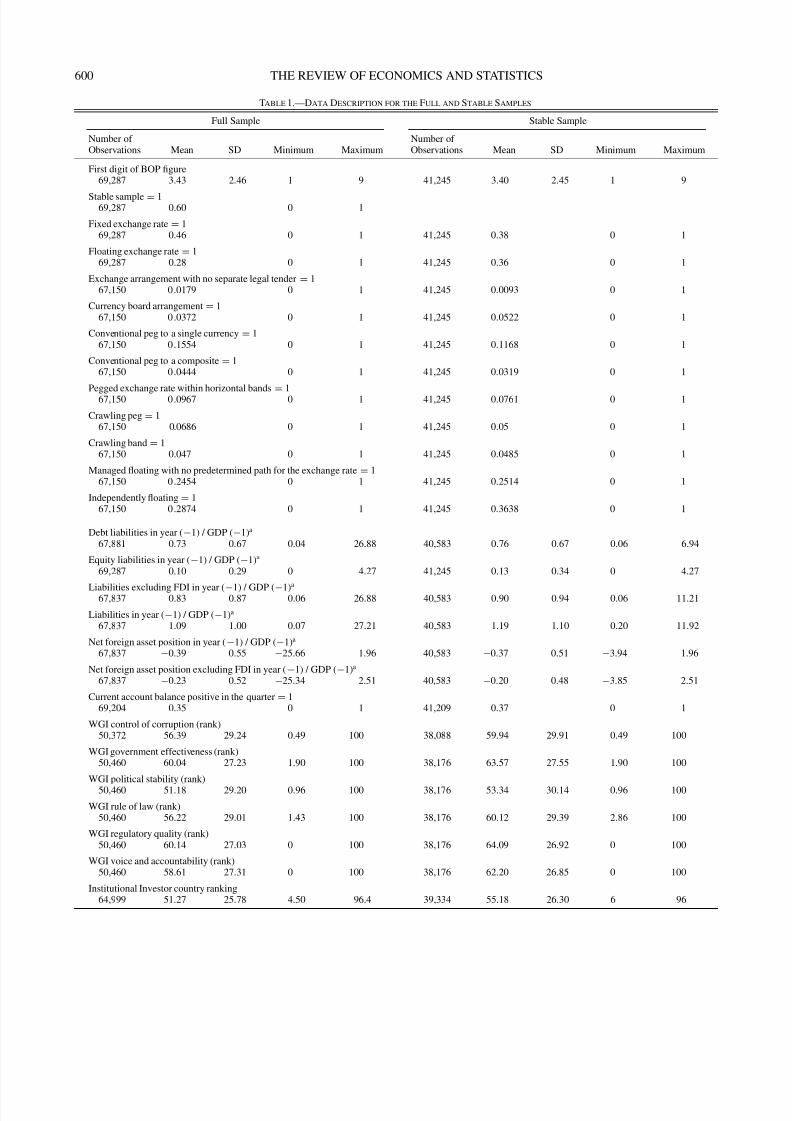
The basic characteristics of the variables in the full and sta-ble samples do not differ substantially (table 1). The majorexception is in the exchange rate regimes: a higher fraction of the observations is available for the purely floating regimesin the stable sample than in the full sample (36.3% versus28.2%, respectively) and a lower fraction for fixed exchange
rate regimes (37.5% versus 45.8% respectively). The coun-tries in the stable sample have on average slightly higherliabilities but higher net foreign assets and better institutionalrankings.
IV. Balance-of-payments Data and Benford’s Law
We first recall why the numbers contained in the BoPdata should theoretically follow a specific distribution calledBenford’s law and then show that this is empirically the case.
A. Benford’s Law and Its Properties for Macroeconomic Data
Newcomb (1881) and Benford (1938) independently
observed empirically and described a distribution of num-bers called since Benford’s law. The predicted occurrencesof the first digits are given, for all j ∈ {1, . . . , 9}, by θ j =
log10(1 + 1/ j).27 The values of these frequencies θ j are givenin table 2 and are plotted in the top left graph of figure 1.
To date, we know of one property and two families of processes that lead the data to be distributed according to
27 Benford’s law also describes the frequencies of occurrences of the nextdigits, which we do not use here for the lack of a sufficient number of observations.
7/24/2019 Do Countries Falsify Economic Data Strategically - Some Evidence That They Might
http://slidepdf.com/reader/full/do-countries-falsify-economic-data-strategically-some-evidence-that-they 10/26
600 THE REVIEW OF ECONOMICS AND STATISTICS
Table 1.—Data Description for the Full and Stable Samples
Full Sample Stable Sample
Number of Number of Observations Mean SD Minimum Maximum Observations Mean SD Minimum Maximum
First digit of BOP figure69,287 3.43 2.46 1 9 41,245 3.40 2.45 1 9
Stable sample = 169,287 0.60 0 1
Fixed exchange rate = 169,287 0.46 0 1 41,245 0.38 0 1
Floating exchange rate = 169,287 0.28 0 1 41,245 0.36 0 1
Exchange arrangement with no separate legal tender = 167,150 0.0179 0 1 41,245 0.0093 0 1
Currency board arrangement = 167,150 0.0372 0 1 41,245 0.0522 0 1
Conventional peg to a single currency = 167,150 0.1554 0 1 41,245 0.1168 0 1
Conventional peg to a composite = 167,150 0.0444 0 1 41,245 0.0319 0 1
Pegged exchange rate within horizontal bands = 167,150 0.0967 0 1 41,245 0.0761 0 1
Crawling peg = 167,150 0.0686 0 1 41,245 0.05 0 1
Crawling band = 167,150 0.047 0 1 41,245 0.0485 0 1
Managed floating with no predetermined path for the exchange rate = 167,150 0.2454 0 1 41,245 0.2514 0 1
Independently floating = 167,150 0.2874 0 1 41,245 0.3638 0 1
Debt liabilities in year (−1) / GDP (−1)a
67,881 0.73 0.67 0.04 26.88 40,583 0.76 0.67 0.06 6.94
Equity liabilities in year (−1) / GDP (−1)a
69,287 0.10 0.29 0 4.27 41,245 0.13 0.34 0 4.27
Liabilities excluding FDI in year (−1) / GDP (−1)a
67,837 0.83 0.87 0.06 26.88 40,583 0.90 0.94 0.06 11.21
Liabilities in year (−1) / GDP (−1)a
67,837 1.09 1.00 0.07 27.21 40,583 1.19 1.10 0.20 11.92
Net foreign asset position in year (−1) / GDP (−1)a
67,837 −0.39 0.55 −25.66 1.96 40,583 −0.37 0.51 −3.94 1.96
Net foreign asset position excluding FDI in year (−1) / GDP (−1)a
67,837 −0.23 0.52 −25.34 2.51 40,583 −0.20 0.48 −3.85 2.51
Current account balance positive in the quarter = 169,204 0.35 0 1 41,209 0.37 0 1
WGI control of corruption (rank)50,372 56.39 29.24 0.49 100 38,088 59.94 29.91 0.49 100
WGI government effectiveness (rank)50,460 60.04 27.23 1.90 100 38,176 63.57 27.55 1.90 100
WGI political stability (rank)50,460 51.18 29.20 0.96 100 38,176 53.34 30.14 0.96 100
WGI rule of law (rank)50,460 56.22 29.01 1.43 100 38,176 60.12 29.39 2.86 100
WGI regulatory quality (rank)50,460 60.14 27.03 0 100 38,176 64.09 26.92 0 100
WGI voice and accountability (rank)50,460 58.61 27.31 0 100 38,176 62.20 26.85 0 100
Institutional Investor country ranking64,999 51.27 25.78 4.50 96.4 39,334 55.18 26.30 6 96
7/24/2019 Do Countries Falsify Economic Data Strategically - Some Evidence That They Might
http://slidepdf.com/reader/full/do-countries-falsify-economic-data-strategically-some-evidence-that-they 11/26
DO COUNTRIES FALSIFY ECONOMIC DATA STRATEGICALLY? 601
Table 1.—(Continued)
Full Sample Stable Sample
Number of Number of Observations Mean SD Minimum Maximum Observations Mean SD Minimum Maximum
OECD member prior to 1989 = 169,287 0.29 0 1 41,245 0.32 0 1
Africa and Middle East = 169,287 0.14 0 1 41,245 0.10 0 1
CIS member = 169,287 0.12 0 1 41,245 0.14 0 1
Eastern Europe = 169,287 0.15 0 1 41,245 0.17 0 1
Developed Europe + Western offshoots + Japan = 169,287 0.29 0 1 41,245 0.32 0 1
Latin America = 169,287 0.16 0 1 41,245 0.15 0 1
Asia excluding Middle East and CIS = 169,287 0.16 0 1 41,245 0.17 0 1
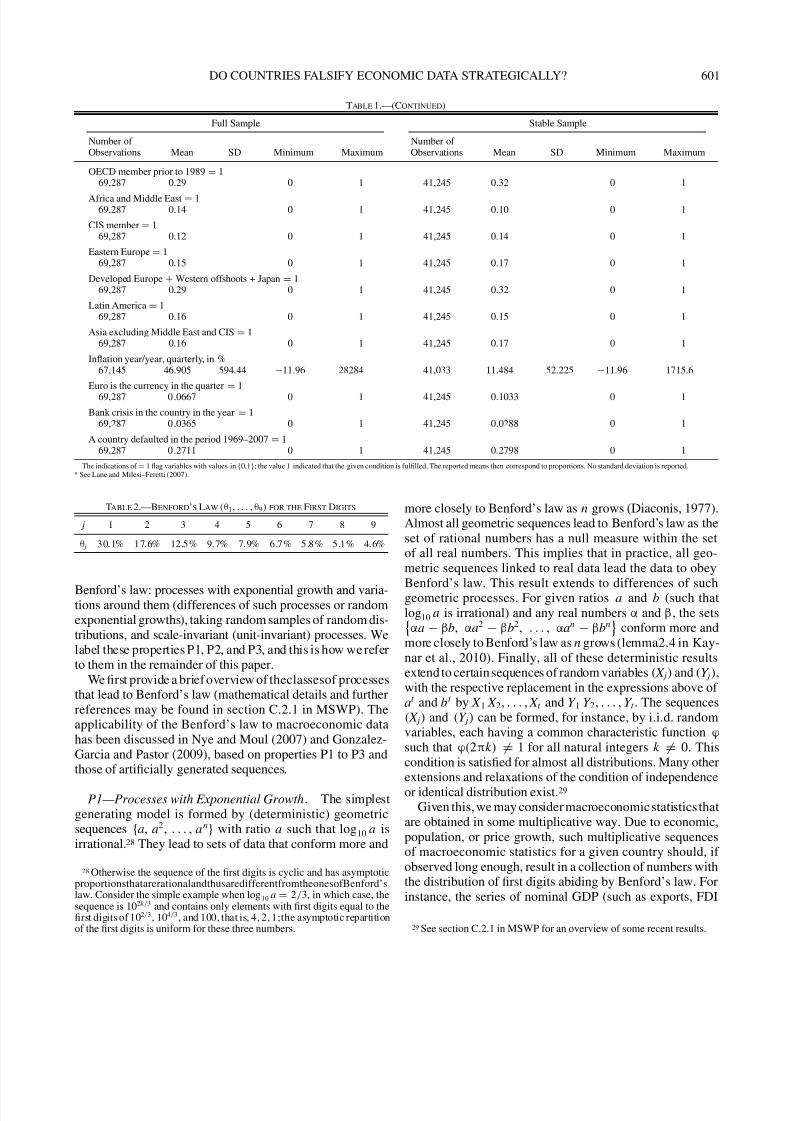
Inflation year/year, quarterly, in %67,145 46.905 594.44 −11.96 28284 41,033 11.484 52.225 −11.96 1715.6
Euro is the currency in the quarter = 169,287 0.0667 0 1 41,245 0.1033 0 1
Bank crisis in the country in the year = 169,287 0.0365 0 1 41,245 0.0288 0 1
A country defaulted in the period 1969–2007 = 169,287 0.2711 0 1 41,245 0.2798 0 1
The indications of = 1 flag variables with values in {0,1}; the value 1 indicated that the given condition is fulfilled. The reported means then correspond to proportions. No standard deviation is reported.a See Lane and Milesi–Feretti (2007).
Table 2.—Benford’s Law (θ1, . . . , θ9) for the First Digits
j 1 2 3 4 5 6 7 8 9
θ j 30.1% 17.6% 12.5% 9.7% 7.9% 6.7% 5.8% 5.1% 4.6%
Benford’s law: processes with exponential growth and varia-tions around them (differences of such processes or randomexponential growths), taking random samples of random dis-tributions, and scale-invariant (unit-invariant) processes. Welabel these properties P1, P2, and P3, and this is how we referto them in the remainder of this paper.
We first provide a brief overview of theclassesof processesthat lead to Benford’s law (mathematical details and furtherreferences may be found in section C.2.1 in MSWP). Theapplicability of the Benford’s law to macroeconomic datahas been discussed in Nye and Moul (2007) and Gonzalez-Garcia and Pastor (2009), based on properties P1 to P3 andthose of artificially generated sequences.
P1—Processes with Exponential Growth. The simplestgenerating model is formed by (deterministic) geometricsequences {a, a2, . . . , an} with ratio a such that log10 a isirrational.28 They lead to sets of data that conform more and
28 Otherwise the sequence of the first digits is cyclic and has asymptoticproportionsthatarerationalandthusaredifferentfromtheonesofBenford’slaw. Consider the simple example when log10 a = 2/3, in which case, thesequence is 102k /3 and contains only elements with first digits equal to thefirst digits of 102/3, 104/3, and 100, that is, 4, 2, 1;the asymptotic repartitionof the first digits is uniform for these three numbers.
more closely to Benford’s law as n grows (Diaconis, 1977).Almost all geometric sequences lead to Benford’s law as theset of rational numbers has a null measure within the setof all real numbers. This implies that in practice, all geo-metric sequences linked to real data lead the data to obey
Benford’s law. This result extends to differences of suchgeometric processes. For given ratios a and b (such thatlog10 a is irrational) and any real numbers α and β, the setsαa − βb, αa2 − βb2, . . . , αan − βbn
conform more and
more closely to Benford’s law as n grows (lemma2.4 in Kay-nar et al., 2010). Finally, all of these deterministic resultsextend to certain sequences of random variables ( X j) and (Y j),with the respective replacement in the expressions above of at and bt by X 1 X 2, . . . , X t and Y 1 Y 2, . . . , Y t . The sequences( X j) and (Y j) can be formed, for instance, by i.i.d. randomvariables, each having a common characteristic function ϕsuch that ϕ(2πk ) = 1 for all natural integers k = 0. Thiscondition is satisfied for almost all distributions. Many otherextensions and relaxations of the condition of independenceor identical distribution exist.29
Given this, we may consider macroeconomic statistics thatare obtained in some multiplicative way. Due to economic,population, or price growth, such multiplicative sequencesof macroeconomic statistics for a given country should, if observed long enough, result in a collection of numbers withthe distribution of first digits abiding by Benford’s law. Forinstance, the series of nominal GDP (such as exports, FDI
29 See section C.2.1 in MSWP for an overview of some recent results.
7/24/2019 Do Countries Falsify Economic Data Strategically - Some Evidence That They Might
http://slidepdf.com/reader/full/do-countries-falsify-economic-data-strategically-some-evidence-that-they 12/26
602 THE REVIEW OF ECONOMICS AND STATISTICS
flows) figures can be considered but not the series of the GDP(such as exports, FDI flows) growth rates, since the lattercorrespond to realizations of random variables X j above. Forexample, in a stationary economy with constant real GDP(such as exports, FDI flows), this should be the case if longenough time series are considered when the inflation in each
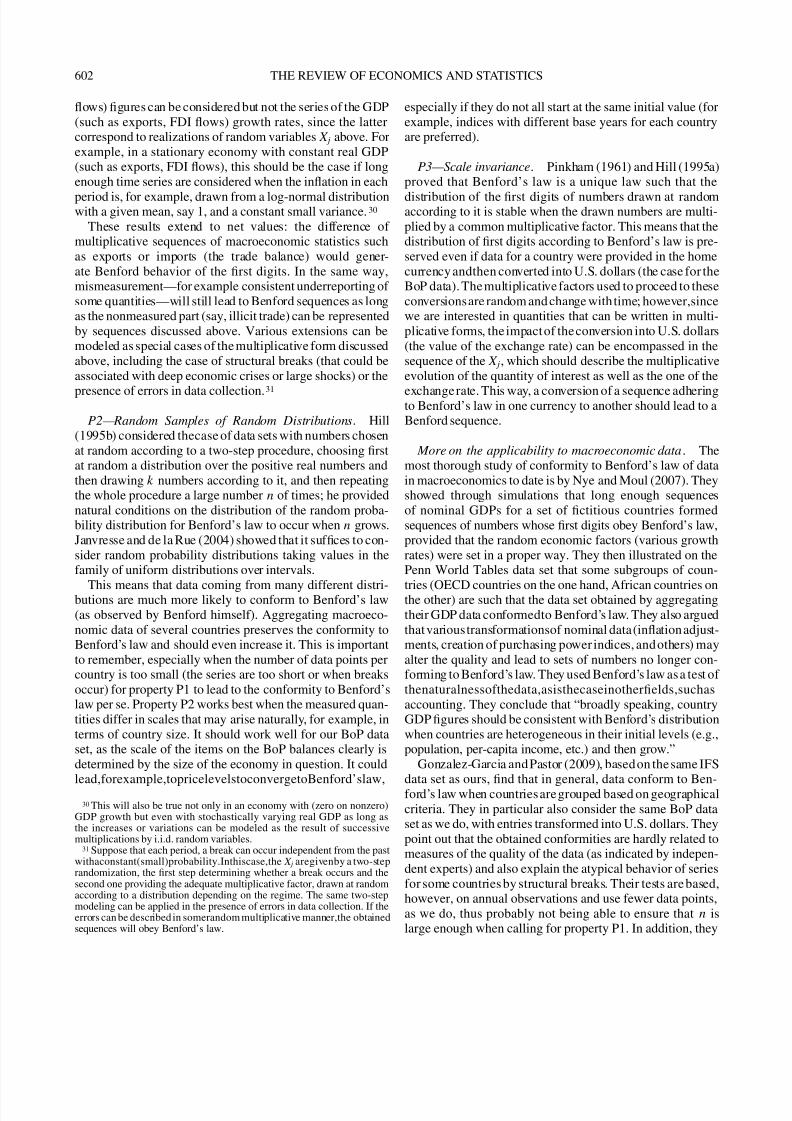
period is, for example, drawn from a log-normal distributionwith a given mean, say 1, and a constant small variance.30
These results extend to net values: the difference of multiplicative sequences of macroeconomic statistics suchas exports or imports (the trade balance) would gener-ate Benford behavior of the first digits. In the same way,mismeasurement—for example consistent underreporting of some quantities—will still lead to Benford sequences as longas the nonmeasured part (say, illicit trade) can be representedby sequences discussed above. Various extensions can bemodeled as special cases of the multiplicative form discussedabove, including the case of structural breaks (that could beassociated with deep economic crises or large shocks) or the
presence of errors in data collection.31
P2—Random Samples of Random Distributions. Hill(1995b) considered thecase of data sets with numbers chosenat random according to a two-step procedure, choosing firstat random a distribution over the positive real numbers andthen drawing k numbers according to it, and then repeatingthe whole procedure a large number n of times; he providednatural conditions on the distribution of the random proba-bility distribution for Benford’s law to occur when n grows.Janvresse and de la Rue (2004) showed that it suffices to con-sider random probability distributions taking values in thefamily of uniform distributions over intervals.
This means that data coming from many different distri-butions are much more likely to conform to Benford’s law(as observed by Benford himself). Aggregating macroeco-nomic data of several countries preserves the conformity toBenford’s law and should even increase it. This is importantto remember, especially when the number of data points percountry is too small (the series are too short or when breaksoccur) for property P1 to lead to the conformity to Benford’slaw per se. Property P2 works best when the measured quan-tities differ in scales that may arise naturally, for example, interms of country size. It should work well for our BoP dataset, as the scale of the items on the BoP balances clearly isdetermined by the size of the economy in question. It could
lead,forexample,topricelevelstoconvergetoBenford’slaw,30 This will also be true not only in an economy with (zero on nonzero)
GDP growth but even with stochastically varying real GDP as long asthe increases or variations can be modeled as the result of successivemultiplications by i.i.d. random variables.
31 Suppose that each period, a break can occur independent from the pastwithaconstant(small)probability.Inthiscase,the X j aregivenby a two-steprandomization, the first step determining whether a break occurs and thesecond one providing the adequate multiplicative factor, drawn at randomaccording to a distribution depending on the regime. The same two-stepmodeling can be applied in the presence of errors in data collection. If theerrors can be described in somerandom multiplicative manner,the obtainedsequences will obey Benford’s law.
especially if they do not all start at the same initial value (forexample, indices with different base years for each countryare preferred).
P3—Scale invariance. Pinkham (1961) and Hill (1995a)proved that Benford’s law is a unique law such that the
distribution of the first digits of numbers drawn at randomaccording to it is stable when the drawn numbers are multi-plied by a common multiplicative factor. This means that thedistribution of first digits according to Benford’s law is pre-served even if data for a country were provided in the homecurrency andthen converted into U.S. dollars (the case for theBoP data). The multiplicative factors used to proceed to theseconversionsare random and change with time; however,sincewe are interested in quantities that can be written in multi-plicative forms, the impactof the conversion into U.S. dollars(the value of the exchange rate) can be encompassed in thesequence of the X j, which should describe the multiplicativeevolution of the quantity of interest as well as the one of the
exchange rate. This way, a conversion of a sequence adheringto Benford’s law in one currency to another should lead to aBenford sequence.
More on the applicability to macroeconomic data. Themost thorough study of conformity to Benford’s law of datain macroeconomics to date is by Nye and Moul (2007). Theyshowed through simulations that long enough sequencesof nominal GDPs for a set of fictitious countries formedsequences of numbers whose first digits obey Benford’s law,provided that the random economic factors (various growthrates) were set in a proper way. They then illustrated on thePenn World Tables data set that some subgroups of coun-
tries (OECD countries on the one hand, African countries onthe other) are such that the data set obtained by aggregatingtheir GDP data conformedto Benford’s law. They also arguedthatvarioustransformationsof nominal data(inflation adjust-ments, creation of purchasing powerindices, and others) mayalter the quality and lead to sets of numbers no longer con-forming to Benford’s law. They used Benford’s law as a test of thenaturalnessofthedata,asisthecaseinotherfields,suchasaccounting. They conclude that “broadly speaking, countryGDP figures should be consistent with Benford’s distributionwhen countries are heterogeneous in their initial levels (e.g.,population, per-capita income, etc.) and then grow.”
Gonzalez-Garcia and Pastor (2009), based on the same IFS
data set as ours, find that in general, data conform to Ben-ford’s law when countries are grouped based on geographicalcriteria. They in particular also consider the same BoP dataset as we do, with entries transformed into U.S. dollars. Theypoint out that the obtained conformities are hardly related tomeasures of the quality of the data (as indicated by indepen-dent experts) and also explain the atypical behavior of seriesfor some countries by structural breaks. Their tests are based,however, on annual observations and use fewer data points,as we do, thus probably not being able to ensure that n islarge enough when calling for property P1. In addition, they
7/24/2019 Do Countries Falsify Economic Data Strategically - Some Evidence That They Might
http://slidepdf.com/reader/full/do-countries-falsify-economic-data-strategically-some-evidence-that-they 13/26
DO COUNTRIES FALSIFY ECONOMIC DATA STRATEGICALLY? 603
Table 3.—Assessment of the Global Conformity of the Dataset to Benford’s Law
Number of Countries and Less Persistent Rejection RatesQuarters Involved All Series Series (%)
Observations Number of Average Number p-Value Number of p-Value Number of 1-in-20 1-in-10 1-in-5Corresponding to Countries of Quarters (in %) Observations (in %) Observations Criterion Criterion Criterion
Full sample 103 57.2 64.4 69,287 66.4 30,075 6.5 6.1 5.4
Stable sample 66 51.9 14.6 41,245 14.8 18,066 5.5 6.9 8.5OECD countries 22 74.0 92.9 20,105 94.2 8,970 3.7 3.7 2.9Non-OECD Countries 81 52.6 25.0 49,182 76.1 21,105 6.1 5.6 5.8
Significant at *5%, **2%, and ***1%.
do not correct for the persistence issues we mention in thenext section. Given the short data span and the frequency,they may not have enough observed cycles.
B. The Chi-Square Test of Goodness of Fit to Benford’s Law
Such a goodness-of-fit test compares the empirical fre-quenciesθ j of the digits j ∈ {1, . . . , 9} of the numbers arising
in a given data set to the theoretical frequencies θ j prescribedby Benford’s law via the statistic
D2 = N
9 j=1
θ j −θ j
2
θ j
,
where N denotes the total number of the available first digitobservations. The statistic D2 converges in distribution to achi-squaredistributionwith8 degreesof freedom as N → ∞.Practitioners think of the distribution of D2 as already closeenough to this limit whenever N ≥ 30 and N θ j ≥ 5 for all
j ∈ {1, . . . , 9} (van der Vaart, 1998). These conditions are in
our case N ≥ 5 min j θ j = 5/θ9 ≥ 110. This approxima-tion is used for P-values associated with values of the statistic D2 in the tables. The test is powerful; it is easy to showby concentration-of-the-measure techniques (see Rivoirard& Stoltz, 2009) that the probability of not rejecting any dis-tribution of the first digits other than Benford’s law when thefirst digits indeed conform to Benford’s law is exponentiallysmall in N , where the constant in the exponent depends onthe discrepancy between the alternative distribution testedand Benford’s law.
The idea of detecting manipulations in the data by tests of conformity to Benford’s law is now well established in audit-ing and accounting, after the seminal article of Nigrini (1996)
and the successful use of his methodology by the author-ities of the City of New York, leading to the detection of fraud in seven companies (see Nigrini, 1999, for an extendedreview of many other cases). The methodology there is touse as the data set to be tested all quantities appearing inaccounts (the values of all individual transactions); the theo-retical justification behind this is idea is mainly property P2.Other occurrences and practical uses of Benford’s law canbe found in Hill (1995b); one can cite, among others, stockmarket data (Ley, 1996) and census statistics as occurrencesand the design of more efficient computers as a possible use.
C. Global Conformity of Our Proposed Data Set to Benford’s
Law
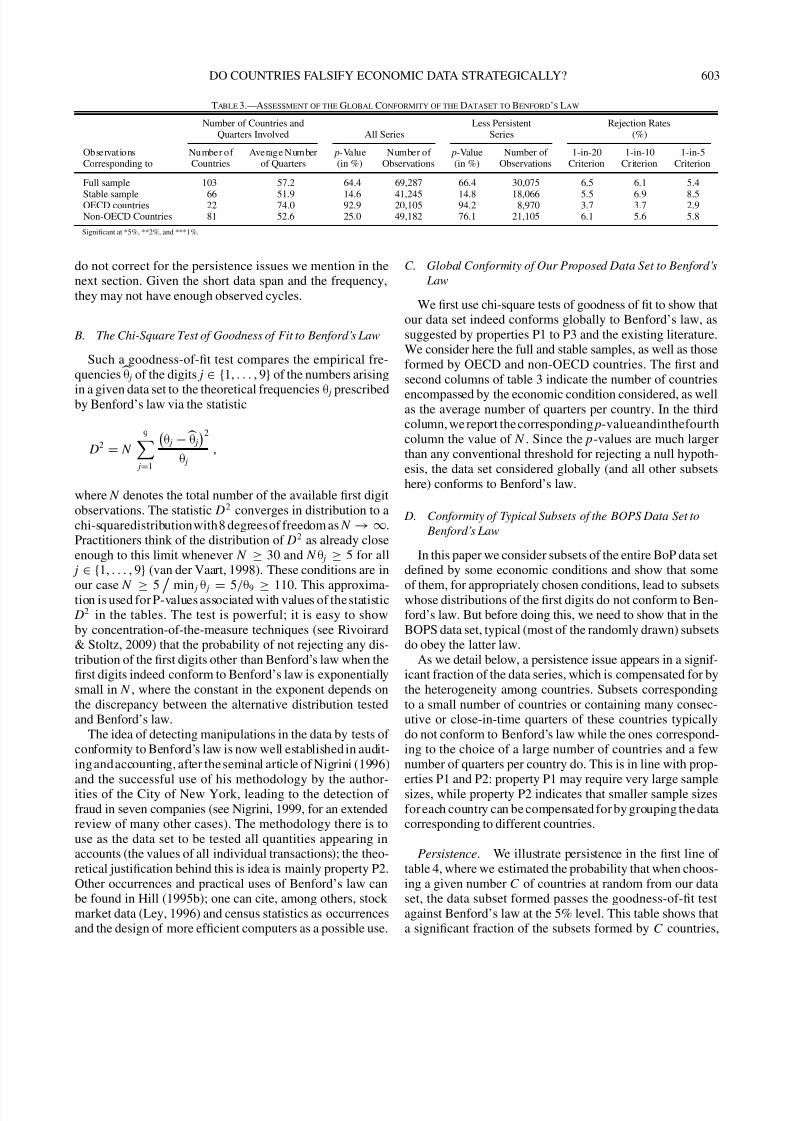
We first use chi-square tests of goodness of fit to show thatour data set indeed conforms globally to Benford’s law, assuggested by properties P1 to P3 and the existing literature.We consider here the full and stable samples, as well as thoseformed by OECD and non-OECD countries. The first andsecond columns of table 3 indicate the number of countries
encompassed by the economic condition considered, as wellas the average number of quarters per country. In the thirdcolumn, we report the corresponding p-valueandinthefourthcolumn the value of N . Since the p-values are much largerthan any conventional threshold for rejecting a null hypoth-esis, the data set considered globally (and all other subsetshere) conforms to Benford’s law.
D. Conformity of Typical Subsets of the BOPS Data Set to
Benford’s Law
In this paper we consider subsets of the entire BoP data setdefined by some economic conditions and show that some
of them, for appropriately chosen conditions, lead to subsetswhose distributions of the first digits do not conform to Ben-ford’s law. But before doing this, we need to show that in theBOPS data set, typical (most of the randomly drawn) subsetsdo obey the latter law.
As we detail below, a persistence issue appears in a signif-icant fraction of the data series, which is compensated for bythe heterogeneity among countries. Subsets correspondingto a small number of countries or containing many consec-utive or close-in-time quarters of these countries typicallydo not conform to Benford’s law while the ones correspond-ing to the choice of a large number of countries and a fewnumber of quarters per country do. This is in line with prop-
erties P1 and P2: property P1 may require very large samplesizes, while property P2 indicates that smaller sample sizesforeach country can be compensated for by grouping the datacorresponding to different countries.
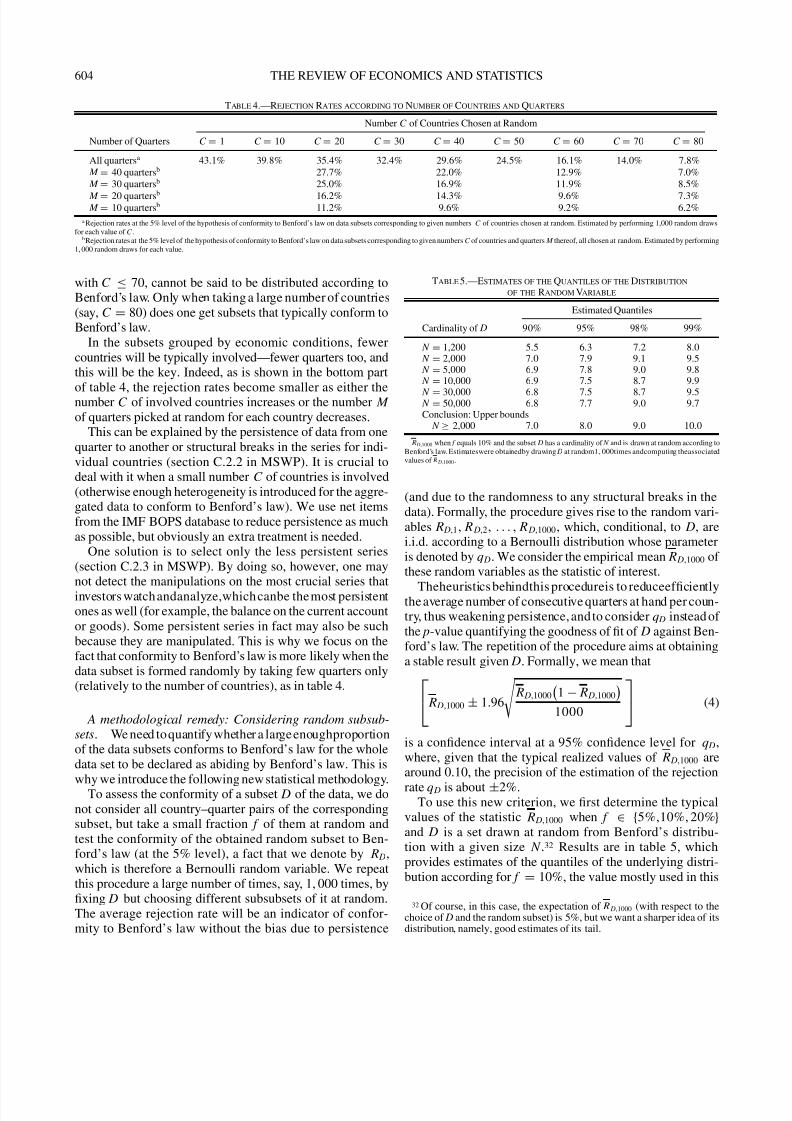
Persistence. We illustrate persistence in the first line of table 4, where we estimated the probability that when choos-ing a given number C of countries at random from our dataset, the data subset formed passes the goodness-of-fit testagainst Benford’s law at the 5% level. This table shows thata significant fraction of the subsets formed by C countries,
7/24/2019 Do Countries Falsify Economic Data Strategically - Some Evidence That They Might
http://slidepdf.com/reader/full/do-countries-falsify-economic-data-strategically-some-evidence-that-they 14/26
604 THE REVIEW OF ECONOMICS AND STATISTICS
Table 4.—Rejection Rates according to Number of Countries and Quarters
Number C of Countries Chosen at Random
Number of Quarters C = 1 C = 10 C = 20 C = 30 C = 40 C = 50 C = 60 C = 70 C = 80
All quartersa 43.1% 39.8% 35.4% 32.4% 29.6% 24.5% 16.1% 14.0% 7.8% M = 40 quartersb 27.7% 22.0% 12.9% 7.0% M = 30 quartersb 25.0% 16.9% 11.9% 8.5%
M = 20 quartersb 16.2% 14.3% 9.6% 7.3% M = 10 quartersb 11.2% 9.6% 9.2% 6.2%
a Rejection rates at the 5% level of the hypothesis of conformity to Benford’s law on data subsets corresponding to given numbers C of countries chosen at random. Estimated by performing 1,000 random drawsfor each value of C .
bRejection rates at the 5% level of the hypothesis of conformity to Benford’s law on data subsets corresponding to given numbers C of countries and quarters M thereof, all chosen at random. Estimated by performing1, 000 random draws for each value.
with C ≤ 70, cannot be said to be distributed according toBenford’s law. Only when taking a large number of countries(say, C = 80) does one get subsets that typically conform toBenford’s law.
In the subsets grouped by economic conditions, fewercountries will be typically involved—fewer quarters too, andthis will be the key. Indeed, as is shown in the bottom part
of table 4, the rejection rates become smaller as either thenumber C of involved countries increases or the number M
of quarters picked at random for each country decreases.This can be explained by the persistence of data from one
quarter to another or structural breaks in the series for indi-vidual countries (section C.2.2 in MSWP). It is crucial todeal with it when a small number C of countries is involved(otherwise enough heterogeneity is introduced for the aggre-gated data to conform to Benford’s law). We use net itemsfrom the IMF BOPS database to reduce persistence as muchas possible, but obviously an extra treatment is needed.
One solution is to select only the less persistent series(section C.2.3 in MSWP). By doing so, however, one maynot detect the manipulations on the most crucial series thatinvestors watch andanalyze,which canbe the most persistentones as well (for example, the balance on the current accountor goods). Some persistent series in fact may also be suchbecause they are manipulated. This is why we focus on thefact that conformity to Benford’s law is more likely when thedata subset is formed randomly by taking few quarters only(relatively to the number of countries), as in table 4.
A methodological remedy: Considering random subsub-
sets. We need to quantify whether a large enoughproportionof the data subsets conforms to Benford’s law for the wholedata set to be declared as abiding by Benford’s law. This is
why we introduce the following new statistical methodology.To assess the conformity of a subset D of the data, we donot consider all country–quarter pairs of the correspondingsubset, but take a small fraction f of them at random andtest the conformity of the obtained random subset to Ben-ford’s law (at the 5% level), a fact that we denote by R D,which is therefore a Bernoulli random variable. We repeatthis procedure a large number of times, say, 1, 000 times, byfixing D but choosing different subsubsets of it at random.The average rejection rate will be an indicator of confor-mity to Benford’s law without the bias due to persistence
Table 5.—Estimates of the Quantiles of the Distribution
of the Random Variable
Estimated Quantiles
Cardinality of D 90% 95% 98% 99%
N = 1,200 5.5 6.3 7.2 8.0 N = 2,000 7.0 7.9 9.1 9.5 N = 5,000 6.9 7.8 9.0 9.8 N = 10,000 6.9 7.5 8.7 9.9
N = 30,000 6.8 7.5 8.7 9.5 N = 50,000 6.8 7.7 9.0 9.7Conclusion: Upper bounds
N ≥ 2,000 7.0 8.0 9.0 10.0
R D,1000 when f equals 10% and the subset D has a cardinality of N and is drawn at random according toBenford’s law. Estimateswere obtainedby drawing D at random1, 000times andcomputing theassociatedvalues of R D,1000.
(and due to the randomness to any structural breaks in thedata). Formally, the procedure gives rise to the random vari-ables R D,1, R D,2, . . . , R D,1000, which, conditional, to D, arei.i.d. according to a Bernoulli distribution whose parameteris denoted by q D. We consider the empirical mean R D,1000 of these random variables as the statistic of interest.
Theheuristics behindthis procedureis to reduceefficientlythe average number of consecutive quarters at hand per coun-try, thus weakening persistence, and to consider q D instead of the p-value quantifying the goodness of fit of D against Ben-ford’s law. The repetition of the procedure aims at obtaininga stable result given D. Formally, we mean that R D,1000 ± 1.96
R D,1000
1 − R D,1000
1000
(4)
is a confidence interval at a 95% confidence level for q D,where, given that the typical realized values of R D,1000 arearound 0.10, the precision of the estimation of the rejection
rate q D is about ±2%.To use this new criterion, we first determine the typical
values of the statistic R D,1000 when f ∈ {5%,10%, 20%}
and D is a set drawn at random from Benford’s distribu-tion with a given size N .32 Results are in table 5, whichprovides estimates of the quantiles of the underlying distri-bution according for f = 10%, the value mostly used in this
32 Of course, in this case, the expectation of R D,1000 (with respect to thechoice of D and the random subset) is 5%, but we want a sharper idea of itsdistribution, namely, good estimates of its tail.
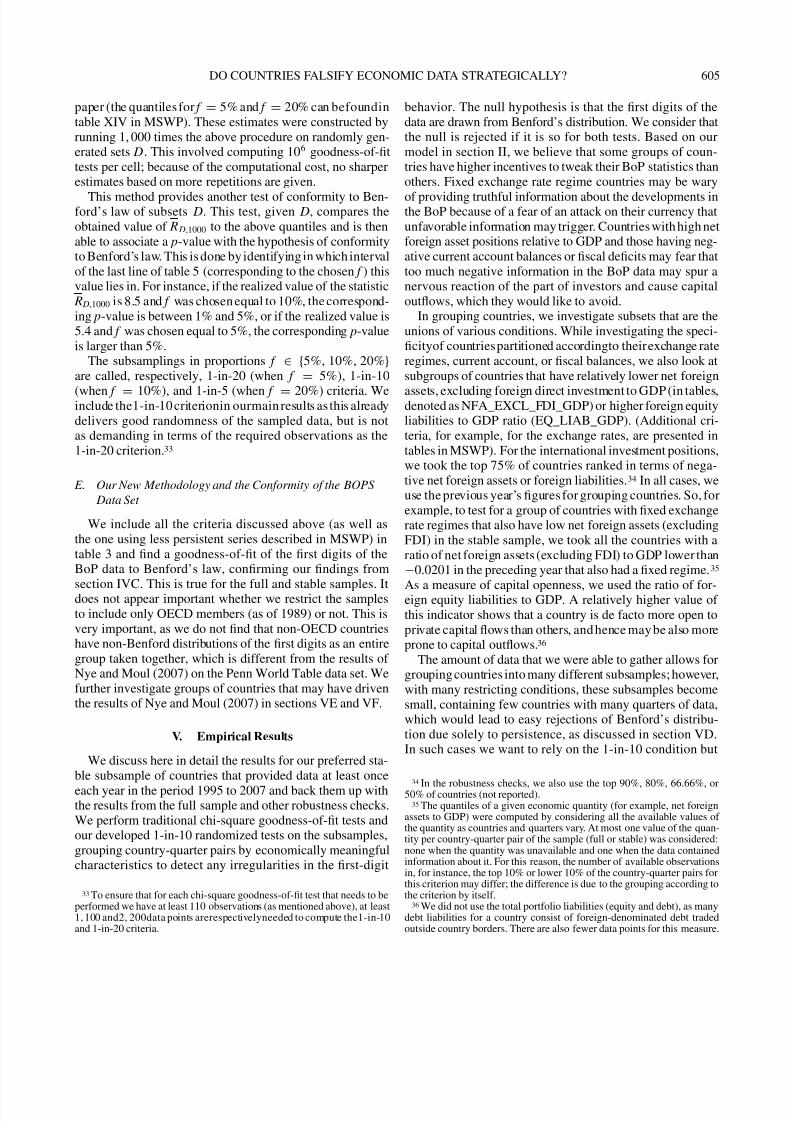
7/24/2019 Do Countries Falsify Economic Data Strategically - Some Evidence That They Might
http://slidepdf.com/reader/full/do-countries-falsify-economic-data-strategically-some-evidence-that-they 15/26
DO COUNTRIES FALSIFY ECONOMIC DATA STRATEGICALLY? 605
paper (the quantiles for f = 5% and f = 20% can befoundintable XIV in MSWP). These estimates were constructed byrunning 1, 000 times the above procedure on randomly gen-erated sets D. This involved computing 106 goodness-of-fittests per cell; because of the computational cost, no sharperestimates based on more repetitions are given.
This method provides another test of conformity to Ben-ford’s law of subsets D. This test, given D, compares theobtained value of R D,1000 to the above quantiles and is thenable to associate a p-value with the hypothesis of conformityto Benford’s law. This is done by identifying in which intervalof the last line of table 5 (corresponding to the chosen f ) thisvalue lies in. For instance, if the realized value of the statistic
R D,1000 is 8.5 and f was chosen equal to 10%, the correspond-ing p-value is between 1% and 5%, or if the realized value is5.4 and f was chosen equal to 5%, the corresponding p-valueis larger than 5%.
The subsamplings in proportions f ∈ {5%, 10%, 20%}
are called, respectively, 1-in-20 (when f = 5%), 1-in-10
(when f = 10%), and 1-in-5 (when f = 20%) criteria. Weinclude the1-in-10 criterionin ourmain results as this alreadydelivers good randomness of the sampled data, but is notas demanding in terms of the required observations as the1-in-20 criterion.33
E. Our New Methodology and the Conformity of the BOPS
Data Set
We include all the criteria discussed above (as well asthe one using less persistent series described in MSWP) intable 3 and find a goodness-of-fit of the first digits of theBoP data to Benford’s law, confirming our findings from
section IVC. This is true for the full and stable samples. Itdoes not appear important whether we restrict the samplesto include only OECD members (as of 1989) or not. This isvery important, as we do not find that non-OECD countrieshave non-Benford distributions of the first digits as an entiregroup taken together, which is different from the results of Nye and Moul (2007) on the Penn World Table data set. Wefurther investigate groups of countries that may have driventhe results of Nye and Moul (2007) in sections VE and VF.
V. Empirical Results
We discuss here in detail the results for our preferred sta-ble subsample of countries that provided data at least onceeach year in the period 1995 to 2007 and back them up withthe results from the full sample and other robustness checks.We perform traditional chi-square goodness-of-fit tests andour developed 1-in-10 randomized tests on the subsamples,grouping country-quarter pairs by economically meaningfulcharacteristics to detect any irregularities in the first-digit
33 To ensure that for each chi-square goodness-of-fit test that needs to beperformed we have at least 110 observations (as mentioned above), at least1, 100 and2, 200data points arerespectivelyneeded to compute the1-in-10and 1-in-20 criteria.
behavior. The null hypothesis is that the first digits of thedata are drawn from Benford’s distribution. We consider thatthe null is rejected if it is so for both tests. Based on ourmodel in section II, we believe that some groups of coun-tries have higher incentives to tweak their BoP statistics thanothers. Fixed exchange rate regime countries may be wary
of providing truthful information about the developments inthe BoP because of a fear of an attack on their currency thatunfavorable information may trigger. Countries with high netforeign asset positions relative to GDP and those having neg-ative current account balances or fiscal deficits may fear thattoo much negative information in the BoP data may spur anervous reaction of the part of investors and cause capitaloutflows, which they would like to avoid.
In grouping countries, we investigate subsets that are theunions of various conditions. While investigating the speci-ficityof countriespartitioned accordingto theirexchange rateregimes, current account, or fiscal balances, we also look atsubgroups of countries that have relatively lower net foreign
assets, excluding foreign direct investment to GDP (in tables,denoted as NFA_EXCL_FDI_GDP) or higher foreign equityliabilities to GDP ratio (EQ_LIAB_GDP). (Additional cri-teria, for example, for the exchange rates, are presented intables in MSWP). For the international investment positions,we took the top 75% of countries ranked in terms of nega-tive net foreign assets or foreign liabilities.34 In all cases, weuse the previous year’s figures for grouping countries. So, forexample, to test for a group of countries with fixed exchangerate regimes that also have low net foreign assets (excludingFDI) in the stable sample, we took all the countries with aratio of net foreign assets (excluding FDI) to GDP lower than−0.0201 in the preceding year that also had a fixed regime.35
As a measure of capital openness, we used the ratio of for-eign equity liabilities to GDP. A relatively higher value of this indicator shows that a country is de facto more open toprivate capital flows than others, and hence may be also moreprone to capital outflows.36
The amount of data that we were able to gather allows forgrouping countries into many different subsamples; however,with many restricting conditions, these subsamples becomesmall, containing few countries with many quarters of data,which would lead to easy rejections of Benford’s distribu-tion due solely to persistence, as discussed in section VD.In such cases we want to rely on the 1-in-10 condition but
34
In the robustness checks, we also use the top 90%, 80%, 66.66%, or50% of countries (not reported).35 The quantiles of a given economic quantity (for example, net foreign
assets to GDP) were computed by considering all the available values of the quantity as countries and quarters vary. At most one value of the quan-tity per country-quarter pair of the sample (full or stable) was considered:none when the quantity was unavailable and one when the data containedinformation about it. For this reason, the number of available observationsin, for instance, the top 10% or lower 10% of the country-quarter pairs forthis criterion may differ; the difference is due to the grouping according tothe criterion by itself.
36 We did not use the total portfolio liabilities (equity and debt), as manydebt liabilities for a country consist of foreign-denominated debt tradedoutside country borders. There are also fewer data points for this measure.
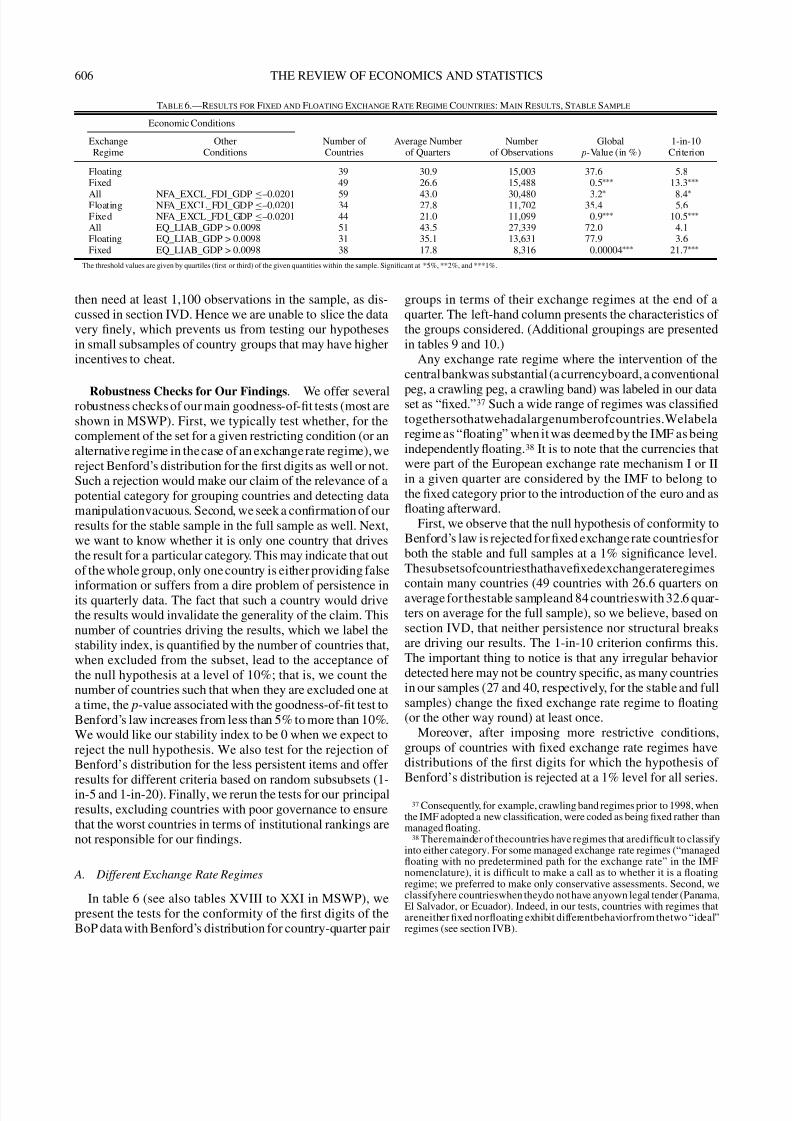
7/24/2019 Do Countries Falsify Economic Data Strategically - Some Evidence That They Might
http://slidepdf.com/reader/full/do-countries-falsify-economic-data-strategically-some-evidence-that-they 16/26
606 THE REVIEW OF ECONOMICS AND STATISTICS
Table 6.—Results for Fixed and Floating Exchange Rate Regime Countries: Main Results, Stable Sample
Economic Conditions
Exchange Other Number of Average Number Number Global 1-in-10Regime Conditions Countries of Quarters of Observations p-Value (in %) Criterion
Floating 39 30.9 15,003 37.6 5.8Fixed 49 26.6 15,488 0.5∗∗∗ 13.3∗∗∗
All NFA_EXCL_FDI_GDP ≤–0.0201 59 43.0 30,480 3.2∗
8.4∗
Floating NFA_EXCL_FDI_GDP ≤–0.0201 34 27.8 11,702 35.4 5.6Fixed NFA_EXCL_FDI_GDP ≤–0.0201 44 21.0 11,099 0.9∗∗∗ 10.5∗∗∗
All EQ_LIAB_GDP > 0.0098 51 43.5 27,339 72.0 4.1Floating EQ_LIAB_GDP > 0.0098 31 35.1 13,631 77.9 3.6Fixed EQ_LIAB_GDP > 0.0098 38 17.8 8,316 0.00004∗∗∗ 21.7∗∗∗
The threshold values are given by quartiles (first or third) of the given quantities within the sample. Significant at *5%, **2%, and ***1%.
then need at least 1,100 observations in the sample, as dis-cussed in section IVD. Hence we are unable to slice the datavery finely, which prevents us from testing our hypothesesin small subsamples of country groups that may have higherincentives to cheat.
Robustness Checks for Our Findings. We offer severalrobustness checks of our main goodness-of-fit tests (most areshown in MSWP). First, we typically test whether, for thecomplement of the set for a given restricting condition (or analternative regime in the case of an exchange rate regime), wereject Benford’s distribution for the first digits as well or not.Such a rejection would make our claim of the relevance of apotential category for grouping countries and detecting datamanipulationvacuous. Second, we seek a confirmation of ourresults for the stable sample in the full sample as well. Next,we want to know whether it is only one country that drivesthe result for a particular category. This may indicate that outof the whole group, only one country is either providing false
information or suffers from a dire problem of persistence inits quarterly data. The fact that such a country would drivethe results would invalidate the generality of the claim. Thisnumber of countries driving the results, which we label thestability index, is quantified by the number of countries that,when excluded from the subset, lead to the acceptance of the null hypothesis at a level of 10%; that is, we count thenumber of countries such that when they are excluded one ata time, the p-value associated with the goodness-of-fit test toBenford’s law increases from less than 5% to more than 10%.We would like our stability index to be 0 when we expect toreject the null hypothesis. We also test for the rejection of Benford’s distribution for the less persistent items and offer
results for different criteria based on random subsubsets (1-in-5 and 1-in-20). Finally, we rerun the tests for our principalresults, excluding countries with poor governance to ensurethat the worst countries in terms of institutional rankings arenot responsible for our findings.
A. Different Exchange Rate Regimes
In table 6 (see also tables XVIII to XXI in MSWP), wepresent the tests for the conformity of the first digits of theBoP data with Benford’s distribution for country-quarter pair
groups in terms of their exchange regimes at the end of aquarter. The left-hand column presents the characteristics of the groups considered. (Additional groupings are presentedin tables 9 and 10.)
Any exchange rate regime where the intervention of thecentralbankwas substantial (a currencyboard, a conventional
peg, a crawling peg, a crawling band) was labeled in our dataset as “fixed.”37 Such a wide range of regimes was classifiedtogethersothatwehadalargenumberofcountries.Welabelaregime as “floating” when it was deemed by the IMF as beingindependently floating.38 It is to note that the currencies thatwere part of the European exchange rate mechanism I or IIin a given quarter are considered by the IMF to belong tothe fixed category prior to the introduction of the euro and asfloating afterward.
First, we observe that the null hypothesis of conformity toBenford’s law is rejected for fixed exchange rate countriesforboth the stable and full samples at a 1% significance level.Thesubsetsofcountriesthathavefixedexchangerateregimes
contain many countries (49 countries with 26.6 quarters onaverage for thestable sampleand 84 countrieswith 32.6 quar-ters on average for the full sample), so we believe, based onsection IVD, that neither persistence nor structural breaksare driving our results. The 1-in-10 criterion confirms this.The important thing to notice is that any irregular behaviordetected here may not be country specific, as many countriesin our samples (27 and 40, respectively, for the stable and fullsamples) change the fixed exchange rate regime to floating(or the other way round) at least once.
Moreover, after imposing more restrictive conditions,groups of countries with fixed exchange rate regimes havedistributions of the first digits for which the hypothesis of Benford’s distribution is rejected at a 1% level for all series.
37 Consequently, for example, crawling band regimes prior to 1998, whenthe IMF adopted a new classification, were coded as being fixed rather thanmanaged floating.
38 Theremainder of thecountries have regimes that aredifficult to classifyinto either category. For some managed exchange rate regimes (“managedfloating with no predetermined path for the exchange rate” in the IMFnomenclature), it is difficult to make a call as to whether it is a floatingregime; we preferred to make only conservative assessments. Second, weclassifyhere countrieswhen theydo not have anyown legal tender (Panama,El Salvador, or Ecuador). Indeed, in our tests, countries with regimes thatareneither fixed norfloating exhibit differentbehaviorfrom thetwo “ideal”regimes (see section IVB).
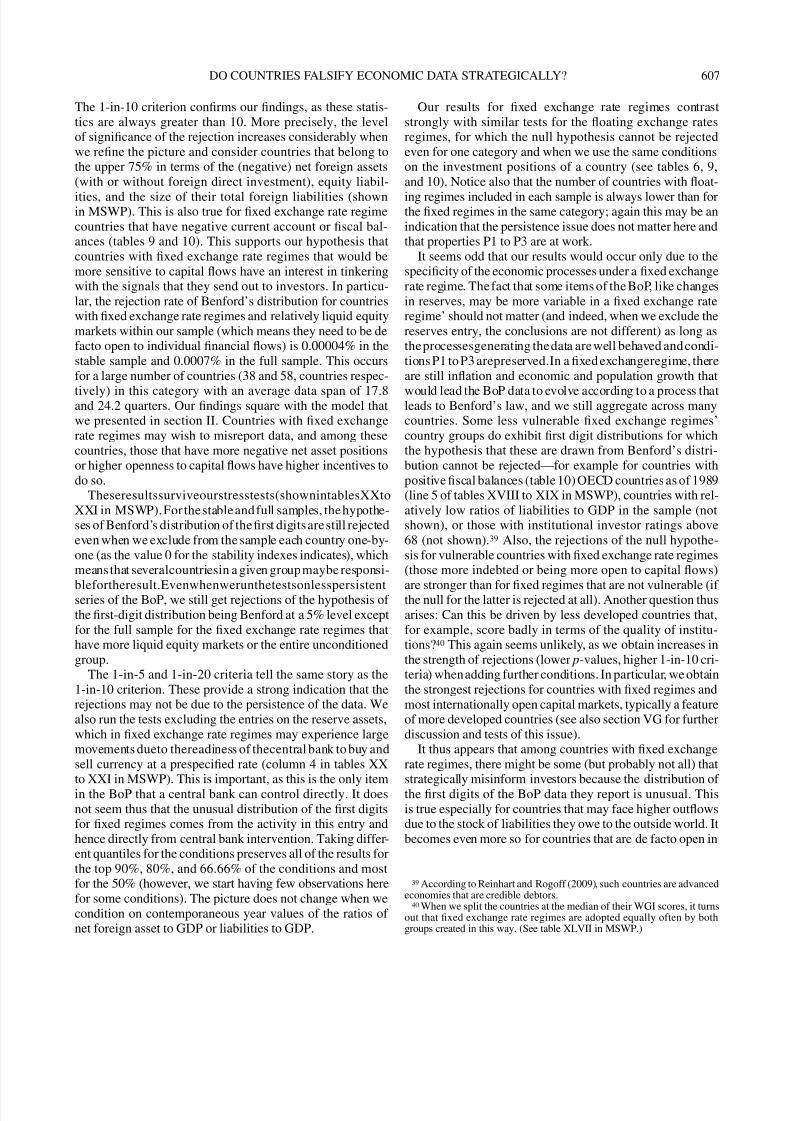
7/24/2019 Do Countries Falsify Economic Data Strategically - Some Evidence That They Might
http://slidepdf.com/reader/full/do-countries-falsify-economic-data-strategically-some-evidence-that-they 17/26
DO COUNTRIES FALSIFY ECONOMIC DATA STRATEGICALLY? 607
The 1-in-10 criterion confirms our findings, as these statis-tics are always greater than 10. More precisely, the levelof significance of the rejection increases considerably whenwe refine the picture and consider countries that belong tothe upper 75% in terms of the (negative) net foreign assets(with or without foreign direct investment), equity liabil-
ities, and the size of their total foreign liabilities (shownin MSWP). This is also true for fixed exchange rate regimecountries that have negative current account or fiscal bal-ances (tables 9 and 10). This supports our hypothesis thatcountries with fixed exchange rate regimes that would bemore sensitive to capital flows have an interest in tinkeringwith the signals that they send out to investors. In particu-lar, the rejection rate of Benford’s distribution for countrieswith fixed exchange rate regimes and relatively liquid equitymarkets within our sample (which means they need to be defacto open to individual financial flows) is 0.00004% in thestable sample and 0.0007% in the full sample. This occursfor a large number of countries (38 and 58, countries respec-
tively) in this category with an average data span of 17.8and 24.2 quarters. Our findings square with the model thatwe presented in section II. Countries with fixed exchangerate regimes may wish to misreport data, and among thesecountries, those that have more negative net asset positionsor higher openness to capital flows have higher incentives todo so.
Theseresultssurviveourstresstests(shownintablesXXtoXXI in MSWP). Forthe stable and full samples, the hypothe-ses of Benford’s distribution of the first digits are still rejectedeven when we exclude from the sample each country one-by-one (as the value 0 for the stability indexes indicates), whichmeans that severalcountriesin a given group maybe responsi-
blefortheresult.Evenwhenwerunthetestsonlesspersistentseries of the BoP, we still get rejections of the hypothesis of the first-digit distribution being Benford at a 5% level exceptfor the full sample for the fixed exchange rate regimes thathave more liquid equity markets or the entire unconditionedgroup.
The 1-in-5 and 1-in-20 criteria tell the same story as the1-in-10 criterion. These provide a strong indication that therejections may not be due to the persistence of the data. Wealso run the tests excluding the entries on the reserve assets,which in fixed exchange rate regimes may experience largemovements dueto thereadiness of thecentral bank to buy andsell currency at a prespecified rate (column 4 in tables XX
to XXI in MSWP). This is important, as this is the only itemin the BoP that a central bank can control directly. It doesnot seem thus that the unusual distribution of the first digitsfor fixed regimes comes from the activity in this entry andhence directly from central bank intervention. Taking differ-ent quantiles for the conditions preserves all of the results forthe top 90%, 80%, and 66.66% of the conditions and mostfor the 50% (however, we start having few observations herefor some conditions). The picture does not change when wecondition on contemporaneous year values of the ratios of net foreign asset to GDP or liabilities to GDP.
Our results for fixed exchange rate regimes contraststrongly with similar tests for the floating exchange ratesregimes, for which the null hypothesis cannot be rejectedeven for one category and when we use the same conditionson the investment positions of a country (see tables 6, 9,and 10). Notice also that the number of countries with float-
ing regimes included in each sample is always lower than forthe fixed regimes in the same category; again this may be anindication that the persistence issue does not matter here andthat properties P1 to P3 are at work.
It seems odd that our results would occur only due to thespecificity of the economic processes under a fixed exchangerate regime. The fact that some items of the BoP, like changesin reserves, may be more variable in a fixed exchange rateregime’ should not matter (and indeed, when we exclude thereserves entry, the conclusions are not different) as long asthe processesgenerating the data are well behaved and condi-tions P1 to P3 arepreserved.In a fixed exchangeregime, thereare still inflation and economic and population growth that
would lead the BoP data to evolve according to a process thatleads to Benford’s law, and we still aggregate across manycountries. Some less vulnerable fixed exchange regimes’country groups do exhibit first digit distributions for whichthe hypothesis that these are drawn from Benford’s distri-bution cannot be rejected—for example for countries withpositive fiscal balances (table 10) OECD countries as of 1989(line 5 of tables XVIII to XIX in MSWP), countries with rel-atively low ratios of liabilities to GDP in the sample (notshown), or those with institutional investor ratings above68 (not shown).39 Also, the rejections of the null hypothe-sis for vulnerable countries with fixed exchange rate regimes(those more indebted or being more open to capital flows)
are stronger than for fixed regimes that are not vulnerable (if the null for the latter is rejected at all). Another question thusarises: Can this be driven by less developed countries that,for example, score badly in terms of the quality of institu-tions?40 This again seems unlikely, as we obtain increases inthe strength of rejections (lower p-values, higher 1-in-10 cri-teria) whenadding further conditions. In particular, we obtainthe strongest rejections for countries with fixed regimes andmost internationally open capital markets, typically a featureof more developed countries (see also section VG for furtherdiscussion and tests of this issue).
It thus appears that among countries with fixed exchangerate regimes, there might be some (but probably not all) that
strategically misinform investors because the distribution of the first digits of the BoP data they report is unusual. Thisis true especially for countries that may face higher outflowsdue to the stock of liabilities they owe to the outside world. Itbecomes even more so for countries that are de facto open in
39 According to Reinhart and Rogoff (2009), such countries are advancedeconomies that are credible debtors.
40 When we split the countries at the median of their WGI scores, it turnsout that fixed exchange rate regimes are adopted equally often by bothgroups created in this way. (See table XLVII in MSWP.)
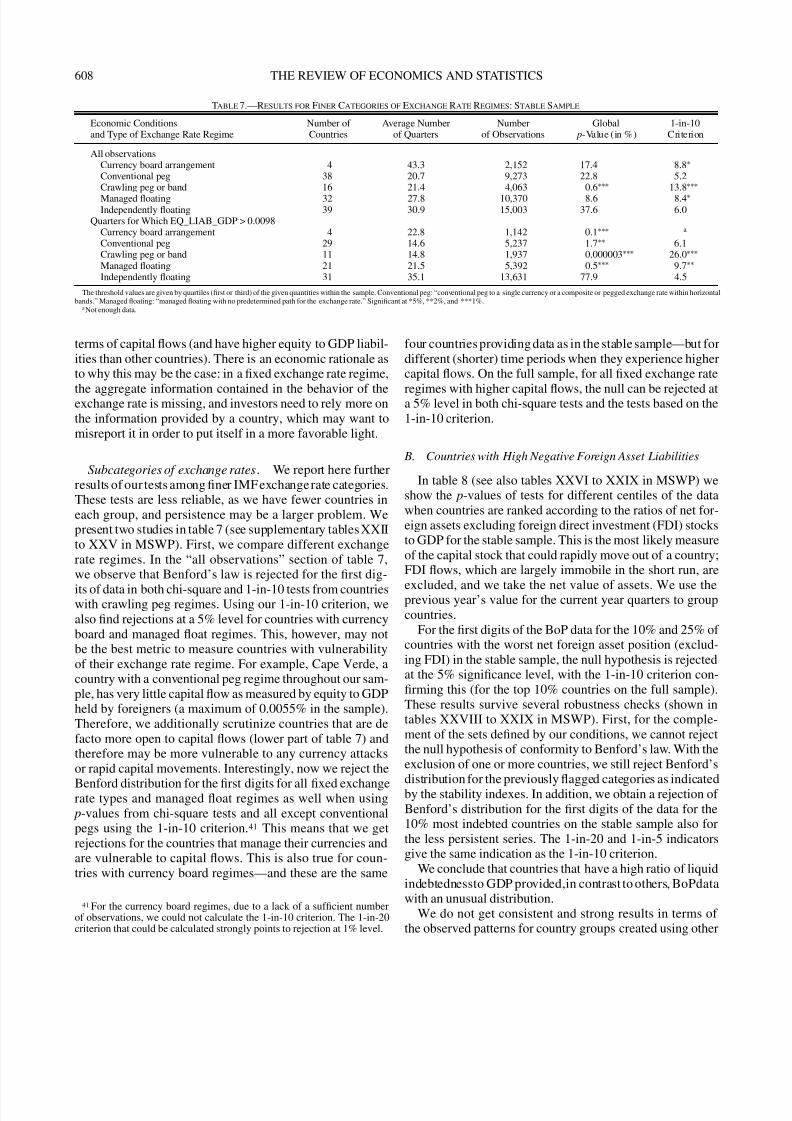
7/24/2019 Do Countries Falsify Economic Data Strategically - Some Evidence That They Might
http://slidepdf.com/reader/full/do-countries-falsify-economic-data-strategically-some-evidence-that-they 18/26
608 THE REVIEW OF ECONOMICS AND STATISTICS
Table 7.—Results for Finer Categories of Exchange Rate Regimes: Stable Sample
Economic Conditions Number of Average Number Number Global 1-in-10and Type of Exchange Rate Regime Countries of Quarters of Observations p-Value (in %) Criterion
All observationsCurrency board arrangement 4 43.3 2,152 17.4 8.8∗
Conventional peg 38 20.7 9,273 22.8 5.2Crawling peg or band 16 21.4 4,063 0.6∗∗∗ 13.8∗∗∗
Managed floating 32 27.8 10,370 8.6 8.4∗
Independently floating 39 30.9 15,003 37.6 6.0Quarters for Which EQ_LIAB_GDP > 0.0098
Currency board arrangement 4 22.8 1,142 0.1∗∗∗ a
Conventional peg 29 14.6 5,237 1.7∗∗ 6.1Crawling peg or band 11 14.8 1,937 0.000003∗∗∗ 26.0∗∗∗
Managed floating 21 21.5 5,392 0.5∗∗∗ 9.7∗∗
Independently floating 31 35.1 13,631 77.9 4.5
The threshold values are given by quartiles (first or third) of the given quantities within the sample. Conventional peg: “conventional peg to a single currency or a composite or pegged exchange rate within horizontalbands.” Managed floating: “managed floating with no predetermined path for the exchange rate.” Significant at *5%, **2%, and ***1%.
a Not enough data.
terms of capital flows (and have higher equity to GDP liabil-ities than other countries). There is an economic rationale asto why this may be the case: in a fixed exchange rate regime,
the aggregate information contained in the behavior of theexchange rate is missing, and investors need to rely more onthe information provided by a country, which may want tomisreport it in order to put itself in a more favorable light.
Subcategories of exchange rates. We report here furtherresults of our tests among finer IMFexchange rate categories.These tests are less reliable, as we have fewer countries ineach group, and persistence may be a larger problem. Wepresent two studies in table 7 (see supplementary tables XXIIto XXV in MSWP). First, we compare different exchangerate regimes. In the “all observations” section of table 7,we observe that Benford’s law is rejected for the first dig-
its of data in both chi-square and 1-in-10 tests from countrieswith crawling peg regimes. Using our 1-in-10 criterion, wealso find rejections at a 5% level for countries with currencyboard and managed float regimes. This, however, may notbe the best metric to measure countries with vulnerabilityof their exchange rate regime. For example, Cape Verde, acountry with a conventional peg regime throughout our sam-ple, has very little capital flow as measured by equity to GDPheld by foreigners (a maximum of 0.0055% in the sample).Therefore, we additionally scrutinize countries that are defacto more open to capital flows (lower part of table 7) andtherefore may be more vulnerable to any currency attacksor rapid capital movements. Interestingly, now we reject the
Benford distribution for the first digits for all fixed exchangerate types and managed float regimes as well when using p-values from chi-square tests and all except conventionalpegs using the 1-in-10 criterion.41 This means that we getrejections for the countries that manage their currencies andare vulnerable to capital flows. This is also true for coun-tries with currency board regimes—and these are the same
41 For the currency board regimes, due to a lack of a sufficient numberof observations, we could not calculate the 1-in-10 criterion. The 1-in-20criterion that could be calculated strongly points to rejection at 1% level.
four countries providing data as in the stable sample—but fordifferent (shorter) time periods when they experience highercapital flows. On the full sample, for all fixed exchange rate
regimes with higher capital flows, the null can be rejected ata 5% level in both chi-square tests and the tests based on the1-in-10 criterion.
B. Countries with High Negative Foreign Asset Liabilities
In table 8 (see also tables XXVI to XXIX in MSWP) weshow the p-values of tests for different centiles of the datawhen countries are ranked according to the ratios of net for-eign assets excluding foreign direct investment (FDI) stocksto GDP for the stable sample. This is the most likely measureof the capital stock that could rapidly move out of a country;FDI flows, which are largely immobile in the short run, are
excluded, and we take the net value of assets. We use theprevious year’s value for the current year quarters to groupcountries.
For the first digits of the BoP data for the 10% and 25% of countries with the worst net foreign asset position (exclud-ing FDI) in the stable sample, the null hypothesis is rejectedat the 5% significance level, with the 1-in-10 criterion con-firming this (for the top 10% countries on the full sample).These results survive several robustness checks (shown intables XXVIII to XXIX in MSWP). First, for the comple-ment of the sets defined by our conditions, we cannot rejectthe null hypothesis of conformity to Benford’s law. With theexclusion of one or more countries, we still reject Benford’s
distribution for the previously flagged categories as indicatedby the stability indexes. In addition, we obtain a rejection of Benford’s distribution for the first digits of the data for the10% most indebted countries on the stable sample also forthe less persistent series. The 1-in-20 and 1-in-5 indicatorsgive the same indication as the 1-in-10 criterion.
We conclude that countries that have a high ratio of liquidindebtednessto GDP provided,in contrast to others, BoPdatawith an unusual distribution.
We do not get consistent and strong results in terms of the observed patterns for country groups created using other
7/24/2019 Do Countries Falsify Economic Data Strategically - Some Evidence That They Might
http://slidepdf.com/reader/full/do-countries-falsify-economic-data-strategically-some-evidence-that-they 19/26
DO COUNTRIES FALSIFY ECONOMIC DATA STRATEGICALLY? 609
Table 8.—Results for Countries Grouped by Net Foreign Asset Liabilities, Excluding Foreign Direct Investment: Main Results, Stable Sample
Economic Conditions: NFA_EXCL_FDI_GDP Number of Average Number Number Global 1-in-10Quantile Level Value Countries of Quarters of Observations p-Value (in %) Criterion
≤10% quantile −0.581 18 19.3 4,003 0.003∗∗∗ 14.4∗∗∗
>10% quantile −0.581 64 47.1 36,580 31.8 5.6≤20% quantile −0.432 24 28.5 8,008 0.1∗∗∗ 10.0∗∗
>20% quantile −0.432 63 42.5 32,575 39.3 6≤25% quantile −0.379 30 28.5 10,086 0.1∗∗∗ 9.9∗∗
>25% quantile −0.379 62 40.4 30,497 40.7 7≤50% quantile −0.193 48 35.4 20,234 7.3 7.5>50% quantile −0.193 46 36.1 20,349 35.3 5.2≤75% quantile −0.02 59 43 30,480 3.2∗ 8.4∗
>75% quantile −0.02 30 27.5 10,103 37.8 5.2≤80% quantile 0.015 60 45 32,494 6.7 7.7> 80% quantile 0.015 29 22.8 8,089 52.1 5.5≤90% quantile 0.144 63 48.1 36,527 8.5 6.9>90% quantile 0.144 15 21.9 4,056 15.8 5.7
Significant at *5%, **2%, and ***1%.
Table 9.—Results for Countries Grouped by the Sign of Their Current Account Balances: Main Results, Stable Sample
Economic Conditions
Sign of the Other Number of Average Number Number Global 1-in-10Current Account Conditions Countries of Quarters of Observations p-Value (in %) Criterion
CA ≥ 0 61 20.6 15,360 15.6 5.2CA < 0 63 34.3 25,849 0.2∗∗∗ 10.9∗∗∗
[No condition] Fixed exchange 49 26.6 15,488 0.5∗∗∗ 13.3∗∗∗
CA ≥ 0 Fixed exchange 37 10.1 4,494 29.6 5CA < 0 Fixed exchange 45 20.4 10,958 0.007∗∗∗ 15.6∗∗∗
[No condition] Floating exchange 39 30.9 15,003 37.6 5.8CA ≥ 0 Floating exchange 31 16.7 6,590 69.8 5.6CA < 0 Floating exchange 35 19.6 8,413 5.2 7.5[No condition] NFA_EXCL_FDI_GDP ≤–0.0201 59 43.0 30,480 3.2∗ 8.4∗
CA ≥ 0 NFA_EXCL_FDI_GDP ≤–0.0201 48 17.5 10,230 46.7 4.1CA < 0 NFA_EXCL_FDI_GDP ≤–0.0201 57 29.8 20,250 0.1∗∗∗ 11.5∗∗∗
[No condition] EQ_LIAB_GDP > 0.0098 51 43.5 27,339 72 4.1CA ≥ 0 EQ_LIAB_GDP > 0.0098 43 22.9 12,228 40.5 4.9CA < 0 EQ_LIAB_GDP > 0.0098 48 25.6 15,111 2.0∗ 9.2∗∗
The threshold values are given by quartiles (first or third) of the given quantities within the sample. Significant at *5%, **2%, and ***1%.
measures of investment positions. In particular, for the fullsample, we obtain rejections of Benford’s distribution of thefirst digits also for countries with the highest net foreign assetpositions and the lowest liabilities to GDP ratio, although weget similar results as for countries with net foreign assets(excluding FDI) for the stable sample. These series may belesspertinentforourtests.Forexample,thefactthatacountryhasa high ratio of total liabilityto GDP, like Switzerland,maynot be an indicator that it is vulnerable if it has high assets aswell. It may also mean that we cannot condition the data wellenough; for example, we do not control for many features,like differences in technology, that may affect the payoffsfrom misreporting. The data on liabilities may not be free of error, and these are data that we have on a yearly basis only.Therefore, if the data set heterogeneity is large, the picturemay be blurred with these less precise measures.
C. Countries with Negative Current Account Balances
We report in table 9 (see also tables XXX to XXXIIIin MSWP) the results of tests for countries with negative
current account positions in a given quarter (labeled CA inthe tables).
By taking into account the p-values and the 1-in-10 cri-terion, we observe that in both the stable ( p-value of 0.2%and 1-in-10 criterion at a 1% significance level) and the fullsample ( p-value of 5.6% and 1-in-10 criterion indicatingrejection at less than a 2% significance level), we obtain arejectionof theconformity of thefirst digitsof theBoP data toBenford’s distribution for countriesthat have negative currentaccount positions in a given quarter. Sixty-three of 66 coun-tries at some point in time have a negative current accountfigure (99 out of 103 for the full sample). This shows that therejection of this condition is not due to country-specific datadissemination practices but rather to what is reported whenthecountry in question is borrowing from therest of theworldin a quarter. The same is true when we select countries withthe highest level of net indebtedness (with or without FDI),fixed exchange rates, or fiscal deficits (shown in table 10) thatare running negative current accounts.
The robustness tests are presented in tables XXXII toXXXIII in MSWP. In general, they confirm our findings
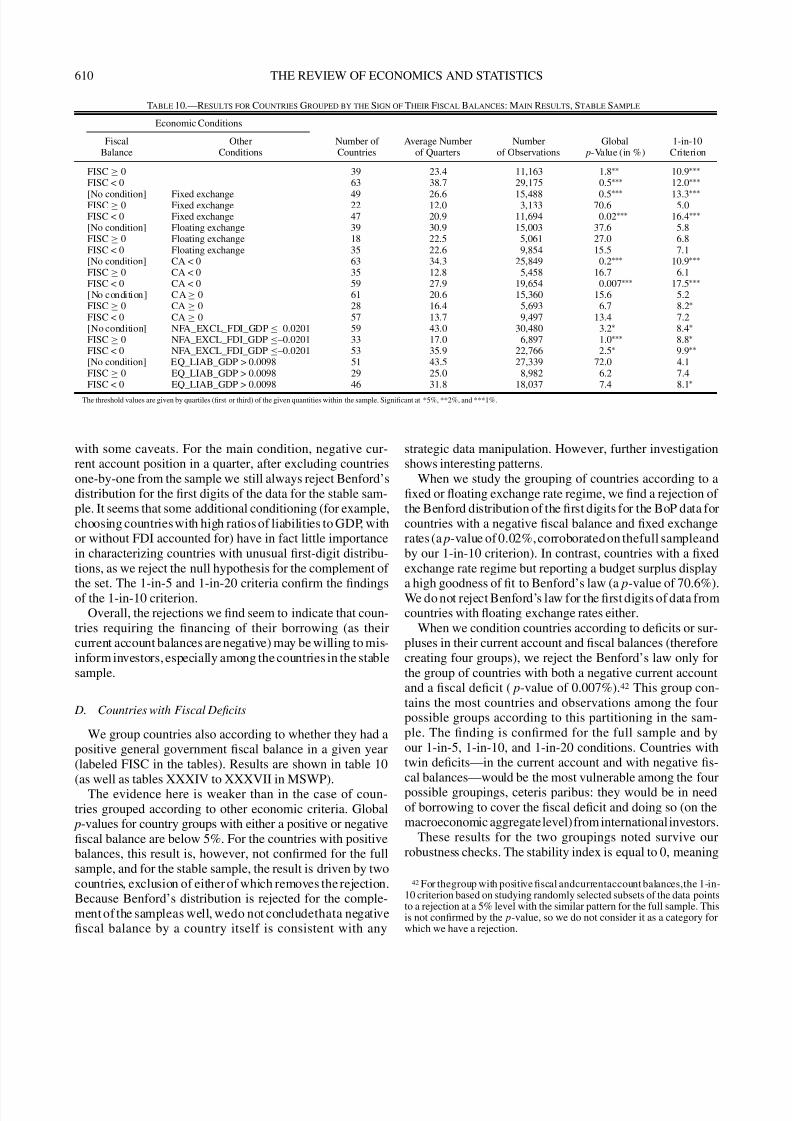
7/24/2019 Do Countries Falsify Economic Data Strategically - Some Evidence That They Might
http://slidepdf.com/reader/full/do-countries-falsify-economic-data-strategically-some-evidence-that-they 20/26
610 THE REVIEW OF ECONOMICS AND STATISTICS
Table 10.—Results for Countries Grouped by the Sign of Their Fiscal Balances: Main Results, Stable Sample
Economic Conditions
Fiscal Other Number of Average Number Number Global 1-in-10Balance Conditions Countries of Quarters of Observations p-Value (in %) Criterion
FISC ≥ 0 39 23.4 11,163 1.8∗∗ 10.9∗∗∗
FISC < 0 63 38.7 29,175 0.5∗∗∗ 12.0∗∗∗
[No condition] Fixed exchange 49 26.6 15,488 0.5∗∗∗
13.3∗∗∗
FISC ≥ 0 Fixed exchange 22 12.0 3,133 70.6 5.0FISC < 0 Fixed exchange 47 20.9 11,694 0.02∗∗∗ 16.4∗∗∗
[No condition] Floating exchange 39 30.9 15,003 37.6 5.8FISC ≥ 0 Floating exchange 18 22.5 5,061 27.0 6.8FISC < 0 Floating exchange 35 22.6 9,854 15.5 7.1[No condition] CA < 0 63 34.3 25,849 0.2∗∗∗ 10.9∗∗∗
FISC ≥ 0 CA < 0 35 12.8 5,458 16.7 6.1FISC < 0 CA < 0 59 27.9 19,654 0.007∗∗∗ 17.5∗∗∗
[No condition] CA ≥ 0 61 20.6 15,360 15.6 5.2FISC ≥ 0 CA ≥ 0 28 16.4 5,693 6.7 8.2∗
FISC < 0 CA ≥ 0 57 13.7 9,497 13.4 7.2[No condition] NFA_EXCL_FDI_GDP ≤–0.0201 59 43.0 30,480 3.2∗ 8.4∗
FISC ≥ 0 NFA_EXCL_FDI_GDP ≤–0.0201 33 17.0 6,897 1.0∗∗∗ 8.8∗
FISC < 0 NFA_EXCL_FDI_GDP ≤–0.0201 53 35.9 22,766 2.5∗ 9.9∗∗
[No condition] EQ_LIAB_GDP > 0.0098 51 43.5 27,339 72.0 4.1FISC ≥ 0 EQ_LIAB_GDP > 0.0098 29 25.0 8,982 6.2 7.4FISC < 0 EQ_LIAB_GDP > 0.0098 46 31.8 18,037 7.4 8.1∗
The threshold values are given by quartiles (first or third) of the given quantities within the sample. Significant at *5%, **2%, and ***1%.
with some caveats. For the main condition, negative cur-rent account position in a quarter, after excluding countriesone-by-one from the sample we still always reject Benford’sdistribution for the first digits of the data for the stable sam-ple. It seems that some additional conditioning (for example,choosing countries with high ratios of liabilities to GDP, withor without FDI accounted for) have in fact little importancein characterizing countries with unusual first-digit distribu-tions, as we reject the null hypothesis for the complement of
the set. The 1-in-5 and 1-in-20 criteria confirm the findingsof the 1-in-10 criterion.Overall, the rejections we find seem to indicate that coun-
tries requiring the financing of their borrowing (as theircurrent account balances are negative) may be willing to mis-inform investors, especially among the countries in the stablesample.
D. Countries with Fiscal Deficits
We group countries also according to whether they had apositive general government fiscal balance in a given year(labeled FISC in the tables). Results are shown in table 10
(as well as tables XXXIV to XXXVII in MSWP).The evidence here is weaker than in the case of coun-tries grouped according to other economic criteria. Global
p-values for country groups with either a positive or negativefiscal balance are below 5%. For the countries with positivebalances, this result is, however, not confirmed for the fullsample, and for the stable sample, the result is driven by twocountries, exclusion of either of which removes the rejection.Because Benford’s distribution is rejected for the comple-ment of the sampleas well, wedo not concludethata negativefiscal balance by a country itself is consistent with any
strategic data manipulation. However, further investigationshows interesting patterns.
When we study the grouping of countries according to afixed or floating exchange rate regime, we find a rejection of the Benford distribution of the first digits for the BoP data forcountries with a negative fiscal balance and fixed exchangerates (a p-value of 0.02%, corroborated on thefull sampleandby our 1-in-10 criterion). In contrast, countries with a fixedexchange rate regime but reporting a budget surplus display
a high goodness of fit to Benford’s law (a p-value of 70.6%).We do not reject Benford’s law for the first digits of data fromcountries with floating exchange rates either.
When we condition countries according to deficits or sur-pluses in their current account and fiscal balances (thereforecreating four groups), we reject the Benford’s law only forthe group of countries with both a negative current accountand a fiscal deficit ( p-value of 0.007%).42 This group con-tains the most countries and observations among the fourpossible groups according to this partitioning in the sam-ple. The finding is confirmed for the full sample and byour 1-in-5, 1-in-10, and 1-in-20 conditions. Countries withtwin deficits—in the current account and with negative fis-cal balances—would be the most vulnerable among the fourpossible groupings, ceteris paribus: they would be in needof borrowing to cover the fiscal deficit and doing so (on themacroeconomic aggregatelevel)from internationalinvestors.
These results for the two groupings noted survive ourrobustness checks. The stability index is equal to 0, meaning
42 For thegroup with positive fiscal andcurrentaccount balances,the 1-in-10 criterion based on studying randomly selected subsets of the data pointsto a rejection at a 5% level with the similar pattern for the full sample. Thisis not confirmed by the p-value, so we do not consider it as a category forwhich we have a rejection.
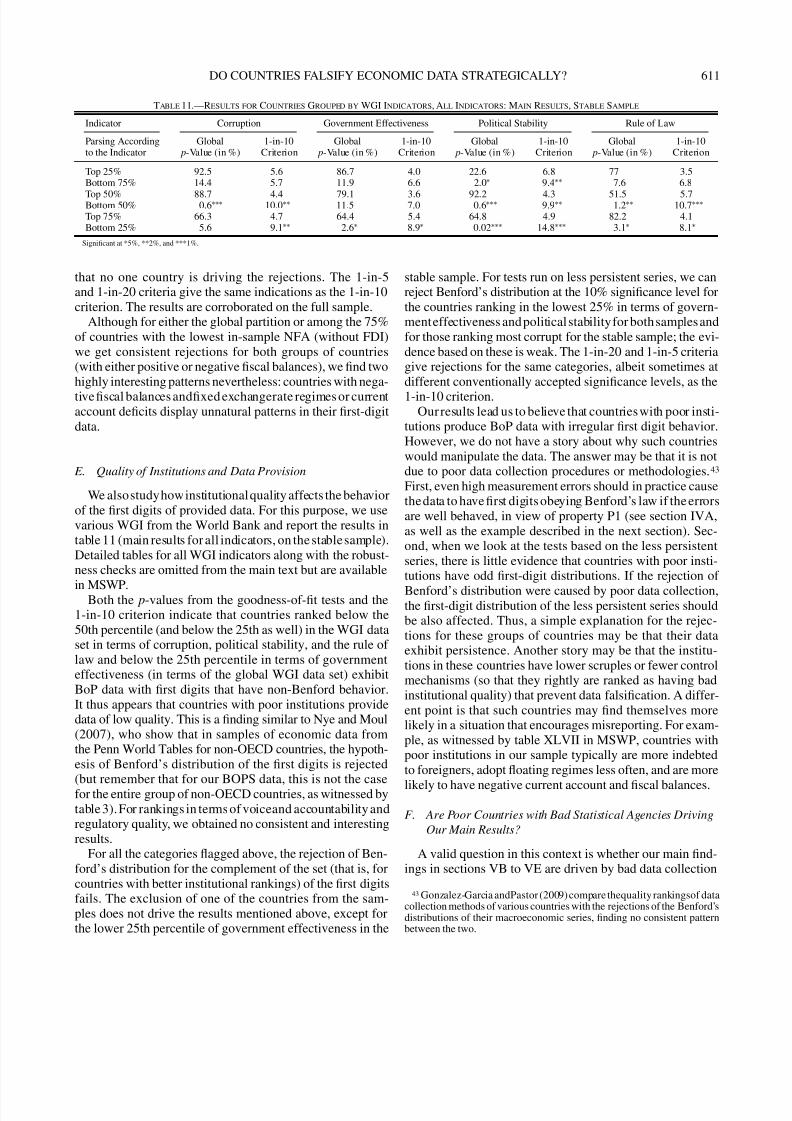
7/24/2019 Do Countries Falsify Economic Data Strategically - Some Evidence That They Might
http://slidepdf.com/reader/full/do-countries-falsify-economic-data-strategically-some-evidence-that-they 21/26
DO COUNTRIES FALSIFY ECONOMIC DATA STRATEGICALLY? 611
Table 11.—Results for Countries Grouped by WGI Indicators, All Indicators: Main Results, Stable Sample
Indicator Corruption Government Effectiveness Political Stability Rule of Law
Parsing According Global 1-in-10 Global 1-in-10 Global 1-in-10 Global 1-in-10to the Indicator p-Value (in %) Criterion p-Value (in %) Criterion p-Value (in %) Criterion p-Value (in %) Criterion
Top 25% 92.5 5.6 86.7 4.0 22.6 6.8 77 3.5Bottom 75% 14.4 5.7 11.9 6.6 2.0∗ 9.4∗∗ 7.6 6.8
Top 50% 88.7 4.4 79.1 3.6 92.2 4.3 51.5 5.7Bottom 50% 0.6∗∗∗ 10.0∗∗ 11.5 7.0 0.6∗∗∗ 9.9∗∗ 1.2∗∗ 10.7∗∗∗
Top 75% 66.3 4.7 64.4 5.4 64.8 4.9 82.2 4.1Bottom 25% 5.6 9.1∗∗ 2.6∗ 8.9∗ 0.02∗∗∗ 14.8∗∗∗ 3.1∗ 8.1∗
Significant at *5%, **2%, and ***1%.
that no one country is driving the rejections. The 1-in-5and 1-in-20 criteria give the same indications as the 1-in-10criterion. The results are corroborated on the full sample.
Although for either the global partition or among the 75%of countries with the lowest in-sample NFA (without FDI)we get consistent rejections for both groups of countries(with either positive or negative fiscal balances), we find twohighly interesting patterns nevertheless: countries with nega-
tive fiscal balances andfixed exchangerate regimes or currentaccount deficits display unnatural patterns in their first-digitdata.
E. Quality of Institutions and Data Provision
We alsostudyhowinstitutionalquality affects the behaviorof the first digits of provided data. For this purpose, we usevarious WGI from the World Bank and report the results intable 11 (main results for all indicators, on the stable sample).Detailed tables for all WGI indicators along with the robust-ness checks are omitted from the main text but are available
in MSWP.Both the p-values from the goodness-of-fit tests and the1-in-10 criterion indicate that countries ranked below the50th percentile (and below the 25th as well) in the WGI dataset in terms of corruption, political stability, and the rule of law and below the 25th percentile in terms of governmenteffectiveness (in terms of the global WGI data set) exhibitBoP data with first digits that have non-Benford behavior.It thus appears that countries with poor institutions providedata of low quality. This is a finding similar to Nye and Moul(2007), who show that in samples of economic data fromthe Penn World Tables for non-OECD countries, the hypoth-esis of Benford’s distribution of the first digits is rejected
(but remember that for our BOPS data, this is not the casefor the entire group of non-OECD countries, as witnessed bytable 3). For rankings in terms of voiceand accountability andregulatory quality, we obtained no consistent and interestingresults.
For all the categories flagged above, the rejection of Ben-ford’s distribution for the complement of the set (that is, forcountries with better institutional rankings) of the first digitsfails. The exclusion of one of the countries from the sam-ples does not drive the results mentioned above, except forthe lower 25th percentile of government effectiveness in the
stable sample. For tests run on less persistent series, we canreject Benford’s distribution at the 10% significance level forthe countries ranking in the lowest 25% in terms of govern-menteffectiveness and politicalstabilityfor both samples andfor those ranking most corrupt for the stable sample; the evi-dence based on these is weak. The 1-in-20 and 1-in-5 criteriagive rejections for the same categories, albeit sometimes atdifferent conventionally accepted significance levels, as the
1-in-10 criterion.Ourresults lead us to believe that countries with poor insti-
tutions produce BoP data with irregular first digit behavior.However, we do not have a story about why such countrieswould manipulate the data. The answer may be that it is notdue to poor data collection procedures or methodologies.43
First, even high measurement errors should in practice causethe data to have first digits obeying Benford’s law if the errorsare well behaved, in view of property P1 (see section IVA,as well as the example described in the next section). Sec-ond, when we look at the tests based on the less persistentseries, there is little evidence that countries with poor insti-tutions have odd first-digit distributions. If the rejection of
Benford’s distribution were caused by poor data collection,the first-digit distribution of the less persistent series shouldbe also affected. Thus, a simple explanation for the rejec-tions for these groups of countries may be that their dataexhibit persistence. Another story may be that the institu-tions in these countries have lower scruples or fewer controlmechanisms (so that they rightly are ranked as having badinstitutional quality) that prevent data falsification. A differ-ent point is that such countries may find themselves morelikely in a situation that encourages misreporting. For exam-ple, as witnessed by table XLVII in MSWP, countries withpoor institutions in our sample typically are more indebtedto foreigners, adopt floating regimes less often, and are more
likely to have negative current account and fiscal balances.
F. Are Poor Countries with Bad Statistical Agencies Driving
Our Main Results?
A valid question in this context is whether our main find-ings in sections VB to VE are driven by bad data collection
43 Gonzalez-Garcia andPastor (2009) compare thequality rankingsof datacollection methods of various countries with the rejections of the Benford’sdistributions of their macroeconomic series, finding no consistent patternbetween the two.
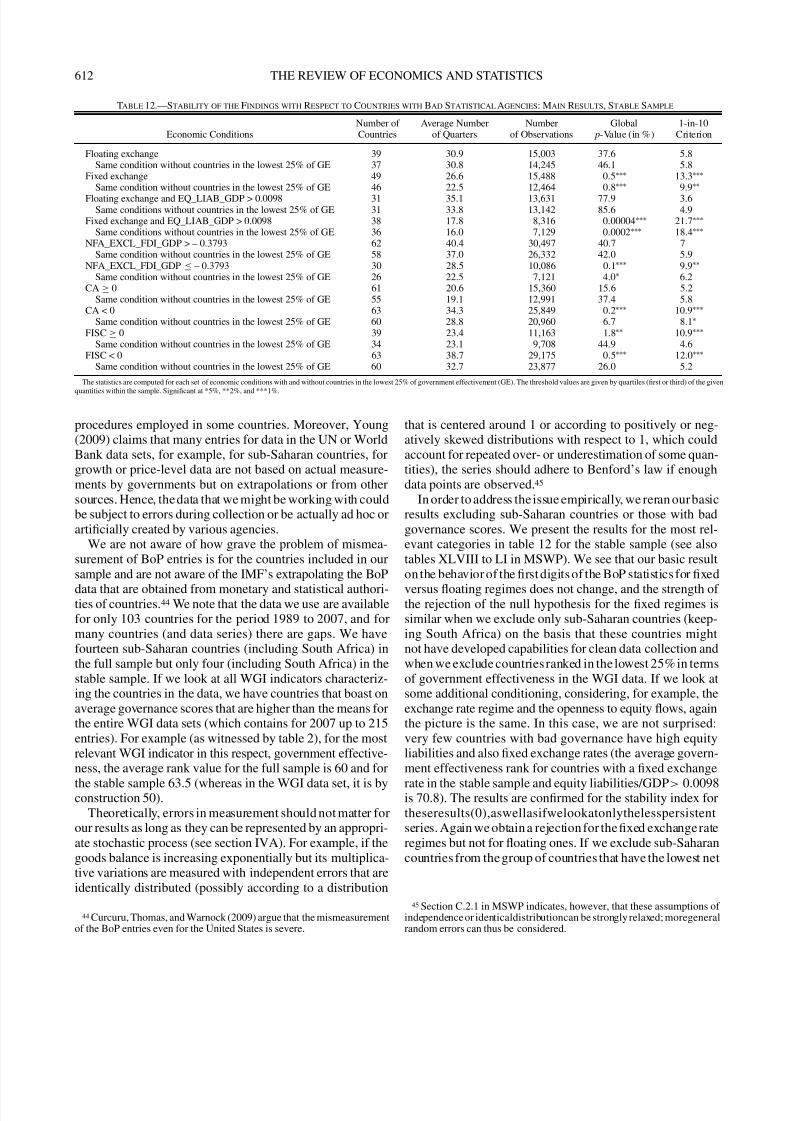
7/24/2019 Do Countries Falsify Economic Data Strategically - Some Evidence That They Might
http://slidepdf.com/reader/full/do-countries-falsify-economic-data-strategically-some-evidence-that-they 22/26
612 THE REVIEW OF ECONOMICS AND STATISTICS
Table 12.—Stability of the Findings with Respect to Countries with Bad Statistical Agencies: Main Results, Stable Sample
Number of Average Number Number Global 1-in-10Economic Conditions Countries of Quarters of Observations p-Value (in %) Criterion
Floating exchange 39 30.9 15,003 37.6 5.8Same condition without countries in the lowest 25% of GE 37 30.8 14,245 46.1 5.8
Fixed exchange 49 26.6 15,488 0.5∗∗∗ 13.3∗∗∗
Same condition without countries in the lowest 25% of GE 46 22.5 12,464 0.8∗∗∗ 9.9∗∗
Floating exchange and EQ_LIAB_GDP > 0.0098 31 35.1 13,631 77.9 3.6Same conditions without countries in the lowest 25% of GE 31 33.8 13,142 85.6 4.9
Fixed exchange and EQ_LIAB_GDP > 0.0098 38 17.8 8,316 0.00004∗∗∗ 21.7∗∗∗
Same conditions without countries in the lowest 25% of GE 36 16.0 7,129 0.0002∗∗∗ 18.4∗∗∗
NFA_EXCL_FDI_GDP > – 0.3793 62 40.4 30,497 40.7 7Same condition without countries in the lowest 25% of GE 58 37.0 26,332 42.0 5.9
NFA_EXCL_FDI_GDP ≤ – 0.3793 30 28.5 10,086 0.1∗∗∗ 9.9∗∗
Same condition without countries in the lowest 25% of GE 26 22.5 7,121 4.0∗ 6.2CA ≥ 0 61 20.6 15,360 15.6 5.2
Same condition without countries in the lowest 25% of GE 55 19.1 12,991 37.4 5.8CA < 0 63 34.3 25,849 0.2∗∗∗ 10.9∗∗∗
Same condition without countries in the lowest 25% of GE 60 28.8 20,960 6.7 8.1∗
FISC ≥ 0 39 23.4 11,163 1.8∗∗ 10.9∗∗∗
Same condition without countries in the lowest 25% of GE 34 23.1 9,708 44.9 4.6FISC < 0 63 38.7 29,175 0.5∗∗∗ 12.0∗∗∗
Same condition without countries in the lowest 25% of GE 60 32.7 23,877 26.0 5.2
The statistics are computed for each set of economic conditions with and without countries in the lowest 25% of government effectivement (GE). The threshold values are given by quartiles (first or third) of the given
quantities within the sample. Significant at *5%, **2%, and ***1%.
procedures employed in some countries. Moreover, Young(2009) claims that many entries for data in the UN or WorldBank data sets, for example, for sub-Saharan countries, forgrowth or price-level data are not based on actual measure-ments by governments but on extrapolations or from othersources. Hence, the data that we might be working with couldbe subject to errors during collection or be actually ad hoc orartificially created by various agencies.
We are not aware of how grave the problem of mismea-surement of BoP entries is for the countries included in oursample and are not aware of the IMF’s extrapolating the BoP
data that are obtained from monetary and statistical authori-ties of countries.44 We note that the data we use are availablefor only 103 countries for the period 1989 to 2007, and formany countries (and data series) there are gaps. We havefourteen sub-Saharan countries (including South Africa) inthe full sample but only four (including South Africa) in thestable sample. If we look at all WGI indicators characteriz-ing the countries in the data, we have countries that boast onaverage governance scores that are higher than the means forthe entire WGI data sets (which contains for 2007 up to 215entries). For example (as witnessed by table 2), for the mostrelevant WGI indicator in this respect, government effective-ness, the average rank value for the full sample is 60 and for
the stable sample 63.5 (whereas in the WGI data set, it is byconstruction 50).Theoretically, errors in measurement should not matter for
our results as long as they can be represented by an appropri-ate stochastic process (see section IVA). For example, if thegoods balance is increasing exponentially but its multiplica-tive variations are measured with independent errors that areidentically distributed (possibly according to a distribution
44 Curcuru, Thomas, and Warnock (2009) argue that the mismeasurementof the BoP entries even for the United States is severe.
that is centered around 1 or according to positively or neg-atively skewed distributions with respect to 1, which couldaccount for repeated over- or underestimation of some quan-tities), the series should adhere to Benford’s law if enoughdata points are observed.45
In order to address the issue empirically, we reran ourbasicresults excluding sub-Saharan countries or those with badgovernance scores. We present the results for the most rel-evant categories in table 12 for the stable sample (see alsotables XLVIII to LI in MSWP). We see that our basic resulton the behavior of the first digits of the BoP statistics for fixed
versus floating regimes does not change, and the strength of the rejection of the null hypothesis for the fixed regimes issimilar when we exclude only sub-Saharan countries (keep-ing South Africa) on the basis that these countries mightnot have developed capabilities for clean data collection andwhen we exclude countries ranked in the lowest 25%in termsof government effectiveness in the WGI data. If we look atsome additional conditioning, considering, for example, theexchange rate regime and the openness to equity flows, againthe picture is the same. In this case, we are not surprised:very few countries with bad governance have high equityliabilities and also fixed exchange rates (the average govern-ment effectiveness rank for countries with a fixed exchange
rate in the stable sample and equity liabilities/GDP> 0.0098is 70.8). The results are confirmed for the stability index fortheseresults(0),aswellasifwelookatonlythelesspersistentseries. Again we obtain a rejection for the fixed exchange rateregimes but not for floating ones. If we exclude sub-Saharancountries from the group of countries that have the lowest net
45 Section C.2.1 in MSWP indicates, however, that these assumptions of independence or identicaldistributioncan be strongly relaxed; moregeneralrandom errors can thus be considered.
7/24/2019 Do Countries Falsify Economic Data Strategically - Some Evidence That They Might
http://slidepdf.com/reader/full/do-countries-falsify-economic-data-strategically-some-evidence-that-they 23/26
DO COUNTRIES FALSIFY ECONOMIC DATA STRATEGICALLY? 613
foreign assets to GDP ratio (excluding foreign direct invest-ment liabilities), the rejection patterns are confirmed. Theevidence is weaker when we exclude from the same groupthe countries with the lowest government effectiveness, butwe still obtain a rejection at 5% when we scrutinize the p-value. For the countries with a negative current account in
a given quarter, the null hypothesis is rejected at 0.1% levelwhen we exclude sub-Saharan countries and at 6.7% whenwe exclude those with the lowest government effectivenessscores. The results for countries grouped by fiscal balancesare the only ones for which we cannot obtain rejections aftercountries with poor institutional scores are dropped from thesample. Nevertheless, for the groupings of interest for whichwe claimed rejections in section VE—countries with nega-tive fiscal balances and fixed exchange rates or countries withtwin deficits—we still reject the Benford distribution of thefirst digits of the data when we exclude countries ranked ineither the lowest 25% in terms of government effectivenessor the sub-Saharan countries (except South Africa) for the
stable sample at least a 5% level (results not shown).Based on our discussion, we do not believe that ourresults are driven by poor countries with bad data collectionprocedures.
G. Other Conditions for Defining the Subsets of the Data
We have tried other conditioning of the data in our searchof unusual reporting patterns.46 First, we studied (akin tosection VC) whether countries with more capital openness(defined as high ratios of foreign equity liabilities to GDP)exhibit non-Benford distribution of their first digits of the
BoP data. Scrutinizing the tails of data sorted according tothis measure, we find no results that this is the case.Next, for countries that joined the euro zone, we inspected
the period in which they had to maintain a fixed exchangerate regime and satisfy certain economic performance crite-ria for admission. We do not find any evidence that the BoPdata are unusual for up to five years prior to joining the zone.However, interestingly, we find that the Benford distributionis rejected for the first digits of the BoP statistics for thesecountries after joining the euro zone. For the full sample, the
p-value is 0.08% and the 1-in-10 criterion 14.6 (both statisti-cally significant at 1% level) with 4,623 observations and 11countries (Belgium and Luxembourg are not in our data set).For the stable sample, the p-value is 0.18% with a 1-in-10 cri-terion of 14.1 (4,259 observations and 10 countries). There
46 For geographically based country groupings (see section C.4.2in MSWP), we rely on the 1-in-10 criterion as the persistence issue may besevere. We find that countries in Africa and the Middle East (for both thefull and stable samples), Latin America, and Eastern Europe (for the stablesample) have suspect distributions of the first digits. This should be takenwith caution, as there are relatively few countries in each group with manyquarters of data each, which may make rejecting the null hypothesis easier(testson theleastpersistent seriesdo notconfirm anyof thefindings). Theremaybe also toolittle heterogeneity forproperty P2 to be able to compensatefor the possible persistence issues.
are two explanations in the context of our model. First, adher-ence to the common currency caused capital flows barriersto fall. Second, the cost of leaving the euro zone is high, sothe fear of a substantial attack that would force a country toleave the joint currency arrangement might induce countriesto misreport the statistics more often.
We also investigated countries with episodes of sovereigndefault andbanking crises(dataon their timing obtained fromReinhart & Rogoff, 2009). For countries that defaulted ontheir sovereign debt within our sample period, we do notfind rejections of the null hypothesis for one-, two-, or three-year brackets preceding a default (results shown in table LIIIin MSWP). The first digits of the statistics released by coun-tries three, five, ten, and twenty years after default appear toconform with the Benford distribution.Thisis consistent withinvestors’ threatening a more severe punishment for futuredefault (or misinformation) but also with lower capital flowsafter a default occurs. After default, a country’s actions mayalso be scrutinizedmore closely by investors or the IMF. Note
that default for the countries in our sample is observed onaverage for less developed countries with worse governancescores (for example, the meangovernment effectiveness WGIranking among countries five years after default is 31, muchlowerthantheaverageof60fortheentiresample).Thisfavorsour strategic argument and is against the main competingexplanation that countries with poor institutions are respon-sible for our results. However, we find evidence that withinone year after enduring banking crises, countries report sus-picious distributions of the BoP data. For these, we can rejectthe hypothesis that the first digits conform to Benford’s dis-tribution at 0.2% with 5,094 observations on the full sampleand 5.6% for the stable sample (2,487 observations).
There seems to be no evidence that countries sufferingsubstantial falls in their institutional investor country creditratings, either contemporaneous, lead or lagged, offer suspectstatistics.
We found no strong results for countries grouped by thelevel of their year-to-year inflation, though our 1-in-10 cri-teria reject the Benford distribution for the first digits of statistics from countries with an inflation rate higher than10% for both the stable and full samples at a 2% level.
We inspect our data for main categories on a year-by-yearbasis in section C.4.1 in MSWP. We find rejections of theBenford distribution for many vulnerable country groupingsfor 1996, 1997, and 2006. For 1997, one can rationalize the
finding in favor of proposition 5: an unexpected global crisisputmany countries in a position where they misreported theirdata. We do not know, however, what investors’ expectationswere in 1997 (and for the other years as well), so we do notdraw any conclusions from this exercise.
H. Summary of the Empirical Results
We find results consistent with the hypothesis that coun-tries strategically provide manipulated data to economicagents.WeobserverejectionsofBenford’sdistributionforthe
7/24/2019 Do Countries Falsify Economic Data Strategically - Some Evidence That They Might
http://slidepdf.com/reader/full/do-countries-falsify-economic-data-strategically-some-evidence-that-they 24/26
614 THE REVIEW OF ECONOMICS AND STATISTICS
first digits of data issued by groups of countries that are morevulnerable to high capital outflows. From the main resultsshown in tables 6, 8, 9, and 10, we find such a pattern inten out of thirteen groupings with the three inconclusive onesinvolving partitions using fiscal balances. These rejectionsare rather category than country specific, as data from many
countries for different quarters enter different categories. Weobtain the strongest (also most robust) results for countrieswith fixed exchange rate regimes, though we also find thatcountrieswiththehighestlevelsofnetindebtednessandthosethat were running current account deficits have first digitsthat have unusual, non-Benford distributions. The Benforddistribution is rejected for the first digits of the BoP statisticsfor euro-adopting countries after these join the euro zone.These findings confirm the viability of the intuition devel-oped by the simple model in section II. However, we do notfind general results for countries that were de facto moreopen to capital flows. This may be due to the fact that weare unable to capture the extent of their vulnerability very
finely; but for some subgroups of countries (for example,those with fixed exchange rate regimes and relatively highde facto openness), we still get very strong rejections of thenull hypothesis. The interesting findingon the fixed exchangerate regime countries may show that the public is more read-ily misinformed by governments when there is a larger scopefor misinformation—for example, when the market pricesaggregating private information are missing. We find alsoevidence that countries with weak institutions provide datathat are non-Benford distributed; moreover, it seems that theyare not driving our main results in sections VA to VD.
VI. Conclusion
In this paper we took a glimpse at the dark side of the moonof government statistics. We conclude that country-quarterpairs that correspond to economic situations in which coun-tries would have higher incentives to misinform investorslead to different distributions of the corresponding first digitsof the balance-of-payments data than Benford’s distribution,while for other country-quarter pairs, the data conform to thisdistribution. This may be because there is a differentunderly-ing process that rules the generation of balance-of-paymentsdistributions in country-quarter pairs for vulnerable coun-tries, which we think is unlikely. It may be simply that suchcountries at times falsify their balance-of-payments data in
these quarters. This partial evidence on the strategiccharacterof misreporting points out that models in which governmentsemit public signals (for example, the discussion on centralbank transparency) should seriously consider the possibil-ity that this signal may be intentionally misleading at times.On the policy side, this paper calls for the need to establishindependent statistical agencies akin to that of independentcentral bankers. Some countries that failed in having suchan independent agency, like Argentina and Greece, werecaught red-handed in altering economic data that they dis-seminated to the public. The possible welfare implications
of misinformation should also be investigated; the actionsof Argentina and Greece show that economic gains to gov-ernments, even if short run, may exist and be substantial. Infurther work, we would like to extend our analysis to fiscaldata from many data sets.
REFERENCESAngeletos, George-Marios, ChristianHellwig, and Alessandro Pavan, “Sig-
naling in a Global Game: Coordination and Policy Traps,” Journalof Political Economy 114 (2006), 452–484.
Angeletos, George-Marios, and Alessandro Pavan, “Efficient Use of Infor-mation and Social Value of Information,” Econometrica 75 (2007),1103–1142.
Aumann,RobertJ., Michael B. Marschler, andRichardE. Stearns, Repeated Games with Incomplete Information (Cambridge, MA: MIT Press,1995).
Barber, Tony, and Kerin Hope, “Brussels Attacks Greece over False Data,”Financial Times (January 13, 2010).
Benabou, Roland, and Guy Laroque, “Using Privileged Information toManipulate Markets: Insiders, Gurus and Credibility,” Quarterly
Journal of Economics 107 (1992), 921–958.Benford, Frank, “The Law of Anomalous Numbers,” Proceedings of the
American Philosophy Society 78 (1938), 551–572.
Bream, Rebecca, James Blitz, and Peter Norman, “Doubts over Way ItalyQualified for Euro,” Financial Times (November 4, 2001).Crawford, Vincent, and Joel Sobel, “Strategic Information Transmission,”
Econometrica 50 (1982), 1431–1451.Curcuru, Stephanie E., Charles P. Thomas, and Francis E. Warnock, “Cur-
rent Account Sustainability and Relative Reliability,” in JeffreyFrankel and Christopher Pissarides (eds.), NBER International Sem-inar on Macroeconomics 2008 (Chicago: University of ChicagoPress, April 2009).
Diaconis, Persi, “The Distribution of Leading Digits and Uniform Distri-bution Mod 1,” Annals of Probability 5 (1977), 359–364.
“Egypt 2004/5 C/A Surplus Slips due to Import Surge,” Reuters News(October 13, 2005).
Gelos, R. Gaston, and Shang-Jin Wei, “Transparency and InternationalInvestor Behavior,” Journal of Finance 60 (2005), 2987–3020.
Gonzalez-Garcia, Jesus, and Gonzalo Pastor, “Benford’s Law and Macro-economic Data Quality,” International Monetary Fund workingpaper WP/09/10 (2009).
Heinemann, Frank, and Gerhard Illing, “Speculative Attacks: Unique Equi-librium and Transparency,” Journal of International Economics 58(2002), 429–450.
Hill, Theodore P., “Base-Invariance Implies Benford’s Law,” Proceedingsof the American Mathematical Society 123 (1995a), 887–895.
——— “A Statistical Derivation of the Significant-Digit Law,” StatisticalScience 10 (1995b), 354–363.
IMF, “Annual Report on Exchange Arrangements and Exchange Restric-tions,” technical report (1989–2008).
——— “Balance of Payments Manual,” technical report (1993).——— “Release of PricewaterhouseCoopers Report on the National Bank
of Ukraine,” news brief 00/26 (2000).——— “IMF Executive Board Reviews Noncomplying Disbursement to
Chad,” press release 03/9826 (June 2003).——— “IMF Executive Board Concludes 2005 Article IV Consultation
with The Gambia,” public information notice 05/121 (September 8,2005).
———“IMFExecutiveBoard Approves USD46.3 MillionPRGF Arrange-ment for Sierra Leone,” press release 06/94 (May 10, 2006).Jack, Andrew, “Loans May Hang on Report Disclosure,” Financial Times
(July 2, 1999).Janvresse, Elise, and Thierry de la Rue, “From Uniform Distributions to
Benford’s Law,” Journal of Applied Probability 41 (2004), 1203–1210.
Kaufmann, Daniel, Aart Kraay, and Massimo Mastruzzi, “GovenanceMatters VIII: Aggregate and Individual Governance Indicators,1996–2008,” World Bank Policy research working paper 4978(2009).
Kaynar, Bahar, ArnoBerger, TheodoreP. Hill,and Ad Ridder, “Finite-StateMarkov Chains Obey Benford’s Law,” Tinbergen Institute workingpaper TI 2010-030/4 (2010).
7/24/2019 Do Countries Falsify Economic Data Strategically - Some Evidence That They Might
http://slidepdf.com/reader/full/do-countries-falsify-economic-data-strategically-some-evidence-that-they 25/26
DO COUNTRIES FALSIFY ECONOMIC DATA STRATEGICALLY? 615
Krugman, Paul, “A Model of Balance of Payments Crises,” Journal of Money, Credit and Banking 11 (1979), 311–325.
Kydland, Finn E., and Edward C. Prescott, “Rules Rather Than discretion:The Inconsistency of Optimal Plans,” Journal of Political Economy85 (1977), 473–491.
Lane, Phillip, and Gian-Maria Milesi-Ferretti, “The External Wealth of Nations Mark II:Revisedand ExtendedEstimates of Foreign Assetsand Liabilities, 1970–2004,” Journal of International Economics 73
(2007), 223–250.Ley, Eduardo, “On the Peculiar Distributrion of the U.S. Stock Indices’
Digits,” American Statistician 50 (1996), 311–313.McSherry, Bernie, “Investors Have to Be Sure That Statistics Do Not Lie,”
Financial Times (July 16, 2009).Miller, John W., “Obscure EU Statistics Bureau May Be Getting a Higher
Profile.” Wall Street Journal (November 10, 2004).Morris, Stephen and H. S. Shin, “The Social Value of Public Information,”
American Economic Review 92 (2002), 1521–1534.Newcomb, Simon, “Note on the Frequency of Use of the Different Digits
in Natural Numbers,” American Journal of Mathematics 4 (1881),39–40.
Nigrini, Mark, “Taxpayer Compliance Application of Benford’s Law,” Journal of the American Taxation Association 18 (1996), 72–92.
——— “I’ve Got Your Number: How a Mathematical Phenomenon CanHelp CPAs Uncover Fraud and Other Irregularities,” Journal of
Accountancy 187:5 (1999), 79–83.
Nye, John, and Charles Moul, “The Political Economy of Numbers: Onthe Application of Benford’s Law to International MacroeconomicStatistics,” B.E. Journal of Macroeconomics 7:1 (2007), article 17.
Obstfeld, Maurice, “Rational and Self-Fulfilling Balance of PaymentsCrises,” American Economic Review 76 (1986), 72–81.
——— “Models of Currency Crises with Self-Fulfilling Features,” Euro- pean Economic Review 40 (1996), 1037–1047.
O’Grady, Mary Anastasia, “Argentina Impoverishes Itself Again: WhatHappens When Government Meddles with Private Wealth,” WallStreet Journal (November 3, 2008).
Pinkham, RogerS., “On the Distribution of FirstSignificant Digits,” Annalsof Mathematical Statistics 32 (1961), 1223–1230.
Reinhart, Carmen, and Kenneth Rogoff, This Time Is Different (Princeton,NJ: Princeton University Press, 2009).
Rivoirard, Vincent, and Gilles Stoltz, Statistique en action (Paris: Vuibert,2009).
Ruskin, Alan,“A TruerMeasure of China’sTradeSurplus,” Financial Times(October 30, 2003).
Sandleris, Guido, “Sovereign Defaults: Information, Investment andCredit,” Journal of International Economics 76 (2008), 267–275.Sbracia, Massimo, and Andrea Zaghini, “Expectations and Information in
Second-Generation Currency Crises Models,” Economic Modelling18 (2001) 203–222.
Standard and Poor’s, “Sovereign Credit Ratings: A Primer,” technical report(2008).
Stein, Jeremy C., “Cheap Talk and the Fed: A Theory of Imprecise PolicyAnnouncements,” American Economic Review 79 (1989), 32–42.
Tarashev, Nikola A., “Speculative Attacks and the Information Role of theInterest Rate,” Journal of the European Economic Association 5(2007), 1–36.
van der Vaart, Aad, Asymptotic Statistics (Cambridge: Cambridge Univer-sity Press, 1998).
Varian, Hal R., “Benford’s Law,” American Statistician 26 (1972), 65–66.Wagstyl, Stefan, “LiesHaunt a Reformer’sGrip on Power,” Financial Times
(October 25, 2007).Webber, Jude, “As Prices Surge, Argentines Cry Foul over the Official
Figures,” Financial Times (July 9, 2008).Young, Alwyn, “The African Growth Miracle,” mimeograph, London
School of Economics (2009).
APPENDIX A
A. Incentives to Misreport Economic Data: Proofs of theStated Results
We provide in this appendix the proofs of the results stated in section II.
A.1. Existence and Properties of the Equilibrium with Lying
Investors wish to maximize their ex ante return from investment; hence,they will allocate capital K so that the marginal return from investment inallcountries is equalized, nomatterwhethertheydeclare a good or badstateof the world. This leads, on the one hand (when C i ≡ C for all countriesi), to the stated fact that the capital K i(si, ρ̃) invested in country i dependsnot on i but solely on si and ρ̃, and, on the other hand, that returns are equal
for countries declaring good or bad states, as in equation (3). As ρ̃ ≥ ρ̂,investmentreturn in countriesthat declare a good state of theworld is lowerthan if allthesecountries wouldin fact beenjoyinga good state.Equality (3)needs to be a feature of anyefficientallocation; theninvestorsare indifferentbetween investing marginally more in one group of countries than in theother. Note also that equation (3) indicates that the ratio Ξ of K (g, ρ̃) toK (b, ρ̃) equals, at equilibrium,
Ξ(ρ̃,ϕ) =K (b, ρ̃)
K (g, ρ̃)=
ρ̂ A(g) + ϕ(1 − ρ̂) A(b)
ρ̃ A(b)
1/(α−1)
=
1 −
ρ̂ A(g) − A(b)
ρ̂ A(g) + ϕ(1 − ρ̂) A(b)
1/(1−α)
, (A1)
withΞ(ρ̃,ϕ) < 1. Giventhisand theglobal mobile capital supplyK ,wecanfind the capital values K (b, ρ̃) and K (b, ρ̃), the stock of capital in countriesdeclaring a bad and good state, respectively. Indeed, the market clearingcondition in the capital market is
[0,1]
K (b, ρ̃) − C ) I{d i =b} di +
[0,1]
K (g, ρ̃) − C ) I{d i =g} di
= (1 − ρ̃)K (b, ρ̃) + ρ̃K (g, ρ̂) − C = K .
After some algebra and by substituting the equality ρ̃ = ρ̂ + ϕ(1 − ρ̂), wecan show that
K (g, ρ̂) =K + C
ρ̂ + (1 − ρ̂)(ϕ + Ξ − ϕΞ).
We now show that ϕ + Ξ − ϕΞ increases as ϕ increases, which impliesthat K (g, ρ̂) then decreases;the derivative of the considered expression withrespect toϕ indeed equals (1 −Ξ) + (1 −ϕ) ∂Ξ/∂ϕ, where both summandsarepositiveasΞ < 1andasΞ(ρ̃,ϕ) isincreasinginϕ,ascanbeseenfromitsclosed-form expression. The interpretation is that as the fraction ϕ of liarsamong countries with s i = b increases, the capital invested in countriesdeclaring a high state of the world declines; this is because the return frominvestment in these countries falls.
Countries. At equilibrium, in the interior when ϕ ∈ (0, 1), countriesare indifferent between lying and reporting truthfully the state of the worldwhen their state is si = b. When making their decision, they do not knowρ̂; hence, their strategies depend on the information they have—that is, ontheir own state of the world and the knowledge of the distribution of ρ. Thefirst step is to analyze the payoffs of countries given in equation (2). Sincewe showed that the functions K i giving the invested capital did not dependon i, the same is true for the return functions R i, which we will simplydenote by R in the sequel (the same holds for the expected returns ER). Acountry that has a good state of the world sm = g will not declare a badstate of the world; it would not only receive less capital from investors (asthese make decisions based on declarations only and K (g, ρ̃) < K (b, ρ̃)),but also be punished. In other words, R(b, g, ρ̃) − R(g, g, ρ̃) < 0. To analyzethe incentive of countries with a bad state of the world, we introduce the
gap ∆(ρ̃) = R(b, g, ρ̃) − R(b, b, ρ̃). Because of the antagonist effects of thepunishment and the increase of invested capital when lying, this gap can inprinciple be positive, negative, or null.
Lemma 6. The gap in payoffs ∆(ρ̃) is strictly decreasing in ϕ , that is,decreases as the proportion ϕ of liars is higher.
Proof. By definition of Ξ and by equation (2), one gets that
∆(ρ̃) = A(b)
(1 − α)
K (g, ρ̃)α
(1 − Ξα)
+ αC
K (g, ρ̃)α−1
(1 − Ξα−1)
.
7/24/2019 Do Countries Falsify Economic Data Strategically - Some Evidence That They Might
http://slidepdf.com/reader/full/do-countries-falsify-economic-data-strategically-some-evidence-that-they 26/26
616 THE REVIEW OF ECONOMICS AND STATISTICS
But since Ξ increases as ϕ increases (as can be seen from its closed-formexpression) and sincethe above expression of ∆ showsthatitisadecreasingfunction of Ξ, the conclusion follows.
The higher the ϕ, the more liars given any ρ̂, and the lower the capitalthat is invested in countries declaring g. Hence, there is a lower incentiveto lie when the country in fact has a true state b. The following result isimmediate by taking expectations (with respect to ρ̃) in the lemma.
Proposition 6. The expected gap ER(b, g) − ER(b, b) is strictly decreas-ing in ϕ.
In particular, the mapping ϕ → ER(b, g) − ER(b, b) is one-to-one. If there exists a ϕ ∈ (0, 1) such that ER(b, g) − ER(b, b) = Φ, then this ϕ isunique, and the investors can deduce it from the value of Φ. In particular,they are then able to precisely deduce the value of ρ̂ given the fractionof countries ρ̃ declaring a good state of the world. Since the strategies of countries do not depend on ρ̂, unknown to the countries when making thedeclarations, and since ρ̃ = ρ̂ + ϕ(1 − ρ̂), the investors can learn the trueρ̂ = (ρ̃−ϕ)/(1−ϕ). If ϕ ∈ (0, 1), thencountrieswith sm = b are indifferentbetween declaring truthfully and misreporting. If ϕ = 1, then all countrieswith sm = b find it more profitable to lie than to declare truthfully despitethe expected punishment Φ. If ϕ = 0, then all countries declare truthfully.This is the case whenever Φ is large enough (larger than the expected gapin payoffs). All in all, we showed that countries have the correct incentives
givenΦ andthe parameters of theenvironment (the stock of mobile capital,productivity differences between the good and the bad state, and so on).
Proof of Proposition 1. When ϕ ∈ (0, 1) at equilibrium, one has ER(b, g) − ER(b, b) = Φ. But proposition 6 precisely stated that ϕ → ER(b, g) − ER(b, b) is decreasing, so the inverse mapping Φ → ϕ of whathappens at equilibrium is decreasing as well.
A.2. Comparative Statics: Proofs of Propositions 2–5.
The simplest proof is of proposition 5, since this result does not rely onpartitioning the countries into two groups.
Proof of Proposition 5. Countries make the choice whether to report gor b based on the properties of the distribution of ρ, as at the moment of making the decision, they do not know the actual fraction ρ̂ of countriesenjoying a good state. Hence, at a given equilibrium (for a given value of ϕ), a constant fraction ϕ of those that obtained a b state lies and the fraction
of liars in the entire population is ϕ(1 − ρ̂), which is decreasing in ρ̂ asstated.
Theframework forall other propositionsto be proved is to split countriesinto two groups, withrespective proportionsξ and1 −ξ, for which it iseasy
to see—following the same lines as above—that at equilibrium, they sharethe same characteristics. This defines a common invested capital functionK or K in each group, a common expected return function ER or ER, acommon cheating rate ϕ or ϕ , and so forth. The observed proportion of countries declaring a good state is now
ρ̃ = ρ̂ + (1 − ρ̂)
ξϕ + (1 − ξ)ϕ
.
The respective proportions of countries not truthfully declaring their statesin each group are given by
(1 − ρ̂)ϕ
ρ̂ + (1 − ρ̂)ϕand
(1 − ρ̂)ϕ
ρ̂ + (1 − ρ̂)ϕ.
As above, at equilibrium, investors can determine ϕ and ϕ and infer ρ̂ fromρ̃.
Proof of Proposition 2. We areinterestedin thebehavior ofthe countrieswhenthereis lyingin equilibrium, that is,whenϕ, ϕ ∈ (0, 1) at equilibrium.Inthiscase,asfollowsfromanimmediateadaptationoftheargumentsabovein each of the groups, ER(b, g) − ER(b, b) = Φ and ER(b, g) − ER(b, b) =Φ, whereeachgap is still a decreasing functionof therespective proportionsϕ and ϕ of liars (see proposition 6). The conclusion follows.
The proofs of the last two propositions are relegated due to their length
to MSWP, section C.1; We provide here only a sketch of how these areconstructed.
Sketch of proof of Proposition 3. In any equilibrium, investors demandthat investment bring ex ante the same return at the margin in either groupof countries, regardless of the declared state of the world. We use thiscondition and find that the following must be true: ϕ < ϕ if and only if K (g, ρ̃) > K (g, ρ̃) for at least one realization ρ̂.47 To show that indeedK (g, ρ̃) > K (g, ρ̃) we use that for equilibria in the interior, ER(b, g) −
ER(b, b) = Φ and ER(b, g) − ER(b, b) = Φ must hold, take a differenceof the two conditions and substitute.
Sketch of Proof of Proposition 4. We use a similar line of reasoning asin the above proof. From the ex ante return equalization on any groupof countries, it can be shown that the stated ϕ < ϕ holds if and only if K (b, ρ̃)/K (b, ρ̃) < K (g, ρ̃)/K (g, ρ̃) for at least one realization ρ̂. We usethe same property of the interior equilibrium ER(b, g) − ER(b, b) = Φ and
ER(b, g)− ER(b, b) = Φ to show that theright-handsideof theequivalencycondition holds.
47 It can be shown that it will then hold for all realizations of ρ̂.