Embed Size (px)
Citation preview
Accounting, Organizations and Society 39 (2014) 149–169
Contents lists available at ScienceDirect
Accounting, Organizations and Society
journal homepage: www.elsevier .com/ locate/aos
Do Chinese government subsidies affect firm value?
http://dx.doi.org/10.1016/j.aos.2014.02.0020361-3682/� 2014 Elsevier Ltd. All rights reserved.
⇑ Corresponding author. Tel.: +44 0161 275 4008; fax: +44 0161 2754023.
E-mail address: [email protected] (M. Walker).
Edward Lee a, Martin Walker b,⇑, Cheng Zeng c
a Manchester Accounting and Finance Group, Manchester Business School, Crawford House, Oxford Road, Manchester M13 9PL, United Kingdomb Manchester Accounting and Finance Group, Manchester Business School, Room 6.21, Harold Hankins Building, Booth Street West, Manchester M13 9QH,United Kingdomc School of Economics, Finance, and Management, University of Bristol, Social Sciences Complex, 8 Woodland Road, Clifton BS8 1TN, United Kingdom
a b s t r a c t
Consistent with the prevailing socio-political ideology of China, the Chinese governmentoffers financial assistance to firms, including many listed companies. Government subsi-dies are provided for several reasons including support for investment, support to enablefirms to pursue social objectives, and support to prop up ailing firms in order to protectjobs.
We examine the value relevance of government subsidies for Chinese listed companiesand structure our study around three questions. First, whether the subsidies received byChinese listed companies are value relevant consistent with their time-series properties.Second, whether the value relevance of subsidies depends on the purpose for which theyare used. Third, whether the value relevance of subsidies depends on the channel throughwhich they are granted.
We motivate these research questions through interviews of accountants, managers, aca-demics, government officials and financial analysts. Through large sample analyses, weconfirm that subsidies are positively related to firm value, but less so for distressed firmsand subsidies granted through non-tax channels. Our study contributes to improvedunderstanding of Chinese-style capitalism.
� 2014 Elsevier Ltd. All rights reserved.
Introduction
China is playing an increasingly important role in theglobal economy, and is expected to surpass the US to be-come the world’s largest economic power (Hawksworth& Tiwari, 2011). An interesting feature of Chinese listedfirms, that distinguishes them from their Western peers,is the pervasiveness of their access to financial subsidiesfrom the government. Despite over three decades of trans-formation from a centrally planned to a market-orientedeconomy (Ezzamel, Xiao, & Pan, 2007), the Chinese govern-ment (both central and local levels) maintains a high de-gree of influence on listed firms through such practices
(Allen, Qian, & Qian, 2005). In recent years, however, thereis increased international concern that state subsidies aregiving Chinese firms an unfair advantage over foreign com-petitors (Capital Trade Incorporated, 2008). These reasonscall for a better understanding of the effects of Chinesestate subsidies.
The main purpose of this paper is to examine the linkbetween firm value and Chinese government subsidies.Since state subsidies capture the government’s ‘‘visiblehand’’, a study of the value relevance of subsidies for Chi-nese listed firms provides an opportunity to examine thedirect role of government in the economy. Although sev-eral studies have investigated the value relevance ofaccounting numbers in China (e.g. Bao & Chow, 1999;Chen, Chen, & Su, 2001; Sami & Zhou, 2004), there has beenlittle systematic examination of how subsidies are re-flected in the market value of Chinese listed companies.
1 These issues were mentioned, for instance, in the Chinese CapitalMarkets Development Report issued by the China Security RegulatoryCommittee (CSRC) in 2007 to discuss the future of China’s stock marketdevelopment: http://www.csrc.gov.cn/pub/csrc_en/Informations/publica-tion/200911/P020091103520222505841.pdf (in Chinese).
150 E. Lee et al. / Accounting, Organizations and Society 39 (2014) 149–169
Moreover, most existing studies on the value relevance ofaccounting information in China fail to model the underly-ing information dynamics, which prevents them from con-sidering whether the accounting numbers are rationallyvalued. Thus, we explore this issue by using large scale sta-tistical data to estimate accounting based models of firmvalue based on the ideas in Ohlson (1995, 1999).
However, before undertaking this statistical analysis wefirst engaged in a number of interviews of people activelyinvolved in the granting and receiving of subsidies (e.g.government officials and entrepreneurs) as well as peoplewith expertise on this issue (e.g. accountants, academics,and financial analysts). The interviews were used to gaina better understanding of why the market value of subsi-dies might vary across different contexts. Based on the re-sult of the interviews, we structure our econometricanalyses of the valuation consequence of state subsidiesaround the following three questions.
First, we investigate whether the subsidies received byChinese listed companies are value relevant and, if so, isthe value relevance of subsidies consistent with theirtime-series properties? Following the approach of Barth,Hand, and Landsman (1999) and Landsman, Miller, andYeh (2007), which extend the Ohlson (1999) model, wefind that subsidies are value relevant on average, consis-tent with the results of our analyses of their informationdynamics. This is also consistent with subsidies beingviewed as beneficial from the perspective of outside equityinvestors.
Second, we investigate whether subsidies are equallyvalue relevant across all firm contexts. In particular, doesthe value relevance of subsidies differ if they are used toboost firms’ competitiveness or to bailout firms in trouble?We partition the sample into financially healthy and dis-tressed firms and our analyses indicate that subsidies arevalue relevant for the former group, but not the lattergroup. This is consistent with subsidies not adding valueto the firm if they are likely to be used to assist earningsmanagement or impede natural selection against weakfirms.
Third, we consider if the value relevance of subsidiesdepends on the channel through which they are granted.We classify subsidies into those based on tax rebates andthose provided by non-tax approaches such as direct cashpayments, loan guarantees, and debt forgiveness. Our anal-yses reveal that the valuation consequence of subsidies dif-fers considerably between the two different channels. Inparticular, we find that the value relevance of tax basedsubsidies is substantially greater than that of non-taxbased subsidies, which is consistent with the former beinggranted on a more persistent and transparent basis.
Our findings have implications for academics, policymakers, and firms. From an academic point of view, weshow that it is possible to use accounting based valuationmodels to demonstrate the valuation consequence of statesubsidies. This research methodology also enables us toshow that value relevance varies in predictable waysaccording to the purpose and channel of the subsidies.For policy makers, our evidence implies that subsidiesare an essential input to the valuation decisions of inves-tors in Chinese listed firms and policies that ensure their
clear disclosure should be promoted. As such, our studyalso offers policy implications for Chinese capital marketregulators, who are keen to enhance transparency andinformation efficiency.1 For the firms, our study suggeststhat the Chinese capital market recognizes that state subsi-dies provide net benefits to corporate value. Thus we haveidentified a valuation driver specific to the context of China,which firms should consider as part of their effort to maxi-mize their shareholders’ wealth.
The remainder of the paper is organized as follows: ‘Lit-erature review and institutional background’ briefly re-views the economic literature on the role of subsidies inthe development of the economy and introduces the insti-tutional environment in China. ‘Interviews and hypothesesdevelopment’ presents the findings of our interviews, anddevelops our main research hypotheses. ‘Modeling the va-lue relevance of government subsidies’ describes the re-search design and sample selection process. ‘Empiricalresults’ presents the econometric evidence and the lastsection concludes.
Literature review and institutional background
Related economic literature
Subsidies are economic intervention tools used by gov-ernments around the world to offset market imperfections,to exploit economies of scale, and to pursue social policyobjectives (Schwartz & Clements, 1999). For instance, agovernment may offer subsidies to firms to influence re-search and development (R&D) (González, Jaumandreu, &Pazo, 2005; Gorg & Strobl, 2007; Irwin & Klenow, 1996),export competitiveness (Desai & Hines, 2008; Ishikawa &Spencer, 1999; Shivakumar, 1993), production efficiency(Azzimonti, de Francisco, & Krusell, 2008; Bagwell & Stai-ger, 1989, 2006), wages and employment (De Mel, McKen-zie, & Woodruff, 2010; Phelps, 1994; Snower, 1994), andenvironmentally friendly practices (Conrad, 1993; Conrad& Wang, 1993; Kohn, 1997). However, existing empiricalresearch on the economic effects of state subsidies yieldsa mixed picture. On the one hand, some studies suggestthat subsidies can stimulate R&D activities (Almus & Czar-nitzki, 2003; Davidson & Segerstrom, 1998; González et al.,2005), improve firm profitability (Desai & Hines, 2008; Gir-ma, Gong, Gorg, & Yu, 2009), enhance competitiveness(Bagwell & Staiger, 1989; Brander & Spencer, 1985), andreduce the capital constraints of firms (Claro, 2006; Li,2002). On the other hand, some studies suggest that subsi-dies result in overproduction or efficiency losses (Larsen &Shah, 1992; Lopez & Galinato, 2007; To, 1994), and inviteinternational disputes (e.g. Neary, 1994). In recent years,the increased outcry of the US government against Chinesestate subsidies to firms (Capital Trade Incorporated, 2008)suggests that subsidies may distort competitiveness anddisadvantage US firms against their Chinese counterparts.
2 Appendix A compares the economy of China as of 2009 againstdeveloped G7 countries (Panel A) and other major emerging economies(Panel B).
3 The statistics can be found at: http://am-articles.blogspot.co.uk/2011/09/worlds-top-5-stock-exchanges.html.
4 Allen et al. (2005) suggest that state subsidies are one of the four mostimportant financial sources of Chinese firms, along with bank loans, firms’self-fundraising, and foreign direct investment.
5 Chinese firms report state subsidies as one of the below-the-line itemsin financial statements. State subsidies were reported as an independentitem before 2007, and included as part of the ‘‘other revenues’’ itemafterwards.
6 We use the word ‘‘governments’’ here because both central andregional governments provide subsidies.
E. Lee et al. / Accounting, Organizations and Society 39 (2014) 149–169 151
The role of government in transitional economies,which are evolving from centrally planned socialism tomarket-oriented capitalism, is widely debated in the eco-nomic literature. In terms of process, the literature putsforward the ‘‘big bang’’ and sequential reform approach.The ‘‘big bang’’ approach argues that reforms should becarried out quickly (Balcerowicz, 1995; Lipton & Sachs,1990) so as to create irreversibility (Boycko, Shleifer, &Vishny, 1995) and exploit the window of opportunity. Thiswas adopted by the Eastern European and former SovietUnion countries through mass privatization to overcomepolitical constraints (Shleifer & Treisman, 2000). Thesequential reform approach suggests a gradual process tobuild upon the successes of previous stages in order to gen-erate incentives for further changes (Dewatripont & Ro-land, 1995; Litwack & Qian, 1998; Wei, 1997). This wasimplemented in China through a gradual liberalizationprocess (Lau, Qian, & Roland, 2000). In terms of govern-ment behavior in transitional economies, the existing liter-ature studies the ‘‘grabbing hand’’ and ‘‘helping hand’’approaches (e.g. Frye & Shleifer, 1997). The former portraysgovernment as controlled by officials that do not maximizesocial welfare and pursue their own selfish objectives(Shleifer & Vishny, 1998), and is associated with local gov-ernments such as Russia and Poland (Shleifer & Vishny,1993). The latter is often associated with the case of China(Che & Qian, 1998; Walder, 1995), where the governmentseeks to guide or stimulate economic growth by reallocat-ing financial resources. In terms of outcome, most transi-tional economies experience an initial drop in output,which is then followed by a recovery of varying paces(Hellman & Shankerman, 2000). China is an interestingexception to this pattern since it began with high growthimmediately without the early stage recession (Roland,2002).
Inter-jurisdictional competition among local govern-ments is an important feature of state intervention inthe economy. Earlier literature suggests that competitionamong regions is beneficial because it helps satisfy regio-nal demand (Oates, 1972), improve governance (Brennan& Buchanan, 1980), and reduce resource allocationdistortions (Qian & Roland, 1998). More recent literaturesuggests competition among regions may cause problemssuch as the depletion of local government revenues(Keen & Marchand, 1997) and the fixation of local gov-ernment on business interests (Bardhan & Mookherjee,2000). Empirical studies report mixed results, with theinfluence of local government competition on growth inChina being positive but in Russia being negative (Jin,Qian, & Weingast, 2005; Zhuravskaya, 2000). One possi-ble reason for this contrast is the difference in the degreeof political centralization between the two transitionaleconomies (Enikolopov & Zhuravskaya, 2007). In Russia,the central government was ineffective in disciplininglocal government officials against self-serving policiesthat would impose negative externalities on the rest ofthe country (Shleifer & Treisman, 2000). In China, localgovernment officials are more disciplined due to politicalcareer advancement concerns as a result of the effectivecontrol of a single political party across the entirecountry.
Institutional setting
The growing interest among academics, policy makers,and practitioners in Chinese-style capitalism stems fromChina’s increasingly important position in the world econ-omy.2 China’s stock market began with the opening of thestock exchanges in Shanghai and Shenzhen back in the early1990s to facilitate economic reform. It subsequently grew tobecome the largest developing economy by 2001, and theworld’s 5th largest economy, in terms of market capitaliza-tion, by 2010.3 The overwhelming majority of the listedfirms are former state-owned enterprises (SOE) in whichthe government retained a majority ownership followingtheir initial public offering (IPO) (O’Connor et al., 2004).For Chinese firms having a stock market listing is importantboth for capital acquisition purposes, and for the purpose ofinternational visibility.
Unlike Western developed economies, the Chinesestock exchanges impose delisting rules that influence theallocation of market capital. The China Security RegulatoryCommittee (CSRC) mandates that if a listed firm reportslosses in two consecutive years, its stock will be classifiedas specially treated (ST) and face many trading and finan-cial restrictions. For such firms, the daily stock price move-ment is restricted within a range of 5%, the semi-annualreport must be audited, and raising additional capital fromthe stock market is prohibited. If an ST firm reports onemore year’s loss, then its stock is suspended from tradingon the stock exchanges, and after a fourth annual loss thestock is delisted. To avoid these restrictions or delisting,firms manipulate earnings in order to avoid reportinglosses and state subsidies may be used to achieve this pur-pose (Chen, Lee, & Li, 2008).
Subsidies from the government are an important re-source for Chinese firms.4 Based on Chinese AccountingStandards (2006), government subsidies are defined as mon-etary or non-monetary assets obtained freely by an enter-prise from the government, but excluding the capitalinvested by the government as the partial owner of theenterprise.5 According to state policy, the primary goal ofsubsidies is to develop national priority areas such as agri-culture, public utilities, and high-tech industries (Chenet al., 2008; Girma et al., 2009). In addition, the governmentsmay also provide subsidies to help firms overcome capitalconstraints and to aid firms in financial difficulties (Claro,2006).6 Chinese SOEs receive more subsidies on average rel-ative to privately controlled firms, because the governmentmakes use of them to pursue socio-political objectives such
152 E. Lee et al. / Accounting, Organizations and Society 39 (2014) 149–169
as creating job opportunities and stabilizing local economies(e.g. Hung, Wong, & Zhang, 2008; Lee, 2001; O’Connor et al.,2006). Subsidies can be granted by both central and localgovernments (Thomas, 1994), although such powers areincreasingly delegated to local government officials whohave a better understanding of their regional developmentneeds. This fiscal decentralization also induces competitionamong local governments to offer subsidies since the num-ber of firms under their jurisdiction is viewed as a perfor-mance indicator of the officials.
State subsidies can be broadly categorized into tax andnon-tax based. Tax based subsidies are mainly grantedthrough rebates of value added tax and export tax toencourage prioritized regions, sectors, and projects. Firmsbecome eligible for tax rebates if they are located in specialeconomic zones or if they invest in projects and/or operatein sectors prioritized by government policies. As such, thereceipt of tax base subsidies may signal that a firm has bet-ter prospects or reduced risks. The non-tax based subsidiesare offered as direct cash payments, loan guarantees, anddebt forgiveness. Government officials grant non-tax basedsubsidies on a more discretionary and subjective basis. Assuch, the receipt of non-tax based subsidies is more areflection of political favoritism rather than a firm’s poten-tial. These differences in the implication of tax and non-taxbased subsidies are expected to influence investors’ deci-sions on the valuation of the recipient firms.
The value relevance of accounting information has beenwidely studied in the Western accounting literature.7 Forinstance, Landsman et al. (2007) find that earnings and bookvalues explain around 64.3% of the variation in market valueof US firms over the period of 1990–2000. Barth et al. (2001)argue that value relevance evidence is important to account-ing standard setters since one of the primary purposes offinancial reporting is to provide information useful for valu-ing firms. In the emerging economies such as China, the lit-erature on the value relevance of accounting information ismore limited. Existing studies on this issue in China (Chen& Wang, 2004; Chen et al., 2001; Haw, Qi, & Wu, 1999) con-sistently show that the earnings information is incorporatedinto investors’ valuation of listed firms.8 For instance, overthe sample period of 1995–1998, Chen et al. (2001) find thatearnings and book value explain around 25% of the variationin market value of their sample. To the best of our knowl-edge, Chen and Wang (2004) is the only prior study to con-sider the effect of government subsidies on the valuation ofChinese listed firms. Using a sample for 1997–2000, theyfind no evidence that subsidies are value relevant despitetheir finding that it is the most persistent below-the-lineitem. However, given the importance of state subsidies inthe context of Chinese listed firms and the rapid change ofChinese economy, their value relevance deserves to be stud-ied using a longer and more recent period sample.
7 For more literature review on this topic, see Barth, Beaver, andLandsman (2001).
8 These studies examine the relevance of accounting information to thevalue of domestic shares (also known as A-shares), which are issued by vastmajority of Chinese listed firms. Other studies such as Bao and Chow (1999)and Sami and Zhou (2004) focus on a smaller group of Chinese listed firmsthat also issue foreign shares (also known as B-shares), and producebroadly similar findings that earnings are value relevant.
Interviews and hypotheses development
Interview design
To gain a better understanding of Chinese governmentsubsidies policy and to motivate our hypotheses for thelarge sample econometric analyses, we carried out 12 inter-views of people familiar with this issue. The interviewswere held over the telephone and varied in length, rangingfrom 20 min to 50 min. Based on existing literature (e.g.Chen & Li, 2001; Chen et al., 2008; Tang & Luo, 2007; Zhu& Chen, 2009) and anecdotal evidence, a pre-determinedinterview protocol was designed which included a set ofopen-ended questions. Appendix B provides further detailson these questions. We were aware that some of our ques-tions are politically sensitive, and that some of the intervie-wees may have been reluctant to respond to such questionsbecause of their position. We addressed this issue in severalways: First, we reserved the ‘‘more controversial’’ questionsfor later in the interview, consistent with Sudman andBradburn (1983). Second, we tried to ask the questions tact-fully. Third, we assessed some answers through the tone ofthe interviewees such as ‘‘very likely’’, ‘‘hard to say’’, or ‘‘thepossibility cannot be excluded’’. Finally, to ensure the accu-racy of the responses, we conducted additional checks toconfirm the answers until the interviewees verified ourunderstanding of their responses.
Our selected interviewees consist of twelve people who arefamiliar with government subsidies in China. They includegovernment officials, accountants, entrepreneurs, academics,and analysts, who are based in cities like Beijing and Chongq-ing, or provinces such as Shandong and Shaanxi. Appendix CPanel A presents the details of interviewees and the date oftheir interviews. The interviews themselves were undertakenby our Chinese co-author. The analysis of the interviews wasconducted by all three authors. The interview questions wereinitially designed in English. Because the interviewees are allnative Chinese speakers, the questions were asked and the an-swers were recorded in Chinese (Mandarin). Finally, the Chi-nese co-author translated the Chinese answers into English.
Interview results
What conditions must firms meet to obtain governmentsubsidies?
The most commonly noted reason for Chinese govern-ments to provide subsidies is to encourage the develop-ment of specific businesses or industries. This was citedby nine of interviewees. In other words, the businesses orindustries that the Chinese government prefers to promotegrowth are more likely to receive subsidies. The responsefrom one of the accountants illustrated this point:
‘For firms to qualify for subsidies, their research anddevelopment expenses must exceed a given threshold,or their products must be within the high technologyfields as stipulated in official guidelines.’
Another important consideration that influenceswhether or not firms receive subsidies is the personal con-nections (or guanxi) between entrepreneurs and officials.
E. Lee et al. / Accounting, Organizations and Society 39 (2014) 149–169 153
This is especially true for the non-tax based subsidies suchas direct cash grants, loan guarantees, and debt forgive-ness. For instance, one of the entrepreneurs from Shandongprovince suggested that:
‘If the local government has budget limitations, then thepolitically connected producers are more likely to besubsidized than their non-connected peers.’
How often do firms receive subsidies from governments?A majority of interviewees stated that the frequency of
receiving subsidies varies across industries as well as thetype of projects the firms used for application. This was ci-ted by six of the interviewees. One of the entrepreneursfrom Shandong province suggested that the frequencymay depend on the channel of subsidies granted:
‘When the subsidies are received in a form of non-taxrebates, it is likely to be less persistent because suchform of subsidies is often based on occasional budgets,which in turn is affected by the availability of financialresource of the government.’
As to the question whether central or local governmentprovides subsidies more frequently, most of the intervie-wees who answered this question chose the former. Thiswas cited by five of the six interviewees, while the remain-ing four did not provide a clear answer. The official fromChongqing explained this issue from the perspective ofgovernments:
‘The central government provides subsidies more fre-quently than local governments because the formermanages much more fiscal resources.’
Which kind of subsidies is more likely to be fair and lesssubjective?
Most of the participants of our interviews agreed thattax based subsidies are granted on a more objective basisand are less likely to be influenced by the discretion of gov-ernment officials. This was cited by eight of the intervie-wees. For instance, the entrepreneur from Chongqing alsosuggested that:
‘Tax based subsidies are relatively more transparentand the application procedure is also easier than forother forms of subsidies.’
Interestingly, all three officials we interviewed did notdeny that non-tax based subsidies can be less fair andmore obscure. The comments from the Chongqing officialwere especially insightful:
‘Because the fiscal resources of local governments canbe limited, firms eligible for non-tax subsidies mustbe further selected and this process can involve a cer-tain degree of subjectivity.’
What are the costs and benefits of subsidies?From the firms’ point of view, government subsidies are
an extra source of funding that helps them increase theirearnings. Moreover, subsidies also bring along reputational
benefits to the recipient firms. For example, the Chongqingentrepreneur commented that:
‘Receiving subsidies imply that the firms have promis-ing projects endorsed by the government. The subsidiesnot only assist the firms financially when developingthe products, but the reputational benefit they bringalong also helps the firms promote the sales of theseproducts.’
Of course, to qualify for government subsidies, the crite-ria often require firms to make initial investments such asequipment, staff, and other expenses. Furthermore, asmentioned earlier, personal networking and political con-nections often improve the chances of firms receiving sub-sidies. Thus, initial investment and human capital areprerequisites of qualifying for subsidies. One of the entre-preneurs from Shandong province weighed the benefitagainst the cost of subsidies:
‘To qualify for subsidies, firms may have to bear the costof initial investment as well as human capital. However,benefits of government support should outweigh thesecosts in the long run.’
What are the governments’ objectives in providing subsidies?There are mixed responses across the interviewees over
the question of whether or not the rescue of distressedfirms is one of the objectives of the government to offersubsidies. The Chongqing official suggested that:
‘One reason for aiding distressed firms is that theirbankruptcy may have substantial influence on localeconomy or social stability through employment. How-ever, this is carried out on a case by case basis.’
When asked if distressed firms are able to receive taxbased subsidies, the officials from Shandong province andChongqing gave positive answers. For example, the formernoted that:
‘Whether or not a firm is eligible for tax rebates has lit-tle to do with whether it is profitable or not. The keypoint is that the firm must satisfy the government pol-icies designed for tax based subsidies.’
Do subsidies really matter in analysts’ earnings forecast,target price forecast, and stock recommendations?
Both of the analysts agreed that subsidies information isuseful for them to anticipate firms’ earnings, target prices,or make stock recommendations. One of the analysts men-tioned that:
‘We pay more attention to subsidies if it accounts for ahigher percentage of a firm’s revenue. We also forecastthe changes in national policies on subsidies.’
As to the question of whether subsidies are more usefulfor analysts to forecast earnings, target prices, or make rec-ommendations for financially healthy firms than distressedfirms, both analysts provided consistently positive an-swers. One of them explained that:

154 E. Lee et al. / Accounting, Organizations and Society 39 (2014) 149–169
‘For loss making firms, subsidies information is not use-ful unless the magnitude received is significant enoughto turn overall losses into gains. In such circumstances,we also consider the effect on a case by case basis.’
When it comes to the question of which type of subsi-dies, i.e. tax or non-tax based, is more useful for analyststo make forecasts or recommendations, one of the analystsnoted that:
‘Tax based subsidies could be more important, becauseit is typically more predictable than non-tax based sub-sidies, and has greater influences on firms’ future cashflows.’
Hypotheses development
Based on the interview results in section ‘Interview re-sults’, we formulate three testable hypotheses for our largesample econometric analyses of the valuation conse-quences of state subsidies. First, according to the financialanalysts’ responses in section ‘Do subsidies really matter inanalysts’ earnings forecast, target price forecast, and stockrecommendations?’, the information on state subsidies re-ceived by the firms they follow serves as a useful input totheir earnings forecasts, target price forecasts, and stockrecommendations. Financial analysts are sophisticatedusers of accounting information and they serve as interme-diaries between firms and investors. The fact that analystsincorporate state subsidies in their forecasts suggests thatthis information is systematically relayed to investors inthe capital market. It also implies that state subsidies in-deed capture the attention of informed investors andmay be widely considered in their investment decisions.This is not surprising since state subsidies directly increasethe receiving firm’s cash flows, and may also indirectlycontribute to a decrease in the cost of further capital acqui-sition. Furthermore, state subsidies also signals to inves-tors that the receiving firm has good prospects and lessuncertainty since it has government backing. These arebroadly consistent with the interview findings in section‘What are the costs and benefits of subsidies?’. As a result,based on the classical discounted cash flow (DCF) model,subsidies should increase a firm’s value. Given these argu-ments, we hypothesize that:
H1. On average, government subsidies are value relevantfor Chinese listed firms.
Next, based on our interview findings in sections ‘Whatconditions must firms meet to obtain government subsi-dies?’ and ‘What are the governments’ objectives in pro-viding subsidies?’, subsidies are granted to encouragefirms to focus on sectors, regions, or projects that are prior-itized by the government, or to rescue distressed firms inorder to stabilize the local economy and increase job secu-rity. However, our interview findings in section ‘How oftendo firms receive subsidies from governments?’ also revealthat the budget limitations of local governments can affecttheir ability to grant subsidies. This in turn could affect theability of local government to aid distressed firms. In otherwords, government is less likely to provide subsidies to
distressed firms on a persistent basis. As such, the subsi-dies granted to rescue firms in distress is less likely toinfluence the long term performance of such firms. Asidefrom that, distressed firms are less likely to have growthopportunities to make use of the additional capital fromsubsidies. The fact that firms are in distress in the firstplace implies a fundamental reduction in their earningsgenerating capacity (Schleicher, Hussainey, & Walker,2007). Prior empirical literature also supports this byshowing that distressed firms reporting a profit by virtueof government subsidies often move back to losses againin the near future (Cheng, Aerts, & Jorissen, 2010). Further-more, state subsidies to distressed firms are more likely tobe used to artificially inflate reported earnings to avoiddelisting (Chen et al., 2008), which undermine the credibil-ity of reported earnings to outside investors in the stockmarket. As a result, we expect government subsidies tohave lower consequences for firm value for distressedfirms compared to financially healthy firms. Given thesearguments, we hypothesize that:
H2. Government subsidies are less value relevant for thefirms that are in distress.
Finally, our interview findings in section ‘Which kind ofsubsidies is more likely to be fair and less subjective?’ alsohighlighted the differences between the two main chan-nels of subsidies, i.e. tax and non-tax based. Tax based sub-sidies are driven by established policies and guidelineswhile non-tax based subsidies are more dependent onthe discretion of officials. The transparency of tax basedsubsidies renders them more predictable to investors,which in turn facilitates the incorporation of this informa-tion into their valuation decisions. The criteria for suchsubsidies also implies that a firm is associated with sectors,regions, and projects encouraged by government, whichprovides a positive signal about the firm’s prospects. Incontrast, although non-tax based subsidies may signal thatpolitical connections are enjoyed by the recipient firms,the subjectivity of their allocation by officials could alsomake such subsidies less predictable to investors. Also,the frequency of non-tax based subsidies may be reducedby fiscal constraints, which tends to be greater among localgovernments. A lower frequency of grants implies a lowerpersistence for non-tax based subsidies. This in turn re-duces the impact of such subsidies on the long-term valueof the recipient firms. Given these arguments, we hypoth-esize that:
H3. Subsidies through tax rebates are more value relevantthan other forms of government subsidies.
Modeling the value relevance of government subsidies
Research design
To test our three hypotheses, we apply the well-estab-lished accounting based valuation models that originatedfrom Ohlson (1995, 1999). Such models are based on theassumption that stock prices fully reflect publically avail-able information. Existing studies (e.g. Firth, Fung, & Rui,
10 The variable r denotes required return (or cost of capital). Following theconsistent research design of prior literature (e.g. Barth et al., 1999;Dechow, Hutton, & Sloan, 1999; Landsman et al., 2007) we apply a uniform
E. Lee et al. / Accounting, Organizations and Society 39 (2014) 149–169 155
2006; Long, Payne, & Feng, 1999) suggest that the Chinesestock market had achieved a reasonable degree of informa-tional efficiency before the early 2000s. Since that time theChinese stock market has developed at great pace, which isin line with the country’s rapid economy growth and thegovernment’s continued reforms toward a market-basedeconomy. For instance, listed firms were mandated withnew governance requirements in 2001 and tighter disclo-sure rules in 2004 (Jing, 2009). Furthermore, reforms onthe state ownership of listed firms were instigated in2006 (Chen, Li, Xin, & Yeung, 2012), and listed firms weremandated to employ new accounting standards that werelargely converged to International Financial ReportingStandards (IFRS) from 2007 onward (Lee, Walker, & Zeng,2013). Meanwhile, there has been continued growth in for-eign institutional investors, the stock broking industry, andthe financial media (e.g. Chen, Du, Li, & Ou-Yang, 2013; Gu,Li, & Yang, 2012). Based on these arguments, we believethat China’s stock market is sufficiently efficient to justifythe accounting based valuation model we apply to exam-ine the relationship between firm value and the subsidiesthey receive. Nevertheless, it is possible that the Chinesestock market is not as informationally efficient as the USstock market on which most of the work on these modelshas been carried out. However, it is important to note that,to the extent Chinese stock market lacks informational effi-ciency, this would work against us finding statistically sig-nificant results consistent with our hypotheses. Inparticular, if the market failed to take notice of the infor-mation content of subsidies that is available in financialstatements, then we should find no relation between firmvalue and subsidies.9 Thus, the extent to which we find thatsubsidies are value relevant is, if anything, likely to be anunderestimate of their true value relevance.
Total value relevance testsThe methodology we use is based on Barth et al. (1999)
and Landsman et al. (2007), which model earnings compo-nents by extending the linear information system devel-oped in Ohlson (1999). The linear information systemcomprises four equations:
NIaj;t ¼ x0 þx1NIa
j;t�1 þx2Sj;t�1 þx3BVj;t�1 þ e1j;t ð1Þ
Sj;t ¼ h0 þ h1Sj;t�1 þ h2BVj;t�1 þ e2j;t ð2Þ
BVj;t ¼ b0 þ b1BVj;t�1 þ e3j;t ð3Þ
Pj;t ¼ a0 þ a1NIaj;t þ a2Sj;t þ a3BVj;t þ e4j;t ð4Þ
Eqs. (1)–(3) capture the information dynamics of the threevariables that are assumed to be the main drivers of firmvalue. These are abnormal earnings, state subsidies, and
9 To evaluate whether subsidies are systematically mispriced by inves-tors, we carried out an additional test to examine the relationship betweencurrent subsidies over book value and subsequent returns. The finding fromthis analysis (untabulated for brevity) suggests that investors do notmisprice the information contained in the state subsidies variable. Thissupports the argument that the market is efficient with regard to theinformation content of subsidies since it is quickly impounded into stockprices.
book value respectively. Eq. (4) is the valuation equationthat relates share price to the three main valuation drivers.A novel feature of this study is that we explicitly model theinformation dynamics of the three valuation drivers forChinese firms, and we relate the estimated coefficients ofthe information dynamics to the coefficients in the valua-tion equation.
Eq. (1) is the abnormal earnings prediction equation,where abnormal earnings NIa
t
� �is defined as earnings
(NIt) less a normal return on equity book value(r � BVt�1).10 St�1 is subsidies in year t � 1. The coefficienton subsidies (x2) reflects the incremental ability of subsi-dies to forecast abnormal earnings. If all earnings compo-nents have the same ability to forecast future abnormalearnings, then x2 should be zero. Since subsidies are partof abnormal earnings, its total forecasting relevance coeffi-cient should be x1 þx2. Thus, subsidies are forecastingirrelevant only if x1 þx2 ¼ 0. Eq. (2) describes the time ser-ies properties, or persistence, of subsidies. If subsidies arenot entirely transitory, then the coefficient h1 should be sig-nificantly different from zero. Following Barth et al. (1999)and Landsman et al. (2007), Eq. (3) is included to preservethe triangular information structure of the generalized ver-sion of Ohlson’s (1999) model. This triangular structure en-sures that, in theory, parameters relating to book value haveno effect on the valuation coefficients on abnormal earningsand subsidies in Eq. (4) (Barth et al., 1999). Like previousstudies, we do not report its regression results for brevity.
Finally, Eq. (4) is the valuation model based on theinformation dynamics in Eqs. (1)–(3). The value relevancecoefficient on subsidies is a2. In parallel with the interpre-tation of x2 in Eq. (1), a2 indicates whether the subsidieshave an incremental valuation effect. If subsidies do nothave incremental explanatory power for equity value (Pjt)beyond other earnings components, then a2 should bezero. Also analogous to Eq. (1), a1 þ a2 reflects the total va-lue relevance of subsidies. If a1 þ a2 ¼ 0, the subsidieswould be value irrelevant.
A comprehensive list of the definitions of the variablesused in our econometric analyses is provided in AppendixD. We estimate Eqs. (1)–(4) using Seemingly UnrelatedRegressions, which allows regression errors to be corre-lated across equations. Moreover, we do this with industryand year fixed-effects controlled. The standard errors inthe regressions are also corrected for heteroskedasticity.Finally, following Dechow et al. (1999) and Landsmanet al. (2007), we estimate all models using per share data.
level of cost of capital for all firms, and we did not separately estimate it ona firm-specific basis. In practice, the estimation of firm-specific implied costof capital requires analysts’ earnings forecast data, which is not availablefor a large cross-section of firms in China (Chen, Chen, Lobo, & Wang, 2011).To avoid reduction in sample size and to prevent potential selection biasissue, our analyses do not use firm-specific implied cost of capital. In ourstudy, we apply a 12% cost of capital across Chinese firms, and this followsprevious research on China’s stock markets (e.g. Shen, 2007). As sensitivityanalyses, we replicated our main analyses by using different level of cost ofcapital, including 5%, 10% and 15%, and our inferences are unaffected.
12 Our subsidies data begin for 2000 after the data for this variablebecomes more available. Because the calculation of abnormal earningsrequires the book value of the previous year, the observations in 2000 hadto be excluded. Moreover, we had to exclude observations in 2001 becausethe information dynamics test of abnormal earnings cannot be carried outwithout the data for abnormal earnings in 2000. Thus the years examinedin this study are 2002–2008.
13 According to a report released by IHS Global Insight, one of the world’slargest economic advisory firms, China accounted for a 19.8% share ofglobal manufacturing in 2010, and became the largest manufacturingnation in the world by surpassing the US (http://www.finfacts.i.e./irishfi-nancenews/article_1021835.shtml). Over the period 2000–2005, manufac-
156 E. Lee et al. / Accounting, Organizations and Society 39 (2014) 149–169
Value relevance tests for financially healthy and distressedfirms
To test hypothesis H2, we partition the sample intofinancially healthy and distressed firms by using a versionof the Z-score as adapted to the Chinese market by Altman,Zhang, and Yen (2007). Since the pioneering research ofAltman (1968), a number of studies have used the Z-scoreto identify potentially distressed firms (e.g. Hillegeist,Keating, Cram, & Lundstend, 2004; Summers & Sweeney,1998). Despite the popularity of the Z-score used in failureprediction, most of the extant research focuses only ondeveloped markets, which might not be applicable toemerging markets such as China due to its unique institu-tional context. To address this issue, Altman et al. (2007)develop a particular model to support identification of po-tential distress firms in China. The modified Z-score modelis of the form:
Z-score ¼ 0:517� 0:460x1 þ 9:320x2 þ 0:388x3
þ 1:158x4 ð5Þ
where x1 is the liability to asset ratio (total liabilities/totalassets), x2 is the rate of return on total assets (net profit/to-tal assets), x3 is working capital to total asset ratio ((cur-rent asset minus current liabilities)/total assets), and x4 isretained earnings to total assets ratio (retained earnings/total assets). We calculate the Z-score for Chinese listedfirms following Eq. (5) and classify a firm as a distressedfirm in the current year if its Z-score in the previous yearis negative.
In order to increase confidence in our results, we usetwo other proxies for distress as a sensitivity check. First,we define Low as one if the firm’s return on equity (ROE)is below the 20th percentile in each year, and zero other-wise. Since the regulatory requirements in China aremainly based on accounting earnings, out of a fear of beingdelisted, the listed firms that have relatively lower profitsare more likely to use subsidies to help them window dresstheir underperformance. Second, we define ST as one if thefirm is specially treated (see discussion in section ‘Institu-tional setting’) in that year, and zero otherwise. Firms withdelisting avoidance motives are more likely to use subsi-dies to manipulate earnings.
Value relevance tests of government subsidies componentsSo far we have assumed that the value relevance of dif-
ferent types of subsidies is identical. As mentioned earlier,the government can grant subsidies through either tax ornon-tax based channels. To test hypothesis H3, we separatesubsidies into these two components and replicate Eqs.(1)–(4) by replacing total subsidies with these compo-nents. Specifically, tax based subsidies include the rebatesof various taxes such as value-added tax, consumption tax,export tax, and income tax. Among them, value-added taxrebates account for the largest proportion. This is consis-tent with official statistics disclosed by the Ministry of Fi-nance as of 2010.11 Prior literature (e.g. Tang & Luo, 2007)also documents a similar finding. Non-tax based subsidies
11 Please see: http://www.mof.gov.cn/zhuantihuigu/czjbqk2010/2cztz/201110/t20111031_603357.html (in Chinese).
are largely provided through direct cash grants, loan guaran-tees, and debt forgiveness.
Sample selection and data
The data used in this study other than subsidies is ob-tained from the China Securities Markets and AccountingResearch Database (CSMAR). The subsidies data, includingthe amount of total subsidies, as well as both tax and non-tax based subsidies, are hand-collected from annual re-ports. We begin our sample selection with all manufactur-ing firms listed on the Shanghai and Shenzhen StockExchanges from 2002 to 2008.12 We focus on the manufac-turing sector for two reasons. First, a single sector reducesthe heterogeneity of firm characteristics in the sample,which may introduce noise into our analyses. Second, man-ufacturing is by far the largest and most important sector inthe Chinese economy.13
Appendix C Panels B to D present the sample we use forthe regression analyses. Panel B presents the sample selec-tion process. Of the 5646 observations available for the2002–2008 sample period, we eliminate 748 observationswith insufficient data to test value relevance, leaving uswith a sample of 4898 firm-year observations to testhypotheses H1 and H2. In order to test hypothesis H3, wehad to delete a further 582 observations, because they donot have sufficient information to distinguish tax rebatesfrom other sources of subsidies. The final sample for test-ing hypothesis H3 therefore consists of 4316 firm-yearobservations. Panel C presents the distribution of observa-tions across the sample years. It shows that around 70% ofthe firm-years are subsidized, which reveals the pervasive-ness of this practice in China. Panel D reports the distribu-tion of firm-years across sub-industries, which are basedon the CSRC’s classification. Among the ten sub-industries,machinery accounts for the largest proportion with 1306total firm-years, of which 918 are subsidized.
Empirical results
Summary statistics
Table 1 presents summary statistics on the variablesused in our econometric analyses. Panel A is based on themain sample used to test hypotheses H1 and H2. The meanand median of stock price are 8.199 and 5.990 respectively.
turing accounted for 32% of China’s GDP (Hanson & Robertson, 2008). Alsomanufacturing firms accounted for around 50% of the market value ofChina’s stock market, making it more specialized in that sector than anyother large emerging economy.
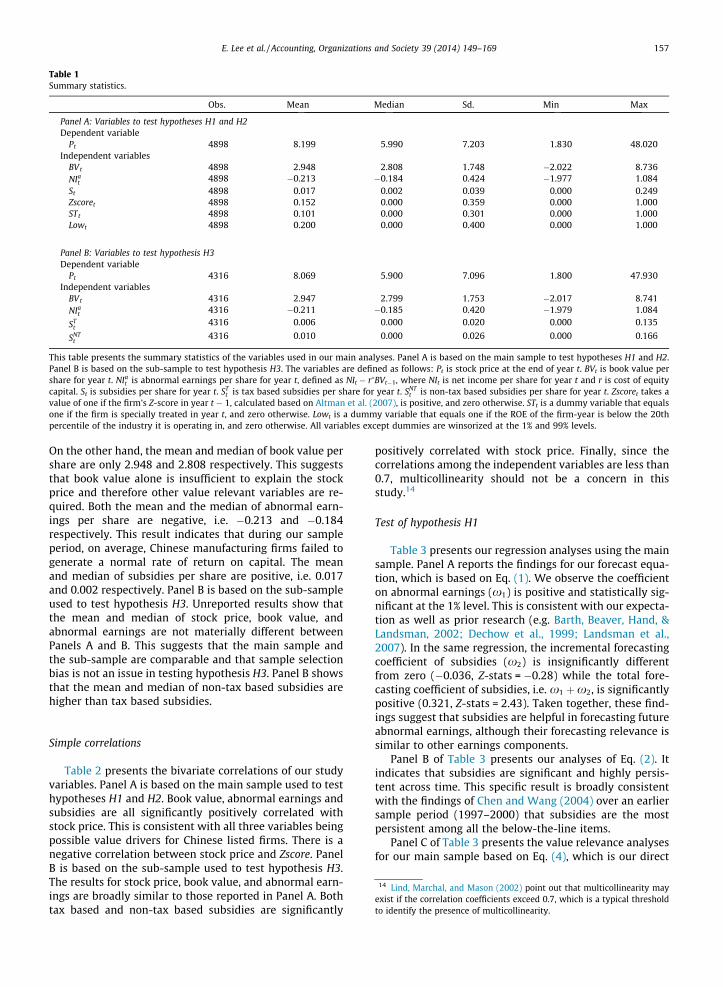
Table 1Summary statistics.
Obs. Mean Median Sd. Min Max
Panel A: Variables to test hypotheses H1 and H2Dependent variable
Pt 4898 8.199 5.990 7.203 1.830 48.020Independent variables
BVt 4898 2.948 2.808 1.748 �2.022 8.736NIa
t 4898 �0.213 �0.184 0.424 �1.977 1.084St 4898 0.017 0.002 0.039 0.000 0.249Zscoret 4898 0.152 0.000 0.359 0.000 1.000STt 4898 0.101 0.000 0.301 0.000 1.000Lowt 4898 0.200 0.000 0.400 0.000 1.000
Panel B: Variables to test hypothesis H3Dependent variable
Pt 4316 8.069 5.900 7.096 1.800 47.930Independent variables
BVt 4316 2.947 2.799 1.753 �2.017 8.741NIa
t 4316 �0.211 �0.185 0.420 �1.979 1.084
STt
4316 0.006 0.000 0.020 0.000 0.135
SNTt
4316 0.010 0.000 0.026 0.000 0.166
This table presents the summary statistics of the variables used in our main analyses. Panel A is based on the main sample to test hypotheses H1 and H2.Panel B is based on the sub-sample to test hypothesis H3. The variables are defined as follows: Pt is stock price at the end of year t. BVt is book value pershare for year t. NIa
t is abnormal earnings per share for year t, defined as NIt � r�BVt�1, where NIt is net income per share for year t and r is cost of equitycapital. St is subsidies per share for year t. ST
t is tax based subsidies per share for year t. SNTt is non-tax based subsidies per share for year t. Zscoret takes a
value of one if the firm’s Z-score in year t � 1, calculated based on Altman et al. (2007), is positive, and zero otherwise. STt is a dummy variable that equalsone if the firm is specially treated in year t, and zero otherwise. Lowt is a dummy variable that equals one if the ROE of the firm-year is below the 20thpercentile of the industry it is operating in, and zero otherwise. All variables except dummies are winsorized at the 1% and 99% levels.
E. Lee et al. / Accounting, Organizations and Society 39 (2014) 149–169 157
On the other hand, the mean and median of book value pershare are only 2.948 and 2.808 respectively. This suggeststhat book value alone is insufficient to explain the stockprice and therefore other value relevant variables are re-quired. Both the mean and the median of abnormal earn-ings per share are negative, i.e. �0.213 and �0.184respectively. This result indicates that during our sampleperiod, on average, Chinese manufacturing firms failed togenerate a normal rate of return on capital. The meanand median of subsidies per share are positive, i.e. 0.017and 0.002 respectively. Panel B is based on the sub-sampleused to test hypothesis H3. Unreported results show thatthe mean and median of stock price, book value, andabnormal earnings are not materially different betweenPanels A and B. This suggests that the main sample andthe sub-sample are comparable and that sample selectionbias is not an issue in testing hypothesis H3. Panel B showsthat the mean and median of non-tax based subsidies arehigher than tax based subsidies.
14 Lind, Marchal, and Mason (2002) point out that multicollinearity mayexist if the correlation coefficients exceed 0.7, which is a typical thresholdto identify the presence of multicollinearity.
Simple correlations
Table 2 presents the bivariate correlations of our studyvariables. Panel A is based on the main sample used to testhypotheses H1 and H2. Book value, abnormal earnings andsubsidies are all significantly positively correlated withstock price. This is consistent with all three variables beingpossible value drivers for Chinese listed firms. There is anegative correlation between stock price and Zscore. PanelB is based on the sub-sample used to test hypothesis H3.The results for stock price, book value, and abnormal earn-ings are broadly similar to those reported in Panel A. Bothtax based and non-tax based subsidies are significantly
positively correlated with stock price. Finally, since thecorrelations among the independent variables are less than0.7, multicollinearity should not be a concern in thisstudy.14
Test of hypothesis H1
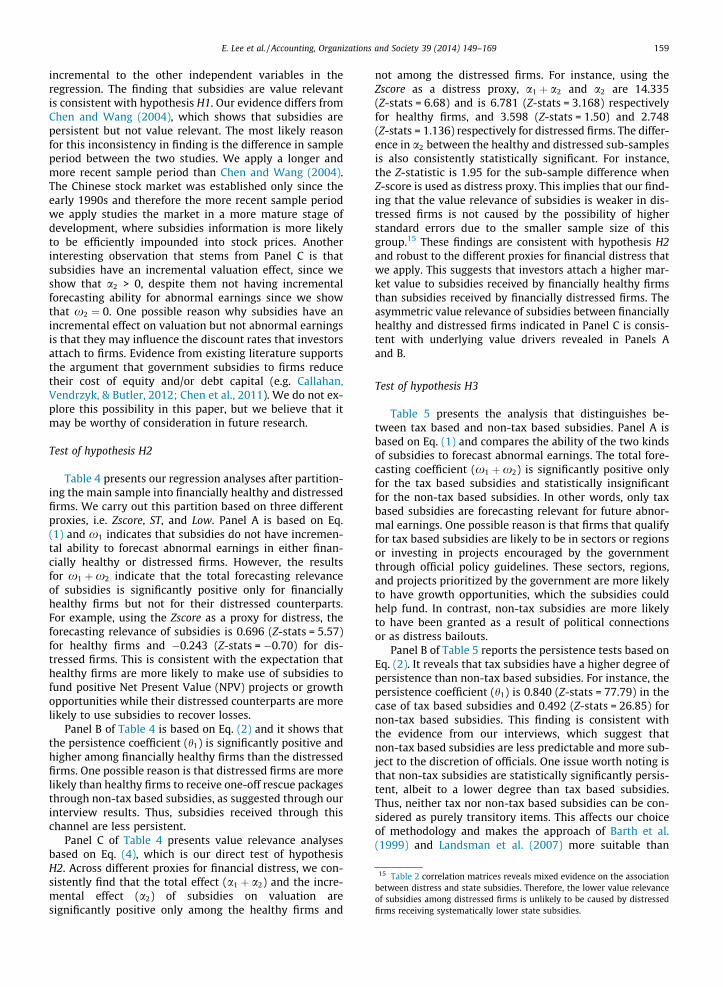
Table 3 presents our regression analyses using the mainsample. Panel A reports the findings for our forecast equa-tion, which is based on Eq. (1). We observe the coefficienton abnormal earnings (x1) is positive and statistically sig-nificant at the 1% level. This is consistent with our expecta-tion as well as prior research (e.g. Barth, Beaver, Hand, &Landsman, 2002; Dechow et al., 1999; Landsman et al.,2007). In the same regression, the incremental forecastingcoefficient of subsidies (x2) is insignificantly differentfrom zero (�0.036, Z-stats = �0.28) while the total fore-casting coefficient of subsidies, i.e. x1 þx2, is significantlypositive (0.321, Z-stats = 2.43). Taken together, these find-ings suggest that subsidies are helpful in forecasting futureabnormal earnings, although their forecasting relevance issimilar to other earnings components.
Panel B of Table 3 presents our analyses of Eq. (2). Itindicates that subsidies are significant and highly persis-tent across time. This specific result is broadly consistentwith the findings of Chen and Wang (2004) over an earliersample period (1997–2000) that subsidies are the mostpersistent among all the below-the-line items.
Panel C of Table 3 presents the value relevance analysesfor our main sample based on Eq. (4), which is our direct
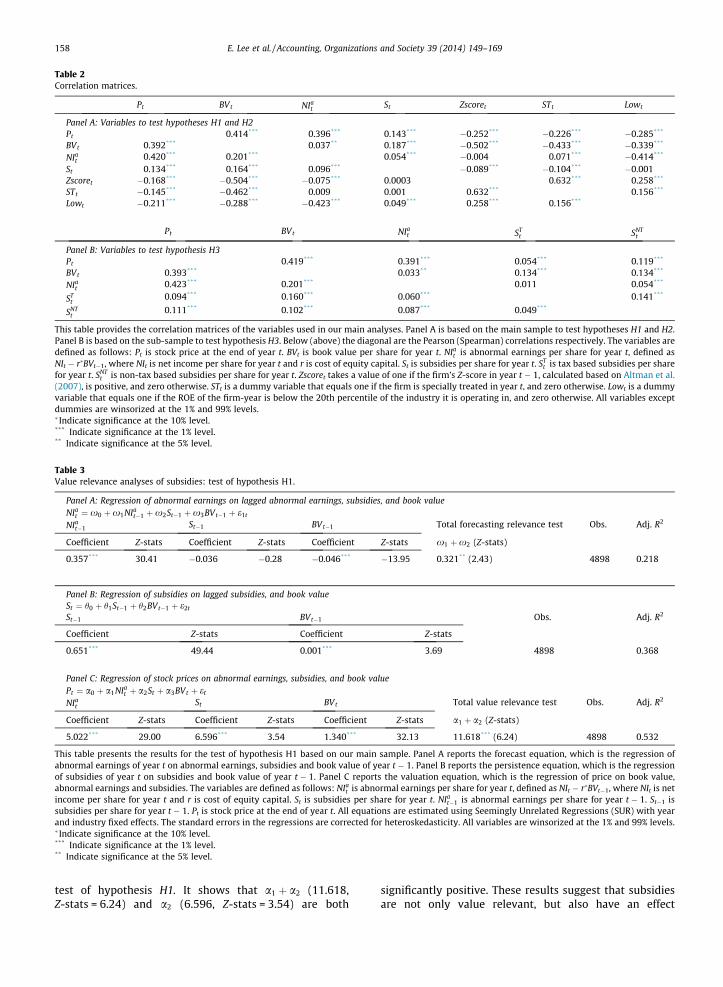
Table 2Correlation matrices.
Pt BVt NIat St Zscoret STt Lowt
Panel A: Variables to test hypotheses H1 and H2Pt 0.414*** 0.396*** 0.143*** �0.252*** �0.226*** �0.285***
BVt 0.392*** 0.037** 0.187*** �0.502*** �0.433*** �0.339***
NIat 0.420*** 0.201*** 0.054*** �0.004 0.071*** �0.414***
St 0.134*** 0.164*** 0.096*** �0.089*** �0.104*** �0.001Zscoret �0.168*** �0.504*** �0.075*** 0.0003 0.632*** 0.258***
STt �0.145*** �0.462*** 0.009 0.001 0.632*** 0.156***
Lowt �0.211*** �0.288*** �0.423*** 0.049*** 0.258*** 0.156***
Pt BVt NIat ST
t SNTt
Panel B: Variables to test hypothesis H3Pt 0.419*** 0.391*** 0.054*** 0.119***
BVt 0.393*** 0.033** 0.134*** 0.134***
NIat 0.423*** 0.201*** 0.011 0.054***
STt
0.094*** 0.160*** 0.060*** 0.141***
SNTt
0.111*** 0.102*** 0.087*** 0.049***
This table provides the correlation matrices of the variables used in our main analyses. Panel A is based on the main sample to test hypotheses H1 and H2.Panel B is based on the sub-sample to test hypothesis H3. Below (above) the diagonal are the Pearson (Spearman) correlations respectively. The variables aredefined as follows: Pt is stock price at the end of year t. BVt is book value per share for year t. NIa
t is abnormal earnings per share for year t, defined asNIt � r�BVt�1, where NIt is net income per share for year t and r is cost of equity capital. St is subsidies per share for year t. ST
t is tax based subsidies per sharefor year t. SNT
t is non-tax based subsidies per share for year t. Zscoret takes a value of one if the firm’s Z-score in year t � 1, calculated based on Altman et al.(2007), is positive, and zero otherwise. STt is a dummy variable that equals one if the firm is specially treated in year t, and zero otherwise. Lowt is a dummyvariable that equals one if the ROE of the firm-year is below the 20th percentile of the industry it is operating in, and zero otherwise. All variables exceptdummies are winsorized at the 1% and 99% levels.� Indicate significance at the 10% level.*** Indicate significance at the 1% level.** Indicate significance at the 5% level.
Table 3Value relevance analyses of subsidies: test of hypothesis H1.
Panel A: Regression of abnormal earnings on lagged abnormal earnings, subsidies, and book valueNIa
t ¼ x0 þx1NIat�1 þx2St�1 þx3BVt�1 þ e1t
NIat�1 St�1 BVt�1 Total forecasting relevance test Obs. Adj. R2
Coefficient Z-stats Coefficient Z-stats Coefficient Z-stats x1 þx2 (Z-stats)
0.357*** 30.41 �0.036 �0.28 �0.046*** �13.95 0.321** (2.43) 4898 0.218
Panel B: Regression of subsidies on lagged subsidies, and book valueSt ¼ h0 þ h1St�1 þ h2BVt�1 þ e2t
St�1 BVt�1 Obs. Adj. R2
Coefficient Z-stats Coefficient Z-stats
0.651*** 49.44 0.001*** 3.69 4898 0.368
Panel C: Regression of stock prices on abnormal earnings, subsidies, and book valuePt ¼ a0 þ a1NIa
t þ a2St þ a3BVt þ et
NIat St BVt Total value relevance test Obs. Adj. R2
Coefficient Z-stats Coefficient Z-stats Coefficient Z-stats a1 þ a2 (Z-stats)
5.022*** 29.00 6.596*** 3.54 1.340*** 32.13 11.618*** (6.24) 4898 0.532
This table presents the results for the test of hypothesis H1 based on our main sample. Panel A reports the forecast equation, which is the regression ofabnormal earnings of year t on abnormal earnings, subsidies and book value of year t � 1. Panel B reports the persistence equation, which is the regressionof subsidies of year t on subsidies and book value of year t � 1. Panel C reports the valuation equation, which is the regression of price on book value,abnormal earnings and subsidies. The variables are defined as follows: NIa
t is abnormal earnings per share for year t, defined as NIt � r�BVt�1, where NIt is netincome per share for year t and r is cost of equity capital. St is subsidies per share for year t. NIa
t�1 is abnormal earnings per share for year t � 1. St�1 issubsidies per share for year t � 1. Pt is stock price at the end of year t. All equations are estimated using Seemingly Unrelated Regressions (SUR) with yearand industry fixed effects. The standard errors in the regressions are corrected for heteroskedasticity. All variables are winsorized at the 1% and 99% levels.� Indicate significance at the 10% level.*** Indicate significance at the 1% level.** Indicate significance at the 5% level.
158 E. Lee et al. / Accounting, Organizations and Society 39 (2014) 149–169
test of hypothesis H1. It shows that a1 þ a2 (11.618,Z-stats = 6.24) and a2 (6.596, Z-stats = 3.54) are both
significantly positive. These results suggest that subsidiesare not only value relevant, but also have an effect
15 Table 2 correlation matrices reveals mixed evidence on the associationbetween distress and state subsidies. Therefore, the lower value relevanceof subsidies among distressed firms is unlikely to be caused by distressedfirms receiving systematically lower state subsidies.
E. Lee et al. / Accounting, Organizations and Society 39 (2014) 149–169 159
incremental to the other independent variables in theregression. The finding that subsidies are value relevantis consistent with hypothesis H1. Our evidence differs fromChen and Wang (2004), which shows that subsidies arepersistent but not value relevant. The most likely reasonfor this inconsistency in finding is the difference in sampleperiod between the two studies. We apply a longer andmore recent sample period than Chen and Wang (2004).The Chinese stock market was established only since theearly 1990s and therefore the more recent sample periodwe apply studies the market in a more mature stage ofdevelopment, where subsidies information is more likelyto be efficiently impounded into stock prices. Anotherinteresting observation that stems from Panel C is thatsubsidies have an incremental valuation effect, since weshow that a2 > 0, despite them not having incrementalforecasting ability for abnormal earnings since we showthat x2 ¼ 0. One possible reason why subsidies have anincremental effect on valuation but not abnormal earningsis that they may influence the discount rates that investorsattach to firms. Evidence from existing literature supportsthe argument that government subsidies to firms reducetheir cost of equity and/or debt capital (e.g. Callahan,Vendrzyk, & Butler, 2012; Chen et al., 2011). We do not ex-plore this possibility in this paper, but we believe that itmay be worthy of consideration in future research.
Test of hypothesis H2
Table 4 presents our regression analyses after partition-ing the main sample into financially healthy and distressedfirms. We carry out this partition based on three differentproxies, i.e. Zscore, ST, and Low. Panel A is based on Eq.(1) and x1 indicates that subsidies do not have incremen-tal ability to forecast abnormal earnings in either finan-cially healthy or distressed firms. However, the resultsfor x1 þx2 indicate that the total forecasting relevanceof subsidies is significantly positive only for financiallyhealthy firms but not for their distressed counterparts.For example, using the Zscore as a proxy for distress, theforecasting relevance of subsidies is 0.696 (Z-stats = 5.57)for healthy firms and �0.243 (Z-stats = �0.70) for dis-tressed firms. This is consistent with the expectation thathealthy firms are more likely to make use of subsidies tofund positive Net Present Value (NPV) projects or growthopportunities while their distressed counterparts are morelikely to use subsidies to recover losses.
Panel B of Table 4 is based on Eq. (2) and it shows thatthe persistence coefficient (h1) is significantly positive andhigher among financially healthy firms than the distressedfirms. One possible reason is that distressed firms are morelikely than healthy firms to receive one-off rescue packagesthrough non-tax based subsidies, as suggested through ourinterview results. Thus, subsidies received through thischannel are less persistent.
Panel C of Table 4 presents value relevance analysesbased on Eq. (4), which is our direct test of hypothesisH2. Across different proxies for financial distress, we con-sistently find that the total effect (a1 þ a2) and the incre-mental effect (a2) of subsidies on valuation aresignificantly positive only among the healthy firms and
not among the distressed firms. For instance, using theZscore as a distress proxy, a1 þ a2 and a2 are 14.335(Z-stats = 6.68) and is 6.781 (Z-stats = 3.168) respectivelyfor healthy firms, and 3.598 (Z-stats = 1.50) and 2.748(Z-stats = 1.136) respectively for distressed firms. The differ-ence in a2 between the healthy and distressed sub-samplesis also consistently statistically significant. For instance,the Z-statistic is 1.95 for the sub-sample difference whenZ-score is used as distress proxy. This implies that our find-ing that the value relevance of subsidies is weaker in dis-tressed firms is not caused by the possibility of higherstandard errors due to the smaller sample size of thisgroup.15 These findings are consistent with hypothesis H2and robust to the different proxies for financial distress thatwe apply. This suggests that investors attach a higher mar-ket value to subsidies received by financially healthy firmsthan subsidies received by financially distressed firms. Theasymmetric value relevance of subsidies between financiallyhealthy and distressed firms indicated in Panel C is consis-tent with underlying value drivers revealed in Panels Aand B.
Test of hypothesis H3
Table 5 presents the analysis that distinguishes be-tween tax based and non-tax based subsidies. Panel A isbased on Eq. (1) and compares the ability of the two kindsof subsidies to forecast abnormal earnings. The total fore-casting coefficient (x1 þx2) is significantly positive onlyfor the tax based subsidies and statistically insignificantfor the non-tax based subsidies. In other words, only taxbased subsidies are forecasting relevant for future abnor-mal earnings. One possible reason is that firms that qualifyfor tax based subsidies are likely to be in sectors or regionsor investing in projects encouraged by the governmentthrough official policy guidelines. These sectors, regions,and projects prioritized by the government are more likelyto have growth opportunities, which the subsidies couldhelp fund. In contrast, non-tax subsidies are more likelyto have been granted as a result of political connectionsor as distress bailouts.
Panel B of Table 5 reports the persistence tests based onEq. (2). It reveals that tax subsidies have a higher degree ofpersistence than non-tax based subsidies. For instance, thepersistence coefficient (h1) is 0.840 (Z-stats = 77.79) in thecase of tax based subsidies and 0.492 (Z-stats = 26.85) fornon-tax based subsidies. This finding is consistent withthe evidence from our interviews, which suggest thatnon-tax based subsidies are less predictable and more sub-ject to the discretion of officials. One issue worth noting isthat non-tax subsidies are statistically significantly persis-tent, albeit to a lower degree than tax based subsidies.Thus, neither tax nor non-tax based subsidies can be con-sidered as purely transitory items. This affects our choiceof methodology and makes the approach of Barth et al.(1999) and Landsman et al. (2007) more suitable than
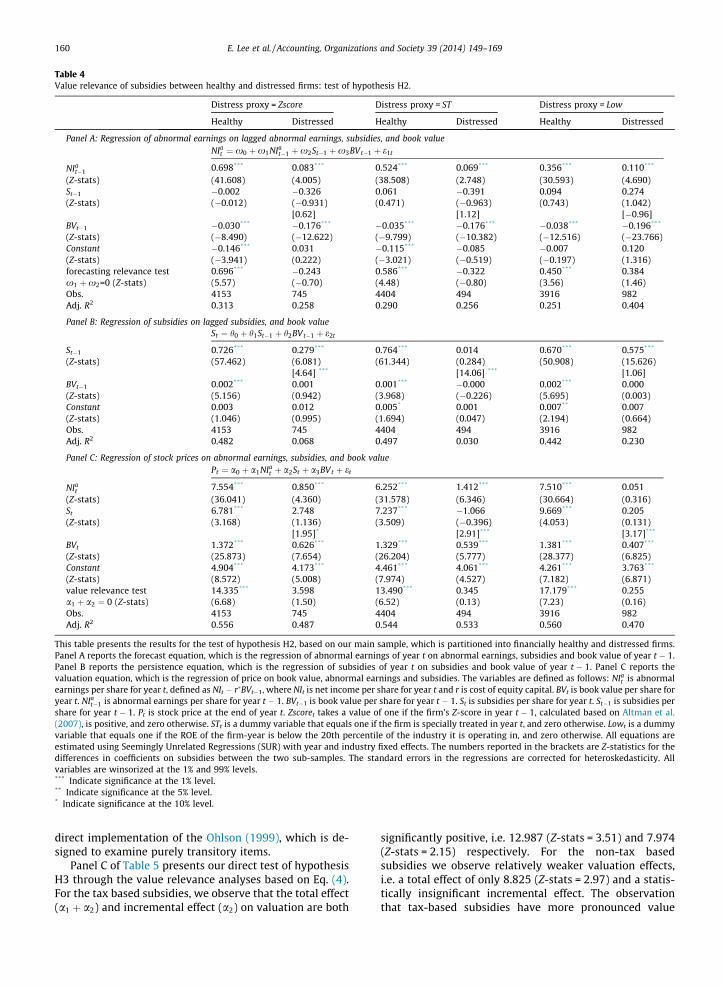
Table 4Value relevance of subsidies between healthy and distressed firms: test of hypothesis H2.
Distress proxy = Zscore Distress proxy = ST Distress proxy = Low
Healthy Distressed Healthy Distressed Healthy Distressed
Panel A: Regression of abnormal earnings on lagged abnormal earnings, subsidies, and book valueNIa
t ¼ x0 þx1NIat�1 þx2St�1 þx3BVt�1 þ e1t
NIat�1 0.698*** 0.083*** 0.524*** 0.069*** 0.356*** 0.110***
(Z-stats) (41.608) (4.005) (38.508) (2.748) (30.593) (4.690)St�1 �0.002 �0.326 0.061 �0.391 0.094 0.274(Z-stats) (�0.012) (�0.931) (0.471) (�0.963) (0.743) (1.042)
[0.62] [1.12] [�0.96]BVt�1 �0.030*** �0.176*** �0.035*** �0.176*** �0.038*** �0.196***
(Z-stats) (�8.490) (�12.622) (�9.799) (�10.382) (�12.516) (�23.766)Constant �0.146*** 0.031 �0.115*** �0.085 �0.007 0.120(Z-stats) (�3.941) (0.222) (�3.021) (�0.519) (�0.197) (1.316)forecasting relevance test 0.696*** �0.243 0.586*** �0.322 0.450*** 0.384x1 þx2=0 (Z-stats) (5.57) (�0.70) (4.48) (�0.80) (3.56) (1.46)Obs. 4153 745 4404 494 3916 982Adj. R2 0.313 0.258 0.290 0.256 0.251 0.404
Panel B: Regression of subsidies on lagged subsidies, and book valueSt ¼ h0 þ h1St�1 þ h2BVt�1 þ e2t
St�1 0.726*** 0.279*** 0.764*** 0.014 0.670*** 0.575***
(Z-stats) (57.462) (6.081) (61.344) (0.284) (50.908) (15.626)[4.64] *** [14.06] *** [1.06]
BVt�1 0.002*** 0.001 0.001*** �0.000 0.002*** 0.000(Z-stats) (5.156) (0.942) (3.968) (�0.226) (5.695) (0.003)Constant 0.003 0.012 0.005* 0.001 0.007** 0.007(Z-stats) (1.046) (0.995) (1.694) (0.047) (2.194) (0.664)Obs. 4153 745 4404 494 3916 982Adj. R2 0.482 0.068 0.497 0.030 0.442 0.230
Panel C: Regression of stock prices on abnormal earnings, subsidies, and book valuePt ¼ a0 þ a1NIa
t þ a2St þ a3BVt þ et
NIat 7.554*** 0.850*** 6.252*** 1.412*** 7.510*** 0.051
(Z-stats) (36.041) (4.360) (31.578) (6.346) (30.664) (0.316)St 6.781*** 2.748 7.237*** �1.066 9.669*** 0.205(Z-stats) (3.168) (1.136) (3.509) (�0.396) (4.053) (0.131)
[1.95]* [2.91]*** [3.17]***
BVt 1.372*** 0.626*** 1.329*** 0.539*** 1.381*** 0.407***
(Z-stats) (25.873) (7.654) (26.204) (5.777) (28.377) (6.825)Constant 4.904*** 4.173*** 4.461*** 4.061*** 4.261*** 3.763***
(Z-stats) (8.572) (5.008) (7.974) (4.527) (7.182) (6.871)value relevance test 14.335*** 3.598 13.490*** 0.345 17.179*** 0.255a1 þ a2 ¼ 0 (Z-stats) (6.68) (1.50) (6.52) (0.13) (7.23) (0.16)Obs. 4153 745 4404 494 3916 982Adj. R2 0.556 0.487 0.544 0.533 0.560 0.470
This table presents the results for the test of hypothesis H2, based on our main sample, which is partitioned into financially healthy and distressed firms.Panel A reports the forecast equation, which is the regression of abnormal earnings of year t on abnormal earnings, subsidies and book value of year t � 1.Panel B reports the persistence equation, which is the regression of subsidies of year t on subsidies and book value of year t � 1. Panel C reports thevaluation equation, which is the regression of price on book value, abnormal earnings and subsidies. The variables are defined as follows: NIa
t is abnormalearnings per share for year t, defined as NIt � r�BVt�1, where NIt is net income per share for year t and r is cost of equity capital. BVt is book value per share foryear t. NIa
t�1 is abnormal earnings per share for year t � 1. BVt�1 is book value per share for year t � 1. St is subsidies per share for year t. St�1 is subsidies pershare for year t � 1. Pt is stock price at the end of year t. Zscoret takes a value of one if the firm’s Z-score in year t � 1, calculated based on Altman et al.(2007), is positive, and zero otherwise. STt is a dummy variable that equals one if the firm is specially treated in year t, and zero otherwise. Lowt is a dummyvariable that equals one if the ROE of the firm-year is below the 20th percentile of the industry it is operating in, and zero otherwise. All equations areestimated using Seemingly Unrelated Regressions (SUR) with year and industry fixed effects. The numbers reported in the brackets are Z-statistics for thedifferences in coefficients on subsidies between the two sub-samples. The standard errors in the regressions are corrected for heteroskedasticity. Allvariables are winsorized at the 1% and 99% levels.*** Indicate significance at the 1% level.** Indicate significance at the 5% level.* Indicate significance at the 10% level.
160 E. Lee et al. / Accounting, Organizations and Society 39 (2014) 149–169
direct implementation of the Ohlson (1999), which is de-signed to examine purely transitory items.
Panel C of Table 5 presents our direct test of hypothesisH3 through the value relevance analyses based on Eq. (4).For the tax based subsidies, we observe that the total effect(a1 þ a2) and incremental effect (a2) on valuation are both
significantly positive, i.e. 12.987 (Z-stats = 3.51) and 7.974(Z-stats = 2.15) respectively. For the non-tax basedsubsidies we observe relatively weaker valuation effects,i.e. a total effect of only 8.825 (Z-stats = 2.97) and a statis-tically insignificant incremental effect. The observationthat tax-based subsidies have more pronounced value
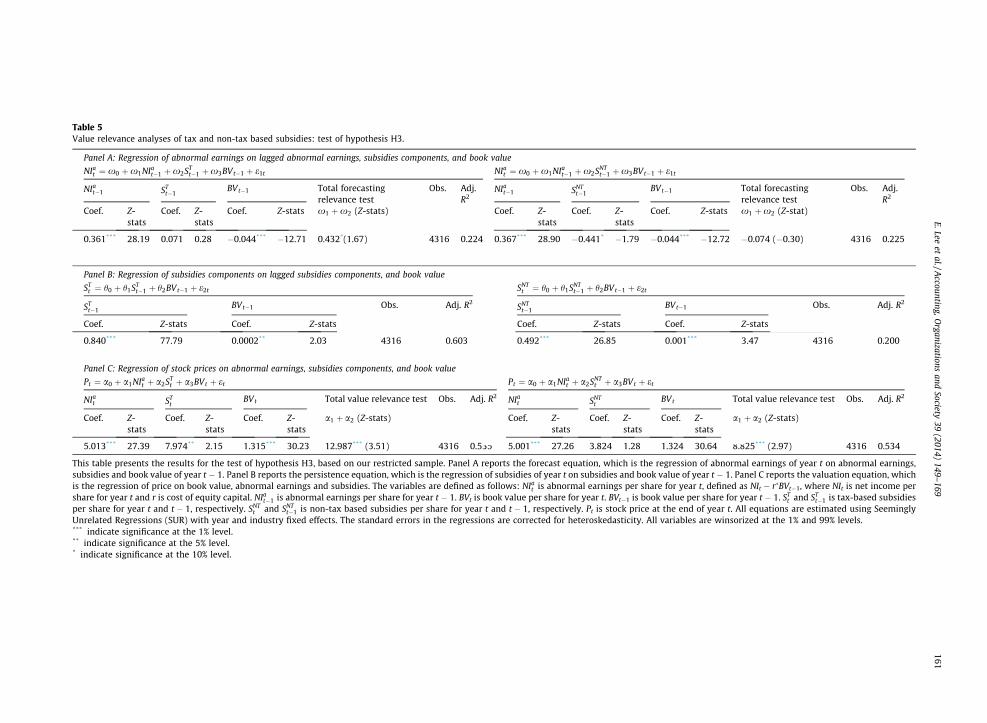
Table 5Value relevance analyses of tax and non-tax based subsidies: test of hypothesis H3.
Panel A: Regression of abnormal earnings on lagged abnormal earnings, subsidies components, and book value
NIat ¼ x0 þx1NIa
t�1 þx2STt�1 þx3BVt�1 þ e1t NIa
t ¼ x0 þx1NIat�1 þx2SNT
t�1 þx3BVt�1 þ e1t
NIat�1 ST
t�1BVt�1 Total forecasting
relevance testObs. Adj.
R2NIa
t�1 SNTt�1
BVt�1 Total forecastingrelevance test
Obs. Adj.R2
Coef. Z-stats
Coef. Z-stats
Coef. Z-stats x1 þx2 (Z-stats) Coef. Z-stats
Coef. Z-stats
Coef. Z-stats x1 þx2 (Z-stat)
0.361*** 28.19 0.071 0.28 �0.044*** �12.71 0.432*(1.67) 4316 0.224 0.367*** 28.90 �0.441* �1.79 �0.044*** �12.72 �0.074 (�0.30) 4316 0.225
Panel B: Regression of subsidies components on lagged subsidies components, and book value
STt ¼ h0 þ h1ST
t�1 þ h2BVt�1 þ e2t SNTt ¼ h0 þ h1SNT
t�1 þ h2BVt�1 þ e2t
STt�1
BVt�1 Obs. Adj. R2SNT
t�1BVt�1 Obs. Adj. R2
Coef. Z-stats Coef. Z-stats Coef. Z-stats Coef. Z-stats
0.840*** 77.79 0.0002** 2.03 4316 0.603 0.492*** 26.85 0.001*** 3.47 4316 0.200
Panel C: Regression of stock prices on abnormal earnings, subsidies components, and book value
Pt ¼ a0 þ a1NIat þ a2ST
t þ a3BVt þ et Pt ¼ a0 þ a1NIat þ a2SNT
t þ a3BVt þ et
NIat ST
tBVt Total value relevance test Obs. Adj. R2 NIa
t SNTt
BVt Total value relevance test Obs. Adj. R2
Coef. Z-stats
Coef. Z-stats
Coef. Z-stats
a1 þ a2 (Z-stats) Coef. Z-stats
Coef. Z-stats
Coef. Z-stats
a1 þ a2 (Z-stats)
5.013*** 27.39 7.974** 2.15 1.315*** 30.23 12.987*** (3.51) 4316 0.535 5.001*** 27.26 3.824 1.28 1.324 30.64 8.825*** (2.97) 4316 0.534
This table presents the results for the test of hypothesis H3, based on our restricted sample. Panel A reports the forecast equation, which is the regression of abnormal earnings of year t on abnormal earnings,subsidies and book value of year t � 1. Panel B reports the persistence equation, which is the regression of subsidies of year t on subsidies and book value of year t � 1. Panel C reports the valuation equation, whichis the regression of price on book value, abnormal earnings and subsidies. The variables are defined as follows: NIa
t is abnormal earnings per share for year t, defined as NIt � r�BVt�1, where NIt is net income pershare for year t and r is cost of equity capital. NIa
t�1 is abnormal earnings per share for year t � 1. BVt is book value per share for year t. BVt�1 is book value per share for year t � 1. STt and ST
t�1 is tax-based subsidiesper share for year t and t � 1, respectively. SNT
t and SNTt�1 is non-tax based subsidies per share for year t and t � 1, respectively. Pt is stock price at the end of year t. All equations are estimated using Seemingly
Unrelated Regressions (SUR) with year and industry fixed effects. The standard errors in the regressions are corrected for heteroskedasticity. All variables are winsorized at the 1% and 99% levels.*** indicate significance at the 1% level.** indicate significance at the 5% level.* indicate significance at the 10% level.
E.Leeet
al./Accounting,O
rganizationsand
Society39
(2014)149–
169161
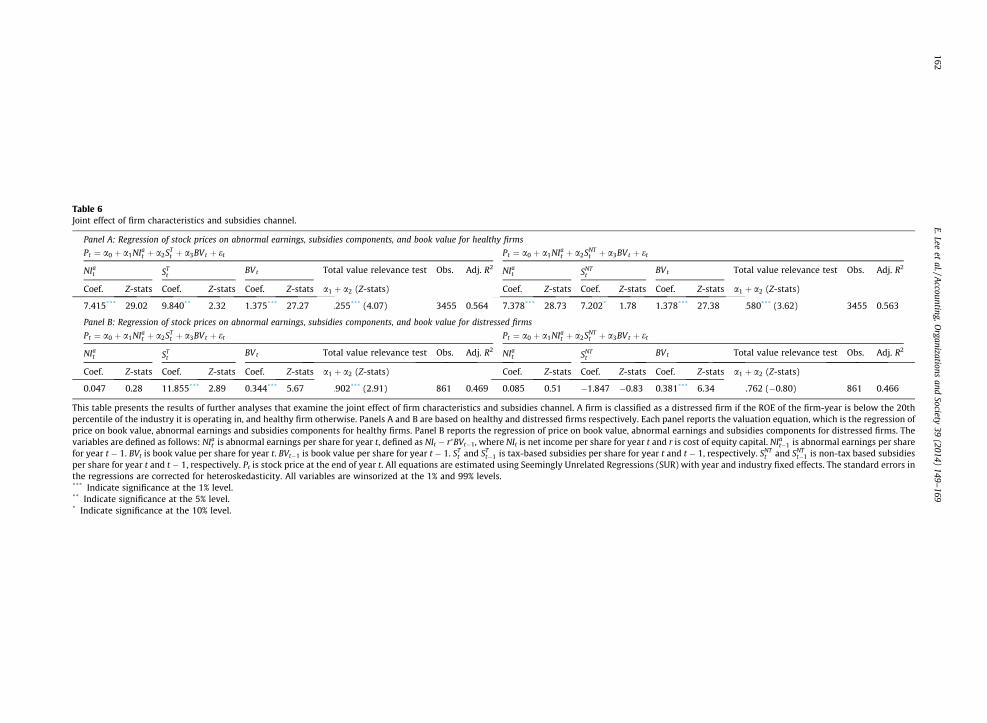
Table 6Joint effect of firm characteristics and subsidies channel.
Panel A: Regression of stock prices on abnormal earnings, subsidies components, and book value for healthy firms
Pt ¼ a0 þ a1NIat þ a2ST
t þ a3BVt þ et Pt ¼ a0 þ a1NIat þ a2SNT
t þ a3BVt þ et
NIat ST
tBVt Total value relevance test Obs. Adj. R2 NIa
t SNTt
BVt Total value relevance test Obs. Adj. R2
Coef. Z-stats Coef. Z-stats Coef. Z-stats a1 þ a2 (Z-stats) Coef. Z-stats Coef. Z-stats Coef. Z-stats a1 þ a2 (Z-stats)
7.415*** 29.02 9.840** 2.32 1.375*** 27.27 17.255*** (4.07) 3455 0.564 7.378*** 28.73 7.202* 1.78 1.378*** 27.38 14.580*** (3.62) 3455 0.563
Panel B: Regression of stock prices on abnormal earnings, subsidies components, and book value for distressed firms
Pt ¼ a0 þ a1NIat þ a2ST
t þ a3BVt þ et Pt ¼ a0 þ a1NIat þ a2SNT
t þ a3BVt þ et
NIat ST
tBVt Total value relevance test Obs. Adj. R2 NIa
t SNTt
BVt Total value relevance test Obs. Adj. R2
Coef. Z-stats Coef. Z-stats Coef. Z-stats a1 þ a2 (Z-stats) Coef. Z-stats Coef. Z-stats Coef. Z-stats a1 þ a2 (Z-stats)
0.047 0.28 11.855*** 2.89 0.344*** 5.67 11.902*** (2.91) 861 0.469 0.085 0.51 �1.847 �0.83 0.381*** 6.34 �1.762 (�0.80) 861 0.466
This table presents the results of further analyses that examine the joint effect of firm characteristics and subsidies channel. A firm is classified as a distressed firm if the ROE of the firm-year is below the 20thpercentile of the industry it is operating in, and healthy firm otherwise. Panels A and B are based on healthy and distressed firms respectively. Each panel reports the valuation equation, which is the regression ofprice on book value, abnormal earnings and subsidies components for healthy firms. Panel B reports the regression of price on book value, abnormal earnings and subsidies components for distressed firms. Thevariables are defined as follows: NIa
t is abnormal earnings per share for year t, defined as NIt � r�BVt�1, where NIt is net income per share for year t and r is cost of equity capital. NIat�1 is abnormal earnings per share
for year t � 1. BVt is book value per share for year t. BVt�1 is book value per share for year t � 1. STt and ST
t�1 is tax-based subsidies per share for year t and t � 1, respectively. SNTt and SNT
t�1 is non-tax based subsidiesper share for year t and t � 1, respectively. Pt is stock price at the end of year t. All equations are estimated using Seemingly Unrelated Regressions (SUR) with year and industry fixed effects. The standard errors inthe regressions are corrected for heteroskedasticity. All variables are winsorized at the 1% and 99% levels.*** Indicate significance at the 1% level.** Indicate significance at the 5% level.* Indicate significance at the 10% level.
162E.Lee
etal./A
ccounting,Organizations
andSociety
39(2014)
149–169
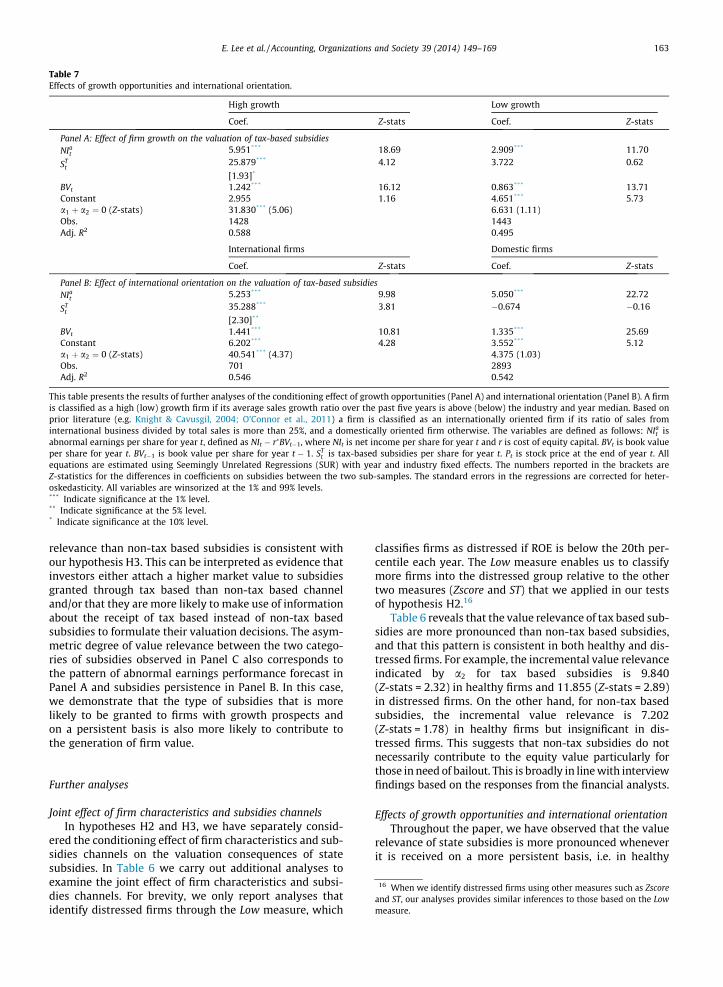
Table 7Effects of growth opportunities and international orientation.
High growth Low growth
Coef. Z-stats Coef. Z-stats
Panel A: Effect of firm growth on the valuation of tax-based subsidiesNIa
t 5.951*** 18.69 2.909*** 11.70
STt
25.879*** 4.12 3.722 0.62
[1.93]*
BVt 1.242*** 16.12 0.863*** 13.71Constant 2.955 1.16 4.651*** 5.73a1 þ a2 ¼ 0 (Z-stats) 31.830*** (5.06) 6.631 (1.11)Obs. 1428 1443Adj. R2 0.588 0.495
International firms Domestic firms
Coef. Z-stats Coef. Z-stats
Panel B: Effect of international orientation on the valuation of tax-based subsidiesNIa
t 5.253*** 9.98 5.050*** 22.72
STt
35.288*** 3.81 �0.674 �0.16
[2.30]**
BVt 1.441*** 10.81 1.335*** 25.69Constant 6.202*** 4.28 3.552*** 5.12a1 þ a2 ¼ 0 (Z-stats) 40.541*** (4.37) 4.375 (1.03)Obs. 701 2893Adj. R2 0.546 0.542
This table presents the results of further analyses of the conditioning effect of growth opportunities (Panel A) and international orientation (Panel B). A firmis classified as a high (low) growth firm if its average sales growth ratio over the past five years is above (below) the industry and year median. Based onprior literature (e.g. Knight & Cavusgil, 2004; O’Connor et al., 2011) a firm is classified as an internationally oriented firm if its ratio of sales frominternational business divided by total sales is more than 25%, and a domestically oriented firm otherwise. The variables are defined as follows: NIa
t isabnormal earnings per share for year t, defined as NIt � r�BVt�1, where NIt is net income per share for year t and r is cost of equity capital. BVt is book valueper share for year t. BVt�1 is book value per share for year t � 1. ST
t is tax-based subsidies per share for year t. Pt is stock price at the end of year t. Allequations are estimated using Seemingly Unrelated Regressions (SUR) with year and industry fixed effects. The numbers reported in the brackets areZ-statistics for the differences in coefficients on subsidies between the two sub-samples. The standard errors in the regressions are corrected for heter-oskedasticity. All variables are winsorized at the 1% and 99% levels.*** Indicate significance at the 1% level.** Indicate significance at the 5% level.* Indicate significance at the 10% level.
E. Lee et al. / Accounting, Organizations and Society 39 (2014) 149–169 163
relevance than non-tax based subsidies is consistent withour hypothesis H3. This can be interpreted as evidence thatinvestors either attach a higher market value to subsidiesgranted through tax based than non-tax based channeland/or that they are more likely to make use of informationabout the receipt of tax based instead of non-tax basedsubsidies to formulate their valuation decisions. The asym-metric degree of value relevance between the two catego-ries of subsidies observed in Panel C also corresponds tothe pattern of abnormal earnings performance forecast inPanel A and subsidies persistence in Panel B. In this case,we demonstrate that the type of subsidies that is morelikely to be granted to firms with growth prospects andon a persistent basis is also more likely to contribute tothe generation of firm value.
16 When we identify distressed firms using other measures such as Zscoreand ST, our analyses provides similar inferences to those based on the Lowmeasure.
Further analyses
Joint effect of firm characteristics and subsidies channelsIn hypotheses H2 and H3, we have separately consid-
ered the conditioning effect of firm characteristics and sub-sidies channels on the valuation consequences of statesubsidies. In Table 6 we carry out additional analyses toexamine the joint effect of firm characteristics and subsi-dies channels. For brevity, we only report analyses thatidentify distressed firms through the Low measure, which
classifies firms as distressed if ROE is below the 20th per-centile each year. The Low measure enables us to classifymore firms into the distressed group relative to the othertwo measures (Zscore and ST) that we applied in our testsof hypothesis H2.16
Table 6 reveals that the value relevance of tax based sub-sidies are more pronounced than non-tax based subsidies,and that this pattern is consistent in both healthy and dis-tressed firms. For example, the incremental value relevanceindicated by a2 for tax based subsidies is 9.840(Z-stats = 2.32) in healthy firms and 11.855 (Z-stats = 2.89)in distressed firms. On the other hand, for non-tax basedsubsidies, the incremental value relevance is 7.202(Z-stats = 1.78) in healthy firms but insignificant in dis-tressed firms. This suggests that non-tax subsidies do notnecessarily contribute to the equity value particularly forthose in need of bailout. This is broadly in line with interviewfindings based on the responses from the financial analysts.
Effects of growth opportunities and international orientationThroughout the paper, we have observed that the value
relevance of state subsidies is more pronounced wheneverit is received on a more persistent basis, i.e. in healthy
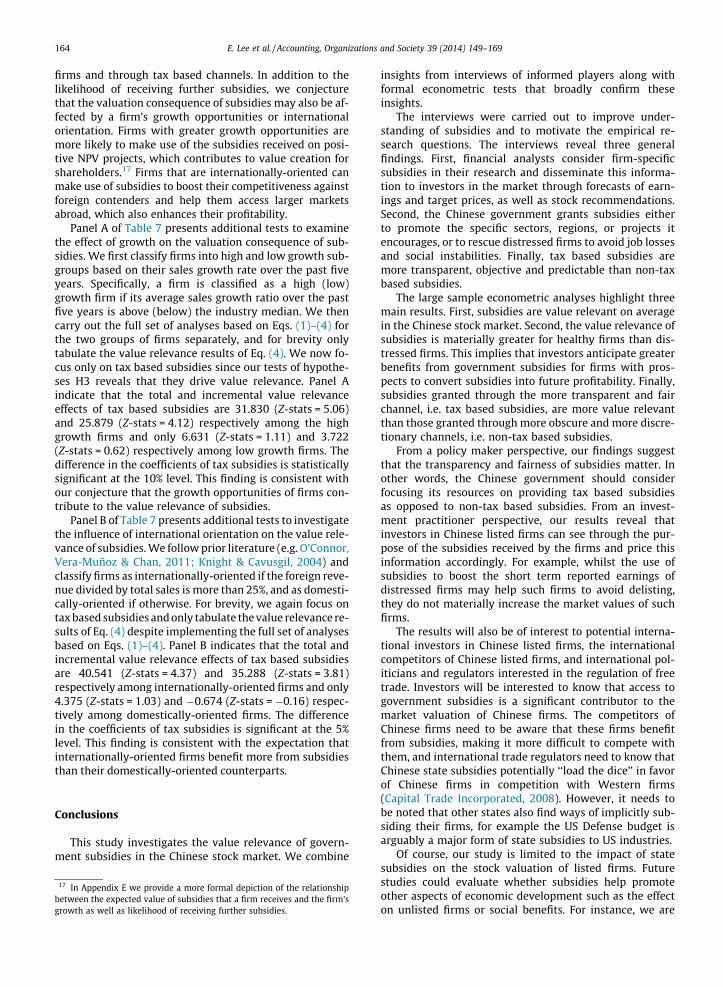
164 E. Lee et al. / Accounting, Organizations and Society 39 (2014) 149–169
firms and through tax based channels. In addition to thelikelihood of receiving further subsidies, we conjecturethat the valuation consequence of subsidies may also be af-fected by a firm’s growth opportunities or internationalorientation. Firms with greater growth opportunities aremore likely to make use of the subsidies received on posi-tive NPV projects, which contributes to value creation forshareholders.17 Firms that are internationally-oriented canmake use of subsidies to boost their competitiveness againstforeign contenders and help them access larger marketsabroad, which also enhances their profitability.
Panel A of Table 7 presents additional tests to examinethe effect of growth on the valuation consequence of sub-sidies. We first classify firms into high and low growth sub-groups based on their sales growth rate over the past fiveyears. Specifically, a firm is classified as a high (low)growth firm if its average sales growth ratio over the pastfive years is above (below) the industry median. We thencarry out the full set of analyses based on Eqs. (1)–(4) forthe two groups of firms separately, and for brevity onlytabulate the value relevance results of Eq. (4). We now fo-cus only on tax based subsidies since our tests of hypothe-ses H3 reveals that they drive value relevance. Panel Aindicate that the total and incremental value relevanceeffects of tax based subsidies are 31.830 (Z-stats = 5.06)and 25.879 (Z-stats = 4.12) respectively among the highgrowth firms and only 6.631 (Z-stats = 1.11) and 3.722(Z-stats = 0.62) respectively among low growth firms. Thedifference in the coefficients of tax subsidies is statisticallysignificant at the 10% level. This finding is consistent withour conjecture that the growth opportunities of firms con-tribute to the value relevance of subsidies.
Panel B of Table 7 presents additional tests to investigatethe influence of international orientation on the value rele-vance of subsidies. We follow prior literature (e.g. O’Connor,Vera-Muñoz & Chan, 2011; Knight & Cavusgil, 2004) andclassify firms as internationally-oriented if the foreign reve-nue divided by total sales is more than 25%, and as domesti-cally-oriented if otherwise. For brevity, we again focus ontax based subsidies and only tabulate the value relevance re-sults of Eq. (4) despite implementing the full set of analysesbased on Eqs. (1)–(4). Panel B indicates that the total andincremental value relevance effects of tax based subsidiesare 40.541 (Z-stats = 4.37) and 35.288 (Z-stats = 3.81)respectively among internationally-oriented firms and only4.375 (Z-stats = 1.03) and �0.674 (Z-stats = �0.16) respec-tively among domestically-oriented firms. The differencein the coefficients of tax subsidies is significant at the 5%level. This finding is consistent with the expectation thatinternationally-oriented firms benefit more from subsidiesthan their domestically-oriented counterparts.
Conclusions
This study investigates the value relevance of govern-ment subsidies in the Chinese stock market. We combine
17 In Appendix E we provide a more formal depiction of the relationshipbetween the expected value of subsidies that a firm receives and the firm’sgrowth as well as likelihood of receiving further subsidies.
insights from interviews of informed players along withformal econometric tests that broadly confirm theseinsights.
The interviews were carried out to improve under-standing of subsidies and to motivate the empirical re-search questions. The interviews reveal three generalfindings. First, financial analysts consider firm-specificsubsidies in their research and disseminate this informa-tion to investors in the market through forecasts of earn-ings and target prices, as well as stock recommendations.Second, the Chinese government grants subsidies eitherto promote the specific sectors, regions, or projects itencourages, or to rescue distressed firms to avoid job lossesand social instabilities. Finally, tax based subsidies aremore transparent, objective and predictable than non-taxbased subsidies.
The large sample econometric analyses highlight threemain results. First, subsidies are value relevant on averagein the Chinese stock market. Second, the value relevance ofsubsidies is materially greater for healthy firms than dis-tressed firms. This implies that investors anticipate greaterbenefits from government subsidies for firms with pros-pects to convert subsidies into future profitability. Finally,subsidies granted through the more transparent and fairchannel, i.e. tax based subsidies, are more value relevantthan those granted through more obscure and more discre-tionary channels, i.e. non-tax based subsidies.
From a policy maker perspective, our findings suggestthat the transparency and fairness of subsidies matter. Inother words, the Chinese government should considerfocusing its resources on providing tax based subsidiesas opposed to non-tax based subsidies. From an invest-ment practitioner perspective, our results reveal thatinvestors in Chinese listed firms can see through the pur-pose of the subsidies received by the firms and price thisinformation accordingly. For example, whilst the use ofsubsidies to boost the short term reported earnings ofdistressed firms may help such firms to avoid delisting,they do not materially increase the market values of suchfirms.
The results will also be of interest to potential interna-tional investors in Chinese listed firms, the internationalcompetitors of Chinese listed firms, and international pol-iticians and regulators interested in the regulation of freetrade. Investors will be interested to know that access togovernment subsidies is a significant contributor to themarket valuation of Chinese firms. The competitors ofChinese firms need to be aware that these firms benefitfrom subsidies, making it more difficult to compete withthem, and international trade regulators need to know thatChinese state subsidies potentially ‘‘load the dice’’ in favorof Chinese firms in competition with Western firms(Capital Trade Incorporated, 2008). However, it needs tobe noted that other states also find ways of implicitly sub-siding their firms, for example the US Defense budget isarguably a major form of state subsidies to US industries.
Of course, our study is limited to the impact of statesubsidies on the stock valuation of listed firms. Futurestudies could evaluate whether subsidies help promoteother aspects of economic development such as the effecton unlisted firms or social benefits. For instance, we are
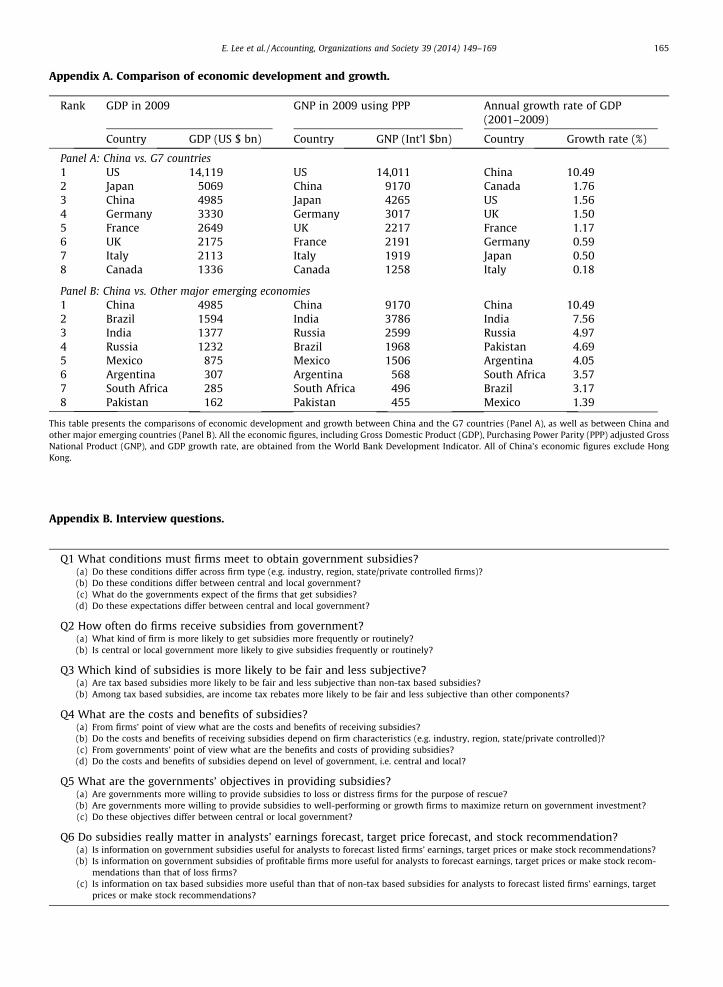
Appendix A. Comparison of economic development and growth.
Rank GDP in 2009 GNP in 2009 using PPP Annual growth rate of GDP(2001–2009)
Country GDP (US $ bn) Country GNP (Int’l $bn) Country Growth rate (%)
Panel A: China vs. G7 countries1 US 14,119 US 14,011 China 10.492 Japan 5069 China 9170 Canada 1.763 China 4985 Japan 4265 US 1.564 Germany 3330 Germany 3017 UK 1.505 France 2649 UK 2217 France 1.176 UK 2175 France 2191 Germany 0.597 Italy 2113 Italy 1919 Japan 0.508 Canada 1336 Canada 1258 Italy 0.18
Panel B: China vs. Other major emerging economies1 China 4985 China 9170 China 10.492 Brazil 1594 India 3786 India 7.563 India 1377 Russia 2599 Russia 4.974 Russia 1232 Brazil 1968 Pakistan 4.695 Mexico 875 Mexico 1506 Argentina 4.056 Argentina 307 Argentina 568 South Africa 3.577 South Africa 285 South Africa 496 Brazil 3.178 Pakistan 162 Pakistan 455 Mexico 1.39
This table presents the comparisons of economic development and growth between China and the G7 countries (Panel A), as well as between China andother major emerging countries (Panel B). All the economic figures, including Gross Domestic Product (GDP), Purchasing Power Parity (PPP) adjusted GrossNational Product (GNP), and GDP growth rate, are obtained from the World Bank Development Indicator. All of China’s economic figures exclude HongKong.
Appendix B. Interview questions.
Q1 What conditions must firms meet to obtain government subsidies?(a) Do these conditions differ across firm type (e.g. industry, region, state/private controlled firms)?(b) Do these conditions differ between central and local government?(c) What do the governments expect of the firms that get subsidies?(d) Do these expectations differ between central and local government?
Q2 How often do firms receive subsidies from government?(a) What kind of firm is more likely to get subsidies more frequently or routinely?(b) Is central or local government more likely to give subsidies frequently or routinely?
Q3 Which kind of subsidies is more likely to be fair and less subjective?(a) Are tax based subsidies more likely to be fair and less subjective than non-tax based subsidies?(b) Among tax based subsidies, are income tax rebates more likely to be fair and less subjective than other components?
Q4 What are the costs and benefits of subsidies?(a) From firms’ point of view what are the costs and benefits of receiving subsidies?(b) Do the costs and benefits of receiving subsidies depend on firm characteristics (e.g. industry, region, state/private controlled)?(c) From governments’ point of view what are the benefits and costs of providing subsidies?(d) Do the costs and benefits of subsidies depend on level of government, i.e. central and local?
Q5 What are the governments’ objectives in providing subsidies?(a) Are governments more willing to provide subsidies to loss or distress firms for the purpose of rescue?(b) Are governments more willing to provide subsidies to well-performing or growth firms to maximize return on government investment?(c) Do these objectives differ between central or local government?
Q6 Do subsidies really matter in analysts’ earnings forecast, target price forecast, and stock recommendation?(a) Is information on government subsidies useful for analysts to forecast listed firms’ earnings, target prices or make stock recommendations?(b) Is information on government subsidies of profitable firms more useful for analysts to forecast earnings, target prices or make stock recom-
mendations than that of loss firms?(c) Is information on tax based subsidies more useful than that of non-tax based subsidies for analysts to forecast listed firms’ earnings, target
prices or make stock recommendations?
E. Lee et al. / Accounting, Organizations and Society 39 (2014) 149–169 165
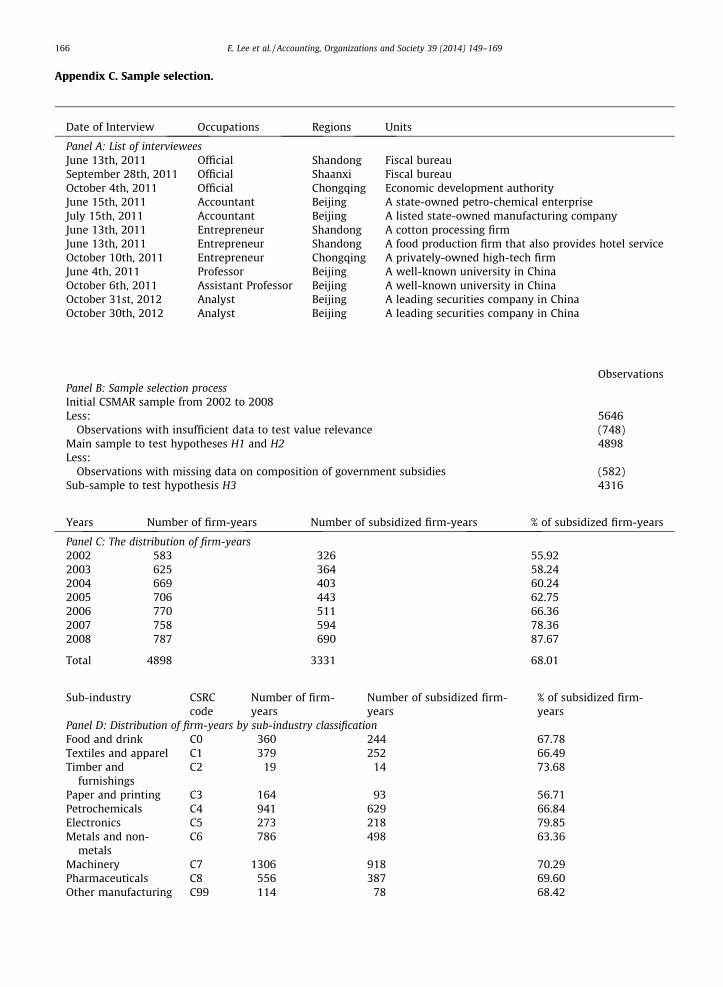
Appendix C. Sample selection.
Date of Interview Occupations Regions Units
Panel A: List of intervieweesJune 13th, 2011 Official Shandong Fiscal bureauSeptember 28th, 2011 Official Shaanxi Fiscal bureauOctober 4th, 2011 Official Chongqing Economic development authorityJune 15th, 2011 Accountant Beijing A state-owned petro-chemical enterpriseJuly 15th, 2011 Accountant Beijing A listed state-owned manufacturing companyJune 13th, 2011 Entrepreneur Shandong A cotton processing firmJune 13th, 2011 Entrepreneur Shandong A food production firm that also provides hotel serviceOctober 10th, 2011 Entrepreneur Chongqing A privately-owned high-tech firmJune 4th, 2011 Professor Beijing A well-known university in ChinaOctober 6th, 2011 Assistant Professor Beijing A well-known university in ChinaOctober 31st, 2012 Analyst Beijing A leading securities company in ChinaOctober 30th, 2012 Analyst Beijing A leading securities company in China
ObservationsPanel B: Sample selection processInitial CSMAR sample from 2002 to 2008Less: 5646
Observations with insufficient data to test value relevance (748)Main sample to test hypotheses H1 and H2 4898Less:
Observations with missing data on composition of government subsidies (582)Sub-sample to test hypothesis H3 4316
Years Number of firm-years Number of subsidized firm-years % of subsidized firm-years
Panel C: The distribution of firm-years2002 583 326 55.922003 625 364 58.242004 669 403 60.242005 706 443 62.752006 770 511 66.362007 758 594 78.362008 787 690 87.67
Total 4898 3331 68.01
Sub-industry CSRCcode
Number of firm-years
Number of subsidized firm-years
% of subsidized firm-years
Panel D: Distribution of firm-years by sub-industry classificationFood and drink C0 360 244 67.78Textiles and apparel C1 379 252 66.49Timber and
furnishingsC2 19 14 73.68
Paper and printing C3 164 93 56.71Petrochemicals C4 941 629 66.84Electronics C5 273 218 79.85Metals and non-
metalsC6 786 498 63.36
Machinery C7 1306 918 70.29Pharmaceuticals C8 556 387 69.60Other manufacturing C99 114 78 68.42
166 E. Lee et al. / Accounting, Organizations and Society 39 (2014) 149–169
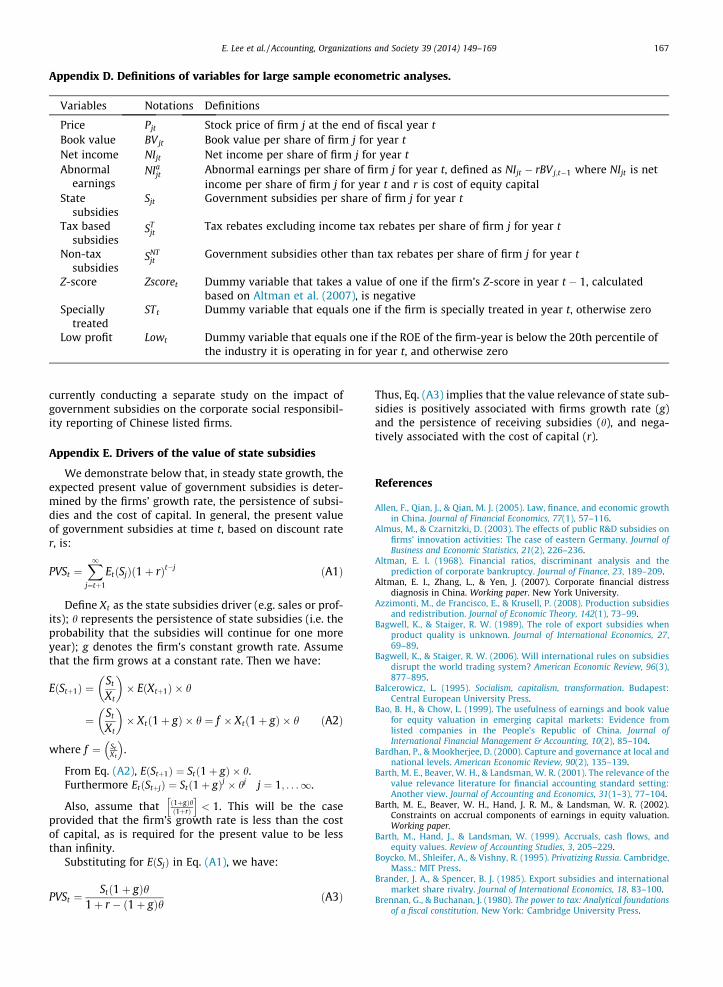
Appendix D. Definitions of variables for large sample econometric analyses.
Variables Notations Definitions
Price Pjt Stock price of firm j at the end of fiscal year tBook value BVjt Book value per share of firm j for year tNet income NIjt Net income per share of firm j for year tAbnormal
earningsNIa
jt Abnormal earnings per share of firm j for year t, defined as NIjt � rBVj;t�1 where NIjt is netincome per share of firm j for year t and r is cost of equity capital
Statesubsidies
Sjt Government subsidies per share of firm j for year t
Tax basedsubsidies
STjt
Tax rebates excluding income tax rebates per share of firm j for year t
Non-taxsubsidies
SNTjt
Government subsidies other than tax rebates per share of firm j for year t
Z-score Zscoret Dummy variable that takes a value of one if the firm’s Z-score in year t � 1, calculatedbased on Altman et al. (2007), is negative
Speciallytreated
STt Dummy variable that equals one if the firm is specially treated in year t, otherwise zero
Low profit Lowt Dummy variable that equals one if the ROE of the firm-year is below the 20th percentile ofthe industry it is operating in for year t, and otherwise zero
E. Lee et al. / Accounting, Organizations and Society 39 (2014) 149–169 167
currently conducting a separate study on the impact ofgovernment subsidies on the corporate social responsibil-ity reporting of Chinese listed firms.
Appendix E. Drivers of the value of state subsidies
We demonstrate below that, in steady state growth, theexpected present value of government subsidies is deter-mined by the firms’ growth rate, the persistence of subsi-dies and the cost of capital. In general, the present valueof government subsidies at time t, based on discount rater, is:
PVSt ¼X1
j¼tþ1
EtðSjÞð1þ rÞt�j ðA1Þ
Define Xt as the state subsidies driver (e.g. sales or prof-its); h represents the persistence of state subsidies (i.e. theprobability that the subsidies will continue for one moreyear); g denotes the firm’s constant growth rate. Assumethat the firm grows at a constant rate. Then we have:
EðStþ1Þ ¼St
Xt
� �� EðXtþ1Þ � h
¼ St
Xt
� �� Xtð1þ gÞ � h ¼ f � Xtð1þ gÞ � h ðA2Þ
where f ¼ StXt
� �.
From Eq. (A2), EðStþ1Þ ¼ Stð1þ gÞ � h.Furthermore EtðStþjÞ ¼ Stð1þ gÞj � hj j ¼ 1; . . .1.
Also, assume that ð1þgÞhð1þrÞ
h i< 1. This will be the case
provided that the firm’s growth rate is less than the costof capital, as is required for the present value to be lessthan infinity.
Substituting for EðSjÞ in Eq. (A1), we have:
PVSt ¼Stð1þ gÞh
1þ r � ð1þ gÞh ðA3Þ
Thus, Eq. (A3) implies that the value relevance of state sub-sidies is positively associated with firms growth rate (g)and the persistence of receiving subsidies (h), and nega-tively associated with the cost of capital (r).
References
Allen, F., Qian, J., & Qian, M. J. (2005). Law, finance, and economic growthin China. Journal of Financial Economics, 77(1), 57–116.
Almus, M., & Czarnitzki, D. (2003). The effects of public R&D subsidies onfirms’ innovation activities: The case of eastern Germany. Journal ofBusiness and Economic Statistics, 21(2), 226–236.
Altman, E. I. (1968). Financial ratios, discriminant analysis and theprediction of corporate bankruptcy. Journal of Finance, 23, 189–209.
Altman, E. I., Zhang, L., & Yen, J. (2007). Corporate financial distressdiagnosis in China. Working paper. New York University.
Azzimonti, M., de Francisco, E., & Krusell, P. (2008). Production subsidiesand redistribution. Journal of Economic Theory, 142(1), 73–99.
Bagwell, K., & Staiger, R. W. (1989). The role of export subsidies whenproduct quality is unknown. Journal of International Economics, 27,69–89.
Bagwell, K., & Staiger, R. W. (2006). Will international rules on subsidiesdisrupt the world trading system? American Economic Review, 96(3),877–895.
Balcerowicz, L. (1995). Socialism, capitalism, transformation. Budapest:Central European University Press.
Bao, B. H., & Chow, L. (1999). The usefulness of earnings and book valuefor equity valuation in emerging capital markets: Evidence fromlisted companies in the People’s Republic of China. Journal ofInternational Financial Management & Accounting, 10(2), 85–104.
Bardhan, P., & Mookherjee, D. (2000). Capture and governance at local andnational levels. American Economic Review, 90(2), 135–139.
Barth, M. E., Beaver, W. H., & Landsman, W. R. (2001). The relevance of thevalue relevance literature for financial accounting standard setting:Another view. Journal of Accounting and Economics, 31(1–3), 77–104.
Barth, M. E., Beaver, W. H., Hand, J. R. M., & Landsman, W. R. (2002).Constraints on accrual components of earnings in equity valuation.Working paper.
Barth, M., Hand, J., & Landsman, W. (1999). Accruals, cash flows, andequity values. Review of Accounting Studies, 3, 205–229.
Boycko, M., Shleifer, A., & Vishny, R. (1995). Privatizing Russia. Cambridge,Mass.: MIT Press.
Brander, J. A., & Spencer, B. J. (1985). Export subsidies and internationalmarket share rivalry. Journal of International Economics, 18, 83–100.
Brennan, G., & Buchanan, J. (1980). The power to tax: Analytical foundationsof a fiscal constitution. New York: Cambridge University Press.
168 E. Lee et al. / Accounting, Organizations and Society 39 (2014) 149–169
Callahan, C. M., Vendrzyk, V. P., & Butler, M. G. (2012). The impact ofimplied facilities cost of money subsidies on capital expenditures andthe cost of debt in the defense industry. Journal of Accounting PublicPolicy, 31, 301–319.
Capital Trade Incorporated (2008). An assessment of China’s subsidies tostrategic and heavyweight industries. Report submitted to US–ChinaEconomic and Security Review Commission.
Che, J., & Qian, Y. (1998). Insecure property rights and governmentownership of firms. Quarterly Journal of Economics, 113(2), 467–496.
Chen, H., Chen, J. Z., Lobo, G. J., & Wang, Y. (2011). Effects of audit qualityon earnings management and cost of equity capital: Evidence fromChina. Contemporary Accounting Research, 28(3), 892–925.
Chen, C. J. P., Chen, S. M., & Su, X. J. (2001). Is accounting informationvalue-relevant in the emerging Chinese stock market? Journal ofInternational Accounting, Auditing and Taxation, 10(1), 1–22.
Chen, Z. A., Du, J. M., Li, D. H., & Ou-Yang, R. (2013). Does foreigninstitutional ownership increase return volatility? Evidence fromChina. Journal of Banking and Finance, 37, 660–669.
Chen, D. H., Li, O. Z., Xin, F., & Yeung, B. (2012). Five-year plans and Chinafinance. Working paper.
Chen, X., Lee, C. W. J., & Li, J. (2008). Government assisted earningsmanagement in China. Journal of Accounting and Public Policy, 27,262–274.
Chen, X., & Li, J. (2001). Exploring the role of local government fiscalsupports in accounting performance of the listed companies. Journalof Accounting Research, 12, 20–28 (in Chinese).
Chen, S. M., & Wang, Y. T. (2004). Evidence from China on the valuerelevance of operating income vs. below-the-line items. TheInternational Journal of Accounting, 39, 339–364.
Cheng, P., Aerts, W., & Jorissen, A. (2010). Earnings management,asset restructuring, and the threat of exchange delisting in anearnings-based regulatory regime. Corporate Governance: AnInternational Review, 18(5), 438–456.
Chinese Accounting Standards Committee (2006). Accounting standardsfor enterprises No. 16: Government subsidies.
Claro, S. (2006). Supporting inefficient firms with capital subsidies: Chinaand Germany in the 1990s. Journal of Comparative Economics, 34(2),377–401.
Conrad, K. (1993). Taxes and subsidies for pollution-intensive industriesas trade policy. Journal of Environmental Economics and Management,25(2), 121–135.
Conrad, K., & Wang, J. M. (1993). The effect of emission taxes andabatement subsidies on market structure. International Journal ofIndustrial Organization, 11(4), 499–518.
Davidson, C., & Segerstrom, P. (1998). R&D subsidies and economicgrowth. RAND Journal of Economics, 29(3), 548–577.
De Mel, S., McKenzie, D., & Woodruff, C. (2010). Wage subsidies formicroenterprises. American Economic Review, 100(2), 614–618.
Dechow, P. M., Hutton, A. P., & Sloan, R. G. (1999). An empiricalassessment of the residual income valuation model. Journal ofAccounting and Economics, 26, 1–34.
Desai, M. A., & Hines, J. R. (2008). Market reactions to export subsidies.Journal of International Economics, 74(2), 459–474.
Dewatripont, M., & Roland, G. (1995). The design of reformpackages under uncertainty. American Economic Review, 85(5),1207–1223.
Enikolopov, R., & Zhuravskaya, E. (2007). Decentralisation and politicalinstitutions. Journal of Public Economics, 91, 2261–2290.
Ezzamel, M., Xiao, Z., & Pan, A. (2007). Political ideology and accountingregulation in China. Accounting, Organizations and Society, 32(7–8),669–700.
Firth, M., Fung, P. M. Y., & Rui, O. M. (2006). Corporate performance andCEO compensation in China. Journal of Corporate Finance, 12(4),693–714.
Frye, T., & Shleifer, A. (1997). The invisible hand and grabbing hand.American Economic Review, 87(2), 354–358.
Girma, S., Gong, Y. D., Gorg, H., & Yu, Z. H. (2009). Can productionsubsidies explain China’s export performance? Evidence from firm-Level data. Scandinavian Journal of Economics, 111(4), 863–891.
González, X., Jaumandreu, J., & Pazo, C. (2005). Barriers to innovationand subsidy effectiveness. RAND Journal of Economics, 36(4),930–950.
Gorg, H., & Strobl, E. (2007). The effect of R&D subsidies on private R&D.Economica, 74(294), 215–234.
Gu, Z., Li, Z., & Yang, Y. G. (2012). Monitors or predators: The influence ofinstitutional investors on sell-side analysts. The Accounting Review,88(1), 137–169.
Hanson, G. H., & Robertson, R. (2008). China and the manufacturingexports of other developing countries. NBER working paper.
Haw, I. M., Qi, D. Q., & Wu, W. (1999). Value relevance of earnings in anemerging capital market: The case of A-shares in China. PacificEconomic Review, 4(3), 337–348.
Hawksworth, J., & Tiwari, A. (2011). The world in 2050 – The acceleratingshift of global economic power: Challenges and opportunities.<http://www.pwc.com/en_GX/gx/world-2050/pdf/world-in-2050-jan-2011.pdf>.
Hellman, J., & Shankerman, M. (2000). Intervention, corruption andcapture: The nexus between enterprises and the state. Economics ofTransition, 8(3), 545–576.
Hillegeist, S. A., Keating, E. K., Cram, D. P., & Lundstend, K. G. (2004).Assessing profitability of bankruptcy. Review of Accounting Studies, 9,5–34.
Hung, M. Y., Wong, T. J., & Zhang, T. Y. (2008). Political relations andoverseas stock exchange listing: Evidence from Chinese state-ownedenterprises. Working paper.
Irwin, D. A., & Klenow, P. J. (1996). High-Tech R&D subsidies: Estimatingthe effects of Sematech. Journal of International Economics, 40(3–4),323–344.
Ishikawa, J., & Spencer, B. J. (1999). Rent-shifting export subsidies with animported intermediate product. Journal of International Economics,48(2), 199–232.
Jin, H., Qian, Y., & Weingast, B. (2005). Regional decentralisation and fiscalincentives: Federalism Chinese style. Journal of Public Economics,89(9–10), 1719–1742.
Jing, L. (2009). Governance and financial reform in China’s transitioneconomy. Hong Kong: Hong Kong University Press.
Keen, M., & Marchand, M. (1997). Fiscal competition and the pattern ofpublic spending. Journal of Public Economics, 66, 33–53.
Knight, G. A., & Cavusgil, S. T. (2004). Innovation, organizationalcapabilities, and the Born-Global firm. Journal of InternationalBusiness Studies, 35(2), 124–141.
Kohn, R. E. (1997). The effect of emission taxes and abatement subsidieson market structure: Comment. International Journal of IndustrialOrganization, 15(5), 617–628.
Landsman, W., Miller, B., & Yeh, S. (2007). Implication of components ofincome exclude from pro forma earnings for future profitability andequity valuation. Journal of Business Finance and Accounting, 34,650–675.
Larsen, B., & Shah, A. (1992). World fossil fuel subsidies and global carbonemissions. Working paper.
Lau, L., Qian, Y., & Roland, G. (2000). Reform without losers: Aninterpretation of China’s dual-track approach to transition. Journalof Political Economy, 108(1), 120–143.
Lee, C. W. J. (2001). Financial restructuring of state owned enterprises inChina: The case of Shanghai Sunve Pharmaceutical Corporation.Accounting, Organizations and Society, 26, 673–689.
Lee, E., Walker, W., & Zeng, C. (2013). Does IFRS convergence affectfinancial reporting quality in China? ACCA Research Report.
Li, W. L. (2002). Entrepreneurship and government subsidies: A generalequilibrium analysis. Journal of Economic Dynamics and Control,26(11), 1815–1844.
Lind, D. A., Marchal, W. G., & Mason, R. D. (2002). Statistical techniques inbusiness and economics. Irwin: MaGraw-Hill.
Lipton, D., & Sachs, J. (1990). Creating a market economy in EasternEurope: The case of Poland. Brookings Papers on Economic Activity, 1,75–133.
Litwack, J., & Qian, Y. (1998). Balanced or unbalanced development:Special economic zones as catalysts for transition. Journal ofComparative Economics, 26(1), 117–141.
Long, D., Payne, J., & Feng, C. (1999). Information transmission in theShanghai equity market. Journal of Financial Research, 22, 29–45.
Lopez, R., & Galinato, G. I. (2007). Should governments stop subsidies toprivate goods? Evidence from rural Latin America. Journal of PublicEconomics, 91(5–6), 1071–1094.
Neary, J. P. (1994). Cost asymmetries in international subsidy games:Should governments help winners or losers? Journal of InternationalEconomics, 37(3–4), 197–218.
Oates, W. (1972). Fiscal federalism. New York: Harcourt Brace Jovanovich.O’Connor, N. G., Chow, C. W., & Wu, A. (2004). The adoption of ‘‘Western’’
management accounting/controls in China’s state-owned enterprisesduring economic transition. Accounting, Organizations and Society,29(3), 349–375.
O’Connor, N. G., Deng, J., & Luo, Y. D. (2006). Political constraints,organization design and performance measurement in China’s state-owned enterprises. Accounting, Organizations and Society, 31,157–177.
O’Connor, N. G., Vera-Muñoz, S. C., & Chan, F. (2011). Competitive forcesand the importance of management control systems in emerging-
E. Lee et al. / Accounting, Organizations and Society 39 (2014) 149–169 169
economy firms: The moderating effect of international marketorientation. Accounting, Organizations and Society, 36(4), 246–266.
Ohlson, J. A. (1995). Earnings, equity book values, and dividends in equityvaluation. Contemporary Accounting Research, 11, 661–688.
Ohlson, J. A. (1999). On transitory earnings. Review of Accounting Studies,3, 145–162.
Phelps, E. S. (1994). Low-wage employment subsidies versus the welfarestate. American Economic Review, 84(2), 54–58.
Qian, Y., & Roland, G. (1998). Federalism and the soft budget constraint.American Economic Review, 88(5), 1143–1162.
Roland, G. (2002). The political economy of transition. Journal of EconomicPerspective, 16(1), 29–50.
Sami, H., & Zhou, H. Y. (2004). A comparison of value relevance ofaccounting information in different segments of the Chinese stockmarket. The International Journal of Accounting, 39(4), 403–427.
Schleicher, T., Hussainey, K., & Walker, M. (2007). Loss firms’ annualreport narratives and share price anticipation of earnings. The BritishAccounting Review, 39, 153–171.
Schwartz, G., & Clements, B. (1999). Government subsidies. Journal ofEconomic Survey, 13(2), 119–147.
Shen, H. B. (2007). Market segmentation, cross listing and the expectedcapital cost: Evidence using Ohlson-Juettner model. Journal ofFinancial Research, 2, 146–155 (in Chinese).
Shivakumar, R. (1993). Strategic trade policy: Choosing between exportsubsidies and export quotas under uncertainty. Journal of InternationalEconomics, 35(1–2), 169–183.
Shleifer, A., & Treisman, D. (2000). Without a map: Political tactics andeconomic reform in Russia. Cambridge, Mass.: MIT Press.
Shleifer, A., & Vishny, R. (1993). Corruption. Quarterly Journal of Economics,108(3), 599–671.
Shleifer, A., & Vishny, R. W. (1998). The grabbing hand: Governmentpathologies and their cures. Harvard University Press.
Snower, D. J. (1994). Converting unemployment benefits intoemployment subsidies. American Economic Review, 84(2), 65–70.
Sudman, S., & Bradburn, N. M. (1983). Asking questions: A practical guide toquestionnaire design. San Francisco, CA: Jossey-Bass.
Summers, S. T., & Sweeney, J. T. (1998). Fraudulently misstated financialstatements and insider trading: An empirical analysis. The AccountingReview, 73(1), 131–146.
Tang, Q. Q., & Luo, D. L. (2007). Empirical study on the motivation and theeffect of government subsidies: Evidence from Chinese listedcompanies. Journal of Financial Research, 6, 149–163 (in Chinese).
Thomas, G. R. (1994). Chinese industrial reform: Accomplishment,prospects, and implications. American Economic Review, 84(2),271–275.
To, T. (1994). Export subsidies and Oligopoly with switching costs. Journalof International Economics, 37(1–2), 97–110.
Walder, A. (1995). China’s transitional economy: Interpreting itssignificance. China Quarterly, 144, 963–979.
Wei, S. (1997). Gradualism versus big bang: Speed and sustainability ofreforms. Canadian Journal of Economics, 30(4), 1234–1247.
Zhu, S., & Chen, Y. S. (2009). Government subsidy decisions, earningsmanagement incentives, and loss reversals of listed firms. ChinaAccounting and Finance Review, 11(3), 115–140.
Zhuravskaya, E. (2000). Incentives to provide local public goods: Fiscalfederalism Russian style. Journal of Public Economics, 76(3), 337–368.