Embed Size (px)
Citation preview
ACCOUNTING WORKSHOP
“Do CEO Bonus Plans Serve a Purpose?”
By
Wayne Guay* John Kepler
The Wharton School
University of Pennsylvania
David Tsui
Marshall School of Business University of Southern California
Thursday, Oct. 13, 2016 1:20 – 2:50 p.m.
Room C06 *Speaker Paper Available in Room 447
Do CEO Bonus Plans Serve a Purpose?
Wayne Guay* [email protected]
The Wharton School University of Pennsylvania
John Kepler
[email protected] The Wharton School
University of Pennsylvania
David Tsui [email protected] Marshall School of Business
University of Southern California
October 6, 2016
Abstract: Given the substantial stock and option portfolios held by most CEOs, much recent literature on CEO incentives regards cash-based bonus plans as largely irrelevant. This begs the question of why nearly all CEO compensation plans include such bonuses. We re-examine the financial incentives provided by bonuses and their role in executive compensation packages. Using detailed data on bonus-plan performance measures, we document that the pay-performance sensitivity of CEO cash compensation is much greater than prior estimates and that cash-based pay provides a substantial portion of many CEOs’ total financial incentives early in their tenure. However, we find little evidence that boards adjust bonus plans over time in response to CEO-specific characteristics, such as the evolution of CEO equity holdings or liquidity needs. This “stickiness” results in growing disparity between the magnitudes of cash- and equity portfolio-based incentives over a typical CEO’s tenure. At the same time, we find evidence that bonus plans appear to consider liquidity and incentive issues for lower-level executives, leading us to conclude that cash-based plans are designed mainly for the overall management team, as well as perhaps new CEOs. Keywords: executive compensation; managerial incentives; pay-performance sensitivity
* Corresponding author. We gratefully acknowledge comments and suggestions from Matthew Cedergren (discussant) as well as seminar participants at Cornell, Wharton, the 2016 American Accounting Association Annual Meeting, and the 2016 UCI/UCLA/USC Accounting Research Conference.

- 1 -
1. Introduction
This paper re-examines the financial incentives provided by executive bonuses and their
role in firms’ incentive compensation packages.1 The vast majority of U.S. executive
compensation plans incorporate bonus payouts, and boards devote considerable time and expense
to designing these often complex plans. However, prior literature presents very different views
regarding the importance of bonuses in CEOs’ overall incentive schemes. One stream of literature
argues that bonus plans provide important incentives and influence CEOs’ investment, financing,
and financial reporting decisions.2 In contrast, other literature estimates the monetary incentives
that bonus awards provide and largely concludes that these incentives are modest, both in absolute
terms and compared to equity-based incentives (e.g., Jensen and Murphy, 1990; Hall and Liebman,
1998; Core et al., 2003).3 Based in part on these findings regarding the magnitude of incentives
from bonus plans, much of the recent literature on CEO incentives ignores bonus awards, due to
their presumed second-order importance, and instead focuses exclusively on “delta” and “vega”
incentives stemming from stock and option portfolio holdings. This latter view, if correct, raises
the question as to why bonus compensation is so pervasive at the CEO level and why boards devote
so much time and energy to designing these plans.
We shed light on this issue by first showing that the actual performance sensitivity of
bonuses is considerably larger than estimates in prior studies, and is comparable in scale to equity
1 We use the term “bonus” in this paper to refer to all forms of short-term cash-based incentive compensation (i.e., annual non-equity-based incentives). 2 Examples of studies emphasizing the importance of cash-based incentive plans include Healy (1985), Lambert and Larcker (1987), Gaver and Gaver (1993), Sloan (1993), Holthausen et al. (1995), Ittner et al. (1997), Matsunaga and Park (2001), and Leone et al. (2006). More recent examples include Murphy and Jensen (2011), Jayaraman and Milbourn (2012), Banker et al. (2012), Indjejikian et al. (2014), Bennett et al. (2015), Gipper (2015), Mukhopadhyay and Shivakumar (2015), and Rhodes (2016). 3 For example, Hall and Liebman (1998) find that for a 10 percent increase in shareholder value, the typical CEO’s cash compensation increases 2.2 percent (about $23,000 in their sample), 53 times less than the corresponding equity portfolio effect (about $1.25 million). Similarly, Core et al. (2003) find that equity portfolio variability is more than 100 times greater than cash pay variability for a typical CEO.

- 2 -
incentives for many CEOs early in their tenures. Prior studies typically estimate bonus
performance sensitivities by regressing bonus payouts (or total cash pay, including salary) on an
assumed measure of firm performance (e.g., stock return or earnings) and using the estimated
coefficient as a measure of the sensitivity of cash pay to performance (e.g., Jensen and Murphy,
1990; Hall and Liebman, 1998). Such regression-based measures invariably contain error and
attenuate the magnitude of the estimated sensitivity of cash pay to performance. To alleviate this
issue, we instead compute bonus performance sensitivities using data on the actual payout
structures defined in executive bonus plans.
Although direct comparisons between the magnitudes of cash- and equity-based incentives
are difficult due to the different underlying performance measures (i.e., bonuses are largely based
on earnings rather than stock price), we compare the two incentive structures based on one of two
alternative assumptions: (i) each firm’s marginal and average P/E ratios are equal (i.e., a one
percent increase in earnings also increases stock price by one percent), or (ii) all firms are subject
to the same marginal P/E ratio (i.e., $1 of additional earnings increases equity value by an equal
amount for all firms). Under either assumption, we find that the typical CEO in our sample receives
an extra 25 to 35 percent in bonus (about $300,000 to $450,000) for a 10 percent increase in
shareholder value, which is about one-sixth to one-ninth of the corresponding equity portfolio
sensitivity (about $2.9 million). For CEOs early in their tenures, who tend to have smaller equity
portfolios (e.g., Core and Guay, 1999; Armstrong et al., 2016), the gap between cash- and equity-
based incentives is considerably narrower: annual cash-based incentives are about one-third to
one-quarter total equity portfolio incentives among these executives.4
4 It is possible that the gap between equity-based and cash-based incentives is even smaller than the estimates above on a risk-adjusted basis. Risk-averse executives are expected to discount the expected payoffs of risky incentive structures, and although bonuses are risky, the volatility of equity is typically greater than the volatility of bonuses.
- 3 -
In supplemental tests, we confirm our conjecture that regression-based estimates severely
understate CEO incentives from bonus plans. Regression-based estimates used in prior literature
attempt to infer pay-performance sensitivities from either cross-sectional or time-series variation
in bonus payouts, where the researcher makes assumptions about the performance measure and
functional form of the payoff structure without detailed knowledge of the characteristics of the
actual underlying bonus plan. We find that the typical regression-based estimates of bonus plan
incentives understate actual incentives by a factor of 10 to 15, with significant portions of this
measurement error stemming from both errors in assumed performance measures and errors in the
functional form of the payoffs.5
We also consider the possibility that our finding of larger bonus incentives than prior work
may reflect a structural shift over time in the design of bonus contracts. In recent years, boards
have faced growing shareholder and political pressure to more strongly link executive annual pay
with firm performance, potentially resulting in increasing performance sensitivity of bonus plans
over time.6 However, we find no evidence of an upward trend in bonus performance sensitivities
over the past twenty years, which suggests that changes over time in actual performance sensitivity
do not explain why our results differ from prior literature.
Our findings suggest that boards design incentive compensation contracts at the start of the
CEO’s tenure with a relatively balanced mix of cash- and equity-based incentives. Over time,
however, equity holdings tend to accumulate because CEOs’ annual equity grants typically exceed
their stock sales (e.g., Core and Guay, 2010; Armstrong et al., 2016). Thus, for longer-tenured
For example, Murphy (2012) assumes a 10 percent risk-adjustment discount on bonus plans compared to a 33 to 67 percent discount for stock options. 5 This conclusion is analogous to the finding in the earnings response coefficient (ERC) literature that the ERCs are “too small” (e.g., Kothari, 2001) and, more generally, consistent with the notion that regression estimates typically understate actual sensitivities (e.g., Hausman, 2001). 6 See, for example, “‘Pay for Performance’ No Longer a Punchline” by Scott Thurm, Wall Street Journal, March 21, 2013.
- 4 -
CEOs, equity portfolio incentives come to dominate overall incentives, consistent with conclusions
from prior literature.
If bonuses are designed to provide CEOs with meaningful financial incentives earlier in
their tenure, one might ask why boards allow CEOs’ equity portfolio incentives to dominate bonus
incentives later in their career. For example, boards could increase cash-based incentives over time
to match increases in equity portfolio incentives, or perhaps encourage CEOs to sell more of their
equity over time to achieve balance. Alternatively, boards might view the dominance of equity
portfolio incentives as being optimal, but perhaps recognize that it takes some time before CEOs
can build up their equity portfolios, and so provide cash-based incentives in the interim. In this
latter case, boards might phase out the payments from CEOs’ cash-based incentives once their
relative importance becomes minor. However, we find no evidence of either pattern in our data.
We conjecture several reasons why boards may continue to provide CEOs with cash-based
bonus plans even after their incentive effects become relatively minor. One possibility is that the
buildup of significant equity incentives can come at the cost of liquidity, and annual cash-based
payouts can provide executives with cash flow to fulfill their consumption demands. Although
annual salary can also provide liquidity, U.S. tax laws discourage non-performance-based cash
payments to executives in excess of $1 million. Thus, cash-based bonuses that are somewhat
weakly tied to performance may serve to fulfill CEOs’ liquidity demands while avoiding the firm-
level tax penalty that would be incurred for providing similar levels of non-performance-based
cash salary.
Boards likely also face pressure from various constituencies to conform compensation
plans to certain norms. For example, compensation consultants and proxy advisors such as ISS
and Glass Lewis tend to focus heavily on CEOs’ annual pay when evaluating the incentives
- 5 -
inherent in executive compensation plans, especially in relation to other CEOs in their peer group
(e.g., Glass Lewis, 2015; ISS, 2016). Surprisingly, and in sharp contrast to the economics literature
in finance and accounting, these advisors largely ignore equity holdings when assessing whether
a given CEO has strong pay-for-performance incentives. Empirical evidence also suggests that
boards appear to modify compensation plans to satisfy the preferences of proxy advisory firms
(Larcker et al., 2015), and therefore bonus plan design may reflect this focus on annual pay over
portfolio incentives.
Finally, because most executive compensation plans have a large number of executive
participants, boards may feel that it is important for synergistic purposes and executive morale to
hold the CEO accountable for the same bonus plan payouts that are borne by other senior
executives (e.g., Edmans et al., 2013; Bushman et al., 2016).7 Lower-level executives typically
receive a lower proportion of their annual pay in the form of equity and have smaller accumulated
equity portfolios, and bonuses are therefore likely to represent a more important component of
these executives’ incentives.
Although it is difficult to determine precisely why boards structure bonus plans, we provide
several analyses that shed light on the possible roles played by CEO bonuses. First, we document
that bonus plans do not appear to evolve over time to accommodate CEO-specific characteristics.
For example, we do not find evidence that boards explicitly adjust cash-based incentives in
response to temporal changes in CEOs’ constrained or unconstrained equity portfolios. In addition,
we find no evidence that CEO-specific liquidity preferences influence the design of bonus plans.
At the same time, consistent with Jayaraman and Milbourn’s (2012) finding that stock-based
7 Murphy (2001) finds that that the median executive bonus plan has 123 participants.

- 6 -
compensation imposes liquidity costs on executives, we find a significant positive relation between
cash-based incentives and firm-level stock illiquidity.
Second, consistent with some external influences on bonus plan design, we find that cash-
based incentives are significantly positively related to bonus incentives for peer firm CEOs.
However, we do not find evidence that boards directly adjust bonus plans in response to other
forms of external pressure, such as “say on pay” votes, proxy advisor voting recommendations, or
greater shareholder monitoring. Finally, as an indication that boards design bonus plans for the
firm’s top management team as a whole rather than contracting with each executive individually,
we find that the relative importance of cash-based incentives is substantially greater for other (non-
CEO) top executives at the firm (about twice as important as for the CEO), and that boards tend to
provide very similar bonus plans across all of the firm’s top executives. For example, the CEO and
the fifth-highest-paid executive share an identical set of performance targets at approximately 75
percent of firms in our sample. Together with our finding that CEO cash-based incentives do not
vary with CEO-specific liquidity measures (but do vary with firm-level measures), these results
suggest that bonus plans are designed to consider overall top management incentive and liquidity
concerns as opposed to CEO-specific needs.
Collectively, our results help reconcile the perceived importance and widespread use of
executive bonus plans with conclusions from prior literature that CEOs’ financial incentives arise
almost exclusively from their equity portfolios. We document that the performance sensitivity of
CEO cash compensation is much greater than estimates in prior studies, and that bonuses provide
a significant portion of many CEOs’ total financial incentives early in their tenure. Our results also
suggest that boards place little emphasis on CEO-specific characteristics, such as liquidity or the
growth of equity portfolio incentives, when designing cash bonus plans. We conclude that CEO
- 7 -
cash-based bonuses persist primarily due to bonus plans designed to provide the top management
team as a whole with liquidity and incentives, and may have relatively little to do with providing
incentives specifically to the CEO, at least after the first few years in office.
This paper proceeds as follows. Section 2 describes our data, variable measurement, and
the procedure we use to estimate pay-performance bonus sensitivities. Section 3 presents our
results and compares our findings to prior literature. Section 4 examines how boards determine
cash-based incentives and Section 5 concludes.
2. Data and Variable Measurement
We obtain data on executive bonus contracts for 8,888 firm-years between 2006 and 2014
from Incentive Lab. The SEC considerably expanded mandatory disclosures regarding the
structure of these bonus contracts (as well as other forms of incentive compensation) in 2006 and
thus details on bonus structures are sparse prior to that year.8 Bonus contracts are typically
characterized by three pairs of values: a minimum (“threshold”) payment for some minimal
acceptable level of performance, a target payment for an expected level of performance, and a
maximum payment for performance sufficiently above expectations (see, e.g., Murphy, 1999;
Murphy and Jensen, 2011). For example, a CEO may receive a bonus equal to 50 percent of salary
if earnings are $1 billion (the threshold), 100 percent of salary if earnings are $5 billion (the target),
and 200 percent of salary if earnings are $16 billion (the maximum). Payments generally increase
linearly between each of these breakpoints (e.g., if earnings in the preceding example are $3
billion, the CEO would receive a bonus of 75 percent of salary).
Bonus contracts often also incorporate several non-earnings-based performance measures,
including financial metrics such as sales and cash flow as well as non-financial metrics such as
8 See SEC Final Rule Release No. 33-8732A (August 29, 2006).

- 8 -
customer satisfaction. For example, 60 percent of a particular CEO’s bonus might be linked to
earnings, with 20 percent linked to sales and 20 percent to customer satisfaction. Table 1 Panel A
reports descriptive statistics for the different types of performance measures used in the bonus
contracts captured by Incentive Lab. The typical firm’s bonus plan includes 2.96 performance
measures. Earnings-based awards are the most common form of bonus plan: the typical bonus plan
includes more than one earnings-based metric, and 93 percent include at least one such metric.9
We focus only on earnings-based bonuses in our performance-sensitivity computations because
they are by far the most common and it is relatively straightforward to compare their incentives to
those from equity-based compensation. To the extent that the non-earnings-based components of
bonus plans also provide financial incentives, our earnings-based measures will understate the
overall performance sensitivity of the bonus contract (we attempt to quantify this potential
understatement in Section 3).
To calculate the performance sensitivity embedded in CEO bonus contracts, we collect
from Incentive Lab the minimum, target, and maximum performance goals disclosed by the board
and the bonus payouts that correspond to each of these objectives. Because firms are not required
to report the specific performance goals underlying their bonus plans, we are only able to obtain
these items for a subset of the full Incentive Lab sample. We gather financial data from Compustat,
stock return data from CRSP, institutional investor holdings from Thomson Reuters 13F filings,
and executive compensation from Execucomp. We also obtain shareholder voting data and
Institutional Shareholder Services (ISS) recommendations from ISS Voting Analytics. To reduce
the influence of extreme observations in the Incentive Lab data, we truncate our sample at the 5th
9 We use the term “earnings-based” to refer to metrics that are a function of the firm’s income. Examples include earnings per share, pretax income, and profit margin. Note that these earnings measures may include various non-GAAP adjustments, such as adding back restructuring charges or tax valuation allowances.

- 9 -
and 95th percentiles of the bonus performance sensitivity measures that we compute. All other
continuous variables are winsorized at the 1st and 99th percentiles. Our final sample (after
truncating) consists of 3,044 firm-years from 2006 to 2014 for which we have sufficient data to
perform the bonus performance sensitivity computations described below.
We define the CEO’s bonus performance sensitivity as the ratio of the payout and goal
ranges specified in the plan. Specifically, we compute the payout range as the maximum payout
offered under the plan, less the threshold amount, and the goal range as the performance goal
associated with the maximum payout, less the goal associated with the threshold payout.10 Our
performance sensitivity measure is the ratio of these two ranges, which represents a linear
approximation of the incremental bonus that the CEO receives for each unit of the underlying
performance metric when performance falls between the threshold and maximum performance
levels (thus, our measure does not capture the effects of any “jumps” in bonus payouts for reaching
threshold performance or “capping out” of payouts for exceeding maximum performance). To
illustrate, suppose the CEO in the example above has a salary of $1 million. The maximum payout
would therefore be $2 million (200 percent of salary) and the threshold payout would be $500,000
(50 percent of salary). We would estimate the performance sensitivity of the bonus contract as the
$1.5 million payout range ($2 million less $500,000) divided by $15 billion ($16 billion maximum
earnings goal less $1 billion threshold), or $100 per $1 million of earnings.
While earnings-based measures are the most common basis for CEO bonus plans, the
specific metric that a given board chooses to use varies somewhat between firms. For example,
one firm may base bonus payments on net income, while another may link bonus to EPS. To
10 Some firms report only two performance levels for their bonus contracts (e.g., only the target and maximum, or only the target and threshold). For such firms, we define the payout and goal ranges as the difference between the two levels that the firm specifies. Our findings are very similar if we instead omit such firms.
- 10 -
enhance comparability between firms, we convert all earnings-based sensitivities to net income
sensitivities – that is, the amount of bonus that the CEO receives for a dollar of net income, which
we refer to as unscaled bonus sensitivity. For example, if the bonus plan is based on EPS, we first
compute the CEO’s bonus sensitivity based on EPS (i.e., bonus per dollar of EPS), then convert
this sensitivity to bonus per dollar of net income by dividing by the number of shares outstanding.
Similarly, if the bonus is based on pretax income, we first compute the bonus sensitivity to pretax
income, then convert this pretax sensitivity to net income sensitivity by dividing by one minus the
firm’s effective tax rate. Appendix A provides the specific earnings-based measures we use and
describes this net income-conversion process in more detail.
Next, to facilitate comparisons with the dollars of pay for a one percent change in equity
value (i.e., portfolio delta) measures that are common in the equity incentive literature (e.g., Hall
and Liebman, 1998; Core and Guay, 1999), we convert these unscaled bonus-earnings sensitivities
(i.e., dollars of bonus per dollar of earnings) to bonus-stock price sensitivities (i.e., dollars of bonus
per one percent change in stock price), which we refer to as Bonus Delta. Specifically, we estimate
the change in earnings that would increase the firm’s market capitalization by one percent and
compute the corresponding effect on the CEO’s bonus payout. To do so, we convert a one percent
change in market capitalization into an earnings-equivalent amount under one of two alternative
assumptions: (i) each firm’s marginal and average price-to-earnings ratio are equal, and therefore
a one percent change in earnings corresponds to a one percent change in stock price;11 or (ii) all
firms are subject to the same marginal price-to-earnings ratio, and equate earnings and equity value
accordingly (i.e., $1 of earnings increases equity value by a fixed amount; for these computations,
11 For firms with negative earnings, we assume the firm’s marginal P/E ratio equals the industry-year median P/E. Our inferences are unchanged if we instead omit such firms.
- 11 -
we assume a marginal price-to-earnings ratio of 17, the median in our sample).12 We then compute
the amount of bonus the CEO would receive for this amount of earnings equivalent to a one percent
change in market capitalization.
To illustrate, suppose a firm has a market capitalization of $18 billion and earnings of $1
billion (i.e., the firm’s P/E ratio is 18). Under assumption (i), we would assume the firm’s marginal
P/E ratio is 18 and therefore a one percent change in earnings ($10 million) would increase equity
value by one percent ($180 million). Thus, we would multiply unscaled bonus-earnings sensitivity
by 10 million to estimate the bonus the CEO would receive for earnings equivalent to one percent
of equity value. Under assumption (ii), we would instead assume the firm’s marginal P/E ratio is
17 and therefore approximately $10.6 million of earnings would increase equity value by one
percent (again, $180 million). In this case, we would multiply unscaled bonus-earnings sensitivity
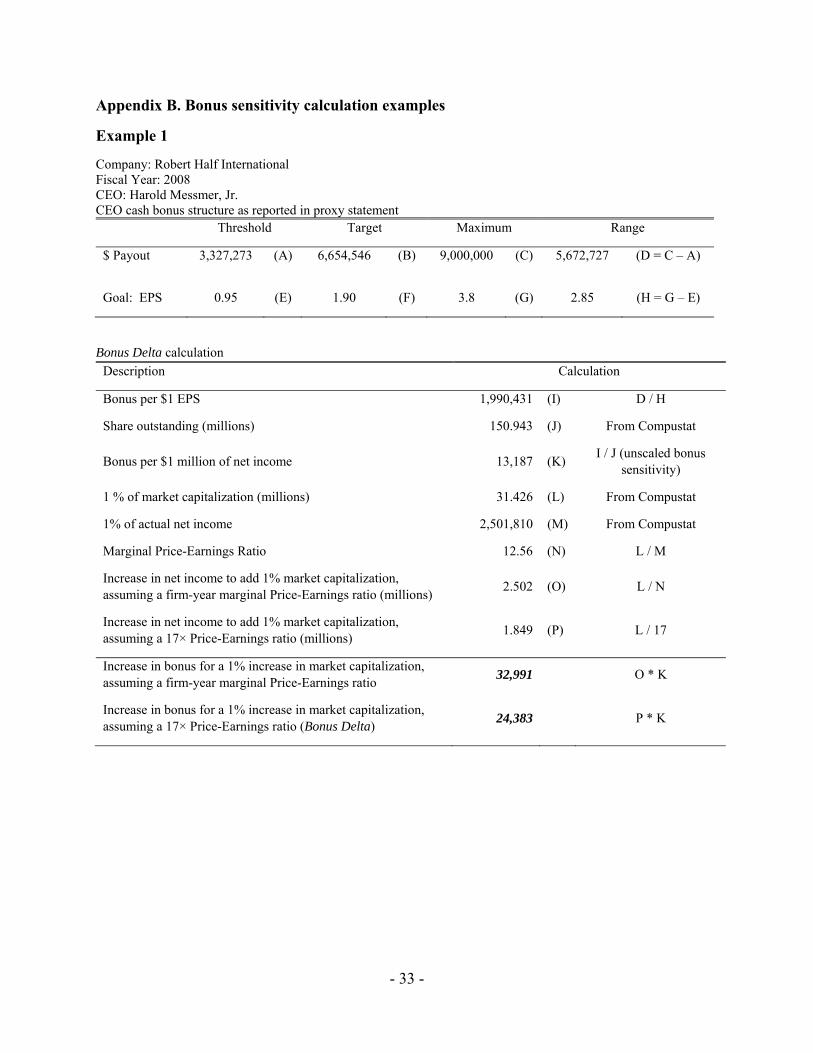
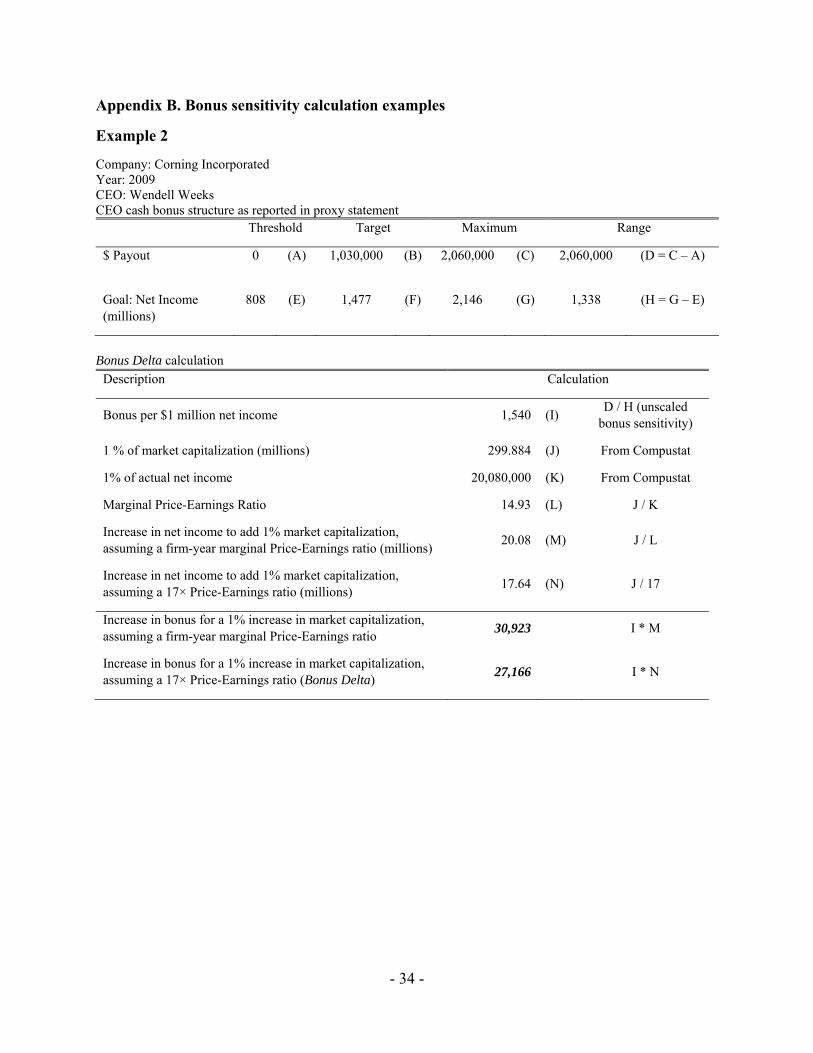
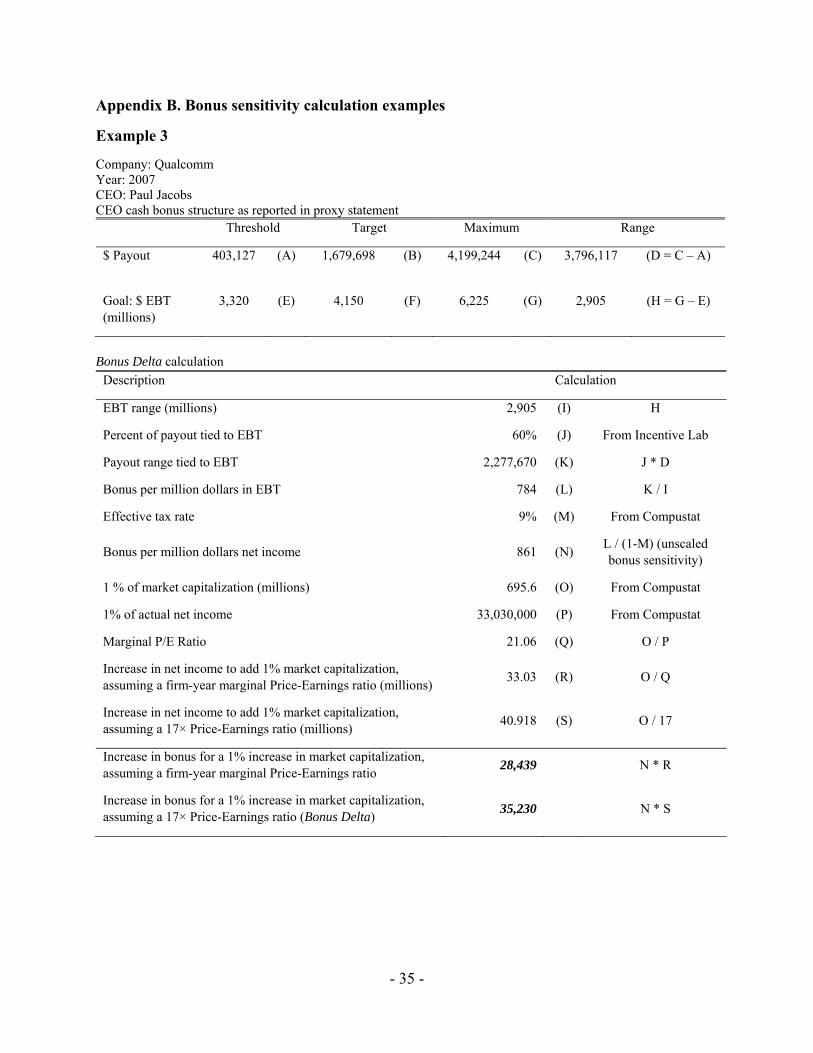
by 10.6 million to estimate the bonus the CEO would receive. Appendix B provides examples from
our sample of these bonus sensitivity computations.
Table 1 Panel B reports descriptive statistics for the performance measures used in the
bonus plans in our sample, which are very similar to the overall distribution reported in Table 1
Panel A. Table 2 Panels A and B report descriptive statistics for the full sample of firms covered
by Incentive Lab and the sample of firms for which we have sufficient data to compute Bonus
Delta, respectively, for our sample period of 2006 through 2014. The median firm for which we
can compute Bonus Delta is generally comparable to the median firm in the broader Incentive Lab
sample; the primary differences are that the median firm in our Bonus Delta sample has a larger
12 A third possible assumption would be to use estimated earnings response coefficients (ERCs; i.e., the coefficient from a regression of stock return on earnings) to proxy for a firm’s marginal P/E ratio. We do not use ERCs because an extensive literature documents that they are generally in the range of 1 to 3, which is too small to be economically reasonable (see, e.g., Kothari, 2001). Nevertheless, for a sense of how using this alternative assumption would affect our results, note that assumption (ii) implicitly assigns an ERC of 17 to all firms. Thus, our Bonus Delta estimates would be approximately 5 to 15 times larger using ERCs to convert equity values to earnings.
- 12 -
book-to-market ratio (0.88 versus 0.82 for the overall Incentive Lab sample) and smaller CEO
portfolio delta ($292,000 versus $345,000). We also report descriptive statistics for Execucomp
firms during the same time period in Table 2 Panel C. Compared to Execucomp firms, firms in
Incentive Lab are larger (median Market Capitalization of $4.3 billion for Incentive Lab versus
$1.7 billion for all Execucomp firms), consistent with Incentive Lab’s stricter sample selection
criteria (i.e., 750 largest US firms, versus the 1,500 largest for Execucomp).
3. Results
3.1. Bonus pay-performance sensitivities
Table 3 presents our estimated bonus performance sensitivities. As in Hall and Liebman
(1998), we focus on medians due to the highly skewed distribution of executive compensation. We
first consider unscaled bonus sensitivity (i.e., dollars of bonus per dollar of net income). The
median CEO receives about $12,000 per $1 million of net income, or slightly more than one cent
for each dollar of income. That is, the median CEO in our sample’s bonus reflects “fractional
ownership” of about one percent of earnings. At the median P/E ratio in our sample of 17 (i.e., $1
of income increases equity value by $17), this implies that the CEO receives approximately $0.60
in bonus for a $1,000 increase in firm value. For comparison, this is approximately 40 times greater
than the estimate from Jensen and Murphy (1990) that CEOs receive $0.0135 in salary and bonus
for a $1,000 increase in firm value and suggests that the performance sensitivity of bonuses is
much higher than previously estimated.
Next, we consider Bonus Delta (i.e., dollars of bonus for a one percent increase in equity
value). Table 3 indicates that, under either of the assumptions linking earnings and equity value
described in Section 2, the median CEO receives about $30,000 in bonus for a one percent increase
in equity value. Relative to the median CEO’s bonus of $1.3 million, this CEO receives an increase
- 13 -
in bonus of approximately 2.3 percent for earnings equivalent to a one percent increase in equity
value.13 In contrast, Hall and Liebman (1998) estimate that the median CEO’s cash pay increases
by about $2,300, or 0.2 percent, for a one percent increase in equity value. Again, these results
suggest that the true performance sensitivity of executive bonus contracts is at least an order of
magnitude larger than prior studies have estimated.
As we note in Section 2, our tests are conducted using bonus sensitivities from earnings-
based plans, and therefore exclude the performance sensitivity of non-earnings-based plans. To
examine the potential influence of this research design choice, we compute bonus sensitivities for
two relatively common non-earnings-based performance metrics (cash flow and sales) and present
the results in Table 4. We compute these sensitivities under the same method as the earnings
sensitivities we describe in Section 2 (i.e., ratio of payout range to goal range). We find that
although sales and cash flow sensitivities are smaller than for earnings, for many CEOs these
sensitivities are economically significant. In untabulated analysis, we estimate that for the typical
bonus contract, earnings-based payouts comprise approximately 67 percent of the total cash award.
Thus, this descriptive analysis suggests that overall cash-based bonus incentives are perhaps about
50 percent greater than those reported in Table 3 for the typical CEO (e.g., perhaps about $45,000
for a one percent change in market capitalization rather than the roughly $30,000 reported in Table
3 for the median CEO).
3.2. Bonus versus equity incentives
Having documented that the performance sensitivity of executive bonus contracts appears
to be much greater than prior literature estimates, we next examine how this result influences the
conclusion in prior literature that equity-based compensation accounts for the vast majority of total
13 Relative to total cash compensation (i.e., salary plus bonus), this is an increase of approximately 1.3 percent.
- 14 -
executive incentives.14 As discussed above, we estimate that the typical CEO receives
approximately $30,000 to $45,000 in bonus for a one percent increase in equity value. In
comparison, the same CEO would receive about $290,000 from increased equity portfolio value,
about six to nine times larger.15 Thus, while equity portfolios do provide the majority of a typical
CEO’s overall financial incentives, the relative incentive weights that we estimate for earnings and
equity are somewhat more balanced than estimates in prior studies. For example, Jensen and
Murphy (1990) find that equity portfolio incentives are about 100 times larger than cash pay
incentives, while Hall and Liebman (1998) conclude the ratio is approximately 50 times.
We also note that, on a risk-adjusted basis, the gap between equity-based and cash-based
incentives may be even smaller than the estimates discussed above. Risk-averse executives are
expected to discount the expected payoffs of risky incentive structures, and although both bonuses
and equity holdings are risky, the volatility of equity holdings is typically greater than the volatility
of bonuses. For example, Murphy (2012) assumes a 10 percent risk-adjustment discount on bonus
plans, compared to a 33 percent to 67 percent discount for stock options.
Figure 1 compares the relative balance between cash and equity portfolio incentives over
the course of a CEO’s tenure. Notably, when the CEO is first hired, equity portfolio incentives
(about $100,000 for a one percent change in equity value) are about three times cash incentives
($30,000 for a one percent change in equity value). However, this balance shifts over time and,
consistent with prior studies (e.g., Core and Guay, 1999; Armstrong et al., 2016), we find that
equity portfolio incentives increase substantially (and approximately linearly) with tenure. In
contrast, cash bonus incentives are largely unchanged over the course of a CEO’s tenure; there is
a modest increase over time, but the scale is dramatically smaller than the increase in equity
14 Jensen and Murphy (1990); Hall and Liebman (1998); Murphy (1999, 2012); Core and Guay (2010). 15 We compute this equity portfolio effect following Core and Guay (2002).
- 15 -
portfolio incentives. The net effect is that equity portfolio incentives become increasingly
dominant as tenure increases. For executives with median tenure (about five years), the balance
between cash and equity incentives is comparable to the ratio across our overall sample, and the
importance of equity incentives continues to grow as tenure extends beyond this point.
Taken as a whole, our results indicate that initial CEO compensation contracts contain a
balanced mix of short- and long-term – as well as cash- and non-cash – incentives, but this
compensation mix becomes increasingly skewed as the CEO’s tenure increases. However, we also
draw a distinction between “constrained” and “unconstrained” equity holdings, as defined by
Armstrong et al. (2016). Those authors document that the majority of CEOs’ equity portfolio
incentives are “unconstrained” in the sense that there are no explicit constraints on sales (e.g., stock
grants or in-the-money options with vesting provisions that have lapsed). In Figure 2, we show
that “constrained” equity, which the CEO cannot sell either because it is unvested or due to a
minimum equity ownership guideline, remains relatively constant over a CEO’s tenure and is
reasonably balanced with cash bonus incentives, while unconstrained equity incentives grow
rapidly and are principally responsible for the growing disparity between cash- and equity-based
incentives as CEO tenure increases.
3.3. Why do prior studies find weaker performance sensitivity?
Next, we evaluate potential reasons why our bonus performance sensitivity estimates differ
so significantly from prior literature. One possibility is that, in recent years, the actual performance
sensitivity embedded in bonus contracts is greater than in the samples considered in prior literature.
For example, the sample in Hall and Liebman (1998) spans from 1980 through 1994 and the
sample in Jensen and Murphy (1990) covers 1969 through 1983. In contrast, our bonus sensitivity
computations are based on data from 2006 through 2014. Boards have been under growing
- 16 -
pressure from shareholders and regulators to strengthen the link between pay and performance,
and our larger estimates may capture increased bonus performance sensitivity since the mid-1990s
in response to this pressure.
Another possibility is that the regression-based estimates in prior literature are unable to
reliably detect the underlying performance sensitivity reflected in executive bonus plans. These
estimates rely on linking cross-sectional or time-series variation in firm performance to variation
in bonus pay and may be quite noisy because of several potential sources of measurement error in
the performance measures underlying bonus contracts. For example, boards may modify
performance targets based on prior results (e.g., Leone and Rock, 2002) or exclude various
expenses when computing earnings (e.g., Bradshaw and Sloan, 2002), both of which could
attenuate the correlation between bonus pay and underlying firm performance and therefore
potentially cause regression-based sensitivities to underestimate the bonus plan’s actual
performance incentives. As we discuss in Section 2, bonus plans also tend to have non-linear
payout structures and zero performance sensitivity above or below certain thresholds (e.g.,
Murphy, 1999; Murphy and Jensen, 2011), which could further attenuate regression-based
estimates of performance sensitivities.
We conduct two series of tests to examine the validity of these two alternative explanations
for the gap between our bonus performance sensitivity estimates and those in prior literature. First,
to evaluate potential time trends in bonus performance sensitivity, we estimate annual bonus-
performance regressions based on the specifications used in prior literature and examine how the
estimated coefficients change over time. Specifically, for each year from 1994 to 2014, we estimate
models of the following form, as in Hall and Liebman (1998):
, (1)
- 17 -
where Compensation is salary plus bonus (i.e., total cash pay) and Performance is either the firm’s
stock return or earnings scaled by market value. We use stock return as a performance measure for
consistency with prior literature (e.g., Jensen and Murphy, 1990; Hall and Liebman, 1998) and
earnings because, as discussed in Section 2, earnings are the primary performance measure used
in bonus contracts. As in Hall and Liebman (1998), we use the current period performance
coefficient (i.e., ) to proxy for the performance sensitivity of the bonus plan. Figures 3a and 3b
plot our annual performance sensitivity estimates using stock return and earnings as the
performance measure, respectively. Our sensitivity estimates using stock return as the performance
measure are generally in the range of 0.2 to 0.4 (i.e., a 10 percent increase in stock price
corresponds to a 2 to 4 percent increase in cash pay), comparable to the estimates in Hall and
Liebman (1998). For both performance measures, there is no clear upward pattern: sensitivities in
more recent years are approximately the same as those in the mid-1990s, and casual inspection
suggests that much of the variation in these sensitivities may reflect economic cycles and overall
stock market performance rather than a persistent long-term trend.16
To further explore potential time trends in bonus sensitivities, we examine how the
sensitivities that we directly compute based on bonus plan data have changed over time. Due to
disclosure requirements, our time series for this analysis spans only from 2006 through 2014,
rather than starting from 1994 as in Figure 3. Figure 4 depicts how the median bonus sensitivity
we compute has evolved over this time period. Similar to the regression results, we find no clear
upward pattern, and again the primary source of variation in these sensitivities appears to be driven
by business cycles rather than a secular trend toward greater performance sensitivity. Together,
16 In untabulated analyses, we also examine the variability of cash-based pay relative to the variability of equity-based pay, as in Core et al. (2003), and find no evidence of an upward trend over time.
- 18 -
Figures 3 and 4 suggest that our larger bonus performance sensitivity estimates compared to prior
literature are not driven by differences between sample periods.
Next, we examine how accurately regression-based performance sensitivity estimates
capture the underlying bonus plan’s incentives. We do so by estimating the following variant of
Eq. (1) using only firms for which we can compute an actual bonus performance sensitivity, which
allows us to compare the estimated coefficient to the performance sensitivity that we directly
compute:
, (2)
where Compensation is bonus pay and Performance is earnings scaled by market value. Note that
the performance coefficient in this model is directly proportional to our scaled bonus sensitivity
measure (i.e., Bonus Delta, or how many dollars a CEO receives for earnings of one percent of
market value). Recall that in Table 3, we find mean Bonus Delta of approximately $60,000, which
corresponds to an estimated performance sensitivity coefficient (i.e., ) of about 100,000.17 That
is, if Eq. (2) accurately estimates the underlying performance sensitivity of the bonus contract, the
estimated coefficient should be in the range of 100,000.
Column 1 of Table 5 Panel A reports results from estimating Eq. (2). In contrast to the
“true” coefficient of 100,000, the estimated performance sensitivity coefficient is approximately
800. That is, our regression estimates indicate that for increasing earnings by one percent of market
value, the CEO receives about $8,000, approximately 100 times less than our measure would
indicate. This result suggests that regression-based performance sensitivity estimates may
17 At a 17× P/E ratio, our mean Bonus Delta of approximately $60,000 implies that the CEO receives $1,020,000 (60,000 x 17) for increasing earnings by one percent of market value. That is, increasing Performance (i.e., earnings scaled by market value) by 0.01 increases Compensation by $1,020,000. We measure Compensation in thousands, so this corresponds to a coefficient of 102,000 (1,020,000 / 1000 / 0.01).
- 19 -
significantly understate the actual incentives embedded in the bonus contract and provides one
plausible explanation for why our estimates vary so substantially from those in prior literature.
To explore why these regression coefficient estimates differ so much from the performance
sensitivities that we directly compute, we re-estimate Eq. (2) using two alternative specifications.
First, to examine the potential effect of non-linearities due to earnings falling outside of the
performance range defined by the bonus plan, we restrict the sample to firms where reported
earnings exceed the specified “threshold” earnings goal. That is, we estimate Eq. (2) using only
firms where reported earnings were sufficiently high for the CEO to receive at least some bonus
payout during the year. Column 2 of Table 5 Panel A reports the results. We find that the
coefficient on earnings under this specification is approximately 2,500, three times greater than in
column 1 and consistent with non-linearities in bonus contracts attenuating regression estimates of
bonus performance sensitivities. Second, to examine the effect of varying performance targets, we
redefine the performance measure as earnings in excess of the threshold goal, rather than raw
earnings (we continue to restrict the sample to this subset of firms with above-threshold earnings).
Column 3 of Table 5 Panel A reports the results. We find that the estimated performance
coefficient is approximately 5,500, twice as large as in column 2 and about six times larger than
in column 1. These results suggest that not accounting for differences in performance targets
between firms also contributes to attenuated performance sensitivity coefficient estimates.
Lastly, to further examine how measurement error may affect our regression-based
performance sensitivity estimates, we re-estimate the three specifications of Eq. (2) described
above as “reverse regressions” (i.e., earnings regressed on bonus). The inverse of the coefficient
from these regressions provides an upper bound estimate of bonus-earnings performance
sensitivity and should not be attenuated by measurement error in the performance measure (i.e,

- 20 -
earnings). Table 5 Panel B presents the results from these reverse regressions.18 In column 1, we
estimate a coefficient of approximately 21, which corresponds to a bonus-earnings coefficient of
approximately 50,000. This is comparable in order of magnitude to our “expected” coefficient of
around 90,000, though still somewhat smaller, consistent with measurement error accounting for
much, but not all, of the attenuated performance sensitivity estimates from Eq. (2). In columns 2
and 3, where we also attempt to control for non-linearity by restricting the sample to firms with
earnings in excess of the bonus payout threshold, we estimate reverse-regression coefficients of
1.9 and 1.8, respectively. These estimates correspond to bonus-earnings coefficients of
approximately 500,000, consistent with them serving as an upper bound on our “expected”
performance coefficients. Collectively, the results in Table 6 suggest that both measurement error
and non-linearity are important factors that attenuate regression estimates of bonus performance
sensitivity.
4. How do boards determine bonus structures?
The results in Section 3 suggest that boards do not substantially alter the magnitude of
bonus incentives over the course of a CEO’s tenure as equity portfolio incentives grow. These
findings raise the question of what factors boards do consider when designing bonus plans and
what the purpose is for such plans. For example, if boards aim to maintain a consistent balance
between cash- and equity-based incentives over a CEO’s tenure, we would expect bonus
sensitivities to increase with equity portfolio incentives. Alternatively, boards could also choose
to eliminate cash-based incentives once equity portfolio incentives become sufficiently large.
However, as we show in Figure 1, neither of these outcomes tends to occur – rather, bonus
18 For expositional purposes, we scale the coefficients by a factor of 1,000,000. This implies that a reverse regression coefficient of 20 would be equivalent to a coefficient of 50,000 in Eq. (2) (1,000,000 / 20).
- 21 -
sensitivities remain quite stable over a typical CEO’s tenure and do not appear to vary
meaningfully with changes in equity portfolio incentives. In this section, we examine several
potential factors that may influence how boards design CEOs’ cash-based incentives to provide
some insight into the intended purposes of these plans.
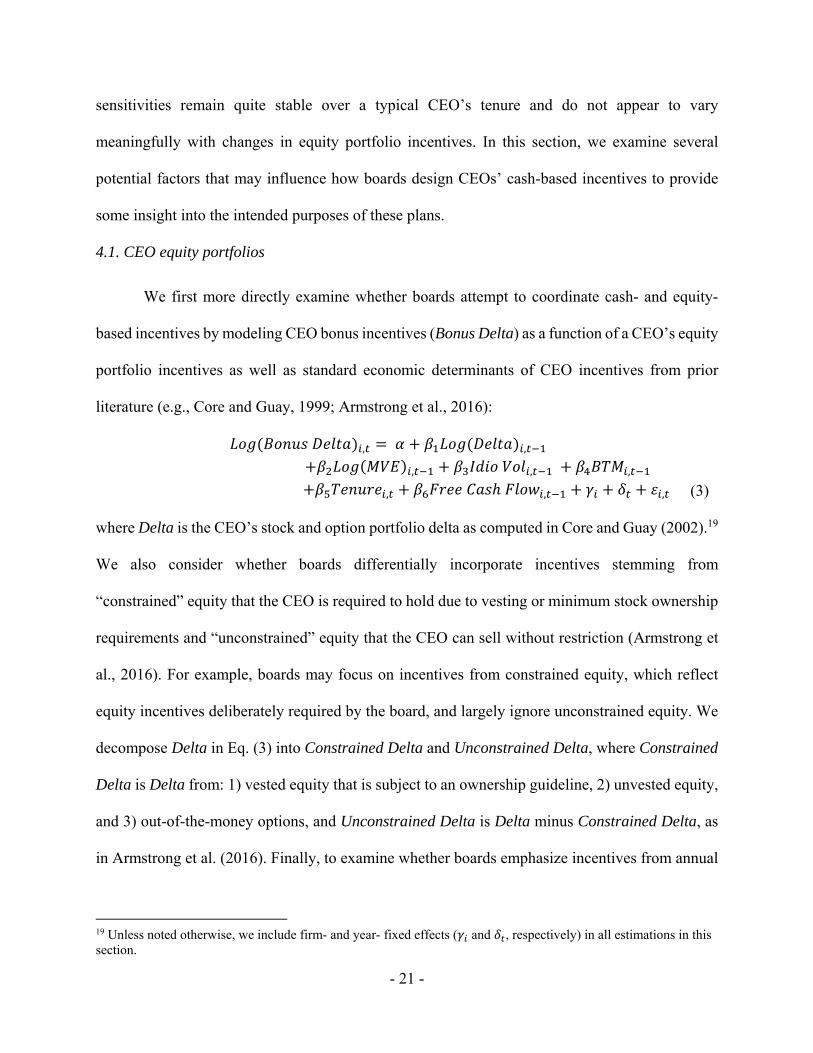
4.1. CEO equity portfolios
We first more directly examine whether boards attempt to coordinate cash- and equity-
based incentives by modeling CEO bonus incentives (Bonus Delta) as a function of a CEO’s equity
portfolio incentives as well as standard economic determinants of CEO incentives from prior
literature (e.g., Core and Guay, 1999; Armstrong et al., 2016):
, ,
, , ,
, , , (3)
where Delta is the CEO’s stock and option portfolio delta as computed in Core and Guay (2002).19
We also consider whether boards differentially incorporate incentives stemming from
“constrained” equity that the CEO is required to hold due to vesting or minimum stock ownership
requirements and “unconstrained” equity that the CEO can sell without restriction (Armstrong et
al., 2016). For example, boards may focus on incentives from constrained equity, which reflect
equity incentives deliberately required by the board, and largely ignore unconstrained equity. We
decompose Delta in Eq. (3) into Constrained Delta and Unconstrained Delta, where Constrained
Delta is Delta from: 1) vested equity that is subject to an ownership guideline, 2) unvested equity,
and 3) out-of-the-money options, and Unconstrained Delta is Delta minus Constrained Delta, as
in Armstrong et al. (2016). Finally, to examine whether boards emphasize incentives from annual
19 Unless noted otherwise, we include firm- and year- fixed effects ( and , respectively) in all estimations in this section.
- 22 -
pay over portfolio incentives, we also consider Annual Delta, the delta of the CEO’s stock and
option grants in the current year.
The results from estimating Eq. (3) are reported in Table 6. Consistent with the descriptive
results from Figure 1, there is no significant relation between Bonus Delta and Delta, suggesting
that boards do not appear to consider equity portfolio incentives when determining CEOs’ cash-
based incentives.20 We also find no significant relation between Bonus Delta and either
Constrained Delta or Unconstrained Delta. Collectively, these results are striking in that they
suggest that boards largely ignore CEOs’ equity portfolio incentives when designing cash-based
incentives. In contrast, we do find a significant positive relation between Bonus Delta and Annual
Delta, suggesting that boards may focus on balancing cash-based incentives with annual equity
grants rather than overall portfolio incentives.
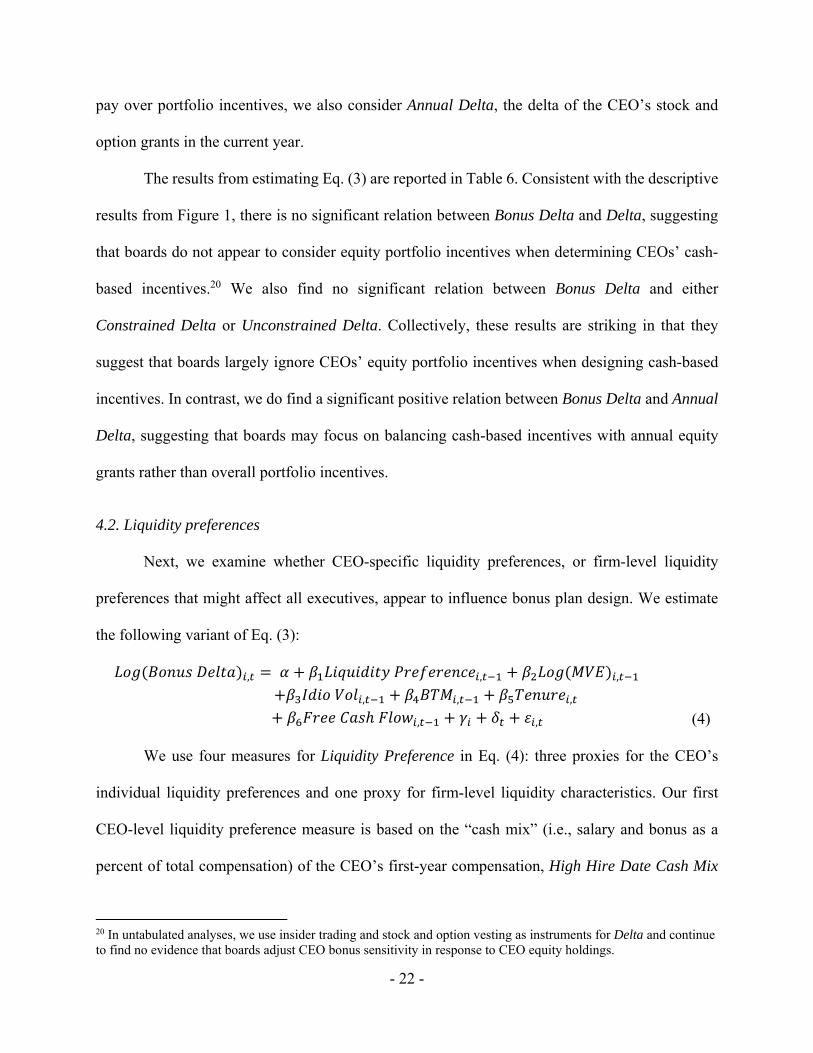
4.2. Liquidity preferences
Next, we examine whether CEO-specific liquidity preferences, or firm-level liquidity
preferences that might affect all executives, appear to influence bonus plan design. We estimate
the following variant of Eq. (3):
, , ,
, , ,
, , (4)
We use four measures for Liquidity Preference in Eq. (4): three proxies for the CEO’s
individual liquidity preferences and one proxy for firm-level liquidity characteristics. Our first
CEO-level liquidity preference measure is based on the “cash mix” (i.e., salary and bonus as a
percent of total compensation) of the CEO’s first-year compensation, High Hire Date Cash Mix
20 In untabulated analyses, we use insider trading and stock and option vesting as instruments for Delta and continue to find no evidence that boards adjust CEO bonus sensitivity in response to CEO equity holdings.
- 23 -
(Industry). Assuming CEOs have some degree of bargaining power in establishing the parameters
of their compensation when they are first hired, a CEO choosing to receive greater cash mix in his
first year may indicate a stronger preference for liquidity. Specifically, we compute cash mix in a
CEO’s first year and define that CEO’s liquidity preference as low (high) if this first-year mix is
below (above) the industry-year median cash mix (i.e., this measure is constant over time for the
same CEO). Second, we define No Deferred Compensation as low (high) for CEOs who
contributed (did not contribute) to a deferred compensation plan in a given year, as CEOs willing
to defer a portion of their current compensation presumably do not have pressing liquidity needs.
Third, we define measure liquidity preferences using the CEO’s age (Executive Age), as older
CEOs have stronger demands for liquidity (e.g., Lewellen et al., 1987). Finally, we measure firm-
level liquidity preferences following Jayaraman and Milbourn (2012), who find that boards put
greater emphasis on cash- (equity-) based incentives when their firm’s stock is less (more) liquid,
Specifically, consistent with Jayaraman and Milbourn (2012), we measure illiquidity (Stock
Illiquidity) as the negative log ratio of the firm’s annual trading volume to shares outstanding.
Table 7 presents results from estimating Eq. (4). We find no evidence that boards consider
CEO-specific liquidity preferences, as there is no significant relation between Bonus Delta and
Delta, High Hire Date Cash Mix (Industry), No Deferred Compensation, or Executive Age. We
do, however, find evidence that boards consider firm-level liquidity characteristics when designing
CEO bonus contracts. In particular, there is a significant positive relation between Bonus Delta
and Stock Illiquidity. Together with the results from Table 6, these findings suggest that boards
may implement bonus plans that consider liquidity preferences across all of the firms’ executives,
rather than tailoring these plans around executive-specific characteristics and preferences, a
possibility we examine further below.
- 24 -
4.3. External pressure and monitoring
We next consider the influence of pressure from external parties on the design of CEO
bonus plans. For example, boards frequently refer to peer-group comparisons when explaining and
justifying their compensation decisions, and Bizjak et al. (2008) and Faulkender and Yang (2010)
find evidence that boards adjust the level of their CEO’s compensation in response to variation in
compensation at peer firms. Furthermore, proxy advisors such as ISS and Glass Lewis also tend to
focus heavily on CEOs’ relative annual pay when evaluating the incentives inherent in executive
compensation plans (e.g., Glass Lewis, 2015; ISS, 2016). As a result, boards may attempt to
benchmark the incentives provided by their CEO’s annual compensation contract to peer group
firms. To examine this possibility, we modify Eq. (3) to include the log of the median Bonus Delta
of the firm’s peer group (Median Peer Bonus Delta):
, ,
, , ,
, , , (5)
To further evaluate the effect of external scrutiny from proxy advisors on the design of
CEOs’ bonus plans, we examine whether these plans respond to proxy advisor recommendations
on executive compensation votes (or, more generally, the existence of such a vote). Specifically,
we estimate the following model:
, , ,
, , ,
, , , (6)
where Compensation Vote indicates whether a shareholder vote on executive compensation
occurred at the annual meeting and ISS Rec indicates whether ISS recommended voting “against”
the compensation plan. We separately consider both the ISS recommendation in the current year
as well as cumulative number of “against” recommendations to account for the possibility that
- 25 -
negative recommendations have persistent effects, rather than only influencing compensation in
the subsequent year. We also consider whether other forms of external monitoring, such as the
presence of institutional investors or blockholders, may influence how boards design CEOs’ bonus
plans by estimating the following model:
, ,
, , ,
, , , (7)
We use three measures for Monitoring in Eq. (7): an indicator for whether the firm is included in
the S&P 500 index (S&P 500), the percentage of shares outstanding owned by institutional
investors (% Institutional Ownership), and the number of investors who own at least one percent
of shares outstanding (Number of Blockholders).
Table 8 displays results from estimating Eq. (5) and (6) and Table 9 displays results from
estimating Eq. (7). In Table 8, we find a significantly positive relation between the firm’s Bonus
Delta and Bonus Delta for peer firms’ CEOs, consistent with peer group effects influencing bonus
plan design. However, we find no evidence that boards respond to shareholder votes on executive
compensation or negative ISS recommendations regarding executive compensation plans.
Similarly, in Table 9, we find no evidence that boards alter bonus plans in response to changes in
the degree of external monitoring. Collectively, these results suggest that while proxy advisors and
institutional investors may have some influence on the factors that boards consider when designing
bonus plans (e.g., focusing on annual or relative pay rather than portfolio incentives), boards do
not appear to deliberately adjust the incentive levels in bonus plans in response to these monitors.
4.4. Top management team synergies
As noted above, boards may primarily intend for bonus plans to motivate the firm’s top
management team as a whole, rather than incentivizing each executive individually. For example,

- 26 -
Edmans et al. (2013) and Bushman et al. (2016) discuss how, due to cost of effort synergies,
managers sharing a common set of performance measures may be incentivized to exert greater
effort than if each manager were paid on a distinct measure. Thus, boards may continue to include
CEOs in bonus plans as part of collectively incentivizing the firm’s top executives, even if the
CEO’s direct financial incentives from these bonuses are relatively modest. To shed light on the
possibility that boards design “firm-wide” executive bonus plans with the intent of covering the
entire top management team and these bonuses are relatively more important for non-CEO
executives, we recompute Bonus Delta and Delta for the lowest-paid executive for which the firm
discloses compensation data (typically the fifth-highest-paid executive at the firm).21 Table 10
Panel A provides descriptive statistics for these results. Consistent with cash-based incentives
being relatively more important to these executives, we find that Bonus Delta for the median
“lowest-paid executive” is about one-fourth of equity Delta (as discussed in Section 3.3, the
median CEO’s Bonus Delta is about one-ninth of equity Delta). If boards design and implement
similar bonus contracts across the firm’s top management, choosing to provide these cash-based
incentives to the firm’s other executives could also result in CEOs receiving similar bonuses even
after their relative incentive effect diminishes.
To explore how closely compensation structure is tied across executives within a firm, we
examine the number of unique (and total) performance measures used in the CEO’s as well as the
lowest-paid executive’s bonus contracts. We define Measure Spread as the difference between the
number of total measures used in the CEO’s bonus contract and the number of total measures used
in the lowest-paid executive’s bonus contract. We also define Congruity as the proportion of
21 In certain cases, the CEO is the lowest-paid executive at the firm. We omit such observations from this analysis. These situations generally arise when the CEO is a founder of the company and holds a very large equity stake in the firm (e.g., Mark Zuckerberg has consistently been the lowest-paid top executive at Facebook).
- 27 -
measures in the lowest-paid executive’s bonus contract that are also included in the CEO’s bonus
contract and Perfect Congruity as an indicator that equals 1 if the CEO’s and lowest-paid
executive’s bonuses are based on exactly the same performance measures (i.e., Measure Spread
equals 0 and Congruity equals 1), and 0 otherwise. Table 10 Panel B provides descriptive statistics
for these results. Consistent with boards designing similar bonus contracts across the firm’s top
management, bonus payouts for both the CEO and the lowest-paid executive are based on exactly
the same measures at the vast majority of firms – Perfect Congruity is 1 at almost 75 percent of
firms and Congruity is 1 at 90 percent of firms.
Finally, to further explore the cash-based incentive structure homogeneity across the top
management team at the same firm, we estimate the following variant of Eq. (3):
,
, , ,
, , , (8)
where Lowest Paid Bonus Delta is the Bonus Delta for the lowest-paid executive for which the
firm provides data. Table 10 Panel C reports the results from estimating Eq. (8). Consistent with
top executives within a firm sharing similar incentive compensation structures, we find a strong
association between the bonus structure of the CEO and the lowest-paid executive at the firm.
Collectively, the results from Table 10 are consistent with firms designing “firm-wide” bonus
plans to cover the entire top management team.
5. Conclusion
We document that financial incentives provided by executive bonus contracts are
significantly greater than estimated in previous academic literature. We show executive bonus
contracts can provide meaningful incentives, particularly for CEOs early on in their tenure,
suggesting that boards design incentive compensation contracts at the start of the CEO’s tenure
- 28 -
with a relatively balanced mix of cash- and equity-based pay, but these bonus incentives are
eclipsed by accumulated equity incentives as the CEO’s tenure increases. These results raise the
question of why boards to not adjust executive bonus contracts as CEOs’ equity portfolios grow
over their tenure. We explore several possible explanations, including liquidity preferences,
pressure from shareholders and proxy advisors, and top management team synergies. We find
evidence consistent with some of these explanations, but find no evidence that boards consider
executive-level characteristics when designing cash-based incentive compensation. Collectively,
our results help reconcile the ubiquitous use of bonus plans in executive compensation contracts
with prior literature documenting that CEOs’ financial incentives arise almost exclusively from
their equity portfolios.
- 29 -
References
Armstrong, Chris, John E. Core, and Wayne R. Guay. "Why do CEOs hold equity?" Available at SSRN 2544792 (2016).
Banker, Rajiv D., Masako N. Darrough, Rong Huang, and Jose M. Plehn-Dujowich. "The relation between CEO compensation and past performance." The Accounting Review 88, no. 1 (2012): 1-30.
Bennett, Benjamin, Carr Bettis, Radhakrishnan Gopalan, and Todd Milbourn. "Costs of including accounting performance goals in executive compensation." Working Paper (2015).
Bizjak, John M., Michael L. Lemmon, and Lalitha Naveen. "Does the use of peer groups contribute to higher pay and less efficient compensation?" Journal of Financial Economics 90.2 (2008): 152-168.
Bradshaw, Mark T., and Richard G. Sloan. "GAAP versus the street: An empirical assessment of two alternative definitions of earnings." Journal of Accounting Research 40.1 (2002): 41-66.
Bushman, Robert M., Zhonglan Dai, and Weining Zhang. "Management Team Incentive: Dispersion and Firm Performance." The Accounting Review91.1 (2016): 21-45.
Core, John, and Wayne Guay. "The use of equity grants to manage optimal equity incentive levels." Journal of Accounting and Economics 28.2 (1999): 151-184.
Core, John, and Wayne Guay. "Estimating the value of employee stock option portfolios and their sensitivities to price and volatility." Journal of Accounting Research (2002): 613-630.
Core, John E., and Wayne R. Guay. "Is CEO pay too high and are incentives too low? A wealth-based contracting framework." The Academy of Management Perspectives 24.1 (2010): 5-19.
Core, John E., Wayne R. Guay, and Robert E. Verrecchia. "Price versus non-price performance measures in optimal CEO compensation contracts." The Accounting Review 78.4 (2003): 957-981.
Edmans, Alex and Goldstein, Itay and Zhu, John, Contracting with Synergies (2013). ECGI - Finance Working Paper No. 320/2011. Available at SSRN: http://dx.doi.org/10.2139/ssrn.1958708
Faulkender, Michael, and Jun Yang. "Inside the black box: The role and composition of compensation peer groups." Journal of Financial Economics 96.2 (2010): 257-270.
Gaver, Jennifer J., and Kenneth M. Gaver. "Additional evidence on the association between the investment opportunity set and corporate financing, dividend, and compensation policies." Journal of Accounting and Economics 16.1 (1993): 125-160.
Graham, John R., Si Li, and Jiaping Qiu. "Managerial attributes and executive compensation." Review of Financial Studies 25.1 (2012): 144-186.
- 30 -
Gipper, Brandon. "Assessing the Effects of Disclosing Management Compensation." Working Paper. Available at SSRN 2514578 (2015).
Hausman, Jerry. "Mismeasured variables in econometric analysis: problems from the right and problems from the left." The Journal of Economic Perspectives 15.4 (2001): 57-67.
Hall, Brian J., and Kevin J. Murphy. "Stock options for undiversified executives." Journal of Accounting and Economics 33.1 (2002): 3-42.
Hall, Brian J., and Jeffrey B. Liebman. Are CEOs really paid like bureaucrats? The Quarterly Journal of Economics Vol. CXIII.3 (1998): 653-691.
Healy, Paul M. "The effect of bonus schemes on accounting decisions." Journal of Accounting and Economics 7.1 (1985): 85-107.
Holthausen, Robert W., David F. Larcker, and Richard G. Sloan. "Annual bonus schemes and the manipulation of earnings." Journal of Accounting and Economics 19.1 (1995): 29-74.
Indjejikian, Raffi J., Michal Matejka, Kenneth A. Merchant, and Wim A. Van der Stede. "Earnings targets and annual bonus incentives." The Accounting Review 89.4 (2014): 1227-1258.
Ittner, Christopher D., David F. Larcker, and Madhav V. Rajan. "The choice of performance measures in annual bonus contracts." The Accounting Review (1997): 231-255.
Jayaraman, Sudarshan, and Todd T. Milbourn. "The role of stock liquidity in executive compensation." The Accounting Review 87.2 (2011): 537-563.
Jensen, Michael C., and Kevin J. Murphy. "Performance pay and top-management incentives." Journal of Political Economy (1990): 225-264.
Kaplan, David S., and Brooks Pierce. "Firmwide versus establishment-specific labor market practices." Review of Economics and Statistics 87.3 (2005): 569-578.
Kothari, S. P. "Capital markets research in accounting." Journal of Accounting and Economics 31.1 (2001): 105-231.
Lambert, Richard A., and David F. Larcker. "An analysis of the use of accounting and market measures of performance in executive compensation contracts." Journal of Accounting Research (1987): 85-125.
Lambert, Richard A., David F. Larcker, and Robert E. Verrecchia. "Portfolio considerations in valuing executive compensation." Journal of Accounting Research (1991): 129-149.
Larcker, David F., Allan L. McCall, and Gaizka Ormazabal. "Outsourcing shareholder voting to proxy advisory firms." Journal of Law and Economics 58.1 (2015): 173-204.
Leone, Andrew J., and Steve Rock. "Empirical tests of budget ratcheting and its effect on managers’ discretionary accrual choices." Journal of Accounting and Economics 33.1 (2002): 43-67.
Leone, Andrew J., Joanna Shuang Wu, and Jerold L. Zimmerman. "Asymmetric sensitivity of CEO cash compensation to stock returns."Journal of Accounting and Economics 42.1 (2006): 167-192.
- 31 -
Lewellen, Wilbur, Claudio Loderer, and Kenneth Martin. "Executive compensation and executive incentive problems: An empirical analysis." Journal of Accounting and Economics 9.3 (1987): 287-310.
Matsunaga, Steven R., and Chul W. Park. "The effect of missing a quarterly earnings benchmark on the CEO's annual bonus." The Accounting Review76.3 (2001): 313-332.
Mukhopadhyay, Tathagat, and Lakshmanan Shivakumar. "Do Compensation Disclosures Matter for SoP Voting?." Working Paper. Available at SSRN 2718438 (2015).
Murphy, Kevin J. "Executive compensation." Handbook of Labor Economics 3 (1999): 2485-2563.
Murphy, Kevin J., and Michael C. Jensen. "CEO bonus plans: And how to fix them." Harvard Business School NOM Unit Working Paper (2011): 12-022.
Murphy, Kevin J. "Executive compensation: Where we are, and how we got there." Handbook of the Economics of Finance. Elsevier Science North Holland (Forthcoming) (2012).
Rhodes, Adrienne. "The relation between earnings-based measures in firm debt contracts and CEO pay sensitivity to earnings." Journal of Accounting and Economics 61.1 (2016): 1-22.
Sloan, Richard G. "Accounting earnings and top executive compensation. "Journal of Accounting and Economics 16.1 (1993): 55-100.
- 32 -
Appendix A. Earnings-based measures
The specific earnings-based measures we use to compute our bonus sensitivities are (as coded by Incentive Lab): EBIT, EBITDA, EBT, Operating Income, Earnings, EVA, EPS, Profit Margin, ROA, ROE, ROI, and ROIC. We consider the first four measures (EBIT, EBITDA, EBT, and Operating Income) pretax income. We convert pretax bonus sensitivities to after-tax sensitivities by dividing by one minus the firm’s effective tax rate. We define the effective tax rate as income tax expense divided by the sum of pretax income and special items, bounded by 0% at the low end and 35% at the high end. If we cannot compute a tax rate, we assume 35%. For example, if we compute a pretax bonus sensitivity of $10 per $1,000 of pretax income and the firm’s tax rate is 20%, our estimated after-tax sensitivity would be $10 / (1 - 20%) = $12.50 per $1,000 of after-tax income. We consider the next two measures (Earnings and EVA) after-tax income and make no adjustments. We consider the last six measures (EPS, Profit Margin, ROA, ROE, ROI, and ROIC) scaled versions of after-tax income. We convert their sensitivities to after-tax income sensitivities by dividing by shares outstanding, revenue, total assets, shareholders’ equity, and invested capital, respectively, where we define invested capital as the sum of short- and long-term debt, shareholders’ equity, and non-cash current assets, less current liabilities. For example, if we compute an EPS bonus sensitivity of $10,000 per $1 of EPS and the firm has 1 million shares outstanding, our estimated after-tax sensitivity would be $10,000 / 1 million = $10 per $1,000 of after-tax income. In some cases, firms report their goals either as margins or per share (e.g., the measure may be EBIT per share). We convert sensitivities based on such goals into dollar sensitivities by dividing by sales and shares outstanding, respectively, in addition to the conversions described above. In other cases, firms report their goals as growth (e.g., EPS growth). We do not compute sensitivities for these firms because the baseline value from which growth is computed is typically unclear (e.g., the prior year’s EPS value for compensation purposes may exclude various items, which makes it impossible to convert a growth rate into dollars).
- 33 -
Appendix B. Bonus sensitivity calculation examples
Example 1
Company: Robert Half International Fiscal Year: 2008 CEO: Harold Messmer, Jr. CEO cash bonus structure as reported in proxy statement
Threshold Target Maximum Range
$ Payout 3,327,273 (A) 6,654,546 (B) 9,000,000 (C) 5,672,727 (D = C – A)
Goal: EPS 0.95 (E) 1.90 (F) 3.8 (G) 2.85 (H = G – E)
Bonus Delta calculation
Description Calculation
Bonus per $1 EPS 1,990,431 (I) D / H
Share outstanding (millions) 150.943 (J) From Compustat
Bonus per $1 million of net income 13,187 (K) I / J (unscaled bonus
sensitivity)
1 % of market capitalization (millions) 31.426 (L) From Compustat
1% of actual net income 2,501,810 (M) From Compustat
Marginal Price-Earnings Ratio 12.56 (N) L / M
Increase in net income to add 1% market capitalization, assuming a firm-year marginal Price-Earnings ratio (millions)
2.502 (O) L / N
Increase in net income to add 1% market capitalization, assuming a 17× Price-Earnings ratio (millions)
1.849 (P) L / 17
Increase in bonus for a 1% increase in market capitalization, assuming a firm-year marginal Price-Earnings ratio
32,991 O * K
Increase in bonus for a 1% increase in market capitalization, assuming a 17× Price-Earnings ratio (Bonus Delta)
24,383 P * K
- 34 -
Appendix B. Bonus sensitivity calculation examples
Example 2
Company: Corning Incorporated Year: 2009 CEO: Wendell Weeks CEO cash bonus structure as reported in proxy statement
Threshold Target Maximum Range
$ Payout 0 (A) 1,030,000 (B) 2,060,000 (C) 2,060,000 (D = C – A)
Goal: Net Income (millions)
808 (E) 1,477 (F) 2,146 (G) 1,338 (H = G – E)
Bonus Delta calculation
Description Calculation
Bonus per $1 million net income 1,540 (I) D / H (unscaled
bonus sensitivity)
1 % of market capitalization (millions) 299.884 (J) From Compustat
1% of actual net income 20,080,000 (K) From Compustat
Marginal Price-Earnings Ratio 14.93 (L) J / K
Increase in net income to add 1% market capitalization, assuming a firm-year marginal Price-Earnings ratio (millions)
20.08 (M) J / L
Increase in net income to add 1% market capitalization, assuming a 17× Price-Earnings ratio (millions)
17.64 (N) J / 17
Increase in bonus for a 1% increase in market capitalization, assuming a firm-year marginal Price-Earnings ratio
30,923 I * M
Increase in bonus for a 1% increase in market capitalization, assuming a 17× Price-Earnings ratio (Bonus Delta)
27,166 I * N
- 35 -
Appendix B. Bonus sensitivity calculation examples
Example 3
Company: Qualcomm Year: 2007 CEO: Paul Jacobs CEO cash bonus structure as reported in proxy statement
Threshold Target Maximum Range
$ Payout 403,127 (A) 1,679,698 (B) 4,199,244 (C) 3,796,117 (D = C – A)
Goal: $ EBT (millions)
3,320 (E) 4,150 (F) 6,225 (G) 2,905 (H = G – E)
Bonus Delta calculation
Description Calculation
EBT range (millions) 2,905 (I) H
Percent of payout tied to EBT 60% (J) From Incentive Lab
Payout range tied to EBT 2,277,670 (K) J * D
Bonus per million dollars in EBT 784 (L) K / I
Effective tax rate 9% (M) From Compustat
Bonus per million dollars net income 861 (N) L / (1-M) (unscaled bonus sensitivity)
1 % of market capitalization (millions) 695.6 (O) From Compustat
1% of actual net income 33,030,000 (P) From Compustat
Marginal P/E Ratio 21.06 (Q) O / P
Increase in net income to add 1% market capitalization, assuming a firm-year marginal Price-Earnings ratio (millions)
33.03 (R) O / Q
Increase in net income to add 1% market capitalization, assuming a 17× Price-Earnings ratio (millions)
40.918 (S) O / 17
Increase in bonus for a 1% increase in market capitalization, assuming a firm-year marginal Price-Earnings ratio
28,439 N * R
Increase in bonus for a 1% increase in market capitalization, assuming a 17× Price-Earnings ratio (Bonus Delta)
35,230 N * S
- 36 -
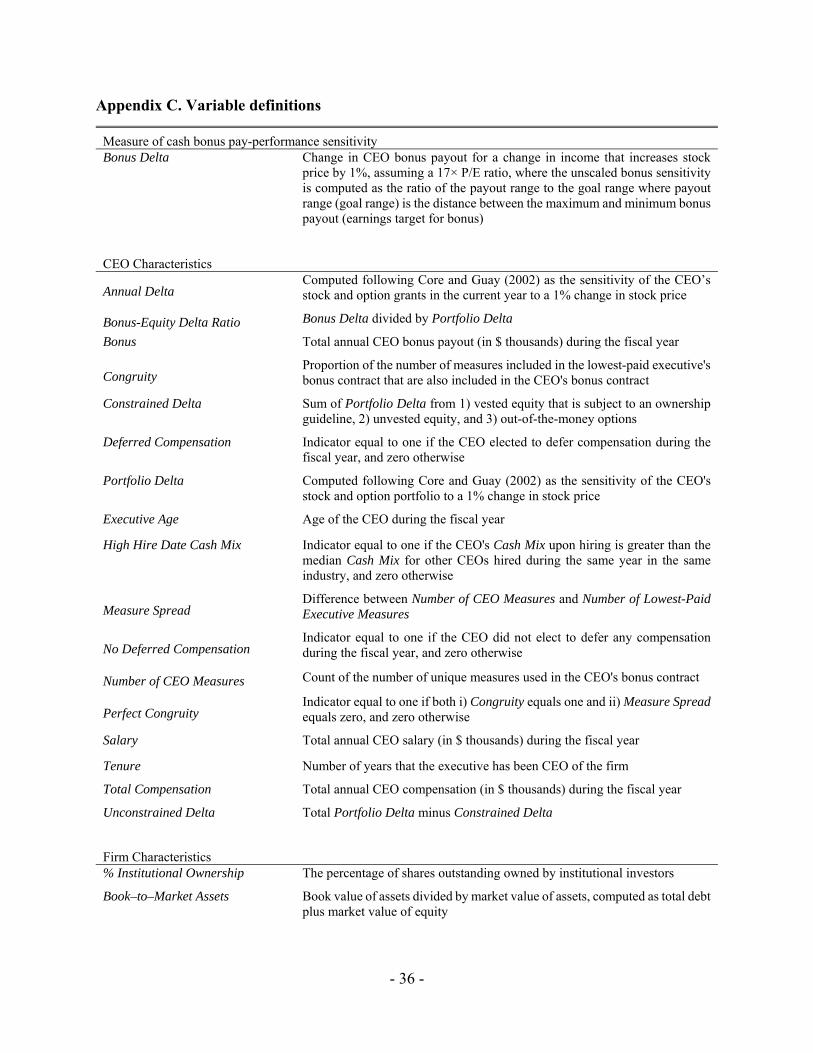
Appendix C. Variable definitions
Measure of cash bonus pay-performance sensitivity Bonus Delta Change in CEO bonus payout for a change in income that increases stock
price by 1%, assuming a 17× P/E ratio, where the unscaled bonus sensitivity is computed as the ratio of the payout range to the goal range where payout range (goal range) is the distance between the maximum and minimum bonus payout (earnings target for bonus)
CEO Characteristics
Annual Delta Computed following Core and Guay (2002) as the sensitivity of the CEO’s stock and option grants in the current year to a 1% change in stock price
Bonus-Equity Delta Ratio Bonus Delta divided by Portfolio Delta
Bonus Total annual CEO bonus payout (in $ thousands) during the fiscal year
Congruity Proportion of the number of measures included in the lowest-paid executive's bonus contract that are also included in the CEO's bonus contract
Constrained Delta Sum of Portfolio Delta from 1) vested equity that is subject to an ownership guideline, 2) unvested equity, and 3) out-of-the-money options
Deferred Compensation Indicator equal to one if the CEO elected to defer compensation during the fiscal year, and zero otherwise
Portfolio Delta Computed following Core and Guay (2002) as the sensitivity of the CEO's stock and option portfolio to a 1% change in stock price
Executive Age Age of the CEO during the fiscal year
High Hire Date Cash Mix Indicator equal to one if the CEO's Cash Mix upon hiring is greater than the median Cash Mix for other CEOs hired during the same year in the same industry, and zero otherwise
Measure Spread Difference between Number of CEO Measures and Number of Lowest-Paid Executive Measures
No Deferred Compensation Indicator equal to one if the CEO did not elect to defer any compensation during the fiscal year, and zero otherwise
Number of CEO Measures Count of the number of unique measures used in the CEO's bonus contract
Perfect Congruity Indicator equal to one if both i) Congruity equals one and ii) Measure Spread equals zero, and zero otherwise
Salary Total annual CEO salary (in $ thousands) during the fiscal year
Tenure Number of years that the executive has been CEO of the firm
Total Compensation Total annual CEO compensation (in $ thousands) during the fiscal year
Unconstrained Delta Total Portfolio Delta minus Constrained Delta
Firm Characteristics
% Institutional Ownership The percentage of shares outstanding owned by institutional investors
Book–to–Market Assets Book value of assets divided by market value of assets, computed as total debt plus market value of equity

- 37 -
Compensation Vote Indicator equal to one if a shareholder vote on executive compensation occurred at the annual meeting during the fiscal year, and zero otherwise
Cumulative ISS Recommendation Count of the total number of times ISS recommended that shareholders vote against the executive compensation plan at the annual meeting since 2003
Current ISS Recommendation Indicator equal to one if ISS recommended if ISS recommends that shareholders vote against the executive compensation plan at the annual meeting during the fiscal year, and zero otherwise
Earnings Income before extraordinary items scaled by market value of equity
Earnings – Goal Threshold Income before extraordinary items minus income goal threshold as identified in the firm’s proxy statement, scaled by market value of equity
Free Cash Flow Operating cash flow minus common and preferred dividends divided by average total assets
Idiosyncratic Volatility Standard deviation of the residual return from a market model regression using daily stock returns during the 12 months prior to the fiscal year end
Median Peer Group Bonus Delta Median Bonus Delta for the firm’s peer group in a given year as identified in its proxy statement
MVE Market capitalization of the firm at the end of the fiscal year
Number of Blockholders The count of the number of investors who own at least one percent of shares outstanding
S&P 500 Indicator equal to one if the firm is included in the S&P 500 index (as identified in the Compustat Index Constituents database) in a given year, and zero otherwise
Stock Illiquidity The natural logarithm of the ratio of total shares traded annually divided by shares outstanding, multiplied by minus one
Stock Returns Buy and hold returns during the 12 months prior to fiscal year-end
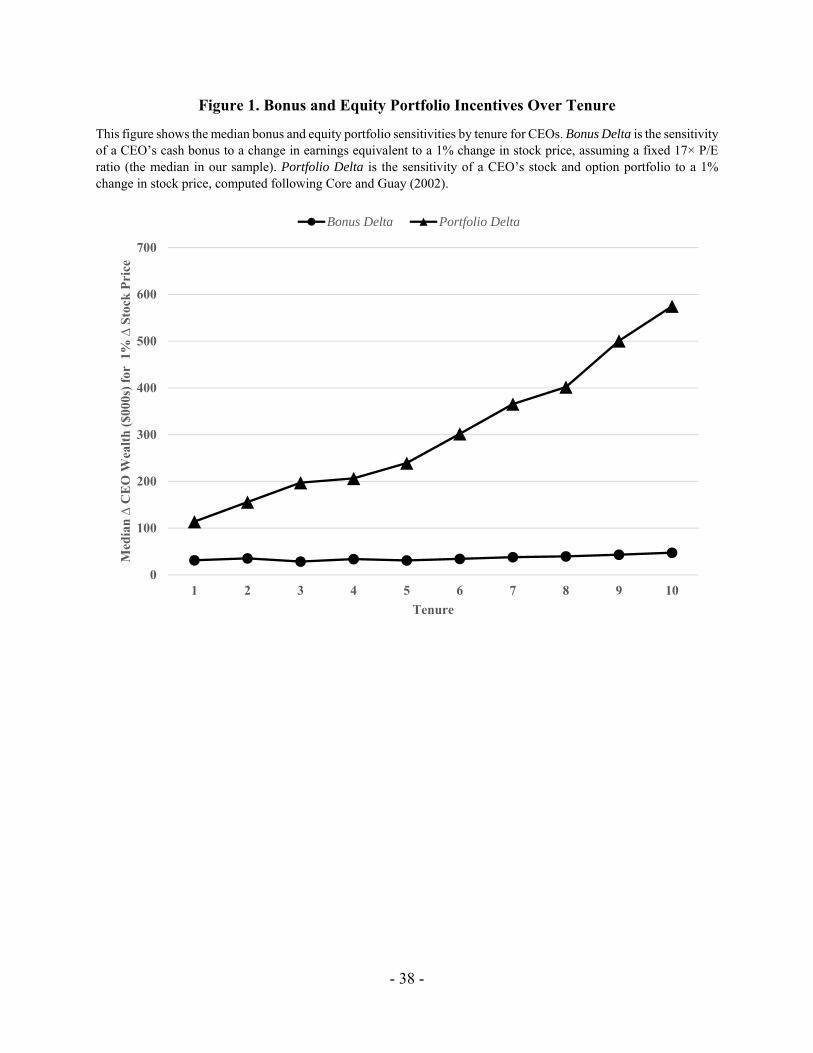
- 38 -
Figure 1. Bonus and Equity Portfolio Incentives Over Tenure
This figure shows the median bonus and equity portfolio sensitivities by tenure for CEOs. Bonus Delta is the sensitivity of a CEO’s cash bonus to a change in earnings equivalent to a 1% change in stock price, assuming a fixed 17× P/E ratio (the median in our sample). Portfolio Delta is the sensitivity of a CEO’s stock and option portfolio to a 1% change in stock price, computed following Core and Guay (2002).
0
100
200
300
400
500
600
700
1 2 3 4 5 6 7 8 9 10
Med
ian
∆ C
EO
Wea
lth
($0
00s)
for
1%
∆ S
tock
Pri
ce
Tenure
Bonus Delta Portfolio Delta
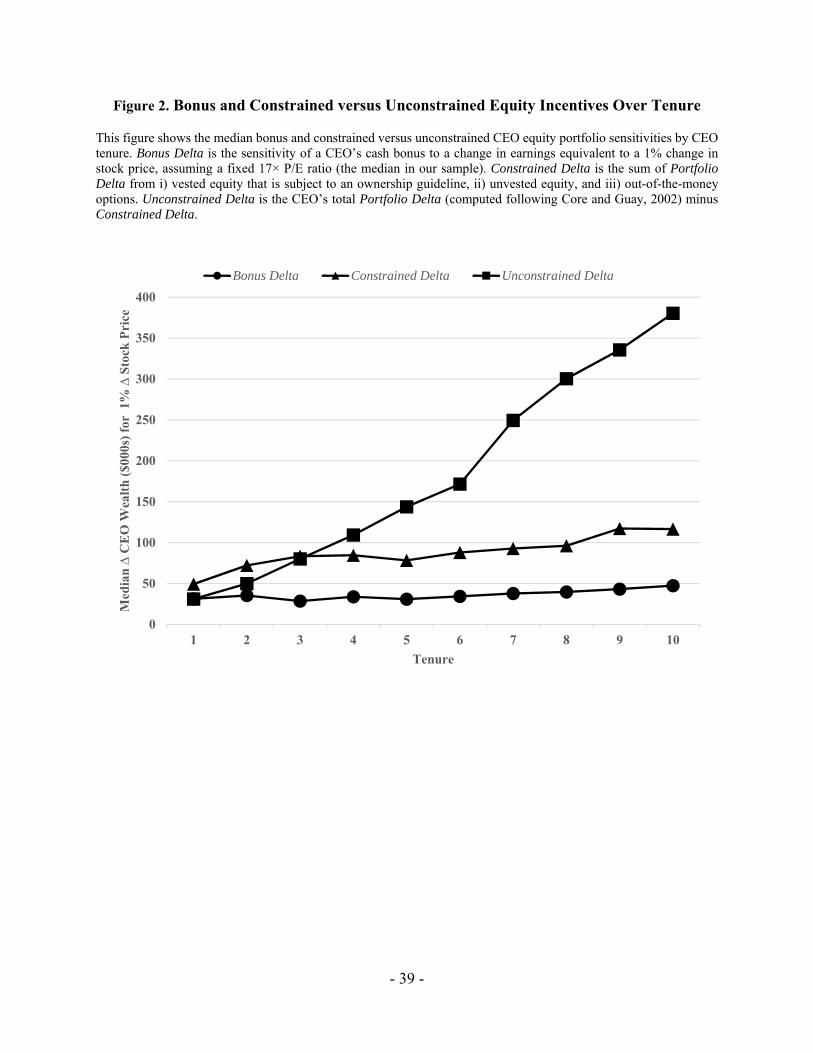
- 39 -
Figure 2. Bonus and Constrained versus Unconstrained Equity Incentives Over Tenure
This figure shows the median bonus and constrained versus unconstrained CEO equity portfolio sensitivities by CEO tenure. Bonus Delta is the sensitivity of a CEO’s cash bonus to a change in earnings equivalent to a 1% change in stock price, assuming a fixed 17× P/E ratio (the median in our sample). Constrained Delta is the sum of Portfolio Delta from i) vested equity that is subject to an ownership guideline, ii) unvested equity, and iii) out-of-the-money options. Unconstrained Delta is the CEO’s total Portfolio Delta (computed following Core and Guay, 2002) minus Constrained Delta.
0
50
100
150
200
250
300
350
400
1 2 3 4 5 6 7 8 9 10
Med
ian
∆ C
EO
Wea
lth
($0
00s)
for
1%
∆ S
tock
Pri
ce
Tenure
Bonus Delta Constrained Delta Unconstrained Delta
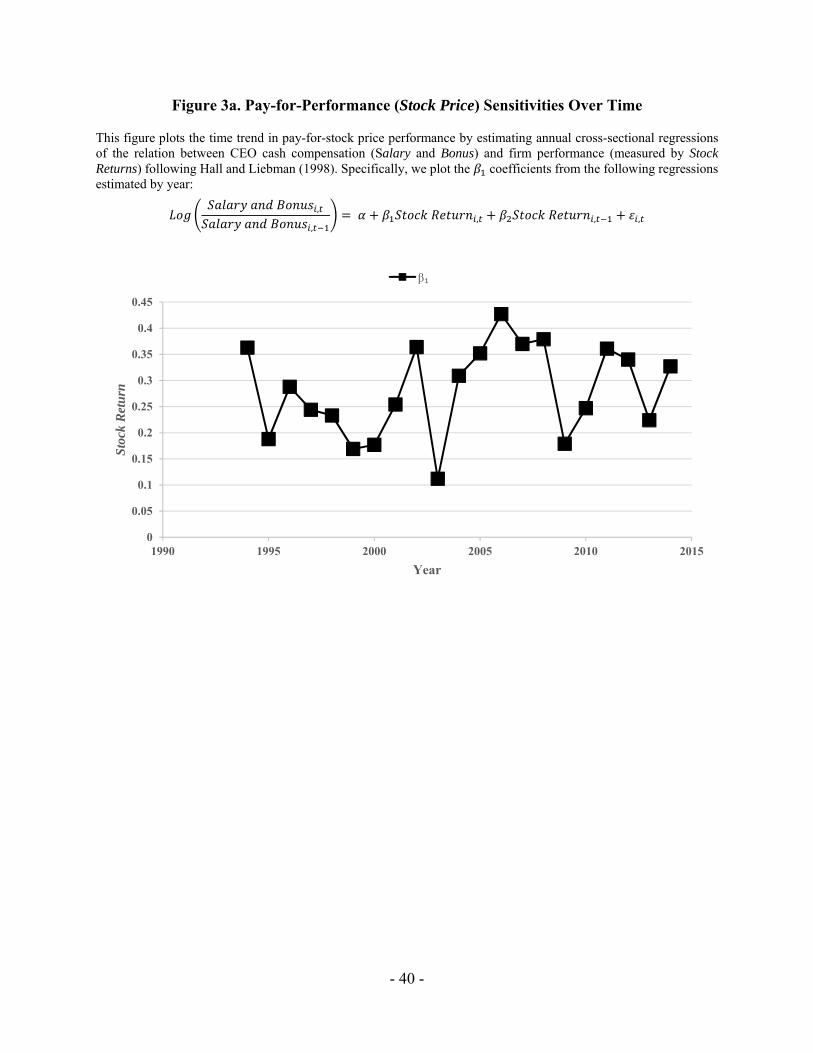
- 40 -
Figure 3a. Pay-for-Performance (Stock Price) Sensitivities Over Time
This figure plots the time trend in pay-for-stock price performance by estimating annual cross-sectional regressions of the relation between CEO cash compensation (Salary and Bonus) and firm performance (measured by Stock Returns) following Hall and Liebman (1998). Specifically, we plot the coefficients from the following regressions estimated by year:
,
, , , ,
0
0.05
0.1
0.15
0.2
0.25
0.3
0.35
0.4
0.45
1990 1995 2000 2005 2010 2015
Sto
ck R
etu
rn
Year
β₁
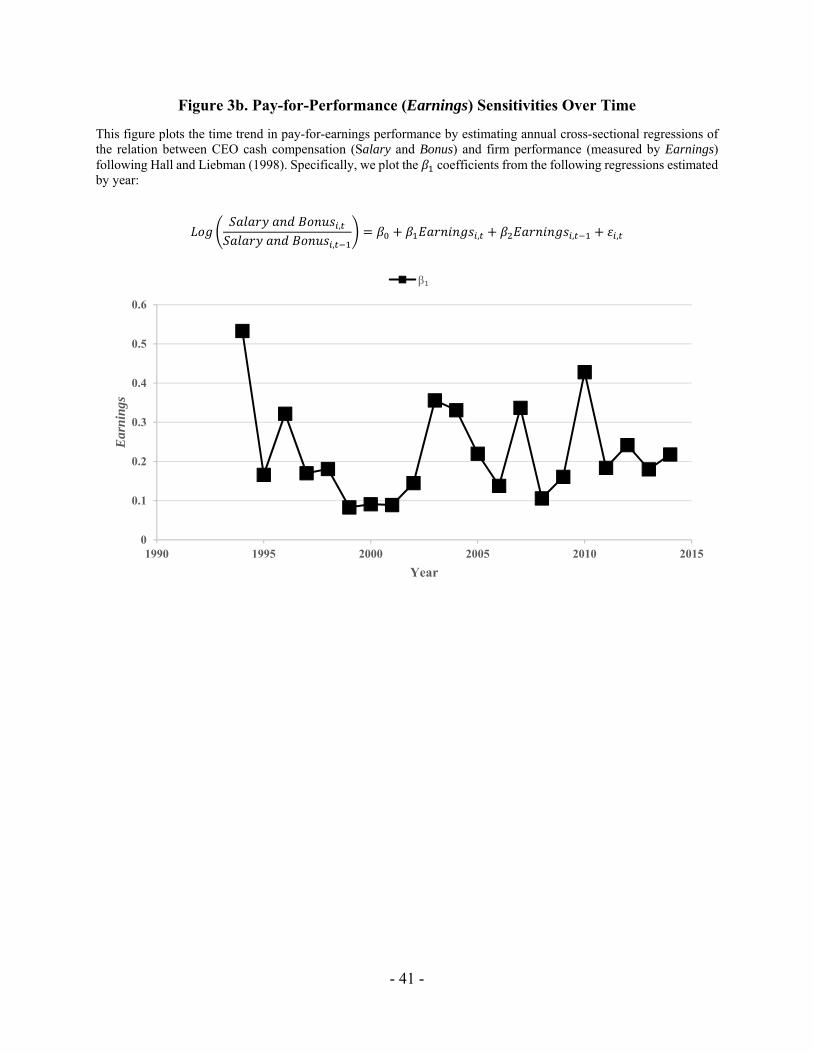
- 41 -
Figure 3b. Pay-for-Performance (Earnings) Sensitivities Over Time
This figure plots the time trend in pay-for-earnings performance by estimating annual cross-sectional regressions of the relation between CEO cash compensation (Salary and Bonus) and firm performance (measured by Earnings) following Hall and Liebman (1998). Specifically, we plot the coefficients from the following regressions estimated by year:
,
,, , ,
0
0.1
0.2
0.3
0.4
0.5
0.6
1990 1995 2000 2005 2010 2015
Ear
nin
gs
Year
β₁
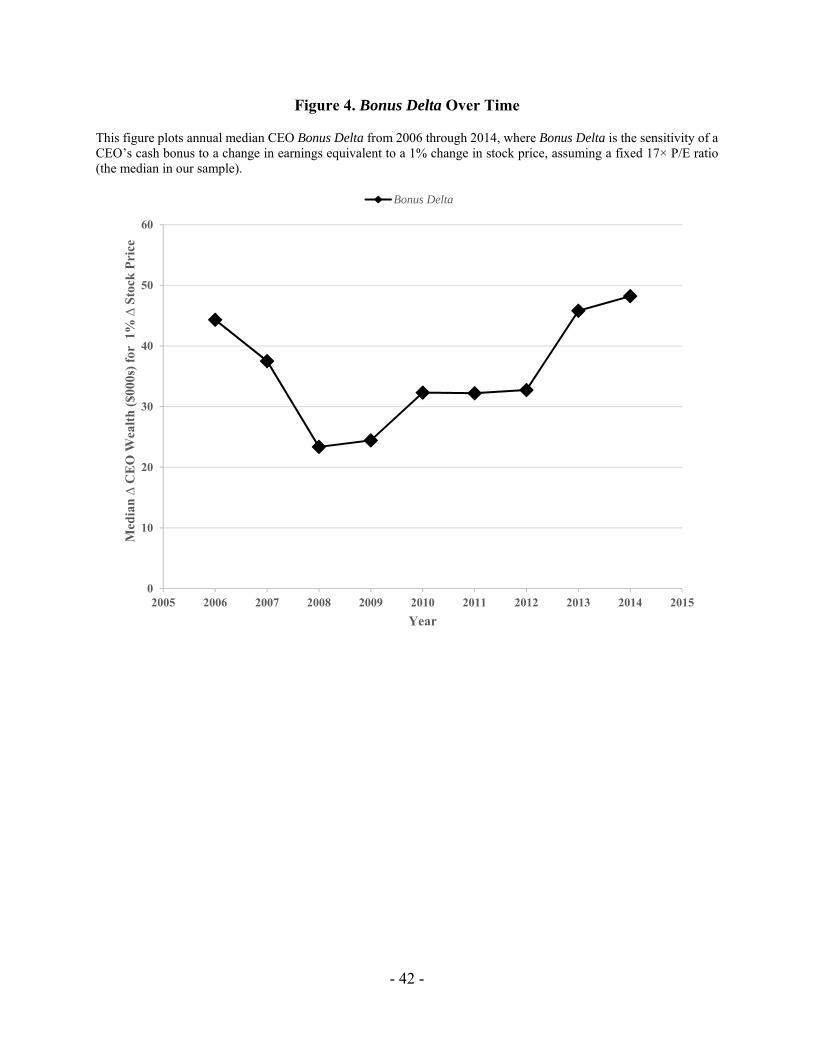
- 42 -
Figure 4. Bonus Delta Over Time
This figure plots annual median CEO Bonus Delta from 2006 through 2014, where Bonus Delta is the sensitivity of a CEO’s cash bonus to a change in earnings equivalent to a 1% change in stock price, assuming a fixed 17× P/E ratio (the median in our sample).
0
10
20
30
40
50
60
2005 2006 2007 2008 2009 2010 2011 2012 2013 2014 2015
Med
ian
∆ C
EO
Wea
lth
($0
00s)
for
1%
∆ S
tock
Pri
ce
Year
Bonus Delta
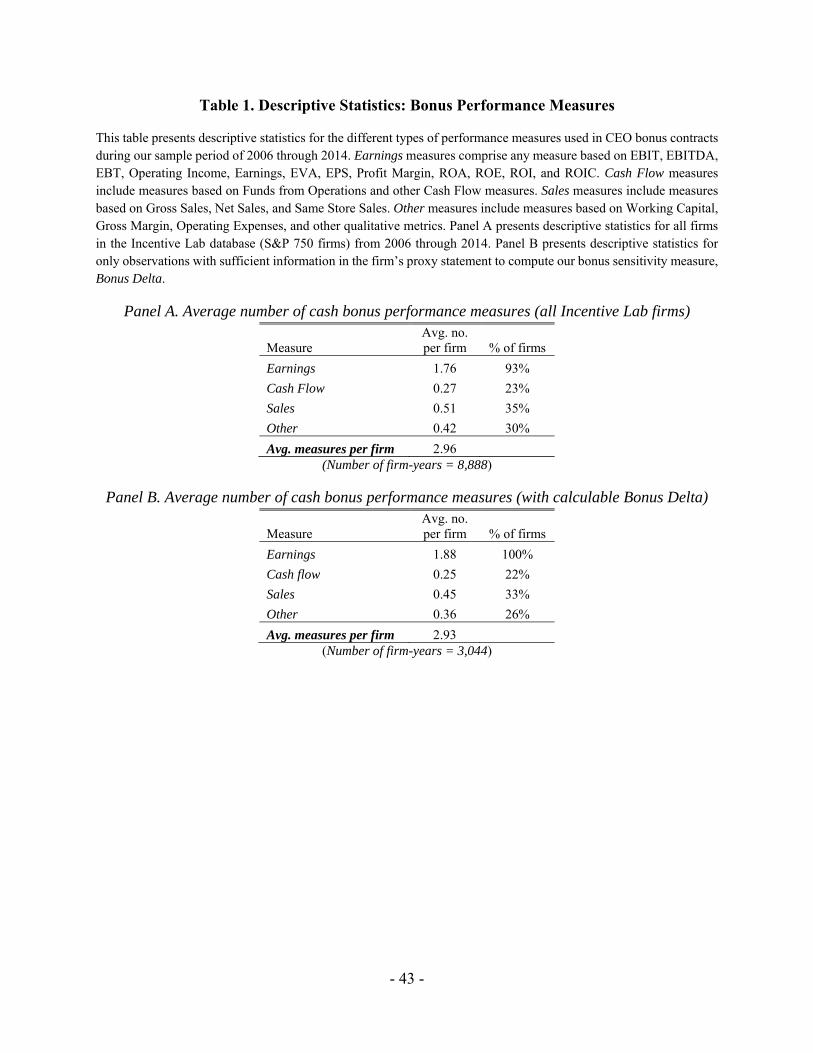
- 43 -
Table 1. Descriptive Statistics: Bonus Performance Measures
This table presents descriptive statistics for the different types of performance measures used in CEO bonus contracts during our sample period of 2006 through 2014. Earnings measures comprise any measure based on EBIT, EBITDA, EBT, Operating Income, Earnings, EVA, EPS, Profit Margin, ROA, ROE, ROI, and ROIC. Cash Flow measures include measures based on Funds from Operations and other Cash Flow measures. Sales measures include measures based on Gross Sales, Net Sales, and Same Store Sales. Other measures include measures based on Working Capital, Gross Margin, Operating Expenses, and other qualitative metrics. Panel A presents descriptive statistics for all firms in the Incentive Lab database (S&P 750 firms) from 2006 through 2014. Panel B presents descriptive statistics for only observations with sufficient information in the firm’s proxy statement to compute our bonus sensitivity measure, Bonus Delta.
Panel A. Average number of cash bonus performance measures (all Incentive Lab firms)
Measure Avg. no. per firm % of firms
Earnings 1.76 93%
Cash Flow 0.27 23%
Sales 0.51 35%
Other 0.42 30%
Avg. measures per firm 2.96 (Number of firm-years = 8,888)
Panel B. Average number of cash bonus performance measures (with calculable Bonus Delta)
Measure Avg. no. per firm % of firms
Earnings 1.88 100%
Cash flow 0.25 22%
Sales 0.45 33%
Other 0.36 26%
Avg. measures per firm 2.93 (Number of firm-years = 3,044)
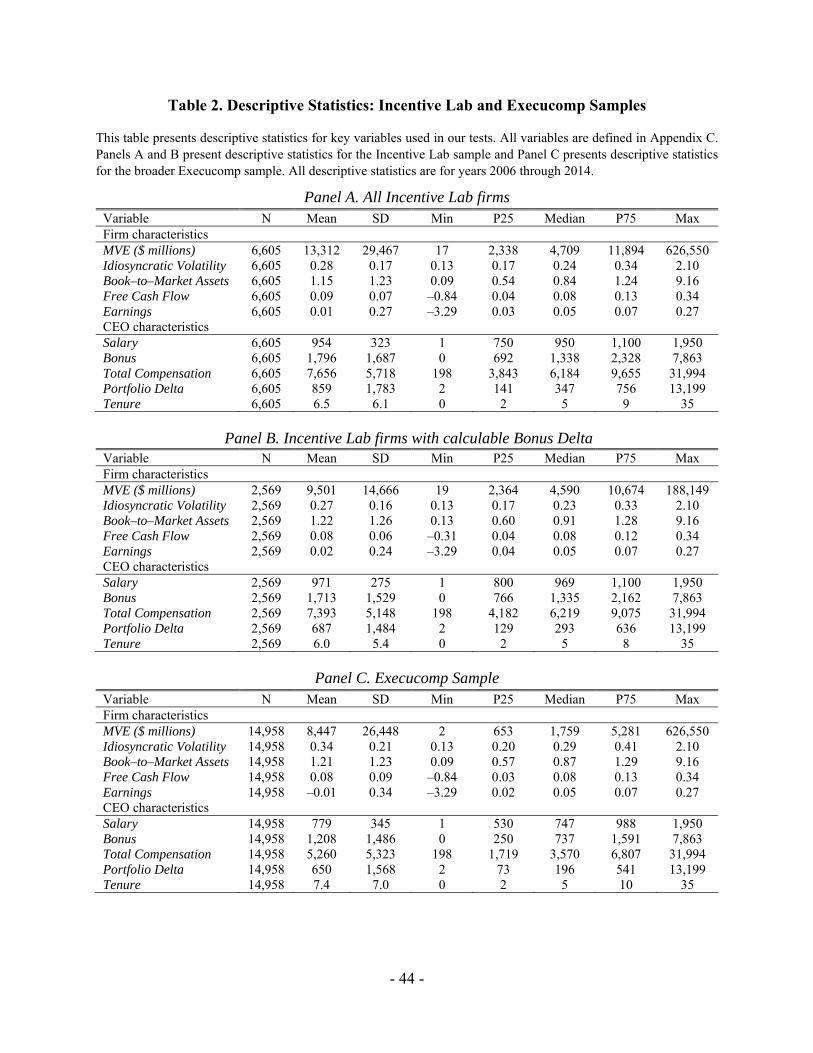
- 44 -
Table 2. Descriptive Statistics: Incentive Lab and Execucomp Samples
This table presents descriptive statistics for key variables used in our tests. All variables are defined in Appendix C. Panels A and B present descriptive statistics for the Incentive Lab sample and Panel C presents descriptive statistics for the broader Execucomp sample. All descriptive statistics are for years 2006 through 2014.
Panel A. All Incentive Lab firms Variable N Mean SD Min P25 Median P75 Max Firm characteristics MVE ($ millions) 6,605 13,312 29,467 17 2,338 4,709 11,894 626,550 Idiosyncratic Volatility 6,605 0.28 0.17 0.13 0.17 0.24 0.34 2.10 Book–to–Market Assets 6,605 1.15 1.23 0.09 0.54 0.84 1.24 9.16 Free Cash Flow 6,605 0.09 0.07 –0.84 0.04 0.08 0.13 0.34 Earnings 6,605 0.01 0.27 –3.29 0.03 0.05 0.07 0.27 CEO characteristics Salary 6,605 954 323 1 750 950 1,100 1,950 Bonus 6,605 1,796 1,687 0 692 1,338 2,328 7,863 Total Compensation 6,605 7,656 5,718 198 3,843 6,184 9,655 31,994 Portfolio Delta 6,605 859 1,783 2 141 347 756 13,199 Tenure 6,605 6.5 6.1 0 2 5 9 35
Panel B. Incentive Lab firms with calculable Bonus Delta Variable N Mean SD Min P25 Median P75 Max Firm characteristics MVE ($ millions) 2,569 9,501 14,666 19 2,364 4,590 10,674 188,149 Idiosyncratic Volatility 2,569 0.27 0.16 0.13 0.17 0.23 0.33 2.10 Book–to–Market Assets 2,569 1.22 1.26 0.13 0.60 0.91 1.28 9.16 Free Cash Flow 2,569 0.08 0.06 –0.31 0.04 0.08 0.12 0.34 Earnings 2,569 0.02 0.24 –3.29 0.04 0.05 0.07 0.27 CEO characteristics Salary 2,569 971 275 1 800 969 1,100 1,950 Bonus 2,569 1,713 1,529 0 766 1,335 2,162 7,863 Total Compensation 2,569 7,393 5,148 198 4,182 6,219 9,075 31,994 Portfolio Delta 2,569 687 1,484 2 129 293 636 13,199 Tenure 2,569 6.0 5.4 0 2 5 8 35
Panel C. Execucomp Sample Variable N Mean SD Min P25 Median P75 Max Firm characteristics MVE ($ millions) 14,958 8,447 26,448 2 653 1,759 5,281 626,550 Idiosyncratic Volatility 14,958 0.34 0.21 0.13 0.20 0.29 0.41 2.10 Book–to–Market Assets 14,958 1.21 1.23 0.09 0.57 0.87 1.29 9.16 Free Cash Flow 14,958 0.08 0.09 –0.84 0.03 0.08 0.13 0.34 Earnings 14,958 –0.01 0.34 –3.29 0.02 0.05 0.07 0.27 CEO characteristics Salary 14,958 779 345 1 530 747 988 1,950 Bonus 14,958 1,208 1,486 0 250 737 1,591 7,863 Total Compensation 14,958 5,260 5,323 198 1,719 3,570 6,807 31,994 Portfolio Delta 14,958 650 1,568 2 73 196 541 13,199 Tenure 14,958 7.4 7.0 0 2 5 10 35
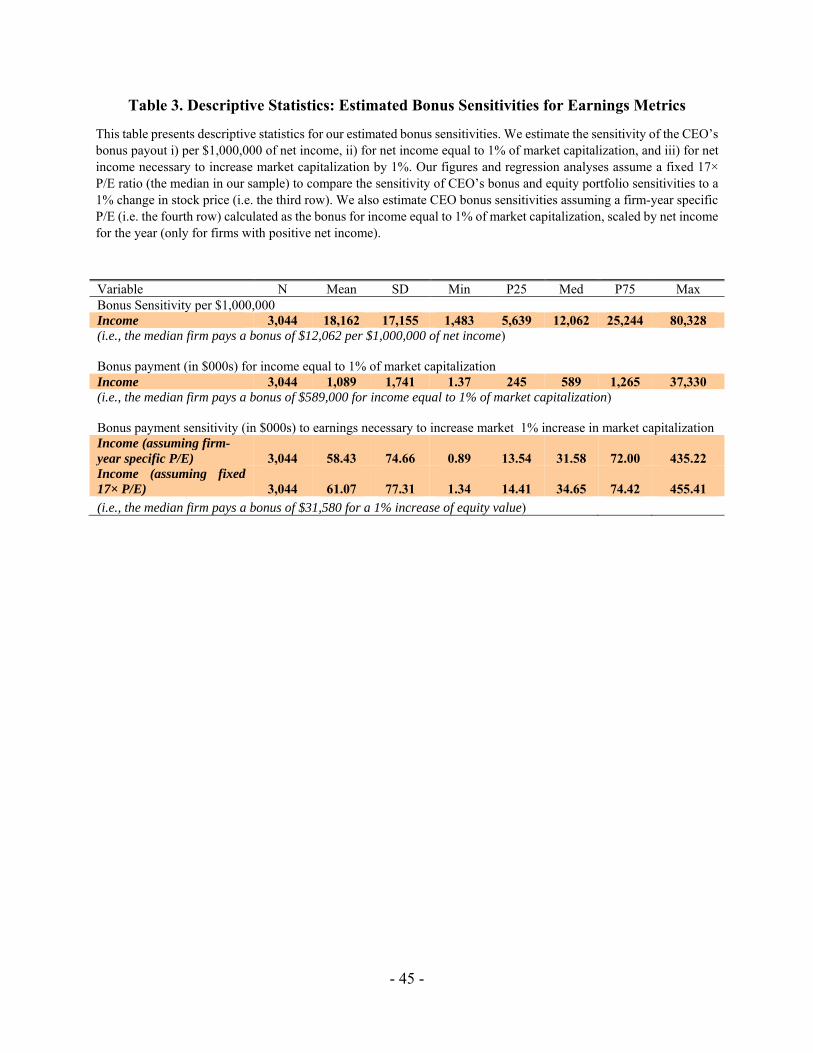
- 45 -
Table 3. Descriptive Statistics: Estimated Bonus Sensitivities for Earnings Metrics
This table presents descriptive statistics for our estimated bonus sensitivities. We estimate the sensitivity of the CEO’s bonus payout i) per $1,000,000 of net income, ii) for net income equal to 1% of market capitalization, and iii) for net income necessary to increase market capitalization by 1%. Our figures and regression analyses assume a fixed 17× P/E ratio (the median in our sample) to compare the sensitivity of CEO’s bonus and equity portfolio sensitivities to a 1% change in stock price (i.e. the third row). We also estimate CEO bonus sensitivities assuming a firm-year specific P/E (i.e. the fourth row) calculated as the bonus for income equal to 1% of market capitalization, scaled by net income for the year (only for firms with positive net income).
Variable N Mean SD Min P25 Med P75 Max Bonus Sensitivity per $1,000,000 Income 3,044 18,162 17,155 1,483 5,639 12,062 25,244 80,328 (i.e., the median firm pays a bonus of $12,062 per $1,000,000 of net income) Bonus payment (in $000s) for income equal to 1% of market capitalization Income 3,044 1,089 1,741 1.37 245 589 1,265 37,330 (i.e., the median firm pays a bonus of $589,000 for income equal to 1% of market capitalization) Bonus payment sensitivity (in $000s) to earnings necessary to increase market 1% increase in market capitalization Income (assuming firm-year specific P/E) 3,044 58.43 74.66 0.89 13.54 31.58 72.00 435.22 Income (assuming fixed 17× P/E) 3,044 61.07 77.31 1.34 14.41 34.65 74.42 455.41
(i.e., the median firm pays a bonus of $31,580 for a 1% increase of equity value)
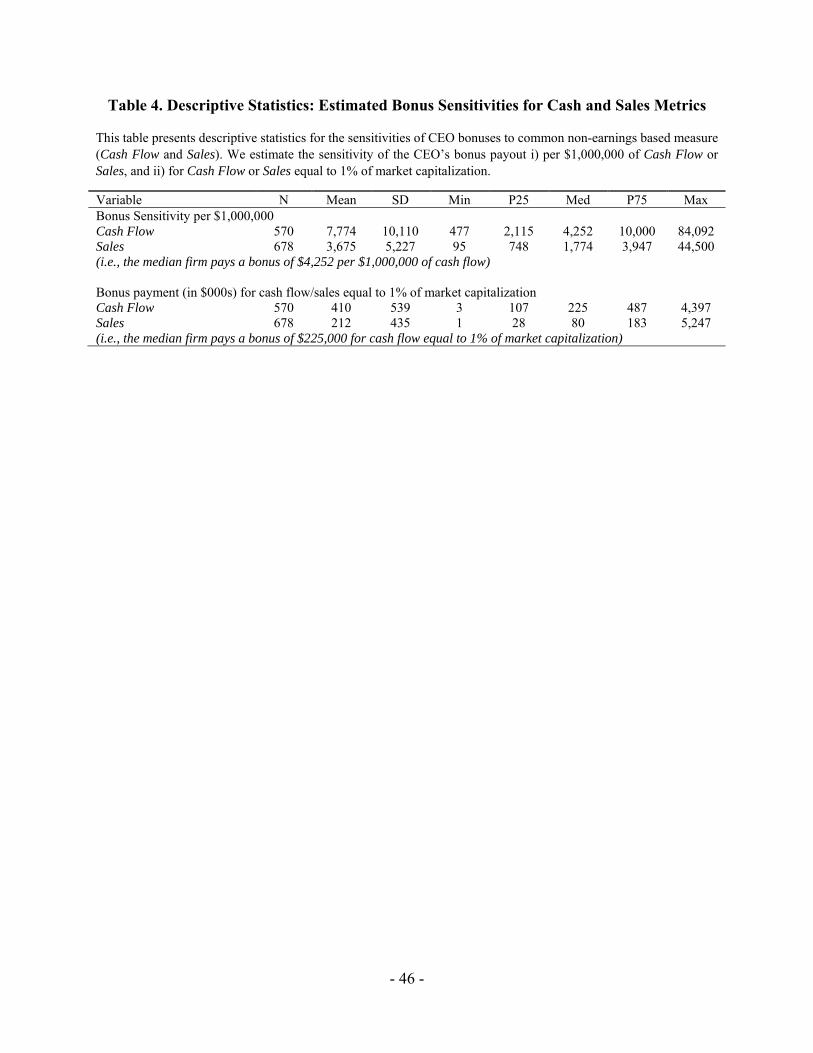
- 46 -
Table 4. Descriptive Statistics: Estimated Bonus Sensitivities for Cash and Sales Metrics
This table presents descriptive statistics for the sensitivities of CEO bonuses to common non-earnings based measure (Cash Flow and Sales). We estimate the sensitivity of the CEO’s bonus payout i) per $1,000,000 of Cash Flow or Sales, and ii) for Cash Flow or Sales equal to 1% of market capitalization.
Variable N Mean SD Min P25 Med P75 Max Bonus Sensitivity per $1,000,000 Cash Flow 570 7,774 10,110 477 2,115 4,252 10,000 84,092 Sales 678 3,675 5,227 95 748 1,774 3,947 44,500 (i.e., the median firm pays a bonus of $4,252 per $1,000,000 of cash flow) Bonus payment (in $000s) for cash flow/sales equal to 1% of market capitalization Cash Flow 570 410 539 3 107 225 487 4,397 Sales 678 212 435 1 28 80 183 5,247 (i.e., the median firm pays a bonus of $225,000 for cash flow equal to 1% of market capitalization)
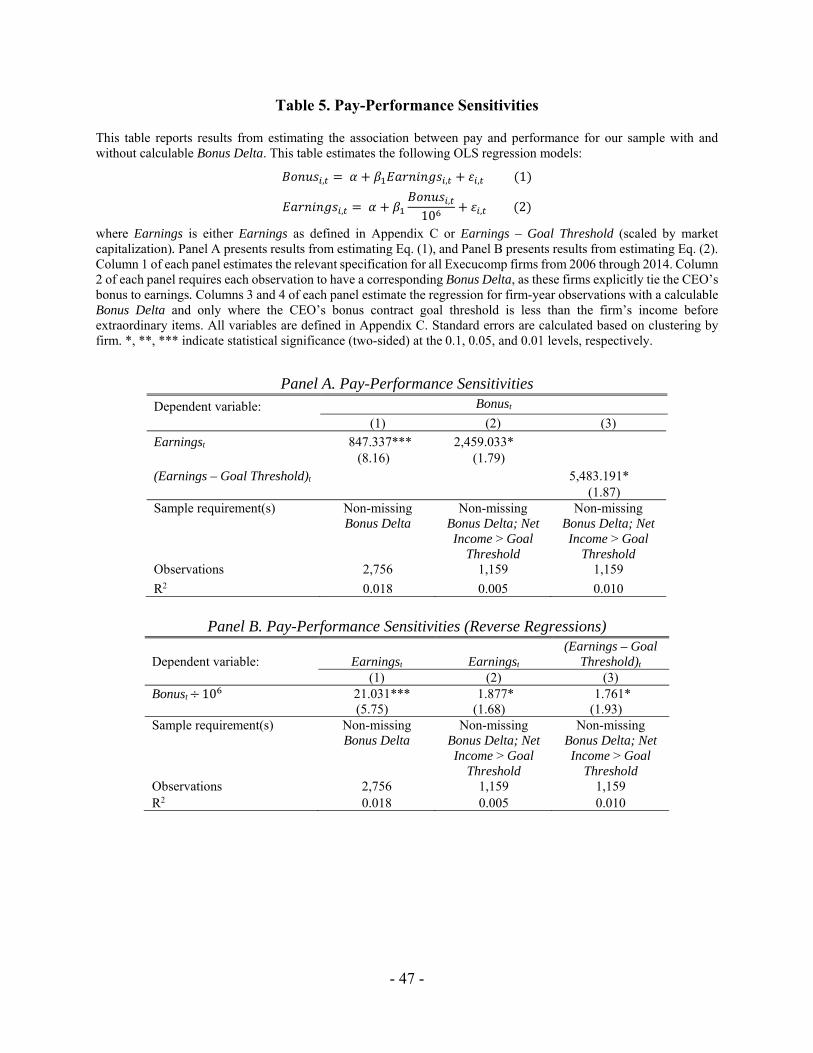
- 47 -
Table 5. Pay-Performance Sensitivities
This table reports results from estimating the association between pay and performance for our sample with and without calculable Bonus Delta. This table estimates the following OLS regression models:
, , , 1
, ,
10 , 2
where Earnings is either Earnings as defined in Appendix C or Earnings – Goal Threshold (scaled by market capitalization). Panel A presents results from estimating Eq. (1), and Panel B presents results from estimating Eq. (2). Column 1 of each panel estimates the relevant specification for all Execucomp firms from 2006 through 2014. Column 2 of each panel requires each observation to have a corresponding Bonus Delta, as these firms explicitly tie the CEO’s bonus to earnings. Columns 3 and 4 of each panel estimate the regression for firm-year observations with a calculable Bonus Delta and only where the CEO’s bonus contract goal threshold is less than the firm’s income before extraordinary items. All variables are defined in Appendix C. Standard errors are calculated based on clustering by firm. *, **, *** indicate statistical significance (two-sided) at the 0.1, 0.05, and 0.01 levels, respectively.
Panel A. Pay-Performance Sensitivities Dependent variable: Bonust
(1) (2) (3)
Earningst 847.337*** 2,459.033* (8.16) (1.79)
(Earnings – Goal Threshold)t 5,483.191*
(1.87) Sample requirement(s) Non-missing
Bonus Delta Non-missing
Bonus Delta; Net Income > Goal
Threshold
Non-missing Bonus Delta; Net Income > Goal
Threshold Observations 2,756 1,159 1,159
R2 0.018 0.005 0.010
Panel B. Pay-Performance Sensitivities (Reverse Regressions)
Dependent variable: Earningst Earningst (Earnings – Goal
Threshold)t (1) (2) (3) Bonust 10 21.031*** 1.877* 1.761*
(5.75) (1.68) (1.93) Sample requirement(s) Non-missing
Bonus Delta Non-missing
Bonus Delta; Net Income > Goal
Threshold
Non-missing Bonus Delta; Net Income > Goal
Threshold Observations 2,756 1,159 1,159 R2 0.018 0.005 0.010
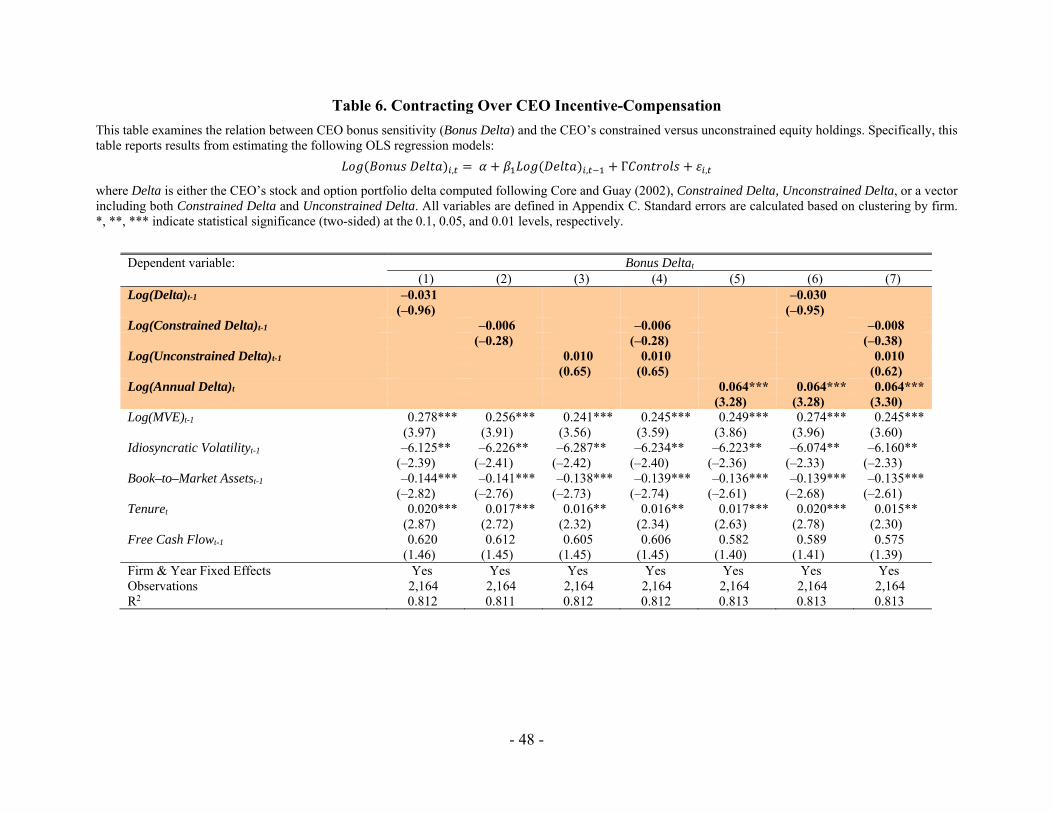
- 48 -
Table 6. Contracting Over CEO Incentive-Compensation
This table examines the relation between CEO bonus sensitivity (Bonus Delta) and the CEO’s constrained versus unconstrained equity holdings. Specifically, this table reports results from estimating the following OLS regression models:
, , Γ ,
where Delta is either the CEO’s stock and option portfolio delta computed following Core and Guay (2002), Constrained Delta, Unconstrained Delta, or a vector including both Constrained Delta and Unconstrained Delta. All variables are defined in Appendix C. Standard errors are calculated based on clustering by firm. *, **, *** indicate statistical significance (two-sided) at the 0.1, 0.05, and 0.01 levels, respectively.
Dependent variable: Bonus Deltat (1) (2) (3) (4) (5) (6) (7) Log(Delta)t-1 –0.031 –0.030 (–0.96) (–0.95) Log(Constrained Delta)t-1 –0.006 –0.006 –0.008 (–0.28) (–0.28) (–0.38) Log(Unconstrained Delta)t-1 0.010 0.010 0.010 (0.65) (0.65) (0.62) Log(Annual Delta)t 0.064*** 0.064*** 0.064*** (3.28) (3.28) (3.30) Log(MVE)t-1 0.278*** 0.256*** 0.241*** 0.245*** 0.249*** 0.274*** 0.245***
(3.97) (3.91) (3.56) (3.59) (3.86) (3.96) (3.60) Idiosyncratic Volatilityt-1 –6.125** –6.226** –6.287** –6.234** –6.223** –6.074** –6.160**
(–2.39) (–2.41) (–2.42) (–2.40) (–2.36) (–2.33) (–2.33) Book–to–Market Assetst-1 –0.144*** –0.141*** –0.138*** –0.139*** –0.136*** –0.139*** –0.135***
(–2.82) (–2.76) (–2.73) (–2.74) (–2.61) (–2.68) (–2.61) Tenuret 0.020*** 0.017*** 0.016** 0.016** 0.017*** 0.020*** 0.015**
(2.87) (2.72) (2.32) (2.34) (2.63) (2.78) (2.30) Free Cash Flowt-1 0.620 0.612 0.605 0.606 0.582 0.589 0.575
(1.46) (1.45) (1.45) (1.45) (1.40) (1.41) (1.39) Firm & Year Fixed Effects Yes Yes Yes Yes Yes Yes Yes Observations 2,164 2,164 2,164 2,164 2,164 2,164 2,164 R2 0.812 0.811 0.812 0.812 0.813 0.813 0.813
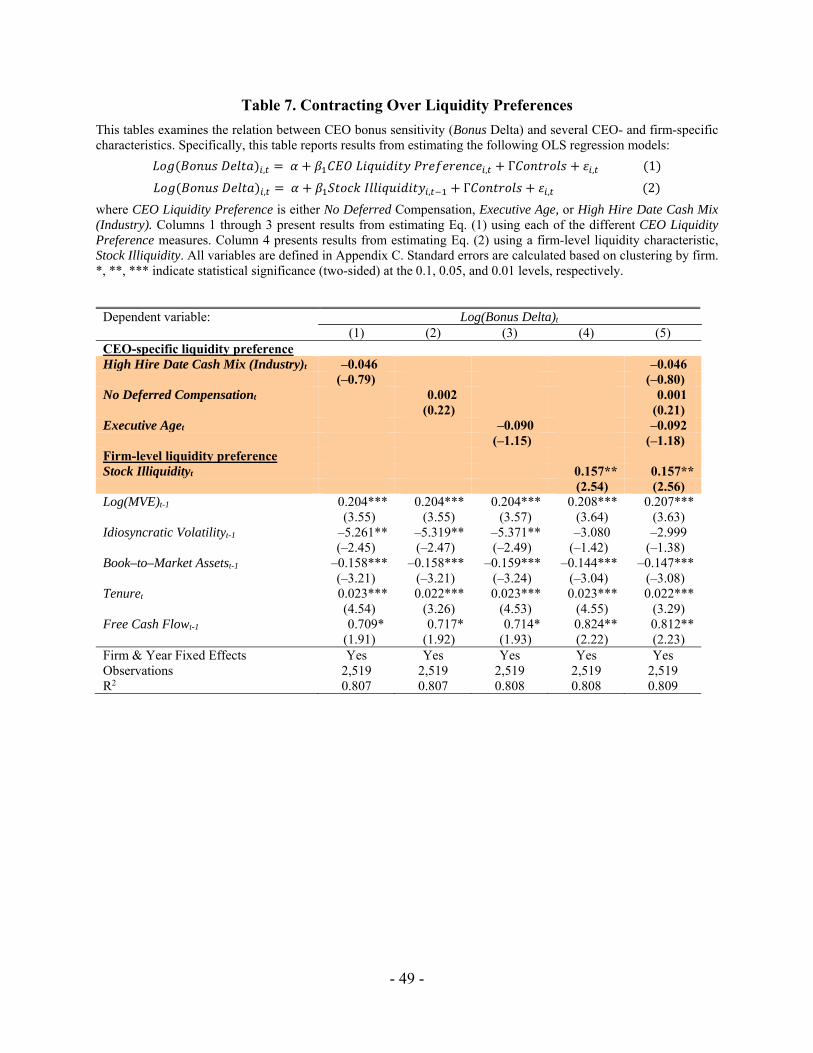
- 49 -
Table 7. Contracting Over Liquidity Preferences
This tables examines the relation between CEO bonus sensitivity (Bonus Delta) and several CEO- and firm-specific characteristics. Specifically, this table reports results from estimating the following OLS regression models:
, , Γ , 1
, , Γ , 2
where CEO Liquidity Preference is either No Deferred Compensation, Executive Age, or High Hire Date Cash Mix (Industry). Columns 1 through 3 present results from estimating Eq. (1) using each of the different CEO Liquidity Preference measures. Column 4 presents results from estimating Eq. (2) using a firm-level liquidity characteristic, Stock Illiquidity. All variables are defined in Appendix C. Standard errors are calculated based on clustering by firm. *, **, *** indicate statistical significance (two-sided) at the 0.1, 0.05, and 0.01 levels, respectively.
Dependent variable: Log(Bonus Delta)t (1) (2) (3) (4) (5) CEO-specific liquidity preference High Hire Date Cash Mix (Industry)t –0.046 –0.046 (–0.79) (–0.80) No Deferred Compensationt 0.002 0.001 (0.22) (0.21) Executive Aget –0.090 –0.092 (–1.15) (–1.18) Firm-level liquidity preference Stock Illiquidityt 0.157** 0.157** (2.54) (2.56) Log(MVE)t-1 0.204*** 0.204*** 0.204*** 0.208*** 0.207***
(3.55) (3.55) (3.57) (3.64) (3.63) Idiosyncratic Volatilityt-1 –5.261** –5.319** –5.371** –3.080 –2.999
(–2.45) (–2.47) (–2.49) (–1.42) (–1.38) Book–to–Market Assetst-1 –0.158*** –0.158*** –0.159*** –0.144*** –0.147***
(–3.21) (–3.21) (–3.24) (–3.04) (–3.08) Tenuret 0.023*** 0.022*** 0.023*** 0.023*** 0.022***
(4.54) (3.26) (4.53) (4.55) (3.29) Free Cash Flowt-1 0.709* 0.717* 0.714* 0.824** 0.812**
(1.91) (1.92) (1.93) (2.22) (2.23) Firm & Year Fixed Effects Yes Yes Yes Yes Yes Observations 2,519 2,519 2,519 2,519 2,519 R2 0.807 0.807 0.808 0.808 0.809
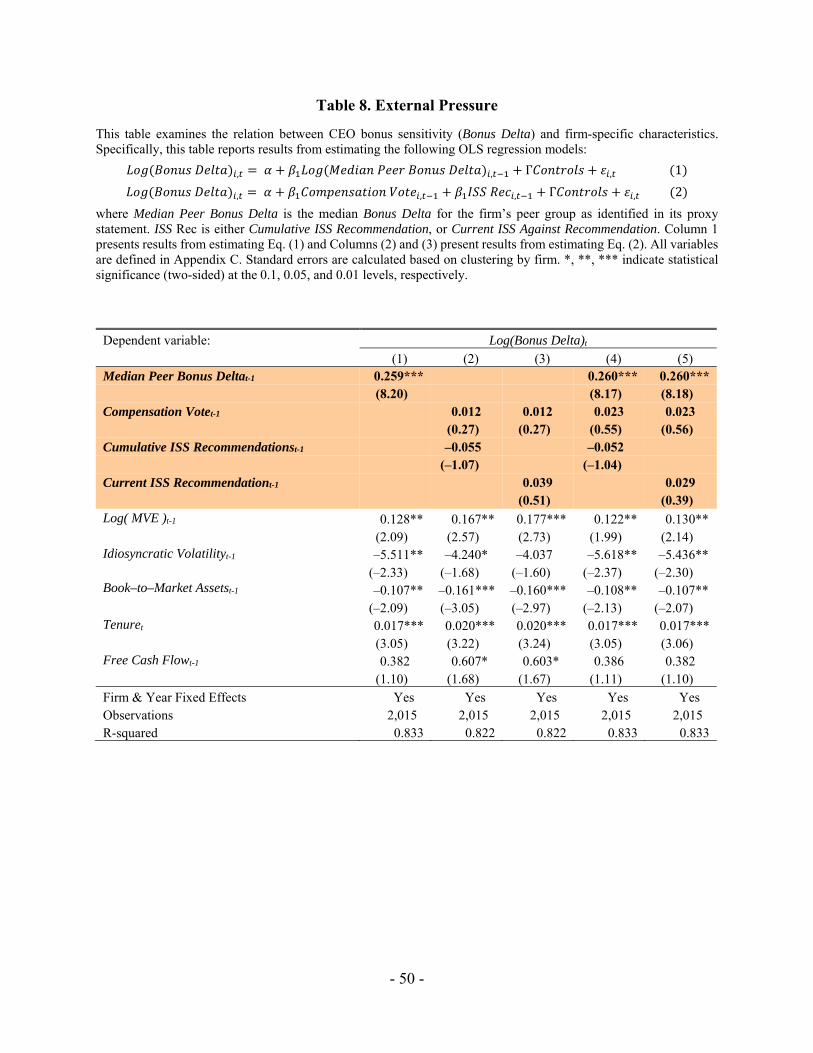
- 50 -
Table 8. External Pressure
This table examines the relation between CEO bonus sensitivity (Bonus Delta) and firm-specific characteristics. Specifically, this table reports results from estimating the following OLS regression models:
, , Γ , 1
, , , Γ , 2
where Median Peer Bonus Delta is the median Bonus Delta for the firm’s peer group as identified in its proxy statement. ISS Rec is either Cumulative ISS Recommendation, or Current ISS Against Recommendation. Column 1 presents results from estimating Eq. (1) and Columns (2) and (3) present results from estimating Eq. (2). All variables are defined in Appendix C. Standard errors are calculated based on clustering by firm. *, **, *** indicate statistical significance (two-sided) at the 0.1, 0.05, and 0.01 levels, respectively.
Dependent variable: Log(Bonus Delta)t (1) (2) (3) (4) (5) Median Peer Bonus Deltat-1 0.259*** 0.260*** 0.260*** (8.20) (8.17) (8.18) Compensation Votet-1 0.012 0.012 0.023 0.023 (0.27) (0.27) (0.55) (0.56) Cumulative ISS Recommendationst-1 –0.055 –0.052 (–1.07) (–1.04) Current ISS Recommendationt-1 0.039 0.029 (0.51) (0.39) Log( MVE )t-1 0.128** 0.167** 0.177*** 0.122** 0.130**
(2.09) (2.57) (2.73) (1.99) (2.14) Idiosyncratic Volatilityt-1 –5.511** –4.240* –4.037 –5.618** –5.436**
(–2.33) (–1.68) (–1.60) (–2.37) (–2.30) Book–to–Market Assetst-1 –0.107** –0.161*** –0.160*** –0.108** –0.107**
(–2.09) (–3.05) (–2.97) (–2.13) (–2.07) Tenuret 0.017*** 0.020*** 0.020*** 0.017*** 0.017***
(3.05) (3.22) (3.24) (3.05) (3.06) Free Cash Flowt-1 0.382 0.607* 0.603* 0.386 0.382
(1.10) (1.68) (1.67) (1.11) (1.10) Firm & Year Fixed Effects Yes Yes Yes Yes Yes Observations 2,015 2,015 2,015 2,015 2,015 R-squared 0.833 0.822 0.822 0.833 0.833
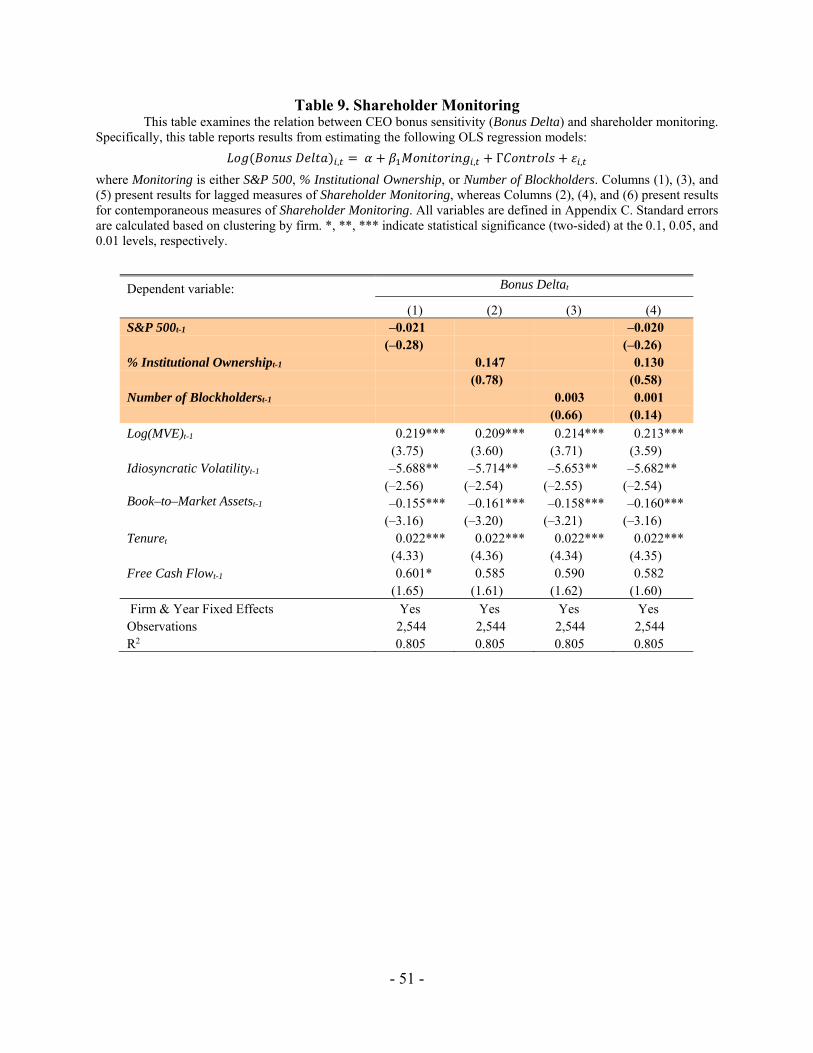
- 51 -
Table 9. Shareholder Monitoring This table examines the relation between CEO bonus sensitivity (Bonus Delta) and shareholder monitoring. Specifically, this table reports results from estimating the following OLS regression models:
, , Γ ,
where Monitoring is either S&P 500, % Institutional Ownership, or Number of Blockholders. Columns (1), (3), and (5) present results for lagged measures of Shareholder Monitoring, whereas Columns (2), (4), and (6) present results for contemporaneous measures of Shareholder Monitoring. All variables are defined in Appendix C. Standard errors are calculated based on clustering by firm. *, **, *** indicate statistical significance (two-sided) at the 0.1, 0.05, and 0.01 levels, respectively.
Dependent variable: Bonus Deltat
(1) (2) (3) (4) S&P 500t-1 –0.021 –0.020 (–0.28) (–0.26) % Institutional Ownershipt-1 0.147 0.130 (0.78) (0.58) Number of Blockholderst-1 0.003 0.001 (0.66) (0.14) Log(MVE)t-1 0.219*** 0.209*** 0.214*** 0.213***
(3.75) (3.60) (3.71) (3.59) Idiosyncratic Volatilityt-1 –5.688** –5.714** –5.653** –5.682**
(–2.56) (–2.54) (–2.55) (–2.54) Book–to–Market Assetst-1 –0.155*** –0.161*** –0.158*** –0.160***
(–3.16) (–3.20) (–3.21) (–3.16) Tenuret 0.022*** 0.022*** 0.022*** 0.022***
(4.33) (4.36) (4.34) (4.35) Free Cash Flowt-1 0.601* 0.585 0.590 0.582
(1.65) (1.61) (1.62) (1.60) Firm & Year Fixed Effects Yes Yes Yes Yes Observations 2,544 2,544 2,544 2,544 R2 0.805 0.805 0.805 0.805
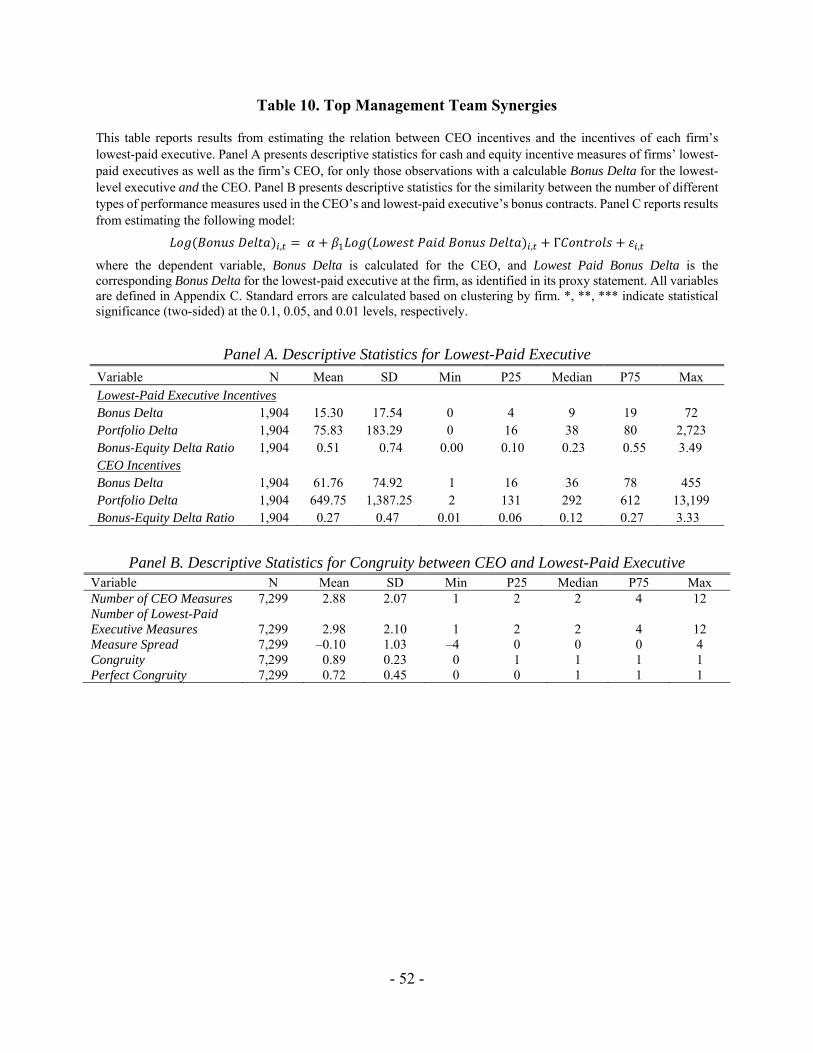
- 52 -
Table 10. Top Management Team Synergies
This table reports results from estimating the relation between CEO incentives and the incentives of each firm’s lowest-paid executive. Panel A presents descriptive statistics for cash and equity incentive measures of firms’ lowest-paid executives as well as the firm’s CEO, for only those observations with a calculable Bonus Delta for the lowest-level executive and the CEO. Panel B presents descriptive statistics for the similarity between the number of different types of performance measures used in the CEO’s and lowest-paid executive’s bonus contracts. Panel C reports results from estimating the following model:
, , Γ ,
where the dependent variable, Bonus Delta is calculated for the CEO, and Lowest Paid Bonus Delta is the corresponding Bonus Delta for the lowest-paid executive at the firm, as identified in its proxy statement. All variables are defined in Appendix C. Standard errors are calculated based on clustering by firm. *, **, *** indicate statistical significance (two-sided) at the 0.1, 0.05, and 0.01 levels, respectively.
Panel A. Descriptive Statistics for Lowest-Paid Executive Variable N Mean SD Min P25 Median P75 Max Lowest-Paid Executive Incentives Bonus Delta 1,904 15.30 17.54 0 4 9 19 72 Portfolio Delta 1,904 75.83 183.29 0 16 38 80 2,723 Bonus-Equity Delta Ratio 1,904 0.51 0.74 0.00 0.10 0.23 0.55 3.49 CEO Incentives Bonus Delta 1,904 61.76 74.92 1 16 36 78 455 Portfolio Delta 1,904 649.75 1,387.25 2 131 292 612 13,199 Bonus-Equity Delta Ratio 1,904 0.27 0.47 0.01 0.06 0.12 0.27 3.33
Panel B. Descriptive Statistics for Congruity between CEO and Lowest-Paid Executive Variable N Mean SD Min P25 Median P75 Max Number of CEO Measures 7,299 2.88 2.07 1 2 2 4 12 Number of Lowest-Paid Executive Measures 7,299 2.98 2.10 1 2 2 4 12 Measure Spread 7,299 –0.10 1.03 –4 0 0 0 4 Congruity 7,299 0.89 0.23 0 1 1 1 1 Perfect Congruity 7,299 0.72 0.45 0 0 1 1 1
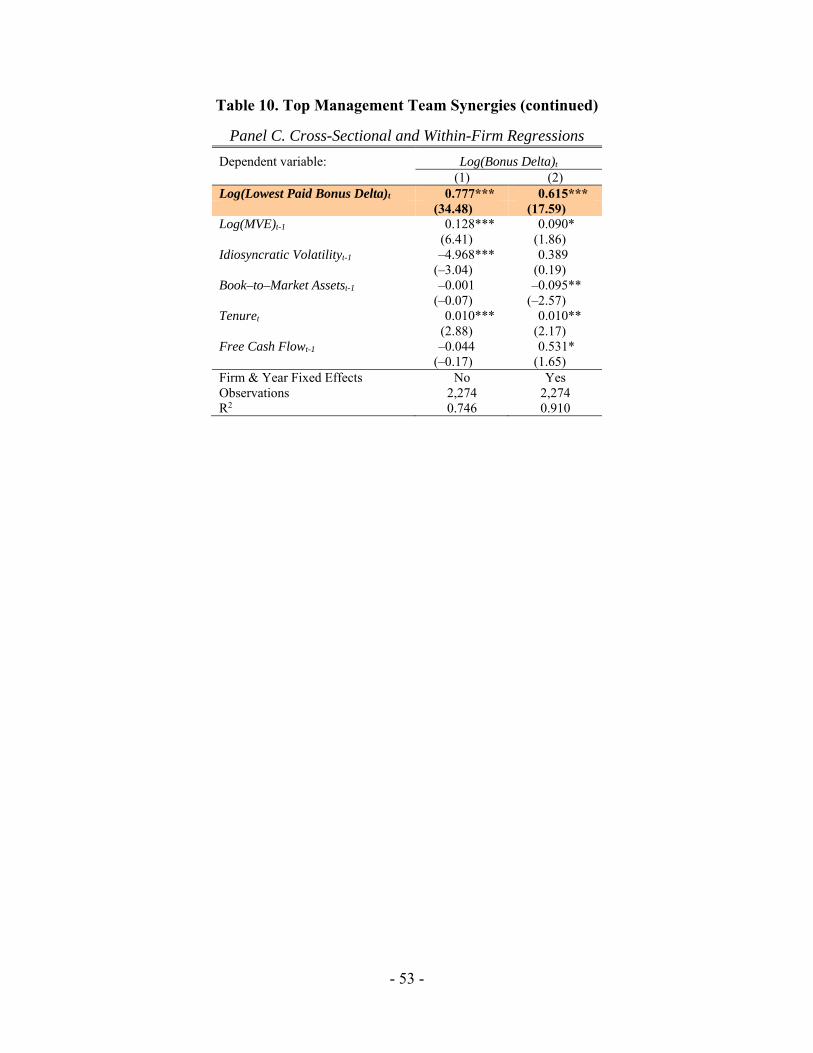
- 53 -
Table 10. Top Management Team Synergies (continued)
Panel C. Cross-Sectional and Within-Firm Regressions
Dependent variable: Log(Bonus Delta)t (1) (2) Log(Lowest Paid Bonus Delta)t 0.777*** 0.615*** (34.48) (17.59) Log(MVE)t-1 0.128*** 0.090*
(6.41) (1.86) Idiosyncratic Volatilityt-1 –4.968*** 0.389
(–3.04) (0.19) Book–to–Market Assetst-1 –0.001 –0.095**
(–0.07) (–2.57) Tenuret 0.010*** 0.010**
(2.88) (2.17) Free Cash Flowt-1 –0.044 0.531*
(–0.17) (1.65) Firm & Year Fixed Effects No Yes Observations 2,274 2,274 R2 0.746 0.910