Embed Size (px)
Citation preview
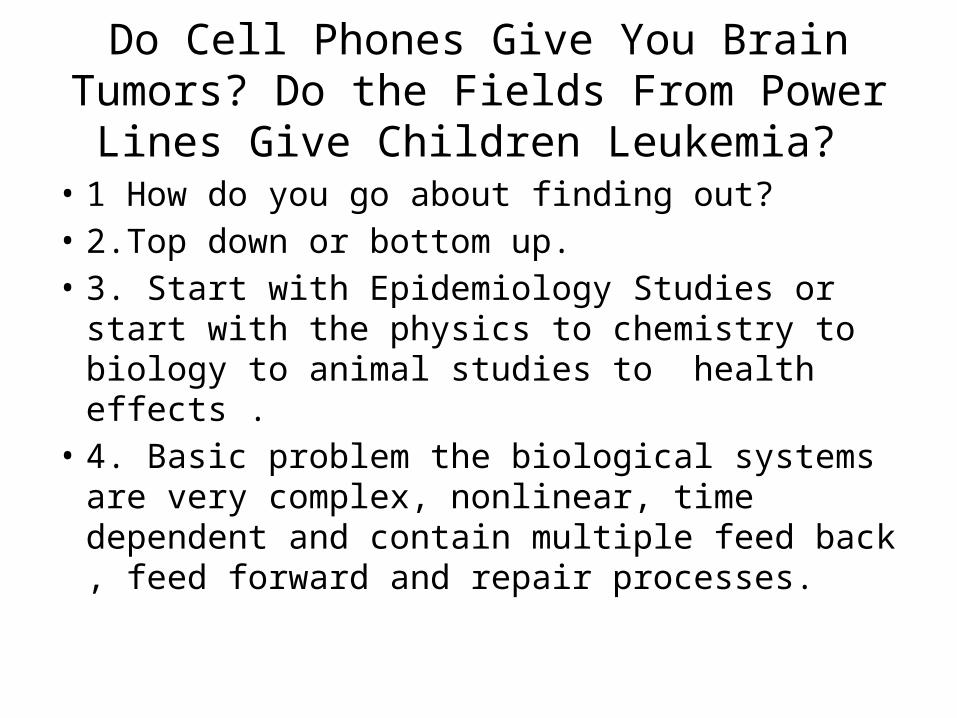
Do Cell Phones Give You Brain Tumors? Do the Fields From Power Lines Give Children
Leukemia? • 1 How do you go about finding out?• 2.Top down or bottom up. • 3. Start with Epidemiology Studies or start with
the physics to chemistry to biology to animal studies to health effects .
• 4. Basic problem the biological systems are very complex, nonlinear, time dependent and contain multiple feed back , feed forward and repair processes.
Types Epidemiology Studies
• 1. Case Control Studies• These are retrospective studies were you first
identify the cases and then select the controls which match the cases as closely as possible except for the variable being studied.
• 2. Cohort Studies • Measure the parameters and confounders for the
whole population under study and follow them for an extended period of time. The diseases are Identified as the study progresses.
Common Weakness
• 1. In case control studies include – A. Selection biases in the controls– B. Exposure measurements– C. Lack of an unexposed population2. In cohort studies,
A. Very large study population required for rare diseases.B. Example . Standard incidence rate for childhood cancers is
3.5/105 for females and 4.2/105 for males. C. Exposure measurements Loss of parts of the population in
unequal numbers.
3. Exposure misclassification, confounders, selection bias. All are common problems.
More Problems and Conflicting Data
• 4. Other sources of the fields. Bias in the populations selected, smoking, age, income level, social norms.
• 5. Long delay times from initiation to observation of many cancers.
• 1 You get conflicting studies? • 2. You get irreproducible results.• 3. Correlations may not be cause and effect.
Epidemiological StudiesELF
• 1. Wertheimer, N. and Leeper, E., Electrical wiring configurations and childhood cancer, Am.J. Epidemiol., 1979, 109(3): 273–284.
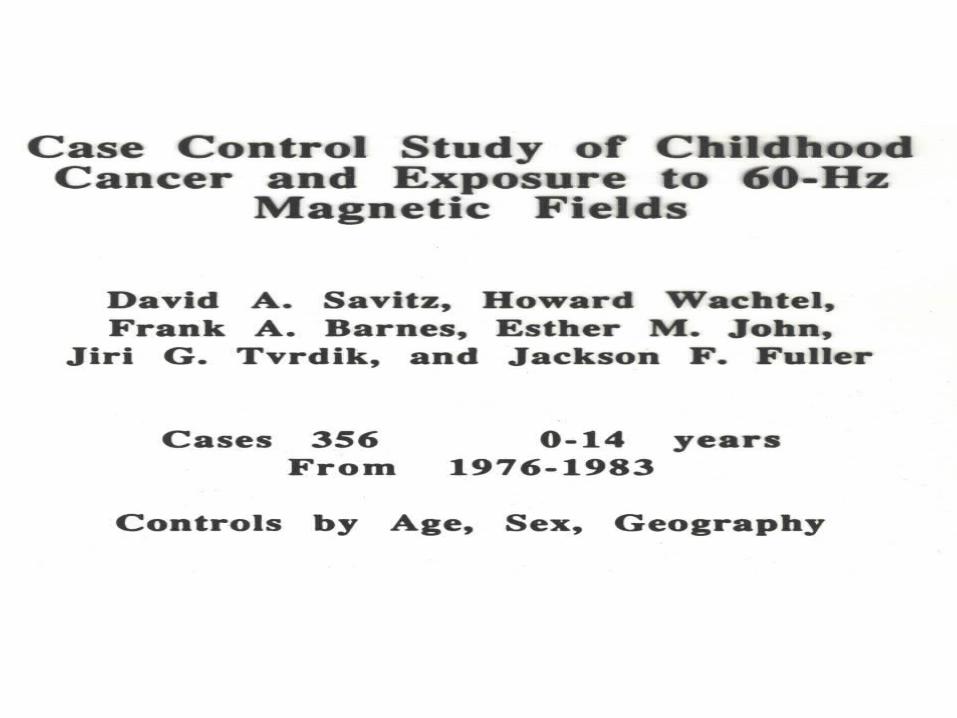
• 2. Savitz, D., Wachtel, H., Barnes, F. et al., Case–control study of childhood cancer and exposure to 60-Hz magnetic fields, Am. J. Epidemiol., 1988, 128(1): 21–38.3.
• 3.Linet, M., Hatch, E., Kleinermann, R. et al., Residential exposure to magnetic fields and acute lymphoblastic leukemia in children, N. Engl. J. Med., 1997, 337(1): 1–7
Wertheimer, N. and Leeper, E., Electrical wiring configurations and childhood cancer
• 1 This was the first study to show possible effects of 60Hz magnetic fields on cancer.
• 2. A Case Control Study • 3. It showed a weak association with power line
configuration. • 4. Note they did not have the funding or the
ability to enter the house and make measurements so the fields were inferred from the power line configuration and proximity.
Some Basic Problems in Measuring the Magnetic Fields.
• 1. They vary with time of day, time of year.• 2. They vary with location. • 3. The fields may be generated by other sources
than the power lines: plumbing, appliances . • 4. People are not home all the time and may be
exposed to magnetic fields else where.• 5. There was no model for the mechanism so that
you did not know what parameters to measure.
Approaches to Field Measurements• 1. Limited access to the house to about 1hour so
what do you measure?• 2. Need to spend time on questions with respect
to income, smoking, other possible confounders. • 3. The fields vary by about 2 to 1 with time of day
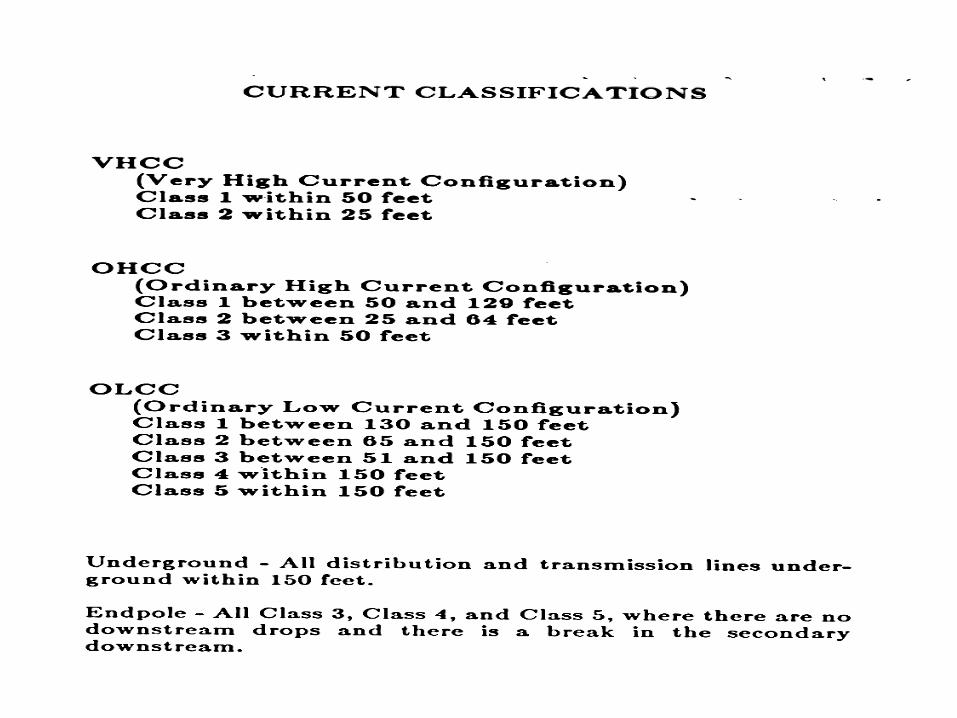
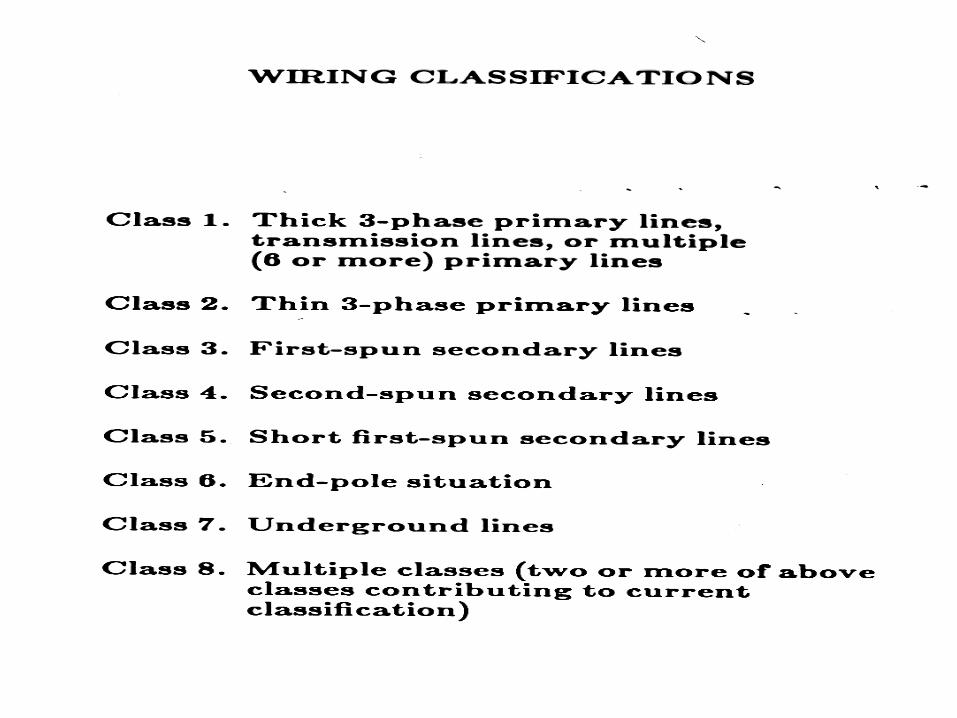
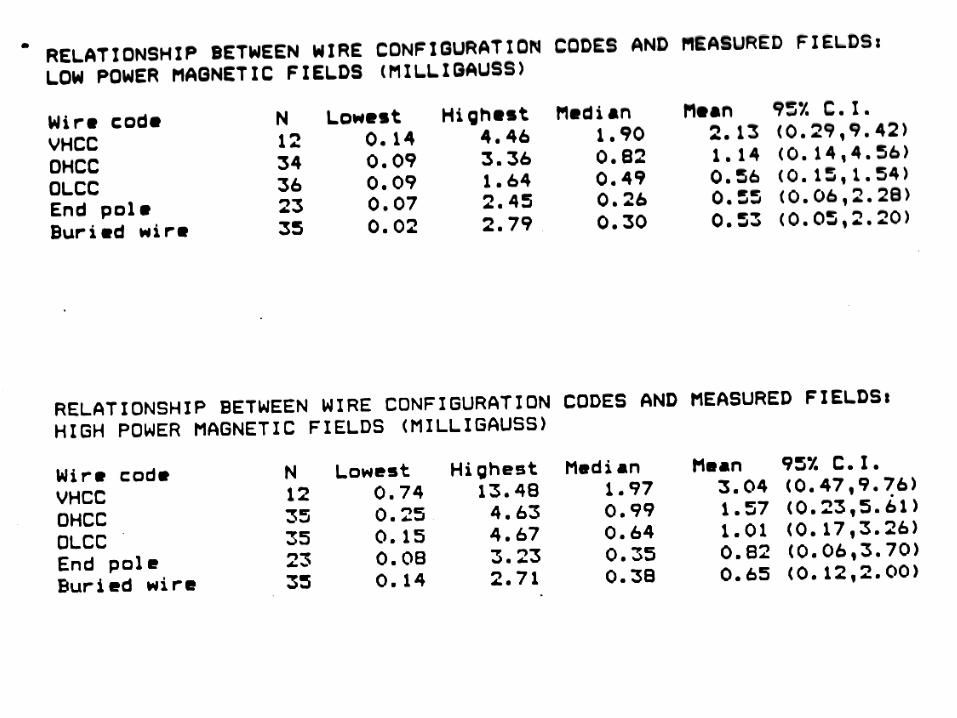
and another 2 to 1 with season of the year. • 4. Wiring Configuration Estimate from Size of
Wire, Distance to the house and from transformer.
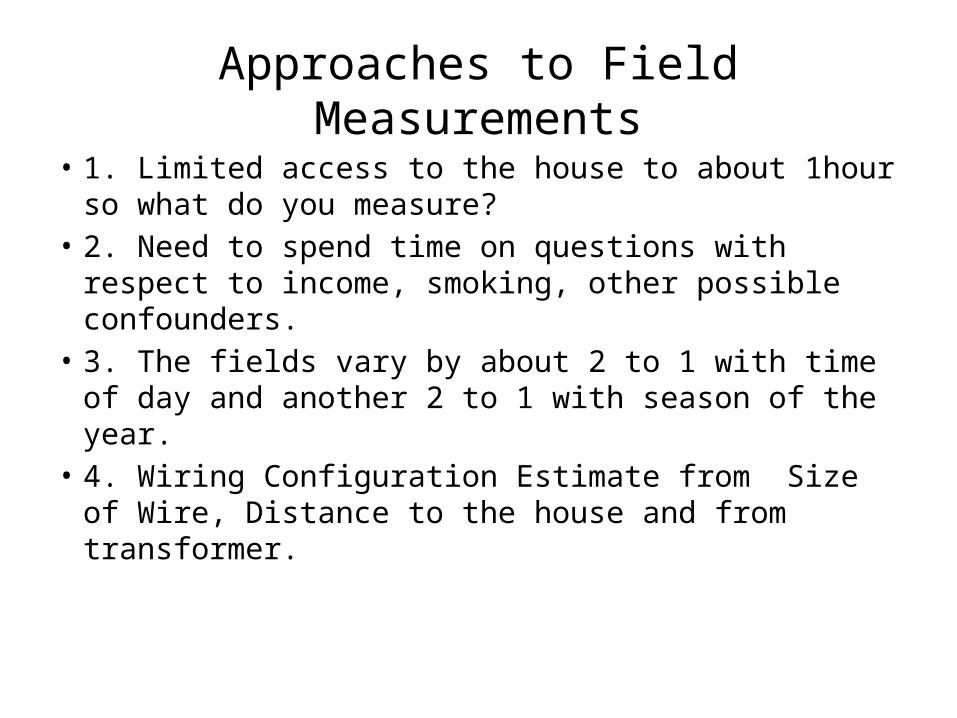
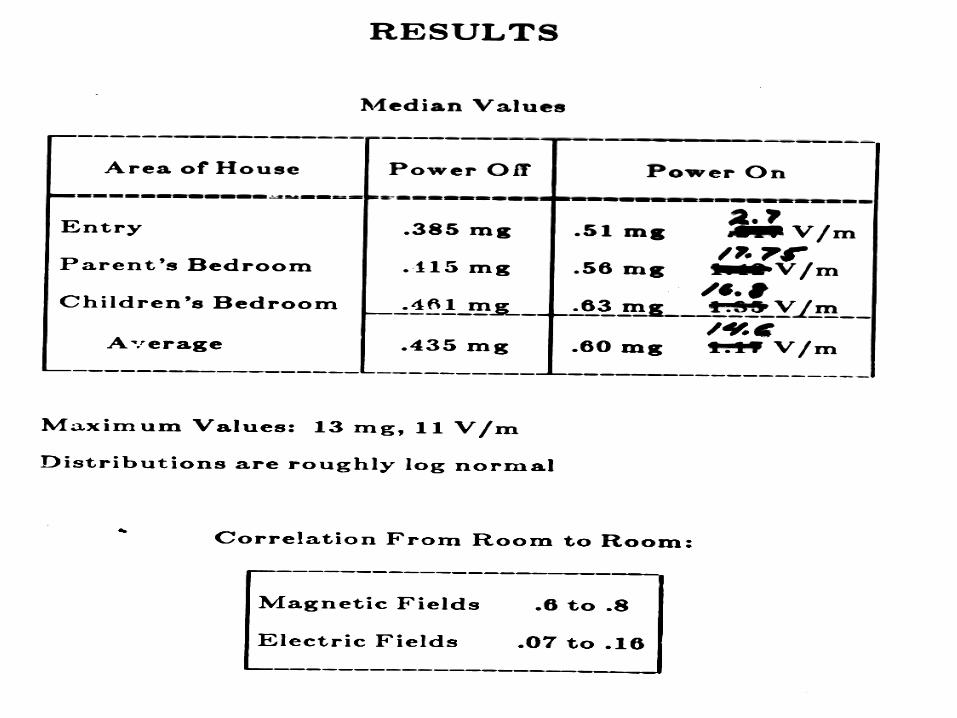
Measured Magnetic Fields in a House
• 1
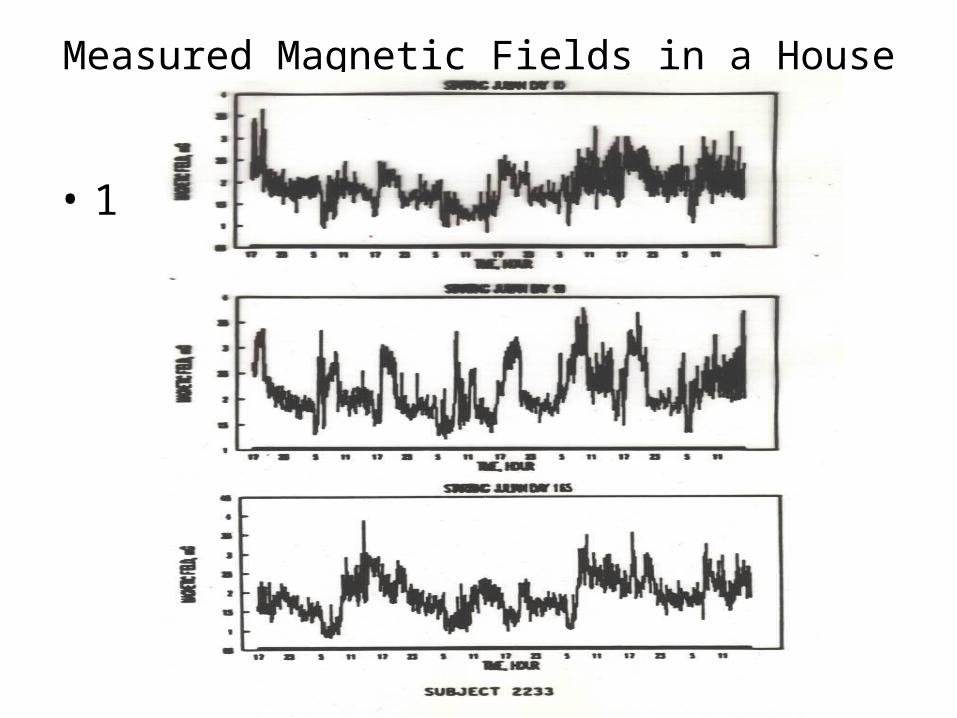
Magnetic Fields and Current in the Plumbing
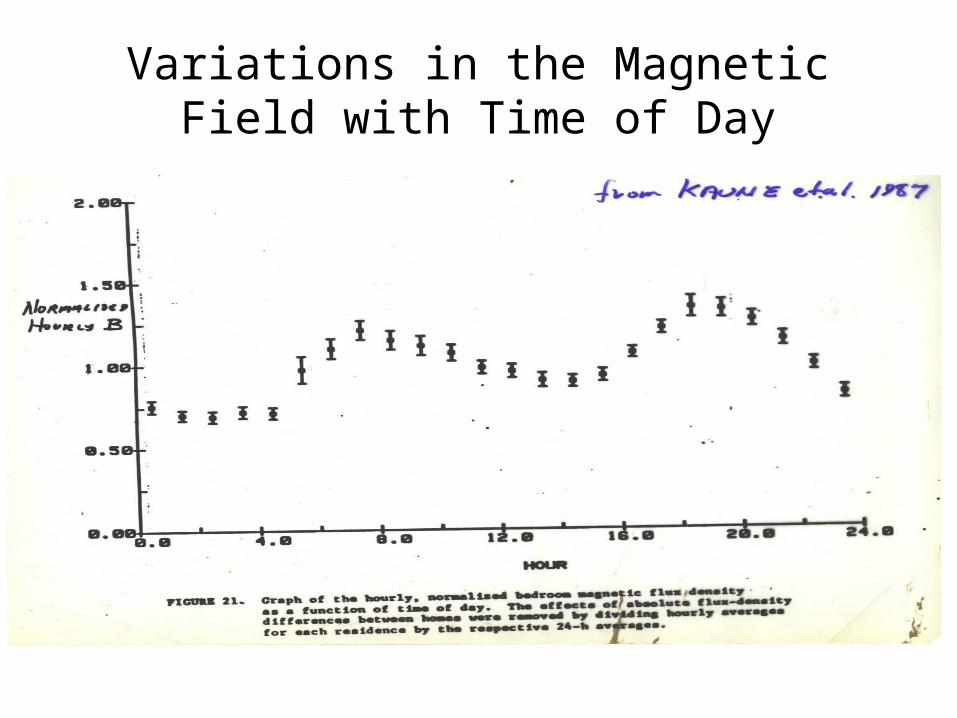
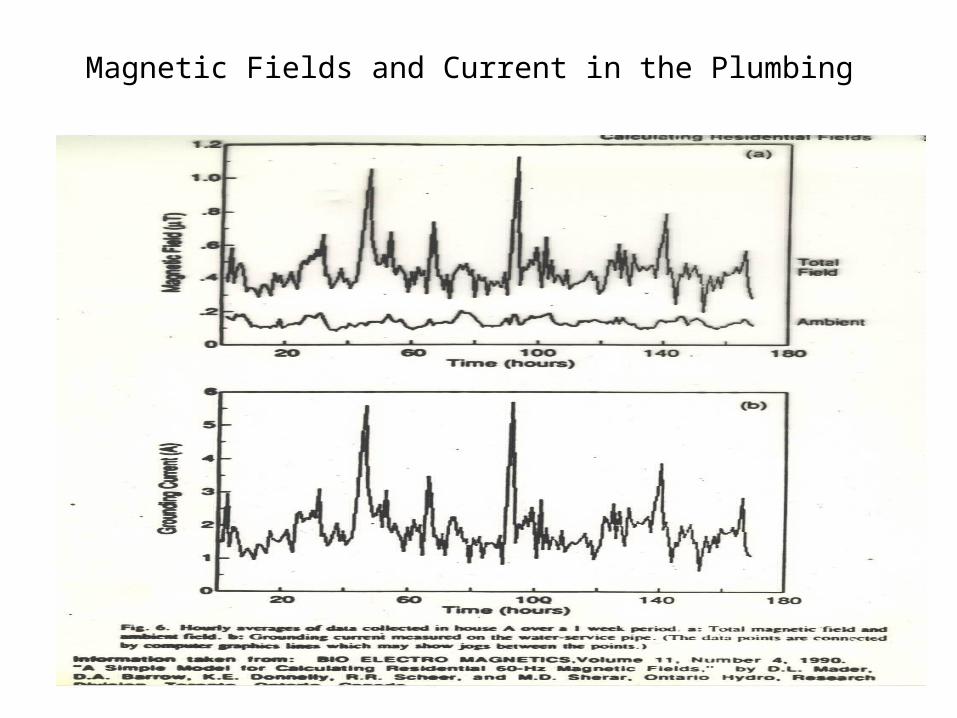
Variations in the Magnetic Field with Time of Day
• 1
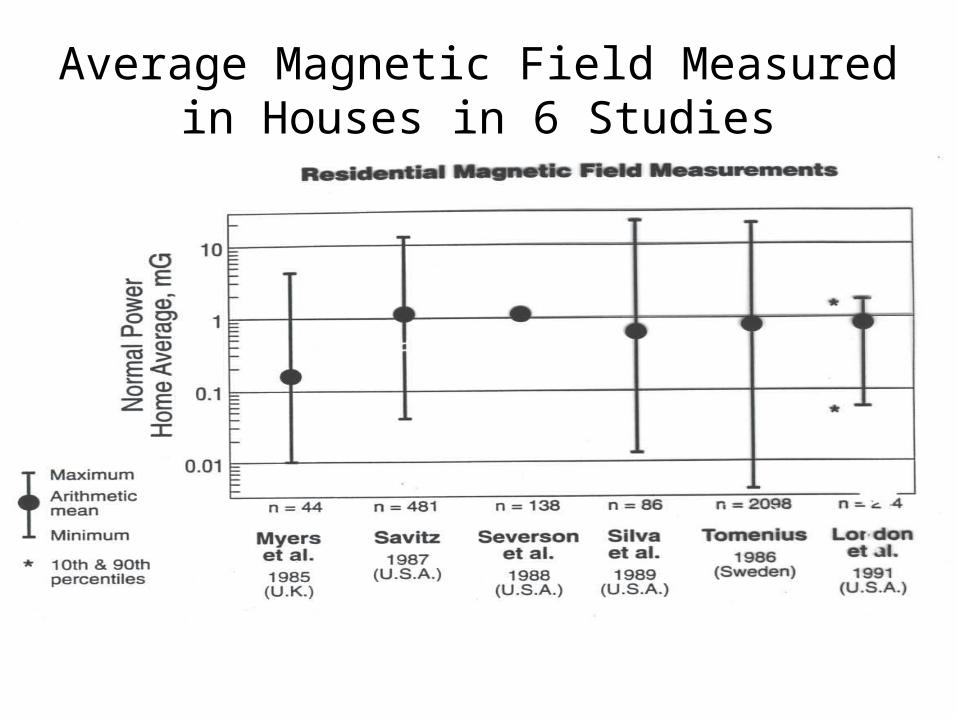
Average Magnetic Field Measured in Houses in 6 Studies
• 1
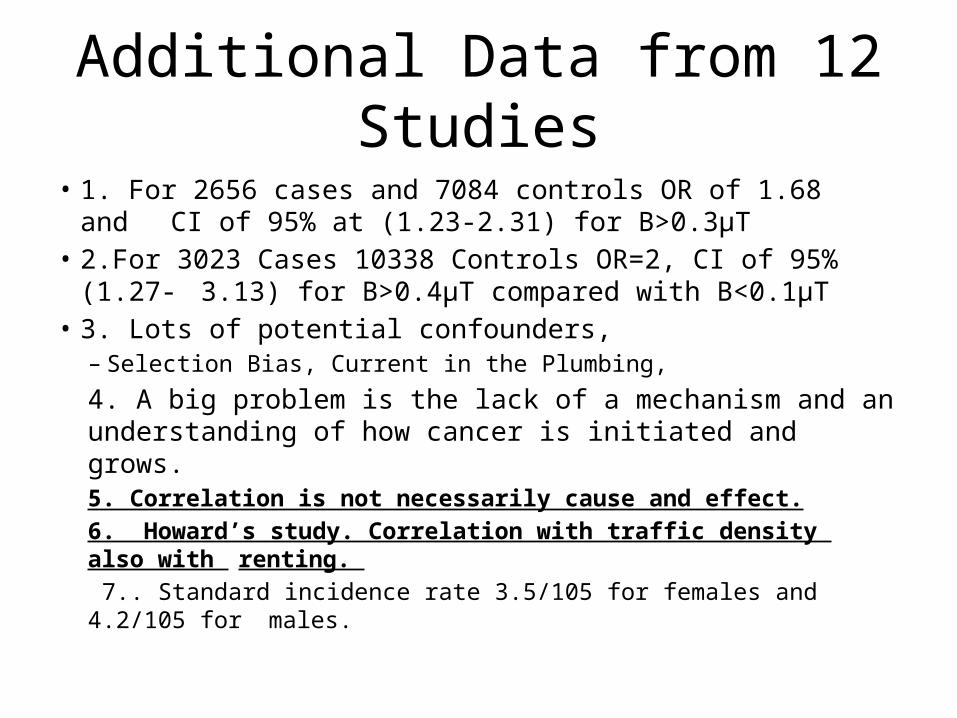
Additional Data from 12 Studies
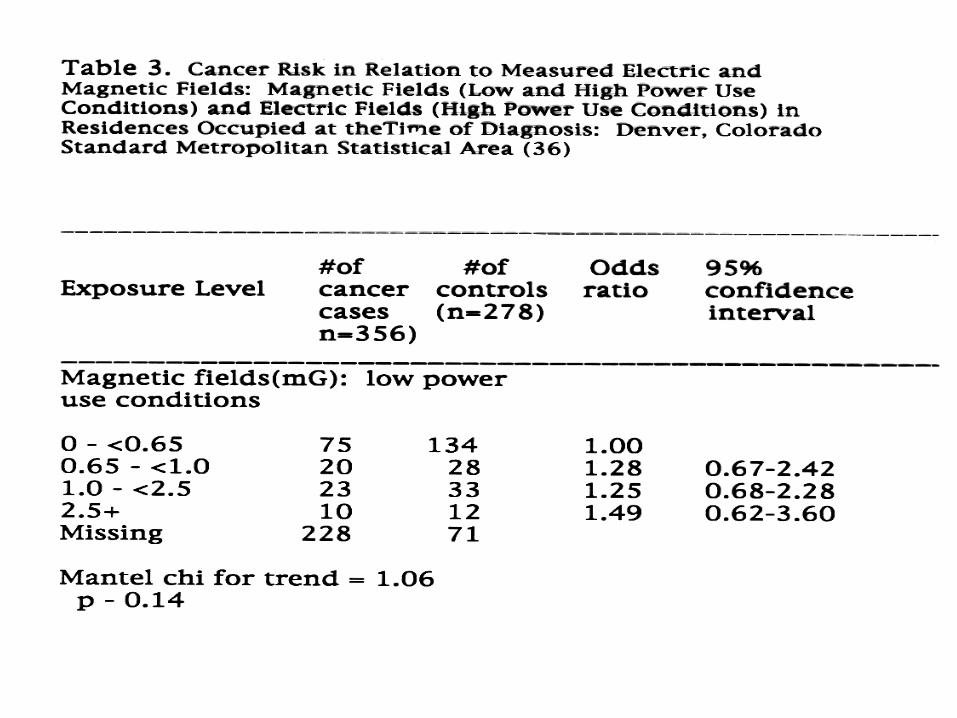
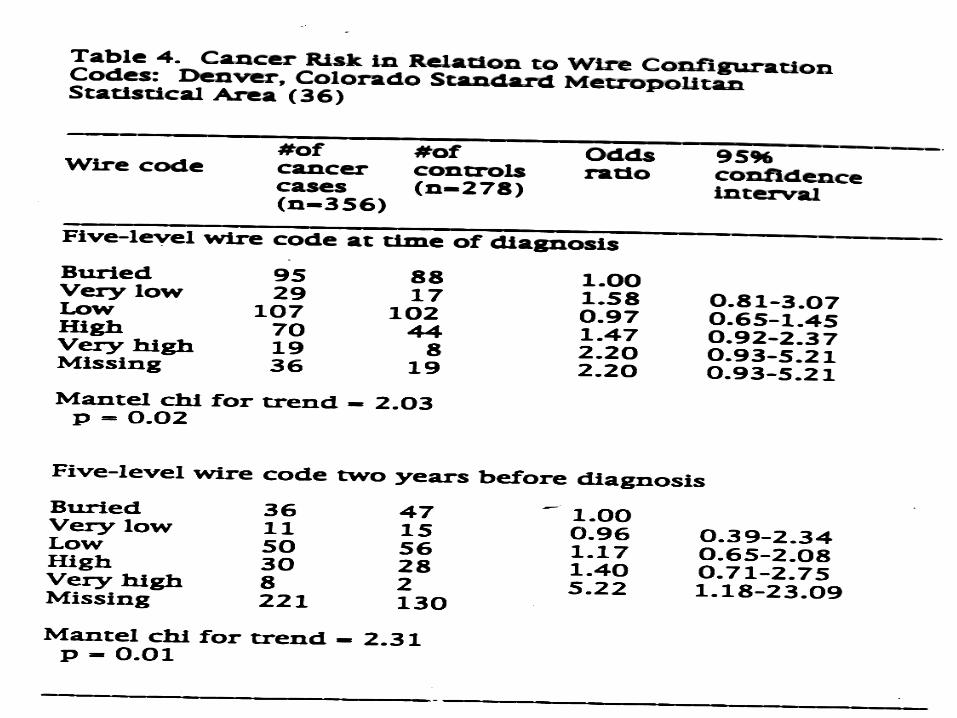
• 1. For 2656 cases and 7084 controls OR of 1.68 and CI of 95% at (1.23-2.31) for B>0.3µT
• 2.For 3023 Cases 10338 Controls OR=2, CI of 95% (1.27-3.13) for B>0.4µT compared with B<0.1µT
• 3. Lots of potential confounders, – Selection Bias, Current in the Plumbing,
4. A big problem is the lack of a mechanism and an understanding of how cancer is initiated and grows. 5. Correlation is not necessarily cause and effect.6. Howard’s study. Correlation with traffic density also with renting. 7.. Standard incidence rate 3.5/105 for females and 4.2/105 for males.
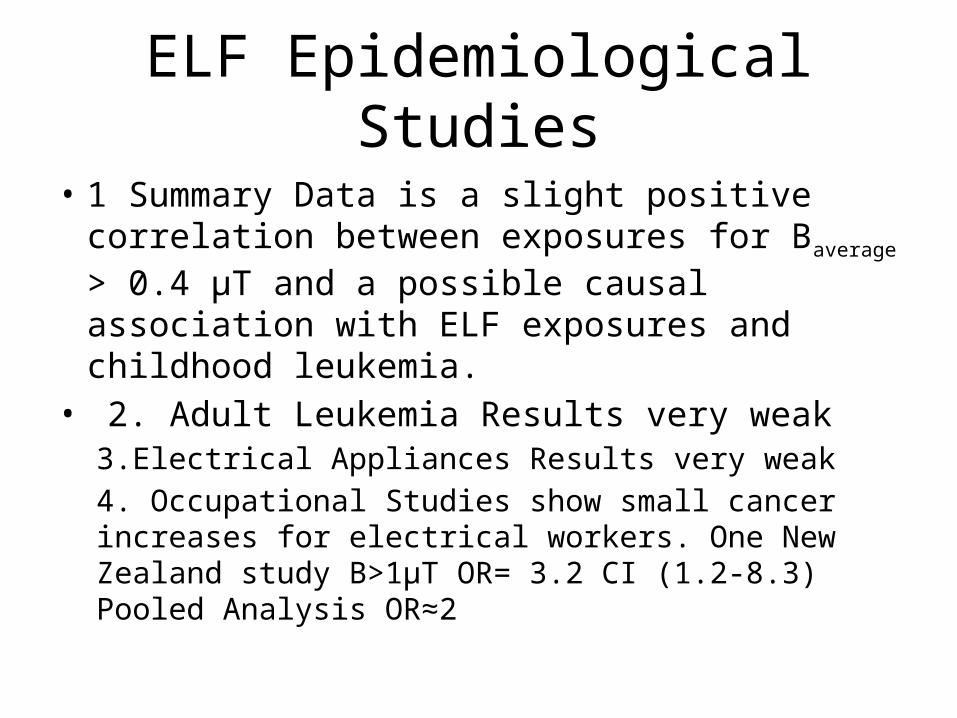
ELF Epidemiological Studies
• 1 Summary Data is a slight positive correlation between exposures for Baverage > 0.4 µT and a possible causal association with ELF exposures and childhood leukemia.
• 2. Adult Leukemia Results very weak 3.Electrical Appliances Results very weak4. Occupational Studies show small cancer increases for electrical workers. One New Zealand study B>1µT OR= 3.2 CI (1.2-8.3) Pooled Analysis OR≈2
Exam
• Test 2 April 10th. Cover Chapters 6,8,9,10 of book 1 Bioengineering and Biophysical Aspects of Electromagnetic Fields
• And 6,7,8,9,10 of Biological and Medical Aspects of Electromagnetic Fields
History for RF Concerns
• 1 Worries about Radar in the 1950s and 1960s– A. High Powers short pulses. 2. Radio and TV Stations
A. Long term low levels3. Only established mechanism is heating. 4. Long term low level effects if any are hard to establish. 5. Miss classification, exposures?, long latency, low incidences of disease
Current Issues
• 1. Cell phone transmitters,– A. Typical power about 100W/channel– B. Measured in Boulder Emax< 2V/m, P≈ 10mW/m2
or 1µW/cm2 • 2. Cell phones Radiation typically from
250mW to 600mW• 3. WiFi• 4. Some numbers for reference P=10W/m2,
E= 61.4V/m, B= 2.05x10⁻⁷T, H=0.163A/m
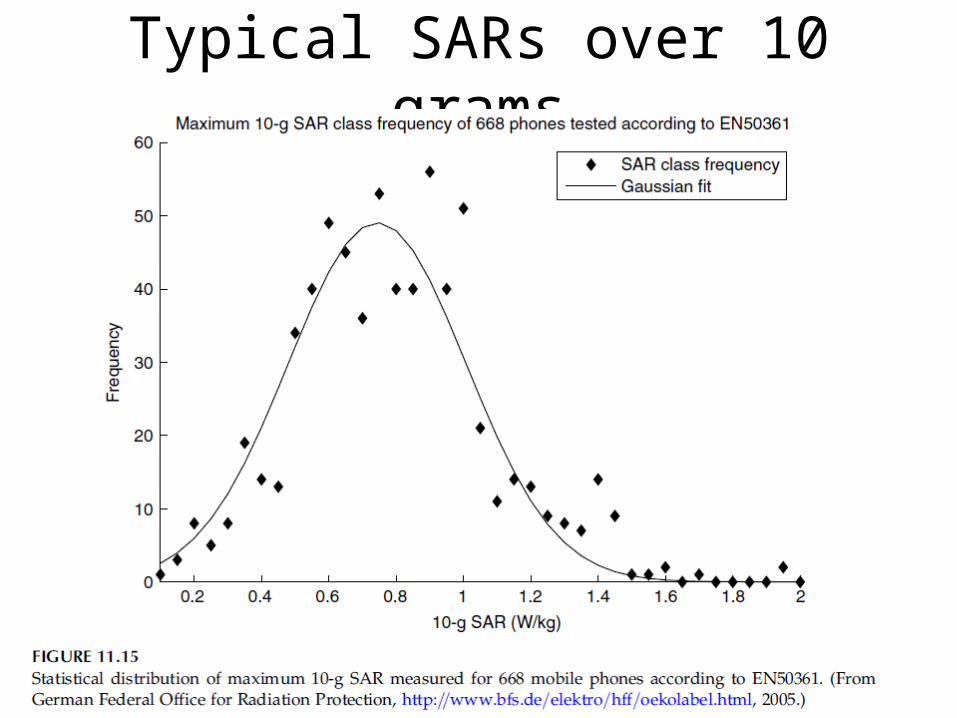
Typical SARs over 10 grams
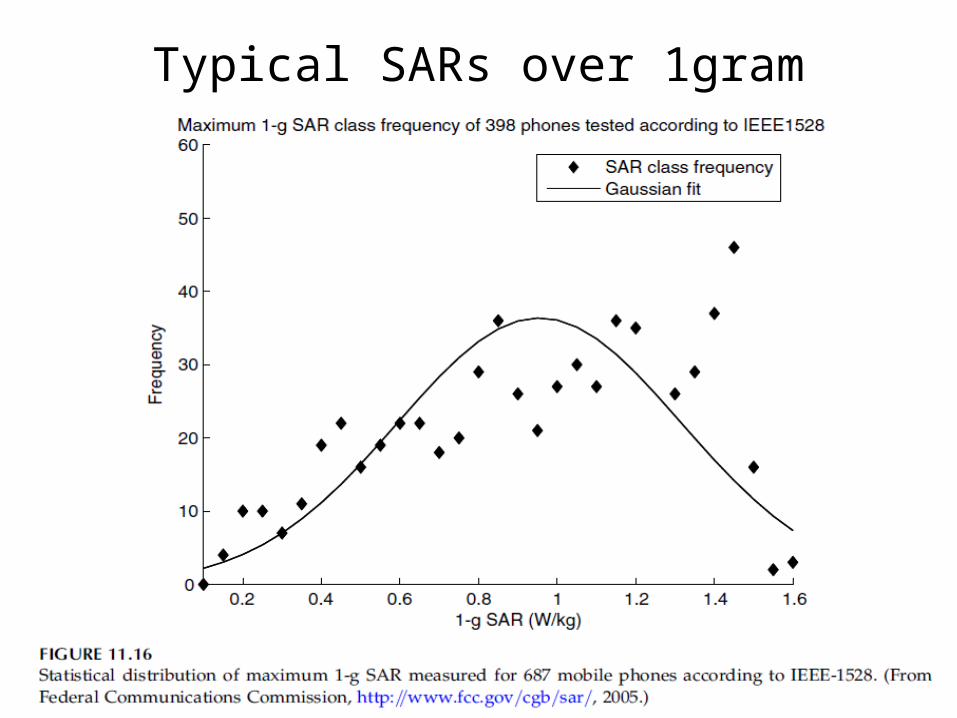
Typical SARs over 1gram
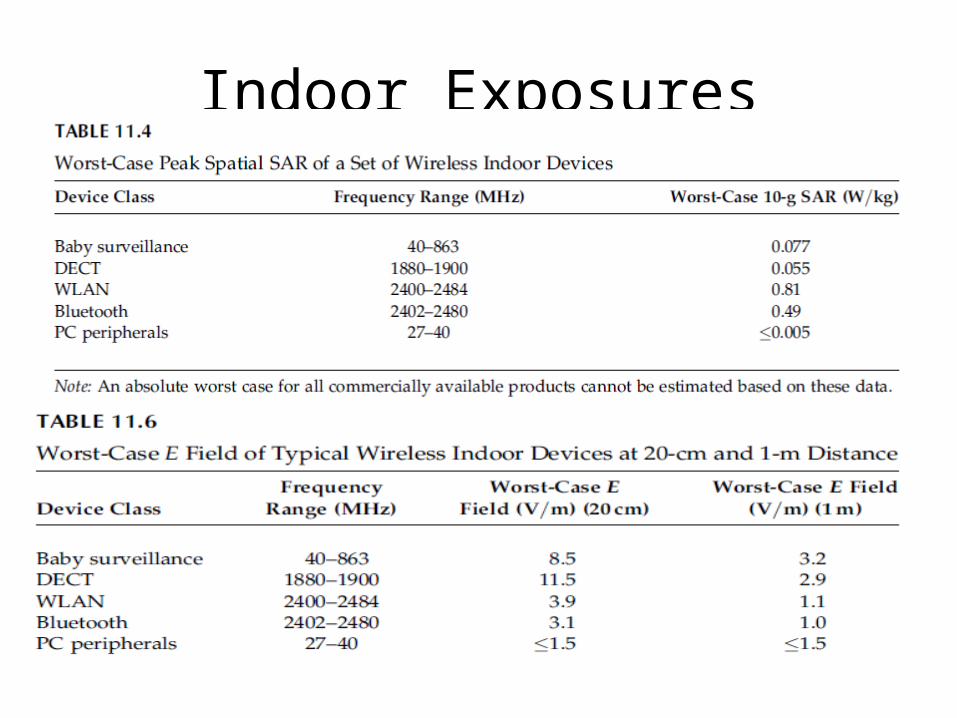
Indoor Exposures
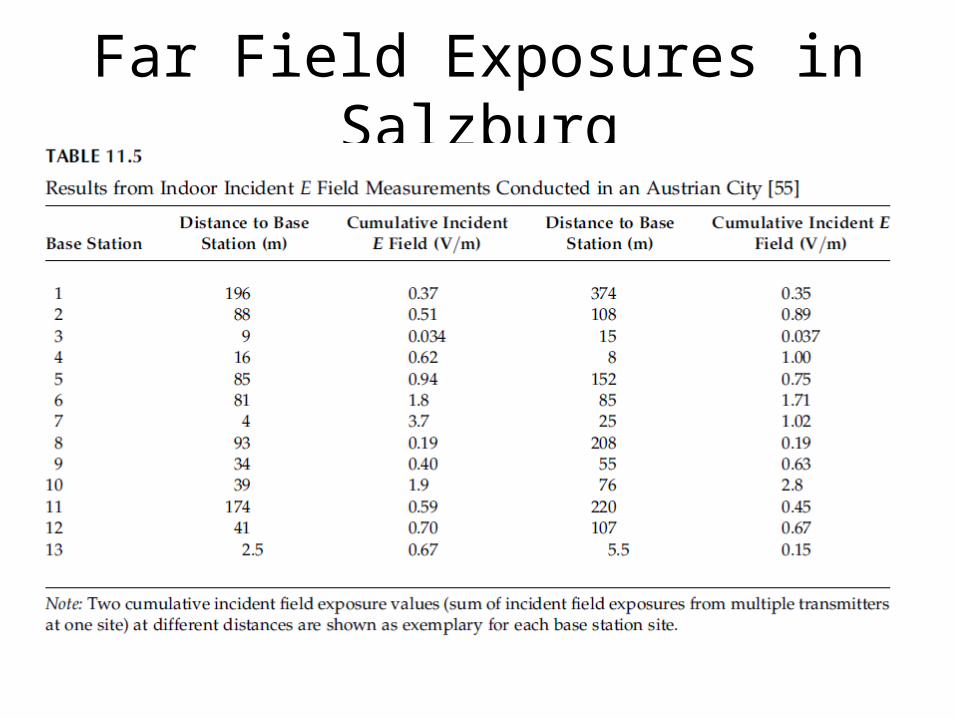
Far Field Exposures in Salzburg
RF Epidemiology Studies
• 1. Hardell L, Hallquist A, Mild KH, Carlberg M, Pahlson A, and Lilja A. Cellular and cordless telephones and the risk for brain tumors. Eur. J. Cancer Prev., 2002; 11(4):377–386.
• Hardell L, Nasman A, Pahlson A, Hallquist A, and Hansson Mild K. Use of cellular telephones and the risk for brain tumours: A case–control study. Int. J. Oncol ., 1999; 15(1):113–116.
• Inskip PD, Tarone RE, Hatch EE, Wilcosky TC, Shapiro WR, Selker RG, Fine HA, Black PM, Loeffler JS, and Linet MS. Cellular-telephone use and brain tumors. N. Engl. J. Med ., 2001; 344(2):79–86.
Early Studies
• 1. Hardell, Showed increased incidence of cancers on the side of the head where the phone was held.
• 2. No overall increase in rate. 80% of the Swedes had cell phones.
• 3. 7 studies show no effects. • 4. 2 US studies show nothing. Problem short
term exposures and long latency for the cancers.
Early Studies
• 1. I reviewed 20 studies and I found two I thought deserved farther investigation.
• 2. Most of the exposure data was weak and it was hard to separate the exposed from
the controls. • 3. The two occupational studies I reviewed
were not convincing.
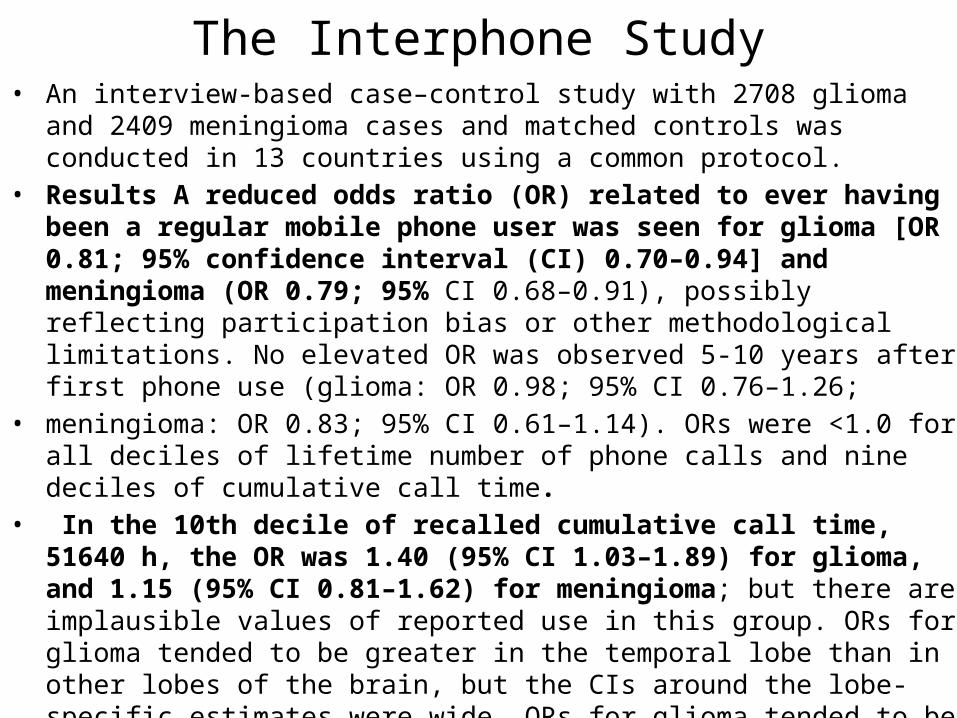
The Interphone Study• An interview-based case–control study with 2708 glioma and 2409 meningioma
cases and matched controls was conducted in 13 countries using a common protocol.
• Results A reduced odds ratio (OR) related to ever having been a regular mobile phone user was seen for glioma [OR 0.81; 95% confidence interval (CI) 0.70–0.94] and meningioma (OR 0.79; 95% CI 0.68–0.91), possibly reflecting participation bias or other methodological limitations. No elevated OR was observed 5-10 years after first phone use (glioma: OR 0.98; 95% CI 0.76–1.26;
• meningioma: OR 0.83; 95% CI 0.61–1.14). ORs were <1.0 for all deciles of lifetime number of phone calls and nine deciles of cumulative call time.
• In the 10th decile of recalled cumulative call time, 51640 h, the OR was 1.40 (95% CI 1.03–1.89) for glioma, and 1.15 (95% CI 0.81–1.62) for meningioma; but there are implausible values of reported use in this group. ORs for glioma tended to be greater in the temporal lobe than in other lobes of the brain, but the CIs around the lobe-specific estimates were wide. ORs for glioma tended to be greater in subjects who reported usual phone use on the same side
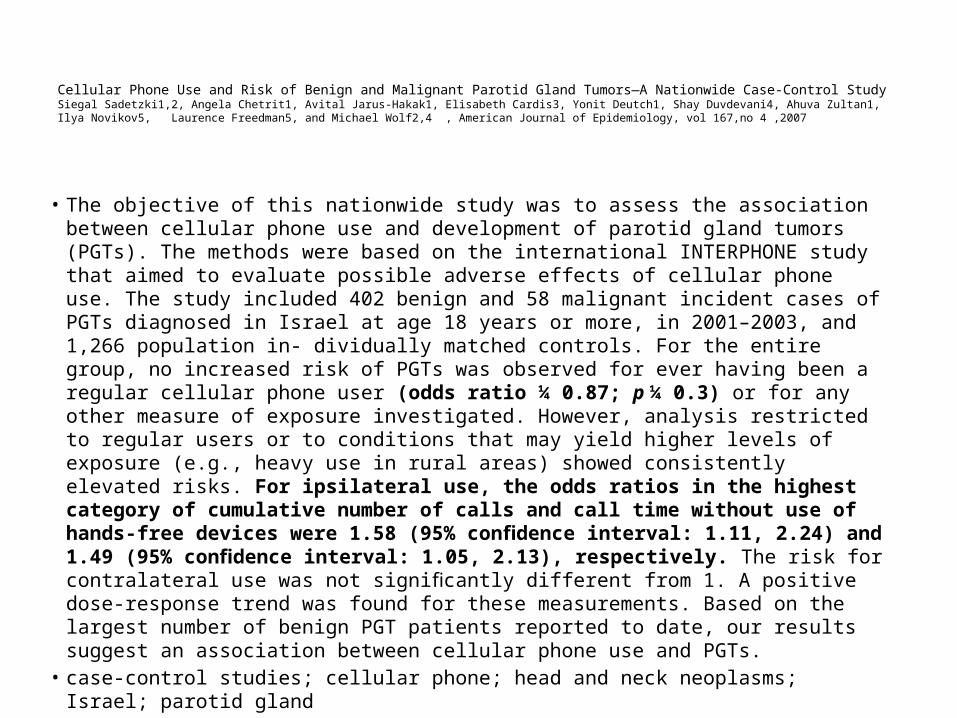
Cellular Phone Use and Risk of Benign and Malignant Parotid Gland Tumors—A Nationwide Case-Control StudySiegal Sadetzki1,2, Angela Chetrit1, Avital Jarus-Hakak1, Elisabeth Cardis3, Yonit Deutch1, Shay Duvdevani4, Ahuva Zultan1, Ilya Novikov5, Laurence Freedman5, and Michael Wolf2,4 , American Journal of Epidemiology, vol 167,no 4 ,2007
• The objective of this nationwide study was to assess the association between cellular phone use and development of parotid gland tumors (PGTs). The methods were based on the international INTERPHONE study that aimed to evaluate possible adverse effects of cellular phone use. The study included 402 benign and 58 malignant incident cases of PGTs diagnosed in Israel at age 18 years or more, in 2001–2003, and 1,266 population in- dividually matched controls. For the entire group, no increased risk of PGTs was observed for ever having been a regular cellular phone user (odds ratio ¼ 0.87; p ¼ 0.3) or for any other measure of exposure investigated. However, analysis restricted to regular users or to conditions that may yield higher levels of exposure (e.g., heavy use in rural areas) showed consistently elevated risks. For ipsilateral use, the odds ratios in the highest category of cumulative number of calls and call time without use of hands-free devices were 1.58 (95% confidence interval: 1.11, 2.24) and 1.49 (95% confidence interval: 1.05, 2.13), respectively. The risk for contralateral use was not significantly different from 1. A positive dose-response trend was found for these measurements. Based on the largest number of benign PGT patients reported to date, our results suggest an association between cellular phone use and PGTs.
• case-control studies; cellular phone; head and neck neoplasms; Israel; parotid gland

Mechanisms
1. Direct Electric Field Effects with High Power Short Pulses. Membrane Damage
2. Heating, RF3. Drift Currents and Dielectrophoresis4. Change in Free Radical Lifetimes and
Chemical Reaction Rates5. A Mechanism for Long Exposures at
Low Levels?
RF Standards
• 1. Some History back to the 50’s and radar, TV, Radio
• 2. Results from injury at high levels and short time exposures.
• 3. Different Philosophies Lead to different numbers. U.S at the highest level not known to be dangerous and a safety factor.
• 4. Heating at 60mW/cm2 shows damage Standard set at 10mW/cm2 then up dated.
• 5. USSR Standard set at 10µW/cm2
RF Standards For Exposures• 1. Types of Standards– A. Voluntary – B. Government Mandated – .C. Different Philosophies and Enforcement 2. Emission Standards, Microwave Ovens, Cell Phones Radio and TV stations, can be set for multiple reasons.3. Exposure Standards may be different for different
groups of people. Children, Workers, General Public etc. Based on known damage?
Precautionary principle?
Multinational and National Standards Bodies• 1, WHO, world health organization works to harmonize
standards • 2. International Commission on Non Ionizing Radiation
Protection (ICNIRP) evaluates evidence and advises on exposure limits. Non industrial members. These recommendations are used by most of Europe and Asia
• 4. IEEE C95.1 RF, C95.6 ELF , ANSI, Open to all including industry. Set other interoperability standards.
• 5. Local governments may impose lower limits. California, Salzburg
Objective is to Protect Health
• 1. This comes down to questions of relative risk. We do not live in a safe world!!
• 2. How much risk to you let people take on themselves and when to your have governments or industry set the standards.
• 3. Issue with electro sensitive people.
Standards Body Approach
• 1. Review of Literature • 2. Check for good dosimetry.• 3. Weight of evidence. • 4. Establish Thresholds + Safety Factor• 5. Evaluate and present for public review.• 6. Current limit protect against short term
acute effects.
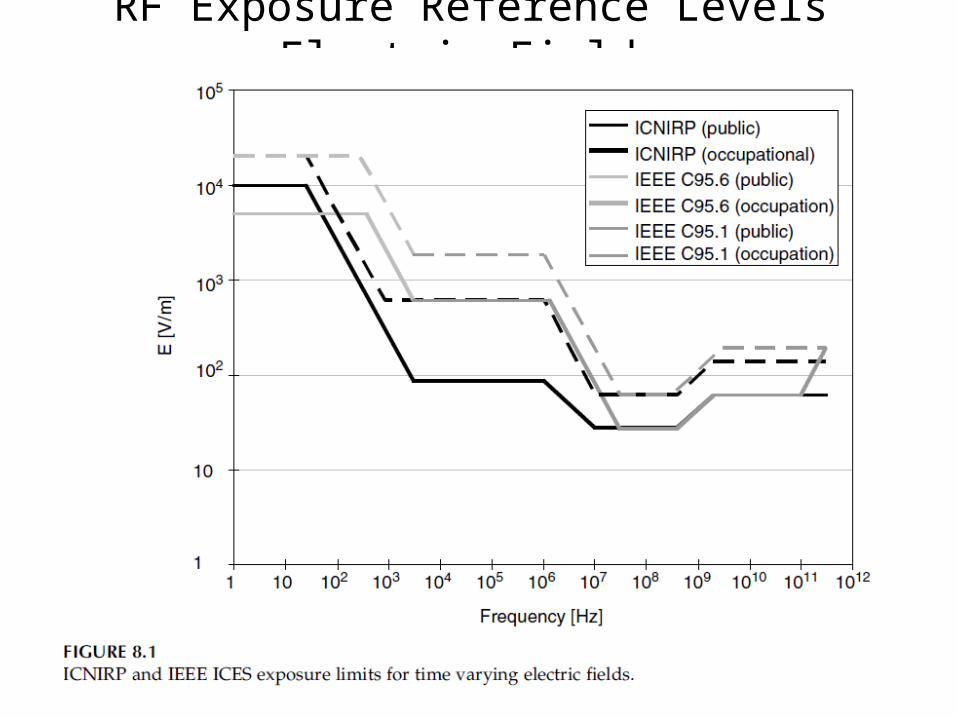
RF Exposure Reference Levels Electric Fields
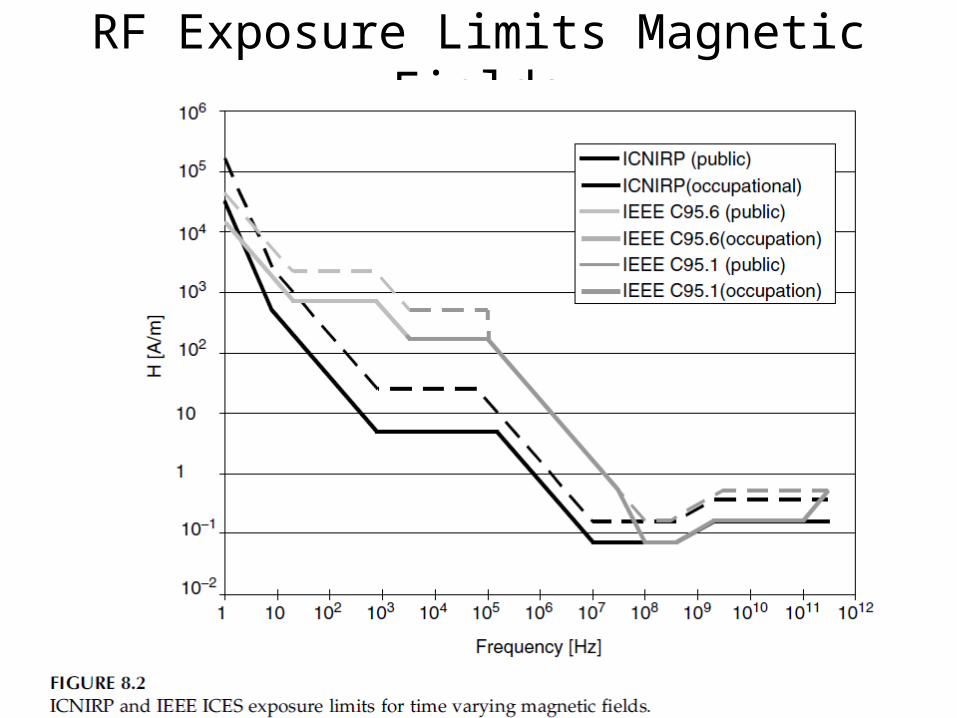
RF Exposure Limits Magnetic Fields
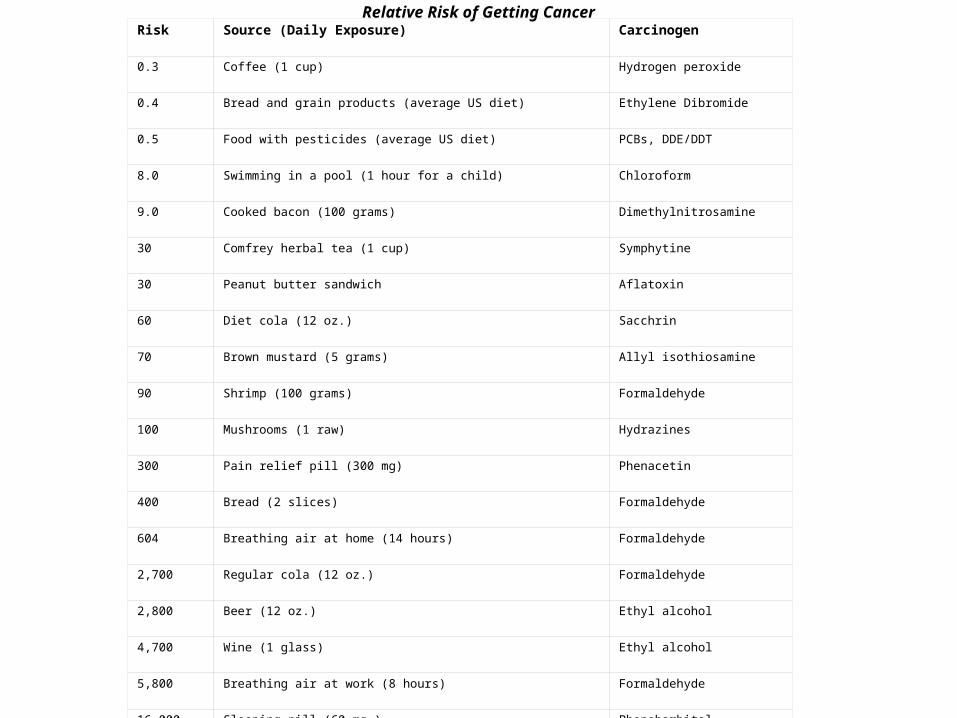
Relative Risk of Getting CancerRisk Source (Daily Exposure) Carcinogen
0.3 Coffee (1 cup) Hydrogen peroxide
0.4 Bread and grain products (average US diet) Ethylene Dibromide
0.5 Food with pesticides (average US diet) PCBs, DDE/DDT
8.0 Swimming in a pool (1 hour for a child) Chloroform
9.0 Cooked bacon (100 grams) Dimethylnitrosamine
30 Comfrey herbal tea (1 cup) Symphytine
30 Peanut butter sandwich Aflatoxin
60 Diet cola (12 oz.) Sacchrin
70 Brown mustard (5 grams) Allyl isothiosamine
90 Shrimp (100 grams) Formaldehyde
100 Mushrooms (1 raw) Hydrazines
300 Pain relief pill (300 mg) Phenacetin
400 Bread (2 slices) Formaldehyde
604 Breathing air at home (14 hours) Formaldehyde
2,700 Regular cola (12 oz.) Formaldehyde
2,800 Beer (12 oz.) Ethyl alcohol
4,700 Wine (1 glass) Ethyl alcohol
5,800 Breathing air at work (8 hours) Formaldehyde
16,000 Sleeping pill (60 mg.) Phenobarbital
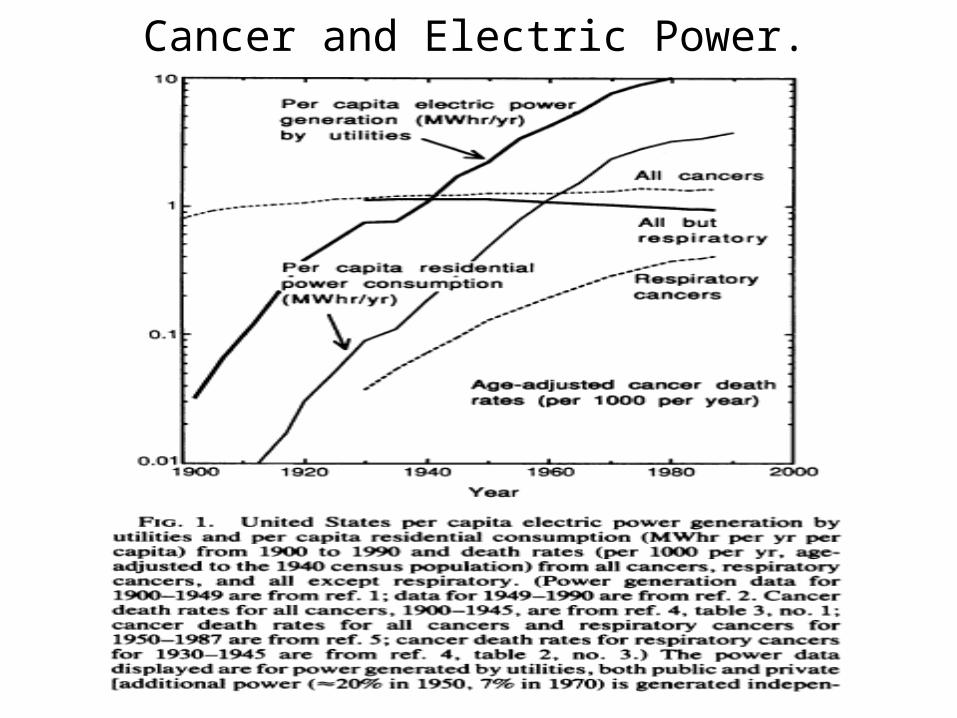
Cancer and Electric Power.
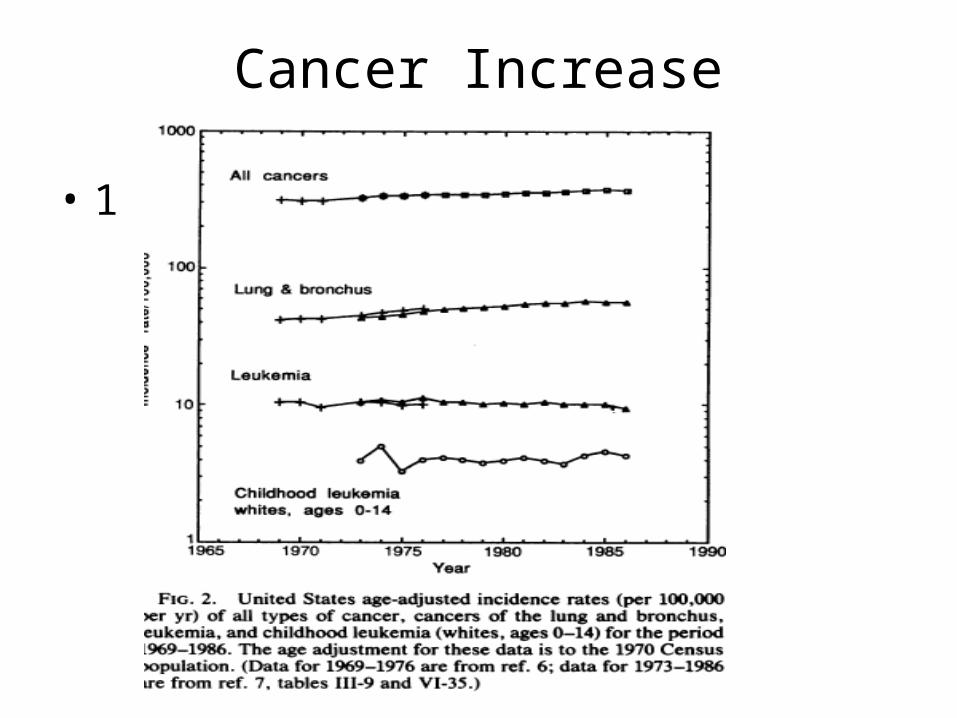
Cancer Increase
• 1
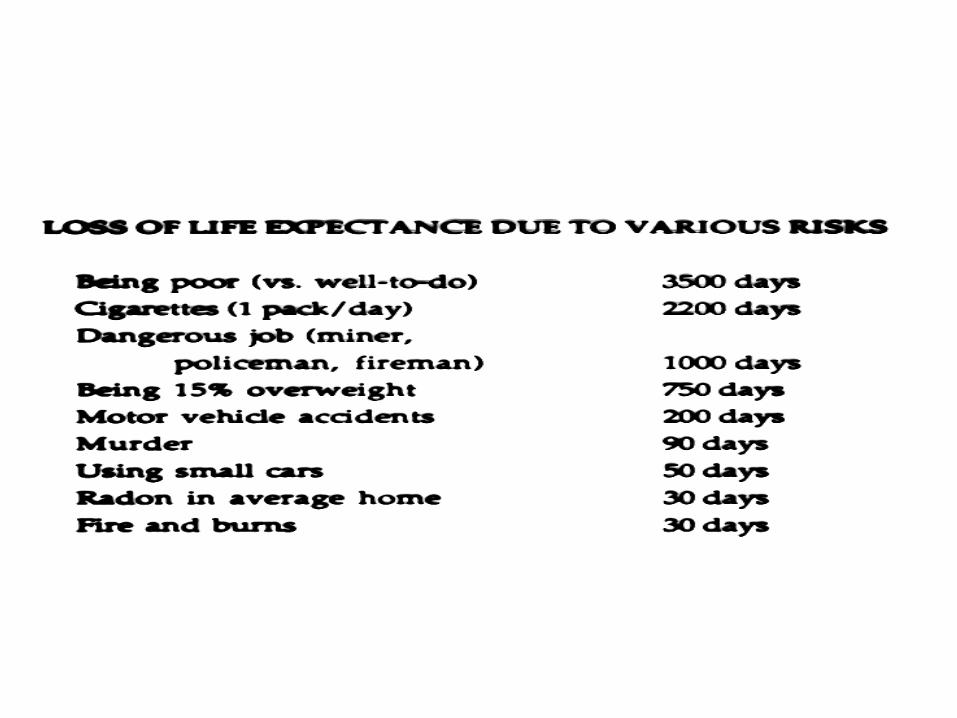
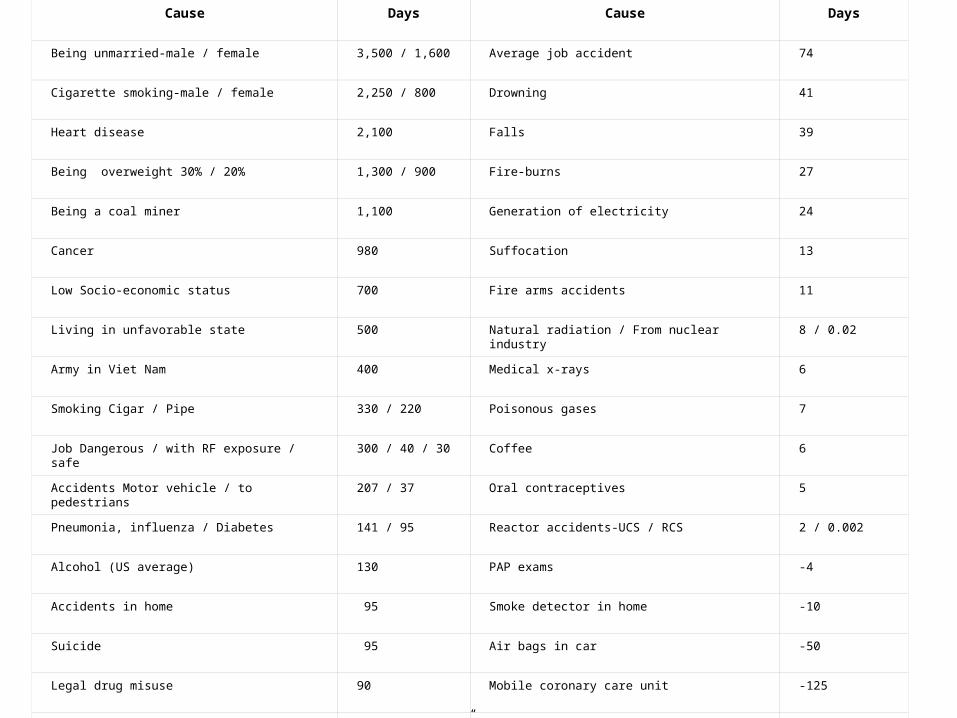
Loss of life expectancy and total number of lost days
Cause Days Cause Days
Being unmarried-male / female 3,500 / 1,600 Average job accident 74
Cigarette smoking-male / female 2,250 / 800 Drowning 41
Heart disease 2,100 Falls 39
Being overweight 30% / 20% 1,300 / 900 Fire-burns 27
Being a coal miner 1,100 Generation of electricity 24
Cancer 980 Suffocation 13
Low Socio-economic status 700 Fire arms accidents 11
Living in unfavorable state 500 Natural radiation / From nuclear industry 8 / 0.02
Army in Viet Nam 400 Medical x-rays 6
Smoking Cigar / Pipe 330 / 220 Poisonous gases 7
Job Dangerous / with RF exposure / safe 300 / 40 / 30 Coffee 6
Accidents Motor vehicle / to pedestrians 207 / 37 Oral contraceptives 5
Pneumonia, influenza / Diabetes 141 / 95 Reactor accidents-UCS / RCS 2 / 0.002
Alcohol (US average) 130 PAP exams -4
Accidents in home 95 Smoke detector in home -10
Suicide 95 Air bags in car -50
Legal drug misuse 90 Mobile coronary care unit -125
Average job accident 74 Safety improvement ‘66-’76 -110Source: Cohen, Bernard L. And Lee. I-sing, “A Catalog of Risks.” Health Physics (36) 707-722. 1979.
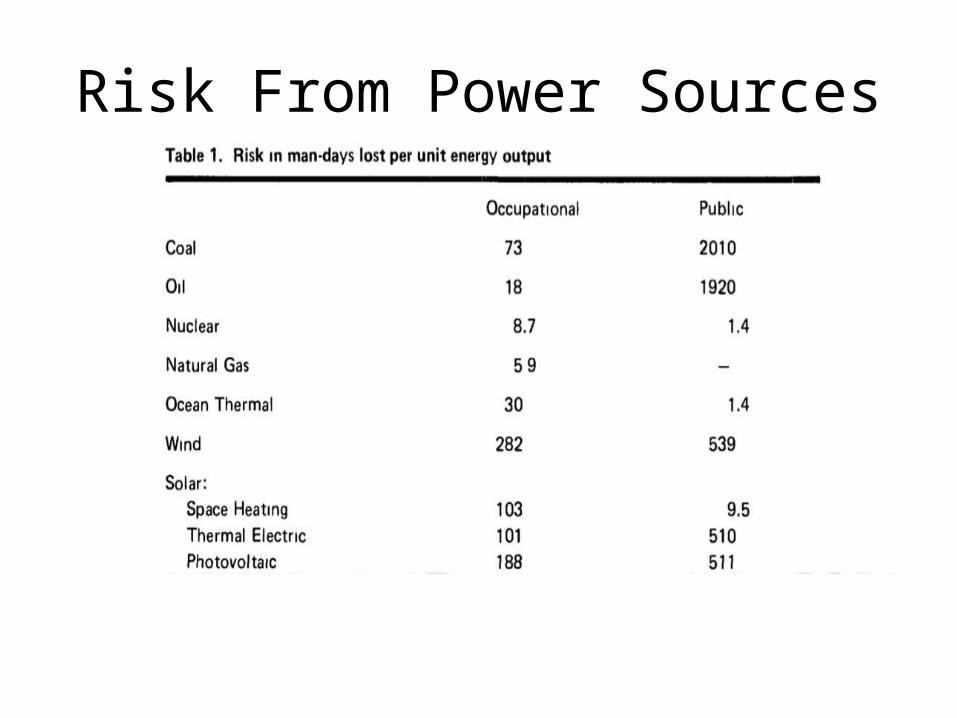
Risk From Power Sources
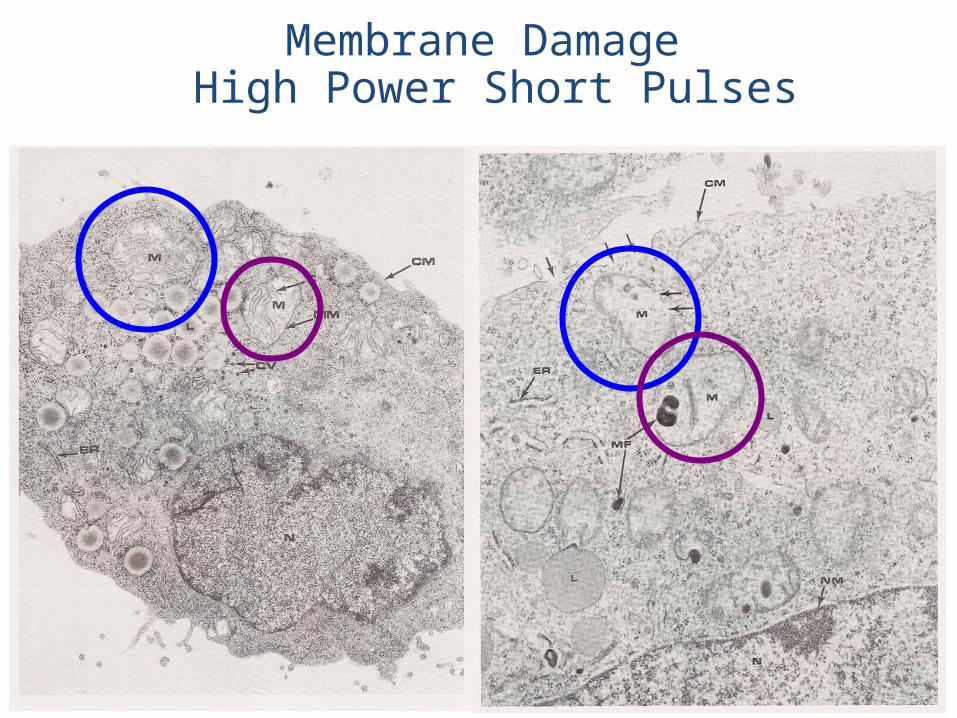
Membrane Damage High Power Short Pulses