Embed Size (px)
Citation preview
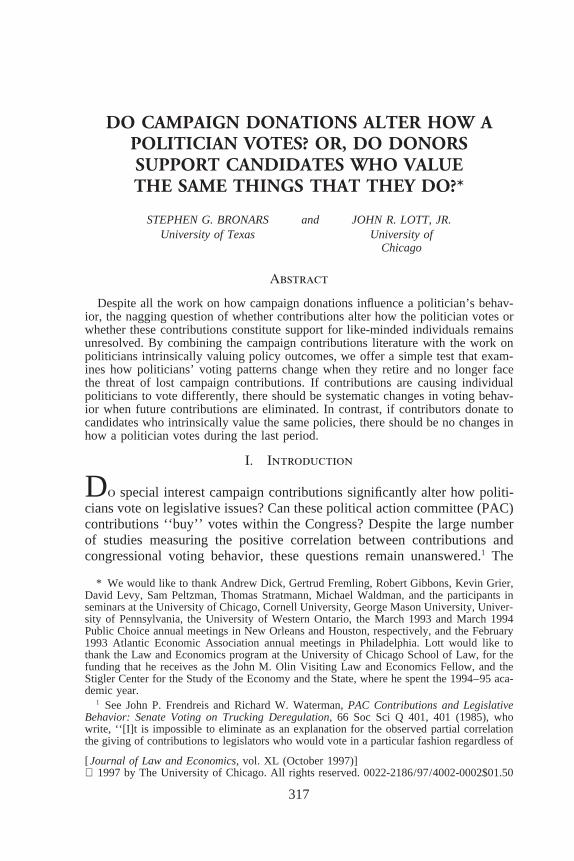
DO CAMPAIGN DONATIONS ALTER HOW APOLITICIAN VOTES? OR, DO DONORSSUPPORT CANDIDATES WHO VALUETHE SAME THINGS THAT THEY DO?*
STEPHEN G. BRONARS and JOHN R. LOTT, JR.University of Texas University of
Chicago
Abstract
Despite all the work on how campaign donations influence a politician’s behav-ior, the nagging question of whether contributions alter how the politician votes orwhether these contributions constitute support for like-minded individuals remainsunresolved. By combining the campaign contributions literature with the work onpoliticians intrinsically valuing policy outcomes, we offer a simple test that exam-ines how politicians’ voting patterns change when they retire and no longer facethe threat of lost campaign contributions. If contributions are causing individualpoliticians to vote differently, there should be systematic changes in voting behav-ior when future contributions are eliminated. In contrast, if contributors donate tocandidates who intrinsically value the same policies, there should be no changes inhow a politician votes during the last period.
I. Introduction
Do special interest campaign contributions significantly alter how politi-cians vote on legislative issues? Can these political action committee (PAC)contributions ‘‘buy’’ votes within the Congress? Despite the large numberof studies measuring the positive correlation between contributions andcongressional voting behavior, these questions remain unanswered.1 The
* We would like to thank Andrew Dick, Gertrud Fremling, Robert Gibbons, Kevin Grier,David Levy, Sam Peltzman, Thomas Stratmann, Michael Waldman, and the participants inseminars at the University of Chicago, Cornell University, George Mason University, Univer-sity of Pennsylvania, the University of Western Ontario, the March 1993 and March 1994Public Choice annual meetings in New Orleans and Houston, respectively, and the February1993 Atlantic Economic Association annual meetings in Philadelphia. Lott would like tothank the Law and Economics program at the University of Chicago School of Law, for thefunding that he receives as the John M. Olin Visiting Law and Economics Fellow, and theStigler Center for the Study of the Economy and the State, where he spent the 1994–95 aca-demic year.
1 See John P. Frendreis and Richard W. Waterman, PAC Contributions and LegislativeBehavior: Senate Voting on Trucking Deregulation, 66 Soc Sci Q 401, 401 (1985), whowrite, ‘‘[I]t is impossible to eliminate as an explanation for the observed partial correlationthe giving of contributions to legislators who would vote in a particular fashion regardless of
[Journal of Law and Economics, vol. XL (October 1997)] 1997 by The University of Chicago. All rights reserved. 0022-2186/97/4002-0002$01.50
317
318 the journal of law and economics
empirical evidence in these studies is equally consistent with the hypothesisthat interest groups contribute to and support politicians with similar inter-ests and ideologies to their own. These correlations do not represent consis-tent estimates of the effect of PAC contributions on voting behavior be-cause campaign contributions are endogenously determined by a number offactors, including a politician’s ideology.
This article attempts to assess the causal link between campaign contri-butions and a politician’s voting behavior by focusing on the effect ofchanges in campaign contributions during a politician’s last term in office.These changes in special interest contributions are largely determined by apolitician’s retirement decision and subject to less endogeneity between apolitician’s or a constituent’s preferences and contributions. In effect, weuse factors that influence politicians’ retirement decisions as instrumentalvariables in identifying the relationship between voting behavior and contri-butions.
The economics literature today generally accepts the claim that politi-
whether they received contributions.’’ Some early research has shown a large and statisticallysignificant association between PAC contributions and voting behavior on minimum wagelegislation (J. I. Silberman and G. C. Durden, Determining Legislative Preferences on theMinimum Wage: An Economic Approach, 84 J Pol Econ 317 (1976)), business and unionsand several regulatory bills (James B. Kau and Paul H. Rubin, Congressmen, Constituents,and Contributors: Determinants of Roll Call Voting in the House of Representatives (1982)),the American Trucking Association and trucking deregulation (Frendreis and Waterman, id),agricultural legislation (Thomas Stratmann, What Do Campaign Contributions Buy? Deci-phering Causal Effects of Money and Votes, 57 S Econ J 606 (1991)), and labor legislation(Sam Peltzman, Constituent Interest and Congressional Voting, 27 J L & Econ 181 (1984);Marick F. Masters, Congressional Support for Unions’ Positions across Diverse Legislation,9 J Lab Res 149 (1988)). Stratmann (id at 619) concludes that legislation that reduces PACcontributions to only $2,500 ‘‘would be insufficient’’ because contributions would still sig-nificantly affect the outcome of legislative votes. The continual introduction of new campaignreform legislation in Congress shows the general acceptance of this view. Other economistsand political scientists have found smaller though still statistically significant relationshipsbetween PAC contributions and voting patterns for a number of areas: a cargo preferencebill (Henry W. Chappell, Jr., Campaign Contributions and Voting on the Cargo PreferenceBill: A Comparison of Simultaneous Models, 36 Pub Choice 301 (1981)), dairy price supports(W. P. Welch, Campaign Contributions and Legislative Voting: Milk Money and Dairy PriceSupports, 35 W Pol Q 478 (1982)), auto emissions standards, defense appropriations, andtruck weight limit regulations (Henry W. Chappell, Jr., Campaign Contributions and Con-gressional Voting: A Simultaneous Probit-Tobit Model, 64 Rev Econ & Stat 77 (1982)). Pa-pers by James W. Endersby and Michael C. Munger, The Impact of Legislator Attributes onUnion PAC Campaign Contributions, 13 J Lab Res 79 (1992); and Kevin Grier and MichaelMunger, The Impact of Legislator Attributes on Interest-Group Campaign Contributions, 7J Lab Res 347 (1986), have attempted to explain which candidates receive labor union contri-butions. They find that being on a legislative committee with jurisdiction over the activitiesthat affect a union and supporting the union’s positions are positively related to union cam-paign contributions. Others claim that increased access from these contributions must trans-late into tangible service (Richard L. Hall and Frank W. Wayman, Buying Time: MoneyedInterests and the Mobilization of Bias in Congressional Committees, 84 Am Pol Sci Rev 797(1990)).
campaign donations 319
cians intrinsically value policy outcomes.2 The most recent debate has beennot over whether politicians have such ideological preferences but whethervoters can successfully sort into office those politicians whose preferencescoincide with the voters’. If sorting is successful, politicians will continuerepresenting their constituents’ desires even when the threat of reelection isremoved during their last term. To the extent that these preferences do notperfectly match, politicians will deviate from constituent interests when thecosts of shirking decline. Likewise, if campaign contributions are made tosupport those politicians who already value the same positions as their do-nors, there should be no change in voting patterns after campaign contribu-tions stop during a politician’s last term in office.3
Both the ‘‘ideological sorting’’ and the ‘‘vote-buying’’ hypotheses areconsistent with a positive correlation between PAC contributions and votingbehavior. However, the ‘‘sorting’’ theory predicts that politicians will notalter their last-period behavior, whereas the vote-buying hypothesis predictsthe opposite—campaign contributions are only ‘‘rational’’ when they alterhow an individual politician votes on an issue.4 If campaign contributions
2 John R. Lott, Jr., and W. R. Reed, Shirking and Sorting in a Model of Finite-Lived Politi-cians, 61 Pub Choice 75 (1989), provide a formal model of this type of sorting by voters. Itis possible to replace voters with donors in that model without any loss of generality. For asurvey of the empirical work on shirking and sorting questions, see Bruce Bender and JohnR. Lott, Jr., Legislator Voting and Shirking: A Critical Review of the Literature, Pub Choice(in press). Sorting can also be done by the politicians themselves. D. C. Coker and W. MarkCrain, Legislative Committees as Loyalty-Generating Institutions, 81 Pub Choice 195 (1994),show that House members demonstrating more loyalty to the party leaders obtain more im-portant committee assignments. See also W. Mark Crain, Donald R. Leavens, and Robert D.Tollison, Final Voting in Legislatures, 76 Am Econ Rev 833 (1986).
3 While such evidence would also be consistent with voters and donors having no controlover politicians, there are fortunately other studies on another dimension of shirking—howfrequently representatives vote during their last term—which can help differentiate these twoexplanations. If politicians are already shirking as much as they desire prior to their last termin office, the last term should produce no changes in either how frequently they vote or howthey vote when they do vote. However, if politicians value both policies and leisure, the ideo-logical sorting hypothesis predicts changes in attendance rates even when there are nochanges in how a politician votes. Politicians in their last term will continue to vote for whatthey believe in, but since they no longer obtain the additional return of larger future support,they just vote less often (John R. Lott, Jr., Political Cheating, 52 Pub Choice 169 (1987)).
4 See, for example, Chappell, Campaign Contributions and Congressional Voting (citedin note 1); and Thomas Stratmann, Are Contributors Rational? Untangling Strategies of Po-litical Action Committees, 100 J Pol Econ 647 (1992). Correlations between donations andperformance do not imply anything about the effect PAC contributions have on an individualpolitician’s voting behavior. Nor does examining whether contributions are made to commit-tee heads help solve this problem. Campaign contributions may be directed toward those inimportant positions because the value of returning politicians to office who share your politi-cal ideology is highest for the most important positions, and not because of a greater expectedreturn to changing those politicians’ positions on political issues. However, even after ad-dressing the question of causation, there is still the difficulty of determining the significanceof these findings. For example, why are contributors not included as part of a politician’s
320 the journal of law and economics
‘‘buy’’ ideological politicians’ votes, causing them to deviate from theirpreferred positions, their voting patterns should diverge from contributors’interests during their last term in office when the threatened loss of futurecampaign donations is reduced or eliminated.
The following sections test whether politicians receiving campaign con-tributions from particular special interest groups change their voting behav-ior between their second to last and last terms in office relative to those whohad never received that group’s campaign contributions. We first examine ifany patterns emerge in comparing the simple changes between periods andthen see if any relationships appear after controlling for other effects—suchas how a politician’s behavior varies over his life cycle. Only a few papersthat test whether politicians have a personal ideology include measures ofcampaign contributions,5 and none of these papers addresses the questionof causality we discuss here. Section V tests for whether it was easier to‘‘buy off’’ congressmen when they were still able to retain unused cam-paign funds for personal use. Finally, Section VI examines whether a con-gressman’s last 2 years in the House of Representatives really constituteshis last term in any meaningful sense by controlling for what the politicianand his offspring did after he left office. Interest groups may compensatepoliticians after they leave elective office through future employment op-portunities for either themselves or their children.
II. A First Look at the Evidence
This article identifies whether politicians’ voting behavior changes be-tween their second to last and last terms in office relative to those who hadnever received a special interest group’s campaign contributions.6 Our em-
relevant constituency? As John R. Wright, PAC Contributions, Lobbying, and Representa-tion, 51 J Pol 713, 726 (1989), points out, ‘‘Members of Congress seldom experience finan-cial pressures and lobbying pressures from groups that have little or no economic or organi-zational claims in their districts.’’ While the access that politicians provide donors maychange political outcomes, instead of ‘‘buying’’ votes, such access may simply assist politi-cians in better representing the constituents from their own district with the most intensepreferences. (See Harold Demsetz, Efficiency, Competition, and Policy (Blackwell, 1989), fora further discussion on the question of what is the relevant constituency for politicians.)
5 See James B. Kau, Donald Keenan, and Paul H. Rubin, A General Equilibrium Modelof Congressional Voting, 97 Q J Econ 271 (1982); Rodney Fort, William Hallagan, CyrilMorong, and Tesa Stegner, The Ideological Component of Senate Voting: Different Princi-ples or Different Principals? 76 Pub Choice 39 (1993); James B. Kau and Paul H. Rubin,Ideology, Voting, and Shirking, 76 Pub Choice 151 (1993).
6 See also John R. Lott, Jr., and Michael L. Davis, A Critical Review and an Extension ofthe Political Shirking Literature, 74 Pub Choice 461 (1992); and John R. Lott, Jr., and Ste-phen G. Bronars, Time Series Evidence on Shirking in the U.S. House of Representatives, 76Pub Choice 125 (1993), for a more complete discussion of this type of analysis.
campaign donations 321
phasis on changes in donations and voting, rather than the correlation be-tween the levels of these variables, recognizes that it is rational for PACsto allocate their funds to their highest valued use. These PAC contributionsare likely to have the greatest effect on election outcomes in districts wherethe contest is expected to be close. Hence PAC contributions are likely toflow to candidates for open seats and in ‘‘competitive’’ districts, not neces-sarily to the strongest advocate of the special interest. In addition, becausePACs are interested in producing majorities and not unanimity, contribu-tions are directed toward politicians representing relatively indifferent con-stituencies.7 Thus our approach identifies changes in contributions to politi-cians in their last term whose voting behavior was most likely to have beenaltered by the campaign contributions throughout their careers.
The data are primarily limited to members of the House of Representa-tives who served in office from 1977 to 1990. Additional data on campaigncontributions are available from the Federal Election Commission back to1975, though they are not disaggregated by the source of the donation for1975 and 1976. We use this additional aggregate data only in Section III,where we examine data reporting on politicians’ careers after leaving theHouse of Representatives. Because our empirical analysis focuses onchanges in a politician’s voting over time, we typically limit our sample tothe 661 congressmen who held office for at least 2 terms between 1977 and1990. These congressmen accounted for 94.5 percent of the terms servedduring that period.8 By 1990, 285 of these multiterm congressmen had leftthe House through retirement (91), to seek another office (97), or by losingtheir bid for reelection (97).9 In Section IV, where our empirical analysisfocuses on how aggregate PAC contributions change, our sample includesthe 731 multiterm congressmen who held office between 1975 and 1990.
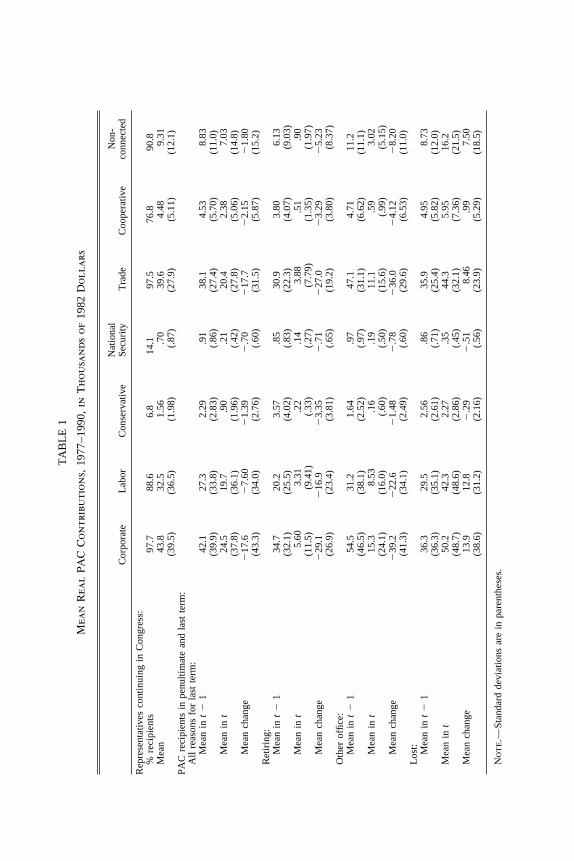
Table 1 presents the mean and standard deviation of real PAC contribu-tions (in thousands of 1982 dollars) and the average fraction of congress-men receiving contributions by seven different categories of contributors.The top panel of Table 1 presents sample statistics for multiterm representa-tives in all terms other than their last term. Political action committee con-
7 See, for example, Arthur T. Denzau and Michael C. Munger, Legislators and InterestGroups: How Unorganized Interests Get Represented, Am Pol Sci Rev 89 (1986); and Strat-mann (cited in note 4).
8 Over the period 1977–90 there are 820 individuals serving a total of 3,045 2-year terms.The mean completed tenure among the multiterm representatives in our sample is 6.24 terms.At a moment in time the tenure for a randomly selected congressman in our sample is 4.19terms.
9 We exclude the last-term observations for the 28 congressmen who died while in office.If these congressmen did not anticipate their death, their inclusion would bias our resultstowards not finding significant changes in last-period behavior.
TA
BL
E1
Mea
nR
eal
PAC
Con
trib
uti
ons,
1977
–199
0,in
Th
ousa
nds
of19
82D
olla
rs
Nat
iona
lN
on-
Cor
pora
teL
abor
Con
serv
ativ
eSe
curi
tyT
rade
Coo
pera
tive
conn
ecte
d
Rep
rese
ntat
ives
cont
inui
ngin
Con
gres
s:%
reci
pien
ts97
.788
.66.
814
.197
.576
.890
.8M
ean
43.8
32.5
1.56
.70
39.6
4.48
9.31
(39.
5)(3
6.5)
(1.9
8)(.
87)
(27.
9)(5
.11)
(12.
1)PA
Cre
cipi
ents
inpe
nulti
mat
ean
dla
stte
rm:
All
reas
ons
for
last
term
:M
ean
int
21
42.1
27.3
2.29
.91
38.1
4.53
8.83
(39.
9)(3
3.8)
(2.8
3)(.
86)
(27.
4)(5
.70)
(11.
0)M
ean
int
24.5
19.7
.90
.21
20.4
2.38
7.03
(37.
8)(3
6.1)
(1.9
6)(.
42)
(27.
8)(5
.06)
(14.
8)M
ean
chan
ge2
17.6
27.
602
1.39
2.7
02
17.7
22.
152
1.80
(43.
3)(3
4.0)
(2.7
6)(.
60)
(31.
5)(5
.87)
(15.
2)R
etir
ing:
Mea
nin
t2
134
.720
.23.
57.8
530
.93.
806.
13(3
2.1)
(25.
5)(4
.02)
(.83
)(2
2.3)
(4.0
7)(9
.03)
Mea
nin
t5.
603.
31.2
2.1
43.
88.5
1.9
0(1
1.5)
(9.4
1)(.
33)
(.27
)(7
.79)
(1.3
5)(1
.97)
Mea
nch
ange
229
.12
16.9
23.
352
.71
227
.02
3.29
25.
23(2
6.9)
(23.
4)(3
.81)
(.65
)(1
9.2)
(3.8
0)(8
.37)
Oth
erof
fice:
Mea
nin
t2
154
.531
.21.
64.9
747
.14.
7111
.2(4
6.5)
(38.
1)(2
.52)
(.97
)(3
1.1)
(6.6
2)(1
1.1)
Mea
nin
t15
.38.
53.1
6.1
911
.1.5
93.
02(2
4.1)
(16.
0)(.
60)
(.50
)(1
5.6)
(.99
)(5
.15)
Mea
nch
ange
239
.22
22.6
21.
482
.78
236
.02
4.12
28.
20(4
1.3)
(34.
1)(2
.49)
(.60
)(2
9.6)
(6.5
3)(1
1.0)
Los
t: Mea
nin
t2
136
.329
.52.
56.8
635
.94.
958.
73(3
6.3)
(35.
1)(2
.61)
(.71
)(2
5.4)
(5.8
2)(1
2.0)
Mea
nin
t50
.242
.32.
27.3
544
.35.
9516
.2(4
8.7)
(48.
6)(2
.86)
(.45
)(3
2.1)
(7.3
6)(2
1.5)
Mea
nch
ange
13.9
12.8
2.2
92
.51
8.46
.99
7.50
(38.
6)(3
1.2)
(2.1
6)(.
56)
(23.
9)(5
.29)
(18.
5)
Not
e.—
Stan
dard
devi
atio
nsar
ein
pare
nthe
ses.
campaign donations 323
tributions were legally limited to $10,000 ($5,000 per primary and generalelection campaign) during the sample. Over 90 percent of representativescontinuing in Congress received contributions from corporate, trade, andnonconnected PACs, and nearly 90 percent received labor PAC contribu-tions. In contrast, less than 15 percent of continuing congressmen receivedcontributions from conservative or national security PACs.10
The bottom panel of Table 1 focuses on representatives’ final 2 terms inoffice. We limit the sample to congressmen who received PAC contribu-tions in their penultimate term in office (denoted by period t 2 1) and pres-ent the change in PAC contributions between their last (period t) and penul-timate terms. The first six rows aggregate last-term representatives into asingle group. It is important to note that the time-series pattern of PAC con-tributions differs substantially across congressmen who retire, run for otheroffice, and lose their reelection bid. This is not surprising because the con-gressmen we classify as retiring publicly announced their retirement priorto the filing date for primaries, so they were not eligible for general electioncampaign contributions. These retiring congressmen were eligible to re-ceive PAC contributions prior to the primary filing date and therefore facedsome (although greatly reduced) costs to voting against these groups’ inter-ests even during their final term.
Table 1 shows that representatives in their last term owing to retirementor because they are running for other office are less likely to receive PACcontributions, and when PAC contributions are made the magnitude of thecontributions declines substantially. The average labor PAC recipient expe-rienced a decrease of $16,900 in labor contributions in their retiring term(84 percent of their previous level of labor contributions) and a decrease of$22,600 when running for other office (72 percent of their previous contri-butions). There are similarly large percentage declines in contributions forother categories of PACs. Consequently, there is significantly less disper-sion in PAC contributions across congressmen when they are in their finalterm in office. If contributions are indeed buying votes, one would expectthese large declines in PAC contributions (especially corporate and labor)
10 The conservative PACs include such groups as the Conservative Victory Fund, Fundfor a Conservative Majority, Americans for Constitutional Action, and Citizens for the Re-public; the trade PACs include all the trade associations such as the American Bankers Asso-ciation, American Medical Association, National Association of Home Builders; the coopera-tive PACs are primarily agricultural and include groups such as the Sunkist PAC, RiceGrowers of California, and MidAmerica Dairymen PAC; and the nonconnected PACs repre-sent all ideological PACs (like the conservative PACs listed above) and other PACs like theJewish American PAC, the Jimmy Carter PAC, and Friends of Right to Work PAC. Totalnonparty PAC donations are almost entirely accounted for by either the corporate, labor,trade, cooperative, or nonconnected categories.
324 the journal of law and economics
in a congressman’s retiring term to lead to substantial changes in his votingbehavior on issues valued by interest groups.
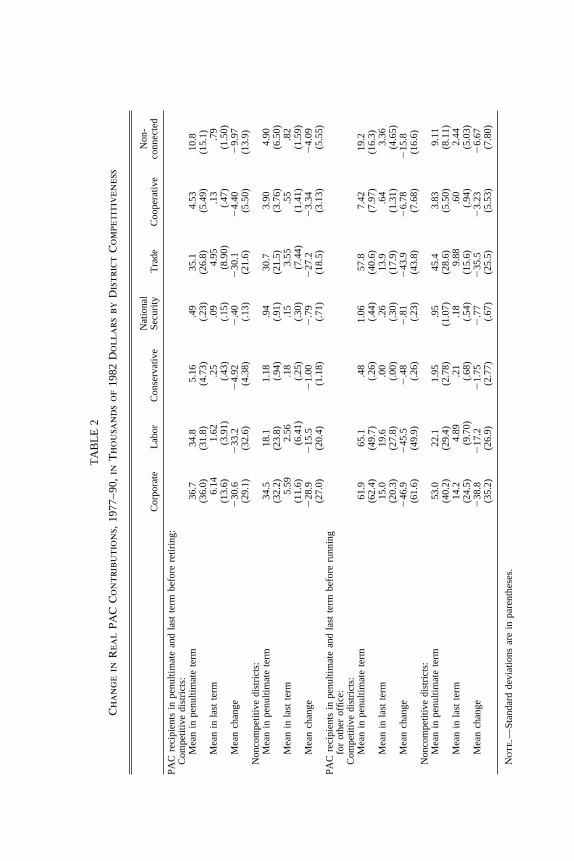
Note that losing congressmen actually experience an increase in PACcontributions in their final term. This increase probably occurs becausethese candidates and their contributors have correctly anticipated a difficultreelection campaign. Moreover, PAC contributions are likely to be larger,on average, in competitive congressional districts that are likely to haveclose election outcomes. This suggests that even larger declines in contribu-tions will occur when a representative in a competitive district retires orruns for another office.
We define a competitive district as one in which the average election out-come (over the period 1974–88) had a vote differential of less than 20 per-centage points.11 Using this definition, 19 percent of congressional districtsin our sample are ‘‘competitive.’’ Table 2 presents a description of changesin PAC contributions for retiring congressmen and congressmen running forother office during their last 2 terms in office in both competitive and non-competitive districts. These changes in contributions are only computed forrepresentatives who received contributions from a PAC of the designatedtype in their penultimate term. For most categories of PAC contributions,congressmen in competitive districts received higher average PAC contribu-tions in their penultimate term and experienced a relatively larger percent-age decrease in contributions after deciding to retire or run for another of-fice.
This raw data can also potentially test the sorting versus vote-buyinghypotheses by answering whether PACs simultaneously give donations totwo different candidates in the same race. It would be difficult to reconcilesimultaneous contributions with the sorting hypothesis. Unfortunately, theFederal Election Commission data on campaign contributions does not dis-tinguish well between primary and general election contributions. To helpanswer this question, we interviewed those running 20 of the PACs used inour sample, and representatives of all these PACs insisted that either theynever provided simultaneous contributions to two opponents in the samerace or that they did so only under the most exceptional circumstances (for
11 We used several other methods for conditioning on the competitiveness of a district:(1) we defined a ‘‘competitive district’’ as one in which the margin of victory in the previouselection was less than 20 percent, (2) we used a margin of victory residual from a regressionthat included state and term dummies, presidential election outcomes in the district, andaverage demographic characteristics in the district to define a ‘‘competitive district,’’ and(3) we included interactions between changes in PAC contributions and the average marginof victory in the district in the regression models in Tables 4–6. None of these approachesindicated any significant differences in behavior across competitive and noncompetitive dis-tricts.
TA
BL
E2
Ch
ange
inR
eal
PAC
Con
trib
uti
ons,
1977
–90,
inT
hou
san
dsof
1982
Dol
lars
byD
istr
ict
Com
peti
tive
nes
s
Nat
iona
lN
on-
Cor
pora
teL
abor
Con
serv
ativ
eSe
curi
tyT
rade
Coo
pera
tive
conn
ecte
d
PAC
reci
pien
tsin
penu
ltim
ate
and
last
term
befo
rere
tirin
g:C
ompe
titiv
edi
stri
cts:
Mea
nin
penu
ltim
ate
term
36.7
34.8
5.16
.49
35.1
4.53
10.8
(36.
0)(3
1.8)
(4.7
3)(.
23)
(26.
8)(5
.49)
(15.
1)M
ean
inla
stte
rm6.
141.
62.2
5.0
94.
95.1
3.7
9(1
3.6)
(3.9
1)(.
43)
(.15
)(8
.90)
(.47
)(1
.50)
Mea
nch
ange
230
.62
33.2
24.
922
.40
230
.12
4.40
29.
97(2
9.1)
(32.
6)(4
.38)
(.13
)(2
1.6)
(5.5
0)(1
3.9)
Non
com
petit
ive
dist
rict
s:M
ean
inpe
nulti
mat
ete
rm34
.518
.11.
18.9
430
.73.
904.
90(3
2.2)
(23.
8)(.
94)
(.91
)(2
1.5)
(3.7
6)(6
.50)
Mea
nin
last
term
5.59
2.56
.18
.15
3.55
.55
.82
(11.
6)(6
.41)
(.25
)(.
30)
(7.4
4)(1
.41)
(1.5
9)M
ean
chan
ge2
28.9
215
.52
1.00
2.7
92
27.2
23.
342
4.09
(27.
0)(2
0.4)
(1.1
8)(.
71)
(18.
5)(3
.13)
(5.5
5)PA
Cre
cipi
ents
inpe
nulti
mat
ean
dla
stte
rmbe
fore
runn
ing
for
othe
rof
fice:
Com
petit
ive
dist
rict
s:M
ean
inpe
nulti
mat
ete
rm61
.965
.1.4
81.
0657
.87.
4219
.2(6
2.4)
(49.
7)(.
26)
(.44
)(4
0.6)
(7.9
7)(1
6.3)
Mea
nin
last
term
15.0
19.6
.00
.26
13.9
.64
3.36
(20.
3)(2
7.8)
(.00
)(.
30)
(17.
9)(1
.31)
(4.6
5)M
ean
chan
ge2
46.9
245
.52
.48
2.8
12
43.9
26.
782
15.8
(61.
6)(4
9.9)
(.26
)(.
23)
(43.
8)(7
.68)
(16.
6)N
onco
mpe
titiv
edi
stri
cts:
Mea
nin
penu
ltim
ate
term
53.0
22.1
1.95
.95
45.4
3.83
9.11
(40.
2)(2
9.4)
(2.7
8)(1
.07)
(28.
6)(5
.50)
(8.1
1)M
ean
inla
stte
rm14
.24.
89.2
1.1
89.
88.6
02.
44(2
4.5)
(9.7
0)(.
68)
(.54
)(1
5.6)
(.94
)(5
.03)
Mea
nch
ange
238
.82
17.2
21.
752
.77
235
.52
3.23
26.
67(3
5.2)
(26.
9)(2
.77)
(.67
)(2
5.5)
(5.5
3)(7
.80)
Not
e.—
Stan
dard
devi
atio
nsar
ein
pare
nthe
ses.
326 the journal of law and economics
example, a PAC may feel obligated to support one of their members whois running for office even if they expect him to lose).12
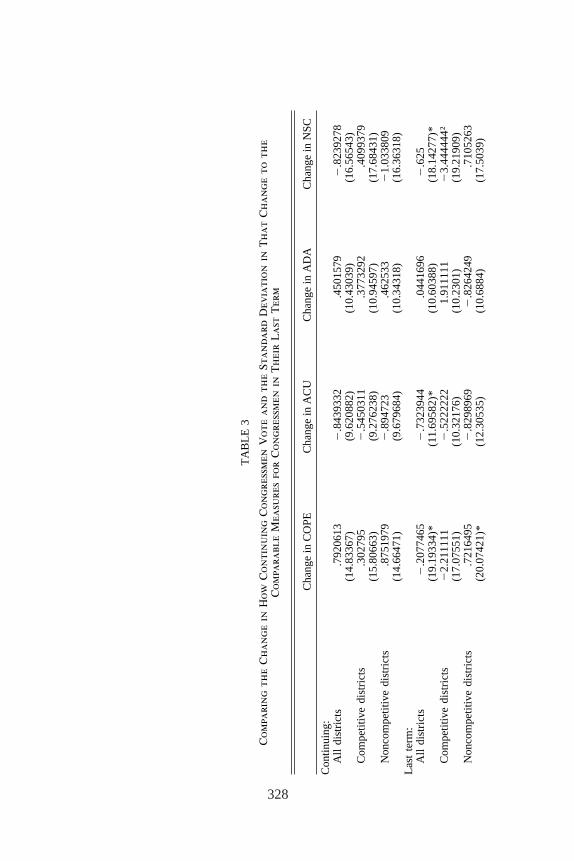
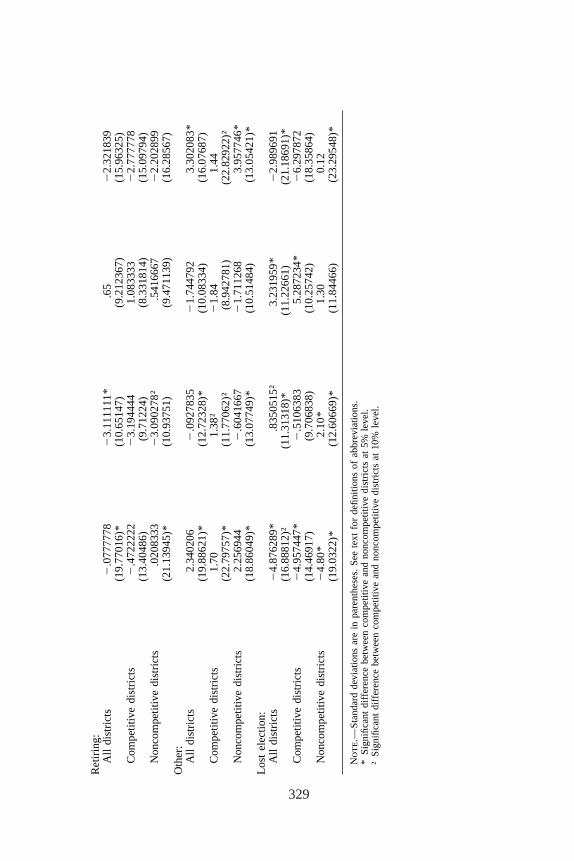
The changes in voting behavior are defined as the changes in five differ-ent special interest indexes of congressional voting: (1) American Con-servative Union (ACU), (2) Americans for Democratic Action (ADA),(3) AFL-CIO’s Committee on Political Education (COPE), (4) National Se-curity Council (NSC), and (5) National Taxpayers Union (NTU). The unitof observation is the individual member of the House of Representatives.Each of these special interest groups assigns a congressman an index num-ber between 0 and 100, indicating the percentage of votes that he casts inaccord with the wishes of that group.13 The one exception is the liberalADA index, which records abstentions as conservative votes and thus re-ports a lower score when a representative abstains from voting.14 Thechange in each voting index subtracts the interest group score he receivedduring the ith 1 1 Congress from his average value from that same groupduring the ith Congress. While ignoring the effect of campaign donationsand the question of causation, the changes in voting indexes shown in Table3 are generally consistent with other studies that examine these indexesover a slightly longer time period.15 With the exception of the ACU index,it reveals that there are no statistically significant differences in the meanchange in voting score for continuing congressmen and for those who areleaving office to retire or run for other offices, though the table does revealthat the standard deviations for how these voting indexes change are consis-
12 A detailed account of these telephones interviews is available from the authors. We in-terviewed the American Conservative Union, Conservative Victory Fund, American MedicalAssociation, American Bankers Association, National Association of Life Underwriters, Na-tional Association of Home Builders, Association of Trial Lawyers of America, Phillip Mor-ris, Tenneco, National Association of Automobile Dealers, National Association of RetiredFederal Employees, United Food & Commercial Workers International Union, United AutoWorkers, the International Machinists & Aerospace Workers Union, Americans for Demo-cratic Action, American Dental Association, National Rifle Association, Realtors’ PAC,Rockwell International Corp., and Lockheed Employees.
13 A particular term’s index may be based on as few as 13 votes (COPE) or as many as430 votes (NTU). While four of the indexes are constructed with votes over a 2-year congres-sional term, the NSC index is based solely on votes occurring during the second year of eachterm. This fact about the NSC index is useful when we note the timing of public announce-ments to retire.
14 The ADA approach produces both some potential difficulties as well as opportunities.Since congressmen tend to vote less frequently during their last term (see Lott (cited in note3)), the ADA index will indicate that congressmen are more conservative during their lastterm when the only real change may be that the return to voting has declined. However,adjusting for this effect will not alter the results shown in this article. One benefit from usingthe ADA index as it was originally constructed is that donations might alter not only how apolitician votes but also whether he abstains from voting. The ADA index will help measurewhether donations alter politicians’ decisions to abstain from voting.
15 Lott and Bronars, at 128–33 (cited in note 6).
campaign donations 327
tently different between continuing congressmen and those running forother offices.16
For 74 of the 91 retiring congressmen where we know the exact date thatthey publicly announced their retirement, the average announcement wasmade 11.91 months prior to the November general election.17 Twenty-fourcongressmen made the announcement after Congress reconvened during thelast year of their last term, with two making the announcement as late asJune of the election year. If survey information on when congressmen whoprivately decided that 1978 was to be their last year in public office is areliable guide for later congressmen,18 they privately decided to retire abouteight months prior to their public announcement.19,20
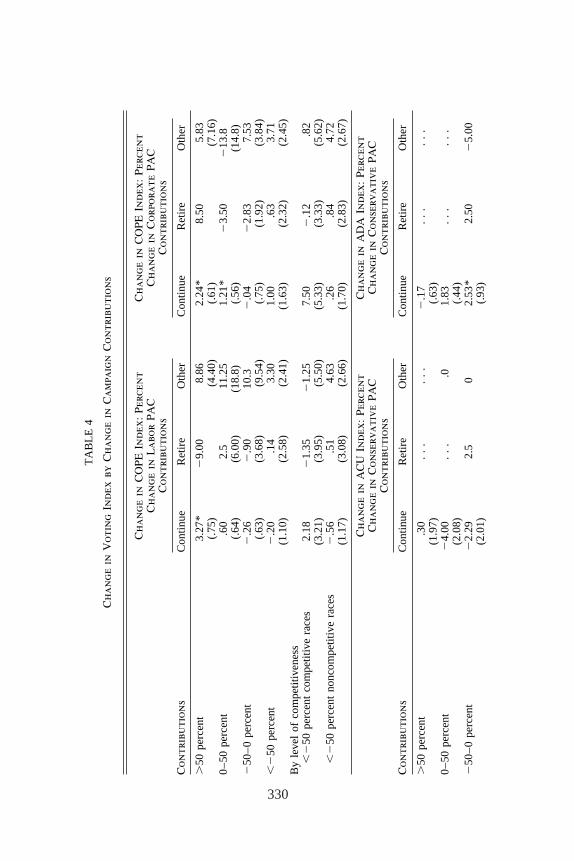
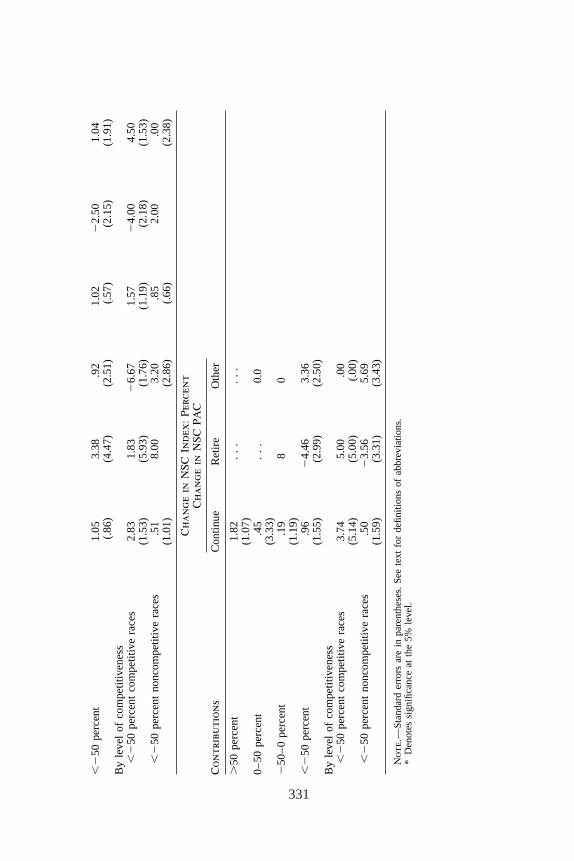
Table 4 provides a first pass at combining changes in contributions andvoting behavior. The change in the different voting indexes is given for var-ious subsamples of congressmen: those continuing in office, those retiringfrom office, and those leaving Congress to run for another political office.For each group of representatives, we calculate the percentage change intheir contributions from a special interest group relative to their contribu-tion in the previous congressional election cycle. As in Table 2, we excludepoliticians from Table 4 who received no PAC contribution from each spe-cial interest group in their next-to-last term. Our tests of whether campaigncontributions buy votes focus on retiring congressmen, where it is quitecommon that PAC contributions decline by more than 50 percent of theirprevious value.21 In situations where PAC contributions decline by morethan 50 percent, we present changes in voting indices overall and separatelyfor competitive and noncompetitive districts. In the different sections of Ta-ble 3, we compare a voting index with the most relevant types of PAC con-tributions. The change in the AFL-CIO’s COPE voting index is compared
16 Lott (cited in note 3) and Lott and Bronars (cited in note 6) provide a more extensiveanalysis of this question.
17 This information was obtained using a NEXIS search with the keywords being the con-gressman’s last name, his state, and the words ‘‘retire’’ and ‘‘Congress.’’
18 Lott (cited in note 3).19 Wiggins, from California, said that he had made his retirement decision and publicly
announced it when he first ran for Congress 10 years earlier. His response is excluded fromthis average.
20 Unlike earlier work examining the life-cycle changes in political voting behavior, weprimarily focus on the change in voting indexes and not the absolute value of that changesince if changes in contributions are made to alter how politicians vote there should be sys-tematic changes in voting.
21 A detailed breakdown for those congressmen who lost their reelection campaign isavailable from the authors. No significant relationships between changes in donations andchanges in voting indexes were found for this category. We also performed this test for theNTU index for both the change and the absolute value of that change, but we again wereunable to observe any systematic relationships.
TA
BL
E3
Com
pari
ng
the
Ch
ange
inH
owC
onti
nu
ing
Con
gres
smen
Vot
ean
dth
eSt
anda
rdD
evia
tion
inT
hat
Ch
ange
toth
eC
ompa
rabl
eM
easu
res
for
Con
gres
smen
inT
hei
rL
ast
Ter
m
Cha
nge
inC
OPE
Cha
nge
inA
CU
Cha
nge
inA
DA
Cha
nge
inN
SC
Con
tinui
ng:
All
dist
rict
s.7
9206
132
.843
9332
.450
1579
2.8
2392
78(1
4.83
367)
(9.6
2088
2)(1
0.43
039)
(16.
5654
3)C
ompe
titiv
edi
stri
cts
.302
795
2.5
4503
11.3
7732
92.4
0993
79(1
5.80
663)
(9.2
7623
8)(1
0.94
597)
(17.
6843
1)N
onco
mpe
titiv
edi
stri
cts
.875
1979
2.8
9472
3.4
6253
32
1.03
3809
(14.
6647
1)(9
.679
684)
(10.
3431
8)(1
6.36
318)
Las
tte
rm:
All
dist
rict
s2
.207
7465
2.7
3239
44.0
4416
962
.625
(19.
1933
4)*
(11.
6958
2)*
(10.
6038
8)(1
8.14
277)
*C
ompe
titiv
edi
stri
cts
22.
2111
112
.522
2222
1.91
1111
23.
4444
44†
(17.
0755
1)(1
0.32
176)
(10.
2301
)(1
9.21
909)
Non
com
petit
ive
dist
rict
s.7
2164
952
.829
8969
2.8
2642
49.7
1052
63(2
0.07
421)
*(1
2.30
535)
(10.
6884
)(1
7.50
39)
328
Ret
irin
g:A
lldi
stri
cts
2.0
7777
782
3.11
1111
*.6
52
2.32
1839
(19.
7701
6)*
(10.
6514
7)(9
.212
367)
(15.
9632
5)C
ompe
titiv
edi
stri
cts
2.4
7222
222
3.19
4444
1.08
3333
22.
7777
78(1
3.40
486)
(9.7
1224
)(8
.331
814)
(15.
0979
4)N
onco
mpe
titiv
edi
stri
cts
.020
8333
23.
0902
78†
.541
6667
22.
2028
99(2
1.13
945)
*(1
0.93
751)
(9.4
7113
9)(1
6.28
567)
Oth
er:
All
dist
rict
s2.
3402
062
.092
7835
21.
7447
923.
3020
83*
(19.
8862
1)*
(12.
7232
8)*
(10.
0833
4)(1
6.07
687)
Com
petit
ive
dist
rict
s1.
701.
38†
21.
841.
44(2
2.79
757)
*(1
1.77
062)
†(8
.942
781)
(22.
8292
2)†
Non
com
petit
ive
dist
rict
s2.
2569
442
.604
1667
21.
7112
683.
9577
46*
(18.
8604
9)*
(13.
0774
9)*
(10.
5148
4)(1
3.05
421)
*L
ost
elec
tion:
All
dist
rict
s2
4.87
6289
*.8
3505
15†
3.23
1959
*2
2.98
9691
(16.
8881
2)†
(11.
3131
8)*
(11.
2266
1)(2
1.18
691)
*C
ompe
titiv
edi
stri
cts
24.
9574
47*
2.5
1063
835.
2872
34*
26.
2978
72(1
4.46
917)
(9.7
0683
8)(1
0.25
742)
(18.
3586
4)N
onco
mpe
titiv
edi
stri
cts
24.
80*
2.10
*1.
300.
12(1
9.03
22)*
(12.
6066
9)*
(11.
8446
6)(2
3.29
548)
*
Not
e.—
Stan
dard
devi
atio
nsar
ein
pare
nthe
ses.
See
text
for
defin
ition
sof
abbr
evia
tions
.*
Sign
ifica
ntdi
ffer
ence
betw
een
com
petit
ive
and
nonc
ompe
titiv
edi
stri
cts
at5%
leve
l.†
Sign
ifica
ntdi
ffer
ence
betw
een
com
petit
ive
and
nonc
ompe
titiv
edi
stri
cts
at10
%le
vel.
329
TA
BL
E4
Ch
ange
inV
otin
gIn
dex
byC
han
gein
Cam
paig
nC
ontr
ibu
tion
s
Ch
ange
inC
OPE
Inde
x:Pe
rcen
tC
han
gein
CO
PEIn
dex:
Perc
ent
Ch
ange
inL
abor
PAC
Ch
ange
inC
orpo
rate
PAC
Con
trib
uti
ons
Con
trib
uti
ons
Con
trib
uti
ons
Con
tinue
Ret
ire
Oth
erC
ontin
ueR
etir
eO
ther
.50
perc
ent
3.27
*2
9.00
8.86
2.24
*8.
505.
83(.
75)
(4.4
0)(.
61)
(7.1
6)0–
50pe
rcen
t.6
02.
511
.25
1.21
*2
3.50
213
.8(.
64)
(6.0
0)(1
8.8)
(.56
)(1
4.8)
250
–0pe
rcen
t2
.26
2.9
010
.32
.04
22.
837.
53(.
63)
(3.6
8)(9
.54)
(.75
)(1
.92)
(3.8
4),
250
perc
ent
2.2
0.1
43.
301.
00.6
33.
71(1
.10)
(2.5
8)(2
.41)
(1.6
3)(2
.32)
(2.4
5)B
yle
vel
ofco
mpe
titiv
enes
s,
250
perc
ent
com
petit
ive
race
s2.
182
1.35
21.
257.
502
.12
.82
(3.2
1)(3
.95)
(5.5
0)(5
.33)
(3.3
3)(5
.62)
,2
50pe
rcen
tno
ncom
petit
ive
race
s2
.56
.51
4.63
.26
.84
4.72
(1.1
7)(3
.08)
(2.6
6)(1
.70)
(2.8
3)(2
.67)
Ch
ange
inA
CU
Inde
x:Pe
rcen
tC
han
gein
AD
AIn
dex:
Perc
ent
Ch
ange
inC
onse
rvat
ive
PAC
Ch
ange
inC
onse
rvat
ive
PAC
Con
trib
uti
ons
Con
trib
uti
ons
Con
trib
uti
ons
Con
tinue
Ret
ire
Oth
erC
ontin
ueR
etir
eO
ther
.50
perc
ent
.30
..
..
..
2.1
7.
..
..
.(1
.97)
(.63
)0–
50pe
rcen
t2
4.00
..
..0
1.83
..
..
..
(2.0
8)(.
44)
250
–0pe
rcen
t2
2.29
2.5
02.
53*
2.50
25.
00(2
.01)
(.93
)
330
,2
50pe
rcen
t1.
053.
38.9
21.
022
2.50
1.04
(.86
)(4
.47)
(2.5
1)(.
57)
(2.1
5)(1
.91)
By
leve
lof
com
petit
iven
ess
,2
50pe
rcen
tco
mpe
titiv
era
ces
2.83
1.83
26.
671.
572
4.00
4.50
(1.5
3)(5
.93)
(1.7
6)(1
.19)
(2.1
8)(1
.53)
,2
50pe
rcen
tno
ncom
petit
ive
race
s.5
18.
003.
20.8
52.
00.0
0(1
.01)
(2.8
6)(.
66)
(2.3
8)
Ch
ange
inN
SCIn
dex:
Perc
ent
Ch
ange
inN
SCPA
C
Con
trib
uti
ons
Con
tinue
Ret
ire
Oth
er
.50
perc
ent
1.82
..
..
..
(1.0
7)0–
50pe
rcen
t.4
5.
..
0.0
(3.3
3)2
50–0
perc
ent
.19
80
(1.1
9),
250
perc
ent
.96
24.
463.
36(1
.55)
(2.9
9)(2
.50)
By
leve
lof
com
petit
iven
ess
,2
50pe
rcen
tco
mpe
titiv
era
ces
3.74
5.00
.00
(5.1
4)(5
.00)
(.00
),
250
perc
ent
nonc
ompe
titiv
era
ces
.50
23.
565.
69(1
.59)
(3.3
1)(3
.43)
Not
e.—
Stan
dard
erro
rsar
ein
pare
nthe
ses.
See
text
for
defin
ition
sof
abbr
evia
tions
.*
Den
otes
sign
ifica
nce
atth
e5%
leve
l.
331
332 the journal of law and economics
with the change in labor and corporate PAC contributions, the ACU andADA indexes with conservative PAC contributions, and the NSC indexwith that group’s own PAC.22
Table 4 points to a generally weak and statistically insignificant relation-ship for retiring politicians between their change in donations and their vot-ing behavior. In fact, we often see a statistically insignificant increase insupport for a special interest group by retiring congressmen even thoughtheir PAC contributions from the interest group have decreased by morethan 50 percent. This relationship for retiring congressmen shows up in thecomparison of COPE scores to labor contributions (an increase of .14 per-centage points) and ACU scores to conservative PAC contributions (an in-crease of 3.38 percentage points). In other words, larger drops in contribu-tions from a special interest group as a congressman retires are associated withthe retiring congressman voting more in accord with the special interest groupduring his last term. While these results are not statistically significant, theyimply the opposite of that predicted by the vote-buying hypothesis.23
In addition, there is no evidence of systematic differences in last termvoting behavior across competitive and noncompetitive districts. The onlyevidence in favor of the vote-buying hypothesis in Table 4 is statisticallyinsignificant: retiring congressmen who experience a more than 50 percentdrop in national security PAC contributions are 4.46 percent less likely tovote in accordance with the NSC interest group.
Since the ADA index records abstentions as conservative votes, these ini-tial results also provide us with some information on whether donations can‘‘buy’’ a politician’s decision not to vote. This also provides a second rea-son to expect that during a politician’s last term lower conservative contri-butions will be associated with higher ADA scores, and it implies that ifdonations affect abstentions, it seems most likely to be observed for thisindex. However, the results for the ADA index fail to confirm that contribu-tions affect politicians’ behavior through abstention in their last term.24
22 The strongest comparisons are obviously those where we can directly link a group’sindex with its own decisions on whom to contribute to. We had hoped to use the ADA’sPAC contributions to make comparisons with the ADA index but could not since their PACmade no contributions to retiring congressmen in either their last or next to last terms inoffice. However, the relationship between the COPE index and corporate PAC contributionsprovides the weakest comparison since, while corporations and unions often disagree on is-sues, some legislation benefits both groups.
23 Those who made their decisions to retire late may have received more contributions,but there was also a shorter period of time over which their votes during their last term wouldbe affected by their decision not to run for reelection.
24 The difference in the NTU index (which aggregates votes on all spending issues) be-tween two consecutive terms and the absolute value of this change was compared to thechange in total contributions. The results implied that there were no systematic changes inpoliticians’ views (that is, whether they prefer larger or smaller government) and no in-
campaign donations 333
For continuing congressmen, higher labor and corporate PAC contribu-tions are correlated with significantly greater support for pro-union legisla-tion, and less conservative PAC money implies a significantly higher ADAindex. The pattern of results for changes in corporate contributions andCOPE scores is somewhat puzzling since it implies that larger contributionsby corporations are associated with increased pro-union voting by congress-men. While these correlations between changes in PAC contributions andvoting indices parallel previous findings, it is difficult to infer from continu-ing congressmen whether contributions altered a politician’s voting deci-sions or whether PAC donors anticipated changes in a congressman’s sup-port on key issues.
III. Controlling for Changing Constituent Interestsand How the Costs of Opportunistic Behavior
Vary over a Politician’s Life-Cycle
Economists have argued that the costs of deviating from constituent in-terests depend on whether a politician faces the threat of reelection and onthe entry barriers created when the politician accumulates additional brandname capital. To complicate matters, voters are simultaneously trying tosort out of office politicians who deviate from constituent interests, andthese interests may be themselves changing over time.25
Consistent with previous studies, we measure the cost of deviating fromconstituents’ interests by controlling for whether it is the last term, alongwith a variable for tenure and tenure squared. Dummy variables are usedto differentiate the various reasons for the last term: retiring, lost, or run-ning for another office. Changing constituency interests are measured intwo sets of regressions: first by using term and state dummies and then re-running the regressions with those dummy variables in addition to a set ofsocioeconomic variables. The socioeconomic variables include the percentof the congressional district that is white-collar, blue-collar, service work-ers, white, black, and other racial groups along with the district’s average
creased dispersion in their views of government spending. Total donations were used sinceno identifiable PAC exists that unambiguously supports either more or less governmentspending on all questions
25 See Lott and Reed (cited in note 2) for a discussion of how these effects imply that tothe extent shirking exists it will increase over a politician’s lifetime. For discussions of theexistence of entry barriers in political markets, see Morris Coats and Thomas Dalton, EntryBarriers in Politics and Uncontested Elections, 49 J Pub Econ 75 (1992); P. L. Hersch andG. S. McDougall, Campaign War Chests as a Barrier to Entry in Congressional Races, EconInquiry 630 (1994); and John R. Lott, Jr., The Effect of Nontransferable Property Rightson the Efficiency of Political Markets: Some Evidence, 32 J Pub Econ 231 (1987). See alsoBender and Lott (cited in note 2) for a more complete discussion of these trade-offs.
334 the journal of law and economics
age, average education, average income, and total population. Each of thesepooled cross-section/time-series regressions has 2,211 observations, exceptthe National Security Council PAC, with 1,815 observations, because theirPAC ended in 1988.26
To proxy for a district’s changing conditions, we interacted the termdummies with measures of the socioeconomic conditions from either the1970 or 1980 Census depending on whether the terms compared were dur-ing the 1970s or 1980s.27 These interactions allow us to put differentweights on the socioeconomic variables to explain voting patterns someyears after the Census data were collected.
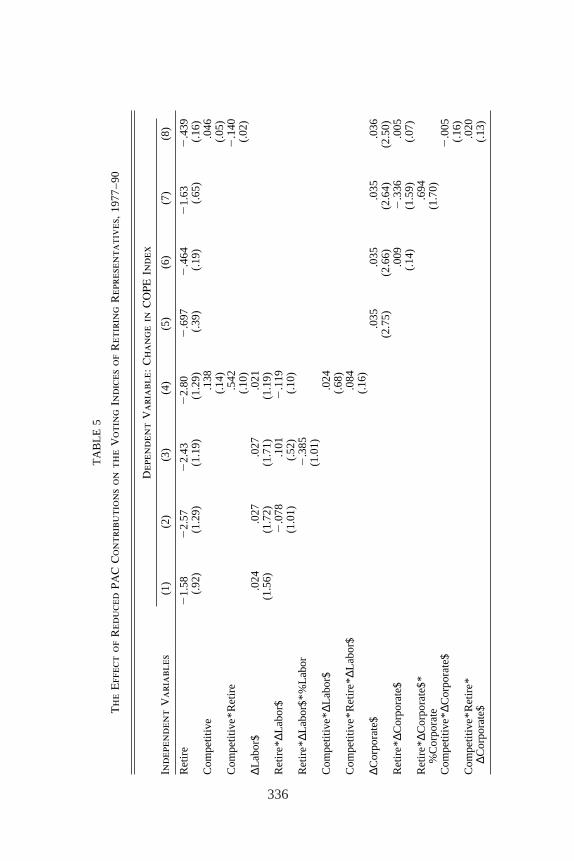
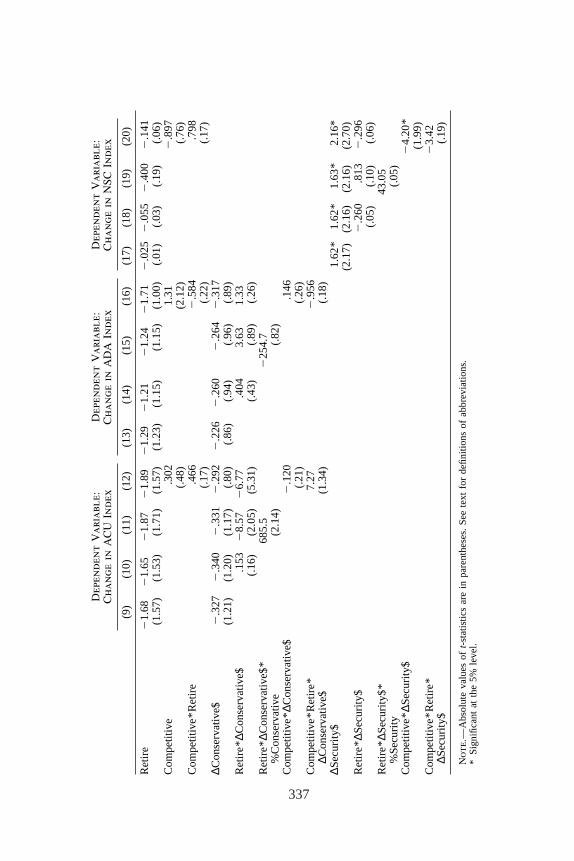
The regressions in Table 5 attempt to explain the change in COPE, ACU,ADA, and NSC voting scores through the changes in related PAC contribu-tions along with the changes in those contributions multiplied by a retire-ment dummy. It is likely that a change in an interest group’s contributionswill have the largest effect on voting behavior when these contributionscomprise a large fraction of the total contributions. To control for this, wenot only tried interacting the retirement dummy with the change in PACcontribution but also with the percent of a politician’s total contributionsaccounted for by this group’s contributions. All these regressions also con-trol for other reasons a politician is leaving office, as well as tenure, andstate and term dummies.
Specifications 10, 11, and 13–20 all indicate that campaign contributionsare significantly related to changes in how a politician votes. The resultsgenerally parallel the preliminary findings shown in Table 4. Higher laborcontributions are thus associated with a significantly more pro-union votingrecord and higher National Security Council contributions with a signifi-cantly more pro-defense voting record. While these correlations are consis-tent with politicians being influenced by PAC contributions, they are alsoconsistent with greater contributions being made to those politicians thatinterest groups believe will represent their positions in future votes. Again,
26 Another way of viewing these regressions is that contributions from PACs and votingrecords are correlated because of omitted (unobserved) measures of a politician’s ideology.Under the null hypothesis that contributions do not influence voting behavior, an exogenouschange in contributions—that is, a change in contributions that is uncorrelated with a changein the politician’s unobserved ideology—should not influence a politician’s voting behavior.In this article we argue that decreases in contributions due to retirement decisions are uncor-related with ideology and hence provide an excellent opportunity for testing the null hypothe-sis that PAC contributions do not buy votes.
27 The 95th and 96th Congresses (1975–80) used the data obtained from the 1970 Censusfor those district boundaries formed after the 1972 redistricting; the 97th Congress (1981–82) used the data from the 1980 Census for those boundaries formed after the 1972 redis-tricting; and the 98th–101st Congresses (1983–90) used the data from the 1980 Census inthose districts formed after the 1982 redistricting.
campaign donations 335
the positive and significant coefficients on corporate contributions in thechange in COPE index regression are puzzling since they imply that largercontributions by corporations are associated with increased pro-union vot-ing by congressmen.
While the coefficients on the change in PAC contributions have an am-biguous interpretation, the coefficients for the change in contributions andthe retirement dummy interaction provide a relatively consistent story. Inmost of the specifications that interact these 2 terms (with and without theweighting of these contributions by their share of total contributions), thecoefficients are insignificant, and in 11 of the 15 cases the signs imply thatreductions in contributions during a politician’s last term are associatedwith votes that are more in accord with the political action group’s desires.If campaign contributions cause ideological congressmen to vote in the con-tributors’ interest, eliminating those contributions should encourage thecongressmen to move away from positions that benefit the contributors andvote more according to their own preferences during their retirement term.In addition, the ADA index does not support the hypothesis that contribu-tions affect politicians’ behavior through abstentions.28
There is one case where the empirical evidence in Table 5 provides somesupport for the vote-buying hypothesis. Specification 18 shows that a$1,000 decrease in contributions by the NSC PAC during a retirement termis associated with a significant 1.36 percent (1.62 2 .26 5 1.36) decreasein the NSC voting index. Specification 20 shows that this effect occurs onlyin noncompetitive districts; in competitive districts there is an insignificantincrease in the NSC voting index when NSC PAC contributions fall duringthe retirement term.
The second piece of evidence that strongly rejects the vote-buying hy-pothesis is seen in the relationship between conservative PAC contributionsand ACU scores in specification 11. Evaluated at sample means, for each$1,000 decrease in conservative PAC contributions experienced by a re-tiree, the retiring representative would vote with the ACU 5.2 percent moreof the time. The large significant coefficient on the interaction term (Re-tire*∆Conservative$*%Conservative$) suggests, however, that a retiringrepresentative who had received a high enough fraction of donations fromconservative PACs would be expected to substantially reduce his ACU vot-ing score in his last term. For example, a retiring congressman who had
28 The drop in attendance that occurs during a politician’s last term should not alter ourdiscussion on the effect of lower conservative donations because we are already controllingfor the average drop with the last term dummy. The question is whether those who experi-ence a drop in conservative contributions become more liberal relative to the entire set ofretiring politicians.
TA
BL
E5
Th
eE
ffec
tof
Red
uce
dPA
CC
ontr
ibu
tion
son
the
Vot
ing
Indi
ces
ofR
etir
ing
Rep
rese
nta
tive
s,19
77–9
0
Dep
ende
nt
Var
iabl
e:C
han
gein
CO
PEIn
dex
Inde
pen
den
tV
aria
bles
(1)
(2)
(3)
(4)
(5)
(6)
(7)
(8)
Ret
ire
21.
582
2.57
22.
432
2.80
2.6
972
.464
21.
632
.439
(.92
)(1
.29)
(1.1
9)(1
.29)
(.39
)(.
19)
(.65
)(.
16)
Com
petit
ive
.138
.046
(.14
)(.
05)
Com
petit
ive*
Ret
ire
.542
2.1
40(.
10)
(.02
)∆L
abor
$.0
24.0
27.0
27.0
21(1
.56)
(1.7
2)(1
.71)
(1.1
9)R
etir
e*∆L
abor
$2
.078
.101
2.1
19(1
.01)
(.52
)(.
10)
Ret
ire*
∆Lab
or$*
%L
abor
2.3
85(1
.01)
Com
petit
ive*
∆Lab
or$
.024
(.68
)C
ompe
titiv
e*R
etir
e*∆L
abor
$.0
84(.
16)
∆Cor
pora
te$
.035
.035
.035
.036
(2.7
5)(2
.66)
(2.6
4)(2
.50)
Ret
ire*
∆Cor
pora
te$
.009
2.3
36.0
05(.
14)
(1.5
9)(.
07)
Ret
ire*
∆Cor
pora
te$*
.694
%C
orpo
rate
(1.7
0)C
ompe
titiv
e*∆C
orpo
rate
$2
.005
(.16
)C
ompe
titiv
e*R
etir
e*.0
20∆C
orpo
rate
$(.
13)
336
Dep
ende
nt
Var
iabl
e:D
epen
den
tV
aria
ble:
Dep
ende
nt
Var
iabl
e:C
han
gein
AC
UIn
dex
Ch
ange
inA
DA
Inde
xC
han
gein
NSC
Inde
x
(9)
(10)
(11)
(12)
(13)
(14)
(15)
(16)
(17)
(18)
(19)
(20)
Ret
ire
21.
682
1.65
21.
872
1.89
21.
292
1.21
21.
242
1.71
2.0
252
.055
2.4
002
.141
(1.5
7)(1
.53)
(1.7
1)(1
.57)
(1.2
3)(1
.15)
(1.1
5)(1
.00)
(.01
)(.
03)
(.19
)(.
06)
Com
petit
ive
.302
1.31
2.8
97(.
48)
(2.1
2)(.
76)
Com
petit
ive*
Ret
ire
.466
2.5
84.7
98(.
17)
(.22
)(.
17)
∆Con
serv
ativ
e$2
.327
2.3
402
.331
2.2
922
.226
2.2
602
.264
2.3
17(1
.21)
(1.2
0)(1
.17)
(.80
)(.
86)
(.94
)(.
96)
(.89
)R
etir
e*∆C
onse
rvat
ive$
.153
28.
572
6.77
.404
3.63
1.33
(.16
)(2
.05)
(5.3
1)(.
43)
(.89
)(.
26)
Ret
ire*
∆Con
serv
ativ
e$*
685.
52
254.
7%
Con
serv
ativ
e(2
.14)
(.82
)C
ompe
titiv
e*∆C
onse
rvat
ive$
2.1
20.1
46(.
21)
(.26
)C
ompe
titiv
e*R
etir
e*7.
272
.956
∆Con
serv
ativ
e$(1
.34)
(.18
)∆S
ecur
ity$
1.62
*1.
62*
1.63
*2.
16*
(2.1
7)(2
.16)
(2.1
6)(2
.70)
Ret
ire*
∆Sec
urity
$2
.260
.813
2.2
96(.
05)
(.10
)(.
06)
Ret
ire*
∆Sec
urity
$*43
.05
%Se
curi
ty(.
05)
Com
petit
ive*
∆Sec
urity
$2
4.20
*(1
.99)
Com
petit
ive*
Ret
ire*
23.
42∆S
ecur
ity$
(.19
)
Not
e.—
Abs
olut
eva
lues
oft-
stat
istic
sar
ein
pare
nthe
ses.
See
text
for
defin
ition
sof
abbr
evia
tions
.*
Sign
ifica
ntat
the
5%le
vel.
337
338 the journal of law and economics
been receiving 2.2 percent of his PAC contributions from conservativePACs would be predicted to vote with the ACU 6.2 percent (statisticallysignificantly) less of the time for each $1,000 decrease in conservative PACcontributions. It is rare for a representative in our sample to receive thishigh of a share of contributions from conservative PACs: only 8 of the 661congressmen in our sample received at least 2.2 percent of their contribu-tions from conservative PACs.
Our results, in general, are consistent with contributions being made topoliticians who value the same policy positions as their donors. Our find-ings are therefore consistent with sorting models in which politicians whoshare the same ideology and preferences as their constituents are elected tooffice. Successful sorting results in consistent congressional voting patternseven when the threat of reelection is removed and when campaign contribu-tions from interest groups decline dramatically. If donors support the ideo-logical candidates who intrinsically value the same policy outcomes, theseideological politicians will find it costly to deviate from their donors’ inter-ests during their last period because it will lower their level of utility.29
The retirement dummy coefficients for all these specifications are verysimilar to those found in previous studies, and they are almost always insig-nificant and economically small. In only one of these twenty specificationsis the retirement dummy significant at the .10 level for a two-tailed t-test.The implication is consistent with the results interacting donations and re-tirement: politicians do not appear to be altering their voting behavior whenthe threat of reelection is removed.30,31
29 Rerunning the regressions shown in Table 4 with the socioeconomic variables for dis-trict characteristics leaves the results virtually unchanged. We also looked at the correlationbetween trade associations and labor unions and between labor, corporate, and trade associa-tions and the interests of the ACU, ADA, and NSC, but in none of these cases were theinteraction between retirement and the change in contributions significant.
30 Other information helps distinguish these hypotheses. Donations from PACs are by farthe greatest when politicians are first elected and when the politicians are removed from of-fice due to defeat. These contributions fall to 87.1 percent of what they were during a politi-cian’s first successful campaign by his second election. Presumably, this donation patternresults from the relative difficulty in challenging incumbents. Yet, if incumbents are so pro-tected from competition, it also implies that most incumbents will attach relatively little bene-fit to receiving larger campaign contributions and thus are less likely to alter their positionson key votes in exchange for more donations. When combined with previous results, an ex-tension of the ‘‘ideological sorting’’ hypothesis is that PACs are relatively successful at de-termining who their friends (or enemies) are early in a politician’s congressional career.
31 While variables such as tenure may be correlated with the presence of sunk investmentsin political reputation and thus may tell us something about the presence of entry barriers, amore direct measure is the depreciated value of a politician’s past campaign expenditures.However, since expenditures are only available from the Federal Election Commission start-ing in 1976, using lagged campaign expenditures for just two previous campaigns reducesthe time period we can study to 1979–90 and decreases our sample size by almost 20 percent.With this smaller sample, we reestimated the specifications shown in Table 4 by now also
campaign donations 339
One concern is that the change in voting scores might be affected by thetiming of a politician’s retirement decision. For example, if the decision toretire was made at the very end of their last term, little change should beexpected in the voting index between a politician’s last 2 terms in office nomatter which theory is correct. We attempted to adjust for this by multi-plying the change in donation interactions by an additional variable measur-ing the number of months before the end of the term that a politician pub-licly announced his retirement. Another similar interaction term wasincluded to control for the four congressmen in our sample who publiclyannounced their retirement during their second to last term. In that case, thenumber of months that they made the announcement prior to the end oftheir second to last term is interacted with the retirement and change in do-nation interaction. We also separately controlled for the number of monthsthe public retirement announcement was made prior to the end of either thelast or second to last term.32
Making these adjustments for the retirement announcement for the re-gressions using the ACU, ADA, and NSC indexes results in the retirementand change in contribution interactions having insignificant but now consis-tently the opposite coefficient signs of what the vote-buying hypothesis pre-dicts. However, the adjustment for the COPE index makes the retirementand change in contribution interactions produce contradictory results. Thecoefficient for the labor contributions regression is significant and impliesthe opposite of the vote-buying hypothesis, while the coefficient for the cor-porate contributions supports it, though it is insignificant.
A final question is whether no change in voting behavior is observed forretirees because contributions from opposing groups might offset eachother. For example, corporate and labor PACs could cancel each other outin determining a politician’s COPE score. If corporate or labor PACs unilat-erally stopped contributing to a politician, he could move toward the posi-tions desired by the other donor, but if both types of PACs cut their contri-butions at the same time, no change might be observed.
controlling for both the incumbents’ and the general election challengers’ campaign expendi-tures lagged over the two previous elections (when available), those four lagged variablessquared, a dummy variable for whether the incumbent had served in previous elected posi-tions, and a dummy variable for whether the incumbent has relatives who have served inelective office. In general, the coefficients on interactions between retirement and change indonations were extremely similar to those reported previously.
32 By regressing the change in retiring congressmen’s PAC contributions during their last2 terms on an intercept term and just the number of months that they publicly announce theirretirement prior to the November election during their last term, we found some evidencefor PAC contributions being reduced the earlier that politicians announced their retirement.The number of months coefficients were significantly negative for changes in corporate, la-bor, and total PAC donations and were insignificantly negative for the NSC PAC.
340 the journal of law and economics
The simplest way to test this is to rerun the COPE specifications shownin Table 5 but simultaneously control for both the change in corporate andlabor contributions and those changes interacted with the retirementdummy. Combining these control variables, however, had no effect on ei-ther the signs or significance of the coefficients shown earlier. The retire-ment and contribution interactions are still insignificant, and their signs arethe opposite of what the vote-buying hypothesis predicts. We also at-tempted to control for the possibility that the marginal effect of changingone type of contribution depends on the change in the other type of dona-tion by adding an additional term which interacts the labor and corporatecontributions for retiring congressmen. In both cases this new coefficientwas insignificant, and its inclusion did not alter the other coefficients.
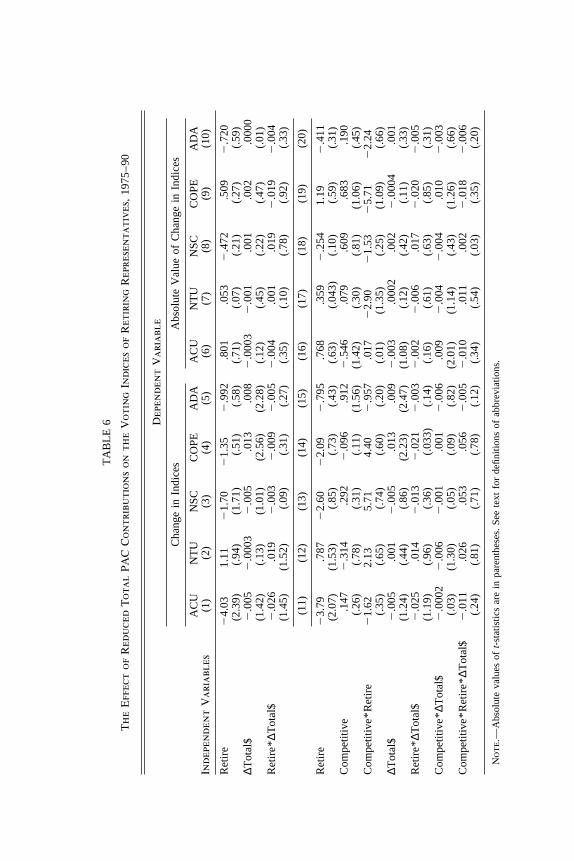
IV. Do Changes in Total PAC Donations Alter Voting?
However, even if individual sources of PAC contributions cannot explainvoting behavior, it is possible that total PAC contributions are important inexplaining voting behavior. Table 6 is analogous to Table 5 in that it at-tempts to examine whether changes in total PAC contributions might ex-plain changes in any of the five voting indexes during a congressman’s lastterm in the House of Representatives. These changes in total PAC contribu-tions are substantial. While the average congressman experiences an in-crease between terms of $14,670 (with an SD of 59,490), retiring congress-men experience an average drop of $73,650 (with an SD of 57,630).However, unlike the earlier specifications matching PAC contributions witha related voting index, the vote-buying hypothesis does not imply a specificrelationship between total PAC contributions and changes in these votingindexes. The National Taxpayers Union index is more natural to use withtotal contributions since none of the identifiable PACs unambiguously sup-ports either more or less government spending on all questions. We thusused both the actual and absolute value of the changes in the voting indexto capture whether there were either any systematic changes in voting orincreased dispersion in voting by retiring congressmen.
The results in Table 6 show that in only four of the 20 specifications arechanges in total PAC contributions correlated with changes in the votingindexes. Higher total PAC contributions are associated with higher ADAand COPE scores. These regressions also continue to support our earlierfindings and imply that changes in total PAC contributions affect neitherthe dispersion of political voting scores nor their average score for retiringrepresentatives. Of the 30 interactions involving the retirement dummy andchanges in total PAC contributions, 27 have t-statistics that are less thanone. Yet, even ignoring the lack of significance the coefficients are small
TA
BL
E6
Th
eE
ffec
tof
Red
uce
dT
otal
PAC
Con
trib
uti
ons
onth
eV
otin
gIn
dice
sof
Ret
irin
gR
epre
sen
tati
ves,
1975
–90
Dep
ende
nt
Var
iabl
e
Cha
nge
inIn
dice
sA
bsol
ute
Val
ueof
Cha
nge
inIn
dice
s
AC
UN
TU
NSC
CO
PEA
DA
AC
UN
TU
NSC
CO
PEA
DA
Inde
pen
den
tV
aria
bles
(1)
(2)
(3)
(4)
(5)
(6)
(7)
(8)
(9)
(10)
Ret
ire
24.
031.
112
1.70
21.
352
.992
.801
.053
2.4
72.5
092
.720
(2.3
9)(.
94)
(1.7
1)(.
51)
(.58
)(.
71)
(.07
)(.
21)
(.27
)(.
59)
∆Tot
al$
2.0
052
.000
32
.005
.013
.008
2.0
003
2.0
01.0
01.0
02.0
000
(1.4
2)(.
13)
(1.0
1)(2
.56)
(2.2
8)(.
12)
(.45
)(.
22)
(.47
)(.
01)
Ret
ire*
∆Tot
al$
2.0
26.0
192
.003
2.0
092
.005
2.0
04.0
01.0
192
.019
2.0
04(1
.45)
(1.5
2)(.
09)
(.31
)(.
27)
(.35
)(.
10)
(.78
)(.
92)
(.33
)
(11)
(12)
(13)
(14)
(15)
(16)
(17)
(18)
(19)
(20)
Ret
ire
23.
79.7
872
2.60
22.
092
.795
.768
.359
2.2
541.
192
.411
(2.0
7)(1
.53)
(.85
)(.
73)
(.43
)(.
63)
(.04
3)(.
10)
(.59
)(.
31)
Com
petit
ive
.147
2.3
14.2
922
.096
.912
2.5
46.0
79.6
09.6
83.1
90(.
26)
(.78
)(.
31)
(.11
)(1
.56)
(1.4
2)(.
30)
(.81
)(1
.06)
(.45
)C
ompe
titiv
e*R
etir
e2
1.62
2.13
5.71
4.40
2.9
57.0
172
2.90
21.
532
5.71
22.
24(.
35)
(.65
)(.
74)
(.60
)(.
20)
(.01
)(1
.35)
(.25
)(1
.09)
(.66
)∆T
otal
$2
.005
.001
2.0
05.0
13.0
092
.003
.000
2.0
022
.000
4.0
01(1
.24)
(.44
)(.
86)
(2.2
3)(2
.47)
(1.0
8)(.
12)
(.42
)(.
11)
(.33
)R
etir
e*∆T
otal
$2
.025
.014
2.0
132
.021
2.0
032
.002
2.0
06.0
172
.020
2.0
05(1
.19)
(.96
)(.
36)
(.03
3)(.
14)
(.16
)(.
61)
(.63
)(.
85)
(.31
)C
ompe
titiv
e*∆T
otal
$2
.000
22
.006
2.0
01.0
012
.006
.009
2.0
042
.004
.010
2.0
03(.
03)
(1.3
0)(.
05)
(.09
)(.
82)
(2.0
1)(1
.14)
(.43
)(1
.26)
(.66
)C
ompe
titiv
e*R
etir
e*∆T
otal
$2
.011
.026
.053
.056
2.0
052
.010
.011
.002
2.0
182
.006
(.24
)(.
81)
(.71
)(.
78)
(.12
)(.
34)
(.54
)(.
03)
(.35
)(.
20)
Not
e.—
Abs
olut
eva
lues
oft-
stat
istic
sar
ein
pare
nthe
ses.
See
text
for
defin
ition
sof
abbr
evia
tions
.
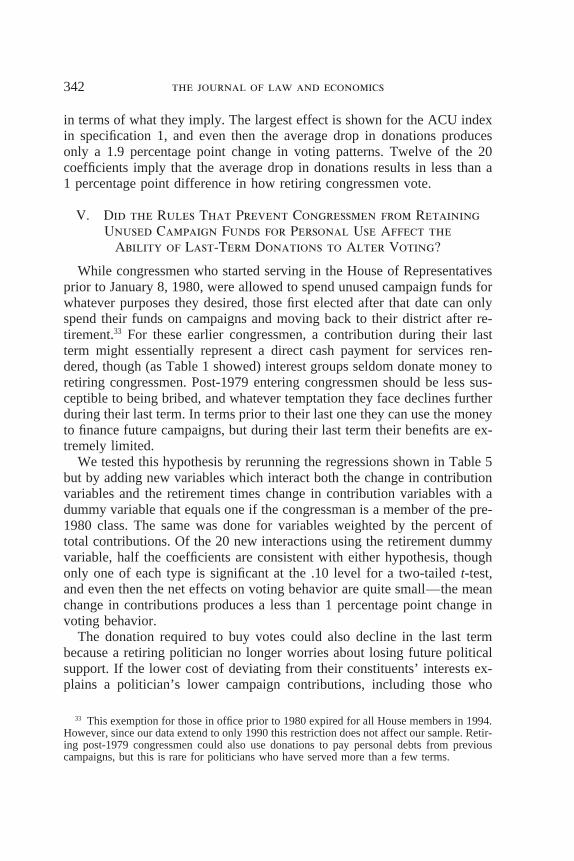
342 the journal of law and economics
in terms of what they imply. The largest effect is shown for the ACU indexin specification 1, and even then the average drop in donations producesonly a 1.9 percentage point change in voting patterns. Twelve of the 20coefficients imply that the average drop in donations results in less than a1 percentage point difference in how retiring congressmen vote.
V. Did the Rules That Prevent Congressmen from RetainingUnused Campaign Funds for Personal Use Affect the
Ability of Last-Term Donations to Alter Voting?
While congressmen who started serving in the House of Representativesprior to January 8, 1980, were allowed to spend unused campaign funds forwhatever purposes they desired, those first elected after that date can onlyspend their funds on campaigns and moving back to their district after re-tirement.33 For these earlier congressmen, a contribution during their lastterm might essentially represent a direct cash payment for services ren-dered, though (as Table 1 showed) interest groups seldom donate money toretiring congressmen. Post-1979 entering congressmen should be less sus-ceptible to being bribed, and whatever temptation they face declines furtherduring their last term. In terms prior to their last one they can use the moneyto finance future campaigns, but during their last term their benefits are ex-tremely limited.
We tested this hypothesis by rerunning the regressions shown in Table 5but by adding new variables which interact both the change in contributionvariables and the retirement times change in contribution variables with adummy variable that equals one if the congressman is a member of the pre-1980 class. The same was done for variables weighted by the percent oftotal contributions. Of the 20 new interactions using the retirement dummyvariable, half the coefficients are consistent with either hypothesis, thoughonly one of each type is significant at the .10 level for a two-tailed t-test,and even then the net effects on voting behavior are quite small—the meanchange in contributions produces a less than 1 percentage point change invoting behavior.
The donation required to buy votes could also decline in the last termbecause a retiring politician no longer worries about losing future politicalsupport. If the lower cost of deviating from their constituents’ interests ex-plains a politician’s lower campaign contributions, including those who
33 This exemption for those in office prior to 1980 expired for all House members in 1994.However, since our data extend to only 1990 this restriction does not affect our sample. Retir-ing post-1979 congressmen could also use donations to pay personal debts from previouscampaigns, but this is rare for politicians who have served more than a few terms.
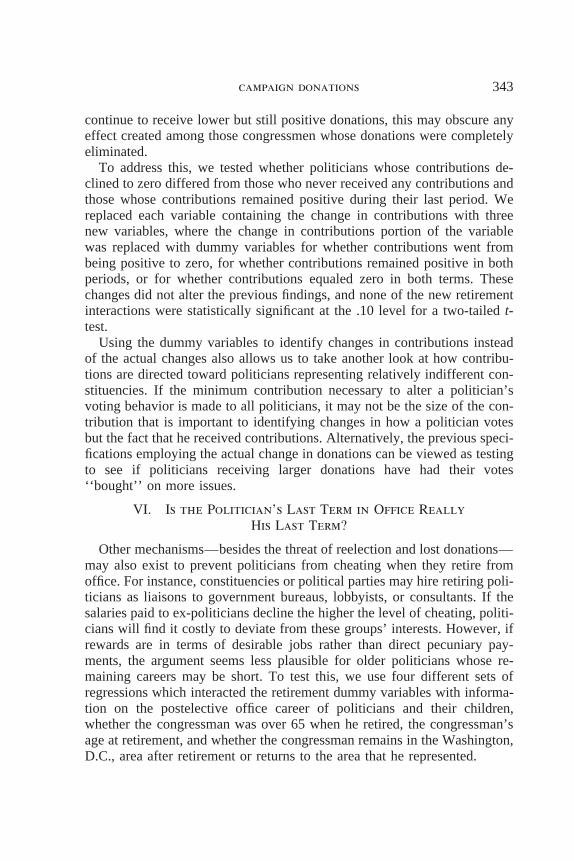
campaign donations 343
continue to receive lower but still positive donations, this may obscure anyeffect created among those congressmen whose donations were completelyeliminated.
To address this, we tested whether politicians whose contributions de-clined to zero differed from those who never received any contributions andthose whose contributions remained positive during their last period. Wereplaced each variable containing the change in contributions with threenew variables, where the change in contributions portion of the variablewas replaced with dummy variables for whether contributions went frombeing positive to zero, for whether contributions remained positive in bothperiods, or for whether contributions equaled zero in both terms. Thesechanges did not alter the previous findings, and none of the new retirementinteractions were statistically significant at the .10 level for a two-tailed t-test.
Using the dummy variables to identify changes in contributions insteadof the actual changes also allows us to take another look at how contribu-tions are directed toward politicians representing relatively indifferent con-stituencies. If the minimum contribution necessary to alter a politician’svoting behavior is made to all politicians, it may not be the size of the con-tribution that is important to identifying changes in how a politician votesbut the fact that he received contributions. Alternatively, the previous speci-fications employing the actual change in donations can be viewed as testingto see if politicians receiving larger donations have had their votes‘‘bought’’ on more issues.
VI. Is the Politician’s Last Term in Office ReallyHis Last Term?
Other mechanisms—besides the threat of reelection and lost donations—may also exist to prevent politicians from cheating when they retire fromoffice. For instance, constituencies or political parties may hire retiring poli-ticians as liaisons to government bureaus, lobbyists, or consultants. If thesalaries paid to ex-politicians decline the higher the level of cheating, politi-cians will find it costly to deviate from these groups’ interests. However, ifrewards are in terms of desirable jobs rather than direct pecuniary pay-ments, the argument seems less plausible for older politicians whose re-maining careers may be short. To test this, we use four different sets ofregressions which interacted the retirement dummy variables with informa-tion on the postelective office career of politicians and their children,whether the congressman was over 65 when he retired, the congressman’sage at retirement, and whether the congressman remains in the Washington,D.C., area after retirement or returns to the area that he represented.
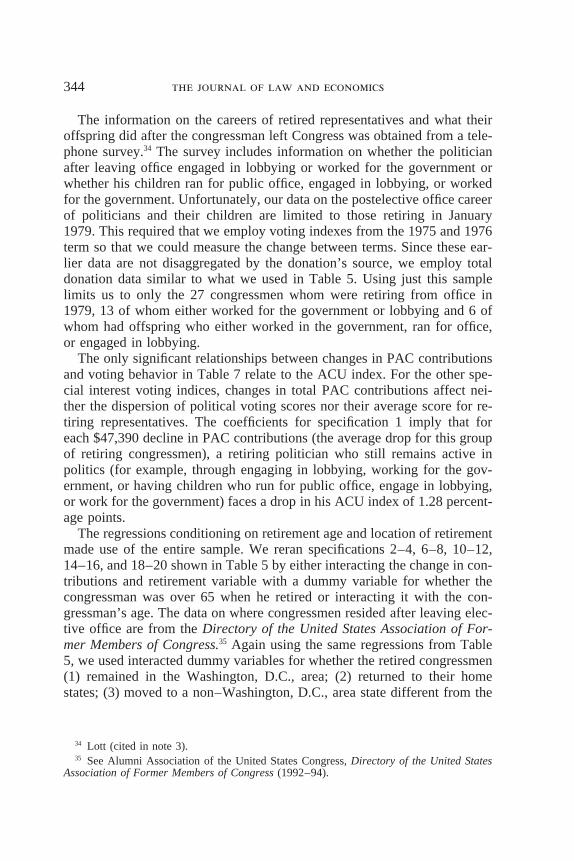
344 the journal of law and economics
The information on the careers of retired representatives and what theiroffspring did after the congressman left Congress was obtained from a tele-phone survey.34 The survey includes information on whether the politicianafter leaving office engaged in lobbying or worked for the government orwhether his children ran for public office, engaged in lobbying, or workedfor the government. Unfortunately, our data on the postelective office careerof politicians and their children are limited to those retiring in January1979. This required that we employ voting indexes from the 1975 and 1976term so that we could measure the change between terms. Since these ear-lier data are not disaggregated by the donation’s source, we employ totaldonation data similar to what we used in Table 5. Using just this samplelimits us to only the 27 congressmen whom were retiring from office in1979, 13 of whom either worked for the government or lobbying and 6 ofwhom had offspring who either worked in the government, ran for office,or engaged in lobbying.
The only significant relationships between changes in PAC contributionsand voting behavior in Table 7 relate to the ACU index. For the other spe-cial interest voting indices, changes in total PAC contributions affect nei-ther the dispersion of political voting scores nor their average score for re-tiring representatives. The coefficients for specification 1 imply that foreach $47,390 decline in PAC contributions (the average drop for this groupof retiring congressmen), a retiring politician who still remains active inpolitics (for example, through engaging in lobbying, working for the gov-ernment, or having children who run for public office, engage in lobbying,or work for the government) faces a drop in his ACU index of 1.28 percent-age points.
The regressions conditioning on retirement age and location of retirementmade use of the entire sample. We reran specifications 2–4, 6–8, 10–12,14–16, and 18–20 shown in Table 5 by either interacting the change in con-tributions and retirement variable with a dummy variable for whether thecongressman was over 65 when he retired or interacting it with the con-gressman’s age. The data on where congressmen resided after leaving elec-tive office are from the Directory of the United States Association of For-mer Members of Congress.35 Again using the same regressions from Table5, we used interacted dummy variables for whether the retired congressmen(1) remained in the Washington, D.C., area; (2) returned to their homestates; (3) moved to a non–Washington, D.C., area state different from the
34 Lott (cited in note 3).35 See Alumni Association of the United States Congress, Directory of the United States
Association of Former Members of Congress (1992–94).
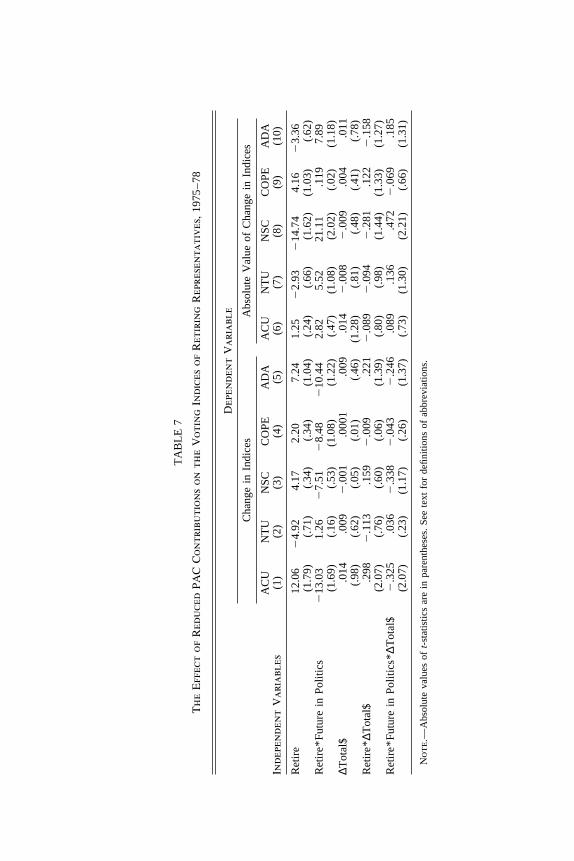
TA
BL
E7
Th
eE
ffec
tof
Red
uce
dPA
CC
ontr
ibu
tion
son
the
Vot
ing
Indi
ces
ofR
etir
ing
Rep
rese
nta
tive
s,19
75–7
8
Dep
ende
nt
Var
iabl
e
Cha
nge
inIn
dice
sA
bsol
ute
Val
ueof
Cha
nge
inIn
dice
s
AC
UN
TU
NSC
CO
PEA
DA
AC
UN
TU
NSC
CO
PEA
DA
Inde
pen
den
tV
aria
bles
(1)
(2)
(3)
(4)
(5)
(6)
(7)
(8)
(9)
(10)
Ret
ire
12.0
62
4.92
4.17
2.20
7.24
1.25
22.
932
14.7
44.
162
3.36
(1.7
9)(.
71)
(.34
)(.
34)
(1.0
4)(.
24)
(.66
)(1
.62)
(1.0
3)(.
62)
Ret
ire*
Futu
rein
Polit
ics
213
.03
1.26
27.
512
8.48
210
.44
2.82
5.52
21.1
1.1
197.
89(1
.69)
(.16
)(.
53)
(1.0
8)(1
.22)
(.47
)(1
.08)
(2.0
2)(.
02)
(1.1
8)∆T
otal
$.0
14.0
092
.001
.000
1.0
09.0
142
.008
2.0
09.0
04.0
11(.
98)
(.62
)(.
05)
(.01
)(.
46)
(1.2
8)(.
81)
(.48
)(.
41)
(.78
)R
etir
e*∆T
otal
$.2
982
.113
.159
2.0
09.2
212
.089
2.0
942
.281
.122
2.1
58(2
.07)
(.76
)(.
60)
(.06
)(1
.39)
(.80
)(.
98)
(1.4
4)(1
.33)
(1.2
7)R
etir
e*Fu
ture
inPo
litic
s*∆T
otal
$2
.325
.036
2.3
382
.043
2.2
46.0
89.1
36.4
722
.069
.185
(2.0
7)(.
23)
(1.1
7)(.
26)
(1.3
7)(.
73)
(1.3
0)(2
.21)
(.66
)(1
.31)
Not
e.—
Abs
olut
eva
lues
oft-
stat
istic
sar
ein
pare
nthe
ses.
See
text
for
defin
ition
sof
abbr
evia
tions
.
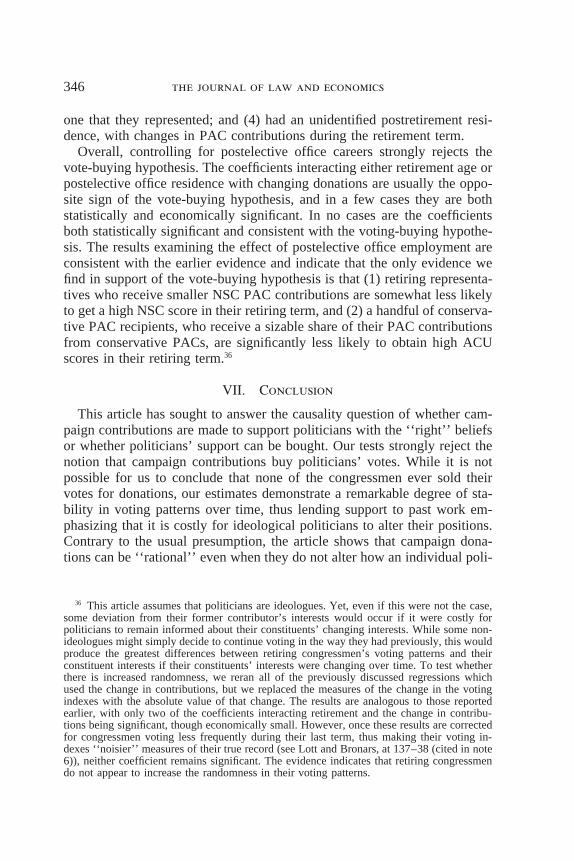
346 the journal of law and economics
one that they represented; and (4) had an unidentified postretirement resi-dence, with changes in PAC contributions during the retirement term.
Overall, controlling for postelective office careers strongly rejects thevote-buying hypothesis. The coefficients interacting either retirement age orpostelective office residence with changing donations are usually the oppo-site sign of the vote-buying hypothesis, and in a few cases they are bothstatistically and economically significant. In no cases are the coefficientsboth statistically significant and consistent with the voting-buying hypothe-sis. The results examining the effect of postelective office employment areconsistent with the earlier evidence and indicate that the only evidence wefind in support of the vote-buying hypothesis is that (1) retiring representa-tives who receive smaller NSC PAC contributions are somewhat less likelyto get a high NSC score in their retiring term, and (2) a handful of conserva-tive PAC recipients, who receive a sizable share of their PAC contributionsfrom conservative PACs, are significantly less likely to obtain high ACUscores in their retiring term.36
VII. Conclusion
This article has sought to answer the causality question of whether cam-paign contributions are made to support politicians with the ‘‘right’’ beliefsor whether politicians’ support can be bought. Our tests strongly reject thenotion that campaign contributions buy politicians’ votes. While it is notpossible for us to conclude that none of the congressmen ever sold theirvotes for donations, our estimates demonstrate a remarkable degree of sta-bility in voting patterns over time, thus lending support to past work em-phasizing that it is costly for ideological politicians to alter their positions.Contrary to the usual presumption, the article shows that campaign dona-tions can be ‘‘rational’’ even when they do not alter how an individual poli-
36 This article assumes that politicians are ideologues. Yet, even if this were not the case,some deviation from their former contributor’s interests would occur if it were costly forpoliticians to remain informed about their constituents’ changing interests. While some non-ideologues might simply decide to continue voting in the way they had previously, this wouldproduce the greatest differences between retiring congressmen’s voting patterns and theirconstituent interests if their constituents’ interests were changing over time. To test whetherthere is increased randomness, we reran all of the previously discussed regressions whichused the change in contributions, but we replaced the measures of the change in the votingindexes with the absolute value of that change. The results are analogous to those reportedearlier, with only two of the coefficients interacting retirement and the change in contribu-tions being significant, though economically small. However, once these results are correctedfor congressmen voting less frequently during their last term, thus making their voting in-dexes ‘‘noisier’’ measures of their true record (see Lott and Bronars, at 137–38 (cited in note6)), neither coefficient remains significant. The evidence indicates that retiring congressmendo not appear to increase the randomness in their voting patterns.
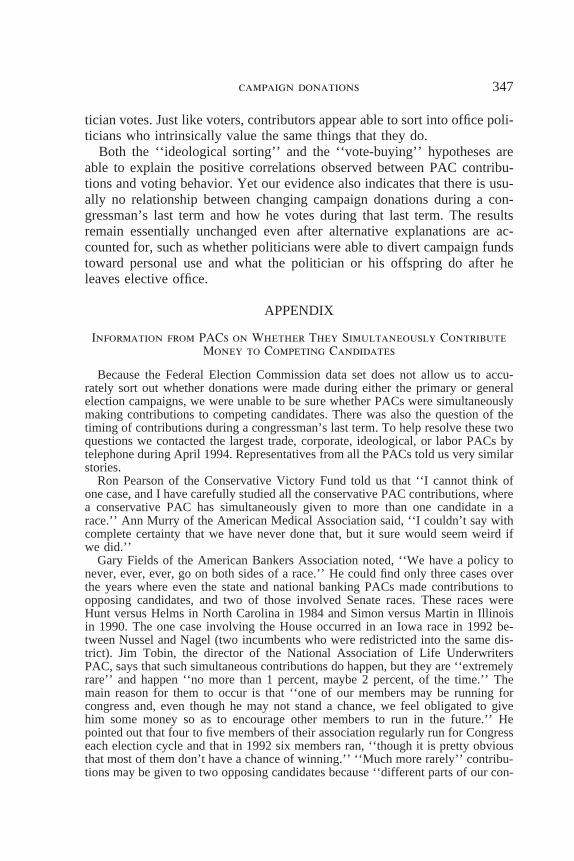
campaign donations 347
tician votes. Just like voters, contributors appear able to sort into office poli-ticians who intrinsically value the same things that they do.
Both the ‘‘ideological sorting’’ and the ‘‘vote-buying’’ hypotheses areable to explain the positive correlations observed between PAC contribu-tions and voting behavior. Yet our evidence also indicates that there is usu-ally no relationship between changing campaign donations during a con-gressman’s last term and how he votes during that last term. The resultsremain essentially unchanged even after alternative explanations are ac-counted for, such as whether politicians were able to divert campaign fundstoward personal use and what the politician or his offspring do after heleaves elective office.
APPENDIX
Information from PACs on Whether They Simultaneously ContributeMoney to Competing Candidates
Because the Federal Election Commission data set does not allow us to accu-rately sort out whether donations were made during either the primary or generalelection campaigns, we were unable to be sure whether PACs were simultaneouslymaking contributions to competing candidates. There was also the question of thetiming of contributions during a congressman’s last term. To help resolve these twoquestions we contacted the largest trade, corporate, ideological, or labor PACs bytelephone during April 1994. Representatives from all the PACs told us very similarstories.
Ron Pearson of the Conservative Victory Fund told us that ‘‘I cannot think ofone case, and I have carefully studied all the conservative PAC contributions, wherea conservative PAC has simultaneously given to more than one candidate in arace.’’ Ann Murry of the American Medical Association said, ‘‘I couldn’t say withcomplete certainty that we have never done that, but it sure would seem weird ifwe did.’’
Gary Fields of the American Bankers Association noted, ‘‘We have a policy tonever, ever, ever, go on both sides of a race.’’ He could find only three cases overthe years where even the state and national banking PACs made contributions toopposing candidates, and two of those involved Senate races. These races wereHunt versus Helms in North Carolina in 1984 and Simon versus Martin in Illinoisin 1990. The one case involving the House occurred in an Iowa race in 1992 be-tween Nussel and Nagel (two incumbents who were redistricted into the same dis-trict). Jim Tobin, the director of the National Association of Life UnderwritersPAC, says that such simultaneous contributions do happen, but they are ‘‘extremelyrare’’ and happen ‘‘no more than 1 percent, maybe 2 percent, of the time.’’ Themain reason for them to occur is that ‘‘one of our members may be running forcongress and, even though he may not stand a chance, we feel obligated to givehim some money so as to encourage other members to run in the future.’’ Hepointed out that four to five members of their association regularly run for Congresseach election cycle and that in 1992 six members ran, ‘‘though it is pretty obviousthat most of them don’t have a chance of winning.’’ ‘‘Much more rarely’’ contribu-tions may be given to two opposing candidates because ‘‘different parts of our con-
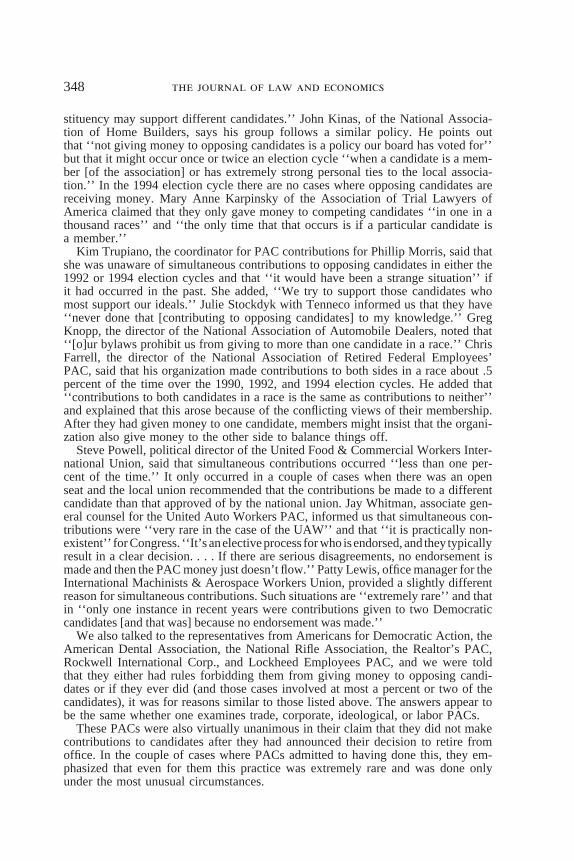
348 the journal of law and economics
stituency may support different candidates.’’ John Kinas, of the National Associa-tion of Home Builders, says his group follows a similar policy. He points outthat ‘‘not giving money to opposing candidates is a policy our board has voted for’’but that it might occur once or twice an election cycle ‘‘when a candidate is a mem-ber [of the association] or has extremely strong personal ties to the local associa-tion.’’ In the 1994 election cycle there are no cases where opposing candidates arereceiving money. Mary Anne Karpinsky of the Association of Trial Lawyers ofAmerica claimed that they only gave money to competing candidates ‘‘in one in athousand races’’ and ‘‘the only time that that occurs is if a particular candidate isa member.’’
Kim Trupiano, the coordinator for PAC contributions for Phillip Morris, said thatshe was unaware of simultaneous contributions to opposing candidates in either the1992 or 1994 election cycles and that ‘‘it would have been a strange situation’’ ifit had occurred in the past. She added, ‘‘We try to support those candidates whomost support our ideals.’’ Julie Stockdyk with Tenneco informed us that they have‘‘never done that [contributing to opposing candidates] to my knowledge.’’ GregKnopp, the director of the National Association of Automobile Dealers, noted that‘‘[o]ur bylaws prohibit us from giving to more than one candidate in a race.’’ ChrisFarrell, the director of the National Association of Retired Federal Employees’PAC, said that his organization made contributions to both sides in a race about .5percent of the time over the 1990, 1992, and 1994 election cycles. He added that‘‘contributions to both candidates in a race is the same as contributions to neither’’and explained that this arose because of the conflicting views of their membership.After they had given money to one candidate, members might insist that the organi-zation also give money to the other side to balance things off.
Steve Powell, political director of the United Food & Commercial Workers Inter-national Union, said that simultaneous contributions occurred ‘‘less than one per-cent of the time.’’ It only occurred in a couple of cases when there was an openseat and the local union recommended that the contributions be made to a differentcandidate than that approved of by the national union. Jay Whitman, associate gen-eral counsel for the United Auto Workers PAC, informed us that simultaneous con-tributions were ‘‘very rare in the case of the UAW’’ and that ‘‘it is practically non-existent’’ for Congress. ‘‘It’s anelective process for who isendorsed, and they typicallyresult in a clear decision. . . . If there are serious disagreements, no endorsement ismade and then the PAC money just doesn’t flow.’’ Patty Lewis, office manager for theInternational Machinists & Aerospace Workers Union, provided a slightly differentreason for simultaneous contributions. Such situations are ‘‘extremely rare’’ and thatin ‘‘only one instance in recent years were contributions given to two Democraticcandidates [and that was] because no endorsement was made.’’
We also talked to the representatives from Americans for Democratic Action, theAmerican Dental Association, the National Rifle Association, the Realtor’s PAC,Rockwell International Corp., and Lockheed Employees PAC, and we were toldthat they either had rules forbidding them from giving money to opposing candi-dates or if they ever did (and those cases involved at most a percent or two of thecandidates), it was for reasons similar to those listed above. The answers appear tobe the same whether one examines trade, corporate, ideological, or labor PACs.
These PACs were also virtually unanimous in their claim that they did not makecontributions to candidates after they had announced their decision to retire fromoffice. In the couple of cases where PACs admitted to having done this, they em-phasized that even for them this practice was extremely rare and was done onlyunder the most unusual circumstances.
campaign donations 349
Bibliography
Alumni Association of the United States Congress. Directory of the United StatesAssociation of Former Members of Congress. Washington, DC: U.S. Associationof Former Members of Congress, 1992–94.
Bender, Bruce, and Lott, John R., Jr. ‘‘Legislator Voting and Shirking: A CriticalReview of the Literature.’’ Public Choice 87 (1996): 67–100.
Chappell, Henry W., Jr. ‘‘Campaign Contributions and Voting on the Cargo Prefer-ence Bill: A Comparison of Simultaneous Models.’’ Public Choice 36 (1981):301–12.
Chappell, Henry W., Jr. ‘‘Campaign Contributions and Congressional Voting: ASimultaneous Probit-Tobit Model.’’ Review of Economics and Statistics 64(1982): 77–83.
Coats, Morris, and Dalton, Thomas. ‘‘Entry Barriers in Politics and UncontestedElections.’’ Journal of Public Economics 49 (1992): 75–90.
Coker, D. C., and Crain, W. Mark. ‘‘Legislative Committees as Loyalty-GeneratingInstitutions.’’ Public Choice 81 (1994): 195–222.
Crain, W. Mark; Leavens, Donald R.; and Tollison, Robert D. ‘‘Final Voting inLegislatures.’’ American Economic Review 76 (1986): 833–41.
Denzau, Arthur T., and Munger, Michael C. ‘‘Legislators and Interest Groups: HowUnorganized Interests Get Represented.’’ American Political Science Review 80(1986): 89–106.
Endersby, James W., and Munger, Michael C. ‘‘The Impact of Legislator Attributeson Union PAC Campaign Contributions.’’ Journal of Labor Research 13 (1992):79–97.
Fort, Rodney; Hallagan, William; Morong, Cyril; and Stegner, Tesa. ‘‘The Ideolog-ical Component of Senate Voting: Different Principles or Different Principals?’’Public Choice 76 (1993): 39–57.
Frendreis, John P., and Waterman, Richard W. ‘‘PAC Contributions and LegislativeBehavior: Senate Voting on Trucking Deregulation.’’ Social Science Quarterly66 (1985): 401–12.
Grier, Kevin, and Munger, Michael. ‘‘The Impact of Legislator Attributes on Interest-Group Campaign Contributions.’’ Journal of Labor Research 7 (1986): 347–61.
Hall, Richard L., and Wayman, Frank W. ‘‘Buying Time: Moneyed Interests andthe Mobilization of Bias in Congressional Committees.’’ American Political Sci-ence Review 84 (1990): 797–820.
Hersch, P. L., and McDougall, G. S. ‘‘Campaign War Chests as a Barrier to Entryin Congressional Races.’’ Economic Inquiry 32 (1994): 630–41.
Kau, James B.; Keenan, Donald; and Rubin, Paul H. ‘‘A General EquilibriumModel of Congressional Voting.’’ Quarterly Journal of Economics 97 (1982):271–93.
Kau, James B., and Rubin, Paul H. Congressmen, Constituents, and Contributors:Determinants of Roll Call Voting in the House of Representatives. Boston: Nij-hoff, 1982.
Kau, James B., and Rubin, Paul H. ‘‘Ideology, Voting, and Shirking.’’ PublicChoice 76 (1993): 151–72.
Lott, John R., Jr. ‘‘Political Cheating.’’ Public Choice 52 (1987): 169–87.
350 the journal of law and economics
Lott, John R., Jr. ‘‘The Effect of Nontransferable Property Rights on the Efficiencyof Political Markets: Some Evidence.’’ Journal of Public Economics 32 (1987):231–46.
Lott, John R., Jr., and Bronars, Stephen G. ‘‘Time Series Evidence on Shirking inthe U.S. House of Representatives.’’ Public Choice 76 (1993): 125–49.
Lott, John R., Jr., and Davis, Michael L. ‘‘A Critical Review and an Extension ofthe Political Shirking Literature.’’ Public Choice 74 (1992): 461–84.
Lott, John R., Jr., and Reed, W. R. ‘‘Shirking and Sorting in a Model of Finite-Lived Politicians.’’ Public Choice 61 (1989): 75–96.
Masters, Marick F. ‘‘Congressional Support for Unions’ Positions across DiverseLegislation.’’ Journal of Labor Research 9 (1988): 149–65.
Peltzman, Sam. ‘‘Constituent Interest and Congressional Voting.’’ Journal of Lawand Economics 27 (1984): 181–210.
Peltzman, Sam. ‘‘An Economic Interpretation of the History of Congressional Vot-ing in the Twentieth Century.’’ American Economic Review 75 (1985): 656–75.
Silberman, J. I., and Durden, G. C. ‘‘Determining Legislative Preferences on theMinimum Wage: An Economic Approach.’’ Journal of Political Economy 84(1976): 317–29.
Stratmann, Thomas. ‘‘What Do Campaign Contributions Buy? Deciphering CausalEffects of Money and Votes.’’ Southern Economic Journal 57 (1991): 606–20.
Stratmann, Thomas. ‘‘Are Contributors Rational? Untangling Strategies of PoliticalAction Committees.’’ Journal of Political Economy 100 (1992): 647–64.
Welch, W. P. ‘‘Campaign Contributions and Legislative Voting: Milk Money andDairy Price Supports.’’ Western Political Quarterly 35 (1982): 478–95.