Embed Size (px)
Citation preview

Do Banks Charge Information Rent in Lending Relationships? Cross-
Country Evidence
Abstract
The paper examines the impact of lending relationships on loan contract terms using a sample of
6500 loans from 40 countries. We find that relationship lending on average leads to higher
interest rate, lower collateral requirement, and shorter loan maturity for our sample of
international borrowers. However, we also show that there is significant variation across
countries regarding the benefits and costs of banking relationships, which can be explained by
countries’ legal and regulatory environments. Stronger creditor rights and higher disclosure
requirements can significantly increase the benefits of relationship lending. Borrowers in
countries with well enforced creditor rights and strict disclosure regulations actually pay lower
interest rate on relationship loans.
I. Introduction
The issue of whether it is beneficial for firms to engage in lending relationships has generated
continuous interest in the literature. Recent evidence suggests that at least for public firms in the
U.S., relationship lending seems to lower the cost of the loan for the borrower (for example, see
Bharath, Dahiya, Saunders, and Srinivasan, 2011; and Schenone, 2010). One explanation for
this finding is that relationship lending reduces the information asymmetry between the lender
and the borrower, which leads to lower cost for the lender. It follows as long as the relationship
lender is willing to share part of the benefits with the borrower, it will also reduce the loan costs
for the borrower as well (Boot and Thakor, 1994).
However, it is not clear that relationship lending always leads to such benefits. An alternative
theory initiated by Sharpe (1990) argues that there is also a lock-in effect associated with
relationship lending, which is caused by the adverse selection problem existing between outside
lenders and the borrower. Such “lock-in” effect can induce relationship lender to extract
economic rent in the form of higher interest rate. This argument is supported by evidences based
on loans originated by privately held borrowers (Petersen and Rajan (1994), Degryse and Van
Cayseele (2000), and Schenone, 2010).
1
For public firms, it remains an open question whether the empirical evidence extends beyond the
U.S. firms. Compared to most other countries, U.S firms have the advantage of having access to
well-developed financial markets as well as strict disclosure requirements that reduce the
information asymmetry between relationship lenders and non-lenders. In addition, prospective
lenders in U.S. are protected by well enforced legal system that supports creditor rights, which
can lead to higher incentives for risk taking (Houston, Lin, Lin, and Ma, 2010). These
institutional factors can lead to stronger competition from outside lenders for the borrower
despite the adverse selection problem (already low due to disclosure regulation), which can force
the relationship lender to share the benefits of the relationship with the borrower. However, not
all countries have equally well developed legal and institutional environments as in U.S. In
countries where creditor rights are less protected and law enforcement is poor, outside lenders
may be more cautious and refrain from taking risks on firms with serious adverse selection
problems. The adverse selection problem between the relationship borrower and prospective
lenders is also more serious in countries where disclosure requirements are low, as less credible
information about the borrower is available to outsider lenders. These factors can deter
competition and lead to hold-up problems in which relationship banks charge monopoly
economic rents on the borrower in the form of higher interest rate.
In this paper, we examine the variation across countries regarding the impact of relationship
lending on loan contract terms. We conjecture that a country’s institutional factors such as
creditor right protection and disclosure regulations play an important role in determining the
costs and benefits of relationship lending beyond what can be explained by borrower’s firm level
characteristics. We expect that to the extent that a country’s legal regimes and disclosure
regulations can foster competition, relationship lending will be beneficial to the borrower.
Conversely, in countries where competition is less supported by the legal and regulatory regimes,
relationship lending may become more costly.
To date, cross-country evidence on the effects of relationship lending on loan contract terms has
been limited. Using data from 20 European countries, Ongena and Smith (2000) find that firms
in countries with strong creditor rights choose to borrow from a smaller number of banks;
however they do not examine the value of the banking relationship. Degryse and Van Cayseele

2
(2000) examine the value of banking relationship in a non-U.S. setting and find that the length of
the relationship is associated with higher interest rate, however their study only focuses on one
country, Belgium. More recently in a related study, Ferreira and Matos (2012) provides some
initial evidences that having banks involving in corporate governance may not be beneficial to
the firm as a lender in the global setting.
Using a broader sample that includes 6524 syndicated loans from 40 countries, our paper is the
first to investigate the link between countries’ institutional characteristics and the value of
relationship lending. We find that a country’s level of disclosure requirement and creditor right
protection has significant impact on whether or not an entrenched bank in relationship loans
charges information rent. In countries where creditor right protection is low, borrowers in
relationship lending are more likely to get stuck in the “locked-in” effect and pay hold-up costs
in the form of higher interest rate. As the countries’ levels of creditor right protection increase,
relationship lending becomes more beneficial. We find a similar relation between country’s
disclosure requirement and relationship lending. In countries with low disclosure requirement,
borrowers of relationship loans pay higher interest cost than on non-relationship loans. As the
disclosure regulation of the country becomes more stringent, borrowers in relationship loans pay
lower interest rate and relationship lending becomes beneficial.
We also employ a propensity score matching (PSM) approach to control for the endogeneity
issue in relationship loan studies and to examine the various determinants of the relationship
lending’s impact on loan cost. We find that while firm level variables such as size and
profitability significantly affect the interest rate premium (or discount) paid on relationship loans
vis-a-vis non-relationship loans, firm characteristics alone cannot explain the variations in the
difference in interest rate across-countries. We show that countries’ legal regimes and
institutions offer significant additional explanation power on top of firm and industry variables.
Borrowers in relationship loans pay an interest rate premium in countries where creditor right
protection is weak and disclosure requirement is low. The interest premium decreases as
countries’ creditor right and disclosure regulation strengthen and eventually switches to discount
in countries with stringent creditor right protection and disclosure regulation.

3
To account for unobserved time-varying country factors in our cross-sectional regression, we
implement difference-in-difference-in-difference tests using exogenous changes in country’s
level of creditor right protection and disclosure requirement standard. For changes in creditor
right protection, we use changes in creditor right index from year to year collected from and
Djankov, McLiesh, and Shleifer (2007) and World Bank Doing Business Database. For changes
in disclosure requirement, we use the adoption of IFRS by 22 countries in 2005 as a natural
experiment. We find that decrease in country’s level of creditor right protection significantly
increases the interest paid on relationship loans relative to non-relationship loans. Similarly, an
increase in a country’s disclosure requirement standard reduces the interest paid on relationship
loans, and the greater is the improvement in disclosure standard, the greater is the reduction in
interest cost. The results largely confirm our cross-sectional tests findings.
In addition to above tests, we also find that the country’s institutional characteristics also affect
the impact of firm level opacity on the benefits and costs of relationship lending. In countries
with weak institutions, higher firm level information opacity induce higher interest rate paid on
relationship loans. However, in countries with strong legal environments, higher firm level
information opacity actually leads to lower interest rate on relationship loans. The result is
consistent with the hypothesis that information opacity increases the potential benefits of
relationship lending when such relationship is beneficial, but can cause higher adverse selection
problem when hold-up problem exist.
Finally, we study the impact of relationship lending on non-price terms of the loan (loan maturity
and collateral). Consistent with the idea that lending-relationships lower the information
asymmetry between the lender and borrower; relationship loans are less likely to require
collateral. The difference in collateral requirement between relationship loans and non-
relationship loans is more significant in countries with high creditor rights. We believe this is
due to the reason that collateral is more effective in countries with better creditor rights
protection and thus are used more often for non-relationship loans. We also find that relationship
loans are associated with shorter loan maturity, which is consistent with the idea that relationship
lending lowers the monitoring costs for the lender, which gives them more incentives to use
shorter maturity loans.

4
Our paper makes several contributions to the literature. First, our paper extends the research in
banking relationship and the value of relationship lending. Evidences on the value of relationship
lending have been mixed. Bharath, Dahiya, Saunders, and Srinivasan (2011) find relationship
lending to reduce interest rate for U.S. public firms while Ferreira and Matos (2012) find that
syndicated loans in global markets have higher interest rate when banks are involved in lenders’
corporate governance. Our study is the first to examine whether there is a cross-country variation
in the value of relationship lending and to try to determine the causes for such variation. Our
paper adds to the literature by providing evidence on the existence of information rent for public
firms only in countries with less stringent disclosure requirements and creditor rights protection.
Second, our paper contributes to the law and finance literature by demonstrating the significant
impact of legal, regulatory, and institutional environments on the costs and benefits of lending
relationships. Various studies have examined the influence of countries’ disclosure requirement
and creditor rights on firms’ characteristics such as cost of capital, innovation activities and loan
interest rates (e.g. see Daske, Hail, Leuz, and Verdi (2008), Acharya and Subramanian (2009),
and Qian and Strahan (2007)) To our knowledge, our paper is the first to examine the impact of
changes in countries’ regulation on relationship lending.
The remainder of the paper proceeds as follows. Section II discusses related literature and the
main hypothesis of the paper. Section III describes the data. Section IV reports the main results
on loan interests. Section V examines non-price loan contract terms. Section VI discusses the
robustness tests, and Section VII concludes this paper.
II. Related Literature and Hypothesis Development
A. Existing Theories on the Value of Relationship Lending
There are two prevailing theories regarding the benefits and costs of relationship lending on loan
contracts. The first one is proposed by Boot and Thakor (1994), who argue that loan interest rate
should decrease as banking relationship intensifies. By reducing the information asymmetry
between the lender and the borrower, relationship lending can reduce the cost of monitoring, that

5
of loans to relationship lenders. The authors argue that as long as the relationship lender is
willing to share part of the savings with the borrower, it will reduce the loan costs for the
borrower as well.
Recent empirical studies on syndicated loans of U.S. public firms provide support to this
argument. Using relationship measures based on past loans with the lender, Bharath et al. (2011)
find that relationship lending provides significant benefits to U.S. public borrowers, both in the
form of lower interest rate and lower collateral requirements. The authors also find that firm
level information opacity significantly increases the benefits of relationship lending. Examining
interest cost on syndicated loans by firms before and after IPO, Schenone (2010) also finds that
interest rate is lower on relationship loans after the borrower went public.
However, alternative theory proposed by Sharpe (1990) and Greenbaum, Kanatas, and Venezia
(1989) asserts that relationship lending can lead to unexpected hold-up problems by the
relationship bank. The authors explain that as relationship between the lender and the borrower
deepens, the lender is able to acquire proprietary information about the borrower which increases
the information asymmetry between the lending bank and prospective lenders. The information
advantage can lead to adverse selection problem for the borrower when it’s seeking financing
from alternative lending banks. As a result, when outside competition is low, the relationship
lender may be able to charge the borrower monopoly rent in the form of higher interest rate.
The empirical evidence based on studies of loans originated by small, private held borrowers is
mixed. Using loan maturity of loans granted to small businesses as a measure of the length of
lending relationship, Petersen and Rajan (1994) finds no relationship between length of
relationship and cost of loan. Degryse and Van Cayseele (2000) find that interest rate actually
increase with length of relationship, which provides support to the lock-in effect of relationship
lending. In contrast, Berger and Udell (1995) find that firms in longer relationships pay lower
interest rate. More recently, Schenone (2010) find that relationship lenders extract economic rent
in the form of higher interest rate on borrowers before they go public.
B. Hypothesis on the Impact of Country Legal and Institution

6
We hypothesize that development in a country’s level of creditor rights protection and disclosure
requirement can significantly increase the value of lending relationships. In this section, we
discuss their potential effects on the benefits and costs of relationship lending.
B.1 Creditor Rights
Following LLSV (1998), we use the creditor right index to measure the level of creditor right
protection in a country. The index consists of four conditions with a value of 1 added to the
index for each condition that holds: (1) Secured creditors gain possession of assets once the
petition for reorganization receives approval (i.e., there is no automatic stay on creditors’ ability
to seize collateral); (2) secured creditors are ranked first in the distribution of proceeds in case of
liquidation; (3) there are restrictions such as creditors’ consent for going into reorganization; and
(4) (incumbent) management does not stay in control of the firm during the reorganization.
We hypothesize that creditor rights can have an indirect and yet positive impact on the value of
lending relationship. Research has shown that stronger creditor right is associated with both
creditors’ willingness to grant credit (Djankov, McLiesh, and Shleifer (DMS), 2007) and banks’
appetite of risk taking (Houston et al., 2010). More specifically, in countries with better creditor
right protection, lenders are more likely to recover collateral, force repayment, or even gain
control of the debtor’s assets in the event of financial distress (Houston et al., 2010). Such
actions will increase the recovery rate for banks at the event of default, and as a result will
increase the banks’ risk tolerance. With higher tolerance for default rate, we expect lenders to be
more willingly to lend to riskier borrowers.
In the case of relationship lending, when borrowers in an existing relationship seek to switch
lenders, outside creditors faces additional risks due to the adverse selection problem.
Relationship borrowers who cannot overcome this adverse selection problem will be forced to
stay with the existing relationship lender, who may take advantage of the situation to charge
information rent (Sharpe (1990)). Besides reducing the information asymmetry between the
relationship lender and outside creditors, one way to mitigate the impact of the adverse selection
risk is to increase the margin of error for outside lenders and lower their expected loss in case of
a default. Since stronger creditor rights lead to higher asset recovery rate, we expect outside

7
lenders to show a greater tolerance for adverse selection risk as the consequence of misjudgment
becomes less severe. As a result, more borrowers will have the option to opt-out of their existing
relationship when it’s not satisfactory, which will increase the competition for the relationship
lender and drive down potential hold-up costs. Similarly, we also expect the “lock-in” effect to
be the most severe in countries with weak creditor rights protection.
On additional factor that bears on the issue is the legal enforcement in the country. Creditor
rights alone are not sufficient if they cannot be faithfully enforced. We use the Rule of Law
index from La Porta et al. (1997) to capture the law enforcement tradition in a country. The
index is from 1 to 10, with 10 being the strongest and 1 being the weakest. Following Ongene
and Smith (2000), we combine the creditor rights index and the rule of index by multiplying
them. The new index allows us to measure the true effective protection of creditor rights in a
country.
B.2 Disclosure Regulation
As discussed earlier, information asymmetry between the borrower and non-lenders can have
significant impact on the benefits and costs of a lending relationship. When non-lenders believe
that the relationship lender holds significantly more information about the borrower than what is
available to out-side lenders, the relationship borrower will face significant adverse selection
problem when seeking alternative lenders.
One way to mitigate this problem is to simply reduce the information asymmetry between the
firm and outside lenders. However, disclosure by the borrower can only be effective if such
disclosure is credible and not self-serving (see, Hail and Leuz, 2005; and Verrecchia, 2001).
Without a reliable way to show commitment, investors may treat any voluntary disclosure with
skepticism since firms may have incentives to manipulate or withhold information in certain
situations, e.g. when performance is poor or risk is high.
Based on these considerations, we conjecture that country level disclosure regulations will play
an important role in determining the costs and benefits of relationship lending beyond what can
be explained by firm level information available. Effective disclosure regulations bind firms to

8
provide a certain level of information in both good and bad times, which can be credibly used by
outside lenders to evaluate the borrower and reduce information asymmetry between prospective
lenders and the relationship lender. In addition to its impact on information asymmetry,
disclosure regulations can also increase the usefulness of capital markets for securities and
reduce cost of capital (Hail and Leuz, 2005). Easier access to capital markets can provide
alternative financing to the borrower and drive up competition for the relationship lender.
There is a potentially negative impact of disclosure requirement on relationship lending,
however. If information asymmetry between relationship lender and prospective creditors are
low due to disclosure regulations, the lender will not be able to gain significant savings from the
relationship and will not be able to share as much with the borrower. However, we believe this
problem with disclosure regulation is limited as it only exists in countries where relationship
banking is already beneficial. In addition, Bharath et al. (2011) show that even in countries with
high disclosure requirement like the U.S., there are still sufficient firm level information
asymmetry left for banks to gain benefits from the relationship.
Following Hail and Leuz (2005), we use the prospectus disclosure requirement index from La
Porta et al. (2005) as our proxy for the level of a country’s disclosure requirement. While it is
more related to stock market than accounting statement disclosure, the index allows us to
effectively capture the regulation rather than voluntary disclosure practice.
III. Data and Summary Statistics
A. Data and Relationship Intensity Measure
We obtain syndicate loan data from the Dealscan database by the Loan Pricing Corporation
(LPC). LPC provides detailed information on loan coverage going back to the 1980s. For loans
greater than $100,000, Dealscan reports the structure of the lending syndicate and the identity of
the syndicate members, as well as loan characteristics such as interest rates (basis point spread
over LIBOR rate, including all fees), collateral requirement, the loan amount, and time to
maturity. However, Dealscan coverage on international firms is sparse until the 1990s. To reduce
sample selection bias, our sample covers loans by international firms from 1990 to 2007.

9
While Dealscan provides detailed data on the loan information, it does not have data on the
borrowers’ characteristics. To obtain this information, we manually match the names of the
borrowers with company names from Worldscope. Through Worldscope, we are able to collect
borrower’s balance sheet and income statement financial information such as firm size,
profitability, leverage, and asset tangibility. We are also able to extract the borrower’s primary
SIC code and exclude from our data set loans to firms who are in the financial (SIC 6) and public
industry (SIC 9) since these firms are more likely to be influenced by government regulation and
may have different risk characteristics from other type of borrowers. Bank mergers can affect a
pre-existing lending relationship. To control for mergers and acquisition activities in the banking
sector, we construct a chronology of banking M&A using hand-matched data from SDC
Platinum mergers and acquisition database and searching through Lexis-Nexis.
To measure a borrower’s strength of relationship with the lending bank, we follow Schenone
(2010) and Bharath, Dahiya, Saunders, and Srinivasan (2011) and use two measures that based
on the past loans the firm had borrowed from the same lead banker. The first one calculates the
number of loans that the firm has borrowed from its lead lender as a proportion of the total loans
the firm has borrowed. More specifically, the measure is constructed as follows:
For each firm i that borrows loan l from lead lender bank m, we first find all the loans that the
firm has borrowed up to loan l for the past five years. Then we determine how many loans prior
to loan l has the same lead lender m as loan l in the past five years, we call it Prior_by_Lead. By
definition, Prior_by_Lead has a minimum number of 0 and a maximum number of l-1 and the
total loan number range from 1 to l. The first relationship intensity measure Relation (Number) is
then equal to:
li
li
iDatetoLoansofNumberTotal
LeadbyNumberLoaniorNumber
,
,
_____
____Pr)(Relation
A second and similar measure is based on the dollar amount of loans that the firm has borrowed
from its lead lender as a proportion of the total dollar amount of loans the firm has borrowed in
the past five years. Again for loan l from bank m to firm i, the variable is constructed as:

10
li
li
iDatetoLoansofAmountTotal
LeadbyAmountLoaniorAmount
,
,
_____
____Pr)(Relation
To define a bank as lead lender, we examine the Dealscan field that describes the lender’s role in
loan syndication. The field includes a number of descriptions such as “admin agent”, “Lead
Bank”, “Arranger”, “Bookrunner” etc. No consistent description or methodology has been used
by LPC to design as lead lender. Hence, following previous literature (Dennis and Mullineaux
(2000), Bharath, Dahiya, Saunders, and Srinivasan (2007)), we classify an institution as a lead
lender if the bank’s description includes one of the following: “agent” (Admin agent, Managing
agent, and agent), “Arranger” (Lead arranger, Mandated arranger, Arranger), “Lead Bank”, and
“Bookrunner”. Unlike previous literature that study U.S. firms, many of the loans in the sample
include multiple lead bankers. Out of 6524 loans, 1100 loans have more than one lead bank in
the syndication. In the case where there are multiple lead bankers for a loan, we take the highest
relationship measure from all the lead banks for the loan as our relationship intensity measure.
B. Summary Statistics
Table I, panel A provides the distribution of loans by country as well as some key country level
variables that capture the development of the country’s private debt market. The key variable of
our interest, the interest spread over LIBOR (reported in Dealscan as All-in-Drawn, referred in
our paper as AISD), is missing in about half of our observations; thus we report both the number
of the total sample of loans as well as number of loans with the All-in-Drawn variable. In total,
there are 6524 loans and 3635 of those have the interest spread information. The distribution of
the number of loans across countries is consistent with previous research on international
syndicated loans (see Qian and Strahan, 2007). Overall there is significant variation in the
number of loans with the greatest concentration of loans in European and East Asian countries.
Relationship loans account for slightly less than half of the total loans and there is no clear
pattern as to what type of countries is more likely to have relationship loans. There is no apparent
bias towards any group of countries in the omission of interest spread in the sample loans except
for Japan (the observation is clustered for Japan in the total sample, but not for samples with all-
in-drawn variable). The reduction in sample size is also evenly distributed between relationship
loans and non-relationship loans.

11
We also show the development of private bond market (measured as total bonds issued by
private firms divided by GDP), creditor right protection, and bank concentration by the three
largest banks in the country. Not surprisingly, European countries have the most developed
private bond markets. We also find that European countries have the highest bank concentration,
but the results are mostly driven by Scandinavian countries.
Panel B reports the loan and firm characteristics by country. Similar to loan number, both loan
size and loan price vary significantly across countries. Firms in European countries in general are
able to borrow larger amount of loans as well as pay a lower interest rate compared to other
regions. The average loan size for European countries is 817 million while the average loan size
for Asian and South American countries is 152 million and 227 million respectively. European
countries only need to pay a spread of 73 basis points on average while Asian countries need to
pay 103 basis points and South American countries need to pay 198 basis points. The
differences, especially in loan size, can be partly explained by firm size. The borrowers in the top
quartile firm size have an average loan size of 877 million versus 224 million for the other
borrowers.
C. Univariate Analysis
Table 2 reports the interest rate paid by borrowers in both relationship loans and non-relationship
loans. We classify the borrowing firms based on their countries’ legal origin, level of disclosure
requirement, public bond market development, creditor right protection, and concentration in the
banking sector. Schenone (2010) finds that for U.S. loans, banks tend to offer lower interest rate
at the early stage of the lending relationship, but substantially increases the interest rate as the
relationship deepens. To examine whether this also holds true for international firms, we further
separate the relationship loans to two groups: loans with low relationship intensity, and loans
with high relationship intensity.
Panel A classifies the firms according to whether they belong to a common law or civil law
country following the classification of LLSV (1998). For both type of countries, we find that
there is a significant U shape regarding the impact of the lending relationship intensity on the

12
interest spread of the loan. For low value relationship intensity loans, the borrowers in common
law countries on average pay 23.38 basis points lower than non-relationship loans; however as
relationship intensity increases, the borrowers start to pay higher and higher interest rate. The
average interest spread on high value relationship intensity loans for common law countries is
14.10 basis point higher than low intensity relationship loans. The U shape pattern also exists for
borrowers from civil law countries. The borrowers pay 14.45 basis points lower when they start
their lending relationship; but as the relationship deepens, the reduction in interest spread
increases by 14.10 basis points. One significant difference between civil law and common law
countries is the spread difference between non-relationship loans and high relationship loans.
While relationship loans with high intensity still offer benefits, albeit reduced, to borrowers in
common law countries, the benefits have largely disappeared for borrowers from civil law
countries.
Panel B breaks the borrowing firms into countries with high disclosure requirement and
countries with low disclosure requirement. We use the prospectus disclosure requirement index
from La Porta et al. (2005) as measure of disclosure requirement, and we define countries as
having a low disclosure requirement if its index is below the median (0.58). Similar to panel A,
we find a U shape pattern for the interest paid on relationship loans for borrowers from high
disclosure requirement countries. Also high intensity relationship lenders still offer lower interest
rate to borrowers compared to transaction loans. However, the U shape disappeared for
borrowers from low disclosure requirement countries. It seems that relationship loans do not
offer benefits to borrowers regardless of the relationship stage the firm is in.
In panel C, we classify firms into countries with well developed public bond market and
countries with less developed bond market. A country’s public bond market is considered well
developed if its historical average dollar amount of private bond issued to GDP ratio is above the
sample median of 0.24. The results suggest that in countries with less developed debt markets,
relationship loans do not offer benefits to borrowers once the borrower is locked in with the
lender.

13
In panel D, firms are groups based on the concentration of the banking industry of their
countries. Ongena and Smith (2000) find that firms maintain more banking relationships in
countries with un-concentrated banking sector. In this panel, we find that high intensity
relationship loans with one single bank do not offer benefits to the borrower in countries with un-
concentrated banking industry, while low intensity relationships do.
Finally, panel E classifies the firms into groups by the level of creditor protection in their
countries of origin. Similar to previous panels, a U shape relation exists between interest spread
paid on loans and the relationship intensity between the lender and the borrower. We find no
significant difference in pattern between high creditor protection countries and low creditor
protection countries.
While the panels provide strong indication that relationship lending initially decreases interest
rate and then increases it, we also find that the intensity of relationship is strongly related to firm
size. Larger firms are more likely to have low intensity relationship but are less likely to have no
relationship or high relationship. Such effects must to be controlled before any definitive
conclusions.
IV. Main Empirical Results
A. Baseline Model Results
In this section we conduct a base-line regression to examine the impact of relationship intensity
on loan interest spread controlling for various firm, loan and country specific factors. In addition,
we include interaction variables between the measure of relationship intensity and different
country factors to investigate whether the impact varies by country characteristics. The following
model is estimated using individual loan data:
AISD = β0 + β1(REL) + ∑ βi(REL*Country_Characteristics)) + ∑ βi(Loan_Characteristics)
+ ∑ βi(Firm_Characteristics) + ∑ βi(Country_Characteristics) + γ+ η+ ε
AISD is the interest spread over LIBOR on the drawn amount plus the annual fee in bps. Loan
characteristics include the number of lenders in the syndicate, whether the lead lender is a state
owned bank, the natural logarithm of the dollar amount of the loan, the natural logarithm of loan
14
maturity in months, indicators for loan type (revolver loan, term loan, or facility loan), indicators
for loan purpose (debt repayment, takeovers, acquisitions, and LBO), and a dummy variable to
show whether the loan is the first loan in a new lending relationship (switch lender). For firm
characteristics, we control for firm size (natural logarithm of firm asset in 2000 dollars), firm’s
tangibility defined as the ratio of property, plant, and equipment (PPE) to total assets, firm’s
profitability measured as last year’s return on assets, and firm’s ratio of total debt to total assets.
We also control for whether the firm has an investment grade credit rating or not. Unfortunately,
most of the firms in our sample do not have credit ratings. Thus to control for firm risk, we also
construct the Altman’s Z-score for each firm, calculated as Z=1.2 (Working Capital/Total
Assets) + 1.4 (Retained Earnings/Total Assets) +3.3 (Earnings Before Interest and Taxes/Total
Assets) +0.6 (Market Value of Equity/Book Value of Liabilities) + 0.999 (Net Sales/Total
Assets). We define a firm as low risk if it has Z-score above 2.675. For firms that do have
enough information to calculate Z-score before the loan, we assign the value of 1 to a missing
risk measure dummy variable.
Finally, we control for a number of country characteristics. First, we use the index of creditor
right from La Porta et al. (1997) to measure the degree to which creditor rights are protected in a
country. To control for the enforceability of these laws, we use the interaction variable between
the measure of creditor right and the rule of law index from La Porta et al. (1997) to capture the
true degree of protection. Second, we control for the disclosure requirement in the country to
capture the amount of credible borrower’s information available to outside investors and
financial institutions. Information asymmetry between the borrower and non-lenders can have
significant impact on the benefits and costs of having a lending relationship. As stated in section
II above, we use the prospectus disclosure requirement index from La Porta et al. (2005) as our
proxy for disclosure regulations. In addition to creditor right protection and disclosure
requirement, we use two additional proxies to control for the development of the security
markets in a given country. The two measures used are the ratio of market value of private sector
debt securities to GDP and ratio of the stock market capitalization to GDP. Both measures come
from World Bank country financial structure dataset and we use the average ratios from 1995 to
2005 to control for bond market and stock market development for each country, respectively.

15
We follow Ongena and Smith (2000) and control the degree of bank concentration within a
country using the concentration ratio from Barth et al. (2007), defined as the percentage of a
country’s commercial banking assets owned by its largest 3 banks. We also control for a range of
country economic development indicators including the average inflation rate, the natural
logarithm of average per capita GDP, the natural logarithm of the GNP, and the risk of the
country. To control for country’s risk, we use the country risk index from International country
risk guide (ICRG), which controls for economic, financial, and political risks. Lastly, research
has shown that much of the variation across institutional variables can be explained by the legal
origin of the country. To take this into account, we categorize countries by their legal origin into
French Law countries, German Law countries, Scandinavia Law countries, and Common Law
countries.
Table 3 reports the initial results using the base line regression. Model 1 to 3 use the relationship
intensity measure based on the prior number of loans the borrower has conducted with the
lender. Model 4 to model 6 use the measure based on the prior dollar amount of loans the firm
has borrowed from the same lender. For brevity, the indicator variables for loan purposes and
types are not included.
In models 1 and 4 we only look at the firm and loan level characteristics while controlling for
country, industry, and year fixed effects. Consistent with the idea that relationship banks can
lock in their clients by acquiring information monopoly, we find that relationship intensity on
average is positively and significantly related to interest spread for international firms when
countries’ institutional developments are typically weaker than U.S. On average, holding
everything else constant, a borrower that conducts 100% of its past loans with the same lender
pays 17 basis points more compared to a non-relationship loan.
In models 2 and 5 we include interaction variables between relationship intensity measures and
country’s creditor right protection level and disclosure requirement to examine whether the
benefits and costs of relationship lending varies by country. Similar to model 1, we find that the
coefficient on relationship measurement is highly positive and significant. However, we also find
that the impact of relationship intensity on interest spread decreases as the disclosure
requirement and creditor right protection of the borrower’s home country increases. This is

16
consistent with the notion that as more credible information about the borrower becomes
available to outside lenders and as potential lenders are better protected in adverse outcomes, the
competition from outside lenders will increase and it is more difficult for relationship banks to
hold-up their clients due to their information advantage.
In models 3 and 6, we include interaction variables between other country level variables and
relationship intensity. Particularly, past research has found that many country specific
institutional characteristics are influenced by the country’s legal origin. To take this effect into
account, we include interaction variables between legal origins and relationship intensity. We
also include interaction variables between relationship intensity and country’s bond market
development, banking sector concentration, and country risk. We find that the structure of the
banking sector has an impact on the benefits and costs of relationship lending. As the banking
sector become more concentrated, it reduces the costs associated with relationship banking. The
result is consistent with the empirical finding of Ongena and Smith (2000) that firms maintain
fewer banking relationships in countries with high banking concentration.
The other variables in the model are consistent with our expectation. We find that firms pay
higher interest rate with larger loan amount and longer loan maturity. But the interest rate spread
decreases as the number of lenders in the syndicated loans increases, probably because of risk-
sharing. For firm characteristics, we find that larger firms, firms with higher tangibility and
profits pay lower interest rate while firms with higher leverage pay higher interest spread.
Further, firms of investment grade pay lower interest rate while firms with missing information
pay higher interest rate. We find that firms using state owned banks as lenders tend to pay lower
interest rate on relationship loans, though the result is not significant. Some of the country
characteristics also have an impact on the loan spread. Not surprisingly, firms in countries with
high inflation rate pay higher interest rate, as do firms with high. Similar to Qian and Strahan
(2007), firms in non-common law countries typically pay lower interest rate on their loans.
Overall, the results in this section provide initial evidence that the effect of banking relationship
varies significantly across countries. In general, public firms in countries with low disclosure
requirement and weak creditor protection pay higher interest rates.
17
B. Propensity Score Matching Approach
A potentially serious issue with our base line regression model is that the choice of staying in a
lending relationship and conducting a relationship loan is largely decided by the borrower and
thus endogenous. Factors such as dollar amount of the loan, firm size or even country
characteristics may affect the borrower’s decision to accept or decline a relationship loan. In
addition, the interaction variables we use may not be adequate to capture all the factors that can
affect the interest spread difference between a relationship loan and a non-relationship loan. To
address these problems, we use a propensity score approach where we find a group of matching
non-relationship loans for each relationship loan based on firm, loan, and country characteristics,
and then calculate the difference in interest rate spread between the relationship loan and the
group of matching non-relationship loans.
To carry out the matching procedure, we first determine the propensity of a loan in the sample to
be a relationship loan by estimating a logit model and calculating the predicted probability of
being a relationship loan. Specifically, the logit model is as follows:
Prob (REL=1)= β0 + ∑ βi(Loan_Characteristics) + ∑ βi(Firm_Characteristics)
+ ∑ βi(Country_Characteristics) + γ+ η+ ε
where REL is a dummy variable that equals 1 if the firm has borrowed from the same lender
before. Loan characteristics include the dollar amount of the loan and indicator variables for
loan type (term loan, revolver loan, and facility loan) and loan purpose (debt repay loan,
acquisition, takeover, and LBO). Firm characteristics include firm’s tangibility, profitability,
leverage, size, and firm’s risk. Ideally we would like to estimate a separate logit model for each
country; however, because the sample size of some countries is limited, we choose to include
loans from all countries in one sample and control for country characteristics. The country
characteristics include legal origin, creditor rights, the degree of bond and stock market
development, disclosure requirement, log of per capita GDP, log of GNP, average inflation rate,
and country risk. We also include industry and year dummies.

18
We then use the coefficients from the logit regression to compute the probability of being a
relationship loan for each loan in the sample and match each relationship loan with a group of
non-relationship loans with propensity scores close to the relationship loan. Two methods are
used to select the matching loans. First method we use is the Nearest Neighbor method, in which
we choose for each relationship loan, 5 non-relationship loans with the closest propensity scores.
We then calculate the average interest spread for this 5 non-relationship loans as the matching
interest rate to compare with the AISD on the relationship loan. To avoid the risk of bad
matches, we set the tolerance level on the maximum propensity score distance (caliper) to 0.005.
The second matching method is a kernel method in which we derive the matching interest rate
estimator using a weighted average of non-relationship loans, with more weights given to the
non-relationship loans that have the closest propensity score to the relationship loan. Two
weighting kernels are used to derive the matching interest rate, GAUSSIAN and
EPANECHNIKOV (only GAUSSIAN is reported in the paper, though results are similar). For
the kernel estimators, we also specify a propensity score bandwidth that limits the sample of non-
relationship loans to be used for comparison. Following Bharath et al. (2011), we pick the
bandwidth to be 0.01.
Panel A in Table IV compares the firm and loan characteristics between the non-relationship
loans and relationship loans. Not surprisingly, the firm and loan characteristics between
relationship loans and matching non-relationship loans are very similar. The matching sample
has slightly larger loan size compared to the relationship loan, but the difference is not
statistically significant. We are also happy to note that the loan maturity between the two types
of loans is comparable. Since we did not include loan maturity in our propensity score matching
procedure, the similarity of this variable indicates that our matching procedure is able to capture
loan characteristics beyond what’s specified in the model.
Panel B in Table IV compares the differences in interest rate spread between the relationship
loans and the matching non-relationship loans across different categories. In the first column, we
break our relationship loans to loans made in high creditor right protection countries and loans
made in low creditor right protection countries. A country is defined as having high creditor right
protection if the creditor right * Rule of Law variable is above 16, which is the median value in
19
our sample countries. Consistent with our hypothesis, we find that the interest rate difference
between relationship loans and non-relationship loans is positive and significant at 1% level in
countries with low creditor right protection. The difference is negative and significant in
countries with high creditor right protection, which suggests that relationship lending seems
beneficial for public firms in U.S., which has a high level of creditor right protection. This result
is consistent with the findings of Bharath et al. (2011).
In the second column, we break the sample into countries with high disclosure requirement and
countries with low disclosure requirement based on their prospectus disclosure requirement
index. A country is considered as having high disclosure requirement if its index value is above
the median of 0.58. Similar to first column, we find that relationship loan borrowers pay
significantly higher interest rate compared to non-relationship loans when the borrowing firm is
located in countries with low disclosure requirement. The difference in interest rate has largely
disappeared for relationship loans made in countries with high disclosure requirement.
In the last column of Panel B in Table IV, we categorize the relationship loans into loans with a
high relationship intensity value and loans with a low relationship intensity value. A relationship
loan is counted as high relationship intensity loan if the firm has borrowed more than 33% (our
sample median) of its past loans from the same lead bank. We find that loans in the high
relationship intensity category pay significantly higher interest rate than their non-relationship
counterparts. However, loans in low relationship intensity category pay lower interest rate than
their counterparts, though the difference is not statistically significant. The lower interest rate
may imply that banks may use lower interest rate to attract firms until the relationship bank is
able to gain enough proprietary information about the borrower.
Panel C conducts formal multivariate regression to examine the determinants of difference in
loan interest rate between relationship loans and non-relationship loans. The general model we
use is as following:
Difference in AISD = β0 + β1(REL) + ∑ βi(Country_Characteristics) +
∑ βi(Loan_Characteristics) + ∑ βi(Firm_Characteristics) + γ+ η+ ε

20
The dependent variable is the difference in interest rate between the relationship loan and the
matching non-relationship loans. For the matching loans, the interest rate is calculated based on
the estimating method used (Nearest Neighbor for model 1 to 3, GAUSSIAN for model 4 to 6).
We include the same loan and firm variables as our base-line model. For our country variables,
we include creditor right protection, disclosure regulation, bond and stock market development
measures, bank concentration, legal origins, log of GDP per capita, log of GNP of the country,
average inflation rate, and country risk. We only include relationship intensity based on number
of past loans, though results are similar with intensity measure based on dollar amount of loans.
For models 1 and 4 in panel C, we only include firm and loan characteristics along with industry
and year fixed effects. On average, the coefficients on firm and loan characteristics are as
expected. Relationship loans with longer maturity and larger loan amount carry higher interest
rate than non-relationship loans as it may be more difficult to obtain the same loan terms from a
non-relationship lender. The interest rate differential for borrowers with better profitability,
higher tangibility, lower leverage, and larger firm size is smaller, which is attributed to the fact
that it’s easier for better quality firms to obtain alternative financing, thus these firms are less
likely to be locked in a relationship. Relationship intensity when not controlling for interaction
terms is positive but not significant. State owned banks seem to charge lower interest rate on
relationship loans; however, the coefficient is not statistically significant. On average, the firm
and loan characteristics explain about 19% of the variation in the interest spread difference.
Models 2 and 5 in panel C include country fixed effects in addition to the variables controlled in
Models 1 and 4. We find that the inclusion of country level dummies on average increases
adjusted R-square to 35%, an 84% increase over the firm and loan variables-only models. The
results are consistent with the idea that differences in country level factors explain a significant
portion in difference in relationship loan interest rates relative to non-relationship loans.
Models 3 and 6 drop country fixed effects and include country level variables. Even though
using country level variables instead of fixed effects reduces the adjusted R-square to 31.5%, it is
still a 66% increase over the firm and loan variables only models. Consistent with what we find

21
in the base-line model, relationship loans made in countries with low creditor right protection
and low disclosure requirements pay significantly higher interest rate than the non-relationship
loans. This difference in interest rate is both economically and statistically significant. For
example, holding everything else constant and only considering creditor right protection, the
interest rate difference between a relationship loan and a non-relationship loan in Argentina
(which has an enforceable creditor right protection index of 5.35) will be about 30 basis points
higher than the same interest rate difference paid by a relationship loan in United Kingdom (with
an index value of 34.27). If we consider disclosure requirement only and hold everything else
constant, the interest spread difference between relationship and non-relationship loan in
Argentina (with a disclosure index of 0.5) will be about 50 basis point higher than the interest
rate difference paid by the borrower in a similar relationship loan in United Kingdom (with an
index value of 0.83). Adding the impact of Creditor right protection and disclosure requirement
together, the spread difference between relationship loan and non-relationship loan will be 80
basis point higher in Argentina than in United Kingdom! These results suggest that institutional
difference across countries have significant impact on whether relationship lending is beneficial
or costly in the particular country.
We also find that relationship lenders tend to charge higher interest rate in countries with high
inflation or high country risk. This is consistent with the idea that unstable macro environment
compounds the problem of adverse selection. We do not find other country characteristics
besides legal origins to have an impact on the interest rate difference between relationship loans
and non-relationship loans. Particularly, the banking sector concentration variable loses its
significance compared to the baseline model. This is due to either the endogeneity correction of
the propensity score matching approach or the inclusion of other variables in explaining the
interest rate differential.
In all models we find that the degree of relationship intensity has a positive albeit insignificant
impact. In unreported tests incorporating interaction variables between the degree of relationship
intensity and country institutional variables, we find that the effect of relationship intensity on
interest rate difference is positive for countries with low disclosure requirements and creditor
22
right protection and reverse in countries with high disclosure requirements and creditor right
protection, and the coefficients are statistically significant.
Overall, the propensity score matching method confirms the main findings of the base-line
regression and shows a significant impact of the degree of creditor right protection and
disclosure requirement on the benefits of relationship lending for public firms.
C. Difference-in-Difference-in-Difference Test
We note that in cross-sectional regressions, country level variables such as creditor rights and
disclosure requirement may be collinear with other time varying country-level unobserved
factors that we omit to control for in our regression tests. To alleviate this problem, in this
section we explore country-level exogenous changes in country creditor rights and disclosure
requirement to conduct difference-in-difference-in-difference tests.
C.1. Difference in Difference in Difference Test Using Change in Creditor Rights
We collect information on changes in creditor rights protection from two sources: Djankov,
McLiesh, and Shleifer (2007) and World Bank Doing Business Database. The creditor right
index from DMS (2007) has a score between 0 and 4 and varies across both countries and time.
The data from DMS (2007) only covers the period from 1978 to 2003, but World Bank began to
collect creditor right protection information for its Doing Business Database since 2004 largely
following the methodology of DMS (2007) (though the index has a score between 0 and 10
instead). We identify an increase (decrease) in creditor right protection for a country when there
is an increase (decrease) of the creditor right index from previous year. A total of 15 countries
went through a change in creditor rights in our sample period. Seven of these experienced
(Canada, Finland, Indonesia, Ireland, Israel, India, and Sweden) a decrease and eight (Brazil,
Denmark, France, India, Japan, Peru, Sweden, and Taiwan) experienced an increase. The
information on countries that underwent the changes is provided in Table V, Panel A.
C.1.1. Empirical Model and Results
We implement the difference-in-difference-in-difference test using the following model:

23
AISD = (βi + βC + βT + β1ICT+ β2DCT)*REL + βi + βC + βT + β3ICT+ β4DCT + β4REL + βX+ ε
For a country that experienced an increase or decrease in creditor right protection in year t, we
only include 3 years before and after the change in the sample. ICT equals zero (one) for three
years before (after) the country underwent a creditor right increase. DCT equals zero (one) for
three years before (after) the country underwent a creditor right decrease. βi, βC and βT are
industry, country and year dummies, REL measures lending relationship intensity either by
number of past loans or the dollar amount of past loans. X consists of loan and firm level control
variables used in previous regressions. We expect a decrease in creditor right protection will
cause relationship banks to charge higher interest (β2 will be positive) as it becomes riskier for
outside banks to lend to firms with significant adverse selection problem. In contrast, an increase
in creditor right will decrease interest charged on relationship loans, so β1 will be negative.
Table VI Panel A presents the results. The relationship intensity variable in Model 1 is based on
number of past loans and the intensity variable in Model 2 is based on dollar amount of past
loans. Since time-varying omitted variables at country/loan level that are correlated with changes
in creditor right can potentially bias the results, in Model 3 and 4 we include additional
interaction variables between relationship intensity and time-varying country, firm, and loan
variables.
In all four models, we find that consistent with our hypothesis, β2 is negative and significant at
5% level, indicating that decrease in creditor rights protection causes relationship banks to
charge higher interest rate. However, β1 is positive as we expect but statistically insignificant.
One potential reason for the result is sample limitation. Most of the creditor right protection
increases happened after 2006, making significant portion of the increases coincide with global
financial crisis, which makes a clean test harder to obtain. In unreported tests, we limit our
sample period from 1990 to 2002 and we find that β1 is still 5% significant and positive as we
would expect. Overall, the results lend support to the notion that lower creditor right protection
increases the risk of economic rent extraction by relationship banks.
C.2. Difference in Difference in Difference Test Using Change in Disclosure Requirement

24
We use the mandatory adoption of International Financial Reporting Standards (IFRS) for listed
companies by 26 countries in 2005 (except Singapore, which adopted IFRS in 2003, also only 22
countries are in our sample) to examine the impact of exogenous shocks to countries’ disclosure
requirements on the cost and benefits of relationship lending. Prior to the adoption of IFRS,
except companies who voluntarily adopt IFRS or US GAAP, most of the local listed companies
were reporting using local accounting standards that are usually less strict. However, recently
more and more countries have moved to IFRS reporting or decided to require the use of these
standards in the near future. In 2005, 24 European countries (plus South Africa) began to require
mandatory use of IFRS in firms’ financial reporting. Regulators expect the use of IFRS to
improve corporate transparency and increase the quality of financial reporting as well as making
comparison across firms easier (see EC Regulation No. 1606/2002). Recent studies that examine
the economic consequence of IFRS adoption provide tentative evidence supporting the notion
that the adoption of IFRS has positive impact on firms’ market liquidity, cost of capital, and
valuation (see Daske, Hail, Leuz, and Verdi (2008)). The list of countries that adopted IFRS is
provided in Table V, Panel B.
C.2.1. Empirical Model and Results
We implement the difference-in-difference-in-difference test using the following basic model:
AISD = (βi + βC + βT + β1FMCT+ β2V + β2VCT)*REL + βi + βC + βT + β3 FMCT + β2V + β2VCT +
β4REL + βX+ ε
Where FMCT is a dummy variable that equals 1 for firms that are first time mandatory adopters
of IFRS after the country required the change. V is a dummy variable that equals 1 if the firm is
a voluntary adopter of either IFRS or US GAAP before the mandatory requirement. VCT is equal
to 1 for voluntary adopters in countries that have already formally required mandatory IFRS
reporting. βi, βC and βT are industry, country and year dummies, REL measures lending
relationship intensity either by number of past loans or the dollar amount of past loans. X
consists of loan and firm level control variables. We expect first time mandatory adopters to
experience the most significant decline in interest paid on their relationship loans relative to non-
relationship loans. We expect voluntary adopters to pay lower interest rate on relationship loans,

25
however we do not expect the mandatory adoption of IFRS to have significant impact on
voluntary adopters. The results of the regressions are reported in Table V Panel B Model 1 and
Model 2, where model 1 uses the number of past loan to measure relationship intensity and
model 2 uses the dollar amount of past loan to measure relationship intensity.
In addition, the impact of the IFRS mandatory adoption may not be the same across all countries.
We expect the impact of IFRS mandatory adoption to be larger for firms in countries that have
greater difference between local accounting standard and IFRS. To control for this effect, we
include a dummy variable (and corresponding interaction terms) that equals one for the top
twenty-five percent countries whose local GAAP and IFRS difference is the greatest. The
regression results for the new variable are reported in Model 3 and Model 4 in Table VI Panel B.
The results are largely consistent with our predictions. We find the coefficient on the interaction
variable between first time mandatory adopter and relationship intensity to be negative and
statistically significant at 5% level. The coefficients on voluntary adopter and voluntary adopter
after mandate are both insignificant though the signs are as expected. We also find in Model 3
and Model 4 that the negative impact of IFRS adoption for first time adopters is the greatest for
companies from countries with larger local GAAP and IFRS difference. The coefficient on the
interaction variable between accounting standard difference dummy variable and first time
mandatory adopter is negative and significant at 5% level. Overall the results from the
difference-in-difference-difference tests support the idea that improvement in disclosure
requirement reduces higher interest rate associated with relationship loans.
D. Firm Level Information Opacity
The results in previous sections show that the level of disclosure requirement and creditor right
protection in a country can affect whether relationship lending is beneficial or not. We argue that
higher disclosure requirement can increase the credible information available to outside lenders,
which reduces information asymmetry and increases competition. Similarly higher creditor right
offers better protection to outside lenders and makes them less risk averse, which will increase
competition and thus reduce hold-up costs associated with relationship lending. In this section,
we examine how the results are affected by firm level information opacity and whether the
26
impact of firm level information opacity on interest rate difference between relationship loans
and non-relationship loans vary by country level variables.
We are interested in firm level information opacity primarily for two reasons. First, firm level
information opacity may be the primary driver behind our results regarding disclosure
requirement. Our argument regarding disclosure requirement is that it serves as a commitment
device that forces companies to disclose information in both good and bad times, which
increases credible information available to investors and reduces information asymmetry
(Bushee and Leuz, 2005). However, our results may simply capture the fact that companies in
high disclosure requirement countries have less firm level information asymmetry in general.
While the difference is subtle, the latter effect sometimes can be achieved through other means
(such as voluntary disclosure or analysts following) than country’s institutional development.
Thus it’s in our interest to ensure that our results on the country’s disclosure requirement are
robust even after controlling for firm level information opacity.
The second reason we are interested in firm level information opacity is to study its impact on
the benefits and costs of relationship lending. The effect of firm level information opacity on
relationship lending can vary greatly depending on whether the benefits or the hold up costs of
the relationship lending dominates. In countries where the lack of its legal institutions and
regulations making relationship lending more costly to the borrower, we should expect lower
firm level information opacity to help the borrowing firm overcome the lock-up effects
associated with relationship lending and which should reduce interest spread. On the other hand,
when country level institutional development foster competition from outside lenders and make
relationship lending more beneficial to the borrower, relatively higher firm level information
opacity can increase the potential benefits of relationship lending as it allows the relationship
lender to generate more proprietary information and share the benefits with the borrower.
Next, we empirically examine the average impact of firm level information opacity on our
sample of loans from international firms, many of which are from countries with weak
institutional development. In addition, we investigate whether the effects of firm level

27
information opacity vary with the level of creditor right protection and disclosure requirement in
a country, which we have shown can affect the benefits and costs of relationship lending.
We use two measures to capture firm level information asymmetry. The first measure is the
standard deviation of analysts’ earnings forecast following Krishnaswami and Subramaniam
(1999), which is measured as the standard deviation of all earnings forecasts made in the 11th
month of the fiscal year. We use the 11th
month because O’brien and Bhushan (1990) and Lang,
Lin, and Miller (2003) document that the analyst activities levels off after the 11th
month. The
higher the dispersion in analysts’ forecast, the more information opacity the firm has since the
disagreement indicates a lack of information about the firm. The second measure we use is the
analyst forecast error in the year before the loan is originated. The variable is defined as the
absolute value of the analyst forecast error (actual earnings minus the mean estimation of the
earnings by analysts), deflated by stock price. The higher the forecast error, the higher the firm
level information asymmetry. Again, following Lang, Lin, and Miller (2003), the earning
forecast is obtained for the 11th
month of the fiscal year. All analysts’ data are obtained from
I/B/E/S.
Panel A of Table VII provides initial results on the relation between firm level information
opacity and the interest rate on relationship loans using the base-line regression. Consistent with
our finding that relationship lending leads to higher interest rate for our sample of international
loans, we also find that firm level information opacity compounds the information rent extraction
problem. The coefficient on the interaction variable between relationship intensity and proxies
for information asymmetry is always positive and significant. Holding everything else constant,
firms with higher level of information opacity pay higher interest spread on their relationship
loans. In addition, we also find that the inclusion of firm level information measure does not
affect the coefficient on country level information measure, which implies that country’s legal
institutions and disclosure regulations do play an important role in fostering competition and
reducing the problem of information rent in relationship lending.
Panel B of Table VII examines the effects of firm level information opacity on the interest rate
difference between a relationship loan and its matching non-relationship loans obtained through
28
propensity score matching. In the interest of brevity, only matching results that are calculated
using the Nearest Neighbor method are reported, though the results are similar when using other
matching estimates. We also only use the relationship intensity measure that is based on the
number of past loans the firm has borrowed from the same lender. The results do not change
using the alternative measure of relation intensity.
The first two models in panel B provide similar results to what we find using the base-line
regression model. Information opacity is positively and significantly related to the interest rate
premium paid by relationship loans over non-relationship loans. And the impact of country’s
disclosure regulation on the differences in interest rate is not affected whether or not we include
firm level information measures. Model 3 and Model 4 in the panel include interaction variables
between firm level information opacity measure and the level of country’s creditor right
protection and disclosure requirement to examine whether the effect of firm level information
asymmetry varies by country’s legal institutional development.
Consistent with the hypothesis that firm level information opacity is positively related to interest
rate when relationship lending leads to hold-up problem and negatively related to interest rate
when relationship lending provides benefits to the borrower, we find that the positive impact of
information asymmetry on interest rate differences decreases as country’s disclosure regulation
and creditor right protection becomes more developed. The results further corroborate our
earlier findings that the development of country’s disclosure regulation and legal creditor right
protection can foster competition and lead to more beneficial relationship lending.
V. Results on Non-price Terms of Loan Contract
A. Collateral Requirement
In this section, we focus on non-price terms of the loan contract and investigate what impact
relationship lending has on the collateral requirement of the loan in a cross-country setting.
Bharath et al. (2011) argue that since relationship lending is related with increased monitoring
and lower information asymmetry between the lender and the borrower, it reduces both the
adverse selection (as proposed by Bester, 1985; Besanko and Thakor, 1987) and the moral
hazard (see Holmstrom and Tirole, 1997; Stulz and Johnson, 1985; Boot, Thakor, and Udell,

29
1991) motivations behind requiring collaterals in loan contracts. Consistent with this argument,
Bharath et al. (2011) find that relationship lending is associated with lower probability of
pledging collateral for a loan for U.S. companies.
We propose that the effect of banking relationship on loan collateral requirement may also vary
with country characteristics, particularly with each country’s level of creditor right protection.
To the extent that there is a need for low credit risk borrowers to signal their quality and pledging
collateral to do so, relationship lending can reduce this collateral requirement as the information
asymmetry between the lender and borrower is mitigated in relationship lending. However,
when creditor rights protection is low, it reduces the effectiveness of collateral as a way for
signaling (as documented by Qian and Strahan, 2007). As a result, the difference in need to use
collateral between a non-relationship borrower with an adverse selection problem and a
relationship borrower without one is also diminished. A similar argument can be applied to the
moral hazard theory. The benefits of do not need (or less requirement) to use collateral
associated with relationship lending is only significant when pledging collateral is effective and
thus demanded by the lender. Since collateral is more effective and useful in countries with high
creditor right protection, the benefits of relationship lending on collateral requirement should
also be more significant in those countries.
We test our hypothesis in table VIII. A probit model is used to examine the likelihood of
pledging collateral. In all four models, the dependent variable is a dummy variable that equals 1
if the loan was secured and 0 otherwise. The independent variables are the same as in the base-
line regression; for reasons of brevity, only selected variables are reported. Since the
information on whether collateral is required or not is limited for our sample of international
loans, we only use 1523 loan observations in our full model regression.
The first two models are estimated using all the observations where collateral information is
available. Consistent with the notion that relationship lending reduces the need for collateral, we
find that the coefficients on relationship intensity measures are negative though insignificant.
More importantly, we find that the coefficient on the interaction variable between creditor rights
and relationship intensity is negative and significant at 5% level. The results support our

30
argument that the benefits of relationship lending on collateral requirement is most apparent in
countries where creditor right protection is high and collateral is more useful.
Similar to the problem in our interest rate regression, the choice of whether to engage in
relationship loan is endogenous and need to be adjusted. We again use the propensity score
matching method to select matching non-relationship loans for our relationship loans. For each
relationship loan, one matching non-relationship loan is selected based on which one has the
closest propensity score. To prevent bad matches, we set the tolerance level to 0.001 and each
non-relationship loan can only be matched once. We are able to find a matching non-
relationship loan for 988 relationship loans, out of which 320 loans with their matching loans
have collateral data (which give us a total sample of 640 loans).
The regression results using the matched sample are reported in the last two models in table VIII.
Similar to the first two models, we find that the coefficients on relationship intensity measures
are negative though insignificant, but the coefficient on the interaction variable between creditor
right and relationship intensity is positive and significant (at 10% level). In all four models, we
find the coefficient on the interaction variable between disclosure regulation and relationship
intensity to be insignificant. The results on other control variables are largely as expected. We
find larger firms and firms with more profitability are less likely to use collateral, while firms
with high leverage are more likely. The results are consistent with previous research (Bharath et
al. (2011)).
B. Loan Maturity
Relationship lending can also have an impact on loan maturity. Bharath et al. (2011) propose that
there are conflicting effects on loan maturity caused by the reduction in information asymmetry
between the relationship lender and the borrower. From the demand side, on one hand, reduced
information asymmetry in relationship lending eliminates the need for borrowers to use short
term loans to signal quality. On the other hand, less information asymmetry also reduces the
refinancing risks, which makes short term loans more appealing to borrowers. From the supply
side, relationship lending makes short term loan more appealing to lenders since the monitoring
cost is lower. Examining this question empirically, Bharath et al. (2011) find that for U.S. public

31
firms, loan maturity becomes significantly shorter as the relationship between borrower and the
lender deepens.
It is not clear how the impact of relationship lending on loan maturity will differ in a cross-
country settings. In countries where well-functioning legal regimes and institutions are absent,
short term maturity loans have already been used by lenders as an alternative to collateral (since
they are relatively ineffective) to mitigate loan risks (Diamond, 2004). This may imply that as
lending relationship reduces information asymmetry and increases monitoring, part of the need
for short term maturity loans by lenders in countries with weak creditor right protection will be
reduced. However, relationship lending still increases incentives for using shorter term maturity
loans both for demand side (reduced refinancing risks) and for supply side (lower monitoring
costs) regardless of differences in countries’ legal institutions.
In this section, we empirically investigate the impact of relationship intensity on loan maturity.
Similar to our loan collateral analyses, we use both the full sample and the reduced sample that
only consists of relationship loans and their matching relationship loans (1976 loans or 988 pairs
from 40 countries). The dependent variable is the log of loan maturity in months and the
independent variables are the same as in our base-line regression without the loan maturity
variable.
The results are reported in Table IX. The first two models are estimated using the full sample.
Consistent with the findings of Bharath et al. (2011), we find that relationship intensity measures
are related to shorter loan maturities and the relation is significant at 5% level. The coefficients
on the interaction variables between relationship measures and disclosure regulation/creditor
right protection are insignificant. The results on relationship intensity measures are very similar
in the last models where we use the propensity score matching sample. The coefficient is
significant and negative at 1% for relationship measure based on past number of loans that
borrowed from the lender and the coefficient is 10% significant for the measure based on past
dollar amount of loans from the same lender. However, unlike our full sample results, we also
find that relationship lending shortens loan maturity less in countries with weak creditor right
protection, which is significant at 5% level. This is consistent with the argument relationship

32
lending reduces information asymmetry between borrower and lender and removes the need for
lenders to use short term loan maturity to mitigate risk in countries with weak legal regimes and
well-developed institutions.
VI. Robustness Checks
In this section, we extend our analysis to examine whether our results are robust to changes in
sample compositions, model specification, and estimation procedures. First, our main
institutional variables of interest—disclosure regulation from La Porta et al. (2005) is measured
at the end of 2000, and yet our sample covers the longer period from 1990 to 2007. While
researches have shown that country’s legal regimes and institutions tend to stay relatively stable
over time, some countries may still have experienced changes in their disclosure requirements
through this period. For example, many European countries adopted mandatory international
accounting standard (IFRS) reporting around 2005, which may have increased the country’s
disclosure environment. To ensure our results are not affected by changes in legal environments,
we rerun our main regressions using shorter time periods (e.g. one is from 1998 to 2002), our
results stay mainly unchanged.
Second, we find that there is a clustering of observations for Japan (for the loan maturity
regression) and U.K. (for the interest rate regression). To ensure our results are not driven by any
one particular country, we re-estimate our loan maturity model with Japan removed our interest
rates model with U.K. removed. We find that our results are not significantly affected after the
removal of these two countries.
Third, while we find that our results on disclosure regulation is not affected by firm level
measure of information opacity, it may be driven by the fact that firms in high disclosure
regulation countries will also have high voluntary disclosure, which may not necessarily
correlated with our measure of firm level information opacity since it’s analysts based. To test
for this, we also include the CIFAR index from Bushman et al. (2004), which is a country level
data that captures voluntary disclosure practice. We find that while the CIFAR index is
33
significant, disclosure regulation still has significant impact on the benefits of relationship
lending.
Lastly, we include firm fixed effects to our model. We do not include firm fixed effect model
initially because our main interests are the country level legal and institutional variables, which
have little time variation and are also constant for firms within the same country. In addition,
relatively few firms in our sample have more than one loan. Nonetheless we re-estimate our
base-line model with firm fixed effects to control for potential firm level omitted variables. We
find that the results on our main interaction variable between relationship intensity and country
level variables remain qualitatively similar.
VII. Conclusion
This paper examines the impact of country level legal and institutional characteristics on the
benefits of relationship lending. We find that country level variables have significant explanation
power on the effects of banking relationships beyond what can be explained by firm level
characteristics. More specifically, we find that creditor rights and disclosure requirement of a
country can significantly lower the interest rate in relationship lending. In countries where
creditor rights is poor and disclosure requirement is weak, banking relationships can lead to
serious hold-up problem and higher loan costs for the borrower. The paper contributes to the
literature by being the first study to explore cross-country variations in the cost and benefits of
relationship lending.

34
Table I. Summary Statistics: This table presents the number of observations and summary statistics by country
Panel A: Loan and Country Characteristics by Country
Country
N of Loans
(total)
N of
Relationship
Loan (total)
N of Loans
(All-in-
Drawn)
N of
Relationship
Loan (All-in-
Drawn)
Private
Bond
Market/G
DP
Creditor
Right*Rule of
Law
Largest 3
Bank
Concentration
Asia
Australia 274 126 140 68 0.29 30 0.34
Hong Kong 104 31 75 21 0.16 32.86 0.56
India 114 29 76 17 0.01 8.33 0.35
Indonesia 5 1 5 1 0.01 7.97 0.51
Israel 11 5 9 4 - 14.45 0.52
Japan 2288 1240 281 126 0.44 17.97 0.35
Korea 316 136 202 88 0.50 16.05 0.38
Malaysia 137 31 36 11 0.47 20.35 0.43
Pakistan 10 4 8 3 - 3.03 0.58
Philippines 84 29 53 22 0.00 2.73 0.74
Singapore 115 45 55 19 0.18 25.7 0.86
Taiwan 478 119 259 80 0.25 17.03 0.29
Thailand 147 48 71 21 0.1 12.5 0.49
Turkey 10 4 8 3 0.00 10.37 0.66
Europe
Austria 7 2 4 2 0.35 30 0.69
Belgium 24 8 17 6 0.43 20 0.77
Denmark 15 6 12 5 1.12 30 0.78
Finland 76 40 57 29 0.27 10 0.95
France 269 113 192 79 0.41 0 0.51
Germany 146 72 117 61 0.46 27.7 0.62
Greece 30 14 24 11 0.01 6.18 0.87
Ireland 19 4 16 4 0.12 7.8 0.59
Italy 68 23 51 18 0.39 16.67 0.52
Netherlands 93 44 67 28 0.48 30 0.71
New Zealand 58 29 25 14 - 40 0.94
Norway 93 39 57 24 0.21 20 0.89
Portugal 5 3 5 3 0.21 8.68 0.71
Spain 73 29 58 25 0.27 15.6 0.74
Sweden 86 34 65 25 0.46 10 0.95
Switzerland 51 16 35 10 0.40 10 0.84
United Kingdom 605 259 399 162 0.17 34.26 0.61
North America
Canada 489 245 211 94 0.25 10 0.55
South America
Argentina 10 4 8 4 0.03 5.35 0.37
Brazil 74 38 39 17 0.10 6.31 0.41
Chile 37 13 34 12 0.18 14.03 0.48
Colombia 4 2 3 2 0.01 0 0.37
Mexico 64 21 52 18 0.08 0 0.63
Peru 3 2 2 2 0.03 0 0.66
Venezuela 5 2 4 2 - 19.1 -
Africa
South Africa 29 11 23 9 0.12 13.25 0.87
Total 6524 2921 3635 1462 - - -
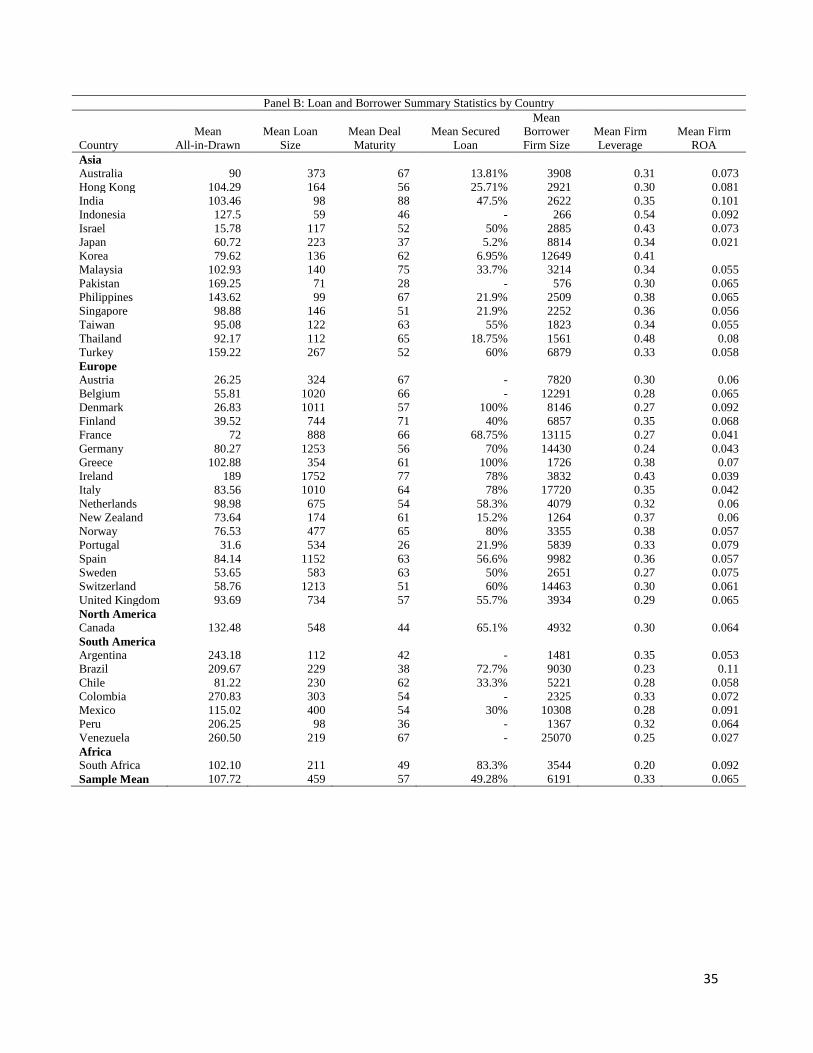
35
Panel B: Loan and Borrower Summary Statistics by Country
Country
Mean
All-in-Drawn
Mean Loan
Size
Mean Deal
Maturity
Mean Secured
Loan
Mean
Borrower
Firm Size
Mean Firm
Leverage
Mean Firm
ROA
Asia
Australia 90 373 67 13.81% 3908 0.31 0.073
Hong Kong 104.29 164 56 25.71% 2921 0.30 0.081
India 103.46 98 88 47.5% 2622 0.35 0.101
Indonesia 127.5 59 46 - 266 0.54 0.092
Israel 15.78 117 52 50% 2885 0.43 0.073
Japan 60.72 223 37 5.2% 8814 0.34 0.021
Korea 79.62 136 62 6.95% 12649 0.41
Malaysia 102.93 140 75 33.7% 3214 0.34 0.055
Pakistan 169.25 71 28 - 576 0.30 0.065
Philippines 143.62 99 67 21.9% 2509 0.38 0.065
Singapore 98.88 146 51 21.9% 2252 0.36 0.056
Taiwan 95.08 122 63 55% 1823 0.34 0.055
Thailand 92.17 112 65 18.75% 1561 0.48 0.08
Turkey 159.22 267 52 60% 6879 0.33 0.058
Europe
Austria 26.25 324 67 - 7820 0.30 0.06
Belgium 55.81 1020 66 - 12291 0.28 0.065
Denmark 26.83 1011 57 100% 8146 0.27 0.092
Finland 39.52 744 71 40% 6857 0.35 0.068
France 72 888 66 68.75% 13115 0.27 0.041
Germany 80.27 1253 56 70% 14430 0.24 0.043
Greece 102.88 354 61 100% 1726 0.38 0.07
Ireland 189 1752 77 78% 3832 0.43 0.039
Italy 83.56 1010 64 78% 17720 0.35 0.042
Netherlands 98.98 675 54 58.3% 4079 0.32 0.06
New Zealand 73.64 174 61 15.2% 1264 0.37 0.06
Norway 76.53 477 65 80% 3355 0.38 0.057
Portugal 31.6 534 26 21.9% 5839 0.33 0.079
Spain 84.14 1152 63 56.6% 9982 0.36 0.057
Sweden 53.65 583 63 50% 2651 0.27 0.075
Switzerland 58.76 1213 51 60% 14463 0.30 0.061
United Kingdom 93.69 734 57 55.7% 3934 0.29 0.065
North America
Canada 132.48 548 44 65.1% 4932 0.30 0.064
South America
Argentina 243.18 112 42 - 1481 0.35 0.053
Brazil 209.67 229 38 72.7% 9030 0.23 0.11
Chile 81.22 230 62 33.3% 5221 0.28 0.058
Colombia 270.83 303 54 - 2325 0.33 0.072
Mexico 115.02 400 54 30% 10308 0.28 0.091
Peru 206.25 98 36 - 1367 0.32 0.064
Venezuela 260.50 219 67 - 25070 0.25 0.027
Africa
South Africa 102.10 211 49 83.3% 3544 0.20 0.092
Sample Mean 107.72 459 57 49.28% 6191 0.33 0.065
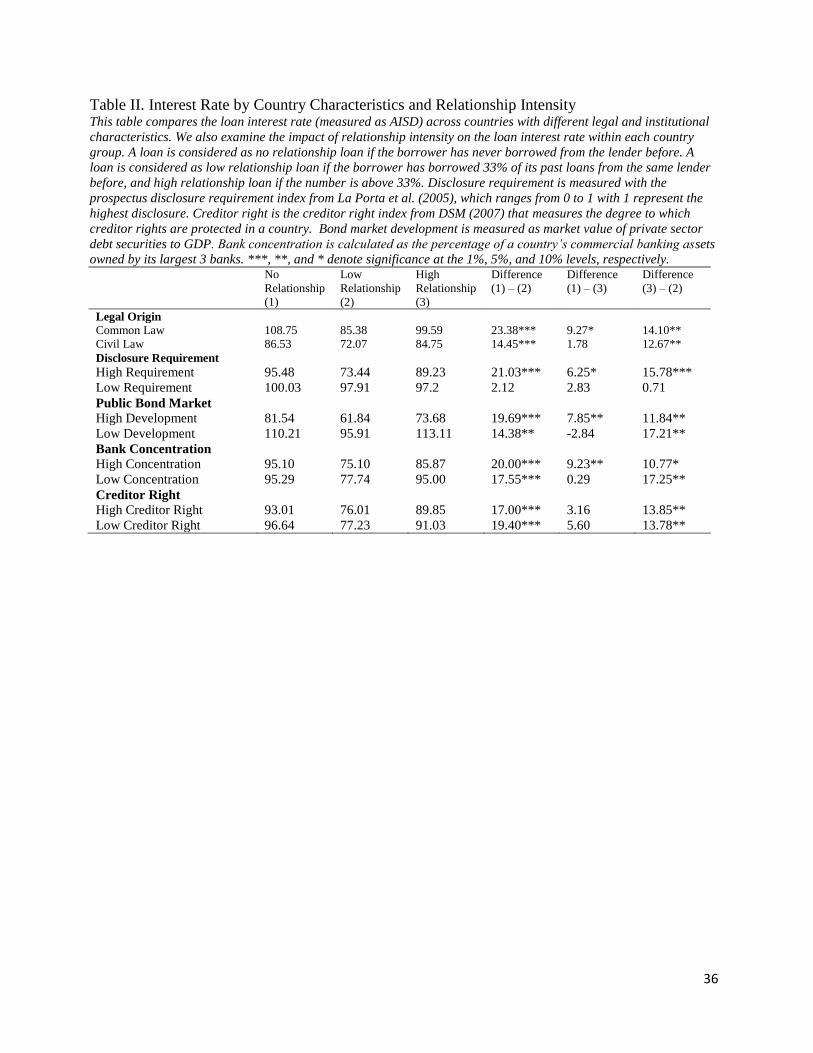
36
Table II. Interest Rate by Country Characteristics and Relationship Intensity This table compares the loan interest rate (measured as AISD) across countries with different legal and institutional
characteristics. We also examine the impact of relationship intensity on the loan interest rate within each country
group. A loan is considered as no relationship loan if the borrower has never borrowed from the lender before. A
loan is considered as low relationship loan if the borrower has borrowed 33% of its past loans from the same lender
before, and high relationship loan if the number is above 33%. Disclosure requirement is measured with the
prospectus disclosure requirement index from La Porta et al. (2005), which ranges from 0 to 1 with 1 represent the
highest disclosure. Creditor right is the creditor right index from DSM (2007) that measures the degree to which
creditor rights are protected in a country. Bond market development is measured as market value of private sector
debt securities to GDP. Bank concentration is calculated as the percentage of a country’s commercial banking assets
owned by its largest 3 banks. ***, **, and * denote significance at the 1%, 5%, and 10% levels, respectively. No
Relationship
(1)
Low
Relationship
(2)
High
Relationship
(3)
Difference
(1) – (2)
Difference
(1) – (3)
Difference
(3) – (2)
Legal Origin
Common Law 108.75 85.38 99.59 23.38*** 9.27* 14.10**
Civil Law 86.53 72.07 84.75 14.45*** 1.78 12.67**
Disclosure Requirement
High Requirement 95.48 73.44 89.23 21.03*** 6.25* 15.78***
Low Requirement 100.03 97.91 97.2 2.12 2.83 0.71
Public Bond Market
High Development 81.54 61.84 73.68 19.69*** 7.85** 11.84**
Low Development 110.21 95.91 113.11 14.38** -2.84 17.21**
Bank Concentration
High Concentration 95.10 75.10 85.87 20.00*** 9.23** 10.77*
Low Concentration 95.29 77.74 95.00 17.55*** 0.29 17.25**
Creditor Right
High Creditor Right 93.01 76.01 89.85 17.00*** 3.16 13.85**
Low Creditor Right 96.64 77.23 91.03 19.40*** 5.60 13.78**
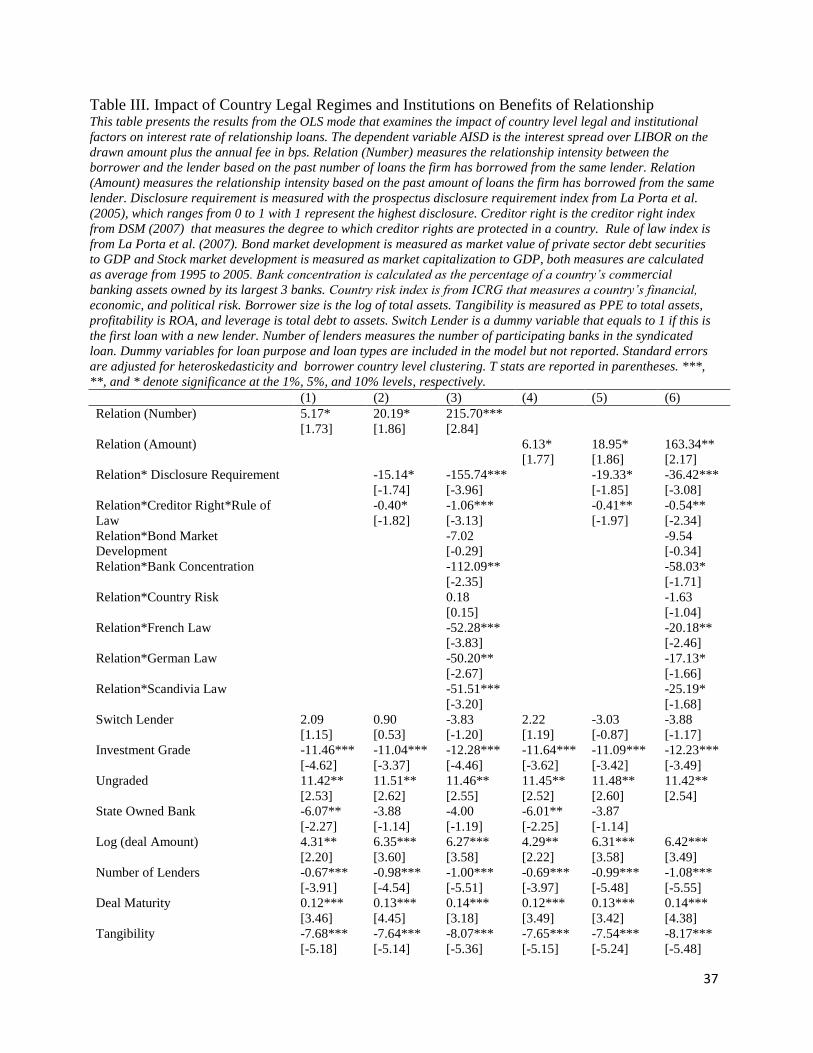
37
Table III. Impact of Country Legal Regimes and Institutions on Benefits of Relationship This table presents the results from the OLS mode that examines the impact of country level legal and institutional
factors on interest rate of relationship loans. The dependent variable AISD is the interest spread over LIBOR on the
drawn amount plus the annual fee in bps. Relation (Number) measures the relationship intensity between the
borrower and the lender based on the past number of loans the firm has borrowed from the same lender. Relation
(Amount) measures the relationship intensity based on the past amount of loans the firm has borrowed from the same
lender. Disclosure requirement is measured with the prospectus disclosure requirement index from La Porta et al.
(2005), which ranges from 0 to 1 with 1 represent the highest disclosure. Creditor right is the creditor right index
from DSM (2007) that measures the degree to which creditor rights are protected in a country. Rule of law index is
from La Porta et al. (2007). Bond market development is measured as market value of private sector debt securities
to GDP and Stock market development is measured as market capitalization to GDP, both measures are calculated
as average from 1995 to 2005. Bank concentration is calculated as the percentage of a country’s commercial
banking assets owned by its largest 3 banks. Country risk index is from ICRG that measures a country’s financial,
economic, and political risk. Borrower size is the log of total assets. Tangibility is measured as PPE to total assets,
profitability is ROA, and leverage is total debt to assets. Switch Lender is a dummy variable that equals to 1 if this is
the first loan with a new lender. Number of lenders measures the number of participating banks in the syndicated
loan. Dummy variables for loan purpose and loan types are included in the model but not reported. Standard errors
are adjusted for heteroskedasticity and borrower country level clustering. T stats are reported in parentheses. ***,
**, and * denote significance at the 1%, 5%, and 10% levels, respectively.
(1) (2) (3) (4) (5) (6)
Relation (Number) 5.17*
[1.73]
20.19*
[1.86]
215.70***
[2.84]
Relation (Amount) 6.13*
[1.77]
18.95*
[1.86]
163.34**
[2.17]
Relation* Disclosure Requirement -15.14*
[-1.74]
-155.74***
[-3.96]
-19.33*
[-1.85]
-36.42***
[-3.08]
Relation*Creditor Right*Rule of
Law
-0.40*
[-1.82]
-1.06***
[-3.13]
-0.41**
[-1.97]
-0.54**
[-2.34]
Relation*Bond Market
Development
-7.02
[-0.29]
-9.54
[-0.34]
Relation*Bank Concentration -112.09**
[-2.35]
-58.03*
[-1.71]
Relation*Country Risk 0.18
[0.15]
-1.63
[-1.04]
Relation*French Law -52.28***
[-3.83]
-20.18**
[-2.46]
Relation*German Law -50.20**
[-2.67]
-17.13*
[-1.66]
Relation*Scandivia Law -51.51***
[-3.20]
-25.19*
[-1.68]
Switch Lender 2.09
[1.15]
0.90
[0.53]
-3.83
[-1.20]
2.22
[1.19]
-3.03
[-0.87]
-3.88
[-1.17]
Investment Grade -11.46***
[-4.62]
-11.04***
[-3.37]
-12.28***
[-4.46]
-11.64***
[-3.62]
-11.09***
[-3.42]
-12.23***
[-3.49]
Ungraded 11.42**
[2.53]
11.51**
[2.62]
11.46**
[2.55]
11.45**
[2.52]
11.48**
[2.60]
11.42**
[2.54]
State Owned Bank -6.07**
[-2.27]
-3.88
[-1.14]
-4.00
[-1.19]
-6.01**
[-2.25]
-3.87
[-1.14]
Log (deal Amount) 4.31**
[2.20]
6.35***
[3.60]
6.27***
[3.58]
4.29**
[2.22]
6.31***
[3.58]
6.42***
[3.49]
Number of Lenders -0.67***
[-3.91]
-0.98***
[-4.54]
-1.00***
[-5.51]
-0.69***
[-3.97]
-0.99***
[-5.48]
-1.08***
[-5.55]
Deal Maturity 0.12***
[3.46]
0.13***
[4.45]
0.14***
[3.18]
0.12***
[3.49]
0.13***
[3.42]
0.14***
[4.38]
Tangibility -7.68***
[-5.18]
-7.64***
[-5.14]
-8.07***
[-5.36]
-7.65***
[-5.15]
-7.54***
[-5.24]
-8.17***
[-5.48]
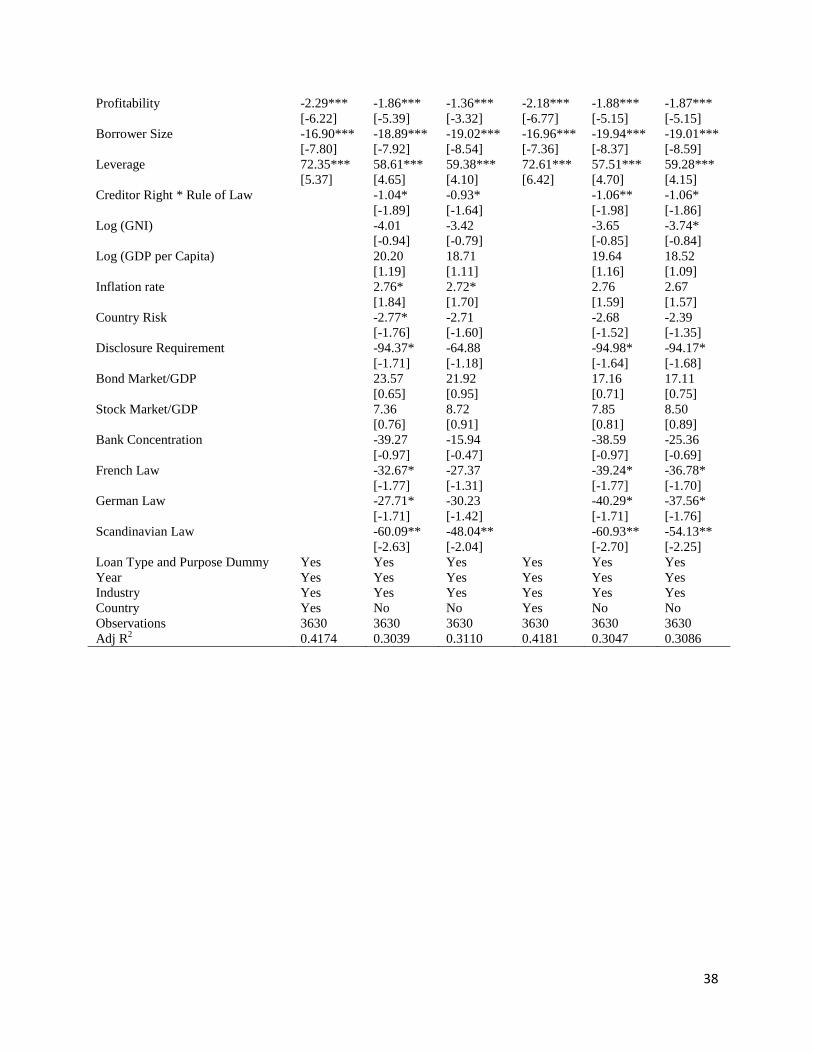
38
Profitability -2.29***
[-6.22]
-1.86***
[-5.39]
-1.36***
[-3.32]
-2.18***
[-6.77]
-1.88***
[-5.15]
-1.87***
[-5.15]
Borrower Size -16.90***
[-7.80]
-18.89***
[-7.92]
-19.02***
[-8.54]
-16.96***
[-7.36]
-19.94***
[-8.37]
-19.01***
[-8.59]
Leverage 72.35***
[5.37]
58.61***
[4.65]
59.38***
[4.10]
72.61***
[6.42]
57.51***
[4.70]
59.28***
[4.15]
Creditor Right * Rule of Law -1.04*
[-1.89]
-0.93*
[-1.64]
-1.06**
[-1.98]
-1.06*
[-1.86]
Log (GNI)
-4.01
[-0.94]
-3.42
[-0.79]
-3.65
[-0.85]
-3.74*
[-0.84]
Log (GDP per Capita) 20.20
[1.19]
18.71
[1.11]
19.64
[1.16]
18.52
[1.09]
Inflation rate 2.76*
[1.84]
2.72*
[1.70]
2.76
[1.59]
2.67
[1.57]
Country Risk -2.77*
[-1.76]
-2.71
[-1.60]
-2.68
[-1.52]
-2.39
[-1.35]
Disclosure Requirement -94.37*
[-1.71]
-64.88
[-1.18]
-94.98*
[-1.64]
-94.17*
[-1.68]
Bond Market/GDP 23.57
[0.65]
21.92
[0.95]
17.16
[0.71]
17.11
[0.75]
Stock Market/GDP 7.36
[0.76]
8.72
[0.91]
7.85
[0.81]
8.50
[0.89]
Bank Concentration -39.27
[-0.97]
-15.94
[-0.47]
-38.59
[-0.97]
-25.36
[-0.69]
French Law -32.67*
[-1.77]
-27.37
[-1.31]
-39.24*
[-1.77]
-36.78*
[-1.70]
German Law -27.71*
[-1.71]
-30.23
[-1.42]
-40.29*
[-1.71]
-37.56*
[-1.76]
Scandinavian Law -60.09**
[-2.63]
-48.04**
[-2.04]
-60.93**
[-2.70]
-54.13**
[-2.25]
Loan Type and Purpose Dummy Yes Yes Yes Yes Yes Yes
Year Yes Yes Yes Yes Yes Yes
Industry Yes Yes Yes Yes Yes Yes
Country Yes No No Yes No No
Observations 3630 3630 3630 3630 3630 3630
Adj R2 0.4174 0.3039 0.3110 0.4181 0.3047 0.3086

39
Table IV: Impact of Country Legal Regimes and Institutions on Benefits of Relationship:
Propensity Score Approach: This table examines the impact of country level legal and institutional factors on
relationship loan cost using propensity score matching approach. Panel A compares the loan and borrower
characteristics between the relationship loan and its nearest 5 matching non-relationship loans based on propensity
score. Panel B compares the difference in AISD between the relationship loan and its matching non-relationship
loans by borrower country’s creditor rights, disclosure regulation, and borrower’s relationship intensity with its
relationship bank. Panel C presents the results from the OLS model that examines the determinants of difference in
interest rate. The dependent variable is the difference in interest spread between the relationship loan and its
matching non-relationship loans. Relation (Number) measures the relationship intensity between the borrower and
the lender based on the past number of loans the firm has borrowed from the same lender. Relation (Amount)
measures the relationship intensity based on the past amount of loans the firm has borrowed from the same lender.
Disclosure requirement is measured with the prospectus disclosure requirement index from La Porta et al. (2005),
which ranges from 0 to 1 with 1 represent the highest disclosure. Creditor right is the creditor right index from
DSM (2007) that measures the degree to which creditor rights are protected in a country. Rule of law index is from
La Porta et al. (2007). Bond market development is measured as market value of private sector debt securities to
GDP and Stock market development is measured as market capitalization to GDP, both measures are calculated as
average from 1995 to 2005. Bank concentration is calculated as the percentage of a country’s commercial banking
assets owned by its largest 3 banks. Standard errors are adjusted for heteroskedasticity and borrower country level
clustering. T stats are reported in parentheses. ***, **, and * denote significance at the 1%, 5%, and 10% levels,
respectively.
Panel A. Matching Loan and Firm Characteristics
Log (Firm
Size)
Firm
Leverage
Firm
Profitability
Loan
Maturity
(Months)
Loan Size (Millions)
Non-
Relationship
Loan
8.28 0.34 0.054 58 793
Relationship
Loan
8.28 0.35 0.057 56 753
Panel B. Difference in Interest Rate
Creditor Right Disclosure Requirement Relationship Intensity
Top Half -5.63**
[-2.24]
-0.382
[-0.16]
6.32**
[2.19]
Bottom Half 9.56**
[2.28]
11.52**
[2.07]
-4.76
[-1.48]
Panel C. Regression Results
(1) (2) (3) (4) (5) (6)
Intercept -40.65
[-1.10]
195.57**
[2.29]
202.54*
[1.78]
-45.72
[-1.17]
194.35*
[1.73]
181.03*
[1.69]
Relation (Number) 10.86
[1.15]
6.42
[0.86]
6.45
[1.03]
8.96
[1.07]
8.17
[1.18]
0.69
[-0.61]
Disclosure Requirement -166.91**
[-2.28]
-155.62**
[-2.20]
Creditor Right*Rule of Law -1.33**
[-2.02]
-1.49***
[-2.68]
Bond Market/GDP -11.14
[-0.29]
-1.34
[-0.05]
Stock Market/GDP -5.56
[-0.62]
-4.73
[-0.47]
Bank Concentration -63.98
[-1.51]
-61.43
[-1.49]
German Law -63.80***
[-3.65]
-68.32***
[-3.03]
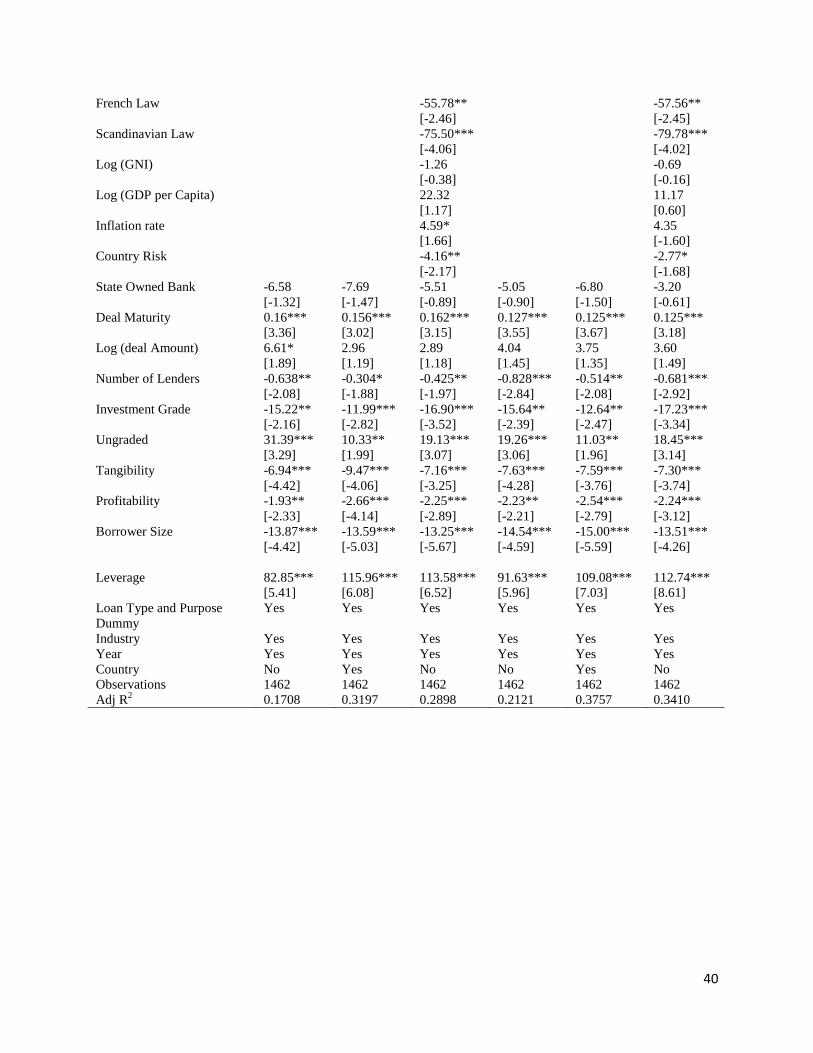
40
French Law -55.78**
[-2.46]
-57.56**
[-2.45]
Scandinavian Law -75.50***
[-4.06]
-79.78***
[-4.02]
Log (GNI) -1.26
[-0.38]
-0.69
[-0.16]
Log (GDP per Capita) 22.32
[1.17]
11.17
[0.60]
Inflation rate 4.59*
[1.66]
4.35
[-1.60]
Country Risk -4.16**
[-2.17]
-2.77*
[-1.68]
State Owned Bank -6.58
[-1.32]
-7.69
[-1.47]
-5.51
[-0.89]
-5.05
[-0.90]
-6.80
[-1.50]
-3.20
[-0.61]
Deal Maturity 0.16***
[3.36]
0.156***
[3.02]
0.162***
[3.15]
0.127***
[3.55]
0.125***
[3.67]
0.125***
[3.18]
Log (deal Amount) 6.61*
[1.89]
2.96
[1.19]
2.89
[1.18]
4.04
[1.45]
3.75
[1.35]
3.60
[1.49]
Number of Lenders -0.638**
[-2.08]
-0.304*
[-1.88]
-0.425**
[-1.97]
-0.828***
[-2.84]
-0.514**
[-2.08]
-0.681***
[-2.92]
Investment Grade -15.22**
[-2.16]
-11.99***
[-2.82]
-16.90***
[-3.52]
-15.64**
[-2.39]
-12.64**
[-2.47]
-17.23***
[-3.34]
Ungraded 31.39***
[3.29]
10.33**
[1.99]
19.13***
[3.07]
19.26***
[3.06]
11.03**
[1.96]
18.45***
[3.14]
Tangibility -6.94***
[-4.42]
-9.47***
[-4.06]
-7.16***
[-3.25]
-7.63***
[-4.28]
-7.59***
[-3.76]
-7.30***
[-3.74]
Profitability -1.93**
[-2.33]
-2.66***
[-4.14]
-2.25***
[-2.89]
-2.23**
[-2.21]
-2.54***
[-2.79]
-2.24***
[-3.12]
Borrower Size -13.87***
[-4.42]
-13.59***
[-5.03]
-13.25***
[-5.67]
-14.54***
[-4.59]
-15.00***
[-5.59]
-13.51***
[-4.26]
Leverage 82.85***
[5.41]
115.96***
[6.08]
113.58***
[6.52]
91.63***
[5.96]
109.08***
[7.03]
112.74***
[8.61]
Loan Type and Purpose
Dummy
Yes Yes Yes Yes Yes Yes
Industry Yes Yes Yes Yes Yes Yes
Year Yes Yes Yes Yes Yes Yes
Country No Yes No No Yes No
Observations 1462 1462 1462 1462 1462 1462
Adj R2 0.1708 0.3197 0.2898 0.2121 0.3757 0.3410
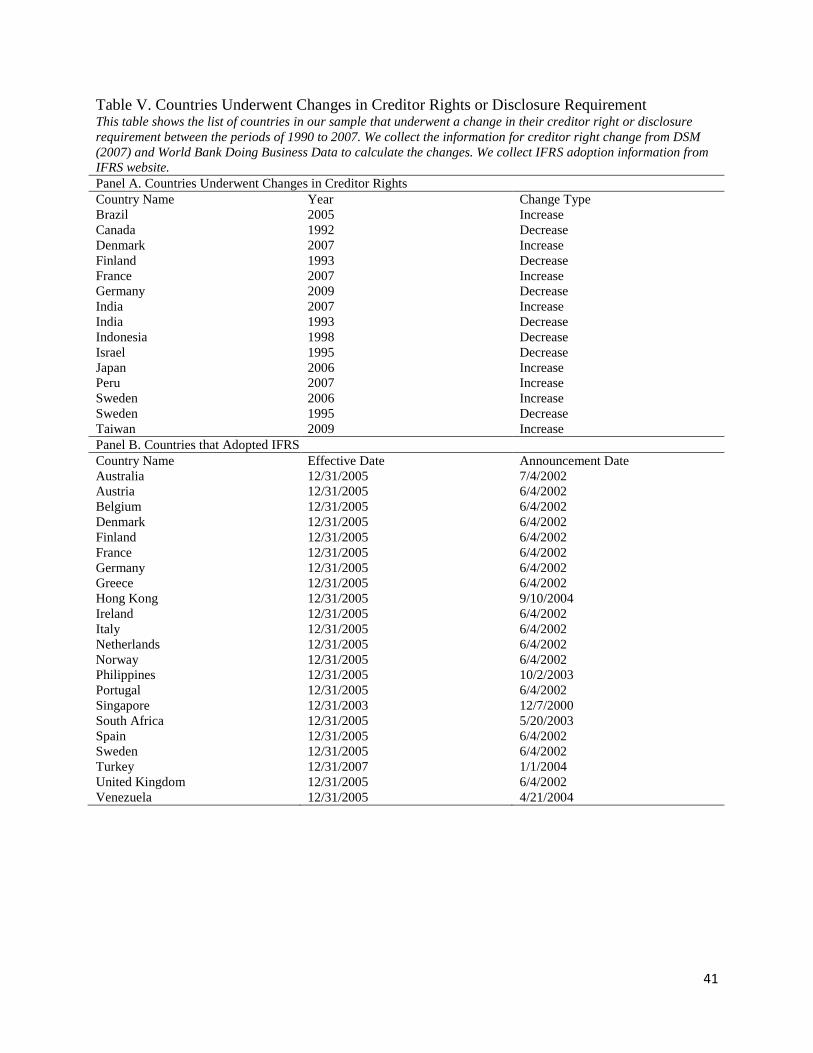
41
Table V. Countries Underwent Changes in Creditor Rights or Disclosure Requirement This table shows the list of countries in our sample that underwent a change in their creditor right or disclosure
requirement between the periods of 1990 to 2007. We collect the information for creditor right change from DSM
(2007) and World Bank Doing Business Data to calculate the changes. We collect IFRS adoption information from
IFRS website.
Panel A. Countries Underwent Changes in Creditor Rights
Country Name Year Change Type
Brazil 2005 Increase
Canada 1992 Decrease
Denmark 2007 Increase
Finland 1993 Decrease
France 2007 Increase
Germany 2009 Decrease
India 2007 Increase
India 1993 Decrease
Indonesia 1998 Decrease
Israel 1995 Decrease
Japan 2006 Increase
Peru 2007 Increase
Sweden 2006 Increase
Sweden 1995 Decrease
Taiwan 2009 Increase
Panel B. Countries that Adopted IFRS
Country Name Effective Date Announcement Date
Australia 12/31/2005 7/4/2002
Austria 12/31/2005 6/4/2002
Belgium 12/31/2005 6/4/2002
Denmark 12/31/2005 6/4/2002
Finland 12/31/2005 6/4/2002
France 12/31/2005 6/4/2002
Germany 12/31/2005 6/4/2002
Greece 12/31/2005 6/4/2002
Hong Kong 12/31/2005 9/10/2004
Ireland 12/31/2005 6/4/2002
Italy 12/31/2005 6/4/2002
Netherlands 12/31/2005 6/4/2002
Norway 12/31/2005 6/4/2002
Philippines 12/31/2005 10/2/2003
Portugal 12/31/2005 6/4/2002
Singapore 12/31/2003 12/7/2000
South Africa 12/31/2005 5/20/2003
Spain 12/31/2005 6/4/2002
Sweden 12/31/2005 6/4/2002
Turkey 12/31/2007 1/1/2004
United Kingdom 12/31/2005 6/4/2002
Venezuela 12/31/2005 4/21/2004

42
Table VI. Difference-in-Difference-in-Difference Tests This Table examines the impact of exogenous shocks to country’s creditor right protection and disclosure
requirement on the benefits of relationship lending. Panel A reports the results using exogenous change in creditor
rights. We use creditor right index from DSM (2007) and World Bank Doing Business Data to calculate the
changes. Creditor right change decrease is a dummy variable that equals to 1 for periods after the country’s
creditor right index decreased. Creditor rights change increase equals to 1 for periods after the country’s creditor
right index increased. Panel B reports the results using exogenous change in disclosure requirement due to
country’s adoption of IFRS. First-Time mandatory is a dummy variable that indicates firm-years ending after IFRS
adoption becomes mandatory and applies only to firms that have never reported under IFRS. Voluntary is a dummy
variable for firms that voluntarily adopt IFRS or US GAAP before the mandatory adoption took effect in the local
country. Mandatory is a dummy variable that equals to 1 for firm-years ending after IFRS adoption becomes
mandatory. Local and IFRS Diff is an indicator variable for top quartile countries who have the greatest difference
between their local accounting standard and IFRS. Relation measures the relationship intensity between the
borrower and the lender, in model 1 and 3, it is based on the past number of loans the firm has borrowed from the
same lender. In model 2 and 4, it is based on the past amount of loans the firm has borrowed from the same lender.
Bond market development is measured as market value of private sector debt securities to GDP. Country risk index
is from ICRG that measures a country’s financial, economic, and political risk. Bank concentration is calculated as
the percentage of a country’s commercial banking assets owned by its largest 3 banks. Standard errors are adjusted
for heteroskedasticity and borrower country level clustering. T stats are reported in parentheses. ***, **, and *
denote significance at the 1%, 5%, and 10% levels, respectively.
Panel A. Creditor Rights Protection Change Results
(1) (2) (3) (4)
Creditor Rights Change Decrease *
Relation
82.54**
[2.47]
83.72**
[2.41]
92.91***
[2.73]
85.21***
[2.65]
Creditor Rights Change Increase *
Relation
-26.09
[-1.43]
-21.09
[-1.21]
-23.24
[-1.15]
-21.52
[-1.12]
Creditor Rights Change Decrease 61.75
[1.20]
54.31
[1.15]
66.07
[1.07]
60.21
[1.39]
Creditor Rights Change Increase -62.01***
[-6.40]
-61.40
[-6.42]
-54.14***
[-5.61]
-54.41***
[-5.65]
Relation 223.92*
[1.80]
213.36**
[1.99]
121.44
[0.53]
47.21
[0.63]
Relation * Country Dummy Yes Yes Yes Yes
Relation * Year Dummy Yes Yes Yes Yes
Relation * Industry Dummy Yes Yes Yes Yes
Relation * Countryrisk 8.98***
[2.80]
6.246*
[1.92]
Relation * Bond Market/GDP 33.48
[0.86]
34.48
[0.64]
Relation * Bank Concentration 38.39
[0.69]
11.01
[0.31]
Relation * Firm and Loan Level
Variables
No No Yes
Yes
Country, Firm and Loan Level Control
Variables
Yes Yes Yes Yes
Industry Dummy Yes Yes Yes Yes
Year Dummy Yes Yes Yes Yes
Country Dummy Yes Yes Yes Yes
Observations 3305 3305 3305 3305
Adj R2 0.4173 0.4173 0.4863 0.4245
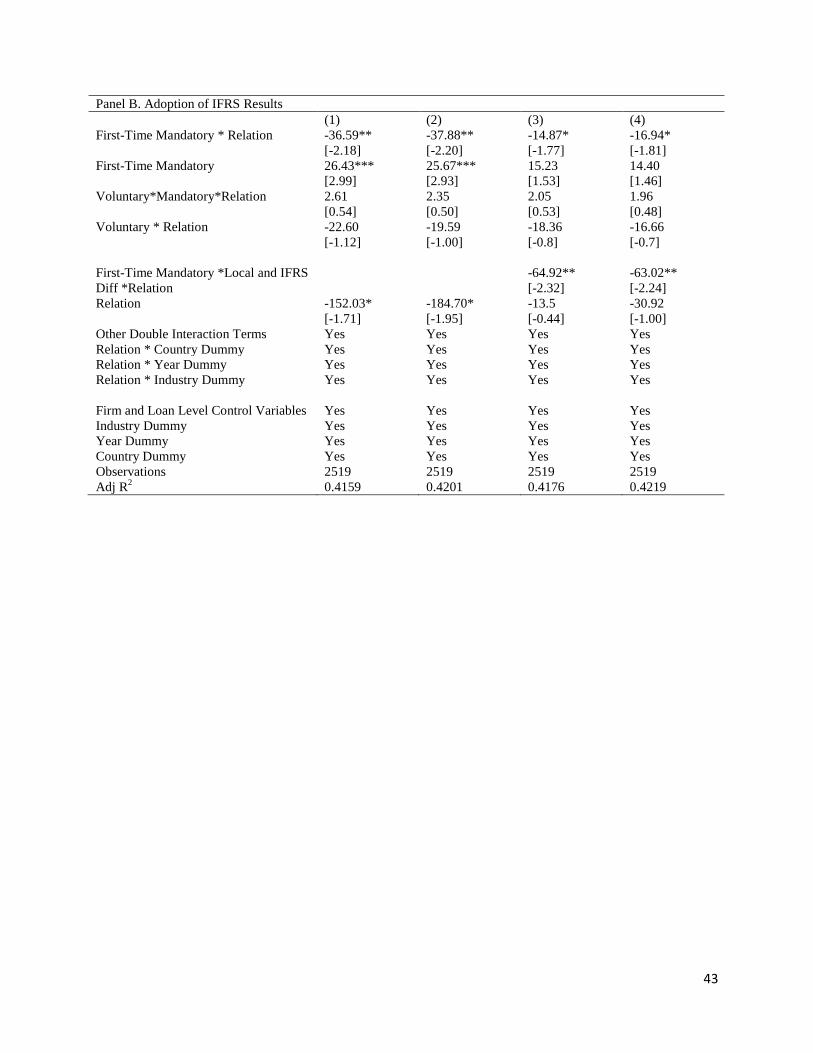
43
Panel B. Adoption of IFRS Results
(1) (2) (3) (4)
First-Time Mandatory * Relation -36.59**
[-2.18]
-37.88**
[-2.20]
-14.87*
[-1.77]
-16.94*
[-1.81]
First-Time Mandatory
26.43***
[2.99]
25.67***
[2.93]
15.23
[1.53]
14.40
[1.46]
Voluntary*Mandatory*Relation 2.61
[0.54]
2.35
[0.50]
2.05
[0.53]
1.96
[0.48]
Voluntary * Relation -22.60
[-1.12]
-19.59
[-1.00]
-18.36
[-0.8]
-16.66
[-0.7]
First-Time Mandatory *Local and IFRS
Diff *Relation
-64.92**
[-2.32]
-63.02**
[-2.24]
Relation -152.03*
[-1.71]
-184.70*
[-1.95]
-13.5
[-0.44]
-30.92
[-1.00]
Other Double Interaction Terms Yes Yes Yes Yes
Relation * Country Dummy Yes Yes Yes Yes
Relation * Year Dummy Yes Yes Yes Yes
Relation * Industry Dummy Yes Yes Yes Yes
Firm and Loan Level Control Variables Yes Yes Yes Yes
Industry Dummy Yes Yes Yes Yes
Year Dummy Yes Yes Yes Yes
Country Dummy Yes Yes Yes Yes
Observations 2519 2519 2519 2519
Adj R2 0.4159 0.4201 0.4176 0.4219
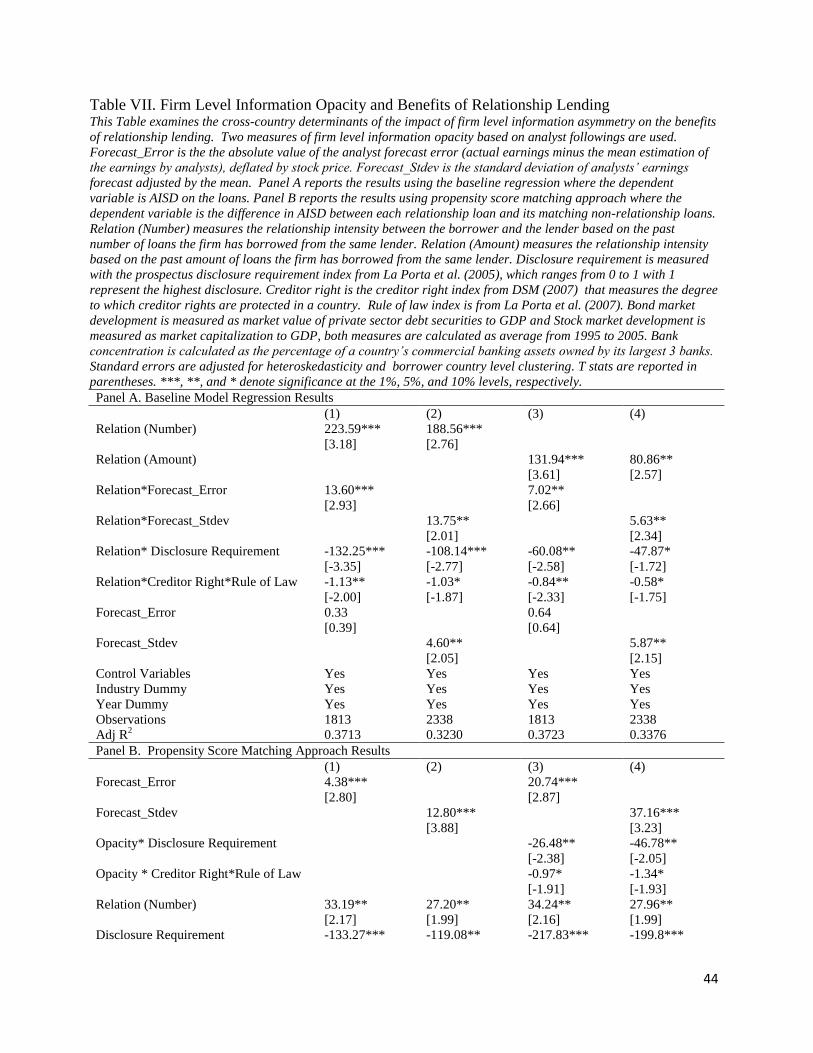
44
Table VII. Firm Level Information Opacity and Benefits of Relationship Lending This Table examines the cross-country determinants of the impact of firm level information asymmetry on the benefits
of relationship lending. Two measures of firm level information opacity based on analyst followings are used.
Forecast_Error is the the absolute value of the analyst forecast error (actual earnings minus the mean estimation of
the earnings by analysts), deflated by stock price. Forecast_Stdev is the standard deviation of analysts’ earnings
forecast adjusted by the mean. Panel A reports the results using the baseline regression where the dependent
variable is AISD on the loans. Panel B reports the results using propensity score matching approach where the
dependent variable is the difference in AISD between each relationship loan and its matching non-relationship loans.
Relation (Number) measures the relationship intensity between the borrower and the lender based on the past
number of loans the firm has borrowed from the same lender. Relation (Amount) measures the relationship intensity
based on the past amount of loans the firm has borrowed from the same lender. Disclosure requirement is measured
with the prospectus disclosure requirement index from La Porta et al. (2005), which ranges from 0 to 1 with 1
represent the highest disclosure. Creditor right is the creditor right index from DSM (2007) that measures the degree
to which creditor rights are protected in a country. Rule of law index is from La Porta et al. (2007). Bond market
development is measured as market value of private sector debt securities to GDP and Stock market development is
measured as market capitalization to GDP, both measures are calculated as average from 1995 to 2005. Bank
concentration is calculated as the percentage of a country’s commercial banking assets owned by its largest 3 banks.
Standard errors are adjusted for heteroskedasticity and borrower country level clustering. T stats are reported in
parentheses. ***, **, and * denote significance at the 1%, 5%, and 10% levels, respectively.
Panel A. Baseline Model Regression Results
(1) (2) (3) (4)
Relation (Number) 223.59***
[3.18]
188.56***
[2.76]
Relation (Amount) 131.94***
[3.61]
80.86**
[2.57]
Relation*Forecast_Error 13.60***
[2.93]
7.02**
[2.66]
Relation*Forecast_Stdev 13.75**
[2.01]
5.63**
[2.34]
Relation* Disclosure Requirement -132.25***
[-3.35]
-108.14***
[-2.77]
-60.08**
[-2.58]
-47.87*
[-1.72]
Relation*Creditor Right*Rule of Law -1.13**
[-2.00]
-1.03*
[-1.87]
-0.84**
[-2.33]
-0.58*
[-1.75]
Forecast_Error 0.33
[0.39]
0.64
[0.64]
Forecast_Stdev 4.60**
[2.05]
5.87**
[2.15]
Control Variables Yes Yes Yes Yes
Industry Dummy Yes Yes Yes Yes
Year Dummy Yes Yes Yes Yes
Observations 1813 2338 1813 2338
Adj R2 0.3713 0.3230 0.3723 0.3376
Panel B. Propensity Score Matching Approach Results
(1) (2) (3) (4)
Forecast_Error 4.38***
[2.80]
20.74***
[2.87]
Forecast_Stdev 12.80***
[3.88]
37.16***
[3.23]
Opacity* Disclosure Requirement -26.48**
[-2.38]
-46.78**
[-2.05]
Opacity * Creditor Right*Rule of Law -0.97*
[-1.91]
-1.34*
[-1.93]
Relation (Number) 33.19**
[2.17]
27.20**
[1.99]
34.24**
[2.16]
27.96**
[1.99]
Disclosure Requirement -133.27*** -119.08** -217.83*** -199.8***
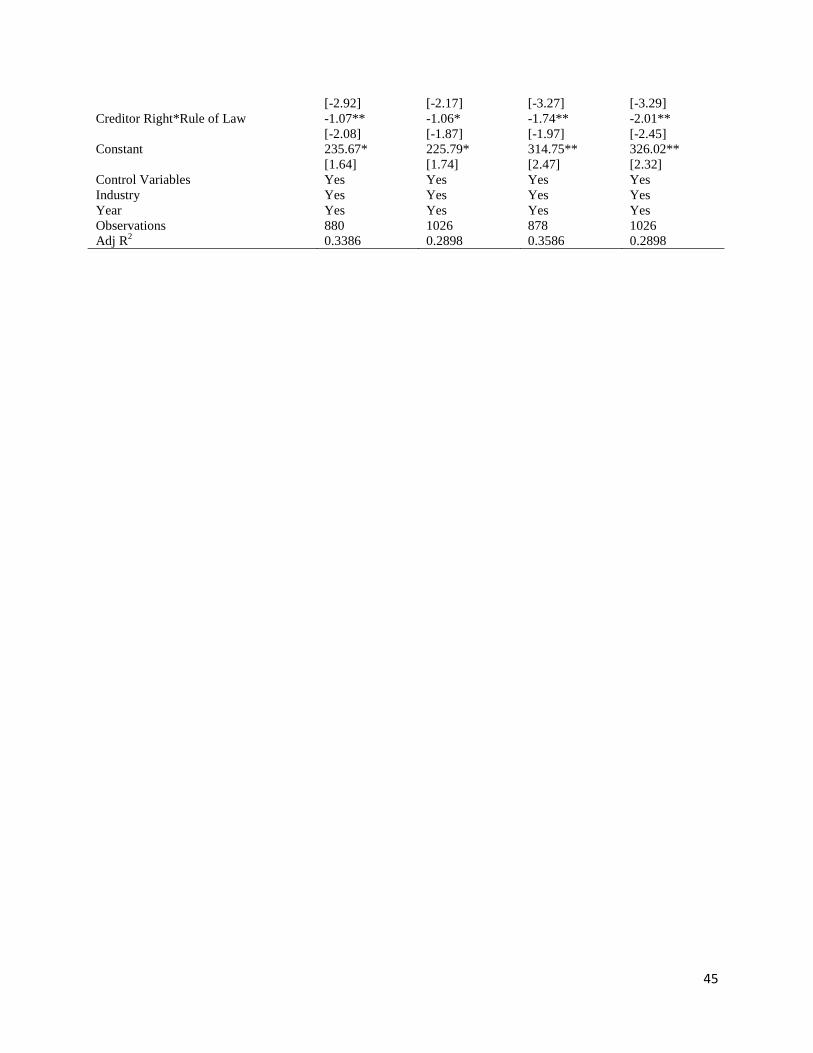
45
[-2.92] [-2.17] [-3.27] [-3.29]
Creditor Right*Rule of Law -1.07**
[-2.08]
-1.06*
[-1.87]
-1.74**
[-1.97]
-2.01**
[-2.45]
Constant 235.67*
[1.64]
225.79*
[1.74]
314.75**
[2.47]
326.02**
[2.32]
Control Variables Yes Yes Yes Yes
Industry Yes Yes Yes Yes
Year Yes Yes Yes Yes
Observations 880 1026 878 1026
Adj R2 0.3386 0.2898 0.3586 0.2898
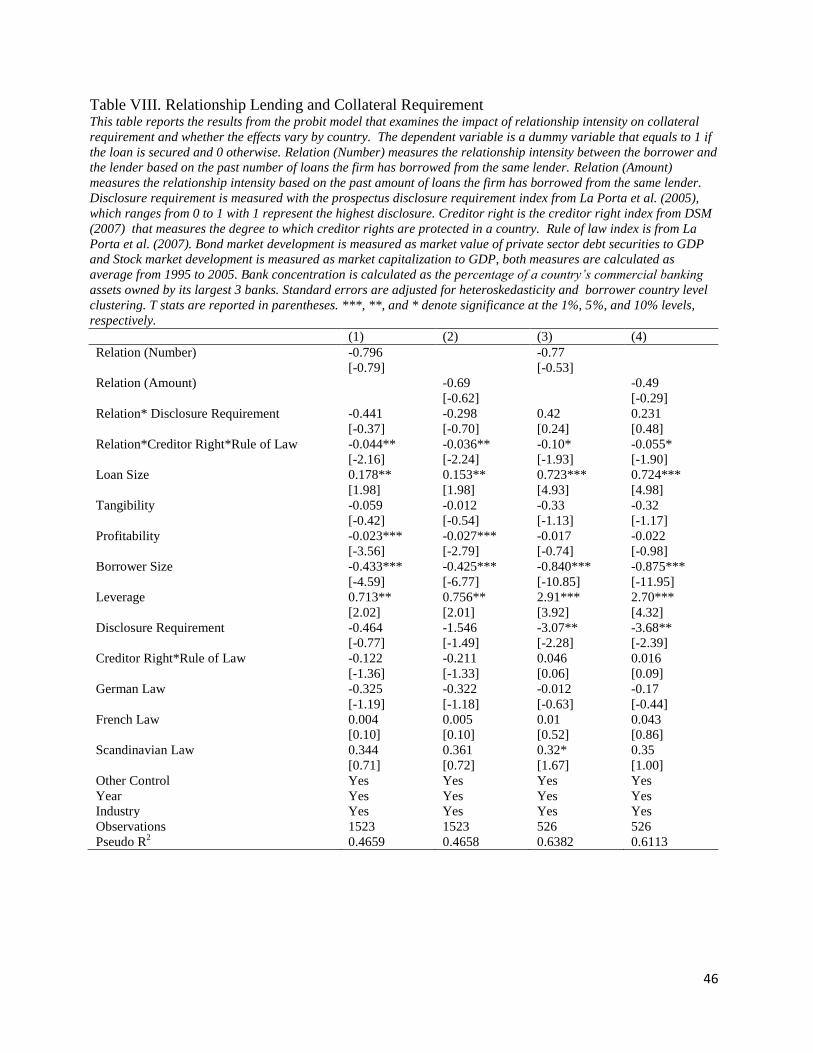
46
Table VIII. Relationship Lending and Collateral Requirement This table reports the results from the probit model that examines the impact of relationship intensity on collateral
requirement and whether the effects vary by country. The dependent variable is a dummy variable that equals to 1 if
the loan is secured and 0 otherwise. Relation (Number) measures the relationship intensity between the borrower and
the lender based on the past number of loans the firm has borrowed from the same lender. Relation (Amount)
measures the relationship intensity based on the past amount of loans the firm has borrowed from the same lender.
Disclosure requirement is measured with the prospectus disclosure requirement index from La Porta et al. (2005),
which ranges from 0 to 1 with 1 represent the highest disclosure. Creditor right is the creditor right index from DSM
(2007) that measures the degree to which creditor rights are protected in a country. Rule of law index is from La
Porta et al. (2007). Bond market development is measured as market value of private sector debt securities to GDP
and Stock market development is measured as market capitalization to GDP, both measures are calculated as
average from 1995 to 2005. Bank concentration is calculated as the percentage of a country’s commercial banking
assets owned by its largest 3 banks. Standard errors are adjusted for heteroskedasticity and borrower country level
clustering. T stats are reported in parentheses. ***, **, and * denote significance at the 1%, 5%, and 10% levels,
respectively.
(1) (2) (3) (4)
Relation (Number) -0.796
[-0.79]
-0.77
[-0.53]
Relation (Amount) -0.69
[-0.62]
-0.49
[-0.29]
Relation* Disclosure Requirement -0.441
[-0.37]
-0.298
[-0.70]
0.42
[0.24]
0.231
[0.48]
Relation*Creditor Right*Rule of Law -0.044**
[-2.16]
-0.036**
[-2.24]
-0.10*
[-1.93]
-0.055*
[-1.90]
Loan Size 0.178**
[1.98]
0.153**
[1.98]
0.723***
[4.93]
0.724***
[4.98]
Tangibility -0.059
[-0.42]
-0.012
[-0.54]
-0.33
[-1.13]
-0.32
[-1.17]
Profitability -0.023***
[-3.56]
-0.027***
[-2.79]
-0.017
[-0.74]
-0.022
[-0.98]
Borrower Size -0.433***
[-4.59]
-0.425***
[-6.77]
-0.840***
[-10.85]
-0.875***
[-11.95]
Leverage 0.713**
[2.02]
0.756**
[2.01]
2.91***
[3.92]
2.70***
[4.32]
Disclosure Requirement -0.464
[-0.77]
-1.546
[-1.49]
-3.07**
[-2.28]
-3.68**
[-2.39]
Creditor Right*Rule of Law -0.122
[-1.36]
-0.211
[-1.33]
0.046
[0.06]
0.016
[0.09]
German Law -0.325
[-1.19]
-0.322
[-1.18]
-0.012
[-0.63]
-0.17
[-0.44]
French Law 0.004
[0.10]
0.005
[0.10]
0.01
[0.52]
0.043
[0.86]
Scandinavian Law 0.344
[0.71]
0.361
[0.72]
0.32*
[1.67]
0.35
[1.00]
Other Control Yes Yes Yes Yes
Year Yes Yes Yes Yes
Industry Yes Yes Yes Yes
Observations 1523 1523 526 526
Pseudo R2 0.4659 0.4658 0.6382 0.6113
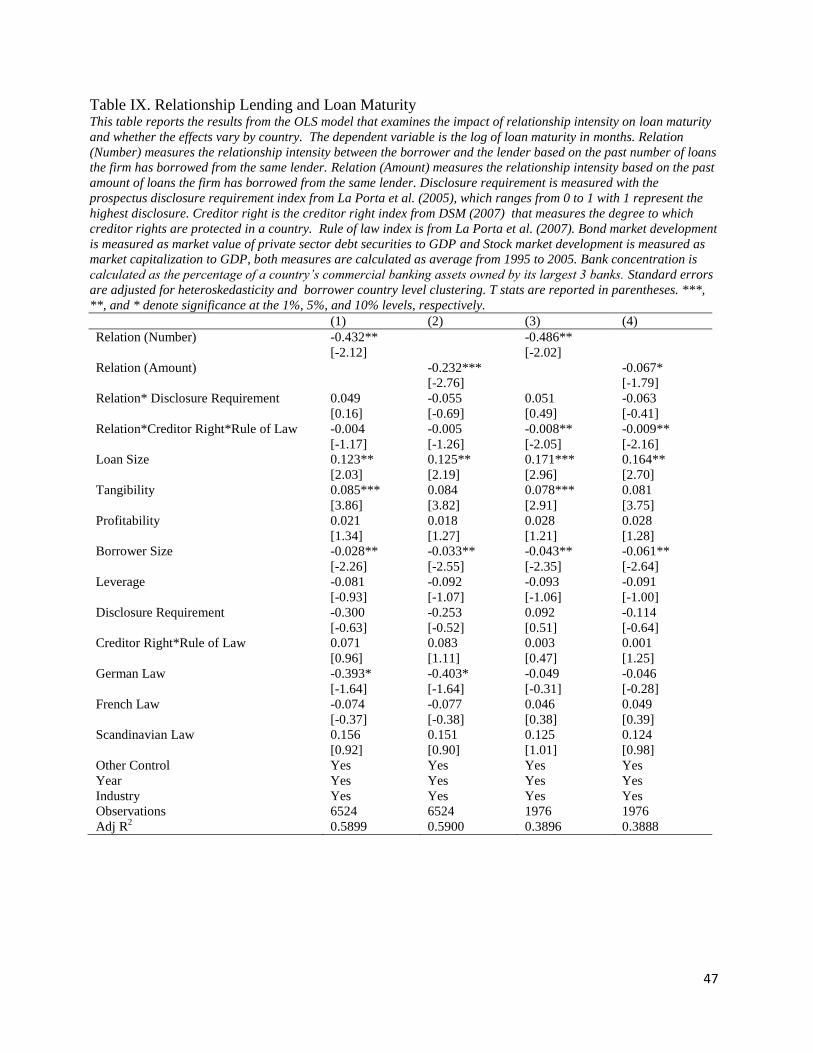
47
Table IX. Relationship Lending and Loan Maturity This table reports the results from the OLS model that examines the impact of relationship intensity on loan maturity
and whether the effects vary by country. The dependent variable is the log of loan maturity in months. Relation
(Number) measures the relationship intensity between the borrower and the lender based on the past number of loans
the firm has borrowed from the same lender. Relation (Amount) measures the relationship intensity based on the past
amount of loans the firm has borrowed from the same lender. Disclosure requirement is measured with the
prospectus disclosure requirement index from La Porta et al. (2005), which ranges from 0 to 1 with 1 represent the
highest disclosure. Creditor right is the creditor right index from DSM (2007) that measures the degree to which
creditor rights are protected in a country. Rule of law index is from La Porta et al. (2007). Bond market development
is measured as market value of private sector debt securities to GDP and Stock market development is measured as
market capitalization to GDP, both measures are calculated as average from 1995 to 2005. Bank concentration is
calculated as the percentage of a country’s commercial banking assets owned by its largest 3 banks. Standard errors
are adjusted for heteroskedasticity and borrower country level clustering. T stats are reported in parentheses. ***,
**, and * denote significance at the 1%, 5%, and 10% levels, respectively.
(1) (2) (3) (4)
Relation (Number) -0.432**
[-2.12]
-0.486**
[-2.02]
Relation (Amount) -0.232***
[-2.76]
-0.067*
[-1.79]
Relation* Disclosure Requirement 0.049
[0.16]
-0.055
[-0.69]
0.051
[0.49]
-0.063
[-0.41]
Relation*Creditor Right*Rule of Law -0.004
[-1.17]
-0.005
[-1.26]
-0.008**
[-2.05]
-0.009**
[-2.16]
Loan Size 0.123**
[2.03]
0.125**
[2.19]
0.171***
[2.96]
0.164**
[2.70]
Tangibility 0.085***
[3.86]
0.084
[3.82]
0.078***
[2.91]
0.081
[3.75]
Profitability 0.021
[1.34]
0.018
[1.27]
0.028
[1.21]
0.028
[1.28]
Borrower Size -0.028**
[-2.26]
-0.033**
[-2.55]
-0.043**
[-2.35]
-0.061**
[-2.64]
Leverage -0.081
[-0.93]
-0.092
[-1.07]
-0.093
[-1.06]
-0.091
[-1.00]
Disclosure Requirement -0.300
[-0.63]
-0.253
[-0.52]
0.092
[0.51]
-0.114
[-0.64]
Creditor Right*Rule of Law 0.071
[0.96]
0.083
[1.11]
0.003
[0.47]
0.001
[1.25]
German Law -0.393*
[-1.64]
-0.403*
[-1.64]
-0.049
[-0.31]
-0.046
[-0.28]
French Law -0.074
[-0.37]
-0.077
[-0.38]
0.046
[0.38]
0.049
[0.39]
Scandinavian Law 0.156
[0.92]
0.151
[0.90]
0.125
[1.01]
0.124
[0.98]
Other Control Yes Yes Yes Yes
Year Yes Yes Yes Yes
Industry Yes Yes Yes Yes
Observations 6524 6524 1976 1976
Adj R2 0.5899 0.5900 0.3896 0.3888
48
References
Acharya, V. V., and Krishnamurthy Subramanian. 2009. Bankrupcy codes and innovation.
Review of Financial Studies 22, 4949-4988.
Barth, J., Lin, C., Lin, P., Song, F., 2009. Corruption in bank lending to firms: cross-country
micro evidence on the beneficial role of competition and information sharing. Journal of
Financial Economics 91, 361–388.
Berger, A., and G. Udell. 1995. Relationship Lending and Lines of Credit in Small Firm Finance.
Journal of Business 68:351–81
Besanko, D., and A. Thakor. 1987. Collateral and Rationing: Sorting Equilibria in Monopolistic
and Competitive Credit Markets. International Economic Review 28:601–689.
Bester, H. 1985. Screening vs. Rationing in Credit Market under Asymmetric Information.
Journal of Economic Theory 42:167–82.
Bharath, S., S. Dahiya, A. Saunders, and A. Srinivasan. 2007. So What Do I Get? The Bank’s
View of Lending Relationships. Journal of Financial Economics 85:368–419.
Bharath, S., S. Dahiya, A. Saunders, and A. Srinivasan. 2011. Lending relationships and loan
contract terms. Review of Financial Studies 24: 1141–1203.
Boot, A., A. Thakor, and G. Udell. 1991. Secured Lending and Default Risk: Equilibrium
Analysis, Policy Implications, and Empirical Results. Economics Journal 101(406):458–72.
Boot, A.W., and A. V. Thakor. 1994. Moral Hazard and Secured Lending in an Infinitely
Repeated Credit Market Game. International Economic Review 35:899–920.
Boot, A. W. 2000. Relationship Banking: What Do We Know? Journal of Financial
Intermediation 9:7–25.
Boyd, J., DeNicol , G., 2005.The theory of bank risk taking and competition revisited. Journal of
Finance 60, 1329–1343.
Bushee, B., and C. Leuz. 2005. Economic Consequences of SEC Disclosure Regulation:
Evidence from the OTC Bulletin Board. Journal of Accounting and Economics 39: 233–64.
Bushman, R.; J. Piotroski, and A. Smith. 2004. What Determines Corporate Transparency?
Journal of Accounting Research 42: 207–52.
Daske, H., Luiz Hail, Christian Leuz, and Rodrigo Verdi, 2008, Mandatory IFRS Reporting
Around the World: Early Evidence on the Economic Consequences. Journal of Accounting
Research
49
Degryse, H., and P. Van Cayseele. 2000. Relationship Lending within a Bank-Based System:
Evidence from European Small Business Data. Journal of Financial Intermediation 9:90–109.
Dennise, S. A., and D. J. Mullineaux. 2000. Syndicated Loans. Journal of Financial
Intermediation 9:404–26.
Diamond, D. 1991. Monitoring and Reputation, the Choice between Bank Loans and Directly
Placed Debt. Journal of Political Economy 99:688–721.
Diamond, D. 2004. Presidential Address, Committing to Commit: Short Term Debt When
Enforcement Is Costly. Journal of Finance 59:1447–79.
Djankov, S., McLiesh, C., Shleifer, A., 2007. Private credit in 129 countries. Journal of Financial
Economics 84, 299–329.
Ferreira, M.A., and Pedro Matos, 2012, Universal Banks and Corporate Control: Evidence from
the Global Syndicated Loan Market. Review of Financial Studies, forth coming.
Greenbaum, S., G. Kanatas, and I. Venezia. 1989. Equilibrium Loan Pricing under the Bank-
Client Relationship. Journal of Banking and Finance 13:221–35.
Hail, L., and Leuz, C., 2005, International difference in the cost of equity capital: do legal
institutions and securities regulation matter? Journal of Accounting Research 44: 485-531
Houston, J.F., Lin, C., Lin, P., and Ma, Yue, 2010, Creditor rights, information sharing, and bank
risk taking, Journal of Finance 96: 485-512
Holmstrom, B., and J. Tirole. 1997. Financial Intermediation, Loanable Funds, and the Real
Sector. Quarterly Journal of Economics 112(3):663–91.
Krishnaswami, S., Spindt, P., Subramaniam, V.,1999. Information asymmetry, monitoring, and
the placement structure of corporate debt. Journal of Financial Economics 51: 407-434.
La Porta, Rafael, Florencio Lopez-de-Silanes, Andrei Shleifer, and Robert Vishny, 1997, Legal
determinants of external finance, Journal of Finance 52, 1131–1150.
La Porta, Rafael, Florencio Lopez-de-Silanes, Andrei Shleifer, and Robert Vishny, 1998, Law
and finance, Journal of Political Economy 106, 1113–1155.
La Porta, Rafael, Florencio Lopez-de-Silanes, Andrei Shleifer, 2005, What Works in Securities
Laws?, The Journal of Finance, Forthcoming .
Lang, M., Lins, K., Miller, D., 2003. ADRs, analysts, and accuracy: does cross listing in the U.S.
improve a firm’s information environment and increase market value? Journal of Accounting
Research 41, 317–346.

50
Qian, J., Strahan, P., 2007. How laws and institutions shape financial contracts: the case of bank
loans. Journal of Finance 62, 2803–2834.
Schenone, Carola, 2010, Lending Relationships and Information Rents: Do Banks Exploit Their
Information Advantages? Review of Financial Studies 23, 1149-1199
Sharpe, S. 1990. Asymmetric Information, Bank Lending and Implicit Contracts: A Stylized
Model of Customer Relationships. Journal of Finance 45:1069–87.
Stulz, R., and H. Johnson. 1985. An Analysis of Secured Debt. Journal of Financial Economics
14:501–21.
Verrecchia, R. 2001. Essays on Disclosure. Journal of Accounting and Economics 32: 91–
180.
Ongena, S., and D. Smith. 2000. What Determines the Number of Bank Relationships? Cross-
Country Evidence. Journal of Financial Intermediation 9:26–56.
Petersen, M. A., and R. G. Rajan. 1994. The Benefits of Lending Relationships: Evidence from
Small Business Data. Journal of Finance 49:3–37.