Embed Size (px)
Citation preview
HAL Id: halshs-00193306https://halshs.archives-ouvertes.fr/halshs-00193306
Submitted on 3 Dec 2007
HAL is a multi-disciplinary open accessarchive for the deposit and dissemination of sci-entific research documents, whether they are pub-lished or not. The documents may come fromteaching and research institutions in France orabroad, or from public or private research centers.
L’archive ouverte pluridisciplinaire HAL, estdestinée au dépôt et à la diffusion de documentsscientifiques de niveau recherche, publiés ou non,émanant des établissements d’enseignement et derecherche français ou étrangers, des laboratoirespublics ou privés.
Do banking crises enhance efficiency ? A case study of1994 Turkish and 1997 Indonesian crises
Julien Reynaud, Rofikoh Rokhim
To cite this version:Julien Reynaud, Rofikoh Rokhim. Do banking crises enhance efficiency ? A case study of 1994 Turkishand 1997 Indonesian crises. 2005. �halshs-00193306�

Maison des Sciences Économiques, 106-112 boulevard de L'Hôpital, 75647 Paris Cedex 13http://mse.univ-paris1.fr/Publicat.htm
ISSN : 1624-0340
Do banking crises enhance efficiency ? A case study
of 1994 Turkish and 1997 Indonesian crises
Julien REYNAUD, TEAM
Rofikoh ROKHIM, TEAM
2005.07

Do banking crises enhance efficiency?
A case study of 1994 Turkish and 1997 Indonesian Crises1
Julien REYNAUD2 & Rofikoh ROKHIM
1 We are grateful to Thérèse Chevalier, Jezabel Couppey-Soubeyran, Rodolphe Desbordes, Jérôme Héricourt and Jean Pierre Laffargue for constructive comments. We also thank David Tripe for his helpful report at the EFMS Asia-Pacific Conference 2004. Participants at the GDR & CEFI, CEPII & CEPN, CERDI, EFMS, ISEG, TEAM conferences and seminars are gratefully acknowledged. All reminding errors are ours. 2 Corresponding author: TEAM – CNRS, Money-Bank-Finance Group, MSE, 106-112 Bd. de l’Hôpital, 75647 PARIS Cédex 13. E-mail: [email protected]
1

RESUME. Cet article a pour objectif de mettre en relation les concepts d’efficacité et de crise bancaire. Cette mise en parallèle trouve sa justification dans la théorie des cycles économiques selon laquelle une crise est le point de retournement à partir duquel l’économie retrouve une phase de croissance. Théoriquement, les crises bancaires sont censées éliminer les mauvaises banques et de fait permettre au système de fonctionner de manière plus efficace après la crise. Dès lors, si l’efficacité de l’industrie bancaire joue un rôle dans l’apparition de problèmes bancaires, la période d’après crise devrait s’accompagner d’une amélioration de l’efficacité des banques. Nous testons cette hypothèse sur les crises bancaires turque de 1994 et indonésienne de 1997 en utilisant la méthode des frontières stochastiques. Nous trouvons que l’efficacité ne s’améliore pas après la crise, au contraire les banques semblent plus inefficaces.
JEL Classification: G14, G21, G28, G34 Mots clés : crise bancaire, efficacité, Indonésie, Turquie.
ABSTRACT. Drawing together the concepts of inefficiency and banking crisis is directly inspired by business cycles theory where a crisis is the turning point from which the market/economy is recovering. If inefficiency plays a role in the occurrence of banking crisis, the post-crisis period should be the time for recovering efficiency. Moreover, traditional banking theory predicts that the crisis should eliminate bad banks from the system, leading to a more efficient banking sector. We tested this hypothesis on the 1994 Turkish and 1997 Indonesian banking crises using stochastic cost frontier analysis. Our results show an interesting pattern, opposed to what theory predicts: we find that inefficiency increase after the crises in both banking sectors.
Classification JEL : G14, G21, G28, G34 Key words: Banking crisis, Efficiency, Indonesia, Turkey.
2

1. Introduction
1990s financial crises led economists to rethink completely their approach
toward monetary and banking crises (see the survey by Cartapanis, 2002). The
International Monetary Funds (IMF, 1998) emphasized that between 1985 and
1995, more than 130 of its members experienced serious banking problems.
The 1980s financial markets liberalization in emerging countries is generally
blamed as a significant source of instability (Edwards and Mishkin, 1995;
Griffith-Jones, 1998; Scialom, 2004). Therefore, inefficiency may be
consequently one of the major causes of 1990s banking problems, and should
be a concern for policy makers (Resti, 1997). Indeed, inefficiency can be
regarded as socially beneficial as it reduces the cost of financial intermediation
for consumers (Matthews and Tripe, 2004). Thus greater amount, at better
price and quality, are intermediated from savers to producers, enhancing
investment and offering greater safety and returns for shareholders (Berger,
Hunter and Timme, 1993).
The purpose of this paper is therefore to asses whether a banking crisis can
improve banking sector’s efficiency? Our point comes from business cycles
theory, where a crisis is the turning point from which the market/economy is
recovering. In that spirit, if inefficiency plays a role in the occurrence of
banking problems, the post-crisis period should be the time of recovering, as
bad banks should have been taken over the market. Consequently, we also
investigate the idea that efficiency should increase during the period following
the crisis. To test this hypothesis, we look at the 1994 Turkish and 1997
Indonesian crises.
The remainder of the paper is organized as follows: Section II defines both
concepts of banking crisis and efficiency, and asses the interaction between the
two in the cases of Indonesia and Turkey. Section III presents the sample and
the econometric methodology. Section IV describes and analyzes the results.
Section V concludes and offers some policy recommendations.
3
2. The role of efficiency in banking crises
2.1. Banking crises
While each banking crisis has its own dynamics, most of the main components
remain identical. These common causes have been pointed out by Calomiris
and Gorton (1991), and for the special case of emerging economies by
Goldstein and Turner (1996). They listed the possible causes for banking crises
as follow: (i) Both external and domestic macroeconomic volatility, (ii) Lending
booms, asset price collapses and surges in capital inflows, (iii) Increasing bank
liabilities with large maturity/currency mismatches, (iv) Inadequate preparation
for financial liberalization, (v) Heavy government involvement and loose
controls on connected lending, (vi) Weaknesses in the accounting, disclosure
and legal framework, (vii) Distorted incentives for bank owners, managers,
bank depositors and supervisors, (viii) Exchange rate regimes. The last 20 years
exhibited one common feature: financial liberalization and more precisely the
difficulties faced by banks in a global banking market (Edwards and Mishkin,
1995; Griffith-Jones, 1998; Scialom, 2004).
Building on these elements, banking crises can be divided into two
categories: microeconomic and macroeconomic. Our study focuses on the
microeconomic level so the macro level will only be shortly presented, before
turning to our point.
The macroeconomic level refers to a bad operating environment. Banking
crises can arise from macroeconomic problems, the latter being external to the
banking system. Even well-run banking systems operating in a strong legal and
regulatory framework can be hit by an unstable macroeconomic environment.
The literature revealed a lot of macro problems that can be sources of banking
crisis: lending booms, possibly fuelled by excessive capital inflows or changes
in tax rules, real estate and/or equity price bubbles, business downturns,
growing excess capacity/falling profitability in real sector, rising fiscal and/or
4

current account deficits, weakened public debt sustainability, sharp changes in
exchange rates and real interest rates, etc.
The microeconomic level refers to bad banking. Banking crises are often
linked to weak bank operations: poor lending practices, excessive risk taking,
deficient governance, lack of internal controls, focus on market share rather
than profitability, and currency and maturity mismatches in the banks
themselves or among their borrowers. In some emerging countries, these
conditions may be worsened when bank ownership is very narrow. In these
circumstances, bad banking refers mostly to bad lending, connected lending,
insider operations, and outright fraud may go hand in hand with impunity.
Similarly, state banks may be run as quasi-fiscal agencies based on political
criteria with disregard for commercial principles, undermining their solvency
and the soundness of other better-run banks. Bad banking can only persist in
the absence of proper regulation and supervision, and of adequate market
discipline. Supervisors may also lack authority and the sufficient skilled staff.
Expectation of depositors and creditors bailouts is also a well-known source of
moral hazard problems that distort incentives, and thus efficiency.
Finally, the distinction between macro- and micro-founded banking crisis
can be sometime uneasy. Financial liberalization can be classified in both
categories as it influences banks managers and government behaviour and
interact between them. In other words, government liberalise banking markets
without adapting the legal framework (macro), inducing a distortion of banks’
owners and managers incentives (micro).
Banks efficiency should be a serious concern for policy makers. First
because the banking industry “has been obsessed with efficiency over the last
decade” (Klinkerman, 2003). Second because banking crises can be very costly
(table 1), depending mostly on the way public authorities manage it.
Conventional academic wisdom acknowledges that a banking authority with a
strong budget constraint will solve a banking crisis more quickly than a soft
5

budget constrained authority3. It has been theoretically shown that a soft
budget constraint induces no discrimination between ‘good-efficient’ and ‘bad-
inefficient’ banks when bailing out the sector. At the opposite, a strong budget
constraint induces that the authority to close the banks. Therefore, recovering
time will vary in this respect. An interesting and surprising result can be found
in the IMF 1998’s World Economic Outlook: emerging economies are more
likely to be affected by banking problems than industrialised ones, but the
average recovering delay is greater in industrialised countries (table 2).
-------------------------------------- Table 1: Budgetary cost of banking crises -------------------------------------- --------------------------------------
Table 2: Banking crises and average recovering delay --------------------------------------
2.2. Efficiency
Coelli, Rao and Battese (1998) summarise conceptual and measurement
problems induced by the concept of operating efficiency inspired by the work
of Farrell (1957) which defines it as cost minimising and profit maximising
production process. Economic efficiency arises from technical and allocative
efficiency. The former refers to an over-utilisation of some inputs and the
latter refers to a bad combination of inputs comparing to their relative prices.
Addressing this problem in emerging markets allows us to refer to the concept
of efficiency as typically in these economies, credit is overproduced and
personal, capital and funds are badly used to produce it for the reasons listed
before.
The way we asses efficiency is generally represented by some form of
parametric and non-parametric frontiers. Firms’ efficiency is then defined in
terms of their relative distance from the efficient frontier which becomes
therefore the benchmark for optimum performance. Many comprehensive
studies raised important problematic regarding banks operations. Banking
efficiency literature in the United States, European Countries and also Eastern 3 For a stylised model, see Huang and Xu (2000).
6

European Countries provided a substantial number of studies with different
methodologies. Some researches dealing with efficiency in US Banking found
that banks could cut their cost and improve their profit efficiency more by
reducing frontier inefficiencies rather than by reducing some optimal level of
scale and scope economies to minimize average cost and profit efficiency
(Berger and Humphrey, 1991 and 1997, Berger and Mester, 1997). Still working
on US banks, DeYoung and Nolle (1996) found that foreign banks are
relatively less efficient than domestic banks. Other studies, like Turati (2001),
noted that the higher the cost efficiency, the higher the level of profits a bank
will earn. He did not found, over 250 European commercial banks from 1992
to 1999, any striking difference in average efficiency among European
countries. Sheldon (1999) used unconsolidated data for 1,783 commercial and
savings banks in the EU, Norway, and Switzerland for the period 1993-1997
and finds that larger banks, specialized banks and retail banks are more cost
and profit efficient than small banks, diversified banks and wholesale banks,
respectively. Using Turkish banks, Jackson et al. (1998) found that competition
among banks is important for the banking performance and efficiency. Relying
on these results, some authors assumed that banks across different countries
access equally to the same banking technology. Others concluded that
efficiency results can not be compared across borders because each country
has specific features, such as regulatory powers, demography, and economic
conditions (Bos & Schimiedel, 2003).
All these studies raised concerns about important features of the
production process and economic problematic, but few have investigated the
implication of inefficiency on banking crises.
2.3. Banking crises in Indonesia and Turkey
Both Turkish and Indonesian States were strongly involved in the financial
sector management, until the end of the 70s for Turkey and the 80s for
Indonesia. Policymakers relied mainly on imports-substitution strategies. Such
policies aimed at ensuring countries self-sufficiency, by the means of
protection against international competition, including protection of the
7
banking industry. After the 80s oil crashes, the development strategies changed
for these countries, turning to promote exports and financial markets
liberalization.
The International Monetary Funds (IMF) stabilisation programs imposed
Turkish financial sector liberalisation. Following the financial crisis of the late
1970s, the program aimed at increasing the rate of saving and channelling
resources towards more efficient activities. This program was designed to
constrain banking sector to fund country’s development. Banks developed
their structures, bought many financial institutions, as well as investment
banks. In a similar way, Indonesian financial liberalization initiated on June
1983 led to the suppression of interest rate controls and credit ceilings for
banks, thus lifting legal lending limit. The purpose was to convert the financial
framework from a state dominated system into a market based one. However,
the insufficient regulatory frame was unable to control the destabilising effects
of markets opening. Indeed, these deregulations did not train long term capital
inflows (i.e. FDI) as shown in figure 1. In 2000, Turkey was ranked 52nd row
among the countries recipient of FDI. Indonesia was in an even worse
situation following the UNCTAD report, during 1999-2001, with the 138th
position. Banks were therefore forced to fund them elsewhere, improving
competition and risk behaviour (i.e. liquid/speculative funds).
--------------------------------------
Figure 1: Foreign direct investment, net inflows (% of GDP) --------------------------------------
The liberalization process led both countries to some structural weaknesses
listed below.
Insufficient capitalisation
Stockholders' equity remained low because law made it possible to open a bank
with little funds, from approximately US$ 30 millions for Turkey. In Indonesia,
the deregulation of October 1988, made possible to create a new bank with
even lower capital (only 10 milliard Rupiah, i.e. around US$ 4 millions).
Moreover, taxes and chronic hyperinflation in those countries did not
8

encourage banks-owners to increase their own capital stocks. Figure 2
highlights the weakness of owned capital stocks in both Turkish and
Indonesian systems.
--------------------------------------
Figure 2: Net Working Capital/Total Assets --------------------------------------
Degradation of credits quality
The credits quality decreased because of illegal appropriations, concentration
of risks and insufficient provisions. Figure 3 emphasises banking assets
weakness. The bad credits quality is even more obvious when considering the
ratio of unproductive loans. To offset their losses, banks artificially increased
the value of their underperforming assets (by making calculation with book-
and not market-values for example), in order to meet prudential ratios.
--------------------------------------
Figure 3: Permanent assets (PA)/Total assets and Non-performing loans (NPL)/Total loans --------------------------------------
A large exposure
Financial liberalization led banks in both countries to large exchange and
interest rates exposures (FX open positions, maturity mismatch) involving a
volatile and limited profitability. Undoubtedly, mismanagement is to be held as
responsible, as well as banking authorities. Maturity mismatch made the sector
more vulnerable to liquidity shocks, just like the FX open positions weakened
the sector vis-à-vis the external shocks. Figures 4 and 5 respectively show
liquidity levels and losses trained by FX open positions.
--------------------------------------
Figure 4: Liquid assets/Total assets (%) -------------------------------------- --------------------------------------
Figure 5: Interests expenses/Non-interests expenses (%) --------------------------------------
In terms of returns over equity (RoE) and over assets (RoA), Turkish banks
look less more profitable than foreign banks. In Indonesia, state-owned banks
were very unprofitable and even private- and foreign-owned banks seem to
9

have suffered during the second half of the 1990s. Table 3 shows all the details.
On the overall, state-owned banks are less profitable, which is not surprising.
--------------------------------------
Table 3: RoE/RoA ratios --------------------------------------
Small sizes and fragmented structures
After having passed from 43 banks in 1980 to 66 in 1990, the banking sector
counted 79 banks in 2000. On the 74 active banks in 2000 (5 were put under
supervision of the Funds of Guaranteed Saving and Deposits, TMSF), 56 are
deposit banks, the remaining 18 being banks of investment. Among the
deposit banks, 4 are stat-owned, 26 are Turkish banks, 18 are foreign-owned
and 8 are under supervision of the TMSF. For Indonesia, before 1990, banks
were dominated by the State and big private banks. Based on October
1988deregulation, private and foreign banks accessed the market easily. Table 4
shows the fragmentation of banking sector structure for both countries.
--------------------------------------
Table 4: Structure banking sectors 1990/2000 --------------------------------------
Inadequate supervision
Banking sectors are characterized by both an internal and external inadequate
supervision, due mainly to the lack of transparency. The Turkish banks used to
window-dress their balance sheets, either using accountancy tricks in
overestimating the value of the permanent credits compared to their market
prices, or quite simply by playing with the inflation and exchange rates.
In Indonesia, the lack of supervision trained a sharp increase of
underperforming credits. The economic crisis showed that banks were
vulnerable mainly because of high NPLs. Because of inadequate supervision,
only little banks declared their real NPL positions, especially because of the
lack of legal sanctions from monetary authorities.
On the overall, both banking sectors were dominated by the States. The
liberalizations have weakened banking industries, worsening bad banking
10

behaviours. Thus, coming to our hypothesis, we expect an increase of
inefficiency before and a decrease after the crisis.4
3. Methodology
There are five ways to asses efficiency; two non-parametric approaches: data
envelopment analysis (DEA) and free disposal hull (FDH); and three
parametric estimation methods: stochastic frontier analysis (SFA), free
distribution analysis (DFA) and thick frontier analysis (TFA).
We build a translogarythmic cost function to estimate a stochastic cost
frontier (SFA) for each of our panel using log-Likelihood estimation. The use
of a cost instead of a production function is due to the assumption that banks
in Indonesia and Turkey were strictly following profit maximization strategies,
which can not be robustly satisfied during the sample period. Moreover,
because of Governments’ soft budgets constraints, outputs levels could have
been exogenously driven. These assumptions lead us to reject a production
approach. A cost function was preferred under the assumptions of exogenous
output and input prices. The competitiveness of banking industry for both
countries suggests that banks competed for their input price and not only on
output side. Finally, a cost function allows us to consider more than a unique
output. We introduce the inputs/outputs choice in the next section.
Largely used in related literature, the translog cost function surpasses other
functions (like Cobb-Douglas, CES, Leontieff, etc.) thanks to its flexible form.
The use of the SFA method is mainly motivated by the fact that non-
parametric approaches do not consider noise in the estimation. The fact that
we are actually looking at emerging economies means a more unstable
economic environment and idiosyncratic shocks can not be omitted.
4 We did not account for pure ‘sun spots’ crisis. Both banking crises showed strong structural components and it has never been argued, to our best knowledge, that Indonesian and Turkish crises were due to ‘sun spots’. See Bhattacharya and Jacklin (1998) for a more formal distinction.
11

Moreover, it has been shown that SFA method is more robust for bigger
samples (Coelli, Rao and Battese, 1998).5
The benchmark equation can then be represented as follows (usual
restrictions apply):
3 2 3 3
01 1 1 1
1ln( ) ln( ) ln( ) ln( ) ln( )2it j itj k itk jl itj itl
j k j ltc w y w wα α β α
= = = =
= + + +∑ ∑ ∑∑
2 2 3 2
1 1 1 1
1 ln( ) ln( ) ln( ) ln( )2 km itk itm jk itj itk it
k m j ky y w yβ δ ε
= = = =
+ +∑∑ ∑∑ +
where, for the panel of banks at time t, ( ) are the price of inputs, ( )
the outputs, ( ) the total cost and
thi itjw itky
ittc 0α , jα , kβ , jlα , kmβ and jkδ the
parameters to be estimated. itε , the disturbance term of the model, is assumed
to have two components:
it it itvε µ= +
where, is the idiosyncratic error and itv itµ is a time-varying truncated-normal
random variable which reflects the distance of observations from the cost
frontier, i.e. the inefficiency term to be estimated. These terms are distributed
independently of each other and defined as follows:
iµ is iid on 2( , )N µµ σ+
and
iv is iid on 2(0, )vN σ
with
exp{ ( )}it i it Tµ η µ= − −
5 See Aigner et al (1977), Berger and Mester (1997), Guarda and Roubah (1999), Turati (2001), Bonin et al (2003) for extensive discussions about the SFA method.
12

where, η is the decay parameter with the last time period in the panel.
When
iT thi
η > 0, the degree of inefficiency is decreasing over time. When η < 0,
the degree of inefficiency is increasing over time. We use a time varying model
instead of a time invariant one to estimate the evolution of the inefficiency
over the period. We also computed time invariant models to enforce our
results and found same patterns.6
4. Data and model specification
The overall sample includes 200 banks: 143 banks from Indonesia and 57 from
Turkey. We divided the panel in two sub-panels: Panel A for the pre-crisis time
and Panel B for the post-crisis period. Then, we differentiate the banking
sector in three groups according to their state, private and foreign ownerships.
We also build another sub-panel discriminating between large and small banks,
taking respectively the highest and the smallest quartiles in term of bank’s
assets to total assets. For each sub-panels, two models are estimated: a Pre-
crisis model using Panel A and a Post-crisis model using Panel B. For
Indonesia, Pre-crisis period is 1991 to 1996 and Post-crisis period is from 1998
to 2001. For Turkey, the Pre-crisis begin in 1990 and finishes in 1993. The
Post-crisis period start in 1995 and ends in 1999. We decided not to take into
account the year of crisis because of too much macro- and micro-economics
instability (strong currencies depreciation, persistently high interest rate
volatility, etc), therefore Indonesia 1997, and Turkey 1994 are excluded from
the panel.
For Indonesia, the data come from PT Ecofin and from announcement of
annual financial statements which are published in Bisnis Indonesia Daily. For
Turkey, the data come from the Banks Association of Turkey Periodical
Reports: Banks in Turkey, 1997 (for the 1990-1996 periods) and Banks in Turkey,
2001 (for the 1997-1999 periods).
6 These results are available upon request to the authors.
13

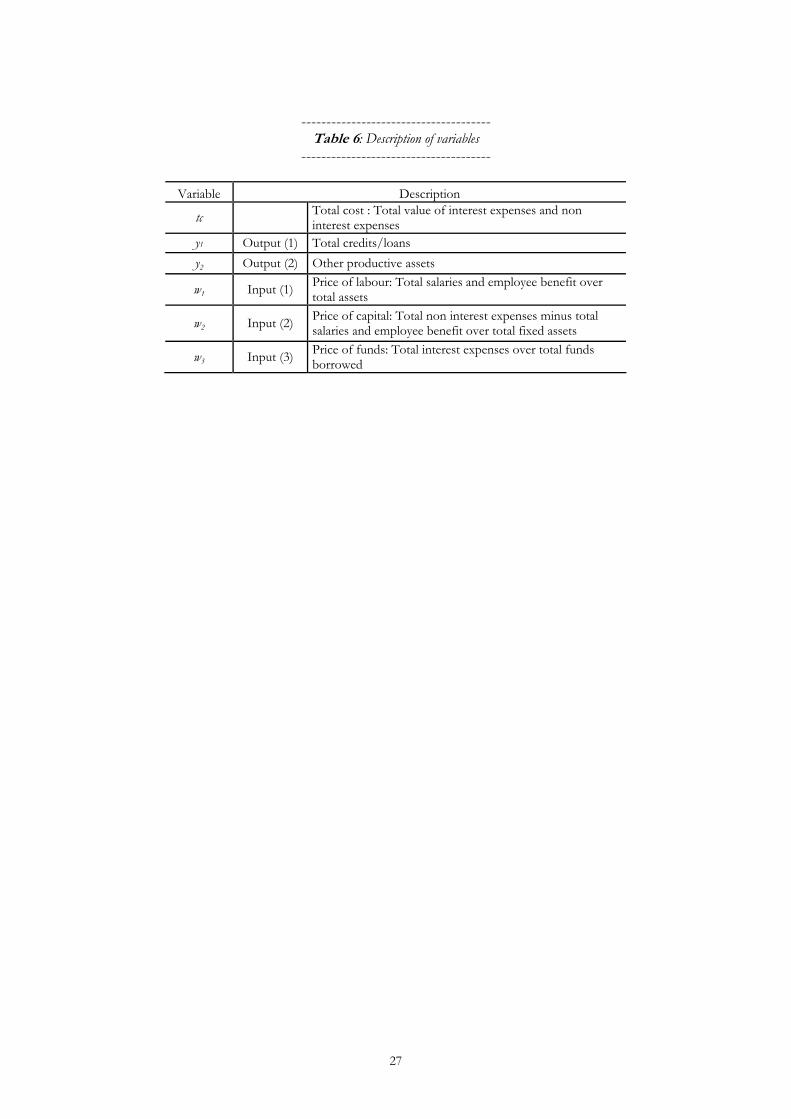
Table 5 introduces the variables used. Table 6 shows the repartition of
banks inside the different panels, showing that the Indonesian and the Turkish
banking sector are similarly built, strengthening the relevance of these
countries for our study.
-------------------------------------- Table 5: Distribution of sample banks by category
--------------------------------------
-------------------------------------- Table 6: Description of variables
--------------------------------------
The total cost ( is the sum of interest and non interest expenses. There are
two outputs : representing the total credits of the type of banks i,
and regrouping all the others productive assets (the essential part is made
of cash and securities). There are three input prices ( ) : is the price of
labour, measured by the ratio of total salaries and employee benefit expenses to
total assets (since the information with respect to the number of employees is
almost completely lacking for most Indonesian banks, we are not able to
compute the personnel expenses per employees, alternatively, the personnel
expenses as a fraction of total assets is used); is the price of physical
capital, measured by the ratio of total non interest expenses minus total salaries
and employee benefit expenses over total fixed assets; and finally, is the
price of borrowed funds, measured as the total interest expenses over total
fund borrowed, mainly made of deposits (demand and term) and trading
account securities.
)ittc
( )itky 1( )ity
2( ity )
)
)
)
itjw 1( itw
2( itw
3( itw
Debate about what constitutes the outputs and inputs in a banking firm is
still ongoing. In this paper, the intermediation approach is adopted. The bank
uses labour, physical capital and borrowed funds to produce earning assets (see
Sealey and Lindley, 1997). This is the most commonly used approach in the
bank cost function literature. It is also argued that deposits are an input to the
14

production of loans, or alternatively, that they are considered as an output
because they involved the creation of added value (Berger, Handcock and
Humprey, 1993). We decide to use them as an input referring to conventional
accountancy principles7 that put them on the liability side.
5. Results and interpretation
We focus our work on the variation of the estimated parameters before and
after the crisis. To support this choice, we run a Chow-type likelihood-ratio
test (results are reported in table 7) pooling together both samples before and
after the crisis and comparing them. Both results are positive and enforce thus
our estimations. This will help us to estimate the influence of a banking crisis
on banks’ efficiency. We presume that during a banking crisis, ‘bad banks’
should be eliminated, leading therefore to an increase in efficiency.
-------------------------------------- Table 7: LR-tests for both countries --------------------------------------
Tables 8 and 9 report the results of the estimated parameters. On the
overall, parameters are reasonably consistent with expectations. In most cases,
the specifications of the factors (inputs and outputs) turned to be statistically
significant for all groups (state, private and foreign banks) and panels (before
and after the banking crisis).8
Our interpretations focus on table 8 that shows the itµ for all
specifications. On the whole, the expected positive effects of crises on each
country’s global banking sector are unexpected. For all sub-samples, i.e. for all
type of ownership, and for both countries, the inefficiency is not decreasing
after the crisis, and more surprisingly, it seems to increase in most of the cases.
7 Our data come from Balance Sheets so accountancy principles have to be applied. 8 Factor tables are not reported because our study focuses on the inefficiency term. All the results can be sent on request to the authors.
15

Looking at the models, small samples and in particular the sub-samples B
(i.e. before the crises) fit poorly and did not allow us to compare before and
after the crisis results. However, results for the sector and for private (both
domestic and foreign owned) banks allows the comparison. Thus we are able
to distinguish from the sub-sample B if the sectors’ inefficiency is driven by
private-domestic-foreign or state-owned banks. Not surprisingly, overall
inefficiency is driven by state-owned banks.9 For both countries, private-
domestic banks are more inefficient than private-foreign owned banks. This
result in also in contradiction with the literature that call for a Foreign-Owned-
Bank Barriers Hypothesis that did not seems to apply to both countries (see
Berger, De Young, Genay and Udell, 2000, for a review of this hypothesis).
This can be explained by the fact that this hypothesis applies for developing
countries. The focus on emerging economies can explain our results, meaning
that foreign banks are well run and beneficiate from know-how and from high
skilled and experienced personnel, leading thus to more efficient work.
-------------------------------------- Table 8: Inefficiency scores for samples A & B
--------------------------------------
Lastly, looking at the size effect, table 9 shows an interesting pattern. If
large banks seem to be more inefficient on the overall (inefficiency scores are
higher for large banks in both countries), the crisis affects countries differently.
Turkish large banks’ inefficiency decreases after the crisis and small banks’
inefficiency increases after the crisis. In other words, it means that even if large
banks are less efficient, small ones are not better of after the crisis. For
Indonesia, results are reversed. Inefficiency is slightly increasing for large banks
after the crisis, and strongly decreasing for small banks. This can be explained
by the fact that policy responses by Indonesian and Turkish authorities were
different and this may have impact banks differently.
9 Note that for sub-sample B of state-owned Indonesia banks, the estimation reveals a negative µ, meaning that the model does not fit for this sub-sample. On the overall, the model fits better Turkish banking industry. This may be imputable to the recapitalisation and restructuring process, and thus can lead to misinterpretation of the function
16

-------------------------------------- Table 9: Inefficiency scores for size samples
--------------------------------------
6. Summary and policy recommendations
This study investigates the cost structure of Indonesian and Turkish banking
industries using a translog cost function to build a stochastic frontier before
and after the respective banking crises.
Concerning Turkey, our results are consistent with the findings of Yeldan
(2001), the Banks Association of Turkey (2000) and the Turkish Banking
Regulation: efficiency did not rise after the crisis. Moreover, inefficiency seems
to have increase after the crisis. Two major reasons can be suggested: (i) the
restructuring program seems to have not been properly managed, and (ii) the
macro-economic environment did not fully recover after the crisis. Finally, our
findings can be easily linked to the more recent 2000/2001 banking collapse.
The Indonesian banking sector is also less efficient in the post-crisis period,
which is also consistent with Levin (1996) and McFadden (1994)
Our major insight is that inefficiency did not decrease significantly after the
crisis; conversely, it increases after the crisis. To support this conclusion, the
International Monetary Funds has published, in 1998’s World Economic
Outlook, a survey showing that Emerging Markets need on average 2.8 years
to recover – in terms of output growth – from a banking crisis. For Turkey, the
post-crisis period asked 6 years. For Indonesia, the period after the crisis takes
only 4 years. This leads us to recommend prudence for Indonesia’s banking
sector. If it has not dealt with its inefficiency problems, the sector can be
vulnerable to another banking crisis.
17
References
Aigner, D.J., C.A.K. Lovell and P. Schmidt, 1977. Formulation and estimation
if stochastic frontier production function models, Journal of Econometrics.
Banks Association of Turkey, 2000. The Turkish Banking System 1958-97,
Banks Association of Turkey.
Banking Regulation and Supervision Agency, 2001. Toward a Sound Turkish
Banking Sector, Banking Regulation and Supervision Agency.
Bhattacharya, S. and C. Jacklin, 1988. Distinguish Panics and Information-
based Bank Runs: Welfare and Policy Implications, Journal of Political
Economy 96.
Berger, A. N. and D.B. Humphrey, 1991. The dominance of inefficiencies over
scale and product mix economies in banking, Journal of Monetary Economics
29.
Berger, A.N., D. Hancock and D.B. Humprey, 1993. Bank efficiency derived
from the profit function, Journal of Banking and Finance 17.
Berger, A.N., W.C. Hunter and S.G. Timme, 1993. The efficiency of financial
institutions: A review of research past, present, and future, Journal of Banking
and Finance 18.
Berger, A.N. and L.J. Mester, 1997. Inside the Black Box: What explains
differences in the efficiencies of financial institutions, Journal of Banking and
Finance 21.
Berger, A. N.; W. C. Hunter and S. G. Timme, 1993. The efficiency of financial
institutions: a review and preview of research past, present and future. Journal
of Banking and Finance 17.
18

Berger, A.N., D.B. Humphrey, 1997. Efficiency of Financial institutions:
International survey and directions for the future research, European Journal
of Operation Research 98.
Berger, A.N. and R. de Young, 1997. Problem loans and cost efficiency in
commercial banks, Journal of Banking and Finance 21.
Berger, A.N., Robert de Young, and G.F. Udell. 2000. Globalization of
financial institutions: Evidence from cross-border banking performance,
Brooking-Wharton Papers on Financial Services 3.
Bonin, J.P., I. Hasan ann P. Wachel, 2003. Bank performance, efficiency and
ownership in transition countries, Working Papers on Banking and the
Financial Sector in Transition and Emerging Market economies.
Bos, J.W.B. and H. Schmiedel, 2003. Comparing efficiency in European
Banking: a Meta Frontier Approach, Research Supervision 57.
Cartapanis, A., 2002. Le déclenchement des crises de changes : qu’avons-nous
appris depuis dix ans ?, Economie Internationale, La Revue du CEPII.
Coelli, T., Rao, D.S. P., Battese, G.E., 1998. An introduction to efficiency and
productivity analysis, Boston, Kluwer Academic Publishers.
De Young, R and D.E. Nolle, 1996. Foreign-Owned Banks in the US: Earning
Market Share or Buying itt?, Journal of Money, Credit and Banking 28 (3).
Edwards, F. and F. Mishkin, 1995. The Decline of Traditional Banking:
Implications for Financial Stability and Regulatory Policy, Federal Reserve
Bank of New York, Economic Policy Review.
19

Farrell, M. J., 1957. The Measurement of Productive Efficiency, Journal of the Royal Statistical Society, Series A 120.
Griffith-Jones, S., 1998. Stabilizing Capital Flows to Developing Countries,
Conference on the East Asia crisis, Institue of Development Studies, Brighton.
Guarda, P. and A. Rouabah, 1999. Efficacité et performance des banques en
Europe: une analyse stochastique frontière sur des données en panel, Working
Paper99-5, Cellule Recherche en Economie Appliquée CRP-Gabriel Lipplan
Luxembourg.
Hasan,I. and K. Marton, 2000. Development and efficiency of the banking
sector in a transitional economy: Hungarian experience, Working Paper,
Institute for Economies in Transition, Bank of Finland.
Huang, H. and C. Xu, 2000. Financial Institutions, Financial Contagion and
Financial Crises, IMF, Working Paper 00/92.
International Monetray Funds, World Economic Outlook, May 1998.
Jackson, P.M., Meryem Duygun Fethi and G. Inal. 1998. Efficiency and
productivity growth in Turkish commercial banking sector: A non-parametric
approach, Working Paper, Management Centre, University of Leicester.
Levine, R., 1996. Foreign banks, financial development, and economic growth,
in Claude E. Barfied, ed., International Financial Markets, Washington D.C.,
AEI Press.
Lindley, J. and C.W. Sealey, 1977. Inputs, outputs and theory of production
and cost as depository financial institutions, Journal of Finance, Vol. 2, No: 4.
Mc Fadden, C., 1994. Foreign banks in Australia, The World Bank, Mimeo.
20

Matthews, C. D. and D. W. L. Tripe, 2002. Problems in Promoting Efficient
Banking Services in a Developing Country – the Case of Papua New Guinea.
Paper presented at 2nd International Conference of Banking and Finance at
Crete, Greece (9-11 August2002), mimeo.
Pastor, J.M., F. Pérez and J. Quesada, 1997. Efficiency analysis in Banking
Firms: An international comparison, European Journal of Operational
Research, 98.
Resti, A., 1997. Evaluating the cost-efficiency of the Italian banking system:
what can be learned from the joint application of parametric and non-
parametric techniques. Journal of Banking and Finance. 21.
Scialom, L., 2004. Economie bancaire, Editions Repères.
Sheldon, G., 1999. Costs, Competitiveness and the changing structure of
European banking, Fondation Banque de France pour la Recherche, Working
Paper.
Turati, G., 2001. Cost efficiency and profitability in European commercial
banking, Instituto di Economia e Finanza, Università Cattolica del S. Cuore,
Working Paper.
Yeldan, E., 2001. On the IMF-Directed Disinflation Program in Turkey: A
Program For Stabilization and Austerity Or A Recipe For Impoverishment and
Financial Chaos?, University of Bilkent, Tureky, mimeo.
21

APPENDIX
--------------------------------------
Table 1: Budgetary cost of banking crises --------------------------------------
Source: IMF, Worl Outlook, May 1998
Country Year Budgetary cost and quasi-budgetary cost (% of GDP)
Argentine 1980/82, 1985 13-55, ... Brasil 1994/96 4-10 Chili 1981/85 19-41 Colombia 1982/87 5-6 Spain 1977/85 15-17 United States 1984/91 5-7 Finlande 1991/93 8-10 Indonesia 1994 2 Japan 1990s 3 Malaisia 1985/88 5 Mexico 1994/95 12-15 Norway 1988/92 4 Philippines 1981/87 3-4 Sri Lanka 1989/93 9 Sweden 1991/93 4-5 Thaïlande 1983/87 1 Turkey 1982/85 3 Uruguay 1981/84 31 Venezuela 1980/83, 1994/95 ..., 17
22
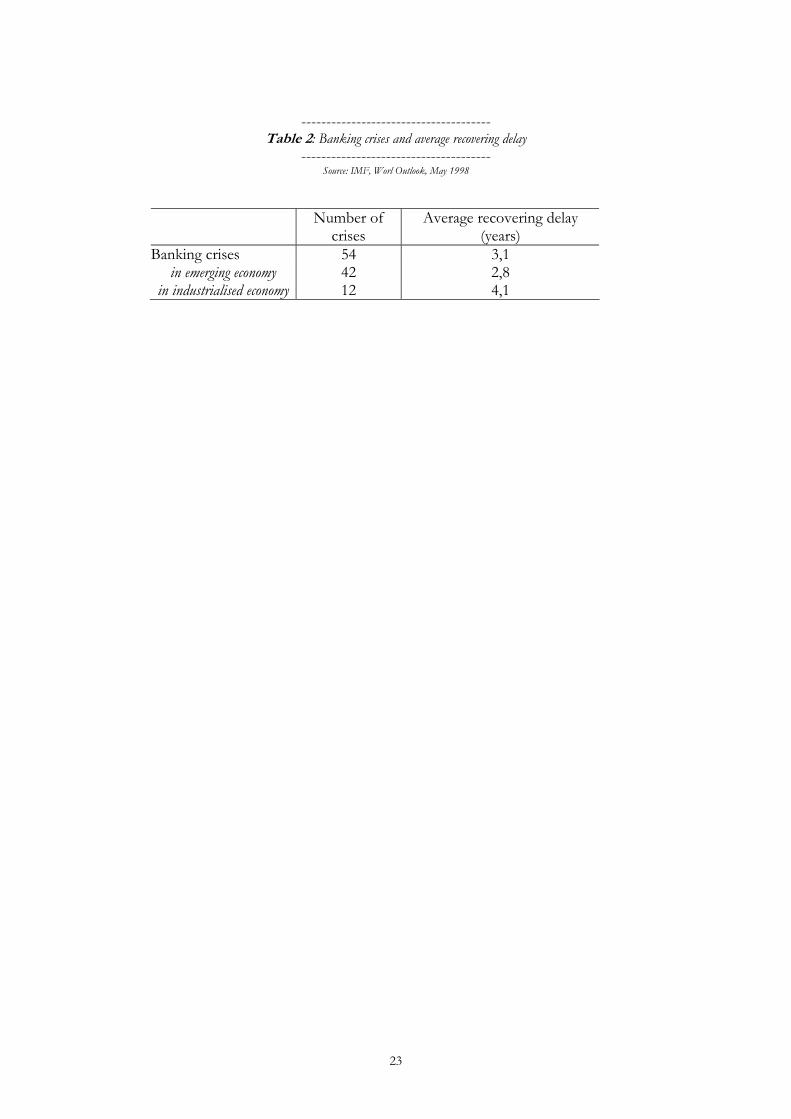
-------------------------------------- Table 2: Banking crises and average recovering delay
-------------------------------------- Source: IMF, Worl Outlook, May 1998
Number of
crises Average recovering delay
(years) Banking crises 54 3,1
in emerging economy 42 2,8 in industrialised economy 12 4,1
23

-------------------------------------- Table 3: RoE and RoA ratios (%) --------------------------------------
Source : TBB (Turkey) and Ecofin and Indonesian Banking Directory (Indonesia)
State-owned Private-owned Foreign-owned 1991-1995 1996-2000 1991-1995 1996-2000 1991-1995 1996-2000 RoE Turkey 0,96 0,54 3,24 3,74 6,03 4,92 Indonesia -1,3 -0,52 3,06 -0,68 2,35 -0,61 RoA Turkey 19,82 13,50 43,19 48,45 78,62 68,67 Indonesia -20,73 3,47 11,99 -12,41 19,01 89,65
24
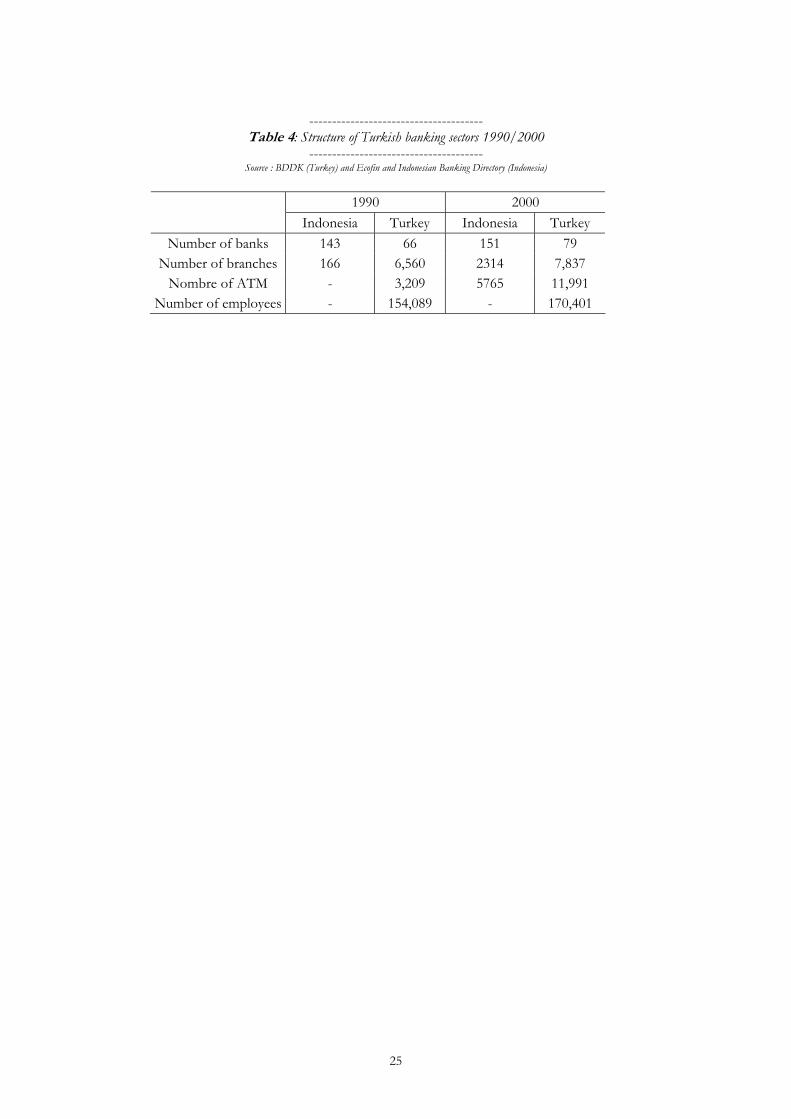
-------------------------------------- Table 4: Structure of Turkish banking sectors 1990/2000
-------------------------------------- Source : BDDK (Turkey) and Ecofin and Indonesian Banking Directory (Indonesia)
1990 2000 Indonesia Turkey Indonesia Turkey
Number of banks 143 66 151 79 Number of branches 166 6,560 2314 7,837
Nombre of ATM - 3,209 5765 11,991 Number of employees - 154,089 - 170,401
25

-------------------------------------- Table 5: Distribution of sample banks by category
-------------------------------------- Source: TBB (Turkey) and Ecofin and Indonesian Banking Directory (Indonesia)
Code Category Indonesia Turkey
1 Public banks 31 12 % 21.7 21.1 2 Private banks 78 30 % 54.5 52.6 3 Foreign banks 34 15 % 23.8 26.3 T Total sample 143 57 % 100 100
26
-------------------------------------- Table 6: Description of variables
--------------------------------------
Variable Description
tc Total cost : Total value of interest expenses and non interest expenses
y1 Output (1) Total credits/loans y2 Output (2) Other productive assets
w1 Input (1) Price of labour: Total salaries and employee benefit over total assets
w2 Input (2) Price of capital: Total non interest expenses minus total salaries and employee benefit over total fixed assets
w3 Input (3) Price of funds: Total interest expenses over total funds borrowed
27

-------------------------------------- Table 7: LR-tests for both countries --------------------------------------
Indonesia Turkey
LR chi2(20) test 58.75 255.58 Prob. > chi2 0.000 0.000
28

-------------------------------------- Table 8: Inefficiency scores for all samples
--------------------------------------
Sector Privatly-owned Privatly-owned Privatly-owned State-owned
Domestic Foreign Indonesia
(time variant model) Before After Before After Before After Before After Before After
mu 0.94 0.69 7.57 7.64 1.43 6.77 0.20 2.11 -0.18 9.22
(1.265) (1.574) (1.405)*** (1.960)*** (1.537) (4.295)** (0.778) (0.875)*** (51.344) (5.242)** lnsigma2 2.80 2.73 2.79 2.75 0.09 0.22 -11.79 -1.10 0.18 -0.15
(0.113)*** (0.070)*** (0.049)*** (0.059)*** (0.081) (0.160) (1812.988) (0.749)* (4.025) (0.166) Observations 919 438 848 570 594 158 234 66 234 61
Number of groups 3 3 2 2 1 1 1 1 1 1
Sector Privatly-owned Privatly-owned Privatly-owned State-owned
Domestic Foreign Turkey
(time variant model) Before After Before After Before After Before Before Before After
mu 1.87 1.98 0.81 0.83 0.06 2.93 0.41 1.61 9.16 11.95
(0.563)*** (0.459)*** (0.333)*** (0.321)*** (0.064) (0.585)*** (0.563) (0.744)** (3.054)**** (2.865)***lnsigma2 -1.91 -2.03 -2.06 -2.10 -2.92 -2.45 -3.36 -2.58 -2.19 -2.02
(0.154)*** (0.157)*** (0.190)*** (0.073)*** (0.163)**** (0.118)*** (0.198)**** (0.171)*** (0.145)**** (0.139)***Observations 144 271 343 373 75 143 51 68 95 103
Number of groups 3 3 2 2 1 1 1 1 1 1
29

-------------------------------------- Table 9: Inefficiency scores for size samples
--------------------------------------
25% largest 25% smallest Indonesia (time invariant model) Before After Before After
mu 5.08 5.09 3.70 2.96 (1.890)*** (1.836)*** (2.272)* (1.919)
lnsigma2 2.69 2.68 2.76 2.78 (0.122)*** (0.122)*** (0.072) *** (0.089)***
Observations 336 340 418 413 Number of groups 1 1 1 1
25% largest 25% smallest Turkey
(time invariant model) Before After Before After mu 0.68 0.66 0.27 0.29
(0.182)*** (0.189)*** (0.172) (0.169)* lnsigma2 -2.03 -1.95 -2.00 -1.96
(0.347)*** (0.366)*** (0.141)*** (0.152)*** Observations 157 161 142 146
Number of groups 1 1 1 1
30

-------------------------------------- Figure 1: Foreign direct investment, net inflows (% of GDP)
-------------------------------------- Source: World Bank
-4
-3
-2
-1
0
1
2
3
419
70
1972
1974
1976
1978
1980
1982
1984
1986
1988
1990
1992
1994
1996
1998
2000
0
0,1
0,2
0,3
0,4
0,5
0,6
0,7IND(l) TUR(r)
31

-------------------------------------- Figure 2: Net Working Capital/Total Assets(%)
-------------------------------------- Source: TBB (Turkey) and Ecofin and Indonesian Banking Directory (Indonesia)
-2
-1
0
1
2
3
419
90
1991
1992
1993
1994
1995
1996
1997
1998
1999
2000
2001
0,0
0,0
0,0
0,1
0,1
0,1
0,1
0,1
0,2
0,2
0,2TUR (l) IND (r)
32
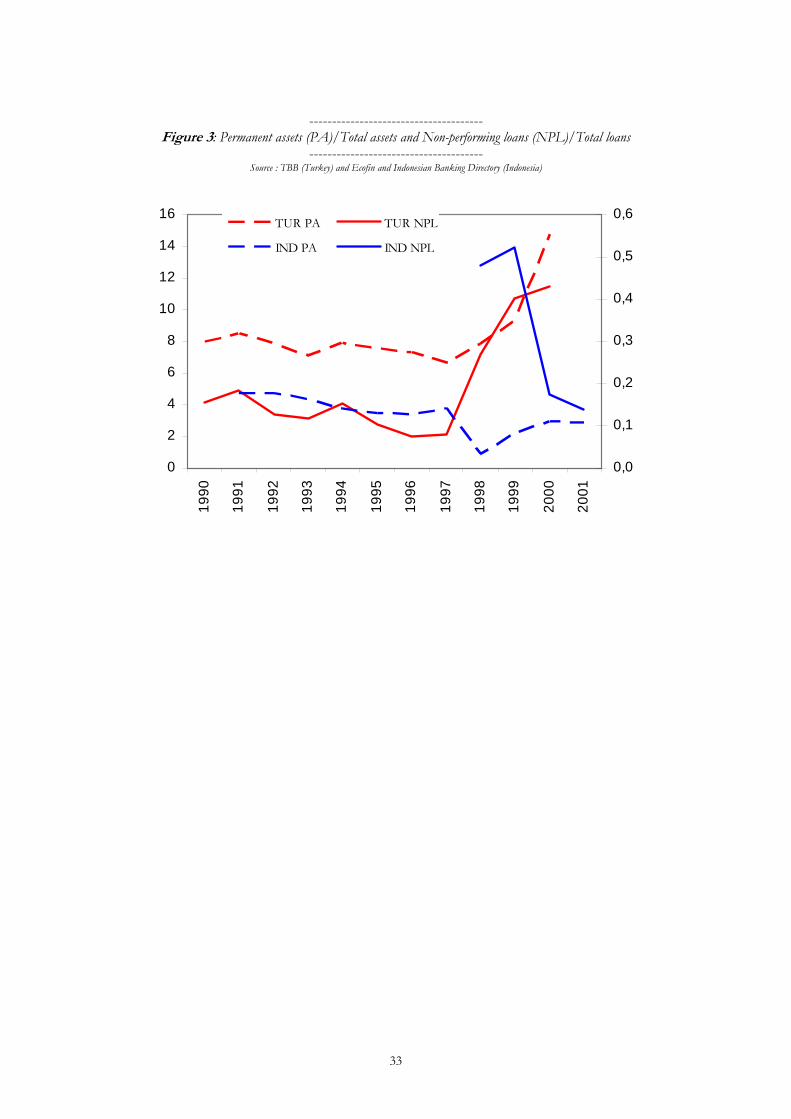
-------------------------------------- Figure 3: Permanent assets (PA)/Total assets and Non-performing loans (NPL)/Total loans
-------------------------------------- Source : TBB (Turkey) and Ecofin and Indonesian Banking Directory (Indonesia)
0
2
4
6
8
10
12
14
1619
90
1991
1992
1993
1994
1995
1996
1997
1998
1999
2000
2001
0,0
0,1
0,2
0,3
0,4
0,5
0,6TUR PA TUR NPL
IND PA IND NPL
33
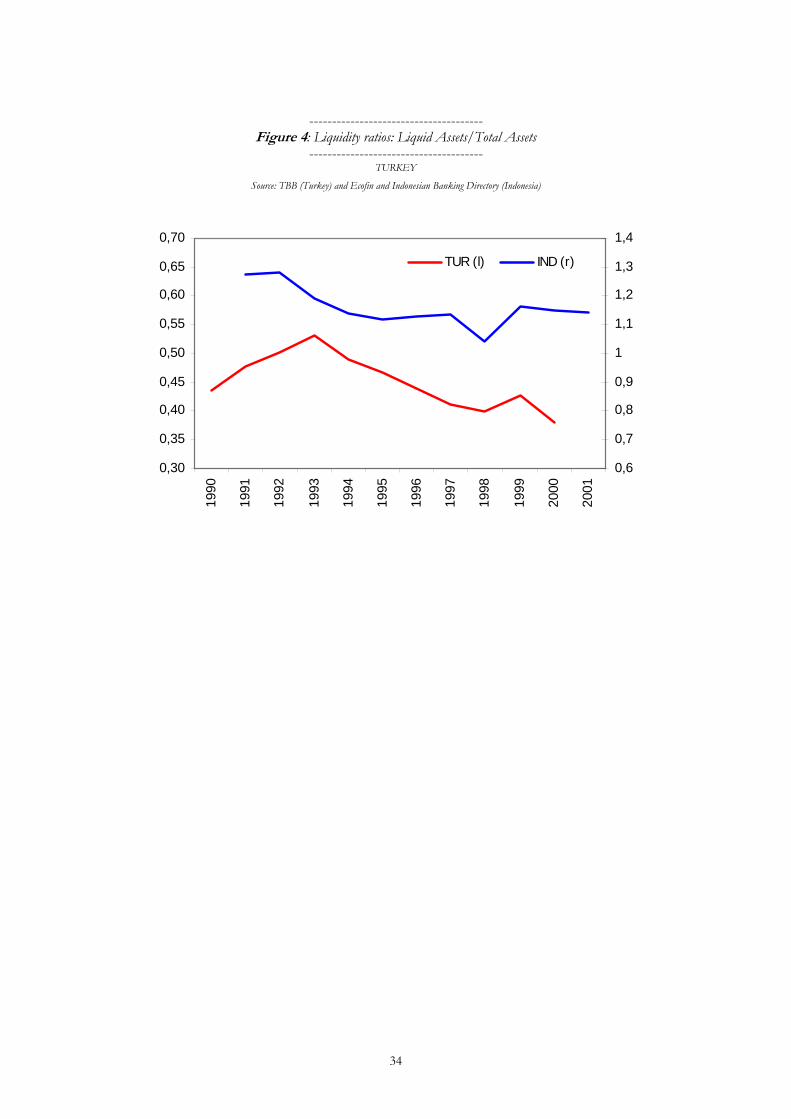
-------------------------------------- Figure 4: Liquidity ratios: Liquid Assets/Total Assets
-------------------------------------- TURKEY
Source: TBB (Turkey) and Ecofin and Indonesian Banking Directory (Indonesia)
0,30
0,35
0,40
0,45
0,50
0,55
0,60
0,65
0,70
1990
1991
1992
1993
1994
1995
1996
1997
1998
1999
2000
2001
0,6
0,7
0,8
0,9
1
1,1
1,2
1,3
1,4
TUR (l) IND (r)
34

-------------------------------------- Figure 5: Profitability ratios: Non-Interest Income/Non-Interest Expenses
-------------------------------------- Source: TBB (Turkey) and Ecofin and Indonesian Banking Directory (Indonesia)
-0,2
0
0,2
0,4
0,6
0,8
119
90
1991
1992
1993
1994
1995
1996
1997
1998
1999
2000
2001
IND TUR
35