Embed Size (px)
Citation preview

Do Ads Influence Editors?
Advertising and Bias in the Financial Media†
Jonathan Reuter and Eric Zitzewitz‡
First Draft: October 2003Current Draft: October 2004
†The authors would like to thank Susan Athey, George Baker, Brad Barber, David Beim, Jeremy Bulow, JohnChalmers, Diane Del Guercio, Ray Fisman, Kenneth Fuller, Ronald Gilson, Shane Greenstein, Ro Gutierrez, LarryHarris, Chris Mayer, Cynthia Montgomery, Wayne Mikkelson, Theodore Miller, David Musto, Megan Partch, AvriRavid, John Rea, Nancy Rose, Greg Spears, Joel Waldfogel, David Yoffie, Steve Zeldes, and seminar participantsat Columbia GSB, Harvard Business School, the 2nd annual International Industrial Organization Conference, theSEC, Stanford, UC-Berkeley, University of Oregon, the 2004 Wharton Conference on Household Financial Decision-Making and Portfolio Choice, and the 2004 NBER Industrial Organization Summer Institute for helpful suggestionsand comments. Caroline Baylon provided excellent research assistance. All remaining errors are our own.
‡Reuter: Assistant Professor of Finance, Lundquist College of Business, 1208 University of Oregon, Eugene,Oregon 97403-1208. Office: 541-346-3140. Email: [email protected]. Zitzewitz: Assistant Professor of Economics,Stanford Graduate School of Business, 518 Memorial Way, Stanford, California 94305. Office: 650-724-1860. Email:[email protected].

Abstract
We use mutual fund recommendations to test whether editorial content is independent from advertis-ers’ influence in the financial media. We find that major personal finance magazines (Money, Kiplinger’sPersonal Finance, and SmartMoney) are more likely to recommend funds from families that have advertisedwithin their pages in the past, controlling for fund characteristics like expenses, past returns and the overalllevels of advertising. We find little evidence of a similar relationship for mentions in the New York Timesor Wall Street Journal. Positive media mentions in both newspapers and magazines are associated withsignificant future inflows into the fund while advertising expenditures are not. Therefore, if we interpret ourcoefficients causally, a large share of the benefit of advertising in our sample of personal finance magazinescomes via the apparent content bias. The welfare implications of this apparent bias are unclear, however,since our tests suggest that bias does not directly lead publications to recommend funds with significantlylower future returns than they might have recommended in the absence of any bias. In selecting funds to rec-ommend, magazines overweight past returns relative to expenses, and as a group their recommendations donot outperform even an equal-weighted average of their peers. Nevertheless, this approach leaves magazineswith large numbers of funds with high past returns from which to select, and so bias towards advertisers canbe accommodated without significantly reducing readers’ future returns. Interestingly, the recommendationsof Consumer Reports, which does not accept advertising, have future returns comparable to or below thoseof the publications which accept do advertising.

1 Introduction
Experts face a problem getting paid for their opinions. Consumers are uncertain of the quality of the
opinion before it is revealed, and they have the option of opportunistically underpaying after it is revealed.
Two common solutions to this problem are the advertising model, in which experts bundle content with
advertising, and the subscription model, in which experts charge for access and subscription fees are based
on reputation. In this paper, we study a third model which we call the bias model: the expert bundles
information with bias and payment comes in the form of influence over consumers’ actions. The expert can
either bias information to match her own tastes or business interests, or she can sell the bias to another
party. In situations where direct payments for bias are unseemly, one might expect the bundling of bias with
other services, such as advertising.
A problem with the bias model is that if consumers perceive the bias, it reduces the credibility of
the information provided. An expert might therefore publicly commit to avoid bias. For example, the
mainstream media often claims to be “fair and balanced” with respect to political bias, and they likewise
seek to avoid a pro-advertiser bias through an ethical sanction. The idea that editorial content should be
independent of advertisers’ influence is prominent in journalistic codes of ethics. and is commonly referred
to as “the Separation of Church and State.”
Of course, consumers may remain skeptical that the temptation to introduce bias is completely avoided.
There has been considerable recent debate about and research interest in political bias in the media. Likewise,
there are occassional questions about the existence of advertising-related bias. For example, in 1996, Fortune
published an article accusing Forbes of “turning downbeat stories into upbeat stories in order to keep
advertisers happy — even at the risk of misleading their own readers.”1 Later that year, an article in
Kiplinger’s Personal Finance printed statements from editors at a number of personal finance publications
(including the three in our study: Money, Kiplinger’s, and SmartMoney) claiming that advertisers have no
influence over published content.2 However, we are aware of no systematic attempt to test the accuracy of
these claims.
1As quoted in Goldberg, Steven, “Do the ads tempt the editors? (influence of mutual fund advertising on personal financemagazine editors),” Kiplinger’s Personal Finance, May 1996.
2Ibid.
1

We test for advertising bias within the financial media by testing for a relation between past advertising
by mutual fund families and publications’ future recommendations of their mutual funds. We chose this
setting because product reviews are a form of content that advertisers might expect to especially benefit
from biasing. Moreover, mutual funds are numerous and have observable, objective characteristics that help
determine their attractiveness.
Despite the relative objectivity with which mutual funds’ ex-ante and ex-post quality can be observed,
however, investment recommendations are not purely mechanical. Rather, these recommendations require
judgments on the part of journalists, potentially opening the door to bias. Specifically, when predicting future
mutual fund returns there is some subjectivity involved in assessing the relative importance of characteristics
such as a low expense ratio, high past returns, an optimal fund size, a good past record for the manager,
or membership in an attractive asset class. Academic studies like Carhart [1997] tend to emphasize the
first characteristic (a low expense ratio), while financial journalism often puts more weight on the others.
Deemphasizing fund expense ratios might be viewed as a form of pro-industry bias, but we do not interpret
it as such. What we do interpret as possible evidence of bias is when, controlling for these and other factors,
a publication is more likely to recommend funds from the mutual fund families that have advertised the
most within its pages.
We study mutual fund recommendations published between January 1996 and December 2002 in five
of the top six recipients of mutual fund advertising dollars. We document a positive correlation between
a fund family’s advertising expenditures over the prior 12 months and its funds’ likelihood of receiving
a positive mention for all three personal finance magazines in our sample (Money Magazine, Kiplinger’s
Personal Finance, and SmartMoney) but for neither national newspaper (the New York Times and Wall
Street Journal). These correlations persist even after controlling for a fund’s objective characteristics and
its family’s general level of advertising. While there are alternative explanations for this correlation that
we discuss in detail below, we argue that the most plausible explanation is the causal one. Namely, that
personal finance magazines bias their recommendations — either consciously or subconsciously — to favor
advertisers.
Positive mentions in these publications are valuable to mutual fund families whose funds are mentioned,
2

since they appear to have a significant influence on investor decision making. Controling for past media
mentions and a variety of fund characteristics, a single additional positive media mention for a fund is
associated with inflows ranging from 6 to 15 percent of its assets over the following 12 months. While
investors appear to respond to the media mentions, we find that the media mentions have little ability to
predict future returns. However, this lack of positive abnormal future returns is not due to the apparent pro-
advertiser bias in recommendations. When we attempt to predict which funds would have been mentioned
in the absence of bias, we find little difference in future returns (and expense ratios) between these funds and
the ones actually mentioned. Consequently, the welfare implications of any advertising bias are unclear. In
selecting funds to recommend, publications overweight past returns relative to expenses. This approach leaves
them with large numbers of funds with high past returns from which to select, allowing publications to favor
advertiser funds without significantly reducing readers’ future returns. Interestingly, the recommendations
of Consumer Reports, which does not accept advertising, have future returns comparable to or below those
of the publications which do accept advertising.
2 Literature Review
Studies of the influence of expert opinion on product demand often implicitly assume that expert opinion
is unbiased (see, for example, Reinstein and Synder [2004] and Del Guercio and Tkac [2003]). In contrast,
we are interested in better understanding the influence of advertising relations on expert opinion. Our tests
of whether advertising expenditures by mutual fund families bias the recommendations that mutual fund
investors receive from the financial media belong to a number of related and growing literatures.
Much of the theoretical work on media bias focuses on ideological bias. For example, Baron [2003]
develops a model in which interest groups compete to influence public sentiment (and thereby regulation
and consumer demand) by advocating their positions through the news media. In addition to biases that
arise through the strategic disclosure of information to the media, Baron allows the media to be biased by
its concern for aggregate public welfare, or the ideological views of its journalists and owners. Alternatively,
Mullainathan and Shleifer [2003] develop a model in which the media exhibits two biases: the first based on a
publication’s ideological orientation and the second based on a publication’s desire to craft memorable stories.
3

While competition between publications with different ideologies allows readers to undo the ideological bias,
competition can increase the amount of bias associated with “spin.” In a recent empirical study, Groseclose
and Milyo [2003] find that most major US media outlets cite policy studies from thinktanks of the same
ideological mix as those cited by left-of-center members of Congress and interpret this finding as evidence of
a liberal media bias.
With respect to other potential sources of media bias, Dyck and Zingales [2003] document a positive
correlation between the way earnings announcements are reported in a press release and the way they
are reported by the financial media. They argue that the cross-sectional and time-series patterns in their
correlation are consistent with a quid pro quo bias, whereby reporters bias articles in exchange for access
to private information from their sources. Turning to potential advertising biases, Miller [2003] examines
a sample of firms that the SEC found guilty of accounting fraud and asks whether the media is less likely
to break stories about firms in industries with a high propensity to advertise. He finds that the media is
no less likely to break stories about accounting fraud in the 15 industries that Advertising Age classifies as
doing the most advertising, although sample size and the lack of firm-level advertising statistics may limit
the statistical power of this test. In the study most similar to our own, Reuter [2004] studies the influences
of advertising on product reviews and finds limited evidence that wine ratings favor advertisers.3
In addition, our study relates to studies of media content more generally. For example, George and
Waldfogel [2003] present evidence that newspaper content responds to the demographic mix of consumers
within their market. Similarly, Hamilton and Zeckhauser [2004, p. 5] find that media coverage of CEOs is
increasing in the number of common shares outstanding and conclude that this reflects “the desire of reporters
to write about firms with a wide audience of investors.” These papers imply that tests for advertising bias
need to mindful of the possibility that both advertising and content are responding to underlying subscriber
demands (i.e., advertising is endogenous).
For mutual fund families to benefit from biased recommendations, at least some set of investors must
rely upon them. Therefore, after testing for bias, we attempt to quantify the impact that media mentions
3In addition, our study relates to papers that test for biases in expert opinion more generally. For example, Lin and McNichols[1998] and Michaely and Womack [1999] find that sell-side analysts’ buy and sell recommendations favor the companies withwhich their employers do investment banking business, suggesting that business relations are capable of influencing expertopinion. Also, Zitzewitz [2002] finds that figure skating judges are nationalistically biased and “sell” bias to colleagues byengaging in vote trading.
4

have on fund flows. Existing studies on the determinants of flows into U.S. mutual funds largely focus
on the relationship between measures of past performance, such as those reported by the media at year’s
end, and future flows (see, for example, Ippolito [1992] and Chevalier and Ellison [1997]). However, as
Sirri and Tufano [1998] argue, these empirical tournaments implicitly assume that it is costless for investors
to gather and process information on the universe of available funds. Consistent with investors having
lower search costs for mutual funds they have been exposed to through the media, Sirri and Tufano find
that mutual funds receiving more media attention receive correspondingly higher inflows. Similarly, Jain
and Wu [2000] compare mutual funds that advertise with a matched sample of nonadvertisers and find
significantly higher inflows into the advertised funds, despite the two sets of funds having similar future
returns. More recently, Cronquist [2003] and Gallagher, Kaniel, and Starks [2004] provide additional evidence
that individual investors respond to fund-level and family-level advertising. Finally, Del Guercio and Tkac’s
[2003] find that changes in Morningstar ratings influence fund flows. Collectively, these papers suggest
that investors rely on both advertising and the media when deciding which mutual funds to buy. Because
we possess data on both media mentions and advertising expenditures, we are able to make a modest
incremental contribution to this literature by estimating the relative importance of each in explaining fund
flows. Interestingly, within our sample it appears that most, if not all, of the returns to advertising come
the apparent bias in recommendations.
Finally, we examine the future returns of funds receiving positive and negative media mentions. Our
guiding question is whether investors benefit from or, in the case of potentially biased recommendations,
are harmed by the recommendations of experts. To the extent that the media mentions in our sample
reflect predictions about future mutual fund performance by full-time industry experts, we might expect
positive media mentions to identify better than average future performers. For example, Chevalier and
Ellison [1999] present evidence that some fund manager characteristics are associated with consistently
higher risk-adjusted returns; since the financial media has access to information on fund managers, we might
expect them to use fund manager characteristics when evaluating funds. Or since funds with low expenses
consistently outperform funds with high expenses (Carhart [1997]), we might expect the negative media
mentions to benefit investors by identifying funds with significantly higher than average expense ratios. On
5
the other hand, Blake and Morey [2000] find little evidence that Morningstar ratings help predict future fund
performance.4 Therefore it is an open question whether the media mentions in our sample help investors to
choose funds with above average future returns.
3 Data
We combine publication-level data on mutual fund family advertising expenditures from Competitive Media
Research, hand-collected data on mutual fund media mentions from Consumer Reports, Kiplinger’s Personal
Finance, Money, New York Times, SmartMoney, and Wall Street Journal, and fund-level data on monthly
returns, inflows, and other U.S. mutual fund characteristics from the CRSP Survivor Bias Free Mutual Fund
Database.
The mutual fund family advertising data were purchased from Competitive Media Research (CMR),
a firm which tracks advertising expenditures for national newspapers, consumer magazines, and nine other
media channels.5 CMR tracks the size of each print media advertisment and estimates a dollar cost for the
advertisement based on a publication’s quoted advertising rates and CMR’s estimate of any likely discount.6
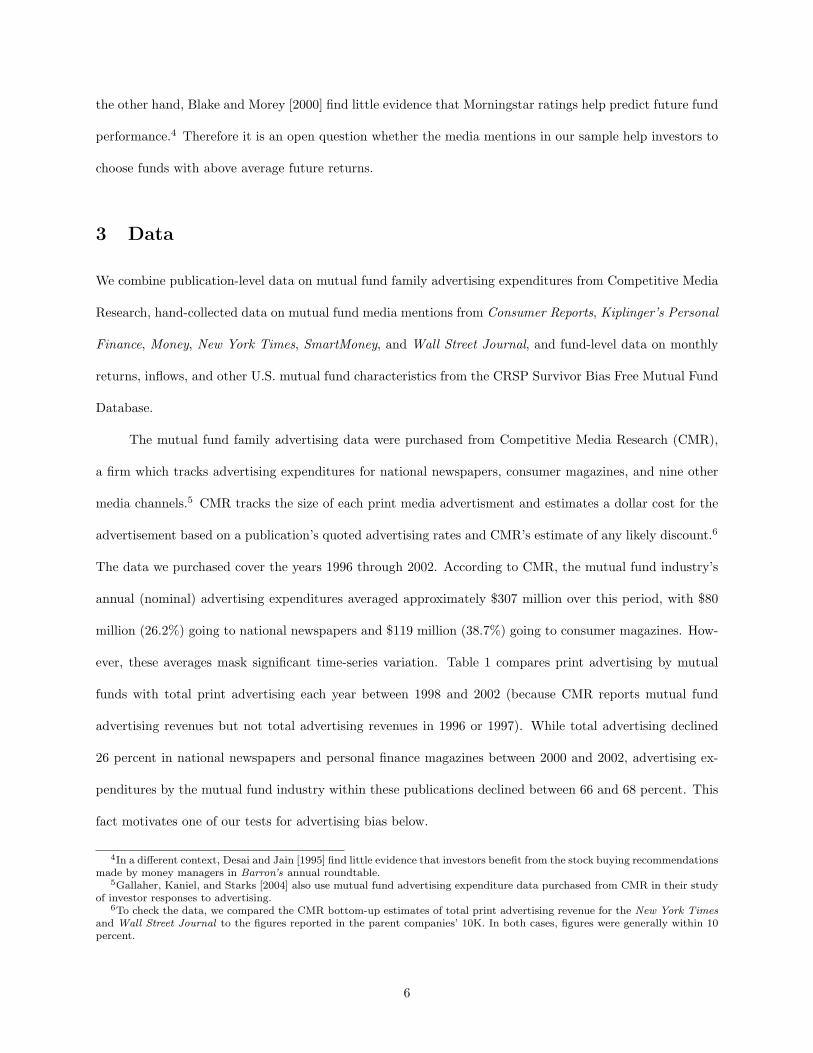
The data we purchased cover the years 1996 through 2002. According to CMR, the mutual fund industry’s
annual (nominal) advertising expenditures averaged approximately $307 million over this period, with $80
million (26.2%) going to national newspapers and $119 million (38.7%) going to consumer magazines. How-
ever, these averages mask significant time-series variation. Table 1 compares print advertising by mutual
funds with total print advertising each year between 1998 and 2002 (because CMR reports mutual fund
advertising revenues but not total advertising revenues in 1996 or 1997). While total advertising declined
26 percent in national newspapers and personal finance magazines between 2000 and 2002, advertising ex-
penditures by the mutual fund industry within these publications declined between 66 and 68 percent. This
fact motivates one of our tests for advertising bias below.
4In a different context, Desai and Jain [1995] find little evidence that investors benefit from the stock buying recommendationsmade by money managers in Barron’s annual roundtable.
5Gallaher, Kaniel, and Starks [2004] also use mutual fund advertising expenditure data purchased from CMR in their studyof investor responses to advertising.
6To check the data, we compared the CMR bottom-up estimates of total print advertising revenue for the New York Timesand Wall Street Journal to the figures reported in the parent companies’ 10K. In both cases, figures were generally within 10percent.
6

Table 2 lists the twenty CMR-monitored publications with the largest average annual mutual fund ad-
vertising revenues between 1998 and 2002, as well as the fraction of advertising revenues for each publication
that comes from the mutual fund industry. The six publications receiving the largest annual advertising rev-
enues from the mutual fund industry are Wall Street Journal ($48.5 million), Money ($22.1 million), Mutual
Funds ($14.0 million), New York Times ($14.0 million), Kiplinger’s Personal Finance ($12.2 million), and
SmartMoney ($8.7 million). We set out to gather media mentions from the first five of these publications.
However, because we were unable to access Mutual Funds content electronically, we dropped Mutual Funds
in favor of SmartMoney. In total, the five publications in our sample received 45.3 percent of the mutual fund
advertising expenditures between 1998 and 2002. Note, however, that these publications differ substantially
in the amount of advertising revenue they receive from non-mutual fund sources. Whereas mutual fund
advertising accounts for 3.8 percent of advertising revenues at the Wall Street Journal and 1.1 percent at the
New York Times, it accounts for 15.1 percent at Money, 15.9 percent at SmartMoney, and 28.2 percent at
Kiplinger’s. We also gathered media mentions from Consumer Reports, which does not accept advertising.
Our media mention data vary across publications and are summarized in Table 3. Money Magazine
publishes a Money 100 list of recommended mutual funds once a year; so for Money, we choose to simply
study the composition of this list.7 Consumer Reports publishes an analogous list, sometimes separating
equity and bond funds. Kiplinger’s Personal Finance and SmartMoney do not construct a master list of
recommended funds, but instead run periodic articles that make either general recommendations of funds to
buy or focus on an asset class or investment theme and make recommendations within that class or theme.
In addition, both Kiplinger’s Personal Finance and SmartMoney run articles that highlight a particular fund
or fund family. For these publications, we analyzed every article containing the word “fund,” classifying the
articles by type listed above and by whether the fund was mentioned in a positive or negative context. As
suggested by the representative article titles reported in Table 3, this rarely involved close judgment calls.
If we could not determine whether a mention was positive or negative we dropped the mention; we did this
for 8 of 668 mentions in Kiplinger’s and 10 of 2102 mentions in SmartMoney.
7If reporters rely more on observable fund characteristics when picking 100 funds at once, than they do when picking fivefunds to feature within a single article, there will be less scope for bias in the Money 100 list than in other mutual fund articlespublished within Money. This, in turn, will reduce the power of our tests for advertising bias within Money.
7

For the New York Times, we tracked the funds mentioned in a column titled “Investing With” that runs
in the Sunday Business section. This column spotlights a particular fund, providing details such as returns,
expense ratios, and the fund company’s contact information. It also interviews fund managers on their views
about future market movements. We judged that being mentioned in this article is unambiguously positive,
since interviewing someone about their view of the market is commonly thought to imply that they have
something useful to say. The Wall Street Journal lacks a similar column, but does regularly report on the
fund industry through a daily column called Fund Track. Here funds are mentioned either because they are
the subject of news (such as fund manager turnover) or because their managers are being quoted discussing
an issue. One might expect being quoted in the Wall Street Journal to be positive on average, although the
impact on inflows may be smaller than with other publications, since the articles rarely recommend a course
of action for fund investors and because these quotes are interspersed with other fund industry news.8
Data on U.S. mutual fund returns and characteristics come from the CRSP Survivor Bias Free Mutual
Fund Database. The unit of observation is fund i in month t. For mutual funds with multiple share classes,
we calculate fund-level returns, inflows, and other characteristics and include one observation per fund per
month in our sample. We include in our sample all domestic equity funds, international equity funds, hybrid
funds (which invest in debt and equity), and bond funds; we exclude money market funds because they are
rarely mentioned in the publications we study. Table 4 provides summary statistics for the full sample of
mutual funds for the period January 1996 though December 2002; it also provides summary statistics for the
subsets of funds that received media mentions from each of the publications and for which we were able to
locate a ticker in CRSP. Variables include the natural logarithms of fund size and fund family size; current
expense ratio and 12b-1 fee; a dummy variable that indicates whether the fund charges a sales load when
investors buy or sell shares; net flows into the fund from month t − 12 to month t − 1; and average fund
return from month t− 12 to month t− 1 minus the average return within its investment objective over that
period.
Advertising expenditures by each mutual fund family are classified as print or non-print, summed over
8Note that our sample period ends before the investigations into the mutual fund industry were announced in September2003. After September 2003, we would be less comfortable with the assumption that Wall Street Journal mentions were positiveon average.
8

month t − 12 to month t − 1, and divided by average family-level assets under management. (Because we
do not observe advertising expenditures in 1995, the statistics for the lagged advertising ratios cover the
period January 1997 through December 2002.) Comparing the level of print advertising across columns,
mutual funds receiving (both positive and negative) media mentions come from mutual fund families with
higher than average levels of print advertising. Interestingly, the sample of funds recommended by Consumer
Reports also come from families that spend an above-average amount on print advertising. This suggests that
print advertising may be correlated with other unobservable (to the econometrician) characteristics that the
financial media uses to rank funds, and should be included as a control in the tests for advertising bias. The
rows containing publication-level advertising shares indicate that mutual funds receiving media mentions from
a particular publication tend to come from mutual fund families with higher than average levels of advertising
in that publication. Below, we explore this possible relation between media mentions and advertising in a
multivariate setting. Other univariate comparisons of the full sample of funds to those receiving media
mentions suggest that funds receiving positive media mentions have significantly higher past returns and net
inflows, lower expense ratios, and are less likely to charge a load (particularly Consumer Reports, Kiplinger’s,
and Money). Finally, relative to the actual distribution of mutual funds across investment objectives, media
mentions focus disproportionately on the subset of general domestic equity funds.
4 Empirical Results
4.1 Do Media Mentions Favor Advertisers?
Except for Consumer Reports, all of the publications we study receive revenue from two sources: subscribers
and advertisers. Future subscription revenues, as well as future circulation and thus long-run future adver-
tising revenues, depend on the publication maintaining a reputation for providing accurate and informative
content. At the same time, short-run pressure to sell advertising may create an incentive for the publication
to bias its content in favor of past or potential future advertisers. We might thus expect publications that
accept advertising to balance their long-run reputational concerns with their short-run business concerns
(for a more formal model of this tradeoff, see Reuter [2004]).
9

In Table 5, we compare Money 100 list mentions for families that are heavy advertisers in Money
(defined as more than $1 million in advertising expenditures over the prior 12 months) with mentions for
families that do not advertise in Money. In an average year, 7.2 percent of non-advertising families are
mentioned once or more in the Money 100 list versus 83.8 percent of heavy advertisers. This difference
partially reflects the fact that heavy advertising families tend to manage more mutual funds than non-
advertisers, but an individual fund from a heavy advertising family is more than twice as likely to be
recommended (3.0 percent vs. 1.3 percent).
While this factor-of-two difference is suggestive of a pro-advertiser bias, Table 5 does not control for
differences in fund characteristics or in the general level of advertising across fund families, both of which
Money might reasonably use to rank funds. To address these shortcomings, we turn to multivariate tests for
advertising bias. We take as given that each publication faces a constraint on the number of funds that it can
recommend within an issue.9 We assume that a publication first decides on the number of recommendations
that it wants to make within a given investment objective in a given month. We then assume that it ranks
all of the funds within that investment objective and recommends the top x funds (where x can vary across
investment objectives and months). Controlling for other characteristics the publication might reasonably
use to rank funds, we want to test whether advertising expenditures influence fund rankings.
Formally, let
Mit =
1 if Bit ≥ B̄jt
0 otherwise(1)
where Mit equals one if fund i is mentioned in a particular publication in month t and zero otherwise, Bit is
the expected benefit to the publication of recommending fund i in month t, and B̄jt is the critical value for
investment objective j in month t. We assume that the expected benefit to the publication of recommending
9In some cases, this constraint follows from the format in which the funds are recommended (e.g., the New York Times’weekly Investing With column; the Money 100 list), whereas in other cases it follows from the fact that each additionalrecommendation will decrease the impact and value to subscribers (or advertisers) of previous ones.
10

fund i in month t, is given by
Bit = βE[Uit(Rit)|Xit] + γE[Ait|Xit] + εit, (2)
where both expectations are formed at time t using a vector of fund and fund family characteristics Xit.
On the one hand, the benefit of mentioning fund i depends on the (possibly subjective) expected utility Uit
that investors will derive from being informed about the fund, where Uit is a function of the fund’s expected
future return Rit and possibly of other fund characteristics as well. On the other hand, if γ is positive,
the benefit of mentioning fund i also depends on Ait, the expected advertising-related business gains from
mentioning the fund. When we ask whether media mentions favor advertisers, we are asking whether γ is
positive.
We estimate equation (1) as a fixed effects logit model, assuming Bit is a linear function of Xit.
Specifically, we assume that the expected value of Uit can depend on both fund i’s characteristics and the
general level of print and non-print advertising by its fund family, while the expected value of Ait depends
solely on the level of advertising expenditures by its fund family within the publication in question through
month t. Hence, the identifying assumption in our tests for advertising bias is that advertising within
a publication is uncorrelated with any unobserved factors (other than business relationships) that would
make readers want a magazine to mention a fund. Under this assumption, once fund characteristics and the
general level of advertising are controlled for, a statistically significant positive coefficient on own-publication
advertising expenditures (γ > 0) constitutes evidence that the publication’s content is biased by advertising.
We include a separate fixed effect for each investment objective-by-month combination, allowing for
the possibility that the critical value B̄jt for an objective-by-month combination is correlated with the Bit in
that objective-by-month combination. Note that the fixed effects logit specification drops those funds with
investment objectives that do not receive a recommendation in month t. Therefore, our tests for advertising
bias condition on the investment objectives that publications actually mention in any given month and ask
whether advertising expenditures influence which funds are mentioned within these investment objectives in
these months.10
10Since advertising expenditures are made at the mutual fund family level and the majority of families offer funds that
11

In Table 6, we estimate the fixed effects logit specification separately for each type of media mention.
For example, the dependent variable in the column titled “SmartMoney (Positive)” equals one if fund i
received a positive media mention in SmartMoney in month t and zero otherwise. The number of observations
reflects the number of mutual funds with the same investment objectives as those receiving positive mentions
in SmartMoney each month. The explanatory variable of interest in this column is advertising expenditures
by fund i’s family within SmartMoney over the prior 12 months, which we will continue to refer to as “own-
publication” advertising expenditures. Since mutual fund families that advertise may differ systematically
from those that do not — either because advertisers have systematically different expected future returns
or because investors are more likely to value reviews of funds from families they learned about through
advertising — we include total print and non-print advertising expenditures by fund i’s family over the prior
12 months as control variables. As additional controls we include characteristics that publications might
reasonably use to rank funds: the natural logarithm of dollars under management within both fund i and
the fund family to which it belongs, fund i’s current expense ratio and 12b-1 fee, and a dummy variable
that indicates whether fund i currently charges a sales commission (known as a load), net inflows into fund i
over the prior twelve months, the actual return earned by fund i over the prior twelve months, this past
return squared, and five variables that reflect fund i’s current Morningstar rating(s).11 Standard errors are
reported below the coefficients and cluster on mutual fund family (Moulton [1990]).
Looking across columns in Table 6, the correlations between own-publication advertising and positive
media mentions are positive and statistically significant for all three personal finance magazines.12 The
observed positive correlations are also economically significant. For example, for Money and Kiplinger’s,
variation in own-publication advertising is more important than variation in either past returns or expense
ratios in explaining positive mentions. In other words, the univariate correlation between advertising and
span the set of investment objectives, we have insufficient statistical power to test whether the choice of investment objectivessystematically favors advertisers.
11Morningstar ratings can differ across different share classes of the same mutual fund. Therefore, to control for currentMorningstar rating we begin with five dummy variables that indicate whether one or more of fund i’s share classes receiveda Morningstar rating of one, two, three, four, or five. We then scale each dummy variable by the fraction of dollars undermanagement in share classes receiving each rating.
12Note that the correlations between advertising and content reported in Table 6 through 9 are robust to the inclusion ofadditional fund characteristics available in the CRSP dataset, such as fund age and manager turnover. They are also robustto our defining investment objectives using Morningstar categories, which divide equity funds more finely according to thecapitalization and price-to-book of their holdings. In Table 6 and throughout this paper, we use the ICDI investment objectivecodes contained in CRSP.
12

the Money 100 list in Table 5 generalizes to positive mentions in all three personal finance magazines in a
multivariate setting. These results are consistent with the three personal finance publications, which receive
between 15.1 and 28.2 percent of their advertising revenues from mutual funds, placing positive weight on
own-publication advertising expenditures when ranking funds. In contrast, the correlations between own-
publication advertising and media mentions are statistically indistinguishable from zero for the Wall Street
Journal and New York Times, which receive 1.1 and 3.8 percent of their advertising revenues from mutual
funds, respectively.13
Turning to the negative media mentions, publications that bias fund rankings to favor advertisers
should be less likely to publish negative mentions featuring advertisers. While point estimates for both
Kiplinger’s and SmartMoney are negative (albeit marginally so for SmartMoney), standard errors are larger
than for positive recommendations, and neither point estimate is statistically significant. However, for both
publications we can reject the hypothesis that the coefficients are equal for positive and negative mentions.
This helps rule out one possible source of endogeneity: that funds that have been advertised in the past are
mentioned more because the past advertising stimulates reader interest in them. If advertising-heightened
reader interest explained the extra future positive mentions, it would presumably be stimulating negative
mentions of past advertisers to the same degree.
Several of the coefficients on the control variables deserve mention. First, counter to our expectations,
few of the coefficients on the total print and non-print advertising expenditure variables are statistically
significant. The fact that the coefficients on total print advertising expenditures are positive for both types
of negative mentions, suggests that Kiplinger’s and SmartMoney may be responding to subscriber demand for
reviews on funds they’ve seen advertised in general (rather than specifically in Kiplinger’s or SmartMoney).
Second, the probability of receiving both positive and negative mentions is increasing in the size of fund i and
decreasing in the size of its family. The fact that the New York Times tends to feature smaller-than-average
funds shows up in the relative low coefficient of 0.192. Third, the probability of receiving both positive
and negative mentions is increasing in the level of the fund i’s expense ratio for every publication except
Consumer Reports, but decreasing in the level of fund i’s 12b-1 fee, a component of the expense ratio. Fourth,
13For the Wall Street Journal, the lack of a statistically significant correlation could also reflect the fact that mentions in the“Fund Track” column are a mixture of positive and negative, driven primarily by news.
13

with the exception of New York Times, the probability of receiving a positive mention is lower for load funds
than for no-load funds. Fifth, funds experiencing inflows, good returns, and favorable Morningstar ratings
over the prior 12 months were more likely to receive positive mentions while outflows and low returns and
ratings were associated with negative mentions.
In Table 7, we begin to explore the robustness of the correlations between own-publication advertising
and mentions. Each cell reports the estimated coefficient on own-publication advertising expenditures for a
particular specification and type of media mention. The first row of Panel A simply repeats the fixed effects
logit estimates from Table 6. The second row adds variables that control for the past media mentions in other
publications, as an additional measure of fund i’s quality. The coefficients on own advertising are attenuated
slightly relative to the baseline specification but the positive coefficients on positive media mentions in the
three personal finance magazines retain their statistical and economic significance.
In Panels B to D, we investigate whether our results are driven by the endogeneity of advertising.
We use three standard approaches: instrumental variables, matching on observables, and differencing the
model. For reasons we discuss, none of these approaches is perfect, but the fact that the advertising-content
correlation survives all three approaches increases the likelihood that it reflects a causal relation between
advertising and content.
In Panel B, we estimate a linear probability version of the model in Table 6, first via OLS and then
via instrumental variables (IV).14 We estimate both specifications using the same set of fixed effects and
observations as in the fixed effects logit specifications. Our instrument for past own-publication advertising
in publication k is past advertising in the two other personal finance magazines. This IV approach allows
us to test whether our results are driven by one potential source of endogeneity: readers of magazine k
have a longstanding preference for a set of fund families (that is not correlated with their funds’ observable
characteristics), this preference led these families to advertise in magazine k in the past, and leads magazine
k to provide positive recommendations to the families’ funds in the current period. Advertising in the other
two magazines is a valid instrument if it is related to a families’ general propensity to advertise in personal
14We follow Angrist and Krueger’s [2001] advice and switch to a linear probability specification to avoid the difficultiesassociated with estimating limited-dependent-variable IV models.
14

finance magazines but not to any unobservable preferences of magazine-k readers for its funds.15 On the
other hand, if mentions are used to reward families that advertise predominately in magazine k, this IV
specification will not capture this reward. In fact, the IV estimates for positive mentions are uniformly
larger than the OLS estimates and statistically significant at the 1-percent level.16
In Panel C, we use a matched sample approach to better control for unobserved fund characteristics
that might be driving the correlation between own-publication advertising and content. Specifically, we
use the coefficients from Table 6 — except for the coefficient on own-publication advertising — to estimate
the probability that each fund receives a given media mention. Then, for each fund belonging to a family
with positive own-publication advertising expenditures in month t, we find the non-advertising fund whose
probability of receiving the media mention is closest (sampling without replacement).
In the top row of Panel C, we estimate the fixed effects logit specification on a sample that consists
of all advertisers and their matched funds. The resulting coefficients on positive media mentions are quite
similar to those obtained in Table 6, suggesting that our results are not being driven by unobservables that
are uncorrelated with linear functions of the observables but related to the observeables non-parametrically.
Since personal finance magazines focus on no-load funds and since it was suggested to us by an industry
participant that load funds might be driving the results, we repeat this analysis using no-load funds only,
and obtaining similar results. (Note that the sample sizes are uniformly lower than in Panel A because the
fixed effects logit specification drops all investment objective-by-month combinations in which neither an
advertiser nor a matched fund receives a mention.)
Finally, in the Panel D, we ask whether funds from families that start advertising in a particular
publication are more likely to be recommended than funds from families that do not start advertising.
Similarly, we ask whether funds from families that stop advertising in a particular publication are less likely
to be recommended than funds from families that continue advertising. In other words, we are using time-
series variation in own-publication advertising status (rather than the level of own-publication advertising
15This identifying assumption is subject to a criticism analogous to the critique of estimating demand instrumenting withprices from other markets [Bresnahan, 1997]. If certain families persistently appeal to readers of all magazines in a way that isuncorrelated with the observables (including the general level of print advertising), then other-magazine advertising will not bea valid instrument.
16When we first difference the linear probability model, we find a positive and statistically significant coefficient on positivementions in Kiplinger’s, and a negative and statistically significant coefficient on negative mentions in SmartMoney.
15

expenditures) to test for advertising bias. Focusing on changes in advertising status does not eliminate
concerns about the endogeneity of advertising, but would require, for example, that families start advertising
in anticipation of positive mentions.
Using the data on monthly advertising expenditures by mutual fund family and publication, we classify
family j as starting to advertise in publication k in month t if family j has positive advertising expenditures
in publication k in month t but no advertising expenditures in the previous six months. We then follow
the funds in that family forward from month t to month t + 5. We also identify all families that neither
advertised in the six months prior to month t nor in the six months between month t and month t + 5 and
include their funds in our sample as well. According to the coefficients in the top row of Panel C, families
that begin advertising in Money are more likely to be included in the Money 100 list than funds that do not
begin advertising. None of the other coefficients are statistically different from zero.17
The algorithm used to identify families that stopped advertising was similar, except that we classified
family j as having stopped advertising in publication k in month t if family j had positive advertising
expenditures in month t − 6 but no advertising expenditures between t − 5 and t. (Because few families
advertise every month we could not classify a family as having stopped advertising if it advertised in month t−
1 and did not advertise in month t.) We then compared the funds in these families to the funds in families
that continued advertising in publication k. According to the coefficients in the bottom row of Panel C,
funds from families that stop advertising are less likely to receive positive mentions in Kiplinger’s and Smart
Money. In contrast, funds from families that stop advertising in the New York Times are more likely to
appear in the “Investing With” column than funds from continuous advertisers.18
Overall, the results in Tables 6 and 7 are consistent with own-publication advertising expenditures
influencing fund rankings at the three personal finance magazines in our sample. Without purely exogenous
variation in advertising, we cannot entirely rule out that the possibility that the correlations we observe are
being driven by the endogeneity of advertising. However, based on the robustness of the positive correlation
17It is possible that mutual fund families begin advertising in month t in response to news that they will be receiving apositive media mention in month t. However, the estimated coefficients are quite similar when we exclude the first month themutual fund family begins advertising in the publication.
18“Investing with” mentions are also negatively related to the level of advertising in the New York Times in all otherspecifications, albeit it not significantly. A negative relationship is possible if a publication overcorrects to avoid the appearanceof bias.
16

for the personal finance magazines (and its absence for the newspapers, which provide a falsification test of
sorts), we believe that the most likely explanation is the causal one.
4.2 Causal Sources of the Relationship between Advertising and Content?
In this section, we consider three potential causal explanations for the correlation between advertising and
content documented in the previous section. First, we consider the possibility that the correlation between
advertising and content is the result of journalists being subconsciously influenced by advertising in their
own publication. While this hypothesis is difficult to test, assuming that journalists read publications other
than their own, it would seem to ruled out by the magnitudes of the correlations. If the mechanism for the
observed correlation were the subconscious influence of advertising, we should find effects for other print
advertising in addition to own-publication advertising, but these effects are less than one-tenth the size of
the effects of own-publication advertising, even for other personal finance magazines.19
Second, we consider the possibility that editors generate a pro-advertiser bias through their selection of
stories. Interviews with reporters suggest that articles on specific funds or fund families are often suggested
by editors; these articles may in turn have been suggested to editors by their superiors, with the goal of
rewarding advertisers. On the other hand, the recommendation of specific funds in articles that provide
general recommendations or recommendations within an investment class seem less subject to influence by
editors. For example, if an editor instructed a reporter to write a story about small-cap funds with instruc-
tions to mention five specific funds, any pro-advertising bias might become obvious to the reporter. If editor
suggestions are driving the observed correlation between advertising and content, we expect the correlation
to be strongest for articles that feature a single fund or family. For both Kiplinger’s and SmartMoney, we
classified articles into those that make general recommendations, those that make recommendations within
an asset class, and those that feature a single fund or family. Table 8 repeats the analysis of positive mentions
in Kiplinger’s and SmartMoney separately for each article type.
For Kiplinger’s, the positive correlation between positive mentions and advertising expenditures is
19A related subconscious bias story is that a journalist is more favorably influenced by an own publication ad due to un-conscious feelings of gratitude. This is almost observationally equivalent to a conscious bias in favor of advertisers, and so wecannot rule this story out. Were this the story, we argue that our results should still be interesting, including to those journalistsinterested in understanding and correcting for any subconscious biases.
17

strongest for the articles that feature a single fund or family, smaller (but still statistically significant)
for articles that make recommendations within an asset class, and close to zero for articles that make
general recommendations. However, for SmartMoney the pattern is reversed, with the strongest correlation
for articles that make general recommendations, smaller (but still statistically significant) for articles that
make recommendations within an asset class, and close to zero for articles that feature a single fund or
family. Therefore, while editor suggestions may contribute to the observed correlation between positive
media mentions and advertising expenditures at Kiplinger’s, they are unlikely to do so at SmartMoney.
Finally, we consider the possibility that the significant decline in mutual fund advertising between 2000
and 2002 (documented in Table 1) contributed to a relaxation in journalistic ethics. Since financial pressure
due to the decline in advertising revenue was present at all three publications to roughly equal degrees,
the only source of variation we have to exploit in our tests is time series. Table 9 reports coefficients on
own publication advertising for specifications identical to those in Table 6 except that they are estimated
separately for each year between 1997 and 2002. In general, across the three publications, the association
between advertising and positive mentions appears to have increased from 1997 to 2000, when mutual fund
advertising expenditures were increasing, and then declined in 2001 and 2002, when mutual fund advertising
expenditures were sharply falling. In 2002, only the coefficient for SmartMoney (Positive) is positive and
statistically significant, but it is significantly higher than in earlier years. Therefore, the evidence that the
correlation between advertising and content increased in 2001 and 2002 as a result of increased competition
for advertising dollars is mixed at best.
Ultimately, in addition to the sort of outside-in statistical analysis we conduct in this paper, better
understanding the underlying mechanism between advertising and content may require interviews and docu-
mentary evidence. For example, a former reporter from one the magazines in our sample described a common
fund selection procedure as running database screens as a first step, but then selecting which of several eli-
gible funds to include based on, in part, whether the reporters had existing high-level contacts available for
quotation. The reporter noted many large advertisers were fairly proactive about meeting reporters when
visiting their offices for business reasons. This mechanism for an advertising-content correlation seems to be
a grey area. One could view it as a pro-advertiser bias or, alternatively, one could view the media mentions
18

as the result of an investment in public relations and the correlation as being due to PR and advertising
being complements.
4.3 Do Investors Respond to Media Mentions?
Media mentions are only valuable to mutual fund families to the extent that they influence investor behavior.
Table 10 presents the results of Fama-MacBeth [1973] style regressions of future fund inflows on media
mentions, fund characteristics, and advertising. Each month between January 1997 and December 2001,
we estimate a cross-sectional regression of inflows over the subsequent twelve months on the various media
mention and control variables. We then report the time-series means and standard errors associated with
these cross-sectional estimates.
Our dependent variable measures the future net inflows into fund i as the percentage change in the size
of fund i between months t + 1 and t + 12 minus the return earned by fund i over this twelve month period.
The number of media mentions in month t is measured separately for each publication and for each type
of mention (positive versus negative). To test whether advertising expenditures are systematically related
to future inflows, we include family-level advertising expenditures on print and nonprint media over the
past twelve months normalized by the average dollars under management within the fund family over this
period. In addition, we include a standard set of control variables: the natural logarithm of dollars under
management in fund i in month t − 1, the natural logarithm of dollars under management in fund i’s fund
family in month t−1, fund i’s current expense ratio and 12b-1 fee, a dummy variable that indicates whether
fund i charges a sales load, net inflows into fund i between months t − 11 and t, the raw return earned by
fund i between months t − 11 and t and the raw return squared. We also include the future raw returns of
fund i between months t + 1 and t + 12 to control for an important source of future inflows. Finally, we
include fixed effects for each investment objective within each monthly cross-sectional regression. Since the
control variables are highly persistent, we estimate their standard errors from the time-series of estimated
coefficients via Newey and West [1987] and allow 12 monthly lags. Since media mentions within a publication
are not very persistent across months, and since for many of the media mentions we are unable to estimate
a coefficient for each of the 60 months, we estimate the standard errors for the media mention variables via
19

White [1980].20
Looking across the columns in Table 10, we see that media mentions are associated with future inflows
in the direction one would expect. The magnitudes are largest in our baseline specification in column (2) and
decline a bit when we control for fund i’s lagged Morningstar rating (column (3)) and prior media mentions
(column (4)). However, they change very little when we add controls for the current and prior media mentions
of other funds in fund i’s family (column (5)), with the exception that the coefficient on Kiplinger’s (Negative)
is now positive and statistical insignificant. Overall, positive mentions in personal finance magazines and
Consumer Reports are associated with an economically significant 7-10 percent increase in fund size over the
next 12 months, while a positive mention in the New York Times is associated with a 15 percent increase.
Negative media mentions in both Kiplinger’s and SmartMoney yield estimated future outflows of around 3
percent, but only the coefficient on SmartMoney is statistically significant, and then only in column (5).
Interestingly, in none of the specifications is the coefficient on the print advertising ratio statistically
different from zero. If we interpret the correlations in Tables 6 and 10 causally, this suggests that all of
the returns to print advertising by mutual funds may come via biased content. Alternatively, if content and
advertising are merely correlated, then past work on advertising may suffer from an omitted variable bias
by failing to control for free media mentions.
4.4 Do Media Mentions Contain Information About Future Returns?
As discussed in the introduction, there is a large literature that seeks to predict future mutual fund perfor-
mance with fund characteristics, fund manager characteristics, and measures of past fund performance. In
Table 11, we ask whether investors who use positive (or negative) media mentions to buy (or sell) funds earn
positive (or negative) abnormal returns relative to other funds they might have chosen.
We begin by comparing the monthly returns of funds receiving media mentions to other funds with the
same investment objectives. We calculate the equal-weighted relative return of fund i in month t as its return
20Note that we are able to estimate the standard errors for both WSJ and SmartMoney (Positive) via Newey-West with 12lags. Doing so results in standard errors that are quantitatively similar to those reported in Table 10. For WSJ, the standarderrors estimated via Newey-West with 12 lags are slightly higher than those estimated via White in columns (2) and (3) — 0.010versus 0.008 and 0.009 versus 0.008, respectively — but the same as those estimated via White in columns (4) and (5). ForSmartMoney (Positive), the standard errors estimated via Newey-West with 12 lags are uniformly lower than those estimatedvia White.
20

in month t minus the equal-weighted average return of all funds with the same investment objective in the
same month. We calculate the value-weighted relative return of fund i in month t as its return in month t
minus the value-weighted average return of all funds with the same investment objective in the same month.
The equal-weighted relative return measures the extent to which fund i outperformed or underperformed the
average fund with its investment objective, while the value-weighted relative return measures the extent to
which it outperformed or underperformed the average dollar invested in its investment objective. For each
type of media mention, we then regress the equal-weighted or value-weighted monthly relative returns on a
dummy variable that indicates whether fund i received the specified media mention at least once in months
t− 11 through t.
The top panel of Table 11 focuses on our full sample of U.S. mutual funds over the period January 1997
through December 2002.21 Each entry reports the coefficient on a media mention dummy variable (along
with heteroscedasticity robust standard errors). Based on equal-weighted relative returns, funds mentioned
in the New York Times and Money 100 outperform the average funds in their investment objectives by 12
to 20 basis points per month, while funds receiving negative mentions in SmartMoney underperform the
average funds in their investment objectives by 22 basis points per month. Therefore, ignoring possible
differences in risk, investors buying funds recommended by the New York Times and Money 100 list and
selling funds receiving negative mentions in SmartMoney would have realized higher than average future
returns. In contrast, positive mentions in Consumer Reports and SmartMoney and Kiplinger’s and negative
mentions in Kiplinger’s yield coefficients that are statistically indistinguishable from zero. Funds mentioned
in Wall Street Journal’s “Fund Track” column underperform their peers by 6.8 basis points per year, which
is consistent with the column containing news that is, on average, bad. However, this is the only statistically
significant result that we obtain for the Wall Street Journal in Table 11.
Using value-weighted relative returns, the coefficients on negative mentions in Kiplinger’s and positive
mentions in Consumer Reports remain negative but become statistically significant at the 5-percent and
10-percent levels, respectively. Funds receiving negative mentions in SmartMoney underperform the average
21Again, we exclude money market funds and mutual funds for which CRSP does not report a ticker for at least one shareclass during our sample period. The number of observations is higher than in previous tables because we only require thatfund i report a return and investment objective in month t.
21

dollar invested in peers funds by almost six percent per year, while funds recommended in Consumer Reports
underperform by a smaller, but still economically significant, 70 basis points per year.
In the bottom panel of Table 11, we restrict the sample to domestic equity funds and repeat the fund-
level analysis of equal-weighted and value-weighted relative returns. The results are largely similar to those
obtain for the full sample of funds, but there are a few differences. First, among domestic equity funds, we
find evidence that funds receiving positive media mentions in SmartMoney underperform peer funds by 1.2
to 1.8 percent per year (depending on the relative return benchmark used). Second, we find stronger evidence
that funds recommended in Consumer Reports underperform peer funds, with the range now between 1.6
and 2.0 percent per year. In both cases, investors would have earned higher expected future returns by
choosing funds at random. With respect to the magnitudes of the estimated coefficients, domestic equity
funds receiving positive mentions in the New York Times outperform their peers by 30 to 42 basis points per
month while those receiving negative mentions in Kiplinger’s and SmartMoney underperform them by 36
to 48 basis points per month. For the Money 100 list, the estimated coefficient using value-weighted returns
falls from 10 basis points per month to 7 basis points per month and losses statistical significance.
In the bottom panel of Table 11, we also test for differences in the risk-adjusted returns of recommended
funds using portfolio-level returns. Each month we calculate the equal-weighted return of funds that received
a particular media mention within the past 12 months and subtract the equal-weighted return earned by the
full sample of equity funds that month. This yields one observation per type of media mention per month.
We then regress these monthly portfolio returns on excess market returns and other mimicking portfolios,
and we report the intercepts (alphas) in Table 11. The “CAPM” specification includes the market return
in excess of the risk-free rate, the “Three-Factor” specification adds the size and book-to-market portfolios
of Fama and French [1993], and the “Four-Factor” specification adds a momentum portfolio as in Carhart
[1997].
At the portfolio level, negative mentions in SmartMoney continue to underperform their peers by a
statistically significant amount. In addition, there is some evidence that funds on the Money 100 outperform
their peers (using a four-factor alpha), and that funds recommended by Consumer Reports underperform
their peers (using a CAPM alpha). However, while many of the other point estimates have the same signs
22

as the coefficients based on relative returns, few of the portfolios of mentioned funds yield statistically
significant alphas. For example, the positive but statistically insignificant alphas for the New York Times
suggest that their positive relative returns may be due to differences in risk, or other characteristics that
imply predictable differences in returns. In other words, the portfolio-level analysis suggests that domestic
equity funds receiving positive media mentions generate risk-adjusted returns over the next 12 months that
are statistically indistinguishable from their peers. Whether these average expected future returns are a
result of the significant positive inflows documented in Table 10 — as predicted in Berk and Green [2004]
— is an interesting question for future research.
4.5 Does the Observed Relation between Advertising and Media Mentions
Harm Investors?
In Table 12, we assume that the observed correlation between advertising expenditures and media mentions
is causal and ask whether this relation significantly distorts the recommendations that investors receive from
the three personal finance magazines in our sample. The top panel of Table 12 continues the fund-level
analysis of equal-weighted relative returns begun in the top panel of Table 11. Again, for our full sample
of mutual funds, we calculate the equal-weighted relative return of fund i in month t as the raw return of
fund i in month t less the equal-weighted return of funds with the same investment objective in the same
month. We then regress these relative monthly returns on a dummy variable that equals one if fund i
received the specified media mention within the 12 months ending month t, and zero otherwise. The top row
reports estimated coefficients when the media mention dummy variable is based on actual media mentions
(thereby replicating the results from Table 11). These coefficients speak to the relative returns of the actual
recommended funds, but do not speak to the relative returns of the funds that would have been recommended
in the absence of any advertising bias. To estimate differences in returns due to the assumed advertising
bias, we first predict the set of funds that a publication should have recommended based on the coefficients
from the fixed effects logits in Table 6 and then ask how the predicted set of recommended funds changes
when we constrain the coefficient on own-publication advertising expenditures to equal zero.
The row labeled “Predicted mentions” uses the coefficients on fund characteristics in Table 6 to rank
23

funds within each investment objective and month. It then uses the pattern of actual recommendations across
investment objectives and months to predict media mentions. For example, if Kiplinger’s recommended five
small cap growth funds in month t, we designate the five small cap growth funds with the highest predicted
values as Kiplinger’s predicted recommendations in that month. When comparing the set of predicted
media mentions to the set of actual media mentions, the overlap varies between 13.2% for negative mentions
in SmartMoney to 37.6% for the Money 100 list. In general, the sets of actual positive mentions yield
higher relative returns than the sets of predicted positive mentions, suggesting that publications rely on
fund characteristics beyond those we include in our analysis.
The row labeled “Predicted mentions ignoring own-publication advertising” uses the coefficients from
the fixed effects logits reported in Table 6 to rank funds, except that it sets the coefficient on own-publication
advertising equal to zero. Overlap between the set of predicted mentions and the set of predicted mentions
ignoring own-publication advertising expenditures varies from 73.4% for positive mentions in Kiplinger’s
(where the coefficient on own publication advertising was estimated to be 0.967) to 99.0% for negative
mentions in SmartMoney (where the coefficient on own publication advertising was estimated to be -0.002).
To determine whether investors are harmed by the influence of advertising expenditures on fund rankings, we
compare the relative returns on the set of predicted mentions to the relative returns on the set of predicted
mentions ignoring own-publication advertising. To the extent that advertised funds have lower expected
returns than comparable non-advertisers, the influence of advertising expenditures on fund rankings will
reduce investor returns. Alternatively, to the extent that funds with higher expected returns also advertise
more, as in Milgrom and Roberts [1986], the influence of advertising expenditures on fund rankings will
increase investor returns. In the publications that we study, the observed differences in returns are quite
small and none are statistically different from zero. In other words, as in Jain and Wu [2000], we find no
evidence that the returns of advertisers are systematically different from those of other funds.
The final row in the top panel ranks funds within each investment objective and month based solely on
the basis of their expense ratios. For positive media mentions, we assign higher rankings to funds with lower
expense ratios, and we reverse the rankings for negative mentions. For predicted mentions in Kiplinger’s
and SmartMoney, funds with the highest expense ratios have lower relative returns than both their peers
24

and funds receiving actual negative mentions (as predicted by Carhart [1997]), while funds with the lowest
expense ratios have higher relative returns than both their peers and those funds receiving actual positive
mentions. Only for the Money 100 list do actual mentions have higher relative returns than predicted
mentions based solely on expense ratios.
The bottom panel in Table 12 replaces the fund-level analysis of relative monthly returns with a fund-
level analysis of relative annual expense ratios. We calculate the relative annual expense ratio of fund i in
month t as its expense ratio minus the equal-weighted average expense ratio of other funds within the same
investment objective in month t. Because expense ratios are highly persistent, we then regress the expense
ratio of fund i in month t on a dummy variable that indicates whether fund i received the specified media
mention in month t. Looking across publications, funds receiving actual positive mentions have expense
ratios that are below average within their investment objectives, but significantly higher than charged by
their lowest cost peers. For example, while funds on the Money 100 list have expense ratios that are 30.7
basis points below average, the set of funds predicted based solely on their expense ratios have expense ratios
that are 102.4 basis points below average. However, comparing predicted mentions and predicted mentions
ignoring own-publication advertising, we see that removing the influence of own-publication advertising
on fund rankings actually increases the average relative expense ratio of recommended funds by 10 to 60
basis points. While none of these differences are statistically significant, they are clearly inconsistent with
the hypothesis that advertising bias is leading investors to higher cost funds. Surprisingly, funds receiving
negative mentions in SmartMoney have expense ratios that are only 3.5 basis points above average within
their investment objectives (and the difference is not statistically different from zero). In other words, the
fact that SmartMoney ’s negative mentions exhibit economically significant below-average returns in the
following twelve months is not driven by their awarding negative mentions to high expense ratio funds.
5 Conclusion
In this paper, we present evidence that personal finance magazines are more likely to recommend the funds of
their advertisers, even after controlling for observable fund characteristics that their readers might value. We
also find that recommendations in these (and other) publications significantly influence investor behavior.
25

If we interpret these correlations as reflecting causal relationships, then a non-trivial share of the returns to
advertising in personal finance magazines comes via a biased content channel.
The observed link between advertising and media mentions raises the possibility that investors who
follow investment advice published in personal finance magazines are being harmed by biased advice. Specif-
ically, if these magazines reduced the weight they attached to own-publication advertising, they might have
recommended funds with significantly higher expected future returns (such as index funds or actively man-
aged funds with lower expense ratios). However, when we attempt to remove the influence of advertising
from media mentions, we find little difference between the returns of those funds predicted to receive media
mentions because of advertising and the returns of funds predicted to receive media mentions when we ig-
nore advertising. Consequently, unless we classify the underweighting of expense ratios as a form of general
pro-industry bias, bias toward advertisers does not appear to be harming investor’s returns. Interestingly,
the recommendations of Consumer Reports, which does not accept advertising, have future returns that are
comparable to or below the recommenations of publications that accept advertising.
Our results raise three additional issues. First, from the perspective of a mutual fund investor, following
published recommendations does not appear to yield positive abnormal returns. With the notable exception
of negative mentions in SmartMoney, few of the risk-adjusted future returns of recommended domestic
equity funds are statistically different from the equal-weighted average of their peers. In other words,
investors would do just as well picking funds at random. Of course, the practice of following magazine
recommendations can be rationalized by information costs. In this case, one would argue that for many
products, following published advice yields better results than picking at random, and that discovering that
this is not so for mutual funds would require costly research, as would the alternative of picking funds using
fund characteristics like expense ratios. For some level of information costs, the low-cost investment advice
available from personal finance publications — even if biased — will likely dominate the costs associated with
investor self-education and mutual fund research. Alternatively, as argued in Berk and Green [2004], the
very fact that investors pour dollars into the set of recommended funds may lower the future returns of these
funds to competitive levels. Both the apparent ability of SmartMoney to identify funds with below-average
future returns, and the predicted negative relation between fund flows and future performance merit future
26

research.
Second, consider a market in which magazines bundle bias with advertising in equilibrium. If magazines
are prohibited from bundling bias with advertising, this prohibition will presumably lower their advertising
rates. In long-run equilibrium, lower advertising rates might affect the subscription price charged by the
magazines, the quantity of advertising sold, the quality of content provided, and the number of publications.
In other words, it is not obvious that paying experts via the bias model yields lower welfare than the
subscription or pure advertising models. In fact, our results suggest that the direct cost of bias to readers
may be quite low in some settings.
Finally, our results raise questions about the reliability of content in advertiser-supported media more
generally. For example, they raise questions about the extent to which voters can rely on the media to cover
politics without being biased by political advertising, viewers can rely on the media to cover regulatory issues
without being influenced by special-interest advertising, and shareholders can rely on the media to uncover
corporate malfeasance without regard to the sensitivities of corporate advertisers. Although ideological media
bias has received more popular and academic attention, the impact of ideological bias is likely to be mitigated
by the presence of outlets on each side of the spectrum (Dewatripont and Tirole, 1999; Mullainathan and
Schleifer, 2003). In contrast, pro-advertiser bias is rarely offset by anti-advertiser bias. Unfortunately,
outside of our carefully chosen setting, many of the most important questions about media bias are difficult
to answer systematically.
27

References
[1] Angrist, Josh and Alan Kreuger, 2001, “Instrumental Variables and the Search for Identification: FromSupply and Demand to Natural Experiments,” Journal of Economic Perspectives 15, 69–85.
[2] Barber, Brad. and Douglas Loeffler, 1993, “The ‘Dartboard’ column: Second-hand information andprice pressure,” Journal of Financial and Quantitative Analysis 28, 273–284.
[3] Baron, David, 2003, “Competing for the public through the news media,” working paper.
[4] Blake, Christopher R., and Matthew R. Morey, 2000, “Morningstar ratings and mutual fund perfor-mance,” Journal of Financial and Quantitative Analysis 35, 451–483.
[5] Berk, Jonathan B., and Richard C. Green, 2002, “Mutual fund flows and performance in rationalmarkets,” Journal of Political Economy (forthcoming).
[6] Bresnahan, Timothy, 1997, “Comment on Valuation of New Goods under Perfect and Imperfect Com-petition,” in Timothy Bresnahan and Robert J. Gordon, eds., NBER Studies in Income and WealthNumber 58, The University of Chicago Press.
[7] Carhart, Mark M., 1997, “On persistence in mutual fund performance” Journal of Finance 52, 57–82.
[8] Chevalier, Judith, and Glenn Ellison, 1997, “Risk-taking by mutual funds as a response to incentives,”Journal of Political Economy 105, 1167–1200.
[9] Chevalier, Judith and Glenn Ellison, 1999, “Are some mutual fund managers better than others? Cross-sectional patterns in behavior and performance,” Journal of Finance 54, 875–899.
[10] Cronquist, Henrik, 2003, “Advertising and portfolio choice,” working paper.
[11] Del Guercio, Diane, and Paula Tkac, 2003, “Star power: The effect of Morningstar ratings on mutualfund flows,” working paper.
[12] Desai, Hemang, and Prem C. Jain, 1995, “An analysis of the recommendations of the superstar moneymanagers at Barron’s annual roundtable,” Journal of Finance 50, 1257–1273.
[13] Dewatripont, Mathias, and Jean Tirole, 1999, “Advocates,” Journal of Political Economy 107, 1–39.
[14] Dyck, Alexander, and Luigi Zingales, 2002, “The corporate governance role of the media,” in R. Islamed. The right to tell: The role of media in development (New York: Oxford University Press).
[15] Dyck, Alexander, and Luigi Zingales, 2003, “The media and asset prices,” working paper.
[16] Fama, Eugene, and Kenneth French, 1993, “Common risk factors in the returns on stocks and bonds,”Journal of Financial Economics 33, 3–56.
[17] Fama, Eugene, and James MacBeth, 1973, “Risk, return, and equilibrium: Empirical tests,” Journal ofPolitical Economy 81, 607–636.
[18] Gallaher, Steven, Ron Kaniel, and Laura Starks, 2004, “Mutual funds and advertising,” working paper.
[19] George, Lisa, and Joel Waldfogel, 2003, “Who affects whom in daily newspaper markets?” Journal ofPolitical Economy 111, 765–784.
[20] Groseclose, Tim, and Jeff Milyo, 2003, “A measure of media bias,” working paper.
[21] Hamilton, James, and Richard Zeckhauser, 2004, “Media Coverage of CEOs: Who? What? Where?When? Why?” working paper.
[22] Ippolito, Richard A., 1992, “Consumer reaction to measures of poor quality: evidence from the mutualfund industry,” Journal of Law and Economics 35, 45–70.
28

[23] Jain, Prem C., and Joanna Shuang Wu, 2000, “Truth in mutual fund advertising: Evidence on futureperformance and fund flows,” Journal of Finance 55, 937–958.
[24] Lin, H.-W., and McNichols, M. F., 1998, “Underwriter relationships, analysts earnings forecasts andinvestment recommendations,” Journal of Accounting and Economics 25, 101–127.
[25] Michaely, Roni, and Kent Womack, 1999, “Conflict of interest and the credibility of underwriter analystrecommendations,” Review of Financial Studies 12, 653–686.
[26] Milgrom, Paul, and John Roberts, 1986, “Price and advertising signals of product quality,” Journal ofPolitical Economy 94, 796–821.
[27] Miller, Gregory S., 2003, “The press as a watchdog for accounting fraud,” working paper.
[28] Moulton, Brent, 1990, “An illustration of the pitfalls in estimating the effects of aggregate variables onmicro units,” Review of Economics and Statistics 72, 334–338.
[29] Mullainathan, Sendhil, and Andrei Schleifer, 2003, “The market for news,” working paper.
[30] Nanda, Vikram, Jay Wang, and Lu Zheng, 2003, “Family values and the star phenomenon,” Review ofFinancial Studies 17, 667–698.
[31] Newey, Whitney, and Kenneth West, 1987, “A simple, positive definite, heteroskedasticity and autocor-relation consistent covariance matrix,” Econometrica 55, 703-708.
[32] Reinstein, David, and Chris Snyder, 2000, “The influence of expert reviews on consumer demand forexperience goods: A case study of movie critics,” Journal of Industrial Economics (forthcoming).
[33] Reuter, Jonathan, 2004, “Does advertising bias product reviews? Testing for biased wine ratings,”working paper.
[34] Sirri, Erik, and Peter Tufano, 1998, “Costly search and mutual fund flows,” Journal of Finance 53,1589–1622.
[35] White, Halbert, 1980, “A heteroskedasticity-consistent covariance matrix estimator and a direct testfor heteroskedasticity”,Econometrica 48, 817–830.
[36] Zitzewitz, Eric, 2002, “Nationalism in winter sports judging and its lessons for organizational decisionmaking,” working paper.
29
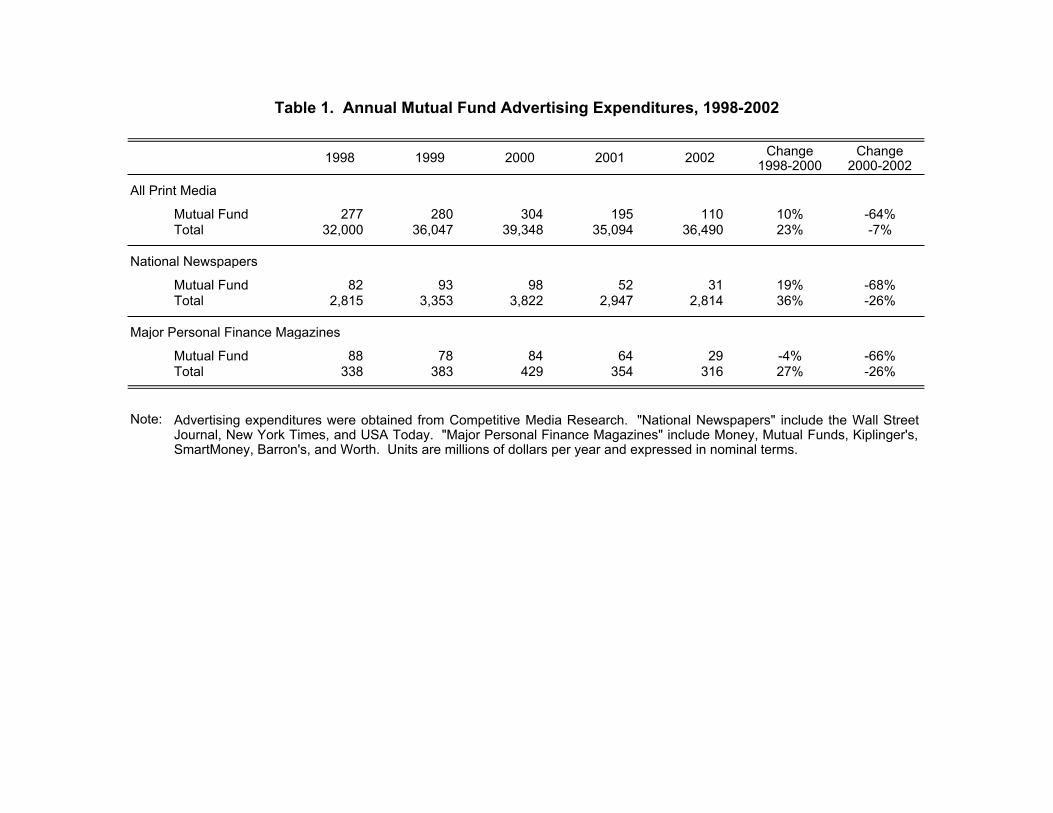
1998 1999 2000 2001 2002 Change 1998-2000
Change 2000-2002
All Print Media
Mutual Fund 277 280 304 195 110 10% -64%Total 32,000 36,047 39,348 35,094 36,490 23% -7%
National Newspapers
Mutual Fund 82 93 98 52 31 19% -68%Total 2,815 3,353 3,822 2,947 2,814 36% -26%
Major Personal Finance Magazines
Mutual Fund 88 78 84 64 29 -4% -66%Total 338 383 429 354 316 27% -26%
Note: Advertising expenditures were obtained from Competitive Media Research. "National Newspapers" include the Wall StreetJournal, New York Times, and USA Today. "Major Personal Finance Magazines" include Money, Mutual Funds, Kiplinger's,SmartMoney, Barron's, and Worth. Units are millions of dollars per year and expressed in nominal terms.
Table 1. Annual Mutual Fund Advertising Expenditures, 1998-2002
Included in Mutual fund Total MF as %Rank Publication this Study ($ mil.) ($ mil.) of Total
1 Wall Street Journal X 48.5 1,264 3.8% 2 Money X 22.1 147 15.1% 3 Mutual Funds 14.0 31 45.1% 4 New York Times X 14.0 1,219 1.1% 5 Kiplinger's Personal Finance X 12.2 43 28.2% 6 SmartMoney X 8.7 55 15.9% 7 USA Today 8.7 667 1.3% 8 US News & World Report 7.8 214 3.6% 9 Barron's 6.8 53 12.8% 10 Time 6.6 602 1.1% 11 Forbes 5.8 321 1.8% 12 Worth 4.6 35 13.3% 13 Fortune 4.5 337 1.3% 14 Business Week 4.0 425 0.9% 15 Investment News 3.3 9 35.8% 16 Los Angeles Times 3.1 1,390 0.2% 17 Registered Representative 3.1 14 22.5% 18 Newsweek 3.0 401 0.8% 19 Investment Advisor 2.7 12 22.9% 20 Financial Planning 2.5 12 21.8%
Consumer Reports X n/a n/a n/a
Studied publications (WSJ, Money, NYT, Kiplinger's, SmartMoney) 105.6 2,728 3.9% Top 20 publications ranked by mutual fund advertising expenditures 186.2 7,251 2.6% All CMR-monitored publications 232.9 34,716 0.7%
Note: Advertising expenditures were obtained from Competitive Media Research. While mutual fund advertisingrevenues are available from January 1996 through 2002, total advertising revenues within each publicationare only available from January 1998 through December 2002. Therefore, we chose to rank publications bytotal mutual fund advertising revenues received between 1998 and 2002. Advertising expenditures areexpressed in nominal terms and averaged across years. Consumer Reports does not accept advertising.
Table 2. Annual Advertising Revenues by Publication, 1998-2002
Publication Article Type Content/Sample Title Character Frequency Number Articles
Number Fund
Mentions
Wall Street Journal "Fund track" column Industry news Generally Neutral Daily 853 2702
New York Times "Investing with" column Profile of funds and managers Positive Weekly 206 180
Money "Money 100 List" Recommended funds Positive Annual 5 465
Kiplinger's All articles mentioning funds Varies 144 668
General recommendations "Best Funds to Buy Now" Positive 31 251
"Hall of Shame" Negative 11 56
Within-asset-class articles "Six Ways to Own the World" Positive 49 244
"The Wild Bunch" Negative 3 10
Single fund/family articles "Magellan's Driven Boss" Positive 38 66
"Is It Time to Leave Magellan?" Negative 12 33
SmartMoney All articles mentioning funds Varies 686 2102
General recommendations "Retire Ten Years Early" Positive 232 882
"The Underachievers Club" Negative 65 303
Within-asset-class articles "Four Great Energy Funds" Positive 116 384
"It's Not Easy Being Green" Negative 46 161
Single fund/family articles "How Janus Got It's Groove Back" Positive 171 247
"What is Janus Thinking?" Negative 56 115
Consumer Reports Mutual fund review issue Recommended funds Positive Annual 10 734
Note: Media mention data were hand collected from the Wall Street Journal, New York Times, Money, Kiplinger's, SmartMoney, and Consumer Reports.In general, the data cover the period January 1996 through December 2002, although the Money 100 and Consumer Reports data cover shorterintervals (as reported in Table 4) because their mutual fund articles appear less frequently.
Table 3. Summary of Hand-Collected Media Mention Data, 1996-2002
All obs. WSJ NYT Pos. Neg. Pos. Neg.
Fund mentions 2,702 180 465 561 99 1513 579 734 With fund characteristics data 254,620 2,229 157 452 386 86 1198 438 688
Date of first media mention collected Jan-96 Jan-96 Jun-98 Jan-96 Jan-96 Jan-96 Jan-96 May-97Date of last media mention collected Dec-02 Dec-02 Dec-02 Dec-02 Dec-02 Dec-02 Dec-02 Oct-02
Ln(Fund Total Net Assets in $millions) 5.07 6.97 5.92 7.53 6.85 6.40 6.96 6.63 6.77 Ln(Family Total Net Assets in $millions) 9.09 9.96 8.65 9.59 9.12 9.12 9.59 9.79 9.72 Current expense ratio (%) 1.27 1.27 1.38 1.08 1.12 1.56 1.24 1.34 0.94 Current 12b-1 fee (%) 0.20 0.17 0.17 0.12 0.08 0.09 0.16 0.20 0.02 Load fund? (%) 55.00 46.52 50.65 29.38 22.78 34.57 41.30 56.44 19.01 Net flows in last 12 months (%) -0.71 12.40 33.49 2.95 38.75 -16.58 29.09 -13.36 12.66 Returns in last 12 months less category average (%) -0.97 10.26 14.98 1.26 7.19 -19.59 15.90 -3.29 6.57
Family print advertising to assets (in basis points) 0.09 0.14 0.10 0.08 0.10 0.17 0.12 0.09 0.11 Family non-print advertising to assets (in basis points) 0.01 0.02 0.02 0.02 0.02 0.02 0.02 0.02 0.02
Share of print advertising by publication (%)
Wall Street Journal 19.7 20.4 18.2 12.9 14.4 21.6 19.1 21.5 22.3 New York Times 4.8 4.9 4.3 3.7 4.1 2.5 4.5 6.1 4.8 Money 6.2 10.5 8.2 10.3 10.2 10.0 10.5 8.9 10.9 Kiplinger's 3.5 5.5 3.4 5.4 6.7 6.3 5.7 4.9 6.5 Smart Money 2.4 4.1 2.6 4.1 4.0 4.9 4.5 3.4 4.4
Share of funds by broad asset class (%)
General domestic equity 40.7 63.6 68.8 73.5 62.7 75.6 58.6 69.6 71.8 Specialized domestic equity 17.7 17.7 11.5 8.0 12.4 4.7 17.9 16.7 5.8 International/global equity 16.0 12.5 17.2 18.6 12.7 9.3 14.2 10.3 13.8 Bonds 25.6 6.2 2.5 0.0 12.2 10.5 9.3 3.4 8.6
Note:
Table 4. Summary Statistics for Mutual Funds Receiving Media Mentions, 1996-2002
This table compares the characteristics of U.S. mutual funds that received media mentions to the full sample of U.S. mutual funds (for which CRSP reportscharacteristics and a ticker for at least one share class) for the period January 1996 through December 2002. The media mention data were hand collected.The advertising data were purchased from Competitive Media Research. The share of print advertising by publication is reported for the subset of fundsbelonging to families with positive advertising expenditures in one or more publication.
Kiplinger's SmartMoneyMoney 100
Consumer Reports
Family Advertising in Money No ad Under $100- $500k-Over Prior 12 Months data $100k 500k $1m
Fund Families 332 194 11.2 7.6 7.4
Families Represented in Money 100 List 24 29 4.2 4.4 6.2
% Families Represented 7.2% 14.9% 37.5% 57.9% 83.8%
Funds 2,446 3,489 388 399 472
Funds Represented in Money 100 List 33 39 5.2 7.4 14.2
% Funds Represented 1.3% 1.1% 1.3% 1.9% 3.0%
Note: Figures reported are per year averages over the five years (1998-2002) for which we possess both CMRadvertising data and the composition of the Money 100 list.
Table 5. Advertising Status and the Money 100 List, 1998-2002
> $1 m
Type of mention
NObjective*Month combinations
Fund family advertising in last 12 months ($ billions)
Own publication 0.002 -0.349 0.431 *** 0.967 *** -0.521 0.693 *** -0.002 (0.050) (0.348) (0.107) (0.244) (0.718) (0.153) (0.267)
Total print 0.017 0.021 -0.051 ** -0.019 0.091 *** -0.012 0.033 *** 0.023 (0.014) (0.039) (0.025) (0.012) (0.027) (0.012) (0.012) (0.015)
Non-print 0.018 0.013 -0.048 ** -0.009 -0.049 -0.007 0.030 0.033 **(0.020) (0.027) (0.022) (0.012) (0.050) (0.016) (0.023) (0.016)
Ln(Fund TNA, month t-1) 0.693 *** 0.192 *** 1.116 *** 0.690 *** 0.904 *** 0.662 *** 0.628 *** 0.454 ***(0.036) (0.061) (0.097) (0.072) (0.131) (0.042) (0.061) (0.054)
Ln(Family TNA, month t-1) -0.115 ** -0.147 *** -0.368 *** -0.300 *** -0.286 *** -0.168 *** -0.115 *** -0.114 (0.054) (0.049) (0.064) (0.058) (0.094) (0.063) (0.044) (0.070)
Current Expense ratio 0.198 *** 0.223 *** 0.233 *** 0.203 *** 0.181 *** 0.187 *** 0.176 *** 0.046 (0.033) (0.090) (0.054) (0.045) (0.071) (0.034) (0.035) (0.182)
Current 12b-1 fee -0.619 ** -0.898 *** -1.272 *** -1.383 -2.389 *** -0.417 -0.590 * -6.157 ***(0.313) (0.350) (0.539) (0.970) (0.940) (0.428) (0.323) (1.109)
Load fund dummy -0.397 *** 0.219 -1.081 *** -1.061 *** -0.492 -0.412 *** 0.099 -0.883 ***(0.146) (0.175) (0.262) (0.346) (0.332) (0.164) (0.141) (0.270)
Net Inflows from month t-11 to t 0.259 *** 0.487 *** 0.549 *** 0.775 *** -0.879 *** 0.548 *** -0.555 *** 0.659 ***(0.073) (0.111) (0.132) (0.109) (0.375) (0.079) (0.174) (0.113)
Raw return from month t-11 to t 0.077 4.362 *** -0.796 ** 1.384 ** -6.899 *** 1.620 *** -4.340 *** 0.852 (0.170) (1.028) (0.395) (0.613) (2.616) (0.405) (0.677) (0.626)
Raw return t-11 to t, Squared 1.069 *** -2.611 *** -3.063 *** -0.148 -0.971 -0.158 -1.626 ** -2.121 *(0.157) (1.117) (1.134) (0.737) (1.246) (0.437) (0.788) (1.088)
Current Morningstar = 1 Star 0.255 * -2.012 -2.226 *** -2.065 * 0.963 * -0.168 0.758 *** 1.650 *(0.147) (1.856) (0.881) (1.087) (0.573) (0.267) (0.267) (0.982)
Current Morningstar = 2 Stars -0.253 ** 0.056 -0.448 -0.613 * 0.320 -0.166 0.410 1.891 ***(0.116) (0.454) (0.363) (0.350) (0.457) (0.220) (0.254) (0.772)
Current Morningstar = 3 Stars -0.399 *** 0.816 ** -0.355 -0.711 ** -1.024 ** -0.187 -0.097 3.045 ***(0.102) (0.353) (0.266) (0.336) (0.462) (0.217) (0.244) (0.761)
Current Morningstar = 4 Stars -0.476 *** 1.412 *** 0.170 0.404 -1.344 *** 0.390 ** -0.459 * 3.672 ***(0.117) (0.353) (0.283) (0.260) (0.369) (0.196) (0.260) (0.768)
Current Morningstar = 5 Stars -0.129 1.927 *** 0.635 *** 1.125 *** -1.099 * 1.101 *** -0.104 3.983 ***(0.156) (0.368) (0.267) (0.273) (0.592) (0.187) (0.313) (0.782)
Note:
Table 6. Fixed Effect Logits Predicting Media Mentions, 1997-2002Dependent variable: one if fund received media mention in month t and 0 otherwise
Each column reports the coefficients from a fixed effects logit model estimated for a particular type of media mention. Our sample of mutual funds comes from the CRSPSurvivorship-Bias Free Mutual Fund Database. In this table, we focus on the period January 1997 through December 2002. We exclude money market funds and mutual fundsfor which CRSP does not report a ticker for at least one share class during our sample period. The dependent variable equals one if mutual fund i received the specified mediamention in month t and zero otherwise. Mutual fund attributes are aggregated across share classes. Since Morningstar ratings are awarded at the share class level, laggedMorningstar ratings dummies are multiplied by the fraction of fund i's dollars under management that receive each rating. Specifications include a separate fixed effect for eachinvestment objective combination each month. Standard errors cluster on mutual fund family and are reported in parentheses. Significance at the 10-percent, 5-percent, and 1-percent levels are denoted by *, **, and ***.
167,115
Kiplinger's (Negative)
SmartMoney (Positive)
SmartMoney (Negative)
60,877 11,541 60,844 17,501 131,490 66,965
Consumer Reports
16,365
WSJ NYT Money 100Kiplinger's (Positive)
52197409529 4316935138
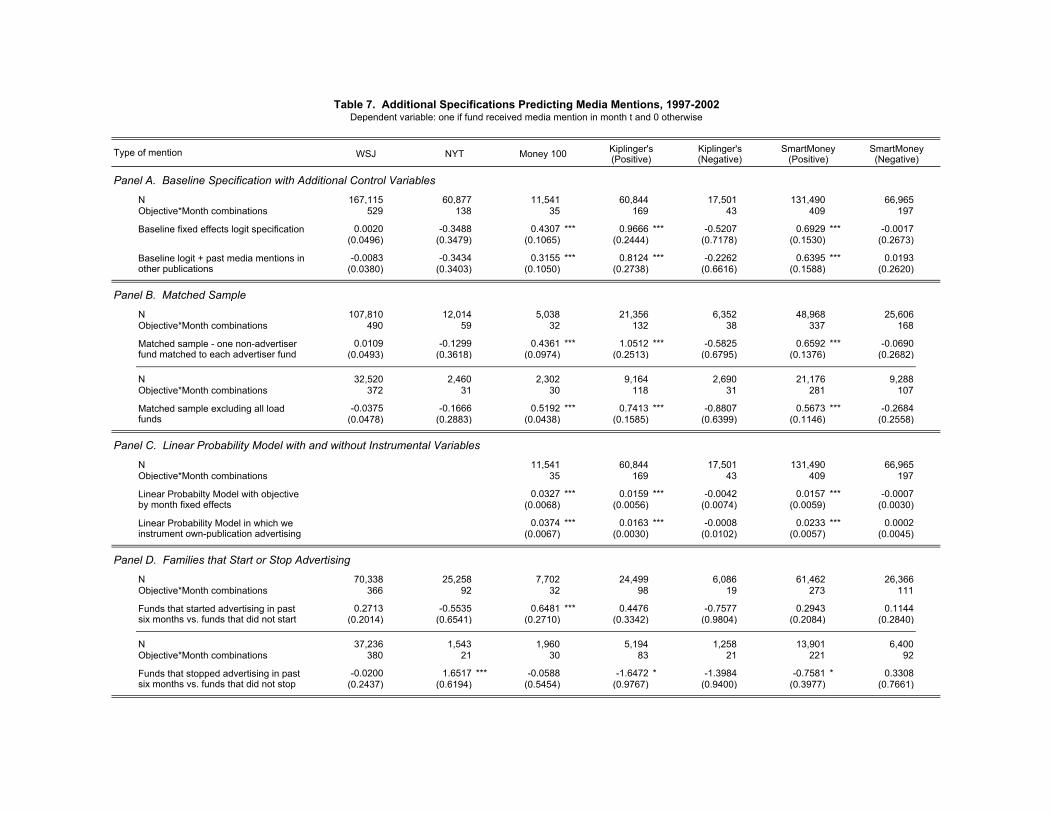
Type of mention
Panel A. Baseline Specification with Additional Control Variables
N 167,115 60,877 11,541 60,844 17,501 131,490 66,965Objective*Month combinations 529 138 35 169 43 409 197
0.0020 -0.3488 0.4307 *** 0.9666 *** -0.5207 0.6929 *** -0.0017 (0.0496) (0.3479) (0.1065) (0.2444) (0.7178) (0.1530) (0.2673)
-0.0083 -0.3434 0.3155 *** 0.8124 *** -0.2262 0.6395 *** 0.0193 (0.0380) (0.3403) (0.1050) (0.2738) (0.6616) (0.1588) (0.2620)
Panel B. Matched Sample
N 107,810 12,014 5,038 21,356 6,352 48,968 25,606Objective*Month combinations 490 59 32 132 38 337 168
0.0109 -0.1299 0.4361 *** 1.0512 *** -0.5825 0.6592 *** -0.0690 (0.0493) (0.3618) (0.0974) (0.2513) (0.6795) (0.1376) (0.2682)
N 32,520 2,460 2,302 9,164 2,690 21,176 9,288Objective*Month combinations 372 31 30 118 31 281 107
-0.0375 -0.1666 0.5192 *** 0.7413 *** -0.8807 0.5673 *** -0.2684 (0.0478) (0.2883) (0.0438) (0.1585) (0.6399) (0.1146) (0.2558)
Panel C. Linear Probability Model with and without Instrumental Variables
N 11,541 60,844 17,501 131,490 66,965Objective*Month combinations 35 169 43 409 197
0.0327 *** 0.0159 *** -0.0042 0.0157 *** -0.0007 (0.0068) (0.0056) (0.0074) (0.0059) (0.0030)
0.0374 *** 0.0163 *** -0.0008 0.0233 *** 0.0002 (0.0067) (0.0030) (0.0102) (0.0057) (0.0045)
Panel D. Families that Start or Stop Advertising
N 70,338 25,258 7,702 24,499 6,086 61,462 26,366Objective*Month combinations 366 92 32 98 19 273 111
0.2713 -0.5535 0.6481 *** 0.4476 -0.7577 0.2943 0.1144 (0.2014) (0.6541) (0.2710) (0.3342) (0.9804) (0.2084) (0.2840)
N 37,236 1,543 1,960 5,194 1,258 13,901 6,400Objective*Month combinations 380 21 30 83 21 221 92
-0.0200 1.6517 *** -0.0588 -1.6472 * -1.3984 -0.7581 * 0.3308 (0.2437) (0.6194) (0.5454) (0.9767) (0.9400) (0.3977) (0.7661)
Table 7. Additional Specifications Predicting Media Mentions, 1997-2002Dependent variable: one if fund received media mention in month t and 0 otherwise
WSJ NYT Kiplinger's (Positive)
Kiplinger's (Negative)
SmartMoney (Positive)
SmartMoney (Negative)
Money 100
Matched sample excluding all load funds
Funds that started advertising in past six months vs. funds that did not start
Funds that stopped advertising in past six months vs. funds that did not stop
Linear Probabilty Model with objective by month fixed effects
Linear Probability Model in which we instrument own-publication advertising
Baseline fixed effects logit specification
Baseline logit + past media mentions in other publications
Matched sample - one non-advertiser fund matched to each advertiser fund

Notes:
Table 7. Additional Specifications Predicting Media Mentions, 1997-2002 (continued)
In Panels A, B, and C, each cell reports the estimated coefficient on the own-publication advertising variable. Panel A reports the results from our baseline specification in Table 6as well as from fixed effects logit specifications that include past media mentions in each of the other publications as control variables. Panel B constructs a matched sample. Foreach fund, we estimate the probability of receiving the mention ignoring own-publication advertising. For each advertiser fund, we then take the non-advertiser fund with the closestprobability as a match and estimate fixed effects logit specifications on the samples of advertiser funds and their matches. The bottom half of Panel B restricts the sample of fundsto no-load funds and then constructs the matched sample. In Panel C, we estimate our baseline fixed effects logit specification as a linear probability model using the same set ofinvestment objective-by-month fixed effects and the same set of observations. We then re-estimate the linear probability model instrumenting own-publication advertising in onepersonal finance publication with advertising in the other two personal finance publications (for example, instrumenting own-publication advertising in Money with advertising in Kiplinger's and SmartMoney).
In Panel D, each cell reports the estimated coefficient on a dummy variable that indicates whether fund i either started or stopped advertising in the publication within the past sixmonths. See the text for a description of how these dummy variables were defined and the corresponding samples were constructed. In Panel A through D, standard errors clusteron mutual fund family and are reported in parentheses. Significance at the 10-percent, 5-percent, and 1-percent levels are denoted by *, **, and ***.
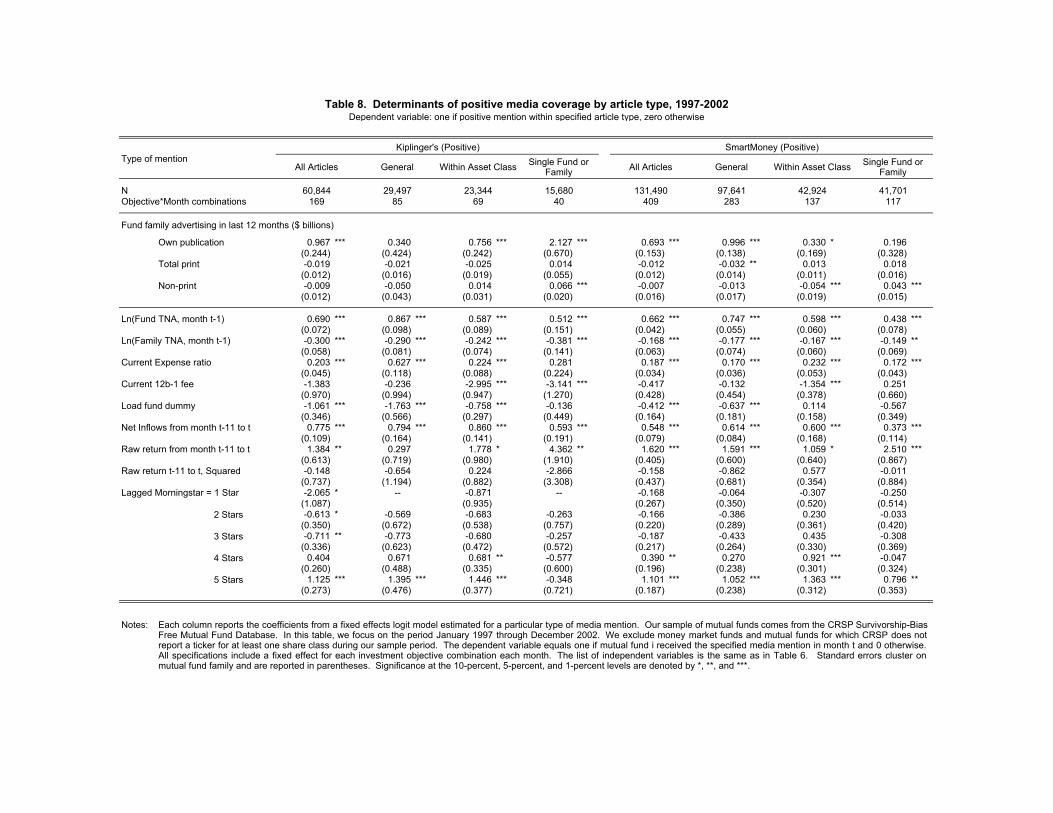
NObjective*Month combinations
Fund family advertising in last 12 months ($ billions)
Own publication 0.967 *** 0.340 0.756 *** 2.127 *** 0.693 *** 0.996 *** 0.330 * 0.196 (0.244) (0.424) (0.242) (0.670) (0.153) (0.138) (0.169) (0.328)
Total print -0.019 -0.021 -0.025 0.014 -0.012 -0.032 ** 0.013 0.018 (0.012) (0.016) (0.019) (0.055) (0.012) (0.014) (0.011) (0.016)
Non-print -0.009 -0.050 0.014 0.066 *** -0.007 -0.013 -0.054 *** 0.043 ***(0.012) (0.043) (0.031) (0.020) (0.016) (0.017) (0.019) (0.015)
Ln(Fund TNA, month t-1) 0.690 *** 0.867 *** 0.587 *** 0.512 *** 0.662 *** 0.747 *** 0.598 *** 0.438 ***(0.072) (0.098) (0.089) (0.151) (0.042) (0.055) (0.060) (0.078)
Ln(Family TNA, month t-1) -0.300 *** -0.290 *** -0.242 *** -0.381 *** -0.168 *** -0.177 *** -0.167 *** -0.149 **(0.058) (0.081) (0.074) (0.141) (0.063) (0.074) (0.060) (0.069)
Current Expense ratio 0.203 *** 0.627 *** 0.224 *** 0.281 0.187 *** 0.170 *** 0.232 *** 0.172 ***(0.045) (0.118) (0.088) (0.224) (0.034) (0.036) (0.053) (0.043)
Current 12b-1 fee -1.383 -0.236 -2.995 *** -3.141 *** -0.417 -0.132 -1.354 *** 0.251 (0.970) (0.994) (0.947) (1.270) (0.428) (0.454) (0.378) (0.660)
Load fund dummy -1.061 *** -1.763 *** -0.758 *** -0.136 -0.412 *** -0.637 *** 0.114 -0.567 (0.346) (0.566) (0.297) (0.449) (0.164) (0.181) (0.158) (0.349)
Net Inflows from month t-11 to t 0.775 *** 0.794 *** 0.860 *** 0.593 *** 0.548 *** 0.614 *** 0.600 *** 0.373 ***(0.109) (0.164) (0.141) (0.191) (0.079) (0.084) (0.168) (0.114)
Raw return from month t-11 to t 1.384 ** 0.297 1.778 * 4.362 ** 1.620 *** 1.591 *** 1.059 * 2.510 ***(0.613) (0.719) (0.980) (1.910) (0.405) (0.600) (0.640) (0.867)
Raw return t-11 to t, Squared -0.148 -0.654 0.224 -2.866 -0.158 -0.862 0.577 -0.011 (0.737) (1.194) (0.882) (3.308) (0.437) (0.681) (0.354) (0.884)
Lagged Morningstar = 1 Star -2.065 * -- -0.871 -- -0.168 -0.064 -0.307 -0.250(1.087) (0.935) (0.267) (0.350) (0.520) (0.514)
Lagged Morningstar = 2 Stars -0.613 * -0.569 -0.683 -0.263 -0.166 -0.386 0.230 -0.033 (0.350) (0.672) (0.538) (0.757) (0.220) (0.289) (0.361) (0.420)
Lagged Morningstar = 3 Stars -0.711 ** -0.773 -0.680 -0.257 -0.187 -0.433 0.435 -0.308 (0.336) (0.623) (0.472) (0.572) (0.217) (0.264) (0.330) (0.369)
Lagged Morningstar = 4 Stars 0.404 0.671 0.681 ** -0.577 0.390 ** 0.270 0.921 *** -0.047 (0.260) (0.488) (0.335) (0.600) (0.196) (0.238) (0.301) (0.324)
Lagged Morningstar = 5 Stars 1.125 *** 1.395 *** 1.446 *** -0.348 1.101 *** 1.052 *** 1.363 *** 0.796 **(0.273) (0.476) (0.377) (0.721) (0.187) (0.238) (0.312) (0.353)
Notes:
Type of mentionAll Articles General Within Asset Class
169 117137283409406985
Kiplinger's (Positive) SmartMoney (Positive)
41,701
Within Asset ClassGeneralAll Articles Single Fund or Family
Single Fund or Family
Table 8. Determinants of positive media coverage by article type, 1997-2002Dependent variable: one if positive mention within specified article type, zero otherwise
Each column reports the coefficients from a fixed effects logit model estimated for a particular type of media mention. Our sample of mutual funds comes from the CRSP Survivorship-BiasFree Mutual Fund Database. In this table, we focus on the period January 1997 through December 2002. We exclude money market funds and mutual funds for which CRSP does notreport a ticker for at least one share class during our sample period. The dependent variable equals one if mutual fund i received the specified media mention in month t and 0 otherwise.All specifications include a fixed effect for each investment objective combination each month. The list of independent variables is the same as in Table 6. Standard errors cluster onmutual fund family and are reported in parentheses. Significance at the 10-percent, 5-percent, and 1-percent levels are denoted by *, **, and ***.
60,844 29,497 23,344 15,680 131,490 97,641 42,924
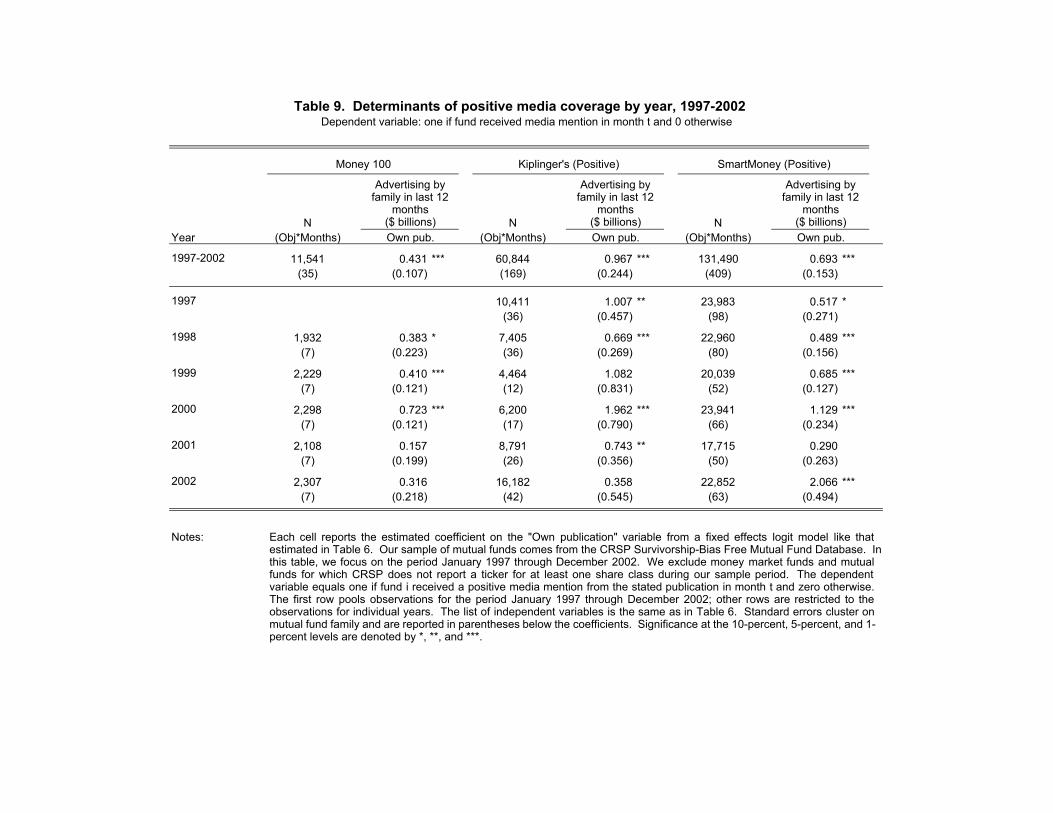
N N NYear (Obj*Months) (Obj*Months) (Obj*Months)
1997-2002 11,541 0.431 *** 60,844 0.967 *** 131,490 0.693 ***(35) (0.107) (169) (0.244) (409) (0.153)
1997 10,411 1.007 ** 23,983 0.517 *(36) (0.457) (98) (0.271)
1998 1,932 0.383 * 7,405 0.669 *** 22,960 0.489 ***(7) (0.223) (36) (0.269) (80) (0.156)
1999 2,229 0.410 *** 4,464 1.082 20,039 0.685 ***(7) (0.121) (12) (0.831) (52) (0.127)
2000 2,298 0.723 *** 6,200 1.962 *** 23,941 1.129 ***(7) (0.121) (17) (0.790) (66) (0.234)
2001 2,108 0.157 8,791 0.743 ** 17,715 0.290 (7) (0.199) (26) (0.356) (50) (0.263)
2002 2,307 0.316 16,182 0.358 22,852 2.066 ***(7) (0.218) (42) (0.545) (63) (0.494)
Notes:
Own pub. Own pub.
Table 9. Determinants of positive media coverage by year, 1997-2002Dependent variable: one if fund received media mention in month t and 0 otherwise
Each cell reports the estimated coefficient on the "Own publication" variable from a fixed effects logit model like thatestimated in Table 6. Our sample of mutual funds comes from the CRSP Survivorship-Bias Free Mutual Fund Database. In this table, we focus on the period January 1997 through December 2002. We exclude money market funds and mutualfunds for which CRSP does not report a ticker for at least one share class during our sample period. The dependentvariable equals one if fund i received a positive media mention from the stated publication in month t and zero otherwise.The first row pools observations for the period January 1997 through December 2002; other rows are restricted to theobservations for individual years. The list of independent variables is the same as in Table 6. Standard errors cluster onmutual fund family and are reported in parentheses below the coefficients. Significance at the 10-percent, 5-percent, and 1-percent levels are denoted by *, **, and ***.
Advertising by family in last 12
months ($ billions)
Money 100 Kiplinger's (Positive) SmartMoney (Positive)
Advertising by family in last 12
months ($ billions)
Advertising by family in last 12
months ($ billions)Own pub.
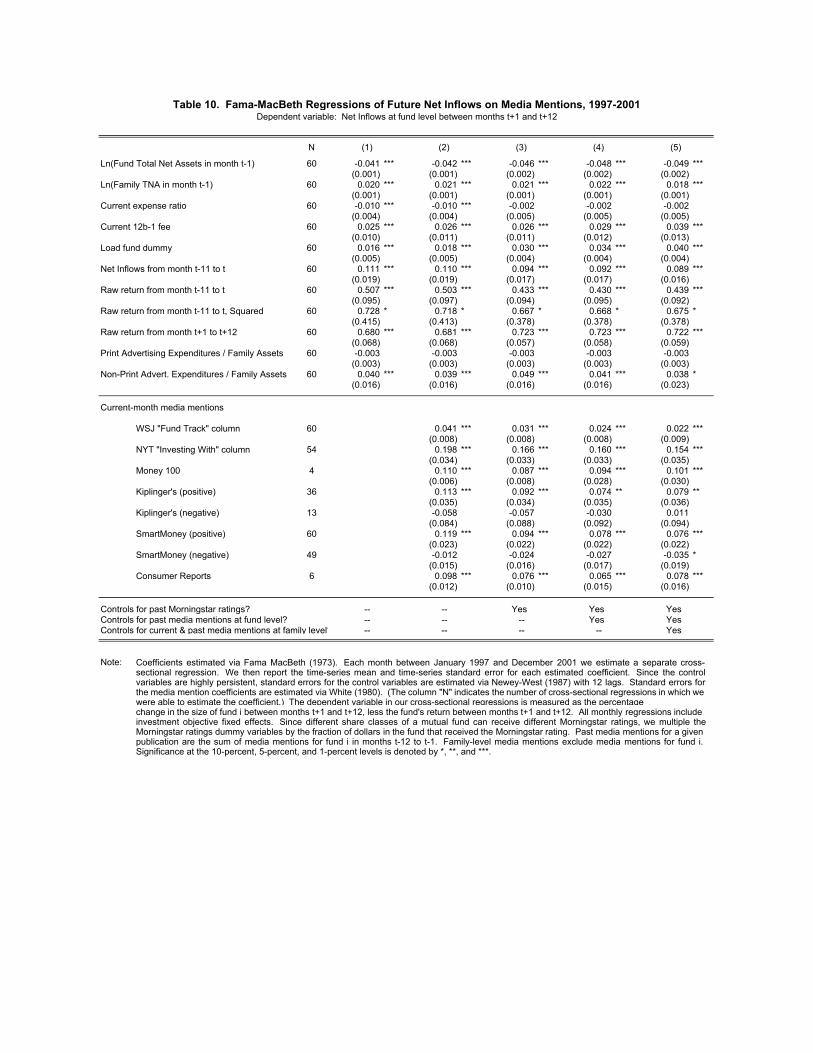
N
Ln(Fund Total Net Assets in month t-1) 60 -0.041 *** -0.042 *** -0.046 *** -0.048 *** -0.049 ***(0.001) (0.001) (0.002) (0.002) (0.002)
Ln(Family TNA in month t-1) 60 0.020 *** 0.021 *** 0.021 *** 0.022 *** 0.018 ***(0.001) (0.001) (0.001) (0.001) (0.001)
Current expense ratio 60 -0.010 *** -0.010 *** -0.002 -0.002 -0.002 (0.004) (0.004) (0.005) (0.005) (0.005)
Current 12b-1 fee 60 0.025 *** 0.026 *** 0.026 *** 0.029 *** 0.039 ***(0.010) (0.011) (0.011) (0.012) (0.013)
Load fund dummy 60 0.016 *** 0.018 *** 0.030 *** 0.034 *** 0.040 ***(0.005) (0.005) (0.004) (0.004) (0.004)
Net Inflows from month t-11 to t 60 0.111 *** 0.110 *** 0.094 *** 0.092 *** 0.089 ***(0.019) (0.019) (0.017) (0.017) (0.016)
Raw return from month t-11 to t 60 0.507 *** 0.503 *** 0.433 *** 0.430 *** 0.439 ***(0.095) (0.097) (0.094) (0.095) (0.092)
Raw return from month t-11 to t, Squared 60 0.728 * 0.718 * 0.667 * 0.668 * 0.675 *(0.415) (0.413) (0.378) (0.378) (0.378)
Raw return from month t+1 to t+12 60 0.680 *** 0.681 *** 0.723 *** 0.723 *** 0.722 ***(0.068) (0.068) (0.057) (0.058) (0.059)
Print Advertising Expenditures / Family Assets 60 -0.003 -0.003 -0.003 -0.003 -0.003 (0.003) (0.003) (0.003) (0.003) (0.003)
Non-Print Advert. Expenditures / Family Assets 60 0.040 *** 0.039 *** 0.049 *** 0.041 *** 0.038 *(0.016) (0.016) (0.016) (0.016) (0.023)
Current-month media mentions
WSJ "Fund Track" column 60 0.041 *** 0.031 *** 0.024 *** 0.022 ***(0.008) (0.008) (0.008) (0.009)
NYT "Investing With" column 54 0.198 *** 0.166 *** 0.160 *** 0.154 ***(0.034) (0.033) (0.033) (0.035)
Money 100 4 0.110 *** 0.087 *** 0.094 *** 0.101 ***(0.006) (0.008) (0.028) (0.030)
Kiplinger's (positive) 36 0.113 *** 0.092 *** 0.074 ** 0.079 **(0.035) (0.034) (0.035) (0.036)
Kiplinger's (negative) 13 -0.058 -0.057 -0.030 0.011 (0.084) (0.088) (0.092) (0.094)
SmartMoney (positive) 60 0.119 *** 0.094 *** 0.078 *** 0.076 ***(0.023) (0.022) (0.022) (0.022)
SmartMoney (negative) 49 -0.012 -0.024 -0.027 -0.035 *(0.015) (0.016) (0.017) (0.019)
Consumer Reports 6 0.098 *** 0.076 *** 0.065 *** 0.078 ***(0.012) (0.010) (0.015) (0.016)
Controls for past Morningstar ratings? -- -- Yes Yes Yes Controls for past media mentions at fund level? -- -- -- Yes Yes Controls for current & past media mentions at family level? -- -- -- -- Yes
Note:
Table 10. Fama-MacBeth Regressions of Future Net Inflows on Media Mentions, 1997-2001Dependent variable: Net Inflows at fund level between months t+1 and t+12
change in the size of fund i between months t+1 and t+12, less the fund's return between months t+1 and t+12. All monthly regressions includeinvestment objective fixed effects. Since different share classes of a mutual fund can receive different Morningstar ratings, we multiple theMorningstar ratings dummy variables by the fraction of dollars in the fund that received the Morningstar rating. Past media mentions for a givenpublication are the sum of media mentions for fund i in months t-12 to t-1. Family-level media mentions exclude media mentions for fund i.Significance at the 10-percent, 5-percent, and 1-percent levels is denoted by *, **, and ***.
Coefficients estimated via Fama MacBeth (1973). Each month between January 1997 and December 2001 we estimate a separate cross-sectional regression. We then report the time-series mean and time-series standard error for each estimated coefficient. Since the controlvariables are highly persistent, standard errors for the control variables are estimated via Newey-West (1987) with 12 lags. Standard errors forthe media mention coefficients are estimated via White (1980). (The column "N" indicates the number of cross-sectional regressions in which wewere able to estimate the coefficient.) The dependent variable in our cross-sectional regressions is measured as the percentage
(1) (2) (3) (4) (5)
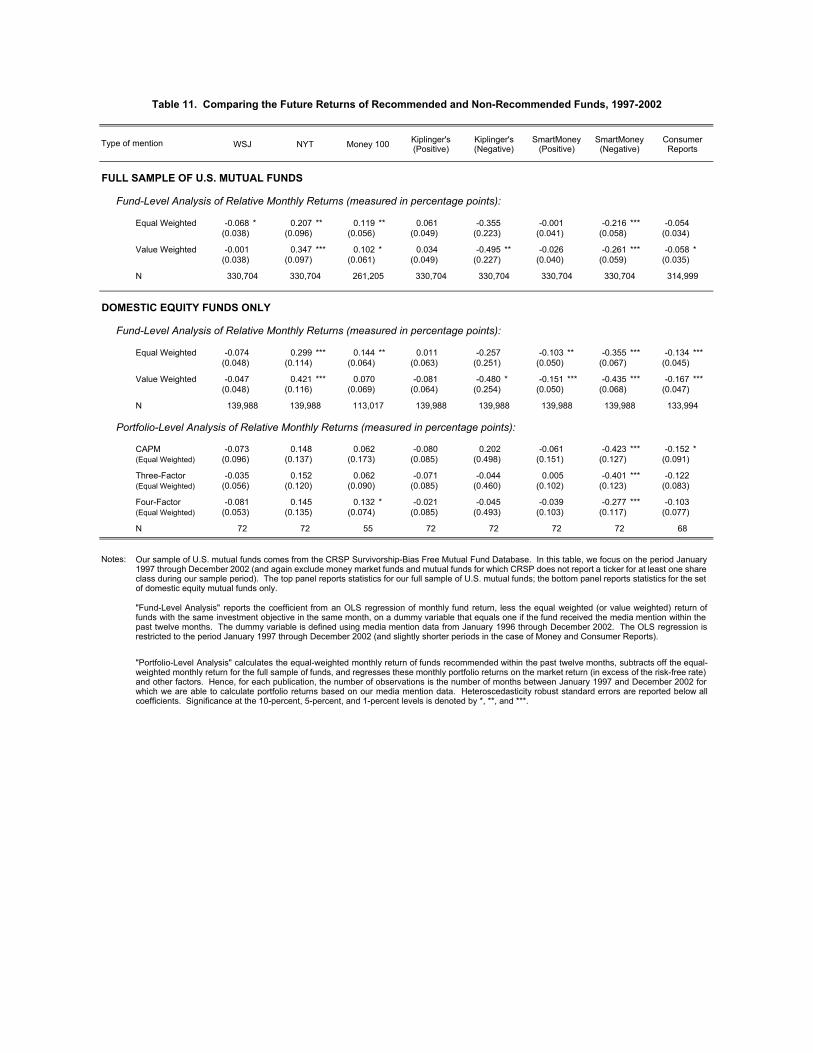
Type of mention
Fund-Level Analysis of Relative Monthly Returns (measured in percentage points):
Equal Weighted -0.068 * 0.207 ** 0.119 ** 0.061 -0.355 -0.001 -0.216 *** -0.054 (0.038) (0.096) (0.056) (0.049) (0.223) (0.041) (0.058) (0.034)
Value Weighted -0.001 0.347 *** 0.102 * 0.034 -0.495 ** -0.026 -0.261 *** -0.058 *(0.038) (0.097) (0.061) (0.049) (0.227) (0.040) (0.059) (0.035)
N
Fund-Level Analysis of Relative Monthly Returns (measured in percentage points):
Equal Weighted -0.074 0.299 *** 0.144 ** 0.011 -0.257 -0.103 ** -0.355 *** -0.134 ***(0.048) (0.114) (0.064) (0.063) (0.251) (0.050) (0.067) (0.045)
Value Weighted -0.047 0.421 *** 0.070 -0.081 -0.480 * -0.151 *** -0.435 *** -0.167 ***(0.048) (0.116) (0.069) (0.064) (0.254) (0.050) (0.068) (0.047)
N
Portfolio-Level Analysis of Relative Monthly Returns (measured in percentage points):
CAPM -0.073 0.148 0.062 -0.080 0.202 -0.061 -0.423 *** -0.152 *(Equal Weighted) (0.096) (0.137) (0.173) (0.085) (0.498) (0.151) (0.127) (0.091)
Three-Factor -0.035 0.152 0.062 -0.071 -0.044 0.005 -0.401 *** -0.122 (Equal Weighted) (0.056) (0.120) (0.090) (0.085) (0.460) (0.102) (0.123) (0.083)
Four-Factor -0.081 0.145 0.132 * -0.021 -0.045 -0.039 -0.277 *** -0.103 (Equal Weighted) (0.053) (0.135) (0.074) (0.085) (0.493) (0.103) (0.117) (0.077)
N
Notes:
"Portfolio-Level Analysis" calculates the equal-weighted monthly return of funds recommended within the past twelve months, subtracts off the equal-weighted monthly return for the full sample of funds, and regresses these monthly portfolio returns on the market return (in excess of the risk-free rate)and other factors. Hence, for each publication, the number of observations is the number of months between January 1997 and December 2002 forwhich we are able to calculate portfolio returns based on our media mention data. Heteroscedasticity robust standard errors are reported below allcoefficients. Significance at the 10-percent, 5-percent, and 1-percent levels is denoted by *, **, and ***.
Our sample of U.S. mutual funds comes from the CRSP Survivorship-Bias Free Mutual Fund Database. In this table, we focus on the period January1997 through December 2002 (and again exclude money market funds and mutual funds for which CRSP does not report a ticker for at least one shareclass during our sample period). The top panel reports statistics for our full sample of U.S. mutual funds; the bottom panel reports statistics for the setof domestic equity mutual funds only.
"Fund-Level Analysis" reports the coefficient from an OLS regression of monthly fund return, less the equal weighted (or value weighted) return offunds with the same investment objective in the same month, on a dummy variable that equals one if the fund received the media mention within thepast twelve months. The dummy variable is defined using media mention data from January 1996 through December 2002. The OLS regression isrestricted to the period January 1997 through December 2002 (and slightly shorter periods in the case of Money and Consumer Reports).
DOMESTIC EQUITY FUNDS ONLY
139,988 139,988 113,017 139,988 139,988 139,988
FULL SAMPLE OF U.S. MUTUAL FUNDS
330,704 330,704 261,205 330,704 330,704 330,704 330,704 314,999
WSJ NYT Money 100 Kiplinger's (Positive)
Kiplinger's (Negative)
SmartMoney (Positive)
SmartMoney (Negative)
Consumer Reports
68
Table 11. Comparing the Future Returns of Recommended and Non-Recommended Funds, 1997-2002
139,988 133,994
72 72 55 72 72 72 72
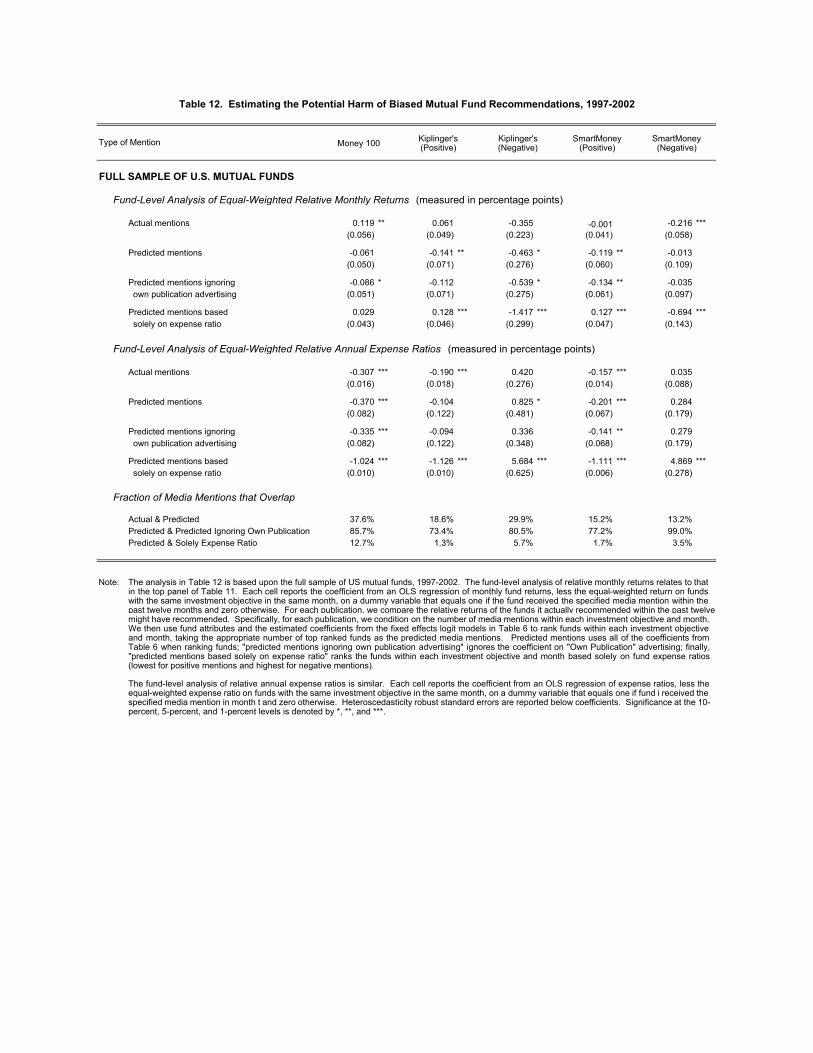
Type of Mention
Fund-Level Analysis of Equal-Weighted Relative Monthly Returns (measured in percentage points)
Actual mentions 0.119 ** 0.061 -0.355 -0.001 -0.216 ***(0.056) (0.049) (0.223) (0.041) (0.058)
Predicted mentions -0.061 -0.141 ** -0.463 * -0.119 ** -0.013 (0.050) (0.071) (0.276) (0.060) (0.109)
Predicted mentions ignoring -0.086 * -0.112 -0.539 * -0.134 ** -0.035 own publication advertising (0.051) (0.071) (0.275) (0.061) (0.097)
Predicted mentions based 0.029 0.128 *** -1.417 *** 0.127 *** -0.694 *** solely on expense ratio (0.043) (0.046) (0.299) (0.047) (0.143)
Fund-Level Analysis of Equal-Weighted Relative Annual Expense Ratios (measured in percentage points)
Actual mentions -0.307 *** -0.190 *** 0.420 -0.157 *** 0.035 (0.016) (0.018) (0.276) (0.014) (0.088)
Predicted mentions -0.370 *** -0.104 0.825 * -0.201 *** 0.284 (0.082) (0.122) (0.481) (0.067) (0.179)
Predicted mentions ignoring -0.335 *** -0.094 0.336 -0.141 ** 0.279 own publication advertising (0.082) (0.122) (0.348) (0.068) (0.179)
Predicted mentions based -1.024 *** -1.126 *** 5.684 *** -1.111 *** 4.869 *** solely on expense ratio (0.010) (0.010) (0.625) (0.006) (0.278)
Fraction of Media Mentions that Overlap
Actual & Predicted 37.6% 18.6% 29.9% 15.2% 13.2%Predicted & Predicted Ignoring Own Publication 85.7% 73.4% 80.5% 77.2% 99.0%Predicted & Solely Expense Ratio 12.7% 1.3% 5.7% 1.7% 3.5%
Note:
The analysis in Table 12 is based upon the full sample of US mutual funds, 1997-2002. The fund-level analysis of relative monthly returns relates to thatin the top panel of Table 11. Each cell reports the coefficient from an OLS regression of monthly fund returns, less the equal-weighted return on fundswith the same investment objective in the same month, on a dummy variable that equals one if the fund received the specified media mention within thepast twelve months and zero otherwise. For each publication, we compare the relative returns of the funds it actually recommended within the past twelve
The fund-level analysis of relative annual expense ratios is similar. Each cell reports the coefficient from an OLS regression of expense ratios, less theequal-weighted expense ratio on funds with the same investment objective in the same month, on a dummy variable that equals one if fund i received thespecified media mention in month t and zero otherwise. Heteroscedasticity robust standard errors are reported below coefficients. Significance at the 10-percent, 5-percent, and 1-percent levels is denoted by *, **, and ***.
might have recommended. Specifically, for each publication, we condition on the number of media mentions within each investment objective and month.We then use fund attributes and the estimated coefficients from the fixed effects logit models in Table 6 to rank funds within each investment objectiveand month, taking the appropriate number of top ranked funds as the predicted media mentions. Predicted mentions uses all of the coefficients fromTable 6 when ranking funds; "predicted mentions ignoring own publication advertising" ignores the coefficient on "Own Publication" advertising; finally,"predicted mentions based solely on expense ratio" ranks the funds within each investment objective and month based solely on fund expense ratios(lowest for positive mentions and highest for negative mentions).
FULL SAMPLE OF U.S. MUTUAL FUNDS
Table 12. Estimating the Potential Harm of Biased Mutual Fund Recommendations, 1997-2002
SmartMoney (Negative)Money 100 Kiplinger's
(Positive)Kiplinger's (Negative)
SmartMoney (Positive)


![RIsIng sun, settIng sun JAPAN’S UNCERTAIN FUTURE...[2] RIsIng sun, settIng sun The opinions expressed are as of March 2014 and may change as subsequent conditions vary. Rising Sun,](https://img.pdfslide.us/doc/110x75/5f4a67a266ab9f6ac847d668/rising-sun-setting-sun-japanas-uncertain-future-2-rising-sun-setting-sun.jpg)