Embed Size (px)
Citation preview
UNIVERSITA’ DEGLI STUDI DI PADOVA
DIPARTIMENTO DI SCIENZE DEL FARMACO
SCUOLA DI DOTTORATO DI SCIENZE MOLECOLARI
INDIRIZZO SCIENZE FARMACEUTICHE
CICLO XXV
DNA, VARIATIONS ON THE THEME
Direttore della scuola: Ch.mo Prof. Antonino Polimeno
Coordinatore d’indirizzo: Ch.mo Prof. Alessandro Dolmella
Supervisore: Ch.ma Proff.sa Claudia Sissi
Dottorando: Giuseppe Marson
31 Gennaio 2013


Dedicated to Maria Linda


TABLE OF CONTENTS
Abstract 1
Riassunto 3
1. Overview 5
1.1 Fundamentals of quadruplex Structures 5
1.2 Structural diversity 7
1.3 Biological interest on G-quadruplexes 12
1.4 Aptamer 14
1.5 Thrombin 17
1.6 Thrombin binding aptamers 22
2. Folding versus charge: understanding selective target recognition by
the thrombin aptamer 25
2.1 Introduction 25
2.2 Materials and Methods 27
2.3 Results 30
2.3.1 Characterization of aptamer folding 30
2.3.2 Binding of oligonucleotides to the human thrombin 34
2.3.3 Competition of single stranded oligonucleotides with thrombin aptamers
binding 37
2.3.4 Modulation of thrombin enzymatic activity by aptamers and unfolded
DNA 41
2.4 Conclusions 43

3. Molecular versatility of the quadruplex/duplex structure in the 29-mer Thrombin
Binding Aptamer 45
3.1 Introduction 45
3.2 Materials and Method 48
3.3 Results 51
3.3.1 Influence of the 5’ 3’ flanked sequences on the 29hTBA folding 51
3.3.2 Influence of the guanosine rich core on the aptamer folding 56
3.3.3 Binding analysis on 29hTBA and mutants to the human thrombin 59
3.3.4 Mapping the thrombin binding sites, a multiple characterization 63
3.3.5 Modulation of aptamer properties by sodium monovalent ion 69
3.4 Conclusions 76
4. Role of the loops on G-quadruplex flexibility 78
4.1 Introduction 78
4.2 Materials and Methods 80
4.3 Results 82
4.4 Conclusions 87
5. Synthesis of human nucleolin forms in Escherichia coli and its purification as G-
quadruplex binding protein 88
5.1 Introduction 88
5.2 Materials and Methods 92
5.3 Results 98
5.3.1 Purification of recombinant human nucleolin forms 98
5.3.2 ITC-based binding affinities for complex formation 102
5.4 Conclusions 104
6. Recognition of unmethylated H3K4(1-10) by Arabidopsis thaliana origin recognition
complex 1b: a functional and structural analysis of the complex 105
6.1 Introduction 105
6.1.1 PHD and BAH domains, molecular architecture
and functions 108
6.2 Materials and Methods 110
6.3 Results 114
6.3.1 Biochemical and bioinformatics evidences for
atORC1bPHD-BAH as H3K4Me0 reader 114
6.3.2 Structural basis of H3K4Me0 readout by atORC1bBAH-PHD 116
6.4 Conclusions 125
References 127
Appendix A. Abbreviations and symbols 130
Appendix B. Protein primary structures and numbering schemes 145


1
Abstract
Molecular biology's central dogma, laid down in 1950s, affirmed that genetic information
flows from DNA to RNA to protein synthesis. For a long time, the first element of this logic
scheme, DNA, was regarded as inactive molecule with the sole purpose to act as a repository
of genetic code. Indeed, the molecular dialogue between DNA and proteins has been
generally interpreted as an univocal relationship between an inert partner (nucleic acid) and
a versatile one (proteins), that remodels DNA as a clay object. Rather, has been emerged
that each kind of interactions between macromolecules requires a mutual structural
adaptation and chemical complementarity.
As in Kurosawa’s classic movie “Rashomon” (1950) the same central event, a heinous
crime, is recalled from the differing perspective of each character (a bandit, a samurai,
samurai’s wife and a woodcutter) this present study aims to highlight some different, but
complementary, aspects of the full dynamic repertoire of DNA macromolecules. In the first
part of this thesis, I will demonstrate that DNA, according to a peculiar three dimensional
arrangement, is not only a simple recipe for proteins production but something more. In
particular, I will focus on guanosine quadruplex structure, a not canonical B-form of DNA
could be described through multiple points of view.
On one side, synthetic guanosine quadruplex can act as “smart” biomolecules able to
recognize multiple targets, with potential implications both as diagnostic as well as
therapeutic agent. This short DNA/RNA sequences, called aptamers, according to a unique
molecular flexibility, are able to recognize and bind a broad range of targets with
specificities reminiscent those exhibited by antibodies. As working model, here I will
present a detailed characterization in vitro of not physiological guanosine rich sequences
able to bind human thrombin, a protein of physiological and pathological relevance. Our
research was aimed to describe the relative role of the structural modules composing their
molecular architecture. This allowed us to propose a structure activity relationship of
synthetic G quadruplex aptamers, in order to fully rationalize and optimize their binding
property.

2
On the other side, G-quadruplex forming sequences are also found in human genome. Some
of them have been described as unique biochemical on/off switch able to regulate
tumorigenic pathways.
In particular, the expression of the oncogene c-Myc is controlled through the formation of
non–B-form DNA structures within its promoter. The conformational shift of this promoter
between a transcription inactive form (G-quadruplex form) to an active one (a canonical
double strand form) is strictly regulated by several nuclear proteins. In the second section
I’ll present a study concerning the heterologous expression, the purification scheme of the
resulting products and the biochemical characterization of the functional domains of human
nucleolin, a nucleolar protein that is able to inhibit c-Myc oncogene transcription by a
peculiar recognition of its promoter in a G quadruplex form. This approach was pursued to
deeper clarify the mechanism of this binding event. Doubtless, this represents a promising
goal in order to develop new selective and effective chemotherapy drugs.
Although revolutionary, the idea that genetic information was encoded only by DNA
sequence, in a protein-free mechanism has been appeared definitely too simplistic. Indeed,
in organisms with nuclei chromosomal DNA is organized along with protein templates
(histones), forming a complex called chromatin. This is target of diverse array of
posttranslational modifications that modulate the interaction among chromatin-associated
proteins, which ultimately dictate dynamic transitions between transcriptionally active
(euchromatin) or transcriptionally silent chromatin states (heterochromatin). In the last
section, I will focus on the structural insights standing on the recognition event between a
modified histone N-terminal tail and a specialized ‘effector’ protein (ORC1b), generally
known for its role in pre-replication complex assembly.
The identification of the molecular details that clarify how distinct protein modules are able
to recognize specific histone modifications is a critical step to understanding how chromatin
dynamics influence fundamental DNA-templated processes such as transcription, DNA
recombination and DNA repair. In particular, our results identify the tandem PHD-BAH
domains of Arabidopsis thaliana ORC1b as a novel unmethylated-lysine-binding module,
thereby establishing the first direct link between histone methylation grade and the
epigenetic role of ORC1b, previously known as a transcriptional regulation factor only for a
series of specific interactions with silencing regulators.

3
Riassunto
Il dogma fondante della biologia molecolare afferma che le informazioni genetiche sono
decodificate attraverso un ordinato flusso logico, che parte dal DNA e passando attraverso il
RNA arriva alla sintesi proteica. Per lungo tempo, all’interno di questo assunto, il DNA è
stato esclusivamente considerato come il deposito biochimico delle informazioni genetiche.
Con un ottica totalmente differente, in questo lavoro di tesi di dottorato presenterò tre
aspetti, differenti ma complementari dell’intero repertorio funzionale del DNA.
La prima sezione di questa tesi è rivolta ad un dettagliato studio degli aptameri leganti la
trombina, ovvero sequenze non fisiologiche di DNA capaci di riconoscere selettivamente il
target proteico in funzione di una specifica conformazione formata da quartetti di
polideossiguanosine. Mediante una precisa caratterizzazione biofisica dei polimorfismi
strutturali e dei profili di legame abbiamo potuto proporre delle solide ipotesi sul ruolo degli
elementi modulari che ne compongono l’architettura molecolare, al fine di razionalizzare ed
eventualmente incrementarne la capacità di riconoscimento del substrato proteico.
Diversamente, porzioni di DNA capaci di autoassemblarsi in quartetti di guanosina sono
state identificate all’interno del genoma umano. Alcune tra queste sono state descritte come
straordinari interruttori biochimici capaci di regolare i processi tumorali. Nello specifico,
l’espressione dell’oncogene c-Myc è fortemente controllata attraverso la formazione di
strutture di DNA non canoniche all’interno del suo promotore.
Questo equilibrio conformazionale del promotore tra una forma inattiva trascrizionalmente
(struttura a quartetti di guanosina) ed una attiva (la canonica forma a doppia elica) è assistito
e modulato da svariate proteine nucleari. Nella seconda parte del mio lavoro di tesi
presenterò uno studio inerente all’espressione eterologa, la purificazione proteica del
prodotto ricombinante e la caratterizzazione biochimica dei domini funzionali della
nucleolina umana, una proteina nucleolare capace di inibire la trascrizione dell’oncogene c-
Myc attraverso un peculiare riconoscimento del suo promotore nella sua forma silente.
Questo approccio è stato perseguito al fine di porre le prime basi per l’identificazione del
meccanismo di riconoscimento proteina – DNA, fortemente implicato nella soppressione
tumorale.

4
Anche se rivoluzionaria, l’idea che le informazioni genetiche siano codificate solamente
all’interno della sequenza del DNA, secondo un meccanismo che contempla le proteine solo
come “lettori” di questo codice, appare un concetto decisamente desueto. Il DNA
cromosomiale, infatti, è organizzato su strutture proteiche (istoni) per le quali è stato esclusa
una funzione esclusivamente “strutturale”. E’ stato dimostrato, infatti, che tali proteine sono
soggette ad una serie di modifiche post trasduzionali che regolano attivamente l’attivazione
e l’inibizione della trascrizione del DNA. Nell’ultima sezione presenterò uno studio
finalizzato a chiarire i dettagli molecolari del riconoscimento tra un frammento istonico e i
domini funzionali dell’effettore atORC1b (origin recognition complex 1b di arabidopsis
thaliana).
L’identificazione dei meccanismi molecolari mediante i quali distinti moduli proteici
riconoscono le specifiche modificazioni istoniche rappresenta un passaggio chiave nella
comprensione di fondamentali processi cellulari come la trascrizione, la ricombinazione
cromosomiale e la riparazione del DNA.
Nello specifico, il nostro studio ha evidenziato come i domini PHD e BAH dell’ORC1b,
opportunamente combinati, possono agire come moduli di lettura del frammento N-
terminale dell’istone 3 nella sua specifica forma non metilata.
Tale evidenza, per la prima volta, dimostra una correlazione diretta tra il grado di
metilazione dell’istone e il ruolo epigenetico dell’ORC1b, precedentemente noto come
regolatore indiretto della trascrizione solamente in funzione di interazione specifiche con
fattori eterocromatinici.
5
1. Overview
1.1 Fundamentals of quadruplex structures
More than four decades before Watson and Crick proposed their structure for double helix
DNA [1] it had been known that guanosine derivates at millimolar concentrations forms
viscous gels in water. However it was only when the first X-ray diffraction data of 5’-
guanosine monophosphate gels was available (around fifteen years later) that this peculiar
behaviour could be explained. [2]
The three dimensional model shown that hydrogen-bonded tetramers of 5’-GMP were the
molecular basis for the gel formation phenomenon. This non canonical DNA arrangement,
adopted also by guanosine-rich DNA or RNA strands, was called Guanosine quadruplexes
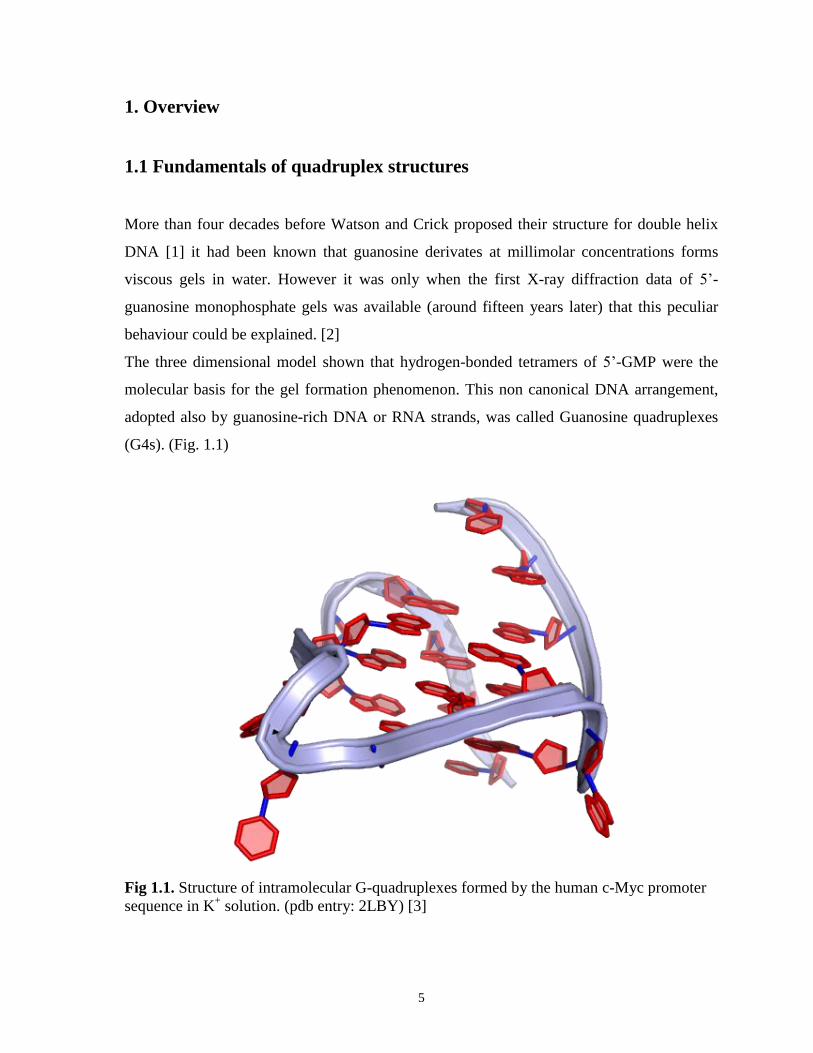
(G4s). (Fig. 1.1)
Fig 1.1. Structure of intramolecular G-quadruplexes formed by the human c-Myc promoter
sequence in K+ solution. (pdb entry: 2LBY) [3]

6
A G-quadruplex structure is formed by stacking of two or more guanine tetrads (or G-
tetrads), each of which made of four guanines assembled in a planar array stabilized by a
cyclic Hoogsteen hydrogen bonding network that involves N1, N7, O6 and N2 of each
guanine nucleobase (Fig. 1.2). [4-7] The formation of these structures requires the presence
of metal ions, especially alkali metals. The ions are placed in the central cavity between the
stacked quartets and they are coordinated by the electronegative carbonyl groups (O6) of
guanines, which point towards the core of G-tetrads. In particular, the coordination of
potassium, sodium and strontium adds both thermodynamically and kinetically to the
stability of G-quadruplexes structure.[8]
However, a number of other cations are also known to promote G-quadruplex formation.
It has been proved that G-quadruplexes are stabilized by the alkali series in the following
order: K+>>Na
+>Rb
+>Cs
+>>Li
+, and by the earth alkali series in the order:
Sr2+
>>Ba2+
>Ca2+
>Mg2+
, indicating that the atomic radii of potassium and strontium
(approximately 1.3 Å atomic radii) best fit in the coordination site between adjacent G-
tetrads. This property also defines the location of the cation with reference to the quartet
plane. [9]
Indeed, the larger potassium ion has been always found lied between stacked tetrads, almost
equidistant from the eight oxygen atoms, whereas the smaller sodium ion (approximately
1.18 Å atomic radii) can sit in the plane formed by guanosines.
Nonetheless, one should remember that in live systems, where the G-quadruplexes are
supposed to play a biological role, the free cations are dominated by few species whose
approximate concentrations can dramatically vary of several order of magnitude depending
on the biological district. ( e.g. K+ presents a concentration of 150 mM and 5.5 mM in intra-
and extra- cellular environment, respectively).
This wide range of conditions should be taken into account since each specific ionic strength
environment could tune the G-quadruplex folding in a specific way.

7
Fig 1.2. Overall view of guanine tetrad.
The guanine tetrad motif and its hydrogen bonding scheme reveal the hollow center that can
accommodate the positive charged metal.
Hoogsteen hydrogen bonding network is shown as orange dotted line.
1.2 Structural diversity
Despite an unifying definition, the most intriguing aspect of G-quadruplexes is their
extensive polymorphism in spatial arrangement, which can be influenced by several
structural features such as the number of strands involved, chain polarity, number of stacked
tetrads, variation of the glycosidic torsion angle and loops arrangement. [4, 10] This
structural polymorphism is dependent on the nucleic acid sequence (chain length, number of
guanosine tracts, loops length and composition, etc) and could be tuned by different counter
ions, the presence of binding partners and by the annealing conditions [11]. Quadruplexes
can be formed by one, two or four DNA or RNA strands giving a broad range of possible
8
combinations. (Fig. 1.4) This is referred to as strand stoichiometry and it can be sub-divided
in two groups, intermolecular (tetrameric (Fig. 1.4.a) or dimeric (Fig. 1.4.b)) or
intramolecular (monomeric (Fig. 1.4.c)) quadruplexes. Another source of structural
variability is the relative polarity direction of adjacent backbones. Irrespective of whether
they are part of the same molecule or not, the strands that constitute a G-quadruplex can
come together in four different ways. They can be all parallel (Fig. 1.4.a), three parallel and
one antiparallel (Fig. 1.5.d), adjacent parallel (Fig. 1.5.b), or alternating antiparallel
(Fig.1.5.a). Lately, in dimeric and monomeric G-quadruplexes, the nucleotide linkers
between guanosines involved in G-quartet can adopt a wide range of arrangement. These
loops can be classified into four major families: diagonal loops connecting two opposing
antiparallel strands (fig. 1.5.b), edgewise loops connecting two adjacent antiparallel strands
(fig. 1.5.a) and double-chain-reversal loops connecting adjacent parallel strands. (Fig. 1.5.c)
[12] The types of loops depend strongly on the size [13] and composition of the linkers. [14]
Diagonal loops can contain three or more residues. Instead, edgewise loops were observed to
contain at least two residues. Ultimately, double-chain-reversal loops were observed to
bridge two or three G-tetrad layers and contain from one to six residues.
In the matter of this structural issue Hazel et al [15] conducted a detailed and comparative
study of guanosine rich sequences defined by various loop lengths. He showed that
quadruplex formation could occur with sequences containing up to seven nucleobases in the
loops and accented how an increased number of bases decreased the stability of the
structure. They further demonstrated, using both molecular modeling and biophysics, that
very short loops (especially single-nucleobase loops) tend to promote a parallel
quadruplexes by a guanosine rich sequence, whereas longer loops favor anti-parallel
quadruplexes. Unpaired nucleobases, of the flexible loops, are able to form stacking
interactions with the guanine tetrad adjacent to the loop, joining the interaction network that
defines the thermodynamic properties of the entire structure.
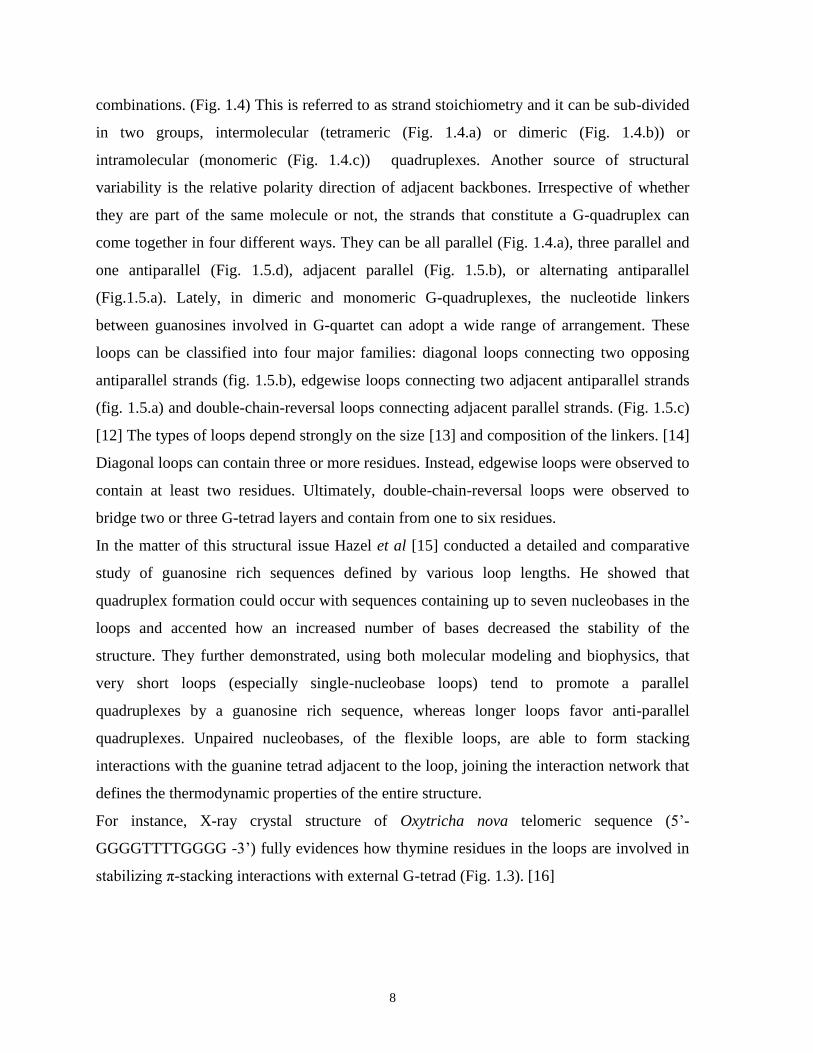
For instance, X-ray crystal structure of Oxytricha nova telomeric sequence (5’-
GGGGTTTTGGGG -3’) fully evidences how thymine residues in the loops are involved in
stabilizing π-stacking interactions with external G-tetrad (Fig. 1.3). [16]
9
.
Fig 1.3. Crystal structure of the Oxytricha telomeric DNA (pdb code: 1JPQ) [16] at 1.6 Å.
Thymidine residues (evidenced in grey) in the loop promote a stabilization of the guanosines
forming the G tetrad.
No rigorous rules or algorithms are able to predict quadruplex fold for a given
oligonucleotidic sequence, and several examples of oligonucleotides that fold in different
structures are reported in literature. In particular, it has been observed that a crucial role in
determining three-dimensional structure is played by metal ions or molecular crowding
agents. [9] For example, the folding topology of guanosine rich human telomeric DNA
sequence in K+ solution is different from that in Na
+ solution [17, 18], while the equivalent
Oxytricha telomeric sequence adopts the same fold in the presence of either K+ or Na
+
cations. [16]

10
Fig.1.4: Various strand stoichiometries of G-quadruplex structures.
(a) Four separate strands produce a tetrameric G-quadruplex.
The structure of the parallel-stranded tetraplex formed by the hexanucleotide
d[TG4T] in a Na+-containing crystal. (pdb entry: 244D) [19]
(b) Two strands give a dimeric G-quadruplex
Crystal structure of the potassium form of the Oxytricha nova telomeric sequence
d[GGGGTTTTGGGG].(pdb entry: 1JPQ) [16]
(c) A one-stranded structure yields a intramolecular G-quadruplex.

11
Fig.1.5: Different strand connectivity for intramolecular guanine tetrad structures.
(a) All three loops run edgewise and connect adjacent-adjacent-adjacent strands.
Structure of the 15mer thrombin binding aptamer d[GGTTGGTGTGGTTGG] in K+
solution. (pdb entry: 148D) [20]

12
(b) One diagonal and two edgewise loops that connect adjacent-diagonal-adjacent
strands. Structure adopted by the human telomeric sequence d[AGGG(TTAGGG)3]
in Na+ solution.(pdb entry: 143D) [21]
(c) All three double chain reversal loops that connect adjacent-adjacent-adjacent
strands.
Structure adopted by the human telomeric sequence d[AGGG(TTAGGG)3] in a K+-
containing crystal. (pdb entry: 1KF1) [22]
(d) One double chain reversal and two edgewise loops that connect adjacent-
adjacent-adjacent strands. Structure of the hybrid-1 type intramolecular G-
quadruplex formed by a 26-nt sequence d[AAAGGG(TTAGGG)3AA] that contains
the wild-type 22-nt four-G-tract human telomeric core sequence with modified
flanking sequences in K+ solution. (pdb entry: 2HY9) [23]
1.3 Biological interest on G-Quadruplexes
The scientific interest on these non-canonical DNA forms has been ignited since it has been
demonstrated that guanosine rich motifs are widely dispersed in eukaryotic genomes. [24-
26] Genome-wide sequence analyses using G-quadruplex signature sequences have revealed
important information on the occurrence and location of potential quadruplex sequences
(PQS). [27] Both prokaryotic and eukaryotic genomes from yeast to human are rich in
PQSs. The human genome, for instance, contains as many as 376 000 PQSs. [27] Although
the occurrence of PQSs in genomes is a third less than expected by chance, their location is
non-random and seems to correlate with functional genomic domains.
However although as many guanosine rich nucleic acid sequences are capable of forming G-
quadruplexes in vitro, one wonders how these structures could be plausible within cells.[28]
The first direct evidence for the presence of G-quadruplex DNA structures in vivo came
from studies performed with antibodies devoided to detect intermolecular G-quadruplex
structures at ciliate telomeres.[29] These genomic segments, are located at the ends of
chromosomes, consist of double stranded G-rich stretches repetitions (e.g. 5’-TTAGGG-3’
in humans and 5’-TTTTGGGG-3’ in Oxytricha) ending with a 3’ overhang at the G-rich
strand. They have propensity to form G-quadruplex structures.[30] In somatic cells at each
cellular replication telomere shortening occurs and this is used to define life of healthy cell

13
[31]. This shortening can be compensated by the synthesis of the repeat sequences at the 3‘
end of the chromosomes by the ribonucleoprotein telomerase. Such an activity is involved in
the immortalization of tumor cells. Formation of G-quadruplexes at telomere ends could, in
principle, prevent extension of 3’ overhangs and consequently suppress immortality of
cancer cells. This hypothesis, primarily, has triggered the interest on G-quadruplexes, as
important chemotherapeutic target, stimulating great effort in the study of small molecules
that lead to their stabilization.[32]
One other piece of evidence, for G-quadruplex formation in physiological conditions, comes
by the detection of proteins with significant biological activities, such as helicases and
nucleases, which bind specifically to this peculiar structures. [33]
Finally, a significant developments occurred in 2002 when Hurley and co-workers [34]
reported in vivo evidence for the structure and function of G-quadruplex in a gene-promoter
region within human cells. This intramolecular G-quadruplex, made up of a 20–30 base-pair
region, was specifically targeted and stabilized by a specific G-quadruplex binder small
molecule, which resulted in transcription repression of the c-Myc oncogenic protein. [35]
In nature, putative G-quadruplex forming sequences were found also in other regions of
biological interest such as in the immunoglobulin switch regions, upstream of the insulin
gene, in the retinoblastoma susceptibility gene and prominently in the promoter regions of
oncogenes, such as c-Kit, HIF-1α, Rb, BCL-2, VEGF, H-Ras, N-Ras, K-Ras and RET. [36]
All those findings suggest that G-quadruplex DNA may play a central role in several
biological events, such as telomere maintenance, telomere capping, replication fork
progression, chromosome organization, regulation of gene expression and recombination
that immunoglobulin heavy chains undergo to bring different constant regions next to
variable regions during the differentiation of B lymphocytes. [26] In addition, severe
pathological conditions like cancer, fragile X syndrome, bloom syndrome, Werner syndrome
and Fanconi anemia are related to genomic defects that involve G-quadruplex forming
sequences. [24, 37, 38] Although an extensive biological involvement of G4 structures, the
interest on those non-canonical DNA forms cannot be run out without considering their
further role in a plethora of areas ranging from structural biology and supramolecular
chemistry to nanotechnology and medicinal chemistry [39, 40]. For example, in regard of
this last branch, some artificial G-rich oligomer sequences, capable to build G-quadruplexes,

14
possess interesting biological activities, such as anticoagulant, anticancer and anti-HIV
agents. [40]
1.4 Aptamers
The use of nucleic acids as drugs represents a consistently growing approach. Different
therapeutical strategies take advantage of the biological and biophysical properties of DNA
and RNA to properly modulate activity of selected targets. During the last twenty years, this
has led to the theoretical and experimental development of oligonucleotide aptamers.
Aptamers are not physiologic DNA- or RNA-based oligonucleotides (with a molecular
weight of 5–26 kDa), which are able to recognize with high affinity and specificity a wide
range of natural and synthetic targets such as small organic molecules, peptides, proteins and
even cells. [41-43]
This target versatility is achieved by their structural flexibility which allows them to assume
distinct folding depending upon their sequence and/or environment. [44] These
oligonucleotides are normally selected by a powerful combinatorial and iterative
methodology, called SELEX (Systematic Evolution of Ligands by EXponential enrichment),
which fishes out, from an oligonucleotide random pool, the ligands which show high affinity
to a desired target.[45] Accordingly, aptamers demonstrated a wide range of applications not
only in therapeutic but also in analytical and clinical diagnostic fields.
They are object of interest for several reasons:
Aptamers are important as novel bio-recognition elements, evidencing a wide
versatility in affinity sensing applications, as immobilised ligands or in homogeneous
assays. The use of aptamers as bio-transducers brought to the development of
acoustic and optical sensors, cantilever-based biosensors and diagnostic tools. [46-
48]
DNA/RNA aptamers may themselves act as therapeutics, with potential applications
as anticoagulants, antivirals, antirheumatics and antiproliferative agents. For
instance, the first RNA aptamer based drug, Macugen (Pegaptanib sodium) has been

15
approved by the US FDA in December 2004. This nucleic acid based drug is been
currently used for patients affected by age-related macular degeneration (AMD), a
pathology which induces a progressive loss of visual acuity due to an aberrant
regulation of angiogenesis. [49]
Finally, aptamers represent interesting DNA/RNA model systems to investigate bio
macromolecular recognition.
In 2004 Breaker et al. first provided the evidence that also inside the cell we can find
some examples of physiological “aptamers”. Those structures are RNA regulatory
elements called riboswitches where the plastic structure of specific polynucleotides
ensures high affinity toward small metabolites. [50]
Although guanosine quadruplex structures is not a conditio sine qua non for DNA aptamer
architecture, representing just one of several possible options of folding adopted, a
conspicuous number of G4-based aptamers are reported in literature. This finding highlights
the role of this peculiar structure in target-DNA recognition.[51]
Compared to conventional drugs, aptamers can be theoretically used in any disease for
which blockade of pathogenic protein–protein interactions is required, either with an
inhibition effect (for example, aptamer against HER3 [52]) or with an agonistic-like action
(e.g., DNA aptamer to isoleucyl tRNA synthetase [53]). Aptamers possess several
advantages over other therapeutic agents such as monoclonal antibodies. First, production of
aptamers does not rely on biological systems since they are produced chemically in a readily
scalable process with low batch-to-batch variability. Second, aptamers are quite thermally
stable and can be denatured and renatured multiple times without significant loss of activity.
Third, aptamers do not show a remarkable immune response and their activity can be easily
controlled by the addiction of complementary DNA-RNA strands, controlling agents which
selectively bind and neutralize the active oligonucleotides. [54] Lastly, conjugation
chemistry for the attachment of various imaging labels or functional groups to aptamers are
orthogonal to nucleic acid chemistry, hence they can be easily introduced during aptamer
synthesis. On reverse, the main drawbacks related to the use of DNA aptamers as
16
therapeutics include a potentially weaker binding to targets than antibodies, unpredictable
toxicity and a poor pharmacokinetic profile given by their susceptibility to serum
degradation and by a faster excretion than antibodies due to smaller size and a generally
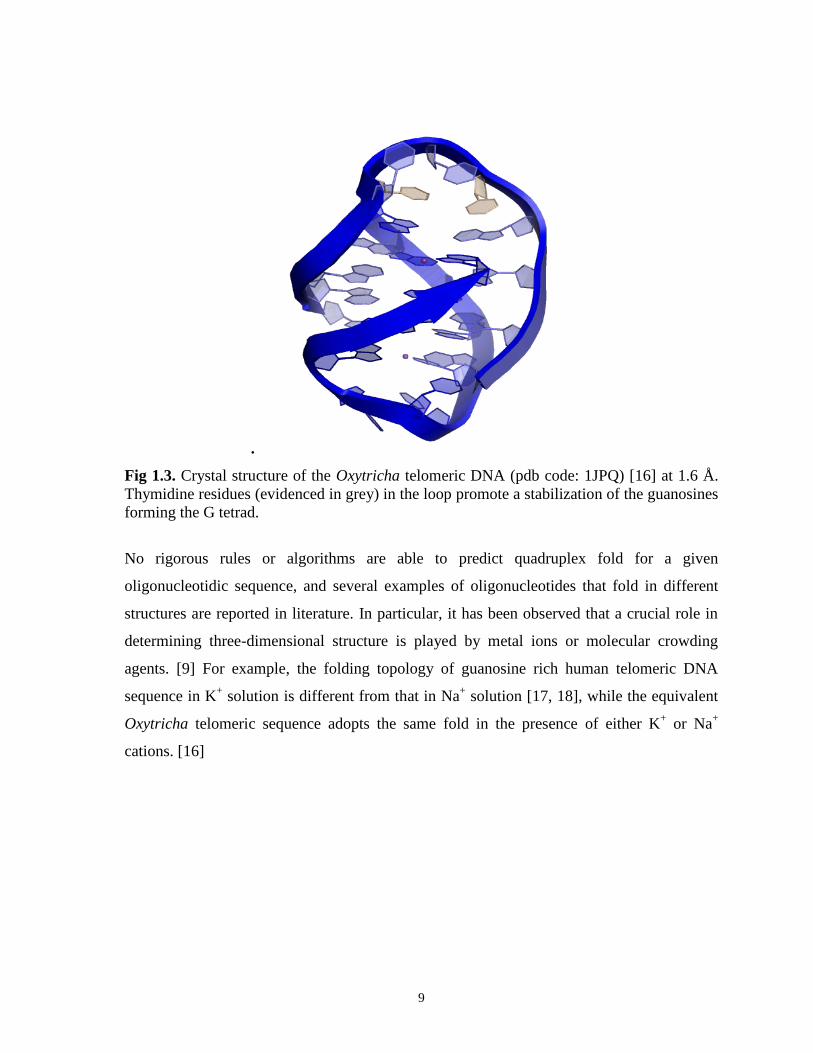
higher hydrophilicity. The nuclease-mediated degradation can be easily overcome by
introducing chemical modifications on the nucleoside’s scaffold, for example at the
phosphoribose backbone (as 2′-deoxy-2’-amino pyrimidines, 2′-fluoro pyrimidines and 2′-O-
methyl ribose purines and pyrimidines) or at nucleobases (for example, at 5-position of
uridine) and by inserting not natural inter-nucleotide linkages such as phosphorothioate
linkages (Fig. 1.6).
Conversely, to overcome the problem of bioavailability and thus reduce the rates of renal
filtration several strategies have been proposed, such as attacking high molecular mass
polyethylene glycol (PEG) or cholesterol at the 5′-terminus. [41]
The previous optimization strategies are aimed at ensuring enhanced accessibility of tailor-
made aptamers for use in specific applications, where the unique properties of aptamers can
be taken be taken advantage of.
Fig. 1.6: Examples of modified nucleotides used to reduce nucleic acid degradation by
nucleases.

17
1.5 Thrombin
Although, there are no scientific evidences that thrombin physiologically interacts with
nucleic acids, its remarkable spectrum of biological activities made it one of the first
biological macromolecule selected for the development of specific aptamers via SELEX.
[55]
Thrombin is a multifunctional serine protease that plays a pivotal role in the coagulation
cascade and in wound healing by exerting two important and paradoxically opposing
functions. [56, 57]
It acts as a procoagulant factor when it cleaves soluble fibrinogen into insoluble
polymerogenic fibrin, the main constituent of blood clot. [58, 59] This function is reinforced
and amplified by activation of coagulation factors produced by a thrombin-mediated
cleavage. Relevant examples are:
the activating cleavage of tranglutaminase FXIII which stabilizes the nascent fibrin
clot by crosslinking adjacent fibrin monomers through ε-(γ-glutamyl) lysine bonds.
the inhibition of fibrinolysis by the activation of thrombin-activated fibrinolysis
inhibitor (TAFI).
the proteolytic feedback activation of the serine protease factor XI and the cofactors
V and VIII.
In addition, in human, thrombin promotes platelets activation and aggregation by
specific recognition and cleavage of protease activated receptors (PARs) 1 and 4, a
member of seven transmembrane receptors. PAR1 is the primary thrombin substrate
on platelets surface and picomolar thrombin concentrations are required for effective
activation. Its action is reinforced by PAR4 whose activation occurs only at high
thrombin concentrations (>10 nM). [59]
Besides procoagulant stimuli, thrombin can also promote an anticoagulant response through
activation of protein C. This property results under the allosteric control of the cofactor
thrombomodulin, a receptor on the membrane of endothelial cells. [58]
Upon binding to thrombomodulin, the ability of thrombin to cleave fibrinogen and PAR1 is
suppressed, but its recognition for the zymogen protein C increases >1000-fold.

18
Upon thrombin-mediated clavage protein C is activated in this form. It attenuates the
coagulant pathway by cleaving factors Va and VIIIa and by down-regulating the two
cofactors Xa and IXa, which are required for thrombin generation, thereby shooting down
the blood coagulation system.
Moreover, thrombin downregulation and clearance in plasma can also be achieved by
irreversibly inactivation via the serine protease inhibitors (serpin), such as antithrombin III
with the assistance of heparin, the thrombin-specific heparin cofactor II (HCII) and protease
nexin I (PNI).
The pharmacological complexity of the “living enzyme of my blood”, as thrombin was
defined by Walter Seeger [60], could not be reduced to a balance between procoagulant and
anticoagulant properties. Indeed, it plays a crucial role at the interface between coagulation
cascade, inflammation and cell proliferation. In addition, this protease has been implicated
in angiogenesis, evidencing a role in the growth and in the metastatic diffusion of cancer as
well as in the muscle development.
Human α thrombin is generated from its inactive precursor, prothrombin (factor II), which is
produced in the liver (normal human plasma concentration 5–10 mg/dL). Its activation
requires the temporary formation of prothrombinase complex, composed by factors Va, Xa,
Ca2+
and membrane phospholipids.[61] The resulting active protein is a dimer composed of
a light polypeptide chain (A chain, 36 residues, MW ~6 kDA) and a heavy chain (B chain,
259 residues, MW ~31 kDa), covalently linked through a disulfide bond (Cys9-Cys119).
(Fig. 1.7) [56]
The B chain, which presents the typical serine protease fold, composed of two adjacent β-
barrels, carries the functional domains of the enzyme and accommodates the catalytic triad
(histidine 57, aspartic acid 102 and serine 195) inside the active site cleft (Fig. 1.7). The
walls of the active site are formed by the two loops (60-loop and γ-insertion loop), involved
in restricting and regulating the access of substrates to the catalytic region.

19
Fig. 1.7: X-ray structure of human thrombin (pdb code: 1HUT [15]). Portions corresponding
to heavy (yellow) and light (purple) chains are evidences.
The catalytic triad in the active site was highlighted.
Thrombin-binders recognition occurs at two positive charged patches, named exosite I and
II, which are present on the surface of the protease in near-opposition with reference to the
enzyme catalytic site. (Fig 1.8) The presence of these distinct functional epitopes on its
surface allows a fine regulation of its catalytic functions by multiple interactions with
substrates, inhibitors and effectors (Fig. 1.8). The exosite I is predominantly involved in the
electrostatic steering of fibrinogen, thrombin physiological substrate, toward the cleavage
site. Contemporaneously, it acts as binding domain for both procoagulant substrates (Factor
V and VIII, PAR1 and 4) and potent inhibitors such as thrombomodulin, heparin cofactor II
and hirudin. [62] Fewer ligands are directed toward exosite II. In accordance to the
significant presence of positively charged residues on its surface, this is the protein domain
that interacts with polyanionic macromolecules like glucosaminoglycans (GAGs), such as
heparin, heparan sulphate and dermatan sulphate.[63] The interaction between these
negative charged chains and thrombin is fully ionic in nature and is required to bridge
antithrombin III (ATIII - the major physiological inhibitor of thrombin) to thrombin, thus

20
promoting the inhibition of the coagulation cascade. Exosite II is also the platform for
thrombin interaction with platelet receptors GpIb and the γI fibrinogen chain. More recently,
a role for the Na+ ion as allosteric modulator was evidenced.[64] This ion drives the enzyme
from a slow activity form (Na+ free) to a fast activity form (Na
+ bound). The slow and fast
forms are both significantly (2:3 ratio) populated under physiologic conditions because the
Kd for Na+ binding is 110 mM at 37 °C and the [NaCl] concentration in the blood (140 mM)
is not sufficient to saturate thrombin. The slow form shows an intrinsic anticoagulant nature,
defined by a prolonged clotting time, a reduced platelet activation time and a higher
specificity for protein C (the major component of the down regulation pathway of thrombin)
in comparison to the natural substrate, the fibrinogen. On the opposite, the Na+ bound form
shows procoagulant properties. This conformation shows an enhanced affinity for fibrinogen
and protease platelet receptors (PARs), responsible for the promotion of platelets activation.
Fig. 1.8: X-ray structure of human thrombin (pdb code: 1HUT [15]). Surfaces corresponding
to exosite I and II are evidences.
Surfaces charges are evidenced on the exosites surfaces (blue positive charges, red negative
ones).
Examples of site selective substrates, effectors and inhibitors with pro-coagulant (in bold) or
anticoagulant (in italic) properties are indicated.

21
Thrombin generation is finely regulated to locally achieve rapid restoration of vascular
integrity after injury, without causing aberrant systemic thrombosis. In the absences of
efficient and timely controlled thrombin generation, stable blood clots cannot form, resulting
in hemorrhage. Conversely, uncontrolled thrombin activity produces an excessive
coagulation, resulting in dissemination of the clot beyond the site of vessel damage
obstruction of normal blood flow. This causes thrombosis and related diseases, which are
among the main causes of mortality in western countries. The capability of regulating the
pathological activity of thrombin in vivo by synthetic compounds is an important goal in
prevention and treatment of thrombovascular diseases. Anticoagulants include both indirect
and direct inhibitors of thrombin enzyme.[65] The indirect inhibitors (Antithrombin
dependent) act by favoring the binding of thrombin to SERPINs (SERine Protease
INhibitors), which irreversibly suppress thrombin activity. This last mechanism is that by
which heparin acts, binding thrombin at exosite II and promoting the formation of the
complex between thrombin and a SERPIN, antithrombin. Such inhibitors are heparins
(unfractionated heparin (UFH) and low-molecular-weight heparins (LWMHs)) and the
synthetic pentasaccharide. Differently, the direct inhibitors (Antithrombin independent)
interact with the procoagulant enzyme’s active site or an exosite blocking its protease
activity. Direct inhibitors of coagulation being clinically tested include hirudin, hirulog,
bivalirudin, argatroban, melagatran and the oral prodrug ximelagratan (H37695). This last
category has several potential advantages over heparin: They can inhibit thrombin bound to
clots or extracellular matrices, which are relatively resistant to heparin and do not require
antithrombin III as a cofactor, which may lead to a more predictable dose response. Despite
its phenomenal success, current anticoagulation therapy suffers from the risk toward serious
bleeding, since exists a direct correlation between the intensity of anticoagulation action and
severity of bleeding.
Hence, the discovery of new molecules capable of modulating thrombin activity represents a
compelling challenge for the development of more effective and safer anticoagulant
strategies.

22
1.6 Thrombin binding aptamers
An innovative drug-like scaffold used to target thrombin is represented by DNA.
In particular, oligonucleotide aptamers have been ignited the attention of scientific
community according to their thrombin recognition ability.
The first identified thrombin binding aptamer was a 15-mer DNA selected with the iterative
SELEX technique from a random pool of 60mers, the sequence of which is
5'-GGTTGGTGTGGTTGG-3' (15fTBA, Fig. 1.9 ). [55]
According to the behaviour of other G-rich sequences, in the presence of monovalent ions
like K+ this sequence folds intramolecularly to adopt a G-quadruplex structure [66, 67]. This
consists of two overlapped planes each deriving from the pairing of four guanines through
reverse Hoogsteen hydrogen bonding (G-tetrads). In particular, as confirmed by NMR [20]
and X-ray crystallography [68], this aptamer, in the presence of potassium ions, adopts an
anti-parallel chair structure containing two G(syn)-G(anti)-G(syn)-G(anti) quartets and three
lateral loops, two minor TT loops on one side and a major TGT loop on the opposite side
(Fig. 1.9). [69, 70]. This highly ordered folding of the oligonucleotide is induced by
thrombin as well, which acts as a chaperone prompting G-quadruplex formation also in the
absence of stabilizing monovalent ions.[71, 72]
Fig 1.9: (a) Schematic representation of 15mer thrombin binding aptamer (15fTBA). (b) The
crystal structure of the intramolecular quadruplex formed by the 15mer thrombin binding
aptamer (PDB entry: 148D). Overall topology is indicated by the ribbon representation in
blue. The guanosines forming the two stacked tetrads are evidenced in black.

23
Despite the great importance of 15fTBA in diagnostic and therapeutic field for both
detection and inhibition of α-thrombin. a clear picture of the structural insights describing
the DNA-protein complex is still missing. A plausible but not controversial model
describing the structure of the protein-aptamer complex has been solved, only recently, by
X-ray diffraction [73]. The crystal structure confirms that the 15fTBA does not interact
directly with the protein catalytic site. Otherwise, it preferentially recognizes the positively
charged exosite I with the two shorter TT loops, largely through salt bridges. Conversely,
the major TGT loop is not involved in thrombin binding and only marginally participates to
the binding through not specific stabilizing interactions.
Ionic and hydrophobic interactions occur at protein-DNA binding interface. In details, a
stabilizing electrostatic network involves the protein residues Arg 75, Glu 77, Asn 78 and
Tyr 117. (Fig. 1.10)
Conversely, tyrosine 76 and isoleucine 79 interact with minor loop nucleobases via
hydrophobic interactions. (Fig. 1.10)
Fig 1.10: Representation of the crystallographic proposed models of thrombin-TBA
complex (pdb entry: 4DII). [73] Thrombin molecule is shown as cartoon with heavy chain in
yellow and light chain in violet. 15fTBA is shown in blue cartoon. Residues involved in the
binding are evidenced.

24
In 1997 Tasset et al [74] isolated a 29-residues DNA aptamer which showed an incremented
binding affinity for human thrombin. It presents the sequence: 5’-
AGTCCGTGGTAGGGCAGGTTGGGGTGACT -3’ (29hTBA). The underlined sequence
corresponds to a 15-nucleotide core (15hTBA) which clearly remember the 15fTBA.
Distinctly from 15fTBA, 29hTBA contains a 5’ and 3’ terminal chains that can form a
Watson Crick duplex connected by two 3-base bulges to a 15-mer G-quadruplex core to
produce a quadruplex/duplex mixed structure. (Fig. 1.11) Although, no structural
information concerning this aptamer is available. It was supposed that the G-quadruplex
conformation of the aptamers could be functional to properly display the loops, which were
considered involved in selection of aptamer-protein interactions.
Interestingly, for this sequence emerged a peculiar thrombin binding selectivity (described
in a conspicuous number of scientific works), directed toward heparin binding exosite
(exosite II).[74]
Fig. 1.11: Schematic representation of 29mer thrombin binding aptamer (29hTBA).
Upon protein binding both aptamers inhibit thrombin-catalyzed fibrin clot formation in
vitro, thus they are equally relevant from a pharmacological point of view. Nevertheless, the
molecular mechanisms leading to the biological activity presumably is distinct. Clinical
applications of the above aptamer sequences are hampered by their extremely short in vivo
half-life. [75, 76] Several modifications can be introduced to overcome this poor
pharmacokinetic profile. [77, 78] However, to rationally design drug candidates without
altering aptamers-protein recognition profile, molecular details of the binding process need
to be fully clarified.

25
2. Folding versus charge: understanding selective target recognition by
the thrombin aptamers
2.1 Introduction
The formation of the complex between thrombin binding aptamers and their biological
target is the result of complementarities between the two macromolecules promoted by the
aptamer sequence (the sequence length and the composition) and folding as well as of
electrostatic interactions generated by the charge balance on the interaction surfaces. Thus,
modest chemical modification in crucial structural elements can largely impair the biological
response. In order to rationally design aptamer candidates for clinical applications without
altering aptamers-protein recognition profile a precise study of molecular details of the
binding process need to be carried out.
For example, how can we identify the driving elements that produce an efficient and
selective binding? How can we effectively combine the contribution of the three-
dimensional structure, the sequence length and composition, the role of the anionic
phosphate backbone? To properly approach these questions and, thus, to better describe the
mechanism of the DNA-protein interactions at molecular level we choose to study and
compare the behaviour of several polydeoxynucleotides. Firstly, we widely investigated the
conformational properties and the binding ability of the reference aptameric sequence
15fTBA and the multi-domains 29hTBA, to properly define an occurring correlation
between a peculiar folding adopted in solution and the capability to specifically recognize
the protein target. Within the 29hTBA sequence we identify and study the corresponding
guanosine rich core 15hTBA, in order to clarify if a simpler structure respect the 29hTBA
still maintains a peculiar binding ability.
Once we obtained an overall picture describing the correlation between the binding affinity
and the folding features of the thrombin binding aptamers we started to focus our attention
on linear DNA sequences, which do not present an ordered structure. The
polydeoxynucleotides were opportunely designed with a different chain length and
composition in order to explore the electrostatic contribution and the role of nucleobase
composition on the binding event.

26
15fTBA
29hTBA
15hTBA
(dT)10
(dT)20
(dT)40
(dT)60
(dT)80
(dA)40
(dC)40
(dGT)20
(dAC)20
5’- GGTTGGTGTGGTTGG -3’
5’- AGTCCGTGGTAGGGCAGGTTGGGGTGACT -3’
5’- GGTAGGGCAGGTTGG -3’
5’- [T]n -3’ where n = 10
5’- [T]n -3’ where n = 20
5’- [T]n -3’ where n = 40
5’- [T]n -3’ where n = 60
5’- [T]n -3’ where n = 80
5’- [A]n -3’ where n = 40
5’- [C]n -3’ where n = 40
5’- [GT]n -3’ where n = 20
5’- [AC]n -3’ where n = 20
Table 2.1: Sequences reported for oligonucleotides studied.
By comparing their thrombin binding and inhibition properties and by mapping their
preferentially recognized binding sites, we aimed to hierarchically define the contribution of
sequence, structure and ionic interactions in TBAs-thrombin binding event.

27
2.2 Materials and methods
2.2.1 Materials
Proteins. Human thrombin was supplied by Sigma Aldrich (St Louis, Missouri, USA) as
lyophilized powder solubilized in MilliQ®
water at a final concentration of 27 μM and then
stored at -80 °C. The colorimetric thrombin substrate (Benzoyl-Phe-Val-Arg-pNA) was
purchased from Calbiochem as lyophilized powder, solubilized in MilliQ®
water at a final
concentration of 1 mg/ml and then stored at -20 °C.
Synthetic oligonucleotides. HPLC purified oligonucleotides as well as their labelled forms
(3' FAM and 5’-Dabcyl) were purchased from Eurogentec (Serain, Belgium) as lyophilized
powder and solubilized in 10 mM Tris, 1 mM EDTA, pH 7.4. Oligonucleotide concentration
was determined by absorbance at 260 nm. Before each experiment, DNA solutions were
heated at 95°C for 5 minutes and slowly cooled at room temperature overnight in the
required buffer
2.2.2 Methods
Circular dichroism (CD). Circular dichroism spectra from 220 to 320 nm were recorded
using 10 mm path length cells on a Jasco J 810 spectropolarimeter equipped with a
NESLAB temperature controller device to achieve constant temperature of 25 °C in a quartz
cell with
optical path length of 1 cm. The reported spectrum of each sample represents the average of
3 scans recorded with 1-nm step resolution. Observed ellipticities were converted to mean
residue ellipticity [θ] = deg x cm2 x dmol
-1 (Mol. Ellip.).
Apparent binding constant (Kd) for the G quadruplex stabilizing ions were calculated by
fitting the relative variations of CD signal at 295 nm as a function of the corresponding
potassium concentration. The relative variations of CD signal were obtained as Δθ/Δθmax and

28
the data were elaborated using the data analysis module of Sigma Plot (Systat Software Inc.)
accordingly to a single binding model.
The melting curves were acquired recording the CD signal at 295 nm while applying a
heating rate of 1°C/min. Tm values were obtained from the minima in the first derivatives of
the melting profiles using the Jasco software.
The buffers used for the CD experiments contained 10 mM Tris-HCl at pH 7.4 in addition to
the indicated levels of KCl. Solutions were titrated with the concentrated KCl solution (3
M), by stepwise addition of 2–5 μl aliquots until no further changes in spectrum took place.
Electrophoretic Mobility Shift Assay (EMSA). DNA (1 μM) was incubated with
increasing protein concentrations (0-11 μM) for 30 minutes at room temperature in 10 mM
Tris, 50 mM KCl, pH 7.4. Then the reaction mixture was loaded onto a 12% native
polyacrylamide gel (acrylamide : bisacrylamide 19:1) in 1X TBE buffer (89 mM Tris, 89
mM boric acid and 2 mM Na2EDTA) added of 10 mM KCl. Gels were stained with
GelRed® or SybrGreen II® and visualized on a Geliance 600 (Perkin Elmer)
Thrombin Inhibition assay. Chromogenic substrates for coagulation and fibrinolytic
enzymes were developed in the early 1970s and very soon employed in assays for the
determination of protein activity, by meaning of spectrophotometric techniques.
A chromogenic substrate is a synthetic peptide, composed of 3-5 amino acids that mimics
the cleavage site of the natural protein substrate and is functionalized at the end with the
chromophore 4-nitroaniline (pNA).
This method is based on differences in Uv-Vis absorbance between the chromogenic
substrate and the released p-nitroanilide (pNA).
The kinetics of thrombin proteolytic activity was measured by following the cleavage of the
chromogenic substrate Benzoyl-Phe-Val-Arg-pNA in the presence/absence of increasing
concentration of selected oligonucleotides (0-3 μM) in phosphate buffer (10 mM Na2HPO4
,100 mM NaCl, 0.1% PEG8000, 0.1% BSA, pH 7.4).
Upon cleavage, the polypeptide substrate releases p-nitroaniline that absorbs light at a
wavelength of 405 nm. This allows to monitor the progression of the reaction. The
absorbance at 405 nm was determined in a 96-well plate microplate reader set at 25 °C

29
(Victor 3 - Multilabel counter – Perkin Elmer). In a final volume reaction of 320 μl 72 μM
of chromogenic substrate were added of human thrombin (4.5 nM) and incubated for 5 min
at 25°C, then readings were taken every 5 min for a period of 45 min. The activity of the
protease was determined from a slope of plots absorbance versus time as a function of
increasing test oligonucleotides concentrations.
Fluorescence quenching assay. Fluorescence quenching assay was performed in a Light
Cycler 1.5 Fluorimeter (Roche) using λex 488 nm and λem 520 nm in LiP buffer (10 mM
LiOH, 50 mM KCl, pH 7.4 with H3PO4). Aptamers thermal stabilities (0.5 μM) were
recorded in the presence of increasing thrombin concentrations (0-5 μM) or by addition of
competitors oligonuclotides (0-5 μM) in the presence of a constant thrombin concentration.
Melting curves were recorded by increasing the temperature from 30 to 95 °C at a rate of 1
°C/ min. followed by a final step in which temperature was maintained at 95 °C. Tm values
were determined from the first derivatives of the melting profiles using the Roche
LightCycler software. Each experiment was repeated at least three times and errors detected
were ± 0.4°C.

30
2.3 Results
2.3.1 Characterization of aptamer folding
Circular dichroism spectroscopy (CD) is a leading technique used to gain information about
protein and nucleic acid topology and to monitor conformational changes. [79-82]
Guanosine-rich DNA sequence, such as thrombin binding aptamers, are known to adopt a
specific conformation called G-quadruplexes. This conformation is characterized by a high
polymorphism that can result from different strands polarity arrangements.
Chain polarities constrain the chromophore guanosines to assume distinct orientations
around the glycosidic bond. As a result, different CD patterns of the two quadruplexes forms
are originated. [83] In particular, spectra relative to “parallel” quadruplexes are generally
defined by a precise chiroptical “fingerprint” distinguished by a positive band at ca. 260 nm
and a negative peak at ca. 240 nm, with a zero crossing at 250 nm. Distinctly, the presence
of a negative band at ca. 265 nm, a maximum at ca. 290 nm and a zero crossing at 280 nm
are features of antiparallel quadruplexes spectra. [79]
The two tested 15-mers oligonucleotides, 15fTBA and 15hTBA were reported to adopt an
antiparallel conformation in the presence of K+ whereas it was suggested that the same
monovalent ion promotes a parallel G-quadruplex conformation for 29hTBA [66, 84]. To
better understand this issue, we performed a comparative analysis of G-quadruplex structure
of 15fTBA, 15hTBA and 29hTBA by means of CD spectroscopy (Fig. 2.1). In the absence
of monovalent cations all oligonucleotides showed distinct CD spectra (Fig. 2.1.C) that
undergo remarkable changes upon addition of K+
(Fig. 2.1.D). Generally, an increment of
the band intensity around 290-295 nm is observed, suggesting the induction of an
antiparallel G-quadruplex folding [85, 86]. As far as the shorter 15fTBA and 15hTBA, their
CD spectra almost overlap in the presence of K+, which points to a very similar folded
conformation (Fig. 2.1.D). However, 29hTBA exhibits a CD signature clearly distinct from
the two 15-mers both in presence or absence of monovalent metal ions (Fig. 2.1.B). In
particular, in the presence of K+, a reduced intensity of all dichroic bands is observed, which
likely reflects the expected simultaneous presence of sequence segments involved in

31
different foldings. In this condition, a safe prediction of the G-quadruplex folding is not
easy.
Nevertheless, by subtracting the contribution of the G-quadruplex folded core (15hTBA)
from 29hTBA (Fig. 2.1.E), we obtain a differential spectrum largely corresponding to those
of a linear DNA (a positive band at 275 and a negative one at 250). This can reasonably be
attributed to the partially paired steam portion. Additionally if we subtract the spectra
recorded in the presence and in the absence of K+ (Fig. 2.1.F), the tendency towards a G-
quadruplex structure clearly appears. Interestingly, the differential spectrum is very similar
to the spectrum of 15hTBA, which strongly suggests the formation of a common
(antiparallel) folding adopted by the corresponding 29mer and 15mer sequences.
Fig. 2.1. In PANEL A, the variation of 15fTBA CD spectrum upon addition of KCl to the
oligonucleotide previously annealed. The arrows indicate the variation induced by the
increasing K+ concentrations (0-85 mM).

32
In PANEL B, the variation of 29hTBA CD spectrum upon addition of KCl to the
oligonucleotide previously annealed. The arrows indicate the variation induced by the
increasing K+ concentrations (0-150 mM).
CD spectra of 15fTBA (red line), 29hTBA (purple line) and 15hTBA (light purple line) in
the absence (PANEL C) or presence (PANEL D) of saturating concentrations of K+ ions.
DNA concentration 5 µM in 10 mM Tris, pH 7.4.
In PANEL E, the spectrum of 29hTBA subtracted of the 15hTBA at saturating K+
concentrations is reported in a dashed line.
In PANEL F, the spectrum of 29hTBA at saturating concentration of K+ ions subtracted of
the 29hTBA in the absence of K+ ions is reported in a dotted line.
Since the CD spectra recorded to monitor the structural conversion promoted by potassium
ions showed isodichroic points for all tested oligonucleotides (Fig. 2.2.D), we analyzed
isothermal titrations according to one binding event.
The apparent dissociation constants obtained are reported in Table 2.2. Interestingly, the
affinity for the monovalent metal ion is strikingly reduced (2 orders of magnitude) when a
stem region is included in the sequence.
Additionally, we monitored the temperature dependence of the CD signal at 293 nm, a
wavelength at which we can follow the structural transitions of the G-quadruplex core
irrespectively of the aptamers composition (Fig. 2.2.A).[87] In line with literature data we
observed similar Tm values for 15fTBA and 15hTBA in 50 mM K+ [66, 86]. On the
opposite, in the same experimental conditions, the 29-bases aptamer showed a significantly
lower Tm that correlates with its lower affinity for the monovalent metal ion (Table 2.2).
This behaviour appears peculiar since the presence of the double stranded portion should be
expected to promote the G-quadruplex folding. However, we observed that in the absence of
an annealing procedure before K+ addition, (thus likely in the absence of a correct pairing of
the steam region), the subsequent addition of monovalent ion promotes the induction of a
kinetically controlled form (it resembles the previously proposed parallel/mixed G-
quadruplex [84]). This structure slowly converts into the most thermodynamically favoured
antiparallel G-quadruplex fold (Fig. 2.2.B).
Hence, the stem nucleotides impairs G-quadruplex stability probably allows coexistence of
multiple conformations in equilibrium through the unfolded form. In fact, annealing is
required to allow direct formation of a G-quadruplex structure, common to all the tested
sequences.

33
Fig. 2.2. In PANEL A, melting profiles of selected aptamers recorded monitoring the CD
signal at 295 nm in 50 mM K+.
In PANEL B, the variation of 29hTBA CD spectra upon addition of KCl to the
oligonucleotide previously not annealed. PANEL B reports the CD spectra recorded in the
absence of K+ (solid line), immediately after addition of 50 mM K
+ (dotted line) or after 24
hours of incubation (dashed line).
CD fluorescence
Kd (mM) Tm (°C) Tm (°C)
15fTBA 0.41 ± 0.17 48.8 ± 0.1 51.7 ± 0.4
15hTBA 0.75 ± 0.07 46.8 ± 0.1 n. d.
29hTBA 64.17 ± 4.81 40.4 ± 0.2 40.9 ± 0.4
Table 2.2: K+ apparent dissociation constant (Kd) and melting temperature (Tm) of tested
aptamers determined by CD spectroscopy and fluorescence melting curves in buffer
containing 50 mM KCl.
n.d.: not determined

34
2.3.2 Binding of oligonucleotides to the human thrombin
The DNA-thrombin complex formation was tested by following the reduction of nucleic
acid electrophoretic mobility upon protein complexation. [88-90]
The polyacrylamide concentration (12%) and consequentially the dimension of the pores in
the gel was chosen to efficiently resolve the free and protein bound tested oligonucleotide.
The protein concentration required to delay tested aptamers reflects the aptamer-thrombin
binding affinity (Fig. 2.3). In our experimental condition the observed ranking order was the
following: 29hTBA≤15fTBA<<15hTBA which indicates that the 15hTBA is a very poor
thrombin binder. This evidence suggests a relevant role of the steam portion of 29hTBA in
the stabilization of the DNA-protein complex.
Interestingly, 15hTBA presents an Adenosine in position 4: such mutation in 15fTBA has
been reported to dramatically reduce aptamer-protein complex formation [91].
Fig. 2.3: DNA ( 1 µM) electrophoretic mobility shift induced by increasing protein
concentration (0; 0.45; 1.35; 2.7; 8.1 and 10.8 μM).
Obviously, no indication of overlapping binding site can be directly obtained by these
EMSA results. However, we took advantage of the different electrophoretic mobility of
29hTBA in comparison to 15-mers to perform a competition assay. Interestingly, the
binding to the protein to the longer aptamer does not prevent binding of 15fTBA, whereas it
partially suppresses complexation of the poorer binder 15hTBA (Fig. 2.4). The conclusion
follows that 15fTBA binds exosite I (as expected), whereas 15hTBA shares with its larger

35
congener recognition of exosite II, although binding to different protein portions (likely
exosite I) can occur. This means that by removing the stem portion the oligonucleotide
preference changes thus suggesting that the binding site selection depends by G-quadruplex
composition as well as by the presence of accessory binding domains. Therefore the two
structural domains of 29hTBA have complementary roles in selective binding to exosite II,
the stem region being more important for specificity. On the opposite, the change in the loop
sequence from GCA to TGT confers selectivity for exosite I and dramatically reduces
affinity for exosite II.
Fig. 2.4: Relative amount of aptamers bound to thrombin when the reaction mixture
contained an equimolar concentration of aptamer sequences. Reaction products were
resolved by EMSA.
a) 29hTBA / 15fTBA / 10 μM of thrombin;
b) 29hTBA; c) 15fTBA;
d) 29hTBA / 15hTBA / 10 μM of thrombin;
e) 29hTBA; f) 15hTBA
Due to the presence of several positively charged amino acid residues at exosite II level (and
I as well), selective thrombin recognition by 29hTBA might be the result of effective
charge-charge interaction favoured by the larger number of phosphate groups in comparison
to the 15nt analogues, thus irrespectively from sequence or pairing effects. To asses which is
the contribute of electrostatic binding to form adequately stable DNA-protein complexes, we

36
performed EMSA experiments with two families of linear synthetic oligonucleotides (Fig.
2.5). The first family comprises polydeoxythymidine oligonucleotides of different length (n
equal to 10, 20, 40 and 60 residues). Data analysis showed that up to 20-mer, no bands
corresponding to the complex were observed (EMSA assays shown only for (dT)10 and
(dT)60). Conversely, in the presence of longer DNA chains, relevant formation of the
protein-DNA complex occurred. This clearly indicates that unfolded oligomers can also bind
to thrombin with an efficiency modulated by the chain length and supports the hypothesis of
an effective charge-charge interaction occurring between protein and DNA. Then, we
compared in the same assay DNA sequences of the same length (40 residues) but having
different sequences, selected to avoid intra- or inter-molecular folding ((dC)40, (dA)40, and
(dGT)20). Interestingly, alternating GT sequences seems to demonstrate a higher affinity
than all other tested sequences. (Fig. 2.5) Thus, although the protein-nucleic acid complex
formation is noticeably promoted by charge-charge interactions, DNA base composition
turned out to be also relevant in the nucleic acid-protein recognition process.
Fig. 2.5: DNA ( 1 µM) electrophoretic mobility shift induced by increasing protein
concentration (0; 0.13; 1.3; 2.6; 5.2; 7.8 and 10.4 μM)

37
2.3.3 Competition of single stranded oligonucleotides with thrombin
aptamers binding.
Due to the evidence of multiple contributions in the aptamer-protein binding process, it is
useful to better define if DNA chain length and base composition might play a comparable
role at exosite I and exosite II level. As experimental protocol we employed a fluorescence
quenching assay [92-94] using the two aptamers 15fTBA and 29hTBA (known to be able to
discriminate between the two protein binding sites), labelled at 5' end with FAM and 3' end
with DABCYL. When DNA is unfolded, fluorescence is clearly detectable; upon G-
quadruplex formation the two labelling groups are in close proximity thus the fluorescence
is quenched. This allowed us to monitor the DNA melting profile in different experimental
conditions (Fig. 2.5).
Fig. 2.5: Schematic representation of the fluorescence quenching assay.
The temperature increasing induces the G quadruplex melting.
In the unstructured DNA the fluorescent probe is positioned to an higher distance to the
fluorescent acceptor tag. In this condition the specific fluorescence of the tag is clearly
detectable.
According to CD data, lower K+ concentrations were required to stabilize 15fTBA folding in
comparison to 29hTBA (Fig. 2.7). Additionally, upon addition of Na+ up to physiologically
relevant concentrations (150 mM), no clear melting transitions of labelled 15fTBA could be
detected whereas a folded form of 29hTBA could be identified.
Interestingly, thrombin was able to stabilize aptamers structure both in the presence and in
the absence of the two tested monovalent ions (Fig. 2.7). This indicates that the chaperone

38
role of the protein is maintained towards both aptamers although a synergic effect is exerted
by the metal ion. Indeed, the melting temperature observed at saturating protein
concentrations (1 µM) results higher in the presence of K+, thus, confirming a major role
played by the G-quadruplex form in mediating DNA-thrombin recognition is confirmed.
Fig. 2.7: Thermal melting profiles of labelled 15fTBA (PANEL A) or 29hTBA (PANEL B)
recorded in the presence/absence of different combinations of 50 mM KCl, 150 mM NaCl
and 1 µM thrombin.
The entity of the melting temperature of the thrombin-bound 15fTBA (red bars) and
29hTBA (purple bars) in different experimental conditions is summarized in the PANEL C.
The thermal shift promoted by thrombin was then used to asses if unlabelled DNA
sequences can compete for binding to the site recognized by each aptamer. When a potential
competitor is added in the reaction mixture, a reduction in the melting temperature of the
protein bound aptamer is expected. Results obtained in 50 mM K+ (where the thrombin

39
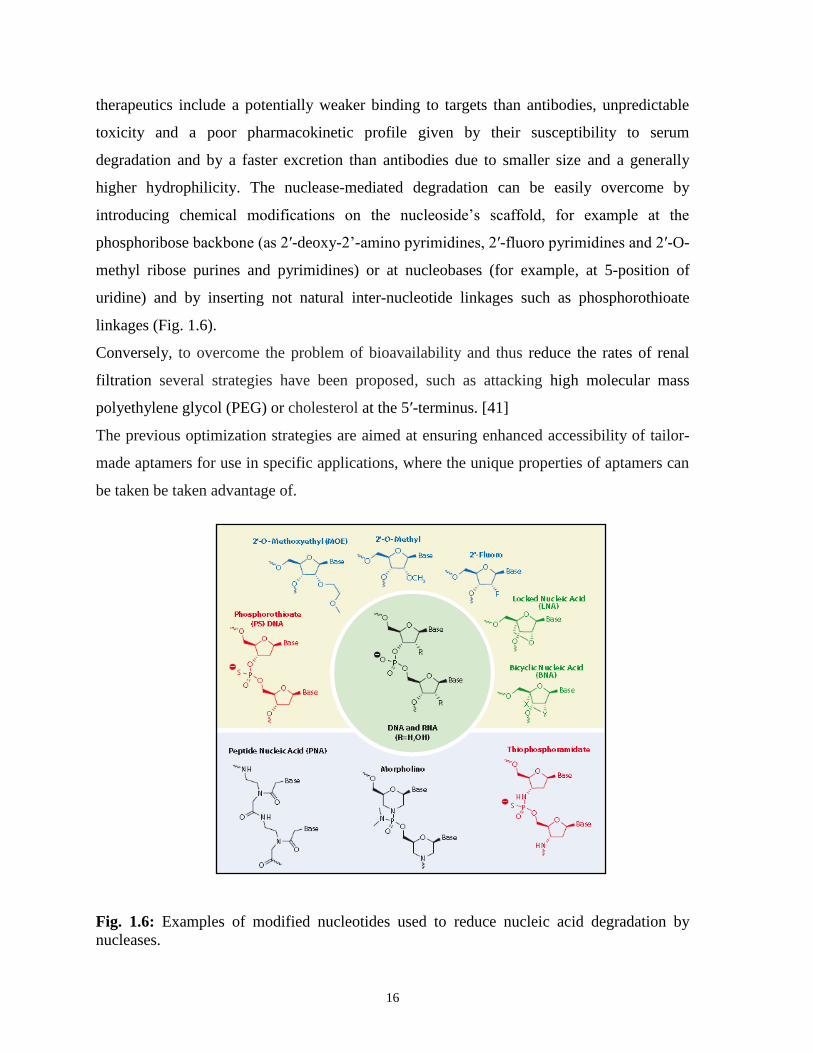
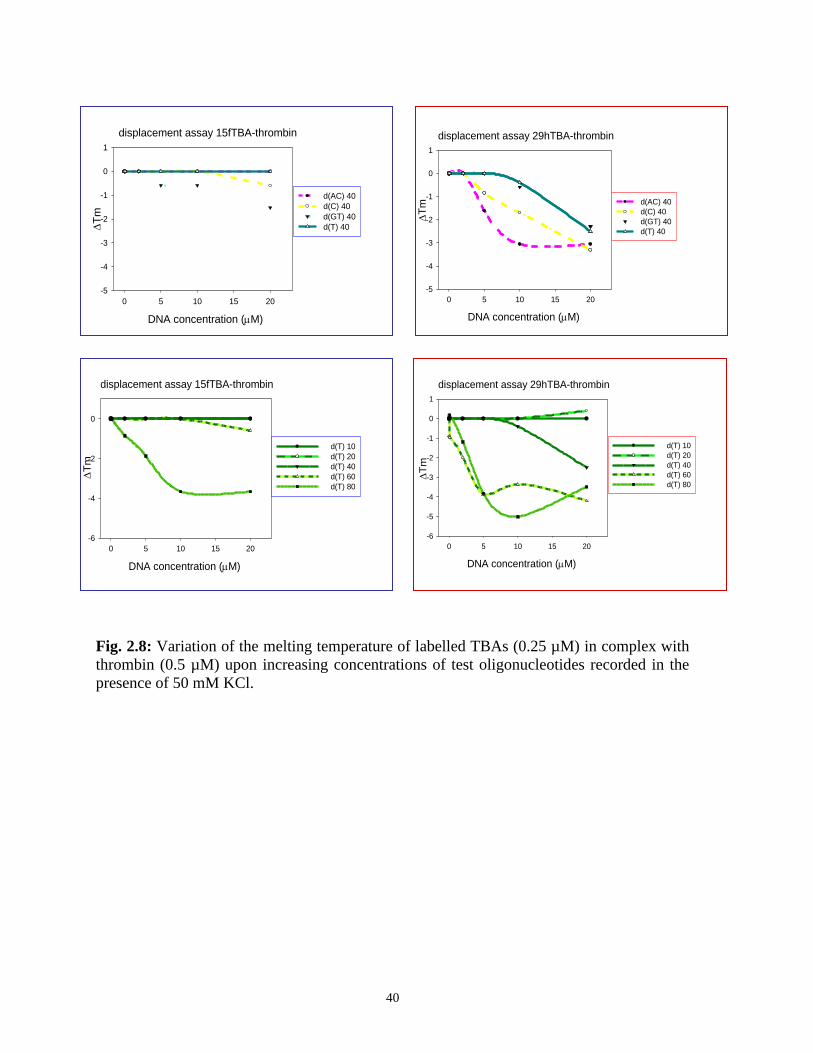
mediated thermal shift of the aptamers is maximal) are summarized in Fig. 2.8. As expected,
no competition occurred between the two aptamers. The core 15hTBA was able to promote
a modest displacement from the protein of both labelled aptamers. This is totally consistent
with the EMSA competition results described above and reinforces the hypothesis of its
possible binding to exosite I as well II.
None of tested single stranded DNA sequence previously used was able to displace thrombin
from 15fTBA (Fig. 2.8). Different results were obtained in the presence of 29hTBA.
Addition of (dT)n to the aptamer-protein complex promoted a remarkable reduction of the
DNA melting temperature (Fig. 2.8). As previously described for EMSA experiments, this
effect is a function of the length of the competitor DNA sequence. In particular the 20mer
oligonucleotide is inactive, the 40mer one is modestly active whereas 60mer one is able to
sensibly reduce the melting of the protein-bound 29hTBA. This behaviour could be related
to competition for charge interaction. However, if we normalize the charge effect by
calculating competitors concentrations in terms of phosphate residues, the same order is
maintained suggesting that other contributions can at least cooperate in describing this trend.
DNA sequence context plays also a role as shown by aptamer displacement measurements
using oligonucleotides of equal length (same net charge) but different base composition. In
fact, base composition modulates the extent of 29hTBA release from the protein bound form
(Fig. 2.8). In particular, the most efficient competitors turned out to be (dAC)20 and, to a
lesser extent, (dC)40.
The different aptamer displacement efficiency showed by tested linear oligonucleotides
toward the two tested aptamers suggest that the binding of the unfolded DNA occurs
essentially at the exosite II level whereas for these sequences effective interaction with the
fibrinogen recognition exosite is basically not apparent. Interestingly, the AC sequence
selectivity, shown by competition experiments with linear oligonucleotides, appears to
correlate with the composition of 29hTBA, where CA steps a substitute the TG steps
peculiar of 15fTBA: this can envisage a correlation between the competition efficiency and
the sequence of the longer G-quadruplex loop.
40
displacement assay 15fTBA-thrombin
DNA concentration (M)
0 5 10 15 20
T
m
-6
-4
-2
0
d(T) 10
d(T) 20
d(T) 40
d(T) 60
d(T) 80
displacement assay 15fTBA-thrombin
DNA concentration (M)
0 5 10 15 20
T
m
-5
-4
-3
-2
-1
0
1
d(AC) 40
d(C) 40
d(GT) 40
d(T) 40
displacement assay 29hTBA-thrombin
DNA concentration (M)
0 5 10 15 20
T
m
-5
-4
-3
-2
-1
0
1
d(AC) 40
d(C) 40
d(GT) 40
d(T) 40
Fig. 2.8: Variation of the melting temperature of labelled TBAs (0.25 µM) in complex with
thrombin (0.5 µM) upon increasing concentrations of test oligonucleotides recorded in the
presence of 50 mM KCl.
displacement assay 29hTBA-thrombin
DNA concentration (M)
0 5 10 15 20
T
m
-6
-5
-4
-3
-2
-1
0
1
d(T) 10
d(T) 20
d(T) 40
d(T) 60
d(T) 80

41
2.3.4 Modulation of thrombin enzymatic activity by aptamers and
unfolded DNA.
It is reported that ligands binding to thrombin exosite I or exosite II can alter the proteolytic
activity of the protein according to an allosteric crosstalk or an enthalpy-entropy
compensation effect [95, 96]. To investigate a possible correlation between DNA binding
and modulation of the enzymatic kinetics, we evaluated the effect of tested oligonucleotides
on the rate of enzymatic cleavage of a chromogenic substrate by thrombin. In figure 2.9 the
initial hydrolysis rate as a function of DNA concentration is reported.
Increasing concentrations of 15fTBA did not inhibit thrombin enzymatic activity. This is not
odd since the binding between 15fTBA and thrombin, occurring at the fibrinogen
recognition exosite may not substantially alter the recognition and cleavage of a small
synthetic substrate. On turn, both 29hTBA and 15hTBA modestly reduce substrate cleavage
rate. Thus, different consequences at the level of the catalytic action upon aptamers binding
at different protein exosites can be envisaged.
Using linear (dT)n we observed a relevant impairment of the enzyme cleavage reaction that
actually parallels the binding affinity order previously described: it increases with the DNA
length up to levelling off at about 40 bases. By comparing different DNA sequences, it
emerged a modest modulation, only (dA)40 being remarkably less efficient. Since (dA)40 was
shown by EMSA to be a poor binder, the overall data suggest a correlation between enzyme
binding affinity of the unfolded DNAs and their impairment of thrombin activity.
Apparently, exosite II occupancy by a polyanionic macromolecule directly affects the
enzymatic cleavage activity. In this connection, aptamers 15hTBA and 29hTBA appear as
outliers. Nevertheless, the inhibitory action on thrombin, can be the result of several factors:
for example an inhibitor effect mediated by the action of an allosteric site or a competition
for the substrate recognition: it is conceivable that these processes can be differently
modulated by folded and unfolded DNAs at least because, due to their G-quadruplex
arrangement, aptamers are folded and thus cannot likely explore protein regions far from
their binding exosite.

42
Fig. 2.9: Modification of thrombin (4.5 nM) cleavage rate (vo, s-1
) of a chromogenic
substrate (72 μM Benzoyl-Phe-Val-Arg-pNA) recorded in the presence of increasing DNA
concentrations in phosphate buffer, pH 7.4.

43
2.4 Conclusions
The molecular basis for recognition of distinct thrombin exosites by 15fTBA and 29hTBA is
still not fully understood. A previous report suggested that they could adopt two different G-
quadruplex topologies. However, our data indicate that both assume a common antiparallel
G-quadruplex folding thus ruling out the involvement of a different structural motif in the
site selection process, (the parallel 29hTBA form is only transiently observed prior to
annealing). Clearly the two aptamers have different loop sequences that are surely playing a
role to produce a selective pattern of interactions, as confirmed by the fact that loop
modification from 15fTBA to 15hTBA preserves an antiparallel G-quadruplex
conformation, but allows aptamer shuffling between both exosites. Interestingly, addition of
the two partially paired arms to obtain 29hTBA is crucial both to provide remarkably higher
affinity for thrombin and for direct binding towards exosite II only. This demonstrates a
combined role played by the stem and G-quadruplex portions of the longer aptamer. Indeed,
correct pairing of the two arms induces the thermodynamically more favourable antiparallel
G-quadruplex folding and generates an additional binding domain to produce effective and
selective exosite recognition.
To assess if this combination is synergic or not we used single stranded DNA model
sequences characterized by different length and composition. Our results indicate
predominant binding of these sequences at the exosite II of thrombin. This is not surprising
since we can equalize these DNAs to linear arrays of negatively charged residues in analogy
to heparin and GAGs, the physiological ligands of the above exosite. Additionally, the
longer the sequence the stronger the binding is, thus further underlining a substantial
contribution of charge-charge interactions. However, it is important to highlight that the
efficiency of 29hTBA displacement is not simply correlated to thrombin affinity of the
linear oligonucleotides, but it is finely tuned by its base sequence too. Interestingly, linear
CA oligomers sharing the dinucleotide repeat with the longer loop of 29hTBA most
efficiently compete for exosite II occupancy. This further reinforces the need to establish
well defined nucleotide-protein interactions, deriving from a subtle interplay of sequence,
length and structure, for effective exosite selection.

44
A final comment must be deserved to the consequences of DNA binding on the modulation
of thrombin activity. In our conditions, we observed that only exosite II binders reduced the
cleavage rate of a short substrate. Nevertheless 29hTBA, which binds to the same site with
high affinity, is actually a poor inhibitor. A hypothesis to rationalize this behaviour rests in
the smaller average dimension of the aptamer: although it is structurally organized in two
main domains, tight folding cannot allow its arms to reach far from the G-quadruplex core.
On the opposite, the single stranded DNAs that we tested are generally expected to assume
an extended form: accordingly they can enforce their protein binding by forming
interactions also with protein portions adjacent to the one strictly recognized by the aptamer.
In this connection, several positively charged Lys/Arg residues are available on the protein
surface to grant additional charged interactions with the interfering oligonucleotide. It is
now to clarify if they act by inducing a protein conformational change or if they directly
shield the access of the substrate to the cleavage site thereby affecting protein catalytic
activity.
In conclusion, our data confirm that the thrombin-aptamers interactions occurring at exosite
I and II are remarkably distinct. Exosite I is effectively bound by 15fTBA in a folded
quadruplex form: this arrangement contains the structural information needed to provide
significant binding site selection (loop(s)) and good binding affinity (charge). On the
opposite, a combination of two structural motifs (stem and G-quadruplex loop) is required to
provide selective targeting for exosite II, additional binding strength being granted by a
larger number of charged residues. Thus, the rational strategies to optimize 15fTBA and
29hTBA in view of their potential therapeutic applications must be substantially
differentiated.
The data have been published in:
G. Marson, M. Palumbo, S. Claudia; Folding versus charge: understanding selective target
recognition by the thrombin aptamers. Current Pharmaceutical Design (Curr Pharm Des.)
2012;18(14):2027-35.
45
3. Molecular versatility of the quadruplex/duplex structure in the 29-
mer Thrombin Binding Aptamer
3.1 Introduction
The impressive affinity and specificity associated with the aptamer-target complex
formation derives from a mutual conformational adaptability. [44] Upon the target
recognition, the aptamer binding domain as well as its target, according to their structural
features, adjusts their surface to maximize complementarity through tightly packed contacts.
When a lack of an unambiguous and detailed structure of protein-DNA complex is prevent,
the nature of the binding interactions could be inspected only via an accurate set of
complementary experiments. In the previous section we proposed that the higher target
affinity of 29-mer thrombin binding aptamer (29hTBA) is probably gained from a peculiar
co-presence of two structural modules, consisting of a 15-mer G-quadruplex core and of
complementary 5’ and 3’ ends, potentially paired, to produce a quadruplex/duplex mixed
structure connected by two 3-base bulges (see Fig. 3.1). This complex architecture appears
to synergically promote a specific thrombin recognition.
However, considering the complexity of the 29hTBAs’ topology some open questions
emerge: which structural motifs are crucial for the thrombin recognition? Can the structural
motifs identified in 29hTBA be treated as distinct modules? Are they interconnected in
defining the thermodynamic stability and/or the thrombin affinity of the aptamer? To answer
these questions, we designed and studied a series of 29hTBA analogous containing sequence
modifications in single domains. In particular, to explore the functional role of the different
loops inside the G quadruplex core we designed two mutants: the 29fTBA, consisting of the
insertion of the 29hTBA 7 nt ends on the 15fTBA guanosine rich segment and the
29hTBAm where we mutated the adenine in position 11 ( inside a minor loop) with a
thymidine. This last modification was introduced in order to assay the role of the di-
nucleotides loops, basic structural domains for the thrombin recognition by the side of
15fTBA, as evidenced in the crystallography model of the aptamer-protein complex (Fig.
1.10).

46
To clarify the role of the double strand module inside the aptameric architecture we used
29hTBAds (double strand) and 29hTBAnp (not paired). Their main differences with
reference to the lead 29hTBA is given by the grade of complementary between the
nucleotides forming the flanking ends.
Conversely with the shorter sequence (22 nucleotides) 22hTBAss (single strand),
characterized by the deletion of the 3’ eptanuclotide end, we investigated the behaviour of
the guanosine rich core extended in 5’ position with a linear eptanucleotide appendage.
As additional control we included the 23hTBAds which represents a further modification of
the 29hTBAds, presenting only four pairing nucleotides at both 3’- 5’ ends. This shorter
derivative was designed to explore the specific behaviour of a short double strand motif.
Finally, we designed the 14hTBAhp (hairpin) which represents a 29hTBA analogous
devoided of guanosine rich central chain, thus consisting only of the paired ends and the
bulge loops connected.
By studying this sequence, deprived of the guanosine repetition tract, we want to point out
how the absence of a G4 module could influence the properties of the 14nt mutant.

47
Fig. 3.1: Schematic representations of oligonucleotides studied.
To pursue this issue, the systematic characterization of the protein recognition profile of
each designed sequence is focused to provide a deep insight into the role of each single
portion.
In this section, we applied the circular dichroism to characterize the conformational features
of control oligonucleotides for which the ability to form either the duplex region or the G-
quadruplex region is particularly tuned
Additionally, spectroscopic techniques and electrophoretic assays were used to study the
binding properties of the novel DNA sequences.
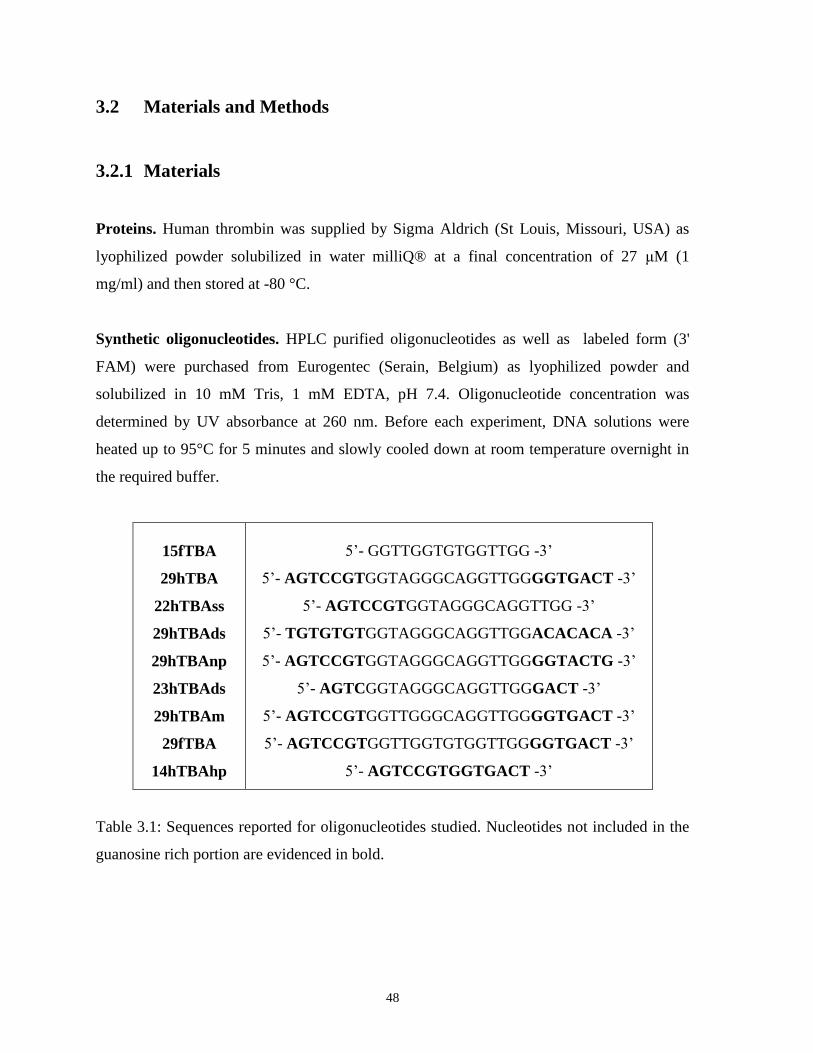
48
3.2 Materials and Methods
3.2.1 Materials
Proteins. Human thrombin was supplied by Sigma Aldrich (St Louis, Missouri, USA) as
lyophilized powder solubilized in water milliQ® at a final concentration of 27 μM (1
mg/ml) and then stored at -80 °C.
Synthetic oligonucleotides. HPLC purified oligonucleotides as well as labeled form (3'
FAM) were purchased from Eurogentec (Serain, Belgium) as lyophilized powder and
solubilized in 10 mM Tris, 1 mM EDTA, pH 7.4. Oligonucleotide concentration was
determined by UV absorbance at 260 nm. Before each experiment, DNA solutions were
heated up to 95°C for 5 minutes and slowly cooled down at room temperature overnight in
the required buffer.
15fTBA
29hTBA
22hTBAss
29hTBAds
29hTBAnp
23hTBAds
29hTBAm
29fTBA
14hTBAhp
5’- GGTTGGTGTGGTTGG -3’
5’- AGTCCGTGGTAGGGCAGGTTGGGGTGACT -3’
5’- AGTCCGTGGTAGGGCAGGTTGG -3’
5’- TGTGTGTGGTAGGGCAGGTTGGACACACA -3’
5’- AGTCCGTGGTAGGGCAGGTTGGGGTACTG -3’
5’- AGTCGGTAGGGCAGGTTGGGACT -3’
5’- AGTCCGTGGTTGGGCAGGTTGGGGTGACT -3’
5’- AGTCCGTGGTTGGTGTGGTTGGGGTGACT -3’
5’- AGTCCGTGGTGACT -3’
Table 3.1: Sequences reported for oligonucleotides studied. Nucleotides not included in the
guanosine rich portion are evidenced in bold.

49
3.2.2 Methods
Circular dichroism (CD). Circular dichroism spectra from 220 to 320 nm were recorded
using 10 mm path length cells on a Jasco J 810 spectropolarimeter equipped with a Peltier
temperature controller device to achieve constant temperature of 25 °C in a quartz cell with
optical path length of 1 cm. The reported spectrum of each sample represents the average of
3 scans recorded with 1-nm step resolution. Observed ellipticities were converted to mean
residue ellipticity [θ] = deg x cm2 x dmol
-1 (Mol. Ellip.).
Apparent dissociation constants (Kd) for the G quadruplex stabilizing ions were calculated
by fitting the relative variations of CD signal at 295 nm or 260 nm (K+ and Na
+,
respectively) as a function of the corresponding ion concentration. The relative variations of
CD signal were obtained as Δθ/Δθmax and the data were elaborated using the data analysis
module of Sigma Plot (Systat Software Inc.) accordingly to a single binding model.
The melting curves were acquired recording the CD signal at 295 nm while applying a
heating rate of 1°C/min. Tm values were obtained from the minima in the first derivatives of
the melting profiles using the Jasco software.
The buffers used for the CD experiments contained 10 mM Tris-HCl at pH 7.4 in addition to
the indicated KCl/NaCl concentrations. Solutions were titrated with a concentrated KCl
solution (3 M) or NaCl (2 M), by stepwise addition of 2–5 μl aliquots until no further
changes in spectrum took place.
The CD spectra of thrombin (in the absence or presence of aptamers) were measured with a
J-810 Spectrophotometer at 212–320 nm using a two compartments 10-mm path-length cell
at 10 mM Tris-HCl pH 7.4 buffer containing 50 mM KCl or 150 mM NaCl.
The final concentration of thrombin was set at about 0.5 µM. The molar ratio of
thrombin/aptamer was 1:1.
Fluorescence binding study. Labeled aptamer-thrombin interaction was studied by
recording the change of DNA probe’s fluorescence at λmax (i.e., 518 nm) as a function of
thrombin concentration. The interactions were monitored at 25 °C by adding to solutions of
3’FAM-15fTBA (48 nM) and 3’FAM-29hTBA (20 nM) in 10 mM Tris, 50 mM KCl pH 7.5
a suitable stock solution of thrombin, up to reach a final protein/DNA molecular ratio of
50
and 20.5 for 15fTBA and 29hTBA, respectively. The fluorescence emission spectra from
500 nm to 595 nm were recorded on fluorescence spectrofluoremeter Jasco model FP-, using
a 10-mm path-length quartz cell. The excitation wavelength was set at 495 nm.
Fluorescence intensity data were finally corrected for dilution (< 7.5% at the end of the
titration) and finally expressed as [(F0-Fobs)/∆Fmax] where F0 and Fobs are the fluorescence of
the DNA label in the absence and presence of thrombin, respectively, and ∆Fmax is the
maximum fluorescence change at saturating concentration of protein. Binding constant (Kd)
was calculated by fitting the λ518 fluorescence changes expressed as [(F0-Fobs)/∆Fmax] as a
function of the total thrombin concentration and using the data analysis module of Sigma
Plot (Systat Software Inc.) with a single binding model. For the competition assay, labeled
29hTBA (0.02 μM) fluorescence intensities were recorded after the addition of competitors
oligonuclotides (0-6 μM) in the presence of a constant thrombin concentration (0.18 µM) in
10 mM Tris, 50 mM KCl pH 7.5. The EC50 of the competition assay were calculated using
the data analysis module of GraphPad Prism (GraphPad Softwere Inc.)
Electrophoretic Mobility Shift Assay (EMSA). DNA (1 μM) was incubated with
increasing protein concentrations (0-11 μM) for 30 min at room temperature in 10 mM Tris,
20 mM KCl (or 100 mM NaCl/KCl), pH 7.4. Then the reaction mixture was loaded onto a
12% native polyacrylamide gel (acrylamide:bisacrylamide 19:1) in 1X TBE buffer (89 mM
Tris, 89 mM boric acid and 2 mM Na2EDTA) added of 20 mM KCl (or 100 mM NaCl/KCl).
Gels were stained with GelRed® or Sybr Green II® and visualized and quantified on a
Geliance 600 (Perkin Elmer).

51
3.3 Results
3.3.1 Influence of the 5’ 3’ flanked sequences on the 29hTBA folding
Target recognition by 29hTBA is inherently associated to its conformational polymorphism,
given by the coexistence of multiple structural modules. In the previous section we defined
and optimized a systematic protocol for the complete analysis of conformational behaviour
of 29hTBA by CD spectroscopy. Here, we adopted the same analytical approach to evaluate
the folding properties of the new aptamer series.
Initially, we assessed the conformational features of 29hTBAds and 29hTBAnp, the first
characterized by fully complementary steam portion and the second defined by terminal
stretches unable to hybridize. Both sequences exhibit two CD signatures clearly distinct
from the reference aptamer both in presence or absence of G-quadruplex stabilizing K+ ions.
In particular, under stabilizing-cation-deficient conditions 29hTBAds presents the typical
CD spectrum of linear DNA ( a positive large band at ca 260–280 nm and a negative band at
ca 245 nm) [79] reasonably deriving from the pairing of the 3’ and 5’ terminal residues.
(Fig. 3.2.B) Addition of saturating potassium concentration induced changes in the CD
spectra which are in line with the induction of a G-quadruplex antiparallel structure. Indeed,
the characteristic positive peak centred around 295 nm clearly emerges (Fig. 3.2.B).
Conversely, the CD spectrum of 29hTBAnp in absence of potassium exhibits a modest
positive band near 260 nm associated to a negative one near 240 nm. (Fig. 3.2.C) This
feature does not recall the chiroptical profile of an unfolded DNA but suggests the presence
of a fraction of G-quadruplex parallel form. Addition of K+ on this mutant sequence
promotes a change in the CD pattern, leading to a new positive CD band at 293 nm
associated with a 265 nm positive shoulder (Fig. 3.2.C). According to this CD signature, an
univocal prediction of the G-quadruplex folding is not easy.
Indeed, this CD patter could suggest either the presence of a mixed population of both
parallel and antiparallel oriented strands distinct forms or the coexistence, inside the same
structure, of the both stranded polarities in a mixed type form.
Nevertheless, this result indicates that the absence of a correct pairing of the terminals
prevents the folding of the G-rich strand towards an univocal antiparallel conformation.

52
To better understand the role of protruding terminals in the G4 folding process we studied
23hTBAss which contains only the 5’ terminal eptanucleotide end. Its CD spectra, upon
addition of potassium, displayed a negative Cotton band with a minimum around 265 nm
and positive band at 295 nm (Fig. 3.2.D), a pattern consistent with the one reported for the
29hTBA reference sequence (Fig. 3.2.A). This allows us to confirm that the loss of the 3’
flanked sequence in 29hTBA does not perturb the final G4 structure adopted.
Thus, one impaired terminal is not sufficient to alter the functional folding of 29hTBA.

53
Fig 3.2. In PANELS A, B, C, D; Variation of CD spectra upon addition of KCl for 29hTBA
(purple line), 29hTBAds (bondi blue line), 22hTBAss (dark blue line) and 29hTBAnp
(yellow line). CD spectra in the absence (dashed line) or presence (solid line) of saturating
concentrations of K+ ions are evidenced. DNA concentration 5 µM in 10 mM Tris, pH 7.4.
The arrows indicate the variation induced by the increasing K+ concentrations.
In PANEL E; CD spectra of aptamers in the absence of K+ ions are reported.
In PANEL F; CD spectra of aptamers at saturating concentrations of K+ ions are reported.
In the figure are reported schematic representations of oligonucleotides studied in this
section and a legend reporting the colour code of each DNA sequence.
In order to estimate the apparent dissociation constant of the stabilizing potassium ions to
aptamers, the quantitative analysis of the titrations was performed. The spectral data were
analyzed, considering the relative variation of the 295 nm signal (the typical feature of an
antiparallel CD spectrum) as a function of potassium concentration. The resulting plots are
reported in figure 3.3.A. Since all CD titrations showed two isodichroic points for the tested
oligonucleotides (257 and 278 nm), indicating the two-state nature of structural transition,
we analyzed isothermal titrations according to one binding event. Among all the tested
sequences, 23hTBAss showed the higher Kd for potassium (table 3.2). This result suggests
that the presence of a single flanked chain favors the coordination of the alkali metal ion to
the guanosine tracts. Furthermore, the 3-fold difference for the Kd between 29hTBAds and
54
29hTBAnp sequences, which differ for the pairing of the terminal portions, indicates that the
duplex strand region cooperates in potassium driven folding for the studied G rich chains
likely forcing the 3’ and 5’ terminal of the G-rich portion to be correctly located to form the
antiparallel G-quadruplex. To further elucidate the contribution of the flanking sequences to
G-quadruplex stability, we investigated the melting profiles of 29hTBA mutants in buffer
containing 50 mM KCl. The plot of the dichroic signal at 295 nm as a function of
temperature for the studied mutants is presented in figure 3.3.B. These curves evidenced
how the increment of the temperature promotes the unfolding of the ordered DNA
structures, which is displayed by a CD magnitudes decrease. Under comparable conditions
G-quadruplexes formed by 29hTBAnp and 23hTBAss turned out to be more stable than the
references aptamer, presenting melting temperatures of 49.8 °C and 48.6 °C, respectively
(Fig. 3.3.B and Table 3.2).
If this result is somehow expected for 29hTBAss and is in line with its higher propensity to
arrange into an antiparallel G4 in the presence of K+, it appears odd for 29hTBAnp which
showed a low affinity for this metal ion. However, it is worth to recall studied the
ambiguous folding adopted by 29hTBAnp in potassium condition.
If the melting temperature of the antiparallel G4 is initially monitored the change of the
signal at 295 nm, the thermal-induced changes recorded at 260 nm should describe the
unfolding of the parallel G4.
Thus, to further understand the 29hTBAnp behavior we estimated and compared the two
different melting profiles, obtained by recording the thermal-induced reduction of the CD
signals at 260 and 295 nm (Fig. 3.3.C). Even though we could not calculate exactly the
minima in the first derivatives of the melting profiles for the 260 nm signal, results clear that
the specific form that contributes to the 260 nm signal is more thermally stable then the
antiparallel form. This implies that the two strand orientations do not coexist inside the same
structure but belong to distinct structures simultaneously present in solution, defined by
distinct thermodynamic stabilities.
Finally, by increasing the antiparallel component the thermal stability largely increments.
The thermal stability of 29hTBAds was estimated to be around 40.0 °C thus similar to the
one of 29mer references sequence. These results assign a controversial role to the duplex
module: on the one hand it promotes G4 folding upon addiction of potassium with reference
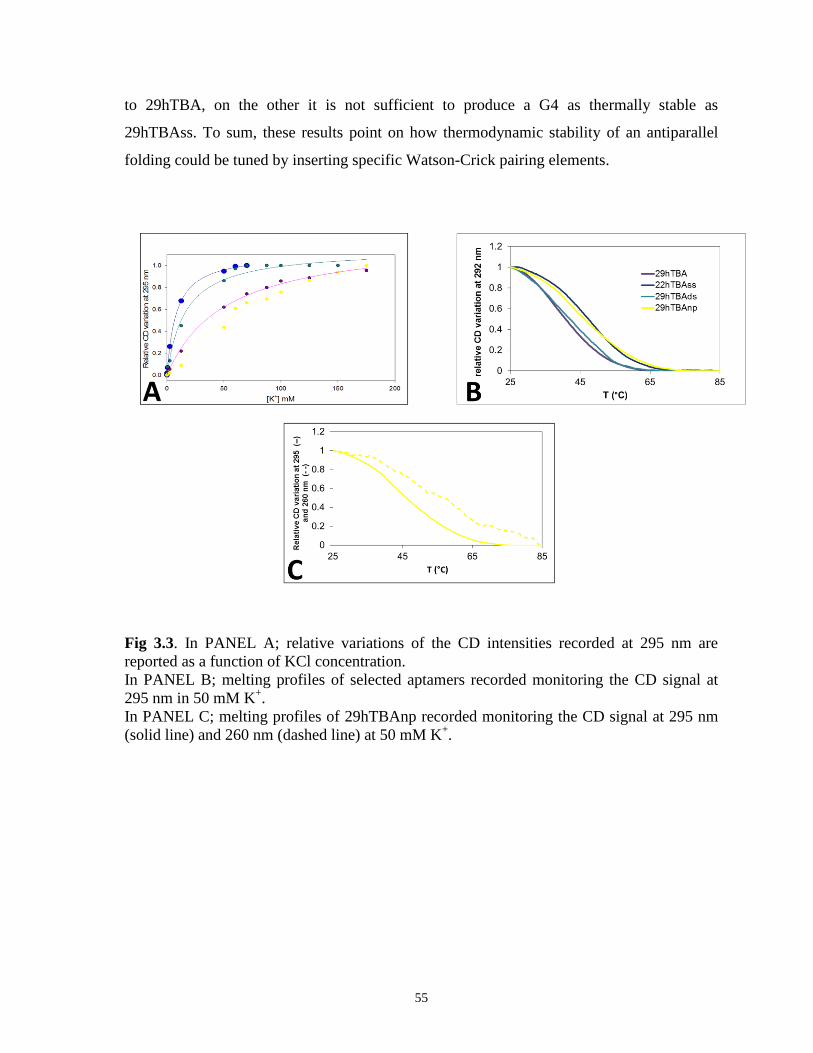
55
to 29hTBA, on the other it is not sufficient to produce a G4 as thermally stable as
29hTBAss. To sum, these results point on how thermodynamic stability of an antiparallel
folding could be tuned by inserting specific Watson-Crick pairing elements.
Fig 3.3. In PANEL A; relative variations of the CD intensities recorded at 295 nm are
reported as a function of KCl concentration.
In PANEL B; melting profiles of selected aptamers recorded monitoring the CD signal at
295 nm in 50 mM K+.
In PANEL C; melting profiles of 29hTBAnp recorded monitoring the CD signal at 295 nm
(solid line) and 260 nm (dashed line) at 50 mM K+.

56
Kd (mM) Tm (°C)
29hTBA 64.17 ± 4.81 40.4 ± 0.2
29hTBAds 17.00 ± 2.46 40.0 0.2
29hTBAnp 53.65 ± 9.60 49.8 0.2
22hTBAss 8.24 ± 7.70 48.6 0.2
Table 3.2: K+ apparent dissociation constant (Kd) and melting temperatures (Tm) of tested
aptamers determined by CD spectroscopy in buffer containing 50 mM KCl.
3.3.2 Influence of the guanosine rich core on the aptamer folding
Literature data indicate that loops composition can largely affect the conformational
equilibria of G-rich sequences in terms of folding kinetics and stability [13-15, 92, 97-103];
in particular a stabilizing effect of thymine residues has been underlined by crystallography
studies. [16]
To assess if minimal nucleobase modifications actually affect the overall G-quadruplex
structural properties of 29hTBA we performed a comparative biophysical analysis of the
following G-rich DNA sequences.
The first sequence (29hTBAm) consists of the 29hTBA sequence with an A-T mutation at
position 11.
Conversely, the 29fTBA is defined by 15fTBA G-rich sequence merged into the peculiar
molecular architecture of the 29hTBA. For this mutant sequence A11 is substituted by T11
and TGT replaces GCA in the major loop. Interestingly, loop composition does not
influence the folding process in terms of overall structure since the comparison of the CD
spectra for the three sequences suggested a common antiparallel structure adopted upon
addition of potassium ions (Fig. 3.4).

57
Fig. 3.4: In PANELS A, B, C; Variation of CD spectra upon addition of KCl for 29hTBA
(purple line), 29hTBAm (light green line) and 29fTBA (orange line). CD spectrum in the
absence (dashed line) or presence (solid line) of saturating concentrations of K+. DNA
concentration 5 µM in 10 mM Tris, pH 7.4.
The arrows indicate the variation induced by the increasing K+ concentrations.
In the figure are reported schematic representations of oligonucleotides studied in this
section and a legend reporting the colour code of each DNA sequence.

58
Interestingly, the monovalent metal ion concentrations required to fully convert the three test
sequences into the G-quadruplex form are different (Fig. 3.5.A and table 3.3). In particular
this is extremely reduced (about six folds) for the mutant 29hTBAm. For this last sequence
the Kd is 10.8 mM, where the corresponding value for reference 29hTBA is 64.8 mM.
For the 29fTBA sequence the apparent dissociation constant for K+ is approximately three
folds lower in comparison to the reference 29hTBA (Table 3.3) This last finding is perfectly
consistent with our previous study in which we reported that the dissociation constant for
15fTBA (the first binding aptamer identified and the G quadruplex core of the 29fTBA) is
approx. 3 fold lower in comparison with 15hTBA (the G quadruplex core of the 29hTBA)
(see table 3.3) [104]. The results above-described clearly indicate how loops composition
can specifically influence the guanosine coordination of K+.
The analysis of the thermal stability evidenced how the three 29nt DNA sequences present
lower melting temperatures in comparison to the corresponding 15nt guanosine rich cores
(15fTBA and 15hTBA) of approximately 8 °C.
These results clearly point out how loop composition negligibly influences the thermal
stability of the G4 core.
Fig. 3.5: In PANEL A; relative variations of the CD intensities recorded at 295 nm are
reported as a function of KCl concentration.
In PANEL B; melting profiles of selected aptamers recorded monitoring the CD signal at
295 nm in 50 mM K+.

59
Kd (mM) Tm (°C)
15hTBA 0.75 ± 0.07 46.8 ± 0.1
15fTBA 0.41 ± 0.17 48.8 ± 0.1
29hTBA 64.17 ± 4.81 40.4 ± 0.2
29fTBA 18.81 ± 8.60 36.5 ± 0.1
29hTBAm 10.80 ± 1.52 39.2 ± 0.2
Table 3.3: Monovalent ions apparent dissociation constant (Kd) and melting temperatures
(Tm) of tested aptamers determined by CD spectroscopy in buffer containing 50 mM KCl.
3.3.3 Binding analysis on 29hTBA and mutants to the human thrombin
The mutant oligonucleotides showed large variability in terms of folding and variability, we
can assume such a structural plasticity can largely affect their recognition properties of the
target protein. Thus, we performed a comparative analysis of thrombin binding efficiency by
means of Electrophoretic Mobility Shift Assay (EMSA), a straightforward method to study
Gq DNA-protein binding. [88] A summary of the results is reported in figure 3.6. We can
assume that, in suitable conditions, the protein concentration required to retard DNA chains
is directly related to the DNA-protein binding affinity and stability. This approach allowed
us to identify the following binding affinity ranking order
29fTBA>29hTBAds≥29hTBAnp>29hTBA=29hTBAm>>23hTBAss. (Fig. 3.6)
These findings highlight how our modifications can largely affect the recognition of the
physiological target. In particular the loss of the 5’ flanked chain brings to a dramatically
reduction in aptamer-protein complex formation. This evidence perfectly agrees with our
past results that highlighted how the binding presents an outstanding electrostatic component
given by the charge-charge interactions between DNA phosphate backbone and the
numerous basic amino acids localized on thrombin surface. This model is further reinforced

60
by the complete loss of affinity for the 23hTBAds, a 29hTBAds analogue presenting shorter
flanking sequences (3nt instead 7nt). This last electrophoretic analysis evidenced that a
minimal sequence difference of 4 nucleotides at the 3’ and 5’ ends is the structural cut off
between an active binder and an inactive one.
It is worth to underline that a perfect pairing of the 7nt residues of the 3’ and 5’ terminals
(29hTBAds), seems to increase the affinity in comparison to the reference DNA sequence,
proving that the duplex domain actively participates in specific interactions with the
thrombin.
Surprisingly, the presence of not paired terminal modules (29hTBAnp) did not reduce the
protein affinity as we could expect.
Our expectation was actually based on the structural differences that this sequence showed
in K+ containing solutions. However, we should keep in mind that the protein can work as a
chaperon likely forcing even 29hTBAnp toward a thrombin-suitable conformation.
To evaluate in which manner loop composition modulates 29mer aptamer-protein
recognition, we investigated the behaviour of 29hTBAm and 29fTBA in the presence of an
increasing amount of thrombin. Our results indicate that the protein concentrations required
to completely retard the 29hTBAm is fully comparable with the one of the 29hTBA protein
binding profile, so a minimal mutation in the minor loop seems not able to alter the
recognition ability of 29hTBAm.
Distinctly, the analogous 29fTBA showed the higher affinity in the mutant series.
Additionally, it showed an unique behaviour. Indeed, by analysing the electrophoretic
mobility shift induced by increasing protein concentrations we can distinguish two different
retarded DNA form,
Clearly, this suggests the formation of protein-DNA complexes with different stoichiometry.
By comparing the electrophoretic mobility of these species with those obtained with
comparable length we can propose that the first complex represents a 2:1 DNA-thrombin
complex whereas the second one, occurring at higher thrombin concentration, corresponds
to a single DNA chain bound to one thrombin.
Regarding the structural modules involved in binding, further questions deserve to receive
our attentions: which is the specific role of the guanosine tetrads in the binding event? Do
they directly interact with the target according to their peculiar folding or are only required
61
to properly force the loops in specific arrangement required for the binding? Without a
strong set of structural data that could define properly the interactions occurring at the G-
quadruplex-protein interface, we try to answer the question by studying an additional
guanosine rich sequence.
The 14hTBAhp is composed only by the two 29hTBA’s eptanucleotides ends covalently
linked, without the G-rich core that characterizes the reference aptamer. For this shorter
sequence, EMSA assay showed that the ability to recognize the target is totally lost. This
finding could suggest that both an individual bulge loop motif (14hTBAhp) and minimal
modifications of loop nucleotides between two antiparallel G quadruplex form (29hTBA and
29fTBA) could strikingly modulate the binding tendency. Hence, we can propose G-tetrads
as important structural elements involved in the binding but we also need to consider the
additional modular elements of the aptamer, such as the loops nature and length and the
specific flanked sequences.
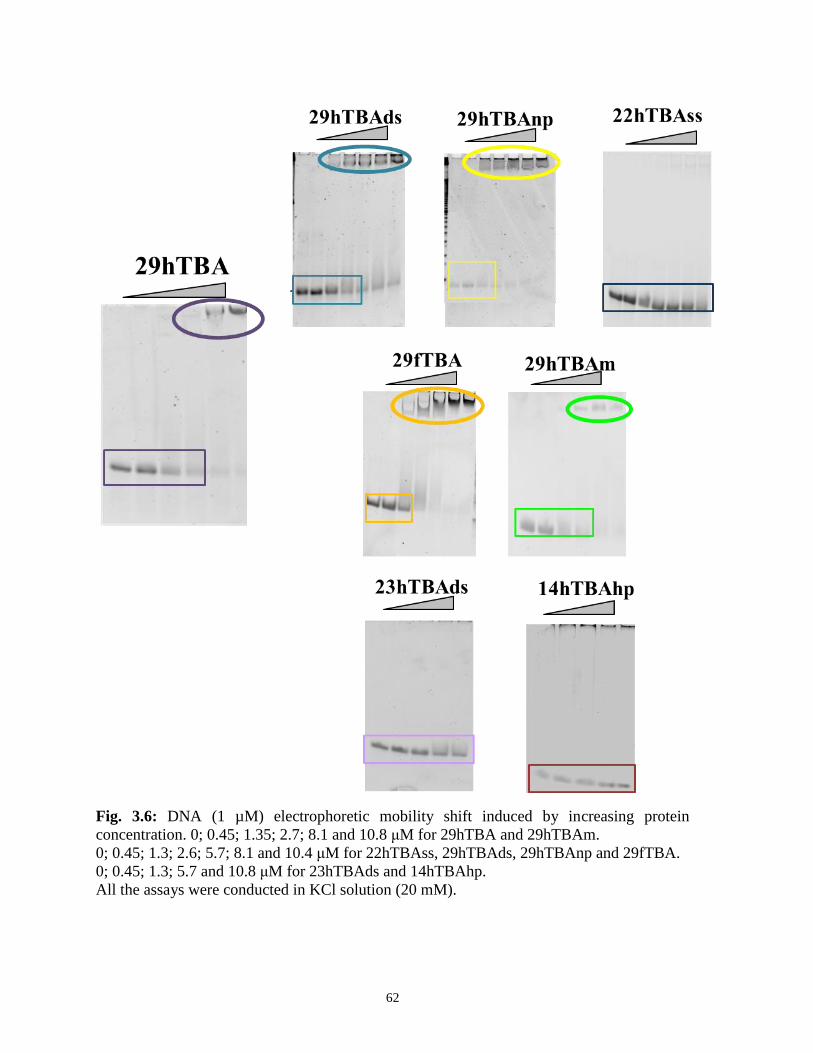
62
Fig. 3.6: DNA (1 µM) electrophoretic mobility shift induced by increasing protein
concentration. 0; 0.45; 1.35; 2.7; 8.1 and 10.8 μM for 29hTBA and 29hTBAm.
0; 0.45; 1.3; 2.6; 5.7; 8.1 and 10.4 μM for 22hTBAss, 29hTBAds, 29hTBAnp and 29fTBA.
0; 0.45; 1.3; 5.7 and 10.8 μM for 23hTBAds and 14hTBAhp.
All the assays were conducted in KCl solution (20 mM).

63
3.3.4 Mapping the thrombin binding sites, a multiple characterization
To go into the details of binding properties of 29fTBA and 29hTBAnp mutants, we carried
out a series of electrophoretic competition assays. In this case we took advantage of the
availability of two the fluorescein labelled TBAs (15fTBA and 29hTBA). They were
opportunely mixed with the unlabelled competitor DNA mutants and thrombin (Fig. 3.7 and
3.8).
For this experimental assay when a potential competitor is added to the protein-aptamer
mixture, a restoration of the unbound aptamer (defined by a major electrophoretic mobility),
could be expected if the added sequence is defined by an higher affinity for the same
binding site.
According to the different exosite selectivity of 15fTBA and 29hTBA this approach allows
us to map at which site the competition eventually occurs.
The selectivity of the 29hTBAnp for the heparin binding domain is fully confirmed by the
gel competition assay. Indeed the addition of this oligonucleotide fully suppresses
complexion only of the 29-mer binder labelled (Fig. 3.7 lane C’). This result could be
explained only assuming a clear preference of the 29hTBAnp for the exosite II.
Conversely, when we stain the EMSA gel with a nucleic acid binding dye, in the lanes
containing the combination 15fTBA fluo/29fTBA (Fig. 3.8 lane C) and 29hTBA
fluo/29fTBA in the presence of thrombin (Fig. 3.8 lane) we were not able to detect a clear
band referring to single strand DNA in the free form. This finding could indicate that in both
cases the two DNA sequences co-incubated are simultaneously bound to the thrombin.
Thus, we can presume that 29fTBA hampers the protein target even if is partially buried by
one of the two fluorescent aptamers.
To sum up, the binding behavior of the 29fTBA opens new scenarios for the conventional
thrombin recognition patterns, suggesting new possible thrombin interaction modes for this
hybrid thrombin binding aptamer.
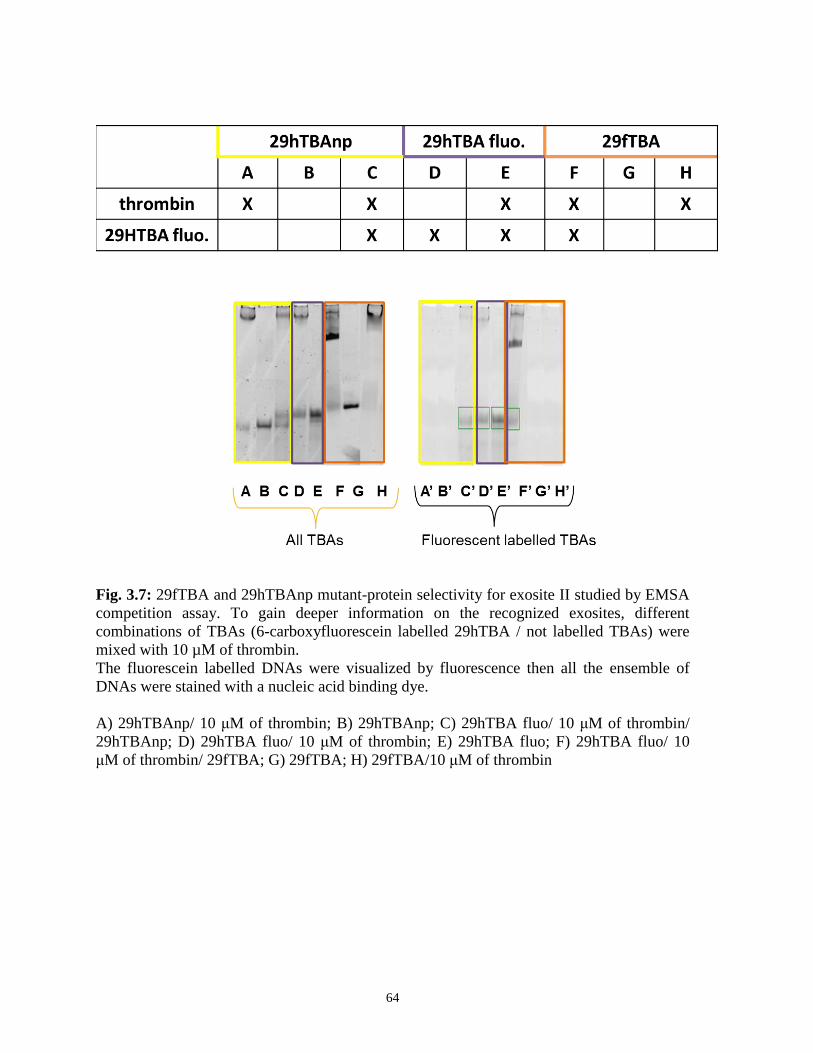
64
Fig. 3.7: 29fTBA and 29hTBAnp mutant-protein selectivity for exosite II studied by EMSA
competition assay. To gain deeper information on the recognized exosites, different
combinations of TBAs (6-carboxyfluorescein labelled 29hTBA / not labelled TBAs) were
mixed with 10 µM of thrombin.
The fluorescein labelled DNAs were visualized by fluorescence then all the ensemble of
DNAs were stained with a nucleic acid binding dye.
A) 29hTBAnp/ 10 μM of thrombin; B) 29hTBAnp; C) 29hTBA fluo/ 10 μM of thrombin/
29hTBAnp; D) 29hTBA fluo/ 10 μM of thrombin; E) 29hTBA fluo; F) 29hTBA fluo/ 10
μM of thrombin/ 29fTBA; G) 29fTBA; H) 29fTBA/10 μM of thrombin

65
Fig 3.8: 29fTBA and 29hTBAnp mutant-protein selectivity for exosite I studied by EMSA
competition assay. To gain deeper information on the recognized exosites, different
combinations of TBAs (6-carboxyfluorescein labelled 15fTBA / not labelled TBAs) were
mixed with 10 µM of thrombin.
The fluorescein labelled DNAs were visualized by fluorescence then all the ensemble of
DNAs were stained with a nucleic acid binding dye.
A) 15fTBA fluo; B) 15fTBA fluo / 10 μM of thrombin; C) 15fTBA fluo/ 10 μM of
thrombin/ 29fTBA; D) 29fTBA; E) 29fTBA/10 μM of thrombin F) 15fTBA fluo/ 10 μM of
thrombin/ 29hTBAnp; G) 29hTBAnp/ 10 μM of thrombin; H) 29hTBAnp.
To better characterize the different thrombin binding behavior showed by these DNA
sequences we performed also fluorescence titrations.
Direct DNA-protein titrations are difficult due to the overlapping absorbion/emission
bands.of the two macromolecules Thus, we applied an experimental protocol based on the
changes in fluorescence intensity of the above described fluorophore-labelled aptamers upon
binding to thrombin. Because fluorescence is dependent on the molecular environment

66
around the fluorophore, close contacts between a labeled molecule and an interacting specie
are expected to result in measurable changes of fluorescence intensity.
With reference to the electrophoretic approach used in the EMSA assays (appropriate for a
first screening) this technique allows to rigorously monitor the protein free and bound DNA
at equilibrium conditions.
As aptameric sequences we used 3’-FAM labeled 15fTBA and 29hTBA and we monitored
changes of FAM florescence (λex 495 nm, λem 518 nm) upon the addition of the target
protein. The protein caused a reduction of the maximum fluorescence emission of the probe
showed for both labelled aptamers (around 16% and 23.4% for 15fTBA and 29hTBA,
respectively) thus indicating a change in the molecular environment around the 3’ bound
label due by the effective complex formation (Fig. 3.9).
For the first reported aptamer, 15fTBA, the dissociation constant (Kd) calculated according
to one binding site model was 184 nM. Distinctly, the 29 nt binder, 29hTBA, presents a
stronger affinity with a Kd of approximately of 20 nM. The ratio between the two
dissociation constants is consistent with those resulting from original literature data. [74]
In particular, in the pioneer work of Tasset et al [74] a Kd of 0.5 nM, and 20 nM were
reported for 29hTBA and 15fTBA, respectively. These values were obtained by a
nitrocellulosa filter binding analysis. This last finding suggest a general consideration: how
the technique employed and the sensibility of the analytical methods can influence
remarkably the value that defines the same recognition event.
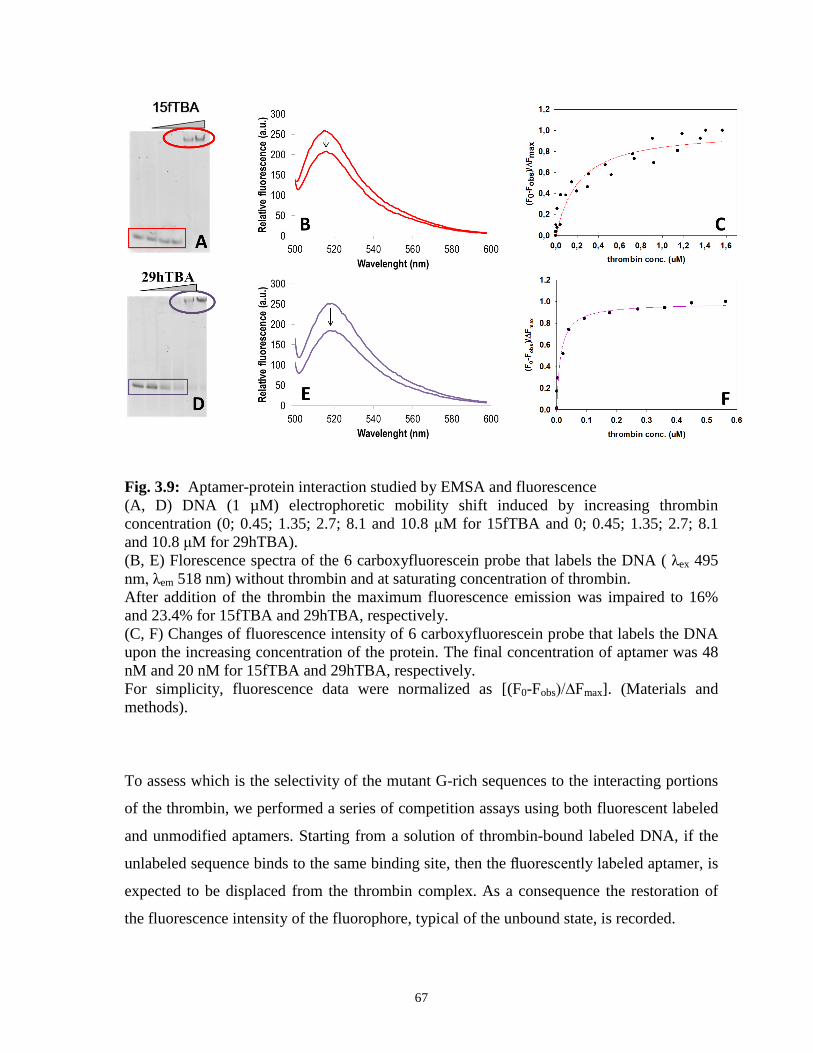
67
Fig. 3.9: Aptamer-protein interaction studied by EMSA and fluorescence
(A, D) DNA (1 µM) electrophoretic mobility shift induced by increasing thrombin
concentration (0; 0.45; 1.35; 2.7; 8.1 and 10.8 μM for 15fTBA and 0; 0.45; 1.35; 2.7; 8.1
and 10.8 μM for 29hTBA).
(B, E) Florescence spectra of the 6 carboxyfluorescein probe that labels the DNA ( λex 495
nm, λem 518 nm) without thrombin and at saturating concentration of thrombin.
After addition of the thrombin the maximum fluorescence emission was impaired to 16%
and 23.4% for 15fTBA and 29hTBA, respectively.
(C, F) Changes of fluorescence intensity of 6 carboxyfluorescein probe that labels the DNA
upon the increasing concentration of the protein. The final concentration of aptamer was 48
nM and 20 nM for 15fTBA and 29hTBA, respectively.
For simplicity, fluorescence data were normalized as [(F0-Fobs)/∆Fmax]. (Materials and
methods).
To assess which is the selectivity of the mutant G-rich sequences to the interacting portions
of the thrombin, we performed a series of competition assays using both fluorescent labeled
and unmodified aptamers. Starting from a solution of thrombin-bound labeled DNA, if the
unlabeled sequence binds to the same binding site, then the fluorescently labeled aptamer, is
expected to be displaced from the thrombin complex. As a consequence the restoration of
the fluorescence intensity of the fluorophore, typical of the unbound state, is recorded.

68
This study was performed using the high affinity 29hTBA aptamer. By comparing the
experimental results, we observed that the 29hTBAds and 29hTBAnp were able to
completely displace the labeled aptamer with a similar profile (Fig. 3.10 and table 3.4).
Otherwise, the 29fTBA, already characterized by unique folding properties and binding
behavior, seems to be not able to displace 29hTBA from the exosite II (Fig. 3.10 and table
3.4).
This surprising outcome could indicate how a minimal change in the loop sequence, from
GCA to the TGT of the 29fTBA, drives the selectivity on an accessory binding domain
distinct from the exosite II.
unlabelled DNA conc. (uM)
0 1 2 3 4 5 6 7
(Fm
ax
-Fo
bs
)/F
max
0.0
0.2
0.4
0.6
0.8
1.0
1.2
1.4
29hTBAnp
29hTBAds
29fTBA
Fig. 3.10: Aptamer-protein selectivity studied by fluorescence spectroscopy
Relative variation of the fluorescence intensity of labeled 29hTBA (0.02 µM) bound to with
thrombin (0.18 µM) upon increasing concentrations of nucleic acid competitors.
The fluorescence data, for the competition assay, were expressed as the following [(Fmax-
Fobs)/∆Fmax].

69
EC50 (µM)
29hTBAds 0.51 ± 0.01
29fTBA n.d. (*)
29hTBAnp 0.19 ± 0.04
Table 3.4: EC50 of tested aptamers for the 5’-fluorescein 29hTBA bound to the target,
determined by fluorescence spectroscopy in buffer containing 50 mM KCl.
n. d. not determined
(*) The displacement entity was not calculated due to a negligible change of the
fluorescence intensity of FAM bound to the aptamer during the titration with the competitor.
3.3.5 Modulation of aptamer properties by sodium monovalent ion.
The previous sections underlined how 29fTBA showed a peculiar thrombin binding profile
irrespectively to a folding behaviour comparable to 29hTBA in K+ containing solutions.
Nevertheless K+ is not the only physiologically relevant G4 stabilizing ion. In particular,
owing to its physiological importance, the other best studied monovalent ions is Na+.
Structural studies indicated that potassium and sodium ions are placed between or within the
cavities formed by stacked planar arrays, respectively. [21, 22]
Due to this different binding mode the polymorphism exhibited by G-quadruplexes is
largely influenced by selective interactions of the G-tetrads with different cations. [8, 18]
Thus, we decided to investigate if the remarkable aptamer features observed in the presence
of K+ are somehow conserved also in the presence of Na
+. As target sequences we selected
29hTBA and 29fTBA. Addition of sodium to 29hTBA did not change remarkably the
undefined CD pattern, recorded under deficient metal ion concentration and which is
reasonably given by a high fraction of disordered DNA molecules (Fig. 3.11). In particular,
sodium promotes only a modest increment of the positive peak at 292 nm that suggests a
minimal chiroptical contribution given by a low fraction of molecules adopting the
antiparallel form (Fig. 3.11). More interesting results derived from the analysis of the Na+
driven 29fTBA folding. In this case the metal ion promotes a remarkable increment of the
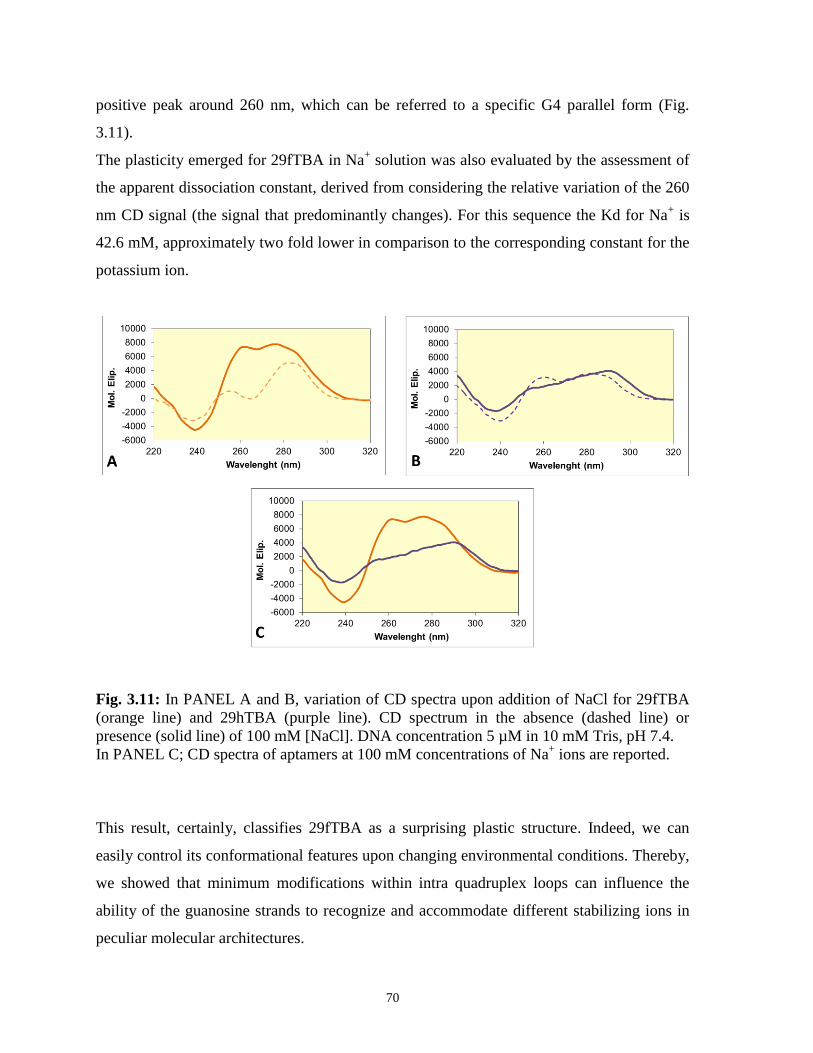
70
positive peak around 260 nm, which can be referred to a specific G4 parallel form (Fig.
3.11).
The plasticity emerged for 29fTBA in Na+ solution was also evaluated by the assessment of
the apparent dissociation constant, derived from considering the relative variation of the 260
nm CD signal (the signal that predominantly changes). For this sequence the Kd for Na+ is
42.6 mM, approximately two fold lower in comparison to the corresponding constant for the
potassium ion.
Fig. 3.11: In PANEL A and B, variation of CD spectra upon addition of NaCl for 29fTBA
(orange line) and 29hTBA (purple line). CD spectrum in the absence (dashed line) or
presence (solid line) of 100 mM [NaCl]. DNA concentration 5 µM in 10 mM Tris, pH 7.4.
In PANEL C; CD spectra of aptamers at 100 mM concentrations of Na+ ions are reported.
This result, certainly, classifies 29fTBA as a surprising plastic structure. Indeed, we can
easily control its conformational features upon changing environmental conditions. Thereby,
we showed that minimum modifications within intra quadruplex loops can influence the
ability of the guanosine strands to recognize and accommodate different stabilizing ions in
peculiar molecular architectures.

71
As previously described, 29fTBA sequence exhibits a peculiar Na+-driven folding, thus we
decided to investigate the binding affinity of the sequence in the presence of this metal ions.
Noticeably, the presence of a sodium-driven parallel form does not influence the recognition
process in terms of EMSA binding profile as reported in figure 3.12.
In addition, we can observe that the higher ionic strength of the medium (100 mM NaCl)
does not impair the inter-molecules binding, suggesting that the folded form adopted in
sodium solution recognizes the target specifically with a molecular event that requires a
minimal contribution of the electrostatic forces.
Otherwise, for the same 29fTBA sequence, an increment of K+ potassium concentration
from 20 mM to 100 mM disturbs significantly the binding of the target, avoiding a complete
complexion of the protein as reported in the figure 3.13.
Conversely, for 29hTBA sequence, high ionic conditions (100 mM KCl/NaCl) reduces the
thrombin binding ability of the aptamer, irrespectively of the metal ions (Fig. 3.13).
Fig. 3.12: . DNA (1 µM) electrophoretic mobility shift induced by increasing protein
concentration (0; 0.45; 1.3; 2.6; 5.7; 8.1 and 10.4 μM) for 29hTBA and 29fTBA in 100 mM
Na+ concentration (dashed lines).

72
Fig. 3.13: Percentage of aptamers bound to thrombin occurring at increasing concentration
of thrombin at different ionic strength/buffer conditions (10 mM KCl, 100 mM KCl and 100
mM NaCl). The binding assay was conducted via EMSA.
In the previous experiments we largely described the binding events in terms of affinity and
specificity, in this last part we wanted to answer to the following open question: the
complexion with the thrombin could promote a conformational change in the DNA
template?
The chaperon-like activity of the thrombin is connected to its ability to promote the folding
of the 15 monomers aptamer in cation-deficient-conditions. This property has been
described in details both in the previous chapter and in the literature. [71, 104]
Due to the peculiar results herein reported for some longer sequences we focused on the
aptamer 29hTBA and the 29fTBA mutant in sodium and potassium conditions in order to
fulfill the issue in an complete manner.
To investigate the DNA folding rearrangement induced by the protein we adopted the
differential circular dichroism.
This approach allows us to monitor the overlapped chiroptical contributes of DNA and the
protein, firstly separated in the two compartments of the cuvette and then mixed.
Hence, the differential CD spectrum can be helpful in describing the structural
rearrangements of the two macromolecules that undergo upon binding. (Fig. 3.14)

73
As an example, the subtraction of the differential spectra of both 29hTBA and 29fTBA in K+
clearly showed absence of DNA arrangement (no signal is detected in DNA absorption
region) (Fig. 3.15 PANELS A and C). This support that the folding of these aptamers
promoted by the monovalent ion is essentially preserved in the presence of the protein.
Conversely, we could detect a rearrangement upon thrombin binding undergone for the
29fTBA in sodium condition (Fig. 3.15 PANEL D). By overlaying the DNA chiroptical
contribute in presence and in absence of the thrombin we can identify a shift of the positive
maximum from 260 to a new 295 nm signal. This finding indicates a conversion of the Na-
promoted parallel form to a newly thrombin-driven antiparallel form. The conclusion
follows that specific chaperon activity of the thrombin, in sodium condition, is conserved
also for the 29fTBA sequence.
Considering the previous spectroscopic analysis we can propose the antiparallel G4 as the
specific thrombin binding structure.
The conformational behaviour of the 29hTBA in sodium condition results less clear.
We can observe a minimal increase of the positive peak at 260 nm followed by a decrease of
the 290 nm signal, both induced upon thrombin addition. This CD pattern change could be
given by a minimal contribute of DNA (we should take in mind that in sodium condition the
29hTBA is mainly unfolded) and a contribute given by the intrinsic CD spectrum of the
protein, evidenced as the decrease of the signal in the far UV region (around 212 nm) and a
reduction in the near UV region (around 285 nm). Both CD changes could be due to
structural arrangement in the protein secondary structure and in the environment of the
tryptophan residues.

74
Fig. 3.14: Example of a differential circular dichroism analysis. Overlapping of the CD
spectra referring to free protein (black line), the free protein and free DNA separated (gray
line) and the protein-DNA mixed (light gray line).
Fig. 3.15: In PANEL A, B, C and D, the far-UV CD spectra of thrombin mixed with an
equivalent concentration of 29hTBA (PANEL A and B) or 29fTBA (PANEL C and D)

75
subtracted of the corresponding CD spectra registered with thrombin/aptamers separated in
the two compartments of the cuvette, recorded in the presence of 50 mM KCl (PANELS A
and C) and 150 mM NaCl (PANELS B and D). Final DNA concentration 0.5 µM in 10 mM
Tris, pH 7.4.
The protein DNA molar ratio adopted for this assay was 1:1.
Fig. 3.16: Differential CD spectra of 29fTBA mixed/unmixed with thrombin.
In PANEL A and B; the CD spectra with DNA contribute not mixed (gray line) or mixed
(black line) with an equimolar concentration of thrombin.
Differential CD spectra are reported for 29fTBA in 50 mM KCl (PANEL A) or 150 mM
NaCl (PANELS B) respectively.
Final DNA concentration 0.5 µM in 10 mM Tris, pH 7.4.
The protein DNA molar ratio adopted for this assay was 1:1.

76
3.4 Conclusions
The high thrombin affinity reported for 29hTBA has been previously described as the results
of the combination of two binding domain: one included in the G4 core and one provided by
the double helix domain.
However, a detailed observation underlined more structural moieties which can be critical to
provide the best interaction of the two macromolecule. This is the case, for example, of the 2
couple of 3 residues which connect the above mentioned domains as well as the G4 loops.
The characterization of the role of these different structural motifs in defining the functional
architecture of the nucleic acid is a promising goal in the to improve the effectiveness of this
active biomolecule. In this work we exploited this aim by designing a series of
oligonucleotides resulting from rational modifications of single structural motifs of
29hTBA. Conformational studies highlighted that the pairing extension of the flanked arms
could influence the conformational equilibria, in a surprising wide scenario of folding
adopted: they can promote double strand forms (flanked sequence completely paired) or
alternatively G-quadruplex parallel folding (terminal arms not paired). This multiple
behaviour confirms and highlights the role of the stem loops in driving G tetrads
arrangement.
A detailed analysis of protein recognition of quadruplex – duplex coexisting forms, a
constitutive feature of the 29nt aptamer, represents an issue that can be extended to a
physiological context where the guanosine stretches of chromosomal DNA equilibrate
between an Hoogsteen bonded quadruplex and a Watson–Crick hydrogen bonded duplex,
formed with the C-rich complementary strand. A further comment must be deserved to the
role of intra G-quadruplex loop composition, a crucial element in aptamer target affinity.
The nature of the loops seems not influence the folding adopted, but has a role in defining
the strength and specificity of metal ion accommodation within the folded structures. In
particular, the mutant 29fTBA sequence, a 29hTBA and 15fTBA hybrid, can adopt multiple
folding, depending on the nature of the monovalent metal cations. To sum up, the ensemble
of the structural appendages that dress the minimal G quadruplex core cooperates in a
reciprocal tendency in modulating the flexibility of the DNA structure, meant as thermal
stability, cation recognition, multiple conformational co-existence, etc.
77
However, our principal aim was pointed to dissect and clarify the minimal structural
elements required to properly retain and enhance the target affinity. By a multi-approach
analysis of the protein-DNA interaction we were able to clearly identify some fundamental
aspects of the binding.
Firstly, a minimal amount of negative charges (given by the phosphate backbone) has to be
maintained in the structure, suggesting an substantial contribution of charge-charge
interactions to the binding event. In line, an extended linear charged portions protruding
from the G4 core irrespectively of its pairing grade, thought influencing largely the
conformation adopted, does not affect both the thrombin binding recognition process and a
common preferences for exosite II, as emerged by the multiple competition assays.
Additionally, by joining 29hTBA partially paired motifs into 15fTBA, a remarkable and
peculiar affinity profile emerged. From the EMSA binding profiles and the displacement
study we can suppose that this 15f/29hTBA hybrid aptamer binds the target on an
unusual/novel recognition site.This site is apparently poorly affected by ionic strength. Thus
showed further it does not involved the highly charged exosite I and exosite II. To conclude,
we identified a structural model consisting of a G-quadruplex core able to orient the other
flexible elements and a flanked region unnecessarily paired that should bring a precise
number of negative charges. Additionally, early results indicate that the molecular plasticity
of aptamers appears to have a primary role in promoting the affinity to the target. This
flexibility could be described by multiple parameters such as its ability to undergo toward
structural equilibria, the thermal stability of those structures and the tendency to recognize
and accommodate in a proper way different cations. All these aspects define the ability of
DNA sequence to adapt its surface toward the target during the recognition process. All the
previous concepts could represent important structural findings for the rational design of
new modified aptamers for use in anticoagulant therapies.
The data included in the sections 3.3.2 and 3.3.3 have been published:
G. Marson, M. Palumbo, S. Claudia; Structural and functional characterization of thrombin
binding aptamer minor loop. International Review of Biophysical Chemistry (I.RE.Bi.C.).
2011; 2 (3)

78
4. Role of the loops on G-quadruplex flexibility
4.1 Introduction
Among G-quadruplexes, variation in loop length and composition affects quadruplex
topology, stability and the already underlined molecular recognition. [14, 92, 100]
To better define this issue we investigated the role of the loops on the structural features
taking advantage of the use of a specific chemical probe, the anticancer cisplatin [cis-
PtCl2(NH3)2] (Fig. 4.1).
Fig. 4.1: Chemical structure of Pt-complex, we adopted as chemical probe.
Pt(II) compounds efficiently form stable DNA adducts with a preference for guanine (N7 of
dG) and to a lesser extent for adenine (N1 and N7 of dA) through a mechanism that involves
one or two spatially closed residues. [105] Obviously, the specific conformational feature of
its target DNA sequence plays a prominent role in modulating the accessibility of this metal-
based chemotherapeutic. For instance, in the G-quadruplex template all guanine residues are
paired in Hoogsteen bonds, with the nitrogen atoms at position 7 involved in hydrogen
bonding and thus not suitable for platination.
Indeed, it has been confirmed that G4 folded conformation could drive the reactivity toward
another base residues (inside loop motifs). Thus, G4 folding can protect the DNA from
metal-mediated modification. [106, 107]
In particular, G4 can promote Pt reactivity toward other residues in comparison to
guanosines (mainly adenosine) that are more assessable, being located in the loops.[108]

79
However, if we look at this property from the opposite point of view, platination can
represent a valid strategy to assess the relevant folding polymorphisms (un/folding
equilibrium for a target G-structure).
To properly assess the Pt-driven conformational tenability, two DNA sequences attracted
our attention, since according to their loop they could be differentially recognize by
chemical probes. In particular here we tasted the 15 nt thrombin binding aptamer (15fTBA)
[55] and the bombyx mori telomeric sequence (BMT).[109]
These DNA sequences were selected according to precise requisites: their g4 structures have
been solved by NMR studies and a similar antiparallel intramolecular G-quadruplex
structure formed by two-layer G-tetrad core and three edgewise loops at saturating
concentrations of K+ ions has been proposed for both. [67, 110]
To fulfill the above requirements the used BMT sequence was mutated in comparison to the
wild type sequence, in particular an U substituted the T at position 16. This mutation has
been shown to favor the folding of the sequence into a single G-quadruplex form.[110]
Figure 4.2: Schematic representations of the oligonucleotides studied
Despite a similar three dimensional arrangement 15fTBA and BMT they vary for loop
nature and composition, thus represent two similar but distinct systems suitable for a deep
analysis of loop influence on DNA plasticity. Indeed, two distinct platination site patterns
are present in the loops: A2, A7, A12 and A17 (thus, only adenosines) for the BMT and G8
for the 15fTBA, therefore defining two optimal comparative systems for the specific
experimental analysis we are going to perform.

80
We wondered to point out if these minimal structural variations can largely influence the
conformational fluctuations in the quadruplex conformers occurring at different platinum
conditions.
4.2 Materials and Methods
4.2.1 Materials
HPLC purified oligonucleotides were purchased from Eurogentec (Serain, Belgium) as
lyophilized powder and solubilized in 10 mM Tris, 1 mM EDTA, pH 7.4. Oligonucleotide
concentration was determined by UV absorbance at 260 nm. Before each experiment, DNA
solutions were heated up to 95°C for 5 minutes and slowly cooled down at room temperature
overnight in the required buffer. Stock solution of cis-Pt-complex was prepared in MilliQ
water and stored at -20 °C in the dark.
15fTBA
BMT
5’- GGTTGGTGTGGTTGG -3’
5’- TAGGTTAGGTTAGGTUAGG -3’
Table 4.1: Sequences reported for oligonucleotides studied.
4.2.2 Methods
Circular dichroism (CD). Circular dichroism spectra from 230 to 320 nm were recorded
using 10 mm path length cells on a Jasco J-810 spectropolarimeter equipped with a Peltier
temperature control system in 10 mM Tris-HCl, pH 7.4 containing the 85 mM KCl
concentration. The reported spectrum of each sample represents the average of 3 scans
recorded with 1-nm step resolution. Observed ellipticities were converted to mean residue
ellipticity [θ] = deg x cm2 x dmol
-1 (Mol. Ellip.).
Solutions were titrated with the concentrated cisplatin solution (3.33 mM), by stepwise
addition of aliquots until a final [Pt] of 500 µM.

81
Time driven CD spectra were recorded regularly within 28 hours of incubation at 25 °C in
the presence of a 1/10/100 molar excess of the metal complex probe.
Adduct formation on distinct DNA sequences. Single- stranded 5’-fluorescein labeled
1fTBA (µM) was incubated at increasing concentrations of cisplatin (in presence/absence of
a concentration of thrombin equimolar to DNA) in order to obtain the following DNA : Pt-
complex molar ratios: 1:100, 1:10 and 1:1 at 25 °C for 28 h in 10 mm Tris, 85 mM KCl, pH
7.5. The reaction mixtures were lyophilized, and the samples were resuspended in 5 µL 80%
formamide containing 0.1% xylene cyanol and bromophenol blue. Denaturing gel
electrophoresis was performed with 20% polyacrylamide gels (19:1
acrylamide/bisacrylamide) in 1X TBE. DNA was visualized by recording the fluorescence
emission of the fluorescein label in a Storm 840 (Amersham).
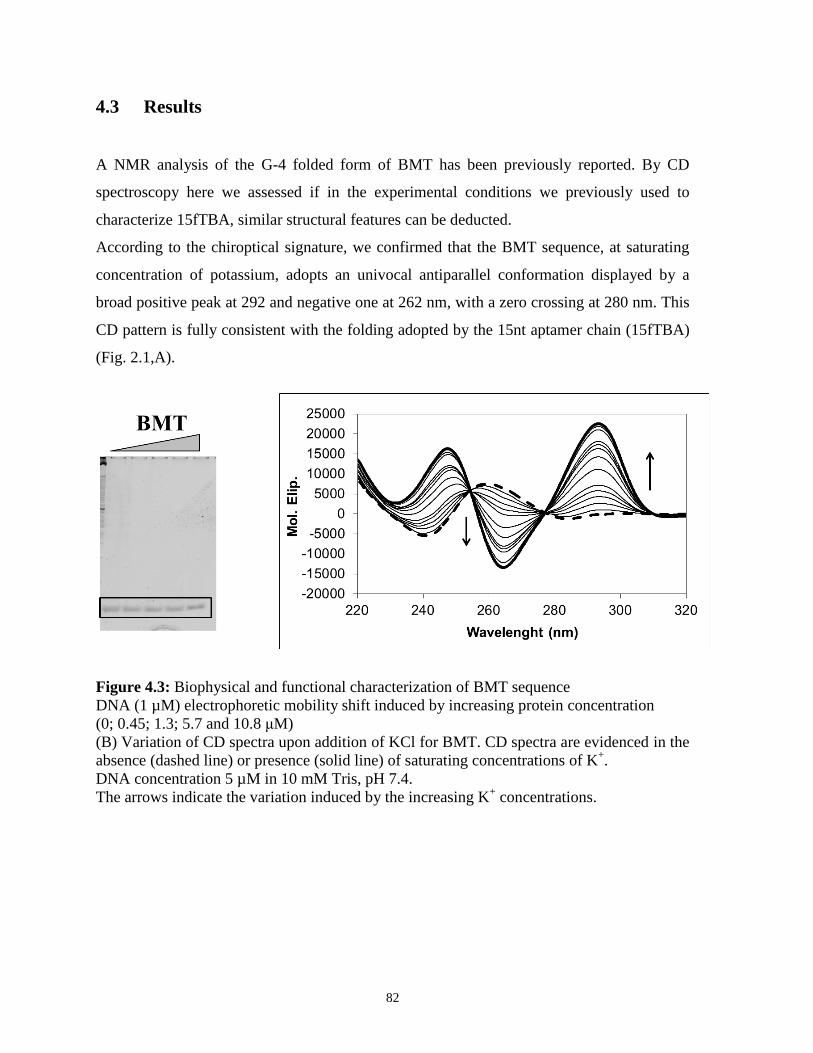
82
4.3 Results
A NMR analysis of the G-4 folded form of BMT has been previously reported. By CD
spectroscopy here we assessed if in the experimental conditions we previously used to
characterize 15fTBA, similar structural features can be deducted.
According to the chiroptical signature, we confirmed that the BMT sequence, at saturating
concentration of potassium, adopts an univocal antiparallel conformation displayed by a
broad positive peak at 292 and negative one at 262 nm, with a zero crossing at 280 nm. This
CD pattern is fully consistent with the folding adopted by the 15nt aptamer chain (15fTBA)
(Fig. 2.1,A).
Figure 4.3: Biophysical and functional characterization of BMT sequence
DNA (1 µM) electrophoretic mobility shift induced by increasing protein concentration
(0; 0.45; 1.3; 5.7 and 10.8 μM)
(B) Variation of CD spectra upon addition of KCl for BMT. CD spectra are evidenced in the
absence (dashed line) or presence (solid line) of saturating concentrations of K+.
DNA concentration 5 µM in 10 mM Tris, pH 7.4.
The arrows indicate the variation induced by the increasing K+ concentrations.

83
Kd (mM) Tm (°C)
15fTBA 0.41 ± 0.17 48.8 ± 0.1
BMT 7.93 ± 3.19 45.0 ± 0.2
Table 4.2: Apparent K+ dissociation constant and melting temperatures (Tm) of tested
aptamers determined by CD spectroscopy in buffer containing 50 mM KCl.
The Kd determined for the BMT is lower respect to the one previously reported for 15fTBA.
However, differences in the two oligonucleotide sequences does entail a notably change of
the melting temperatures, as reported in table 4.2. This finding suggests that the thermal
stability of pure antiparallel G4 form is barely influenced by loop nature.
As expected and experimentally confirmed by EMSA the common structural feature of the
two tested G4 do not grant to the BM telomeric sequence to recognize thrombin, the protein
target of 15fTBA.
Afterwards, circular dichroism was applied to preliminary assess if platination can cause the
structural changes in the analogous antiparallel G quadruplex. The experiments were
performed at K+ concentration of 85 mM where the full conversion into the antiparallel G-
quadruplexes form was confirmed for both sequences.
Upon addition of increasing amounts of cisplatin, the CD spectra of the K+-induced
quadruplexes did not promptly changed of the CD (Fig. 4.3.A,B). This finding is consistent
with the literature data that indicate how the reactivity of cisplatin toward DNA is connected
to its conversion into reactive aqua species, a slow reaction which requires few hours to be
fully activated.[111]
Accordingly, by increasing incubation time with the tested Pt probe, clear perturbations of
CD signal emerged for both DNA sequences.
However, as reported in figure 4.3, this effect is largely dependent upon cisplatin/DNA
molar ratio. Indeed, it is maximal in the presence of a large molar excess of metal complex
but completely absent when the ligand was added at stoichiometric ratio.
We can assume that when the metal complex is added at stoichiometric ratio, platination
occurs but preferentially at the reactive DNA residues located in the loop (G or A for
15fTBA and BMT, respectively). Conversely, by increasing the metal probe concentration
(up to hundred-fold molar excess), platination can occur also on the accessible stacked

84
guanosines, thus competing with the stabilizing hoogsten network. This competition bring to
a time-driven disruption of the G4 structure, monitored through the variations of the CD
spectra (Fig. 4.3.C,D).
Figure 4.3: In PANELS A and B; Variation of CD spectra upon addition of cis-Pt for
15fTBA (red line) and BMT (black line).

85
CD spectra in the absence (solid line) or presence (dotted line) of 500 equivalents of Pt ions
are evidenced. DNA concentration 5 µM in 10 mM Tris, 85 mM KCl, pH 7.4.
In PANELS C and D; Variation of CD spectra induced by a 1:1; 10:1; 100:1 cisplatin/DNA
molar ratio recorded for 28 hours in 10 mM Tris, 85 mM KCl, pH 7.4 at 25 °C for 15fTBA
(red line) and BMT (black line).
In PANEL E; Time-driven relative variations of the CD intensities recorded at 295 nm
induced by a 1/10/100 fold molar excess of tested cis-Pt on 15fTBA (red lines) and BMT
(black lines) in 10 mM Tris, 85 mM KCl, pH 7.4 at 25 °C.
However, the kinetic of platination on the G quartets determined the changes of the
characteristic CD pattern upon incubation time. In may be not intrinsically related to the
adduct formation.
To overcame this intrinsic drawback of the technique we resolved by denaturing
polyacrylamide gel electrophoresis the platinum-DNA reaction products, taking advantage
of the availability of the fluorescein 15fTBA. This approach allows the analysis of stable
adduct formation at single base resolution. [112]
For the 15fTBA substrate we performed an incubation with the metal complex adopting two
different incubation times (21 and 28 hours) in order to analyze the kinetic profile of the
DNA adduct formation. The reaction was performed at 25 °C, in 85 mM K+. The results are
reported in Figure 4.4. The gels showed a progressive decrease of the free DNA upon
increasing Pt complex concentration which is associated to the appearance of lower mobility
bands. These corresponds to the platinated DNA.
Additionally, more platination events can be detected on the DNA strand occurring only at
higher platinum conditions for both incubation times.

86
Figure 4.4: PAGE analysis of 5’-fluorescein 15fTBA (10 µM) after 21 h (PANELS A and
B) or 28 h (PANEL C and D) incubation at 25 °C with increasing concentrations of cisplatin
(DNA:Pt-complex molar ratios: 0; 1:1; 1:10 and 1:100) in 10 mm Tris, 85 mm KCl, pH 7.5.
In addition,in the PAGE displayed in the PANELS B and D the reaction mixture with we co-
incubated the an equimolar concentration of human thrombin (10 µM).
Since 15fTBA represent a protein recognition agent, we were interest in understanding how
the simultaneous presence of the thrombin can influence the adduct formation on DNA.
When the protein was included in the reaction mixture we observed that DNA platination
was significantly impaired. This data can be related to a competition between S- or N-
platination sites of the protein (Cys, Met and His) and N7 of guanine.
Nevertheless, it can indicate that the protein bound DNA represents a poorer target for the
metal complex.

87
4.4 Conclusions
Data herein presented provide a preliminary characterization of the behavior of similar G
quadruplex structures upon addition of cisplatin. This result was pursued in order to better
understand how minimal differences in the structure could prevent or modulate the DNA
flexibility given by the chemical probe. Primarily, we identified and characterized a 15fTBA
analogous G quadruplex forming sequence BMT in order to compare two related molecular
systems. Then, we demonstrated how the G4 folding of both sequences is disrupted by high
platinum concentration in a time dependent manner. Apparently, the distinct platination
pattern on the external loops that characterizes the two DNA systems seems not largely
influence the occurrence of unfolding process.
This is likely connected to the large excess of metal complex used to monitor it. However, it
can be also the results of the comparable structural stability exerted by the two quadruplex.
As future perspective it will be useful to check if less stable G4 sequences are more prone to
be disrupted by platination.
As far as concern data at low cisplatin DNA molar ratio by merging the preliminary
electrophoretic results with the spectroscopic characterization of the DNA structures we can
confirm that only a single platinum adduct is formed on the DNA templates, presumably
involving the residue in the loops.
In this contest it is attractive to underline how the platination reaction on the 15fTBA is
significantly diminished in presence of thrombin. We can assume this finding as the
consequence of the increased 15fTBA stability upon binding. Nonetheless a detailed
competition study about potential platination sites for protein DNA mixture has to be
performed in order to clarify the issue. The partial results could be considered relevant since
open the question if the cisplatin represents a relative probe for mapping the accessibility of
binding modules or conversely to assess the protein recognized, thus representing a novel
approach to obtain highly selective diagnostic tool.

88
5. Synthesis of human nucleolin forms in Escherichia coli and its
purification as G-quadruplex binding protein
5.1 Introduction
C-Myc proto-oncogene encodes for a multifunctional transcription factor that plays an
important role in a broad range of cellular processes, including the regulation of cell cycle
progression, cell growth, differentiation, transformation, angiogenesis, and apoptosis. [113-
116]
Aberrant c-Myc expression is one of the hallmarks of a significant number of human
malignancies, including breast, colon, cervix, small-cell lung cancers, osteosarcomas,
glioblastomas, and myeloid leukemias. It has been estimated that around as one-seventh of
all cancer deaths (70,000 deaths annually in the United States) [115] are associated with
alteration of c-Myc expression. In contrast to other widely characterized oncogenes, such as
the human RAS, where the primary mechanism of tumor promotion is through the
acquisition of activating mutations, c-Myc is usually dysregulated indirectly through
alterations of the upstream transcriptional activation pathway that leads to uncontrolled
expression. [116]
In fact, one crucial DNA element that has been shown to regulate c-Myc expression is
located –142 to –115 bp upstream of the P1 promoter, and it has been shown to control up to
90% of the total c-Myc transcription.[117] This DNA segment is highly sensitive to DNAse
I and S1 nucleases. For this reason is referred to as the nuclease hypersensitive element
(NHE) III1. The NHE III1 consists of a guanosine-rich sequence that can equilibrate under
physiological conditions between transcriptionally active forms (duplex and single-stranded
DNA) and a guanosine quartet structure that was demonstrated to act as transcriptional
repressor element. [3, 117-119] In particular, as assessed by NMR spectroscopy, the G-
tetrad arrangement adopts an intramolecular parallel-stranded structure containing three
G(anti)-G(anti)-G(anti)-G(anti) quartets and three side loops, in the presence of potassium
ions. [120]
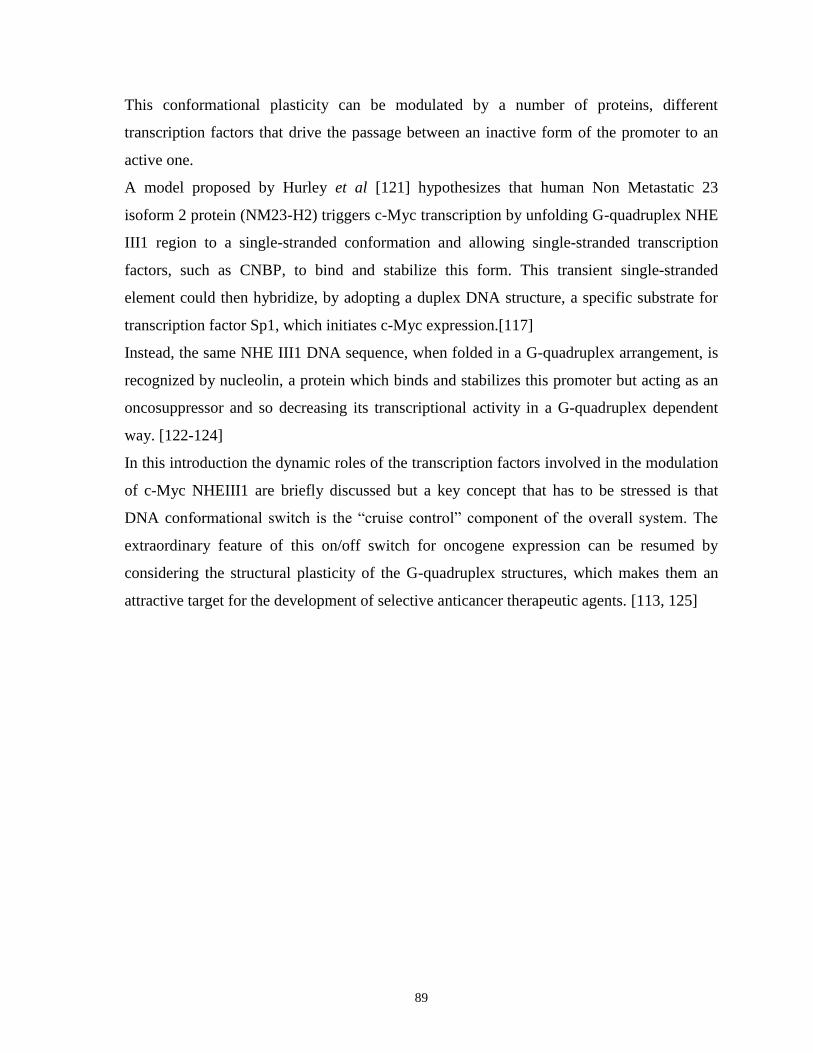
89
This conformational plasticity can be modulated by a number of proteins, different
transcription factors that drive the passage between an inactive form of the promoter to an
active one.
A model proposed by Hurley et al [121] hypothesizes that human Non Metastatic 23
isoform 2 protein (NM23-H2) triggers c-Myc transcription by unfolding G-quadruplex NHE
III1 region to a single-stranded conformation and allowing single-stranded transcription
factors, such as CNBP, to bind and stabilize this form. This transient single-stranded
element could then hybridize, by adopting a duplex DNA structure, a specific substrate for
transcription factor Sp1, which initiates c-Myc expression.[117]
Instead, the same NHE III1 DNA sequence, when folded in a G-quadruplex arrangement, is
recognized by nucleolin, a protein which binds and stabilizes this promoter but acting as an
oncosuppressor and so decreasing its transcriptional activity in a G-quadruplex dependent
way. [122-124]
In this introduction the dynamic roles of the transcription factors involved in the modulation
of c-Myc NHEIII1 are briefly discussed but a key concept that has to be stressed is that
DNA conformational switch is the “cruise control” component of the overall system. The
extraordinary feature of this on/off switch for oncogene expression can be resumed by
considering the structural plasticity of the G-quadruplex structures, which makes them an
attractive target for the development of selective anticancer therapeutic agents. [113, 125]

90
Fig. 5.1: Model of the different promoter forms assumed by the c-Myc promoter NHE
III1. (modified form [117])
(a) Binding of nucleolin to the G-quadruplex structure leads to inactivation of c-Myc
expression.
(b) Binding of hnRNP K and CNBP to the single-stranded C- and G-rich regions,
respectively, promotes the formation of double strand form inside c-Myc promoter.
(c) Binding of Sp1 to the duplex structure leads to activation of c-Myc expression.
As previously anticipated, nucleolin is the principal mammalian protein that specifically
interacts with and drives the intramolecular c-Myc promoter to its silencer conformation.
[123]
This multifunctional nucleolar protein is a ~76-kDa phosphoprotein that plays a role in
chromatin decondensation, ribosome biogenesis, cell proliferation, differentiation and
maintenance of neural tissue and apoptosis. [122]

91
This functional versatility can be ascribed to a complex domain structure, illustrated in
figure 5.2.
Fig. 5.2: Diagram of human nucleolin protein domains.
The N-terminal domain is constituted of repeated TPXKK motifs flanked by stretches of
highly acidic amino acid residues contains multiple phosphorylation sites that influence the
cellular localization.
The central region contains four consensus RNA-binding domains (RBDs), also known as
RRM (RNA recognition motif). A specific feature of this region is that each module is
separated by flexible linker loops.
The C-terminal domain called GAR or RGG domain is characterized by an abundance of
Arg-Gly-Gly repeats interspersed with aromatic amino acids, such as phenylalanine
residues.
The RGG domain of nucleolin also binds RNA, but the binding is non-specific and weak.
This modular architecture provides a higher structural versatility to the protein, since by
combining multiple domains, nucleolin can construct various interaction surfaces which can
be assembled and disassembled as needed.
In addition, its plasticity allows the protein to recognize a large number of substrates. For
example, by combining its first two RBDs, nucleolin interacts with the stem-loop RNA
structure formed by the nucleolin recognition element, while all four RBDs are required for
binding to a single-stranded RNA motif found in pre-rRNA. [126, 127]
The last specific interaction of this multi-domain protein with nascent pre-rRNA and
ribosomal proteins is thought to be important for the proper folding of pre-rRNA and its
packaging into pre-ribosomal particles.
Due to its modular structure, nucleolin can adapt to interact also with nontraditional forms of
RNA and DNA, including G-quadruplex structures such the ones formed at c-Myc promoter
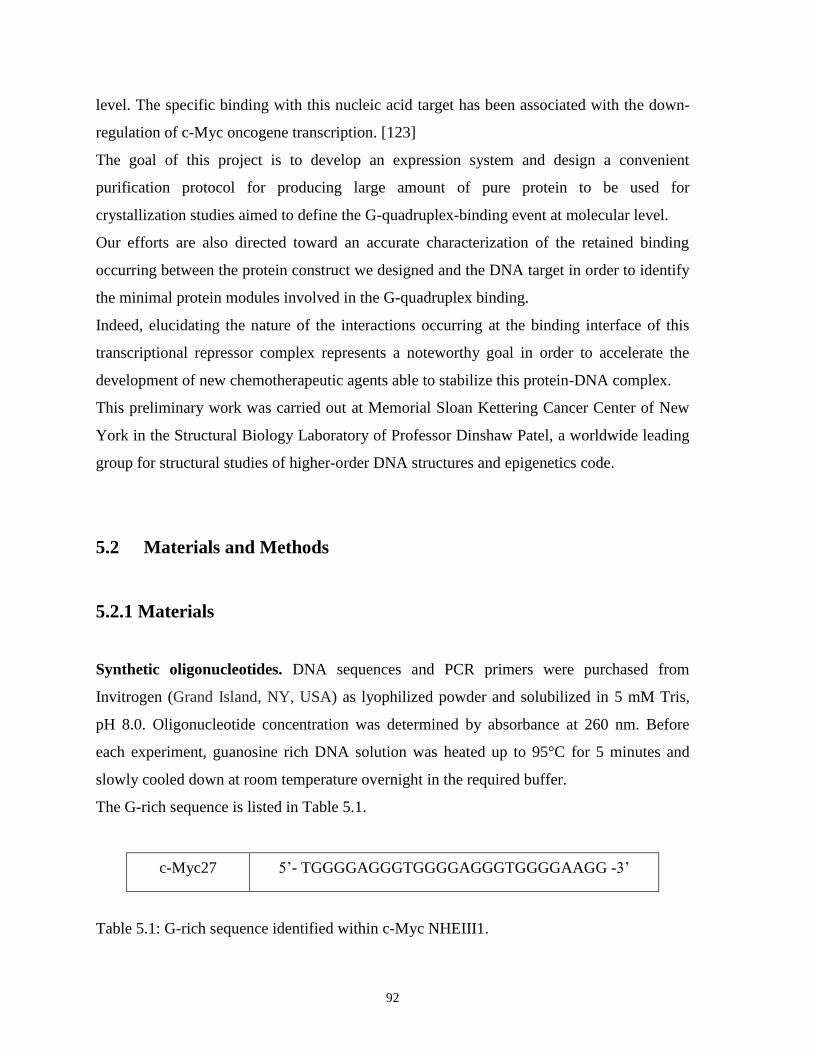
92
level. The specific binding with this nucleic acid target has been associated with the down-
regulation of c-Myc oncogene transcription. [123]
The goal of this project is to develop an expression system and design a convenient
purification protocol for producing large amount of pure protein to be used for
crystallization studies aimed to define the G-quadruplex-binding event at molecular level.
Our efforts are also directed toward an accurate characterization of the retained binding
occurring between the protein construct we designed and the DNA target in order to identify
the minimal protein modules involved in the G-quadruplex binding.
Indeed, elucidating the nature of the interactions occurring at the binding interface of this
transcriptional repressor complex represents a noteworthy goal in order to accelerate the
development of new chemotherapeutic agents able to stabilize this protein-DNA complex.
This preliminary work was carried out at Memorial Sloan Kettering Cancer Center of New
York in the Structural Biology Laboratory of Professor Dinshaw Patel, a worldwide leading
group for structural studies of higher-order DNA structures and epigenetics code.
5.2 Materials and Methods
5.2.1 Materials
Synthetic oligonucleotides. DNA sequences and PCR primers were purchased from
Invitrogen (Grand Island, NY, USA) as lyophilized powder and solubilized in 5 mM Tris,
pH 8.0. Oligonucleotide concentration was determined by absorbance at 260 nm. Before
each experiment, guanosine rich DNA solution was heated up to 95°C for 5 minutes and
slowly cooled down at room temperature overnight in the required buffer.
The G-rich sequence is listed in Table 5.1.
c-Myc27 5’- TGGGGAGGGTGGGGAGGGTGGGGAAGG -3’
Table 5.1: G-rich sequence identified within c-Myc NHEIII1.
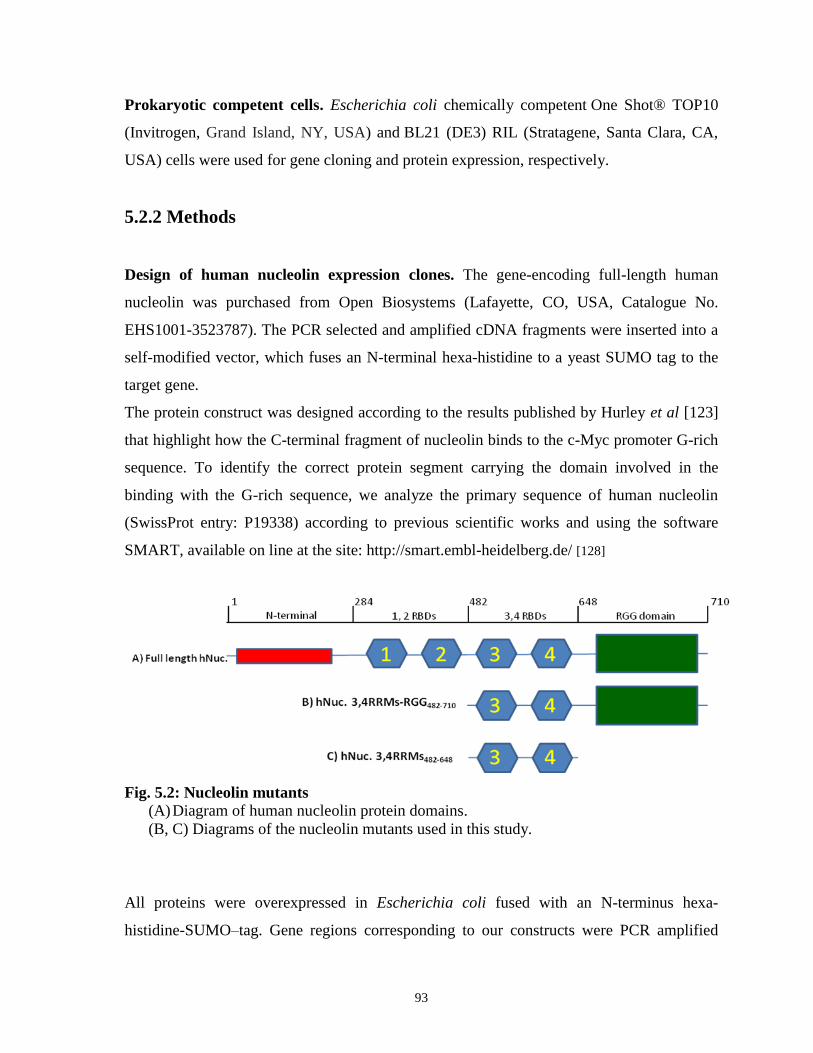
93
Prokaryotic competent cells. Escherichia coli chemically competent One Shot® TOP10
(Invitrogen, Grand Island, NY, USA) and BL21 (DE3) RIL (Stratagene, Santa Clara, CA,
USA) cells were used for gene cloning and protein expression, respectively.
5.2.2 Methods
Design of human nucleolin expression clones. The gene-encoding full-length human
nucleolin was purchased from Open Biosystems (Lafayette, CO, USA, Catalogue No.
EHS1001-3523787). The PCR selected and amplified cDNA fragments were inserted into a
self-modified vector, which fuses an N-terminal hexa-histidine to a yeast SUMO tag to the
target gene.
The protein construct was designed according to the results published by Hurley et al [123]
that highlight how the C-terminal fragment of nucleolin binds to the c-Myc promoter G-rich
sequence. To identify the correct protein segment carrying the domain involved in the
binding with the G-rich sequence, we analyze the primary sequence of human nucleolin
(SwissProt entry: P19338) according to previous scientific works and using the software
SMART, available on line at the site: http://smart.embl-heidelberg.de/ [128]
Fig. 5.2: Nucleolin mutants
(A) Diagram of human nucleolin protein domains.
(B, C) Diagrams of the nucleolin mutants used in this study.
All proteins were overexpressed in Escherichia coli fused with an N-terminus hexa-
histidine-SUMO–tag. Gene regions corresponding to our constructs were PCR amplified

94
using synthetic primers, which introduced the restriction enzyme sites BamHI (5’-
G_GATCC-3’) on the sense primer and XhoI (5’-C_TCGAG-3’) on the antisense primer for
subcloning into our expression vector.
The first clone corresponding to the C-terminal nucleolin (defined hNuc 3,4RRMs-RGG482-
710) was selected using as forward primer 5’-ATAGGA
TCCAGTGGTGAATCAAAAACTCTGG-3’ and as reverse primer 5’-
TATCTCGAGCTATTCAAACTTCGTCTTCTTTCC-3’ and encodes for the protein
fragment corresponding to amino acids 482 to the last 710 in the native sequence. The
second clone (defined hNuc 3,4RRMs482-648) was amplified using the forward primer 5’-
ATAGGATCCAGTGGTGAATCAAAAACTCTGG-3’ and reverse primer 5’-
TATCTCGAGCTACTTAGGTTTGGCCCAGTC-3’ and encodes for the fragment
corresponding to amino acids 482 to 648 in the full length sequence.
The PCR reaction was carried out in a total volume of 25 µl containing 50 nmol of each
PCR primer, 100 ng of template DNA and 22 µl of the PCR AccuPrime™ Pfx Supermix
(Invitrogen, Grand Island, NY, USA), a commercial ready-to-use mixture of DNA
polymerase, accessory proteins, salts, magnesium and dNTPs.
The PCR amplification was carried out through 30 cycles of denaturing (95 °C, 30 seconds),
annealing (55 °C, 1 minute) and elongation (68 °C, 1 minute). The final elongation step was
at 68 °C for 15 minutes.
The 686 bp and 500 bp PCR products containing the cDNA encoding for the two constructs
were recovered from agarose gel electrophoresis, and subsequently purified. The purified
PCR product was digested with BamHI and XhoI at 37 °C for 3 hours. The purified
digestion product was then ligated into our expression vector using the SNOVA ligation kit.
The identities of all the recombinant clones were confirmed by DNA sequence analysis.
Protein purification. The plasmids were transformed into Escherichia coli strain BL21
(DE3) RIL cells (Stratagene, Santa Clara, CA, USA).
Transformed cells were grown at 37 °C in one liter of Luria Bertani broth (supplemented
with 30 mg/l kanamycin and 25 mg/l chloramphenicol, respectively) until OD600 reached
1.0, afterwards the media was cooled to 20 °C and isopropylthio-β-D-galactoside (IPTG)
was added to a final concentration of 0.2 mM to induce protein expression overnight.
95
The cells were harvested by centrifugation at 4 °C for 12 minutes (4500 g) and resuspended
in buffer A (500 mM NaCl, 25 mM Tris pH 8.0 and 20 mM imidazole) supplemented with 1
mM phenylmethylsulphonyl fluoride (PMSF) as protease inhibitor and 2 mM β-
mercaptoethanol (β-ME).
After the cells lysis performed on ice using the french press high-pressure homogenizer the
insoluble cell debris was removed from the cell lysate by centrifugation at 4 °C for 90
minutes (16000 g).
Subsequently lysate was purified by immobilized metal affinity chromatography (IMAC) by
loading the supernatant onto two nickel loaded HisTrap FF crude columns (GE Healthcare,
Little Chalfont, Buckinghamshire, UK).
After extensive washing by buffer A, the target protein was eluted with buffer A
supplemented with 300 mM of imidazole.
High imidazole concentration was removed by dialyzing the eluate at 4 °C overnight against
one liter of buffer A.
The hexa-histidine-SUMO tag was cleaved by Ulp1 protease at room temperature and
removed by further passing through a second step of HisTrap FF column.
From this point the purification of the two different recombinant nucleolin forms diverged,
relying on an ion exchange chromatography (IEC) carried out with Q Sepharose columns
(GE Healthcare, Little Chalfont, Buckinghamshire, UK) and a buffer B pH 8.0 for hNuc482-
648, instead an ion exchange chromatography (IEC) carried out with HiTrap heparin HP
columns (GE Healthcare, Little Chalfont, Buckinghamshire, UK) and a buffer B pH 8.0 for
hNuc482-710, according to the different physicochemical parameters of the two proteins.
The protein was dialyzed with a 10 kDa MWCO Cut off membrane the eluate at 4 °C
overnight against one liter of buffer B (150 mM NaCl, 20 mM Tris and 5 mM Dithiothreitol
(DTT).
Subsequently the construct was purified by ion exchange chromatography (IEC) by loading
the protein with the corresponding buffer B onto two 5 ml IEC columns.
Then, the protein was eluted with a linear gradient (50%/50 min) from the loading buffer B
(150 mM sodium) to the elution buffer (2 M NaCl, 20 mM Tris) at 2.5 ml/min flow rate.
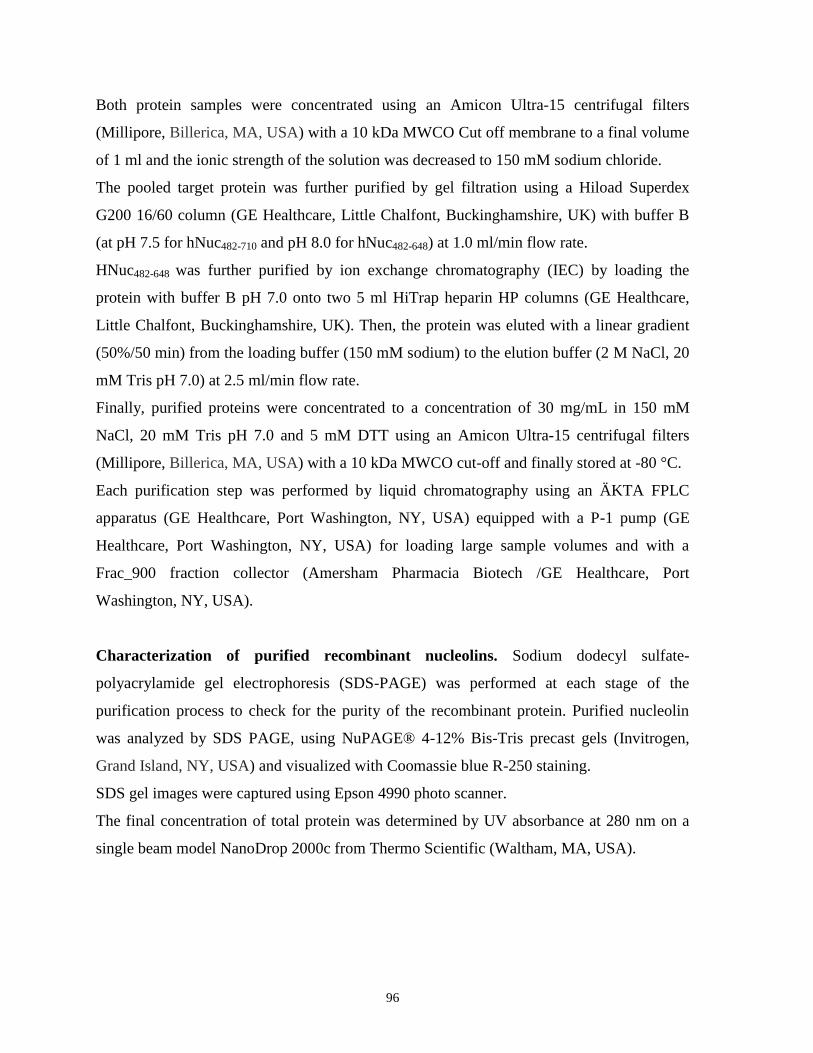
96
Both protein samples were concentrated using an Amicon Ultra-15 centrifugal filters
(Millipore, Billerica, MA, USA) with a 10 kDa MWCO Cut off membrane to a final volume
of 1 ml and the ionic strength of the solution was decreased to 150 mM sodium chloride.
The pooled target protein was further purified by gel filtration using a Hiload Superdex
G200 16/60 column (GE Healthcare, Little Chalfont, Buckinghamshire, UK) with buffer B
(at pH 7.5 for hNuc482-710 and pH 8.0 for hNuc482-648) at 1.0 ml/min flow rate.
HNuc482-648 was further purified by ion exchange chromatography (IEC) by loading the
protein with buffer B pH 7.0 onto two 5 ml HiTrap heparin HP columns (GE Healthcare,
Little Chalfont, Buckinghamshire, UK). Then, the protein was eluted with a linear gradient
(50%/50 min) from the loading buffer (150 mM sodium) to the elution buffer (2 M NaCl, 20
mM Tris pH 7.0) at 2.5 ml/min flow rate.
Finally, purified proteins were concentrated to a concentration of 30 mg/mL in 150 mM
NaCl, 20 mM Tris pH 7.0 and 5 mM DTT using an Amicon Ultra-15 centrifugal filters
(Millipore, Billerica, MA, USA) with a 10 kDa MWCO cut-off and finally stored at -80 °C.
Each purification step was performed by liquid chromatography using an ÄKTA FPLC
apparatus (GE Healthcare, Port Washington, NY, USA) equipped with a P-1 pump (GE
Healthcare, Port Washington, NY, USA) for loading large sample volumes and with a
Frac_900 fraction collector (Amersham Pharmacia Biotech /GE Healthcare, Port
Washington, NY, USA).
Characterization of purified recombinant nucleolins. Sodium dodecyl sulfate-
polyacrylamide gel electrophoresis (SDS-PAGE) was performed at each stage of the
purification process to check for the purity of the recombinant protein. Purified nucleolin
was analyzed by SDS PAGE, using NuPAGE® 4-12% Bis-Tris precast gels (Invitrogen,
Grand Island, NY, USA) and visualized with Coomassie blue R-250 staining.
SDS gel images were captured using Epson 4990 photo scanner.
The final concentration of total protein was determined by UV absorbance at 280 nm on a
single beam model NanoDrop 2000c from Thermo Scientific (Waltham, MA, USA).

97
ITC measurements. Protein sample and G-rich DNA sequence used for ITC measurements
were dialized overnight dialysis against buffer containing 20 mM HEPES pH 7.0 and 50
mM KCl.
Before each measurement, the protein concentration was adjusted to about 0.1 mM.
ITC measurements were carried out at 0.1 mM protein concentration and 1.5 mM nucleic
acid concentration on an ITC200 Microcal calorimeter (MicroCal, Piscataway, NJ, USA) at
25 °C.
A typical titration consisted of 17 injections of 2.4 µl of DNA solution into the protein
solution at time intervals of 180 seconds.
Binding constants were calculated by fitting the data using the ITC data analysis module of
Origin 7.0 (OriginLab Corporation) using the 1:1 binding model.
Computational methods. The in silico estimation of proteins physical and chemical
parameters, such as theoretical pI value, molecular weight and extinction coefficients, was
performed using the software Protparam, available on line at website:
http://web.expasy.org/protparam/ [129]
The computational sequence analysis aimed to rapidly identify the modular architecture of
the protein, was carried out using the Web-based tool SMART, available on line at the
website: http://smart.embl-heidelberg.de/ [128]

98
5.3 Results
5.3.1 Purification of recombinant human nucleolin forms
The design of an optimized expression vector and purification protocol, aimed to obtain
multi-milligram quantities of highly purified (~95% purity) protein, represents a compulsory
step in structural biology field.
Several scientific papers highlight the impossibility to obtain full-length nucleolin
expression in E. coli. [124] For this reason, according to the resources available in the
laboratory, we attempt to engineer the target protein by deleting the N-terminal segment but,
at the same time, trying to maintain in the resulting construct the functional domains
involved in G quadruplex binding. To express our recombinant protein we used a vector
which drives the expression of the recombinant gene under the control of the T7 RNA
polymerase promoter and lac operator.
Since both the recombinant proteins were engineered to contain an N-terminal hexa-
histidine-SUMO -tagged, immobilized metal affinity chromatography (IMAC) on Nickel
Sepharose FF was devised as the initial capture step.
Figures 5..3A.1 and 5.3.B.1 show the capture steps by IMAC of both recombinant nucleolin
forms.
An evident additional peak, which eluted at high imidazole concentration indicates an
effective separation from the untagged proteins produced by the prokaryotic system not
bound to the metal loaded in the column.
The molecular weight of the two fragments, predicted in silico by amino acid composition,
is 24,160 Da for hNuc482-710 and 18,369 Da for hNuc482-648, respectively.
SDS page analysis (Fig. 5.3.A.2 and 5.3.B.2) was used to check the effective separation
from the untagged proteins produced by the prokaryotic system before (+) and after (*) the
excision of the 6His-SUMO tag (around 11.5 kDa) with Ulp1 protease treatment.

99
The molecular weight of the expressed samples was approximated to the migration distance
relative to the protein marker.
Fig. 5.3 In PANEL A.1; IMAC of polyHis-SUMO tag hNuc482-710 on Ni
++ HisTrap.
In PANEL B.1; IMAC of polyHis-SUMO tag hNuc482-648 on Ni++
HisTrap.
Buffer A and B contained 20 mM and 500 mM imidazole. The polyHis-SUMO tagged
recombinant protein was eluted in the last visible peak at 100% solvent B.
In the PANELS .2 all the corresponding SDS page analysis are displayed.
An asterisk is placed under the lane referring to the sample taken after adding the Ulp1
protease.
A cross is placed under the lane corresponding to chromatographic peak.
For each control gel we reported molecular mass markers (mass values are reported).
Although the IMAC procedure sometimes is indicated as a successful single-step
purification technique of heterologous proteins, RNA/DNA binding proteins often require
more purification steps to remove the host RNA or DNA, strongly bound during
overexpression, in order to achieve the desired level of product purity and so to maximize
the chances of obtaining protein crystals.
Polishing of recombinant nucleolin constructs were successfully accomplished by iterative
ion exchange and gel filtration chromatography passages.
Ion exchange chromatography (IEC) was adopted as convenient intermediate purification
technique.
Protein separation by IEC is primarily dependent on the charge properties of the proteins so
the first step in establishing a suitable IEC purification consists of the identification of the
conditions allowing efficient binding (and elution) of target protein to the columns matrix.

100
According to the calculated isoelectric points of the constructs (9.25 for hNuc482-710 and 4.96
for hNuc482-648) and in order to optimize the resolving power of this chromatographic
technique we decided to use HiTrap heparin HP columns and a buffer pH 7.5 for hNuc482-710.
At the same time, the Q Sepharose column associated to a loading buffer pH 8.0 was
considered more suitable for purification of hNuc482-648.
During IEC, nucleolin482-710 displayed a strong affinity for the charged groups of the column,
as much as to finally get the protein we needed to increase the ionic strength of the elution
buffer to a maximum value. (Fig. 5.4.A.1)
A further necessary purification step for both forms was carried out through size-exclusion
chromatography, often recommended to detect and remove any high-molecular-weight
aggregates or persisting trace contaminants.
The gel filtration purification outlined two distinct behaviours for the recombinant proteins.
For hNuc482-710 the purified fraction was displayed by a low and asymmetric
chromatographic peak (Fig. 5.4.B.1), suggesting a final product extremely impure.
Furthermore the protein in the pooled samples demonstrates the tendency to precipitate.
The instability evidenced by hNuc482-710 points out how this protein does not represent a
suitable candidate for protein-crystallization trials.
Conversely, the shorter hNuc482-648 was eluted as a single symmetric sharp peak (Fig.
5.4.D.1) and reasonably well separated from contaminants.
However the peak referring to the shorter recombinant protein is still marked by a high
A260/A280 ratio (Fig. 5.4.D.1) which indicates a residual presence of a nucleic acid fraction
bound to the protein.
According to the previous finding the final purification of hNuc482-648 was obtained by a
second IEC analysis, conducted at lower pH conditions (pH 7), chosen to alter the charge of
the protein, and with a different ion exchange column (HiTrap Heparin).
This polishing step (Fig. 5.4.E) ultimately led to the achievement of a pure recombinant
nucleolin482-648. Indeed, the corresponding SDS–PAGE analysis (Fig. 5.4.E.2) of the fraction
confirms the homogeneity of the final product.
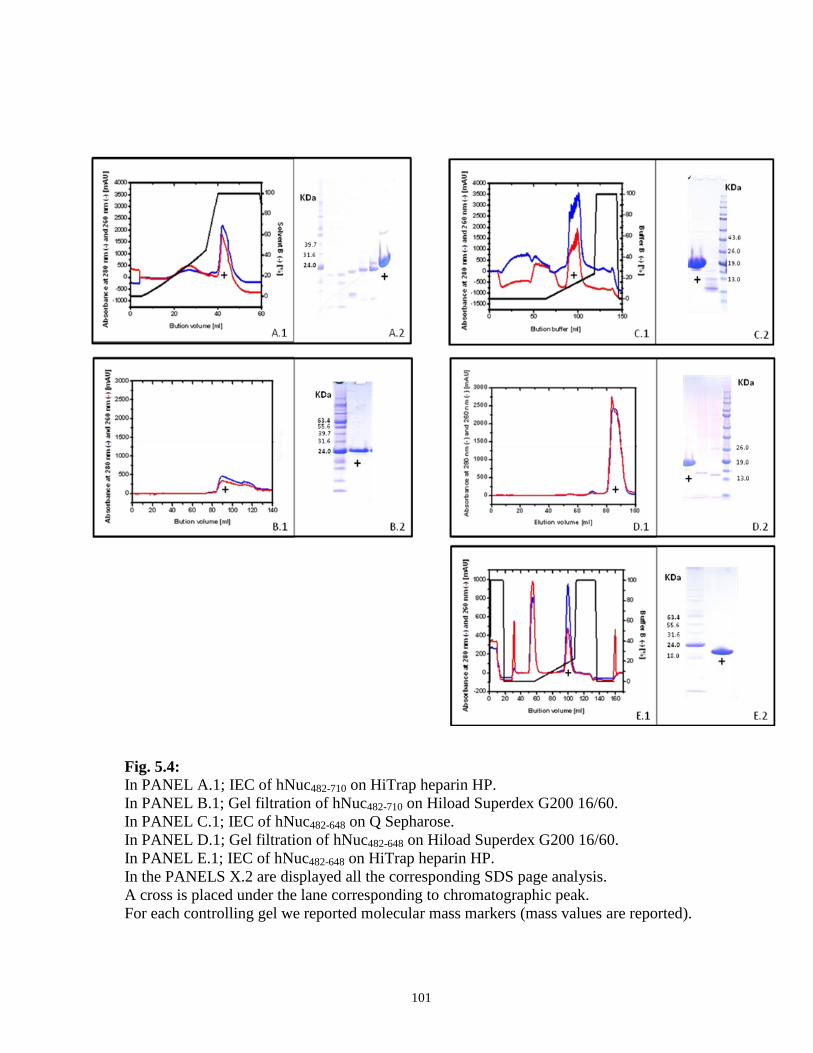
101
Fig. 5.4:
In PANEL A.1; IEC of hNuc482-710 on HiTrap heparin HP.
In PANEL B.1; Gel filtration of hNuc482-710 on Hiload Superdex G200 16/60.
In PANEL C.1; IEC of hNuc482-648 on Q Sepharose.
In PANEL D.1; Gel filtration of hNuc482-648 on Hiload Superdex G200 16/60.
In PANEL E.1; IEC of hNuc482-648 on HiTrap heparin HP.
In the PANELS X.2 are displayed all the corresponding SDS page analysis.
A cross is placed under the lane corresponding to chromatographic peak.
For each controlling gel we reported molecular mass markers (mass values are reported).

102
The estimation of the final yield for hNuc482-648 was done by measuring the UV absorbance
at 280 nm of the pooled fraction adopting as extinction coefficient the value of 8,480 M-1
cm-1
, previously calculated in silico from the hNuc482-648 amino acids composition as
described in materials and methods.
Finally, the discrete value of 1.3 mg/liter of recombinant hNuc 3,4RRMs 482-648 was obtained
adopting this multistep protocol.
5.3.2 ITC-based binding affinities for complex formation
In a paper of 2009, Hurley stated that C-terminal domain of human nucleolin, composed by
the last two RBDs domains and the terminal RGG motif, still maintained the binding to the
c-Myc G-quadruplex promoter with high affinity and selectivity and proved that by different
biochemical techniques such as EMSA and fluorescence melting. [123]
In this work we decided to attest the binding affinity of the shorter protein construct that we
previously expressed and purified, to the oncogene promoter by means of ITC, a very
sensitive calorimetric technique which allows defining the thermodynamic properties of the
binding event.
The analysis of the curve obtained indicates that, surprisingly, hNuc482-648 is also able to
interact with the 27mer G-rich sequence with a binding affinity of about 17.3 µM, a value
around six-fold lower if compared to the dissociation constant calculated by Hurley.[123]
Without focusing on the difference of affinity, which can be due to the different techniques
adopted, we found that the third and the fourth RNA binding domains of nucleolin are still
able to recognize the physiological G-quadruplex target.
A detailed analysis of the thermodynamic properties of the binding events indicates that the
complex formation is predominantly of enthalpically driven (ΔH = -14.31 kcal/mol) and is
partially compensated by an entropic contribution (-TΔS = 7.676 kcal/mol). This
thermodynamic signature is consistent with additional electrostatic forces and hydrogen
bonds presumably at the binding interface associated to conformational restrictions of the
side chains and nucleobases flexibility upon complex formation.
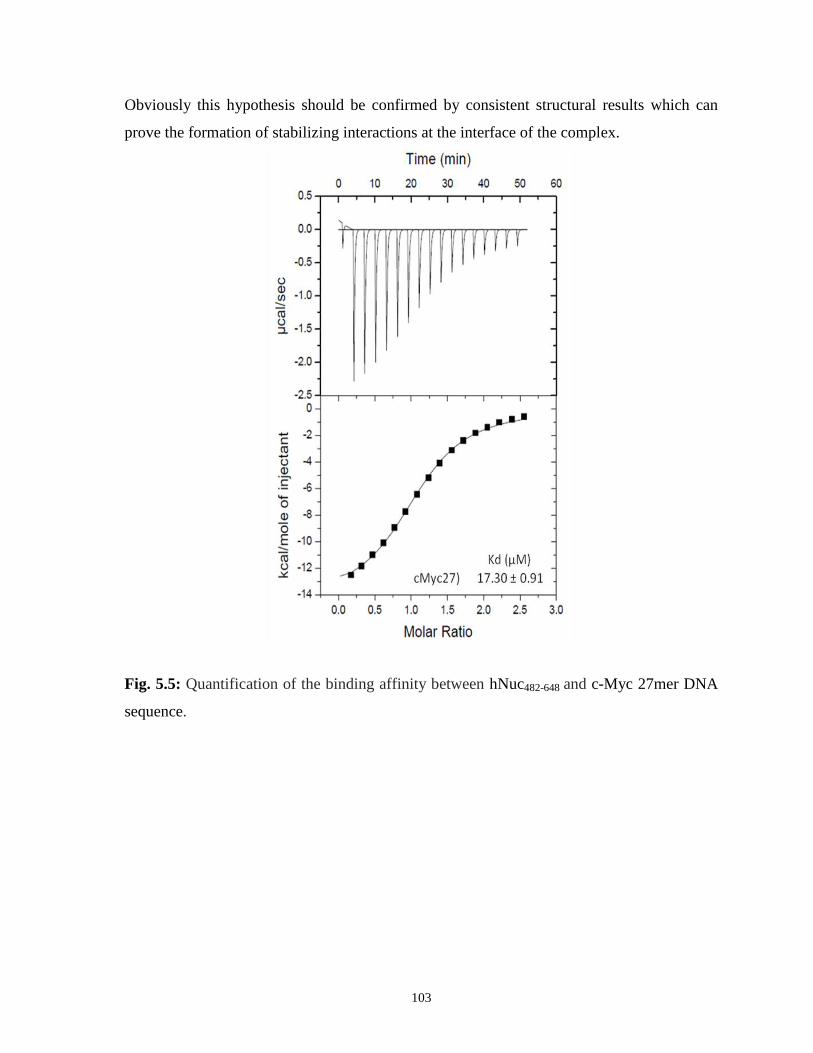
103
Obviously this hypothesis should be confirmed by consistent structural results which can
prove the formation of stabilizing interactions at the interface of the complex.
Fig. 5.5: Quantification of the binding affinity between hNuc482-648 and c-Myc 27mer DNA
sequence.

104
5.4 Conclusions
To conclude, we developed a highly reproducible purification protocol which, although
yielding only about 1.3 mg of pure recombinant nucleolin 3,4RRMs 482-648 per liter culture,
lets us to obtain an extremely pure protein. This is a very important feature for
crystallographic studies.
The protein product appears remarkably stable and the lack of precipitation or aggregation
makes it a good candidate for structural studies.
In addition, the construct we design (a 166 amino acid sequence containing the 3,4 RNA
binding domains) maintains a good selectively toward the nucleic acid target as evidenced
through the accurate calorimetric analysis of the binding performed by ITC.
This finding delves into the previous study about the correlation between nucleolin structure
and the retained Gq binding activities and indicates that the C-terminal RGG domain is not
necessary for the recognition event.
The future efforts could be directed toward the characterization of the nucleolin binding
toward other G-quadruplex forms, differing from the parallel one adopted by the c-Myc
promoter.
Our preliminary but noteworthy results combined to the absence of a solved structure of
protein-DNA complex encourage us to improve our efforts to set up the best crystallization
conditions in order to solve the three dimensional structure of the complex.
Decrypting the structural insights of this complex, so embedded in the tumorigenesis
pathway, would represent a successful starting point for further rational design of effective
chemotherapeutics.

105
6. Recognition of unmethylated H3K4(1-10) by Arabidopsis thaliana
origin recognition complex 1b: a functional and structural analysis of the
complex
6.1 Introduction
The original concept in molecular biology that histone proteins are only static building
blocks aimed to package eukaryotic DNA into repeating nucleosomal units is definitely
overcame. It is now clear that histones are integral and dynamic components of the
machinery responsible for regulating gene transcription. [130-132]
Histone proteins take part of the control of gene expression mostly through a complex
balance of various epigenetic modifications occurring at N-terminal sequences, including
acetylation, phosphorylation, methylation, ubiquitination and ADP-ribosylation (Fig. 6.1).
[133-135]
Fig. 6.1: Model for nucleosome modifications.
This nucleosome core particle shows the histone globular region and histone terminal tail
that protrude through the DNA wrapped. Schematic representation of condensed
nucleosome modifications is reported and includes acetylation (ac), phosphorylation (p),
methylation (me) and ubiquitination (u). Residue numbers are included for each
modification.

106
The modification pattern of histone tails, which protrude from the surface of the
nucleosome, may serve as a mark to be recognized by a complex and by a dynamic network
of players such as transcription factors or remodelling chromatin elements.
Such non histone elements are often defined by multiple protein reader domains that,
advisably combined, can decipher the language of the histones to specific biological
outcomes. [136]
In particular, methylation of selected lysine (K) residues in the N-terminal tails of histones
H3 and H4 is recognized as an important component of an epigenetic indexing system,
demarcating transcriptionally active and inactive chromatin domains. [137, 138]
Interestingly, the same chemical moiety can bring to distinct downstream events, for
examples lysine methylation at H3K4, H3K36 and H3K79 marks transcriptionally active
chromatin, whereas methylation of H3K9, H3K27 and H4K20 defines repressed chromatin
domains.
The discovery of specific effector proteins, such as BHC80, that bind selectively to the
unmodified H3K4, suggested that even the absence of post-transcriptional modification
could represent a peculiar pattern in the ‘histone code’. [139]
In particular, methylation state of H3K4 is proposed to have a pivotal role in
de/condensation of chromatin by serving as a binding platform for different silencing and
transcription promoting factors. [140, 141]
Understanding the mechanisms used by downstream effectors to recognize and transduce
H3K4 different methylation patterns into specific gene expression “routes” constitutes to an
intriguing challenge in epigenetic, engaging a plethora of different areas ranging from
molecular biology and genetics to molecular pathology and oncogenesis.
As previously discussed, the epigenetic network that comprises a complex histone code and
a large number of effector proteins is still unclear, however the development of refined
biochemistry techniques such as chromatin immunoprecipitation (ChiP) and the accurate use
of specific model organism is increasingly clarifying the dynamic role of the elements that
characterizing the obscure universe of epigenetics.
The flowering plant Arabidopsis thaliana has been a pioneer model to explore the
epigenetics of multicellular organisms, thanks to a compact, almost fully sequenced genome
and a comprehensive set of genetic and genomic resources. Moreover, because

107
the Arabidopsis genome contains a large repertoire of transposable element families (but all
in relatively few copies), the chromatin state of these ubiquitous components of the genomes
has been assessed with great precision. [142]
Different eukaryotic regulators are known to play a role in heterochromatin assembly and
between those non histone epigenetic proteins an emerging role has been assigned to origin
recognition complex (ORC).
This protein is an evolutionarily conserved six-subunits heteromeric complex mainly known
for its function in DNA replication. [143]
The most studied feature of ORC is its role in binding directly to replication origins and
recruiting cell division cycle (CDC) 1, 6 and mini chromosome maintenance proteins (Mcm)
2-7 to form pre-replication complexes (pre-RCs) at G1/S boundary. [143]
Moreover, ORC plays an important role in the transcriptional modulation through multiple
interactions with heterochromatin factors such as silence information regulator 1 (Sir1) in
budding yeast [144]and heterochromatin protein 1 (HP1) in higher eukaryotes. [144]
Mutations across ORC subunits in multicellular organisms are associated to pleiotropic
phenotypes that include chromosomal abnormalities and cell cycle arrest.
As explained, the same protein complex complies with replication and transcriptional
regulation function with an unknown mechanism that remains an intriguing issue to be
uncovered. Accordingly, our goal consists of clarifying, by means of structural evidences,
how Arabidopsis ORC1b, the large subunit of the origin recognition complex, can act in
chromatin remodeling through a peculiar histone recognition process.
An intriguing biochemical feature of plant ORC1s is represented by the presence of two
adjacent well defined domains (a BAH domain associated to the PHD finger) [145] that
make it a prominent subject to be investigated in order to define how different binding
modules can resemble to achieve a specific function.
Fig. 6.2: Schematic diagram of Arabidopsis thaliana ORC1b protein domains.
108
In this section we provide an epigenetic model which shows, with structural and functional
evidences, how Arabidopsis thaliana ORC1b is able to recognize a decapeptide
corresponding to unmethylated H3K4 tail, according to specific protein architecture
constitutes by a BAH-PHD cassette.
The functional data, collected by isothermal titration calorimetry (ITC) fully confirm the
plain reliability of the tree dimensional model and the selectivity of the atORC1b BAH-PHD
cassette toward the H3K4 decapeptide in its demethylated form.
My contribution to this work, conducted at Prof. Patel Lab, was mainly focused on the
protein expression and purification of the atORC1b BAH-PHD cassette in conjunction of the
bioinformatics and biophysical characterization of the protein product features.
6.1.1 PHD and BAH domains, molecular architecture and functions
In order to fully understand the molecular architecture of the protein-peptide complex we
solved in this section I should briefly described the structural elements that are combined to
form PHD-BAH cassette.
The PHD finger is a small zinc-binding motif, characterized by a specific Cys4-Hys-Cys3
pattern, corresponding to a C-X1-2-C-X9–21-C-X2–4-C-X4-5-H-X2-C-X12–46-C-X2-C consensus
sequence of approximately 50-80 amino acids, where the 8 underlined residues coordinate
two Zn2+
ions.[145-147]
The arrangement of cysteine, histidine and other neighborhood residues distinguishes this
domain from similar zinc-binding motifs as Cys3-His-Cys4 RING finger and Cys2-His-Cys5
LIM domain.[148]
The name PHD finger come from the cysteine-rich regions of the two closely related plant
homeo domain proteins, HAT3.1 of Arabidopsis thaliana and Zmhox1a of maize.[149]
In animals PHD fingers are found in transcriptional regulators often involved in chromatin-
remodelling such as the co-activators p300 and CBP, polycomb-like protein (PC), Trithorax-
group proteins like ASH1L, ASH2L and MLL, the autoimmune regulator (AIRE), Mi-2
complex (part of histone deacetylase complex) and the co-repressors TIF1, the newly
discovered JARID1-family of demethylases and many more.[145]

109
In the last five years, PHD fingers have emerged as protein motifs that specifically recognize
histone H3 N-terminal tail. Two distinct subclasses of PHD fingers have been identified,
which can specifically bind to either methylated (for example, bromodomain PHD finger
transcription factor [BPTF] and inhibitor of growth family 2 [ING2] ) or unmethylated
lysine residues on the histone H3 N-terminal tail. [150, 151]
The last peculiar recognition process of unmethylated H3K4 was assessed for the
BHC80 protein, which cooperates with lysine-specific histone demethylase (LSD1). [139]
The second motif, the BAH (bromo adjacent homology) motif was found in eukaryotic
DNA (cytosine-5) methyltransferase, the origin replication complex (ORC1) and several
proteins involved in transcriptional regulation.[152]
The BAH domain appears to act as a protein-protein interaction module specialized in gene
silencing, as suggested for example by its interaction within yeast Orc1p with the silent
information regulator Sir1p.[153] The BAH module might has suggested to play an
important role by linking DNA methylation, replication and transcriptional regulation.[152]
The features of the BAH domain can be clearly resumed with the following: preceded or
followed by non-globular regions; found at the NH2-terminus of some proteins (e.g. N-
terminus of human Orc1 proteins) and immediately followed by well defined modules such
as PHD fingers (e.g. receptor-like protein ES43 of barley or ASH1 of drosophila).[145]
The functional relevance of this last feature is still unknown, even if represents a nodal point
highlighting if with the multiple presence of those motifs emerges a new activity due to this
peculiar combination.

110
6.2 Materials and Methods
6.2.1 Materials
Synthetic peptide and oligonucleotides. DNA sequences and PCR primers were purchased
from Invitrogen (Grand Island, NY, USA) as lyophilized powder and solubilized in 5 mM
Tris, pH 8.0. Oligonucleotide concentration was determined by absorbance at 260 nm. The
H3 1-10 peptide (table 6.1), (un-, mono-, di- or tri-methylated on lysine 4) used in the
preliminary studies and in the crystallization trials were generously supplied by the group of
Steven Jacobsen as lyophilized powder and then solubilized with DI water.
H3(1-10) ARTKQTARKS
Table 5.1: Decapeptide that mimicries the N terminal of the histone 3. The lysine 4, subject
of the modifications is evidenced in bold.
Prokaryotic competent cells. Escherichia coli chemically competent One Shot® TOP10
(Invitrogen, Grand Island, NY, USA) and BL21 (DE3) RIL (Stratagene, Santa Clara, CA,
USA) cells were used for gene cloning and protein expression, respectively.
6.2.2 Methods
Protein expression and purification. The PCR-amplified cDNA fragment of arabidopsis
thaliana ORC1b encoding the BAH-PHD cassette (residue 126-346) was cloned into the
self-modified expression vector and Glutatione S-transferase (GST)-tagged protein was
overexpressed in Escherichia coli strain BL21 (DE3) RIL cells (Stratagene, Santa Clara,
CA, USA)

111
Fig. 6.3: Schematic diagram of the atORC1b fragment analyzed in this study.
Transformed cells were grown at 37 °C in one liter of LB media (containing 30 mg/l
kanamycin and 25 mg/l chloramphenicol, respectively) supplemented with 0.1 mM ZnCl2
until OD600 reached 1.0, then the media was cooled to 20 °C and isopropylthio-β-D-
galactoside (IPTG) was added to a final concentration of 0.2 mM to induce protein
expression overnight.
The cells were harvested by centrifugation at 4 °C for 12 minutes (4500 g) and resuspended
in buffer A (250 mM NaCl, 20 mM Tris pH 7.5) supplemented with 1 mM
phenylmethylsulphonyl fluoride (PMSF) as protease inhibitor and 2 mM β-mercaptoethanol
(β-ME) to reduce oxidation damage.
After cells lysis on ice by high-pressure homogenizer (French press) the insoluble cell debris
was removed from the cell lysate by centrifugation at 4 °C for 90 minutes (16000 g).
Subsequently lysate was purified by affinity chromatography, loading the supernatant onto
two 5 ml GSTrap FF columns (GE Healthcare, Little Chalfont, Buckinghamshire, UK).
After extensive washing by buffer A, the target protein was eluted with buffer A
supplemented with 20 mM reduced glutathione.
The GSH tag was cleaved by prescission protease at room temperature. The digestion
mixture was dialyzed at 4 °C overnight against one liter of buffer B (150 mM NaCl, 20 mM
Tris pH 8.0 and 5 mM Dithiothreitol (DTT)).
Subsequently the protein was purified by ion exchange chromatography (IEC) by loading
the protein with buffer B onto two 5ml HiTrap Q FF columns (GE Healthcare, Little
Chalfont, Buckinghamshire, UK).
Then, the protein was eluted with a linear gradient (50%/50 min) from the buffer B (50 mM
sodium to the elution buffer (2 M NaCl, 20 mM Tris pH 8.0) at 2.5 ml/min flow rate.

112
Protein samples were concentrated using an Amicon Ultra-15 centrifugal filter (Millipore,
Billerica, MA, USA) with a 10 kDa MWCO Cut off membrane to a final volume of 1 ml
and the ionic strength of the solution was decreased to 150 mM sodium chloride.
The pooled target protein was further purified by gel filtration using a Hiload Superdex
G200 16/60 column (GE Healthcare, Little Chalfont, Buckinghamshire, UK) with buffer B
at 1.0 ml/min flow rate.
Finally, the purified proteins were concentrated to 15–20 mg/mL in 150 mM NaCl, 20 mM
Tris pH 8.0 and 5 mM DTT using an Amicon Ultra-15 centrifugal filter (Millipore, Billerica,
MA, USA) with a 10 kDa MWCO Cut off membrane.
Every purification step was performed by liquid chromatography using an ÄKTA FPLC
apparatus (GE Healthcare, Port Washington, NY, USA) equipped with a P-1 pump (GE
Healthcare, Port Washington, NY, USA) for large sample volumes loading and with a
Frac_900 fraction collector (GE Healthcare, Port Washington, NY, USA).
Crystallization and Synchrotron Data Collection. In order to obtain the crystallization of
Origin Recognition Complex 1b BAH-PHD with unmethylated H3K4 decapeptide, the protein
was concentrated to 15 mg/ml and mixed with peptide in molar ratios of 1:5 at 4 °C for 1 hr.
Crystallization was carried out at 20 °C using the hanging drop vapor diffusion method by
mixing 1.5 µl of protein-peptide complex sample with 1.5 µl reservoir solution.
The crystallization conditions were initially identified using the following sparse-matrix
screen kits: JCSG I, II, III, IV, Compas and PACT (Hampton Research), screening in total
576 crystallization conditions.
Several conditions yielded crystallization of the complexes within several days.
Then the crystals were directly mounted on a nylon loop for diffraction data collection.
X-ray diffraction data set for H3(1–10)K4me0-bound to atORC1bBAH-PHD domain were
collected at zinc peak wavelength on the X29A, National Synchrotron Light Source (NSLS)
at Brookhaven National Laboratory (New York, NY, USA).
The diffraction data were indexed, integrated and scaled using the HKL 2000 program. The
structure of free atORC1bBAH-PHD was solved by the single-wavelength dispersion method
with zinc atoms using the AutoSol program embedded in PHENIX software, which also
gave an initial structural model.

113
Further modeling of atORC1bBAH-PHD domain was carried out using COOT, and then refined
using PHENIX. The final model was refined to 1.9 Å resolution.
ITC measurements. Protein samples used for ITC measurements were subjected to
overnight dialysis against buffer containing 150 mM NaCl, 20 mM Tris (pH 7.5) and 2 mM
b-mercaptoethanol.
Extensively lyophilized H3 1–10 peptides (un-, mono-, di- or tri-methylated on lysine 4)
were dissolved in the same buffer.
Before each measurement, the protein concentration was adjusted to about 0.1 mM.
ITC measurements were carried out from 0.1 mM protein concentration, with 1.5 mM
peptide concentration, on an ITC200 Microcal calorimeter (MicroCal, Piscataway, NJ,
USA) at 25 °C.
A typical titration consisted of 17 injections of 2.4 µl of DNA solution into protein solution
at time intervals of 180 s.
Binding constants were calculated by fitting the data using the ITC data analysis module of
Origin 7.0 (OriginLab Corporation) with a 1:1 binding model.
Computational methods.
The computational sequence analysis, aimed to rapid identifies modular architecture was
carried out using the Web-based tool SMART, available on line at the website:
http://smart.embl-heidelberg.de/ [128]
Alignment of the primary structures corresponding to histone readers PHD fingers was
carried out using the program Multalin, available on line at the website:
http://multalin.toulouse.inra.fr/multalin/ [154]
The detailed analysis on the stereochemistry of the protein structure was performed with
PROCHECK programs. [155]
The analysis of the solved structure and the preparation of the figures were done with the
program PyMol (http://www.pymol.org/).

114
6.3 Results
6.3.1 Biochemical and bioinformatics evidences for atORC1bPHD-BAH as
H3K4Me0 reader
Understanding the mechanisms employed by effector proteins to recognize specific histone
codes and translate this information into a specific gene expression response represents a
challenging goal in epigenetics.
In this study we expressed and purified the fragment of Arabidopsis ORC1b (residue 126-
346) in yields sufficient for structural and function analysis.
This specific construct was identified through a bioinformatic analysis of the full length
sequence and chosen according to the presence of two adjacent chromatin associated motifs,
a PHD (plant homeo domain) finger followed by a BAH (bromo adjacent homology)
domain.
A first approach for the analysis and prediction of the features of the PHD finger was carried
out by comparing atORC1bPHD primary structure with other PHD fingers whose specificity
for binding either methylated (me3) or unmethylated (me0) H3K4 was well established both
biochemically and structurally.
The multiple sequence alignment confirms that atORC1bPHD motif presents the classical
Cys4-Hys-Cys3 pattern of the PHD finger fold (Fig. 6.4). [146]
In addiction we can identify, within atORC1b PHD sequence, the specific signature that
characterizes PHD fingers that recognize unmethylated H3K4.
This pattern shows the presence of negatively charged amino acids (glutamic or aspartic
acids, highlighted in the blue in the figure 6.4) preceding the canonical PHD finger, those
acid residues have been proposed as key elements for recognition of unmodified H3K4.
Another significant pattern for PHD fingers, able to “read” unmethylated H3K4, is the
presence of two prolines intersperse between the 5th
and 6th
Cys that are supposed to force
the conformation to a characteristic molecular architecture.

115
Conversely, the PHD fingers which recognize trimethylated H3K4, presents hydrophobic
residues highlighted in violet in the figure 6.4, which are implied in trimethylated H3K4
recognition.
Fig. 6.4: Sequence alignment of PHD fingers of histone readers.
Sequence comparison between the PHD finger of the atORC1b (fully evidenced in the
schematic diagram of the protein) with other PHD fingers which recognize trimethylated or
unmodified H3K4. Residues highlighted in red are implicated in the Cys4-Hys-Cys3
coordination of the two zinc ions. The aspartate and glutamate highlighted in light blue are
keys for recognition of unmodified H3K4.
Residues highlighted in violet are implicated in trimethylated H3K4 recognition.
To further confirm the affiliation of the whole PHD-BAH cassette and so devise the best
crystallization screening, we performed ITC experiments. They allowed us to determine the
dissociation constant (Kd) of the complex between the protein construct and the
decapeptide, corresponding to H3 N-terminal tail, in different methylation states (K4me3, 2,
1 and K4me0). (Fig. 6.5) We proved that PHD-BAH cassette shows a clear specificity for
unmodified H3K4, binding the peptide with a Kd of 2.82 µM. We further asset that mono
and di-methylation on epsilon amino group of lysine 4 entails an approximately 5 and 6-fold
drop in binding affinity (14.9 µM for me1 and 17.2 for me2), respectively.

116
Finally, the binding affinity is totally cancelled for the three methylated lysine 4 (in this last
case the dissociation constant is too weak to be measured accurately).
According to this experiment, we concluded that PHD-BAH cassette is able to recognize the
histone H3 N-terminal tail in vitro, evidencing a binding specificity for unmethylated versus
methylated forms of the peptide.
Fig. 6.5: Quantification of the binding affinity between atORC1bPHD-BAH and unmodified,
mono-, di- and tri methylated H3K4 peptides (residues 1–10) by ITC.
6.3.2 Structural basis of H3K4Me0 readout by atORC1b BAH-PHD
The full-length Arabidopsis thaliana Orc1b protein proved to be difficult to crystallize.
In order to understand the molecular basis of histone recognition, we attempted to crystallize
the BAH-PHD cassette of atORC1b in complex with the unmodified histone H3(1-10)
peptide. AtOrc1b protein fragment comprised of amino acids produced crystals that
diffracted to 1.9 Å. The structure of the protein-peptide complex was determined by
anomalous dispersion with single-wavelength anomalous diffraction (SAD) method. The
final Rwork was refined to 19.4 % and Rfree was 20.5 % (Table 6.1). The crystal belongs to
P43 space group. The data statistic and structure refinement are shown below.
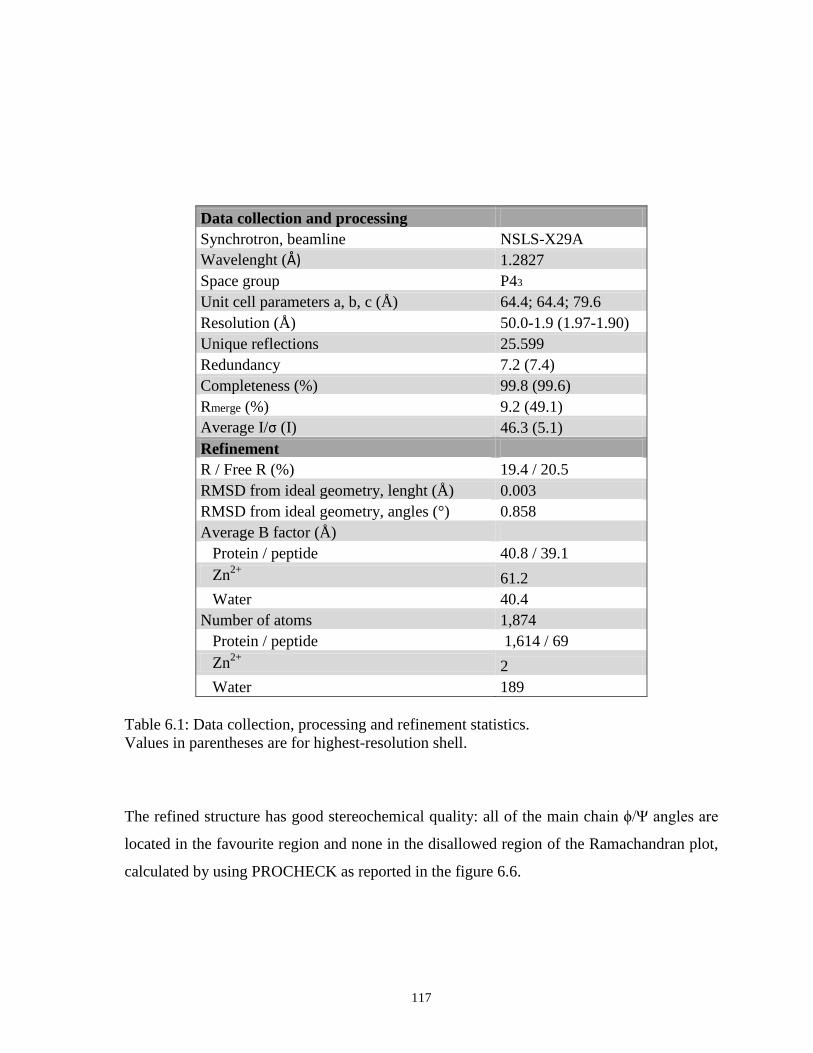
117
Data collection and processing
Synchrotron, beamline NSLS-X29A
Wavelenght (Å) 1.2827
Space group P43
Unit cell parameters a, b, c (Å) 64.4; 64.4; 79.6
Resolution (Å) 50.0-1.9 (1.97-1.90)
Unique reflections 25.599
Redundancy 7.2 (7.4)
Completeness (%) 99.8 (99.6)
Rmerge (%) 9.2 (49.1)
Average I/σ (I) 46.3 (5.1)
Refinement
R / Free R (%) 19.4 / 20.5
RMSD from ideal geometry, lenght (Å) 0.003
RMSD from ideal geometry, angles (°) 0.858
Average B factor (Å)
Protein / peptide 40.8 / 39.1
Zn2+
61.2
Water 40.4
Number of atoms 1,874
Protein / peptide 1,614 / 69
Zn2+
2
Water 189
Table 6.1: Data collection, processing and refinement statistics.
Values in parentheses are for highest-resolution shell.
The refined structure has good stereochemical quality: all of the main chain ϕ/Ψ angles are
located in the favourite region and none in the disallowed region of the Ramachandran plot,
calculated by using PROCHECK as reported in the figure 6.6.

118
Fig. 6.6: The ensemble of backbone conformations of atORC1b displayed through the
observed Ramachandran plot
As predicted from the bioinformatic analysis of the protein sequence, the structure presents a
canonical PHD finger (residues 162-215) defined by a ‘cross-braced’ topology and
stabilized by a pair of coordinated zinc ions (Fig. 6.7.B). The PHD finger is composed by a
pair of antiparallel beta-strands (b1: 180-183, b2: 187-191) flanked by two short α-helices
(residues 192-194 and 210-214) and two long loops, unresolved. This PHD motif is
followed by an additional BAH domain that delimits the N-terminal H3 binding site, in a
specific molecular clamp that recognizes selectively the peptide substrate. This domain
mainly consists of a series of antiparallel beta sheets and is reminiscent of a β barrel-like
architecture. [152]
In details this module is built up on a total of 14 antiparallel β strands arranged around a
central core defined by four long antiparallel strands as evidences in figure 6.7.C.

119
This specific arrangement is similar to the first BAH domain solved by X-ray
crystallography for saccharomyces cerevisiae ORC1 subunit (pdb code: 1M4Z), which is
composed by 6 β-strands arranged around a core of four long antiparallel β sheets. [153]
The decapeptide that mimicries H3K4 histone tail results partially contained in a short
groove on the protein, marked by a prominent presence of negative charges (Fig. 6.8).
Fig. 6.7: The molecular basis of H3(1-10)K4me0 recognition by atORC1b BAH-PHD.
In PANEL A: Overall structure of atORC1bPHD-BAH bound to H3(1-10)K4me0 peptide. The
PHD finger (green), the BAH domain (pink) and the bound H3K4me0 peptide (white) are
shown in ribbon representation, respectively.
In PANEL B: The cross-brace topology of the PHD domain is evidences and the residues
involved in chelating Zn2+
are shown in stick representation.
In PANEL C: The central core of the BAH domain is evidenced.

120
Fig. 6.8: Electrostatic surface representation of atORC1bPHD-BAH cassette. (blue positive
charges, red negative ones). In the zoomed panel is highlighted how only N-terminal
residues of H3 are caged inside the binding groove, defined by positive charges.
The peptide does not adopt an extended β-strands conformation as was reported for the
structures of H3K4Me0 reader AIRE complex (Fig. 6.10) (pdb code: 2KFT), [156]but,
instead, it folds into a bent arrangement with a sharp turn of nearly 90 degree level with the
peptide tyrosine 6. This constrained arrangement drives the three ARK residues on the
outward surfaces of the BAH domain, leading the positive charged guanidinium group of H3
arginine 8 to form a salt bridge with the carboxylates of the BAH residue aspartic acid 162
placed on the external surface of the domain (Fig. 6.9).
Distinct peptide foldings can be attributed to a substantial difference between the two
binding sites. Indeed, for AIREPHD, the recognition of H3(1-10)K4Me0 fully occurs on the
domain surface through the formation of antiparallel β sheets (Fig. 6.10) while for the
atORC1b PHD-BAH cassette the binding site coincides with a well defined narrow groove
that does not allows a plain insertion of the decapeptide.

121
Fig. 6.9: Positioning of H3(1–10) peptides on the external surface of atORC1b BAH-PHD
cassette. The C terminal of the peptide is forced in a bent conformation through the
formation of stabilizing charge charge interactions occurring between the R8 of the
decapeptide and the D162 of the atORC1bPHD finger.
Fig. 6.10: View of the association between human AIRE-PHD (296–367) and unmodified
H3 (1-10).(PDB code: 2KFT) [156]. The peptide that mimicries the N-terminal histone 3
(displayed as silver cartoon) interacts with the PHD domain through the formation of
antiparallel β sheets.

122
As widely described in the literature, the first two charged residues of the H3 amino
terminus are pivotal marks in defining the binding mode with histone readers. [133-135]
In our structure atORC1bPHD-BAH accommodates the side chains of H3K4 and H3R2
simultaneously in two different binding surfaces that are separated by the side chain of a
glutamic acid 182, a residue involved in simultaneous binding with those crucial residues
(Fig. 6.11).
The side chain of H3K4 sits in narrow polar cage, where the unmodified lysine ε ammonium
group of the side chain forms a direct hydrogen bonds with backbone carbonyl oxygen of
L187 (Fig. 6.11). In addition, this group is anchored through a stabilizing electrostatic bridge
with the carboxylate of highly conserved glutamic acids 167 and 182.
Fig. 6.11:. Detailed view of the association between ORC1b BAH-PHD binding site and
H3K4 in its unmethylated form. The width of the K4 binding site is evidenced.
It is interesting to observe how all the residues involved in K4 binding belongs to the PHD
finger, so a structural comparison with other similar PHD histone readers could be
considered an effective strategy to reinforce the validness of the model.

123
This binding mode for K4 agrees with the recognition pattern of unmethylated lysine in the
3D structures of other H3K4Me0 readers, AIREPHD (pdb code: 2KFT) [156] and BHC80PHD.
[139]
As well, in these complexes the side chain of H3K4 fits into a narrow channel defined by
two polar residues (D297 and N295 for AIRE, D489 and E488 for BHC80).
On reverse, the X-ray structures of methyl-lysine-binding PHD fingers such as BPTF (pdb
code: 2F6J [150]) and ING2 (pdb code: 2VNF [151]) show that K4 side chain is buried by a
wider full aromatic cage defined by tyrosines 10 and 17 and tryptophan 32 for BPTF (Fig.
6.12) and tyrosines 216, 223 and tryptophan 239 for ING2.
Fig. 6.12: Detailed interactions between human BPTF PHD domain (displayed in green)
and H3K4 in its trimethylated form. (PDB code: 2F6J)
The width of the K4 binding site is evidenced.

124
This structural model is consistent with the results obtained by the ITC assays which proved
the selectivity of the ORC1b BAH-PHD cassette to H3K4(1-10)me0 and attested the
impaired binding to mono- / di-methylated H3K4 peptide.
An increasing methylation state at H3K4 would both create steric clashes with residues
defining the narrow negative “cage” and disrupt the ionic interactions with D167 and 182
and finally impair hydrogen bonding with L187 backbone.
The considerations made on the three dimensional structure perfectly agree with the totally
lack of binding affinity to trimethylated H3K4 peptide, as we demonstrated via ITC.
The other positive charged residue, the H3R2, sits in a small pocket where the positive
charged guanidinium forms hydrogen bond with the backbone carbonyls of G323 and A319
and with the carboxylate group of glutamic acid 182 through a water molecule that
simultaneously binds to the two charged side chains. (Fig. 6.13.A)
The binding ability of R2 by histone readers is quite uncommon since in several
crystallographic complexes this positive charged residue is oriented toward the solvent,
without suggesting a prominent role in the protein-peptide recognition event.
An exception is given by crystal structure of PHD finger of human AIRE complexed with
H3(1-10)K4me0 peptide (pdb code: 2KFT), where the arginine 2 of the peptide is restrained
via charge charge interactions with the D312 of the protein (Fig. 6.13.B).
A concept which deserves to be emphasized is that, for the binding of arginine 2, both
domains (PHD and BAH) are equally involved. This finding represents a new structural
element in histone reader modules and further underlines the scientific relevance of
combinatorial read out of the histone code by tandemly arranged reader modules.

125
Fig. 6.13: Detailed interactions between atORC1b BAH-PHD binding site and H3R2
(PANEL A) and the analogous interactions between the H3R2 and the PHD finger of human
AIRE (PANEL B) as was reported in corresponding crystallographic model. (PDB code:
2KFT)
6.4 Conclusions
The interplay between epigenetic reading domains within the same complex generates a
multifaceted network of contacts and combinations that can elicit distinct biological
outcomes. However only little information are known about the structural arrangement of
multiple readers which recognize post transcriptional modification pattern on histone
globular domains. In sum, we have proposed a pioneer 3D model which describes how two
distinct histone-binder modules can be structural combined in order to reach a histone tail-
binding specificity. This remarkable result, sustained by calorimetric functional data,
provides structural insights in the specific recognition of the decapeptide that mimicries the
N-terminal tail of histone 3 and proposed atORC1bPHD-BAH as un-methylated histone 3
reader. However, biochemical and cytological results, associated the H3K4Me with the
active genes of euchromatin in Arabidopsis, combined with our structural insights of the
recognition process are not enough to unambiguously define the role of ORC1b as silencing
regulation factor (as often described for its evolutionary conserved non replication function).

126
Therefore further studies are needed to fully define the precise role of both ORC1b inside
the dynamic network of chromatin remodelling factors in Arabidopsis organism, considering
the possible recruitment of other silencing chromatin proteins.
This open question is being currently evaluated by the group of Steven Jacobsen, at UCLA,
which is collaborating with our structural biology group, through an extensive analysis of
the interactions between transcription factors by means of ChiP.

127
References
1. Watson, J.D. and F.H. Crick, Molecular structure of nucleic acids; a structure for
deoxyribose nucleic acid. Nature, 1953. 171(4356): p. 737-8.
2. Gellert, M., M.N. Lipsett, and D.R. Davies, Helix formation by guanylic acid. Proc
Natl Acad Sci U S A, 1962. 48: p. 2013-8.
3. Mathad, R.I., et al., c-MYC promoter G-quadruplex formed at the 5'-end of NHE III1
element: insights into biological relevance and parallel-stranded G-quadruplex
stability. Nucleic Acids Res, 2011. 39: p. 9023-9033.
4. Burge, S., et al., Quadruplex DNA: sequence, topology and structure. Nucleic Acids
Res, 2006. 34(19): p. 5402-15.
5. Davis, J.T., G-quartets 40 years later: from 5'-GMP to molecular biology and
supramolecular chemistry. Angew Chem Int Ed Engl, 2004. 43(6): p. 668-98.
6. Phan, A.T., V. Kuryavyi, and D.J. Patel, DNA architecture: from G to Z. Curr Opin
Struct Biol, 2006. 16(3): p. 288-98.
7. Simonsson, T., G-quadruplex DNA structures--variations on a theme. Biol Chem,
2001. 382(4): p. 621-8.
8. Sen, D. and W. Gilbert, A sodium-potassium switch in the formation of four-stranded
G4-DNA. Nature, 1990. 344(6265): p. 410-4.
9. Niedle, S. and S. Balasubramanian, Quadruplex Nucleic Acids. T.R.S.o. Chemistry,
Editor. 2006. Chapter 1.2.3.
10. Esposito, V., et al., A topological classification of G-quadruplex structures.
Nucleosides Nucleotides Nucleic Acids, 2007. 26(8-9): p. 1155-9.
11. Niedle, S. and S. Balasubramanian, Quadruplex Nucleic Acids. T.R.S.o. Chemistry,
Editor. 2006. Chapter 1.3.2.
12. Niedle, S. and S. Balasubramanian, Quadruplex Nucleic Acids. T.R.S.o. Chemistry,
Editor. 2006. Chapter 3.
13. Guedin, A., et al., How long is too long? Effects of loop size on G-quadruplex
stability. Nucleic Acids Res, 2010. 38(21): p. 7858-68.
14. Smirnov, I. and R.H. Shafer, Effect of loop sequence and size on DNA aptamer
stability. Biochemistry, 2000. 39(6): p. 1462-8.

128
15. Hazel, P., et al., Loop-Length-Dependent Folding of G-Quadruplexes. Journal of the
American Chemical Society, 2004. 126(50): p. 16405-16415.
16. Haider, S., G.N. Parkinson, and S. Neidle, Crystal structure of the potassium form of
an Oxytricha nova G-quadruplex. J Mol Biol, 2002. 320(2): p. 189-200.
17. Dai, J., M. Carver, and D. Yang, Polymorphism of human telomeric quadruplex
structures. Biochimie, 2008. 90(8): p. 1172-83.
18. Gray, R.D. and J.B. Chaires, Kinetics and mechanism of K+- and Na
+-induced
folding of models of human telomeric DNA into G-quadruplex structures. Nucleic
Acids Res, 2008. 36(12): p. 4191-203.
19. Laughlan, G., et al., The high-resolution crystal structure of a parallel-stranded
guanine tetraplex. Science, 1994. 265(5171): p. 520-4.
20. Schultze, P., R.F. Macaya, and J. Feigon, Three-dimensional solution structure of the
thrombin-binding DNA aptamer d(GGTTGGTGTGGTTGG). J Mol Biol, 1994.
235(5): p. 1532-47.
21. Wang, Y. and D.J. Patel, Solution structure of the human telomeric repeat
d[AG3(T2AG3)3] G-tetraplex. Structure, 1993. 1(4): p. 263-82.
22. Parkinson, G.N., M.P. Lee, and S. Neidle, Crystal structure of parallel quadruplexes
from human telomeric DNA. Nature, 2002. 417(6891): p. 876-80.
23. Dai, J., et al., Structure of the intramolecular human telomeric G-quadruplex in
potassium solution: a novel adenine triple formation. Nucleic Acids Res, 2007.
35(7): p. 2440-50.
24. Arthanari, H. and P.H. Bolton, Functional and dysfunctional roles of quadruplex
DNA in cells. Chem Biol, 2001. 8(3): p. 221-30.
25. Maizels, N., Dynamic roles for G4 DNA in the biology of eukaryotic cells. Nat Struct
Mol Biol, 2006. 13(12): p. 1055-9.
26. Lipps, H.J. and D. Rhodes, G-quadruplex structures: in vivo evidence and function.
Trends Cell Biol, 2009. 19(8): p. 414-22.
27. Huppert, J.L. and S. Balasubramanian, Prevalence of quadruplexes in the human
genome. Nucleic Acids Res, 2005. 33(9): p. 2908-16.
28. Riou, J.F., et al., G-quadruplex DNA: myth or reality?. Bull Cancer, 2003. 90(4): p.
305-13.

129
29. Williamson, J.R., G-quartet structures in telomeric DNA. Annu Rev Biophys Biomol
Struct, 1994. 23: p. 703-30.
30. Maiti, S., Human telomeric G-quadruplex. FEBS J, 2010. 277(5): p. 1097.
31. Blackburn, E.H., Structure and function of telomeres. Nature, 1991. 350(6319): p.
569-73.
32. Rezler, E.M., D.J. Bearss, and L.H. Hurley, Telomeres and telomerases as drug
targets. Curr Opin Pharmacol, 2002. 2(4): p. 415-23.
33. Baran, N., et al., The SV40 large T-antigen helicase can unwind four stranded DNA
structures linked by G-quartets. Nucleic Acids Res, 1997. 25(2): p. 297-303.
34. Siddiqui-Jain, A., et al., Direct evidence for a G-quadruplex in a promoter region
and its targeting with a small molecule to repress c-MYC transcription. Proc Natl
Acad Sci U S A, 2002. 99(18): p. 11593-8.
35. Grand, C.L., et al., The cationic porphyrin TMPyP4 down-regulates c-MYC and
human telomerase reverse transcriptase expression and inhibits tumor growth in
vivo. Mol Cancer Ther, 2002. 1(8): p. 565-73.
36. Miller, M.C., et al., Polymorphism and resolution of oncogene promoter quadruplex-
forming sequences. Org Biomol Chem, 2011. 9(22): p. 7633-7.
37. Wu, Y. and R.M. Brosh, Jr., G-quadruplex nucleic acids and human disease. FEBS
J, 2010. 277(17): p. 3470-88.
38. Gomez-Marquez, J., DNA G-quadruplex: structure, function and human disease.
FEBS J, 2010. 277(17): p. 3451.
39. Hurley, L.H., DNA and its associated processes as targets for cancer therapy. Nat
Rev Cancer, 2002. 2(3): p. 188-200.
40. Sissi, C., B. Gatto, and M. Palumbo, The evolving world of protein-G-quadruplex
recognition: a medicinal chemist's perspective. Biochimie. 93(8): p. 1219-30.
41. Mayer, G., The chemical biology of aptamers. Angew Chem Int Ed Engl, 2009.
48(15): p. 2672-89.
42. Famulok, M. and G. Mayer, Chemical biology: aptamers in nanoland. Nature, 2006.
439(7077): p. 666-9.
43. Thiel, K., Oligo oligarchy-the surprisingly small world of aptamers. Nat Biotechnol,
2004. 22(6): p. 649-51.
130
44. Hermann, T. and D.J. Patel, Adaptive recognition by nucleic acid aptamers. Science,
2000. 287(5454): p. 820-5.
45. Stoltenburg, R., C. Reinemann, and B. Strehlitz, SELEX--a (r)evolutionary method to
generate high-affinity nucleic acid ligands. Biomol Eng, 2007. 24(4): p. 381-403.
46. Tombelli, S., M. Minunni, and M. Mascini, Analytical applications of aptamers.
Biosens Bioelectron, 2005. 20(12): p. 2424-34.
47. Deisingh, A.K., Aptamer-based biosensors: biomedical applications. Handb Exp
Pharmacol, 2006(173): p. 341-57.
48. Mairal, T., et al., Aptamers: molecular tools for analytical applications. Anal
Bioanal Chem, 2008. 390(4): p. 989-1007.
49. Pegaptanib sodium (Macugen) for macular degeneration. Med Lett Drugs Ther,
2005. 47(1212): p. 55-6.
50. Breaker, R.R., Natural and engineered nucleic acids as tools to explore biology.
Nature, 2004. 432(7019): p. 838-45.
51. Gatto, B., M. Palumbo, and C. Sissi, Nucleic acid aptamers based on the G-
quadruplex structure: therapeutic and diagnostic potential. Curr Med Chem, 2009.
16(10): p. 1248-65.
52. Chen, C.H., et al., Inhibition of heregulin signaling by an aptamer that preferentially
binds to the oligomeric form of human epidermal growth factor receptor-3. Proc Natl
Acad Sci U S A, 2003. 100(16): p. 9226-31.
53. Farrow, M.A. and P. Schimmel, Editing by a tRNA synthetase: DNA aptamer-
induced translocation and hydrolysis of a misactivated amino acid. Biochemistry,
2001. 40(14): p. 4478-83.
54. Oney, S., et al., Development of universal antidotes to control aptamer activity. Nat
Med, 2009. 15(10): p. 1224-8.
55. Bock, L.C., et al., Selection of single-stranded DNA molecules that bind and inhibit
human thrombin. Nature, 1992. 355(6360): p. 564-6.
56. Di Cera, E., Thrombin. Mol Aspects Med, 2008. 29(4): p. 203-54.
57. Mann, K.G., Thrombin: can't live without it; probably die from it. Chest, 2003.
124(3 Suppl): p. 1S-3S.

131
58. Di Cera, E., Thrombin as procoagulant and anticoagulant. J Thromb Haemost, 2007.
5 Suppl 1: p. 196-202.
59. Davie, E.W., K. Fujikawa, and W. Kisiel, The coagulation cascade: initiation,
maintenance, and regulation. Biochemistry, 1991. 30(43): p. 10363-70.
60. Seegers, W.H., R.H. Landaburu, and J.F. Johnson, Thrombin-E as a fibrinolytic
enzyme. Science, 1960. 131(3402): p. 726.
61. Mann, K.G., S. Butenas, and K. Brummel, The dynamics of thrombin formation.
Arterioscler Thromb Vasc Biol, 2003. 23(1): p. 17-25.
62. Johnson, P.H., Hirudin: clinical potential of a thrombin inhibitor. Annu Rev Med,
1994. 45: p. 165-77.
63. Carter, W.J., E. Cama, and J.A. Huntington, Crystal structure of thrombin bound to
heparin. J Biol Chem, 2005. 280(4): p. 2745-9.
64. De Filippis, V., et al., Effect of Na+ binding on the conformation, stability and
molecular recognition properties of thrombin. Biochem J, 2005. 390(Pt 2): p. 485-
92.
65. Samama, M.M., et al., Biochemistry and clinical pharmacology of new anticoagulant
agents. Pathophysiol Haemost Thromb, 2002. 32(5-6): p. 218-24.
66. Ponikova, S., M. Antalik, and T. Hianik, A circular dichroism study of the stability of
guanine quadruplexes of thrombin DNA aptamers at presence of K+ and Na
+ ions.
Gen Physiol Biophys, 2008. 27(4): p. 271-7.
67. Macaya, R.F., et al., Thrombin-binding DNA aptamer forms a unimolecular
quadruplex structure in solution. Proc Natl Acad Sci U S A, 1993. 90(8): p. 3745-9.
68. Padmanabhan, K., et al., The structure of alpha-thrombin inhibited by a 15-mer
single-stranded DNA aptamer. J Biol Chem, 1993. 268(24): p. 17651-4.
69. Kuryavyi, V., et al., A double chain reversal loop and two diagonal loops define the
architecture of a unimolecular DNA quadruplex containing a pair of stacked G(syn)-
G(syn)-G(anti)-G(anti) tetrads flanked by a G-(T-T) Triad and a T-T-T triple. J Mol
Biol, 2001. 310(1): p. 181-94.
70. Mao, X.A. and W.H. Gmeiner, NMR study of the folding-unfolding mechanism for
the thrombin-binding DNA aptamer d(GGTTGGTGTGGTTGG). Biophys Chem,
2005. 113(2): p. 155-60.

132
71. Baldrich, E. and C.K. O'Sullivan, Ability of thrombin to act as molecular chaperone,
inducing formation of quadruplex structure of thrombin-binding aptamer. Anal
Biochem, 2005. 341(1): p. 194-7.
72. Nagatoishi, S., Y. Tanaka, and K. Tsumoto, Circular dichroism spectra demonstrate
formation of the thrombin-binding DNA aptamer G-quadruplex under stabilizing-
cation-deficient conditions. Biochem Biophys Res Commun, 2007. 352(3): p. 812-7.
73. Russo Krauss, I., et al., High-resolution structures of two complexes between
thrombin and thrombin-binding aptamer shed light on the role of cations in the
aptamer inhibitory activity. Nucleic Acids Res. 40(16): p. 8119-28.
74. Tasset, D.M., M.F. Kubik, and W. Steiner, Oligonucleotide inhibitors of human
thrombin that bind distinct epitopes. J Mol Biol, 1997. 272(5): p. 688-98.
75. Becker, R.C., C. Rusconi, and B. Sullenger, Nucleic acid aptamers in therapeutic
anticoagulation. Technology, development and clinical application. Thromb
Haemost, 2005. 93(6): p. 1014-20.
76. Healy, J.M., et al., Pharmacokinetics and biodistribution of novel aptamer
compositions. Pharm Res, 2004. 21(12): p. 2234-46.
77. Kurreck, J., Antisense technologies. Improvement through novel chemical
modifications. Eur J Biochem, 2003. 270(8): p. 1628-44.
78. Kuwahara, M. and N. Sugimoto, Molecular evolution of functional nucleic acids
with chemical modifications. Molecules, 2010. 15(8): p. 5423-44.
79. Kypr, J., et al., Circular dichroism and conformational polymorphism of DNA.
Nucleic Acids Res, 2009. 37(6): p. 1713-25.
80. Paramasivan, S., I. Rujan, and P.H. Bolton, Circular dichroism of quadruplex DNAs:
applications to structure, cation effects and ligand binding. Methods, 2007. 43(4): p.
324-31.
81. Randazzo, A., G.P. Spada, and M.W. Silva, Circular Dichroism of Quadruplex
Structures. Top Curr Chem, 2012.
82. Niedle, S. and S. Balasubramanian, Quadruplex Nucleic Acids. T.R.S.o. Chemistry,
Editor. 2006. Chapter 1.4.2,
83. Masiero, S., et al., A non-empirical chromophoric interpretation of CD spectra of
DNA G-quadruplex structures. Org Biomol Chem, 2010. 8(12): p. 2683-92.
133
84. Zhou, G., X. Huang, and Y. Qu, The binding effect of aptamers on thrombin.
Biochemical engineering journal, 2010. 52: p. 117-122.
85. Lu, M., Q. Guo, and N.R. Kallenbach, Thermodynamics of G-tetraplex formation by
telomeric DNAs. Biochemistry, 1993. 32(2): p. 598-601.
86. Kankia, B.I. and L.A. Marky, Folding of the thrombin aptamer into a G-quadruplex
with Sr(2+): stability, heat, and hydration. J Am Chem Soc, 2001. 123(44): p. 10799-
804.
87. Rachwal, P.A. and K.R. Fox, Quadruplex melting. Methods, 2007. 43(4): p. 291-
301.
88. Bryan, T.M. and M.B. Jarstfer, Interrogation of G-quadruplex-protein interactions.
Methods, 2007. 43(4): p. 332-9.
89. Niedle, S. and S. Balasubramanian, Quadruplex Nucleic Acids. T.R.S.o. Chemistry,
Editor. 2006. Chapter 1.4.3.
90. Sun, D. and L.H. Hurley, Biochemical techniques for the characterization of G-
quadruplex structures: EMSA, DMS footprinting, and DNA polymerase stop assay.
Methods Mol Biol, 2010. 608: p. 65-79.
91. Nagatoishi, S., et al., Loop residues of thrombin-binding DNA aptamer impact G-
quadruplex stability and thrombin binding. Biochimie, 2011.
92. Risitano, A. and K.R. Fox, Influence of loop size on the stability of intramolecular
DNA quadruplexes. Nucleic Acids Res, 2004. 32(8): p. 2598-606.
93. Allain, C., D. Monchaud, and M.P. Teulade-Fichou, FRET templated by G-
quadruplex DNA: a specific ternary interaction using an original pair of
donor/acceptor partners. J Am Chem Soc, 2006. 128(36): p. 11890-3.
94. Niedle, S. and S. Balasubramanian, Quadruplex Nucleic Acids. T.R.S.o. Chemistry,
Editor. 2006. Chapter 1.4.4.
95. Treuheit, N.A., M.A. Beach, and E.A. Komives, Thermodynamic Compensation
upon Binding to Exosite 1 and the Active Site of Thrombin. Biochemistry, 2010.
50(21): p. 4590-6.
96. Colwell, N.S., et al., Allosteric effects of a monoclonal antibody against thrombin
exosite II. Biochemistry, 1998. 37(43): p. 15057-65.
134
97. Rachwal, P.A., T. Brown, and K.R. Fox, Sequence effects of single base loops in
intramolecular quadruplex DNA. FEBS Lett, 2007. 581(8): p. 1657-60.
98. Cevec, M. and J. Plavec, Role of loop residues and cations on the formation and
stability of dimeric DNA G-quadruplexes. Biochemistry, 2005. 44(46): p. 15238-46.
99. Nagatoishi, S., et al., Loop residues of thrombin-binding DNA aptamer impact G-
quadruplex stability and thrombin binding. Biochimie. 93(8): p. 1231-8.
100. Takahama, K., et al., Loop lengths of G-quadruplex structures affect the G-
quadruplex DNA binding selectivity of the RGG motif in Ewing's sarcoma.
Biochemistry. 50(23): p. 5369-78.
101. Rachwal, P.A., et al., Intramolecular DNA quadruplexes with different arrangements
of short and long loops. Nucleic Acids Res, 2007. 35(12): p. 4214-22.
102. Kumar, N., et al., Effect of loop length variation on quadruplex-Watson Crick duplex
competition. Nucleic Acids Res, 2008. 36(13): p. 4433-42.
103. Rachwal, P.A., T. Brown, and K.R. Fox, Effect of G-tract length on the topology and
stability of intramolecular DNA quadruplexes. Biochemistry, 2007. 46(11): p. 3036-
44.
104. Marson, G., M. Palumbo, and C. Sissi, Folding versus charge: understanding
selective target recognition by the thrombin aptamers. Curr Pharm Des, 2012.
18(14): p. 2027-35.
105. Takahara, P.M., et al., Crystal structure of double-stranded DNA containing the
major adduct of the anticancer drug cisplatin. Nature, 1995. 377(6550): p. 649-52.
106. Zheng, X.H., et al., Pt(II) squares as selective and effective human telomeric G-
quadruplex binders and potential cancer therapeutics. Dalton Trans, 2012. 41(38):
p. 11807-12.
107. Viglasky, V., Platination of telomeric sequences and nuclease hypersensitive
elements of human c-myc and PDGF-A promoters and their ability to form G-
quadruplexes. FEBS J, 2009. 276(2): p. 401-9.
108. Bertrand, H., et al., Exclusive platination of loop adenines in the human telomeric G-
quadruplex. Org Biomol Chem, 2009. 7(14): p. 2864-71.

135
109. Okazaki, S., et al., Identification of a pentanucleotide telomeric sequence,
(TTAGG)n, in the silkworm Bombyx mori and in other insects. Mol Cell Biol, 1993.
13(3): p. 1424-32.
110. Amrane, S., et al., A novel chair-type G-quadruplex formed by a Bombyx mori
telomeric sequence. Nucleic Acids Res, 2009. 37(3): p. 931-8.
111. Jamieson, E.R. and S.J. Lippard, Structure, Recognition, and Processing of
Cisplatin-DNA Adducts. Chem Rev, 1999. 99(9): p. 2467-98.
112. Musetti, C., et al., DNA reactivity profile of trans-platinum planar amine derivatives.
ChemMedChem, 2011. 6(7): p. 1283-90.
113. Hermeking, H., The MYC oncogene as a cancer drug target. Curr Cancer Drug
Targets, 2003. 3(3): p. 163-75.
114. Marcu, K.B., S.A. Bossone, and A.J. Patel, myc function and regulation. Annu Rev
Biochem, 1992. 61: p. 809-60.
115. Meyer, N. and L.Z. Penn, Reflecting on 25 years with MYC. Nat Rev Cancer, 2008.
8(12): p. 976-90.
116. Pelengaris, S. and M. Khan, The many faces of c-MYC. Arch Biochem Biophys,
2003. 416(2): p. 129-36.
117. Gonzalez, V. and L.H. Hurley, The c-MYC NHE III(1): function and regulation.
Annu Rev Pharmacol Toxicol. 50: p. 111-29.
118. Cashman, D.J., et al., Molecular modeling and biophysical analysis of the c-MYC
NHE-III1 silencer element. J Mol Model, 2008. 14(2): p. 93-101.
119. Yang, D. and L.H. Hurley, Structure of the biologically relevant G-quadruplex in the
c-MYC promoter. Nucleosides Nucleotides Nucleic Acids, 2006. 25(8): p. 951-68.
120. Ambrus, A., et al., Solution structure of the biologically relevant G-quadruplex
element in the human c-MYC promoter. Implications for G-quadruplex stabilization.
Biochemistry, 2005. 44(6): p. 2048-58.
121. Dexheimer, T.S., et al., NM23-H2 may play an indirect role in transcriptional
activation of c-myc gene expression but does not cleave the nuclease hypersensitive
element III(1). Mol Cancer Ther, 2009. 8(5): p. 1363-77.
122. Ginisty, H., et al., Structure and functions of nucleolin. J Cell Sci, 1999. 112 ( Pt 6):
p. 761-72.
136
123. Gonzalez, V. and L.H. Hurley, The C-terminus of nucleolin promotes the formation
of the c-MYC G-quadruplex and inhibits c-MYC promoter activity. Biochemistry.
49(45): p. 9706-14.
124. Hanakahi, L.A., et al., Nucleolin is one component of the B cell-specific transcription
factor and switch region binding protein, LR1. Proc Natl Acad Sci U S A, 1997.
94(8): p. 3605-10.
125. Balasubramanian, S., L.H. Hurley, and S. Neidle, Targeting G-quadruplexes in gene
promoters: a novel anticancer strategy? Nat Rev Drug Discov. 10(4): p. 261-75.
126. Ginisty, H., F. Amalric, and P. Bouvet, Two different combinations of RNA-binding
domains determine the RNA binding specificity of nucleolin. J Biol Chem, 2001.
276(17): p. 14338-43.
127. Serin, G., et al., Two RNA-binding domains determine the RNA-binding specificity of
nucleolin. J Biol Chem, 1997. 272(20): p. 13109-16.
128. Schultz, J., et al., SMART, a simple modular architecture research tool:
identification of signaling domains. Proc Natl Acad Sci U S A, 1998. 95(11): p.
5857-64.
129. Wilkins, M.R., et al., Protein identification and analysis tools in the ExPASy server.
Methods Mol Biol, 1999. 112: p. 531-52.
130. Felsenfeld, G. and M. Groudine, Controlling the double helix. Nature, 2003.
421(6921): p. 448-53.
131. Fry, C.J. and C.L. Peterson, Transcription. Unlocking the gates to gene expression.
Science, 2002. 295(5561): p. 1847-8.
132. Olins, D.E. and A.L. Olins, Chromatin history: our view from the bridge. Nat Rev
Mol Cell Biol, 2003. 4(10): p. 809-14.
133. Bannister, A.J. and T. Kouzarides, Regulation of chromatin by histone modifications.
Cell Res, 2011. 21(3): p. 381-95.
134. Jenuwein, T. and C.D. Allis, Translating the histone code. Science, 2001. 293(5532):
p. 1074-80.
135. Strahl, B.D. and C.D. Allis, The language of covalent histone modifications. Nature,
2000. 403(6765): p. 41-5.
136. Yun, M., et al., Readers of histone modifications. Cell Res. 21(4): p. 564-78.

137
137. Greer, E.L. and Y. Shi, Histone methylation: a dynamic mark in health, disease and
inheritance. Nat Rev Genet. 13(5): p. 343-57.
138. Rea, S., et al., Regulation of chromatin structure by site-specific histone H3
methyltransferases. Nature, 2000. 406(6796): p. 593-9.
139. Lan, F., et al., Recognition of unmethylated histone H3 lysine 4 links BHC80 to
LSD1-mediated gene repression. Nature, 2007. 448(7154): p. 718-22.
140. Bernstein, B.E., et al., Methylation of histone H3 Lys 4 in coding regions of active
genes. Proc Natl Acad Sci U S A, 2002. 99(13): p. 8695-700.
141. Santos-Rosa, H., et al., Active genes are tri-methylated at K4 of histone H3. Nature,
2002. 419(6905): p. 407-11.
142. Meinke, D.W., et al., Arabidopsis thaliana: a model plant for genome analysis.
Science, 1998. 282(5389): p. 662, 679-82.
143. Sasaki, T. and D.M. Gilbert, The many faces of the origin recognition complex. Curr
Opin Cell Biol, 2007. 19(3): p. 337-43.
144. Hou, Z., et al., Structural basis of the Sir1-origin recognition complex interaction in
transcriptional silencing. Proc Natl Acad Sci U S A, 2005. 102(24): p. 8489-94.
145. Aasland, R., T.J. Gibson, and A.F. Stewart, The PHD finger: implications for
chromatin-mediated transcriptional regulation. Trends Biochem Sci, 1995. 20(2): p.
56-9.
146. Bienz, M., The PHD finger, a nuclear protein-interaction domain. Trends Biochem
Sci, 2006. 31(1): p. 35-40.
147. Sanchez, R. and M.M. Zhou, The PHD finger: a versatile epigenome reader. Trends
Biochem Sci. 36(7): p. 364-72.
148. Capili, A.D., et al., Solution structure of the PHD domain from the KAP-1
corepressor: structural determinants for PHD, RING and LIM zinc-binding domains.
EMBO J, 2001. 20(1-2): p. 165-77.
149. Schindler, U., H. Beckmann, and A.R. Cashmore, HAT3.1, a novel Arabidopsis
homeodomain protein containing a conserved cysteine-rich region. Plant J, 1993.
4(1): p. 137-50.
150. Li, H., et al., Molecular basis for site-specific read-out of histone H3K4me3 by the
BPTF PHD finger of NURF. Nature, 2006. 442(7098): p. 91-5.
138
151. Palacios, A., et al., Molecular basis of histone H3K4me3 recognition by ING4. J Biol
Chem, 2008. 283(23): p. 15956-64.
152. Callebaut, I., J.C. Courvalin, and J.P. Mornon, The BAH (bromo-adjacent homology)
domain: a link between DNA methylation, replication and transcriptional regulation.
FEBS Lett, 1999. 446(1): p. 189-93.
153. Zhang, Z., et al., Structure and function of the BAH-containing domain of Orc1p in
epigenetic silencing. EMBO J, 2002. 21(17): p. 4600-11.
154. Corpet, F., Multiple sequence alignment with hierarchical clustering. Nucleic Acids
Res, 1988. 16(22): p. 10881-90.
155. Laskowski, R.A., D.S. Moss, and J.M. Thornton, Main-chain bond lengths and bond
angles in protein structures. J Mol Biol, 1993. 231(4): p. 1049-67.
156. Chakravarty, S., L. Zeng, and M.M. Zhou, Structure and site-specific recognition of
histone H3 by the PHD finger of human autoimmune regulator. Structure, 2009.
17(5): p. 670-9.

139
Appendix A
Abbreviations and Symbols
DNA Deoxyribonucleic acid
RNA Ribonucleic acid
PHD Plant homeo domain
BAH Bromo adjacent homology domain
ORC Origin recognition complex
GMP Guanosine monophosphate
G4 Guanosine quadruplex
Gq Guanosine quadruplex
PQS Potential quadruplex sequences
Bp Base pair
HIV Human immunodeficiency virus
SELEX Systematic evolution of ligands by exponential enrichment
FDA Food and drug administration
AMD Age-related macular degeneration
tRNA Transfer RNA
PEG Polyethylene glycol
PAR Platelet activate receptor
Serpin Serine protease inhibitor
HCII Heparin cofactor II
140
PNI Protease nexin I
MW Molecular weight
GAG Glycosaminoglycans
ATIII Antithrombin III
TBA Thrombin binding aptamer
LWMH Low-molecular-weight heparin
-mers Monomers
NMR Nuclear magnetic resonance
Tris Tris(hydroxymethyl)aminomethane
EDTA Ethylenediaminetetraacetic acid
CD Circular dichroism
pNA Para-nitroaniline
BSA Bovine serum albumin
FRET Förster (Fluorescence) resonance energy transfer
Tm Melting temperature
FAM Carboxyfluorescein
DABCYL 4 - ((4 - (dimethylamino)phenyl)azo)benzoic acid
HPLC High-performance liquid chromatography
UV Ultraviolet
Mol. Elip. Mean residue ellipticity
nt Nucleotides

141
SDS Sodium Dodecyl Sulphate
PAGE PolyAcrylamide Gel Electrophoresis
LB Luria Bertani
IPTG Isopropyl β-D-1-thiogalactopyranoside
DTT Dithiothreitol
Da Dalton
Aa Amino acid
Å Amstrong
UFH Unfractionated heparin
EMSA Electromobility Shift assay
GSH Glutathione
IEC Ion exchange chromatography
FF Fast flow
MWCO Molecular weight cut off
FPLC Fast protein liquid chromatography
NHE Nuclease hypersensitive element
CNBP Cellular nucleic acid-binding protein
RBD RNA binding domain
RRM RNA recognition motif
rRNA Ribosomal ribonucleic acid
mRNA Messanger ribonucleic acid

142
SUMO Small Ubiquitin-like Modifier
cDNA Complementary DNA
PCR Polymerase chain reaction
OD Optical density
PMSF Phenylmethylsulphonyl fluoride
β-ME β-mercaptoethanol
IMAC Immobilized metal affinity chromatography
HEPES 4-(2-hydroxyethyl)-1-piperazineethanesulfonic acid
ITC Isothermal titration calorimetry
Ulp Ubl-specific protease
ADP Adenosine diphosphate
ChiP Chromatin Immunoprecipitation
BHC80 BRAF-HDAC complex
Mcm Mini chromosome maintenance proteins
CDC Cell division cycle
pre-RC Pre-replication complexes
Sir1 Silence information regulator 1
HP1 Heterochromatin protein 1
RING Really Interesting New Gene
PC Polycomb-like protein
AIRE Autoimmune regulator
143
BPFT Bromodomain PHD finger transcription
ING2 Inhibitor of growth family 2
LSD1 Lysine-specific histone demethylase 1
GST Glutatione S-transferase
HER3 Human Epidermal Growth Factor Receptor
HIF Hypoxia-inducible factors
Rb Retinoblastoma protein
BCL-2 B lymphocyte chemoattractant
VEGF Vascular endothelial growth factor
N-Ras Rat sarcoma
RET Rearranged during transfection

144
Amino acid abbreviations
Alanine Ala A
Arginine Arg R
Asparagine Asn N
Aspartic acid Asp D
Cysteine Cys C
Glutamic acid Glu E
Glutamine Gln Q
Glycine Gly G
Histidine His H
Isoleucine Ile I
Leucine Leu L
Lysine Lys K
Methionine Met M
Phenylalanine Phe F
Proline Pro P
Serine Ser S
Threonine Thr T
Tryptophan Trp W
Tyrosine Tyr Y
Valine Val V

145
Appendix B
Protein primary structures and numbering schemes
Human thrombin, A chain (uniProtKB code: P00734) 10 20 30 36
TFGSGEADCG LRPLFEKKSL EDKTERELLE SYIDGR
Human thrombin, B chain (uniProtKB code: P00734)
10 20 30 40 50 60
IVEGSDAEIG MSPWQVMLFR KSPQELLCGA SLISDRWVLT AAHCLLYPPW DKNFTENDLL
70 80 90 100 110 120
VRIGKHSRTR YERNIEKISM LEKIYIHPRY NWRENLDRDI ALMKLKKPVA FSDYIHPVCL
130 140 150 160 170 180
PDRETAASLL QAGYKGRVTG WGNLKETWTA NVGKGQPSVL QVVNLPIVER PVCKDSTRIR
190 200 210 220 230 240
ITDNMFCAGY KPDEGKRGDA CEGDSGGPFV MKSPFNNRWY QMGIVSWGEG CDRDGKYGFY
250 259
THVFRLKKWI QKVIDQFGE

146
Human nucleolin (uniProtKB code: P19338)
10 20 30 40 50 60
MVKLAKAGKN QGDPKKMAPP PKEVEEDSED EEMSEDEEDD SSGEEVVIPQ KKGKKAAATS
70 80 90 100 110 120
AKKVVVSPTK KVAVATPAKK AAVTPGKKAA ATPAKKTVTP AKAVTTPGKK GATPGKALVA
130 140 150 160 170 180
TPGKKGAAIP AKGAKNGKNA KKEDSDEEED DDSEEDEEDD EDEDEDEDEI EPAAMKAAAA
190 200 210 220 230 240
APASEDEDDE DDEDDEDDDD DEEDDSEEEA METTPAKGKK AAKVVPVKAK NVAEDEDEEE
250 260 270 280 290 300
DDEDEDDDDD EDDEDDDDED DEEEEEEEEE EPVKEAPGKR KKEMAKQKAA PEAKKQKVEG
310 320 330 340 350 360
TEPTTAFNLF VGNLNFNKSA PELKTGISDV FAKNDLAVVD VRIGMTRKFG YVDFESAEDL
370 380 390 400 410 420
EKALELTGLK VFGNEIKLEK PKGKDSKKER DARTLLAKNL PYKVTQDELK EVFEDAAEIR
430 440 450 460 470 480
LVSKDGKSKG IAYIEFKTEA DAEKTFEEKQ GTEIDGRSIS LYYTGEKGQN QDYRGGKNST
490 500 510 520 530 540
WSGESKTLVL SNLSYSATEE TLQEVFEKAT FIKVPQNQNG KSKGYAFIEF ASFEDAKEAL
550 560 570 580 590 600
NSCNKREIEG RAIRLELQGP RGSPNARSQP SKTLFVKGLS EDTTEETLKE SFDGSVRARI
610 620 630 640 650 660
VTDRETGSSK GFGFVDFNSE EDAKAAKEAM EDGEIDGNKV TLDWAKPKGE GGFGGRGGGR
670 680 690 700 710
GGFGGRGGGR GGRGGFGGRG RGGFGGRGGF RGGRGGGGDH KPQGKKTKFE

147
Arabidopsis thaliana origin recognition complex 1b (uniProtKB code: Q9SU24)
10 20 30 40 50 60
MASTPRAKTF KSPTKTPSNI YRKSYLSPSS TSHTPQTPET HTPLRRSARH VSRKIDLGND
70 80 90 100 110 120
PIDAPGNDPI EGMNLIRKRE RAPRKPTTDV VPSKSKKTET PKKKKKIDSF TPVSPIRSET
130 140 150 160 170 180
IKKTKKKKRV YYNKVEFDET EFEIGDDVYV KRREDSNSDE EEDPEIEDCQ ICFKSDTNIM
190 200 210 220 230 240
IECDDCLGGF HLKCLKPPLK EVPEGDWICQ FCEVKKSGQS QTLDLPKPPE GKKLARTMRE
250 260 270 280 290 300
KLLSGDLWAA RIDKLWKEVD DGVYWIRARW YMIPEETVSG RQPHNLKREL YLTNDFADIE
310 320 330 340 350 360
MECILRHCSV KCPKEFSKAS NDGDDVFLCE YEYDVHWRSF KRLAELADGD SDSDQEWNGR
370 380 390 400 410 420
KEEEVDDSDE EMELDDEVLK SKRGGLTSAR GGANSRKGRF FGVEKVGMKL IPEHVRCHKQ
430 440 450 460 470 480
SELEKAKATL LLATRPKSLP CRSKEMEEIT SFIKGSISDD QCLGRCMYIH GVPGTGKTIS
490 500 510 520 530 540
VLSVMKNLKA EVEEGSVSPY CFVEINGLKL ASPENIYSVI YEALSGHRVG WKKALQCLNE
550 560 570 580 590 600
RFAEGKRIGK EDEKPCILLI DELDLLVTRN QSVLYNILDW PTKPNSKLVV LGIANTMDLP
610 620 630 640 650 660
EKLLPRISSR MGIQRLCFGP YNHTQLQEII STRLNGIDAF EKTAIEFASR KVAAISGDAR
670 680 690 700 710 720
RALEICRRAA EVADHRLNTN KSAKNQLVIM ADVEAAIQEM FQAPHIQVMK SVSKLSKIFL
730 740 750 760 770 780
TAMVHELYKT GMAETTFDRV ATTVSSICLT NGEAFPGWDI LLKIGCDLGE CRIILCEPGE
790 800 810 813
KHRLQKLQLN FPSDDVAFAL KDNKDLPWLA NYL
The protein primary structures were found in the UniProtKB databases
(http://www.uniprot.org/help/uniprotkb), a widely used hub for the collection of protein
informations. The numbering scheme was assigned by using the ProtParam web-server
tool.(http://web.expasy.org/protparam/)


![Variations on an Original Theme [D.813] - Sheet music...Variations on an Original Theme D.813 26 Title Variations on an Original Theme [D.813] Author Schubert, Franz Peter - Publisher:](https://img.pdfslide.us/doc/110x75/60b91610c277013ea3256b00/variations-on-an-original-theme-d813-sheet-music-variations-on-an-original.jpg)