Embed Size (px)
Citation preview
All contents © 2006-2012 DNA Tribes. DNA Tribes®. DNA Tribes patent pending analysis is available
exclusively from DNA Tribes. All rights reserved.
http://www.dnatribes.com/snp.htmlCustomerSupport:[email protected]
9/4/2012 Page1of32
DNATribes®SNPAdmixtureResultsbyPopulationAugust1,2012
IntroductionThis document lists population admixture results for the 8 continental zones and 24 world regions identified by DNA Tribes® SNP analysis as of August 1, 2012. DNA Tribes® SNP analysis is performed based on proprietary statistical algorithms not available elsewhere. For this reason, DNA Tribes® SNP results can differ from other admixture analyses using similar reference samples. Admixture results listed in this document are average scores for individual members of each population. However, each person’s results will vary based on what genetic material each person has inherited and the genetic variation within each population. These admixture components express the relative geographical relationships between SNP samples in our database. However, these genetic components can cross perceived ethnic and cultural distinctions to express more ancient migrations and patterns of trade and contact between world populations.
Table of ContentsIntroduction ..................................................................................................................................... 1
Admixture Analysis: 8 Continental Zones ...................................................................................... 3
8 Continents Admixture: African Populations (Part 1) ............................................................................. 4
8 Continents Admixture: African Populations (Part 2) ............................................................................. 5
8 Continents Admixture: African Populations (Part 3) ............................................................................. 6
8 Continents Admixture: Middle Eastern and Horn of Africa Populations ............................................... 7
8 Continents Admixture: West Asian Populations .................................................................................... 8
8 Continents Admixture: European Populations (Part 1) ......................................................................... 9
8 Continents Admixture: European Populations (Part 2) ....................................................................... 10
8 Continents Admixture: Native American and Latino Populations ....................................................... 11
8 Continents Admixture: South Asian Populations (Part 1) .................................................................... 12
8 Continents Admixture: South Asian Populations (Part 2) .................................................................... 13
8 Continents Admixture: East Asian Populations.................................................................................... 14
8 Continents Admixture: North Asian Populations ................................................................................. 15
8 Continents Admixture: Southeast Asian Populations .......................................................................... 16
All contents © 2006-2012 DNA Tribes. DNA Tribes®. DNA Tribes patent pending analysis is available
exclusively from DNA Tribes. All rights reserved.
http://www.dnatribes.com/snp.htmlCustomerSupport:[email protected]
9/4/2012 Page2of32
Admixture Analysis: 24 World Regions ....................................................................................... 17
Description of World Regions ................................................................................................................. 18
Neighbor‐Joining Tree of World Regions ................................................................................................ 19
24 World Regions Admixture: African Populations (Part 1) ................................................................... 20
24 World Regions Admixture: African Populations (Part 2) ................................................................... 21
24 World Regions Admixture: African Populations (Part 3) ................................................................... 22
24 World Regions Admixture: Middle Eastern and Horn of Africa Populations ..................................... 23
24 Regions Admixture: West Asian Populations ..................................................................................... 24
24 World Regions Admixture: European Populations (Part 1) ............................................................... 25
24 World Regions Admixture: European Populations (Part 2) ............................................................... 26
24 World Regions Admixture: Native American and Latino Populations ............................................... 27
24 World Regions Admixture: South Asian Populations (Part 1) ............................................................ 28
24 World Regions Admixture: South Asian Populations (Part 2) ............................................................ 29
24 World Regions Admixture: East Asian Populations ........................................................................... 30
24 World Regions Admixture: North Asian Populations ......................................................................... 31
24 World Regions Admixture: Southeast Asian Populations .................................................................. 32

ATmap
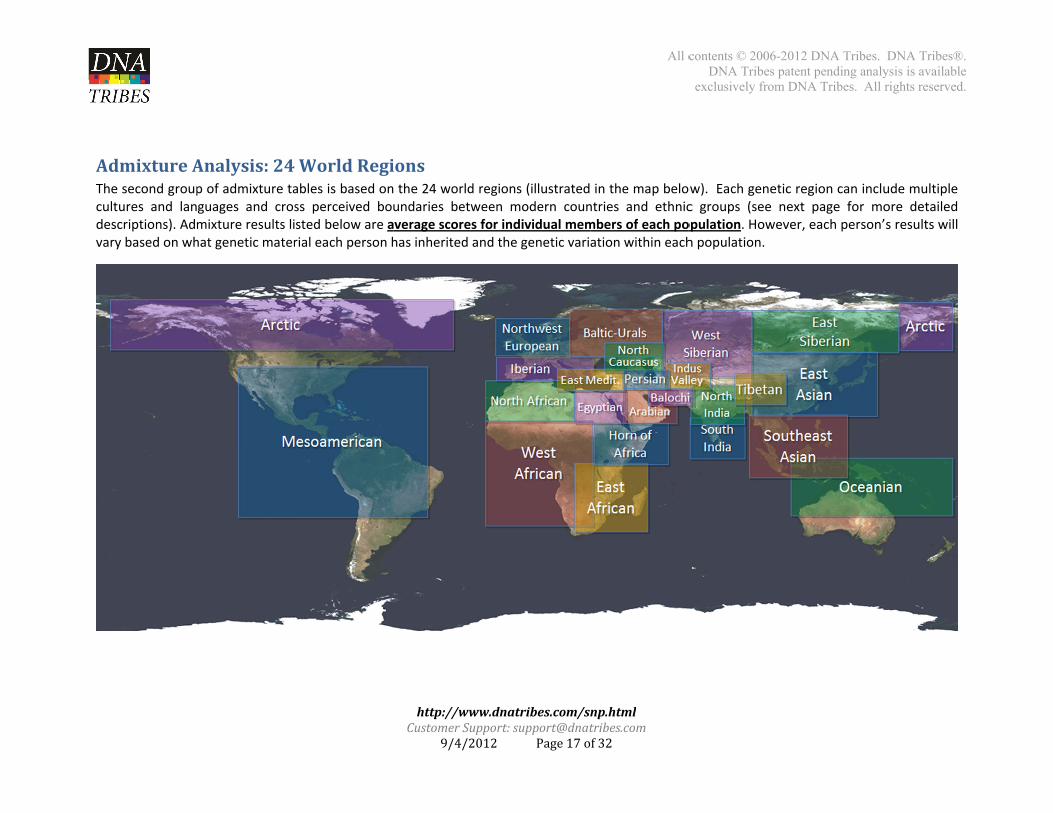
AdmixtureAThe first group omultiple cultures average scores fperson has inheri
Analysis:8Cof admixture taband languages afor individual meited and the gene
ContinentalZbles is based on and cross perceivembers of each etic variation with
http://www.CustomerSuppo
9/4/201
Zonesthe 8 continentaed boundaries bepopulation. Howhin each populat
dnatribes.com/snort:support@dnat12 Page3of
al zones (illustraetween modern nwever, each persion.
All c
np.htmltribes.comf32
ated in the map nations and ethnson’s results will
contents © 2006-2DNA Tribes pa
exclusively from
below). Each cnic groups. Admixl vary based on
012 DNA Tribes. atent pending analyDNA Tribes. All r
ontinental zonexture results listewhat genetic m
DNA Tribes®. ysis is available rights reserved.
can include ed below are aterial each
All contents © 2006-2012 DNA Tribes. DNA Tribes®. DNA Tribes patent pending analysis is available
exclusively from DNA Tribes. All rights reserved.
http://www.dnatribes.com/snp.htmlCustomerSupport:[email protected]
9/4/2012 Page4of32
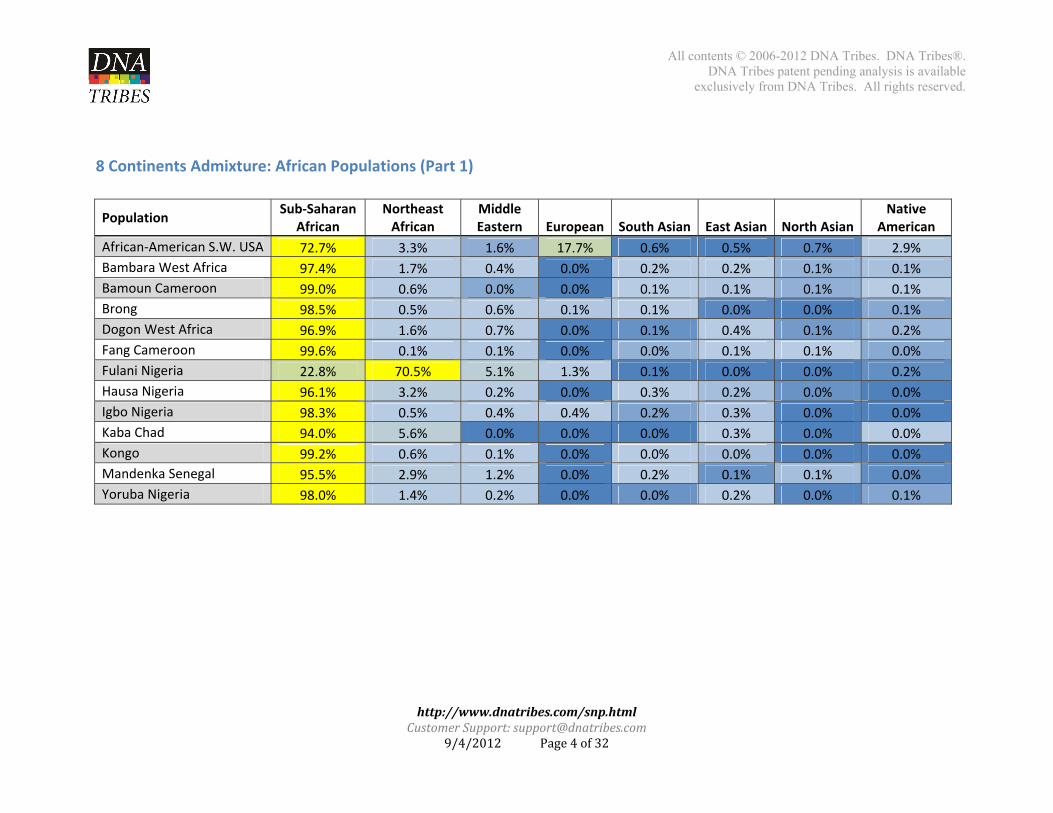
8 Continents Admixture: African Populations (Part 1)
Population Sub‐Saharan
African Northeast African
Middle Eastern European South Asian East Asian North Asian
Native American
African‐American S.W. USA 72.7% 3.3% 1.6% 17.7% 0.6% 0.5% 0.7% 2.9%
Bambara West Africa 97.4% 1.7% 0.4% 0.0% 0.2% 0.2% 0.1% 0.1%
Bamoun Cameroon 99.0% 0.6% 0.0% 0.0% 0.1% 0.1% 0.1% 0.1%
Brong 98.5% 0.5% 0.6% 0.1% 0.1% 0.0% 0.0% 0.1%
Dogon West Africa 96.9% 1.6% 0.7% 0.0% 0.1% 0.4% 0.1% 0.2%
Fang Cameroon 99.6% 0.1% 0.1% 0.0% 0.0% 0.1% 0.1% 0.0%
Fulani Nigeria 22.8% 70.5% 5.1% 1.3% 0.1% 0.0% 0.0% 0.2%
Hausa Nigeria 96.1% 3.2% 0.2% 0.0% 0.3% 0.2% 0.0% 0.0%
Igbo Nigeria 98.3% 0.5% 0.4% 0.4% 0.2% 0.3% 0.0% 0.0%
Kaba Chad 94.0% 5.6% 0.0% 0.0% 0.0% 0.3% 0.0% 0.0%
Kongo 99.2% 0.6% 0.1% 0.0% 0.0% 0.0% 0.0% 0.0%
Mandenka Senegal 95.5% 2.9% 1.2% 0.0% 0.2% 0.1% 0.1% 0.0%
Yoruba Nigeria 98.0% 1.4% 0.2% 0.0% 0.0% 0.2% 0.0% 0.1%
All contents © 2006-2012 DNA Tribes. DNA Tribes®. DNA Tribes patent pending analysis is available
exclusively from DNA Tribes. All rights reserved.
http://www.dnatribes.com/snp.htmlCustomerSupport:[email protected]
9/4/2012 Page5of32
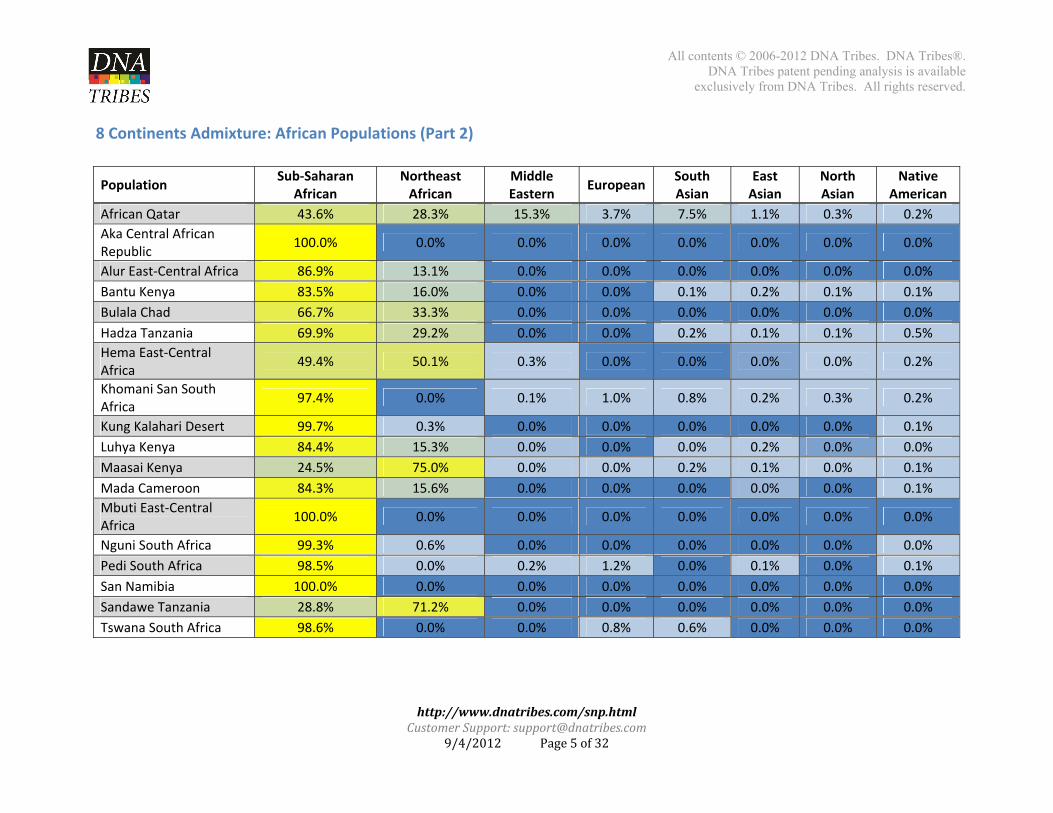
8 Continents Admixture: African Populations (Part 2)
Population Sub‐Saharan
African Northeast African
Middle Eastern
European South Asian
East Asian
North Asian
Native American
African Qatar 43.6% 28.3% 15.3% 3.7% 7.5% 1.1% 0.3% 0.2%
Aka Central African Republic
100.0% 0.0% 0.0% 0.0% 0.0% 0.0% 0.0% 0.0%
Alur East‐Central Africa 86.9% 13.1% 0.0% 0.0% 0.0% 0.0% 0.0% 0.0%
Bantu Kenya 83.5% 16.0% 0.0% 0.0% 0.1% 0.2% 0.1% 0.1%
Bulala Chad 66.7% 33.3% 0.0% 0.0% 0.0% 0.0% 0.0% 0.0%
Hadza Tanzania 69.9% 29.2% 0.0% 0.0% 0.2% 0.1% 0.1% 0.5%
Hema East‐Central Africa
49.4% 50.1% 0.3% 0.0% 0.0% 0.0% 0.0% 0.2%
Khomani San South Africa
97.4% 0.0% 0.1% 1.0% 0.8% 0.2% 0.3% 0.2%
Kung Kalahari Desert 99.7% 0.3% 0.0% 0.0% 0.0% 0.0% 0.0% 0.1%
Luhya Kenya 84.4% 15.3% 0.0% 0.0% 0.0% 0.2% 0.0% 0.0%
Maasai Kenya 24.5% 75.0% 0.0% 0.0% 0.2% 0.1% 0.0% 0.1%
Mada Cameroon 84.3% 15.6% 0.0% 0.0% 0.0% 0.0% 0.0% 0.1%
Mbuti East‐Central Africa
100.0% 0.0% 0.0% 0.0% 0.0% 0.0% 0.0% 0.0%
Nguni South Africa 99.3% 0.6% 0.0% 0.0% 0.0% 0.0% 0.0% 0.0%
Pedi South Africa 98.5% 0.0% 0.2% 1.2% 0.0% 0.1% 0.0% 0.1%
San Namibia 100.0% 0.0% 0.0% 0.0% 0.0% 0.0% 0.0% 0.0%
Sandawe Tanzania 28.8% 71.2% 0.0% 0.0% 0.0% 0.0% 0.0% 0.0%
Tswana South Africa 98.6% 0.0% 0.0% 0.8% 0.6% 0.0% 0.0% 0.0%
All contents © 2006-2012 DNA Tribes. DNA Tribes®. DNA Tribes patent pending analysis is available
exclusively from DNA Tribes. All rights reserved.
http://www.dnatribes.com/snp.htmlCustomerSupport:[email protected]
9/4/2012 Page6of32
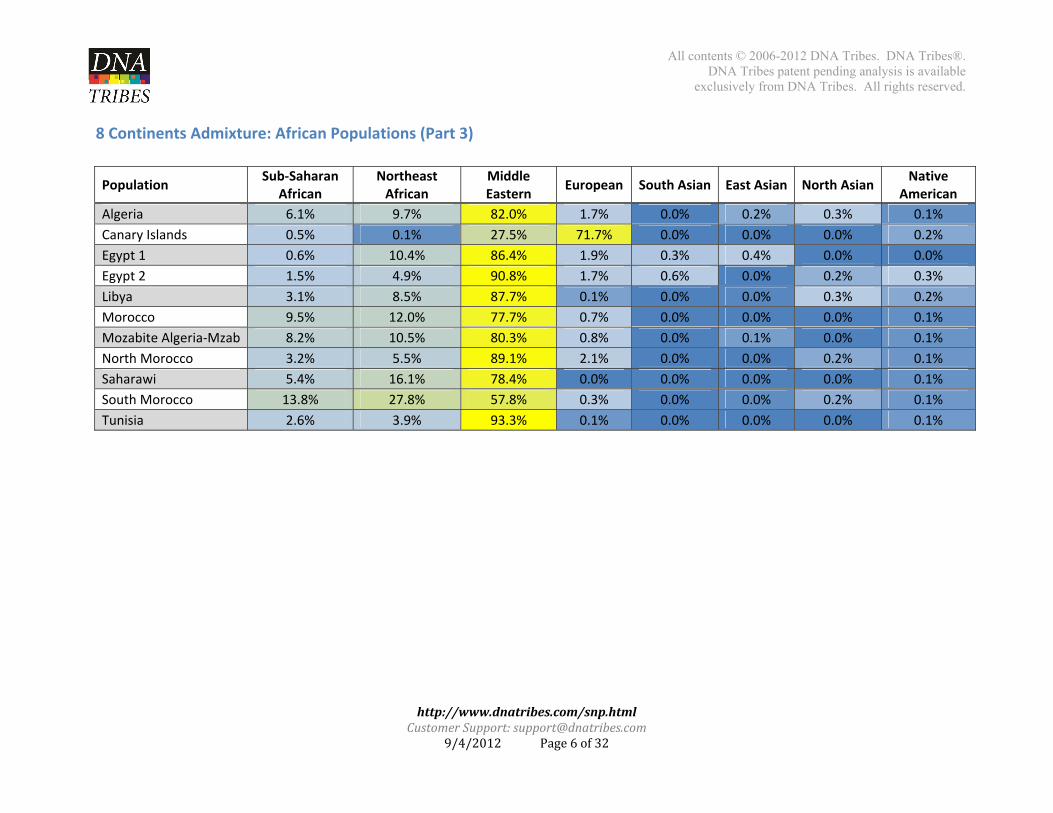
8 Continents Admixture: African Populations (Part 3)
Population Sub‐Saharan
African Northeast African
Middle Eastern
European South Asian East Asian North AsianNative
American
Algeria 6.1% 9.7% 82.0% 1.7% 0.0% 0.2% 0.3% 0.1%
Canary Islands 0.5% 0.1% 27.5% 71.7% 0.0% 0.0% 0.0% 0.2%
Egypt 1 0.6% 10.4% 86.4% 1.9% 0.3% 0.4% 0.0% 0.0%
Egypt 2 1.5% 4.9% 90.8% 1.7% 0.6% 0.0% 0.2% 0.3%
Libya 3.1% 8.5% 87.7% 0.1% 0.0% 0.0% 0.3% 0.2%
Morocco 9.5% 12.0% 77.7% 0.7% 0.0% 0.0% 0.0% 0.1%
Mozabite Algeria‐Mzab 8.2% 10.5% 80.3% 0.8% 0.0% 0.1% 0.0% 0.1%
North Morocco 3.2% 5.5% 89.1% 2.1% 0.0% 0.0% 0.2% 0.1%
Saharawi 5.4% 16.1% 78.4% 0.0% 0.0% 0.0% 0.0% 0.1%
South Morocco 13.8% 27.8% 57.8% 0.3% 0.0% 0.0% 0.2% 0.1%
Tunisia 2.6% 3.9% 93.3% 0.1% 0.0% 0.0% 0.0% 0.1%
All contents © 2006-2012 DNA Tribes. DNA Tribes®. DNA Tribes patent pending analysis is available
exclusively from DNA Tribes. All rights reserved.
http://www.dnatribes.com/snp.htmlCustomerSupport:[email protected]
9/4/2012 Page7of32
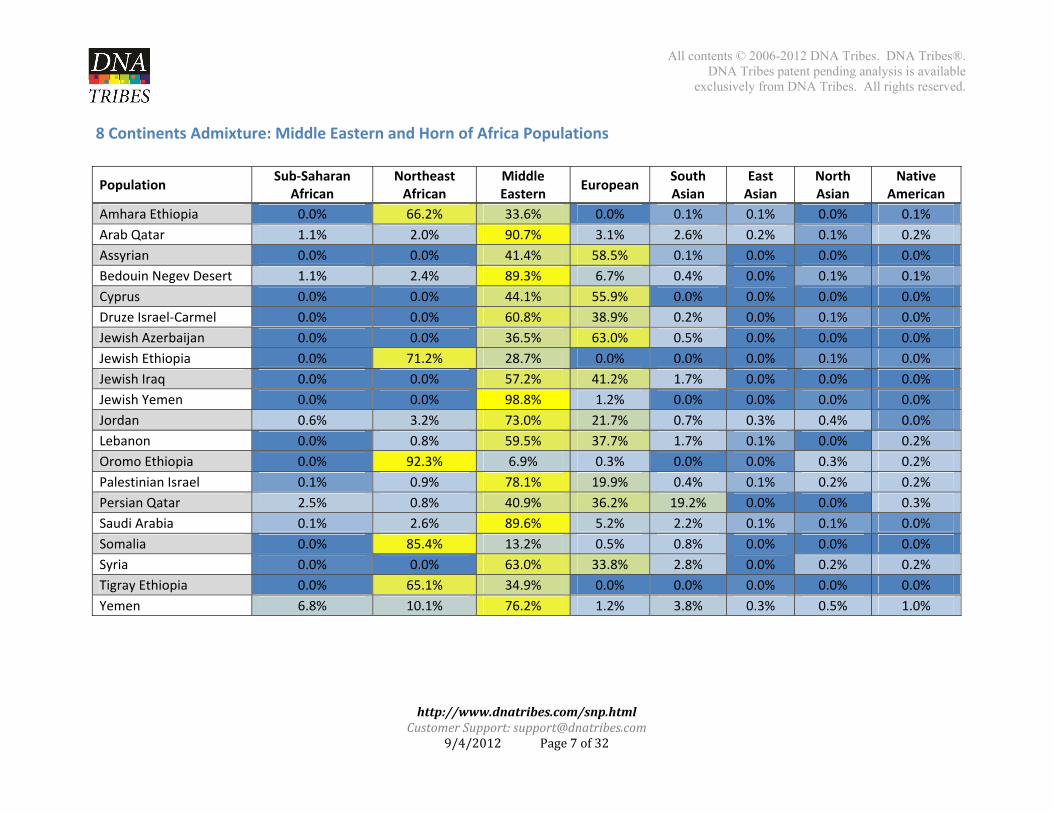
8 Continents Admixture: Middle Eastern and Horn of Africa Populations
Population Sub‐Saharan
African Northeast African
Middle Eastern
European South Asian
East Asian
North Asian
Native American
Amhara Ethiopia 0.0% 66.2% 33.6% 0.0% 0.1% 0.1% 0.0% 0.1%
Arab Qatar 1.1% 2.0% 90.7% 3.1% 2.6% 0.2% 0.1% 0.2%
Assyrian 0.0% 0.0% 41.4% 58.5% 0.1% 0.0% 0.0% 0.0%
Bedouin Negev Desert 1.1% 2.4% 89.3% 6.7% 0.4% 0.0% 0.1% 0.1%
Cyprus 0.0% 0.0% 44.1% 55.9% 0.0% 0.0% 0.0% 0.0%
Druze Israel‐Carmel 0.0% 0.0% 60.8% 38.9% 0.2% 0.0% 0.1% 0.0%
Jewish Azerbaijan 0.0% 0.0% 36.5% 63.0% 0.5% 0.0% 0.0% 0.0%
Jewish Ethiopia 0.0% 71.2% 28.7% 0.0% 0.0% 0.0% 0.1% 0.0%
Jewish Iraq 0.0% 0.0% 57.2% 41.2% 1.7% 0.0% 0.0% 0.0%
Jewish Yemen 0.0% 0.0% 98.8% 1.2% 0.0% 0.0% 0.0% 0.0%
Jordan 0.6% 3.2% 73.0% 21.7% 0.7% 0.3% 0.4% 0.0%
Lebanon 0.0% 0.8% 59.5% 37.7% 1.7% 0.1% 0.0% 0.2%
Oromo Ethiopia 0.0% 92.3% 6.9% 0.3% 0.0% 0.0% 0.3% 0.2%
Palestinian Israel 0.1% 0.9% 78.1% 19.9% 0.4% 0.1% 0.2% 0.2%
Persian Qatar 2.5% 0.8% 40.9% 36.2% 19.2% 0.0% 0.0% 0.3%
Saudi Arabia 0.1% 2.6% 89.6% 5.2% 2.2% 0.1% 0.1% 0.0%
Somalia 0.0% 85.4% 13.2% 0.5% 0.8% 0.0% 0.0% 0.0%
Syria 0.0% 0.0% 63.0% 33.8% 2.8% 0.0% 0.2% 0.2%
Tigray Ethiopia 0.0% 65.1% 34.9% 0.0% 0.0% 0.0% 0.0% 0.0%
Yemen 6.8% 10.1% 76.2% 1.2% 3.8% 0.3% 0.5% 1.0%
All contents © 2006-2012 DNA Tribes. DNA Tribes®. DNA Tribes patent pending analysis is available
exclusively from DNA Tribes. All rights reserved.
http://www.dnatribes.com/snp.htmlCustomerSupport:[email protected]
9/4/2012 Page8of32
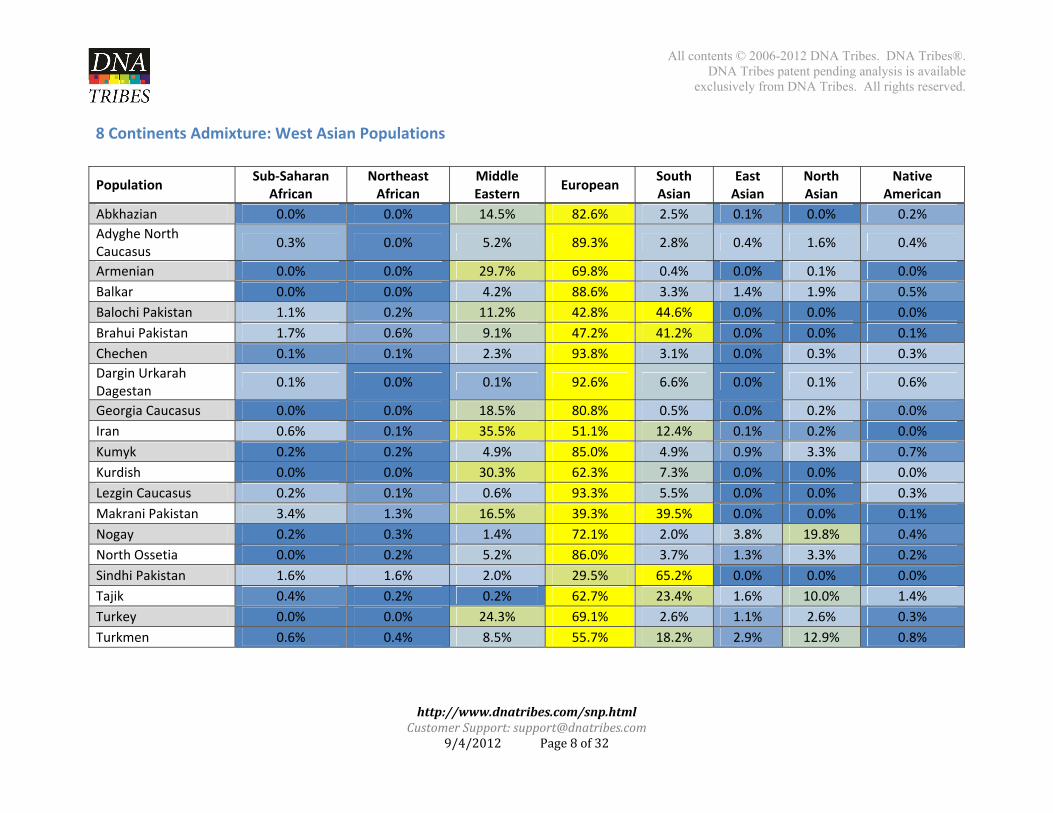
8 Continents Admixture: West Asian Populations
Population Sub‐Saharan
African Northeast African
Middle Eastern
European South Asian
East Asian
North Asian
Native American
Abkhazian 0.0% 0.0% 14.5% 82.6% 2.5% 0.1% 0.0% 0.2%
Adyghe North Caucasus
0.3% 0.0% 5.2% 89.3% 2.8% 0.4% 1.6% 0.4%
Armenian 0.0% 0.0% 29.7% 69.8% 0.4% 0.0% 0.1% 0.0%
Balkar 0.0% 0.0% 4.2% 88.6% 3.3% 1.4% 1.9% 0.5%
Balochi Pakistan 1.1% 0.2% 11.2% 42.8% 44.6% 0.0% 0.0% 0.0%
Brahui Pakistan 1.7% 0.6% 9.1% 47.2% 41.2% 0.0% 0.0% 0.1%
Chechen 0.1% 0.1% 2.3% 93.8% 3.1% 0.0% 0.3% 0.3%
Dargin Urkarah Dagestan
0.1% 0.0% 0.1% 92.6% 6.6% 0.0% 0.1% 0.6%
Georgia Caucasus 0.0% 0.0% 18.5% 80.8% 0.5% 0.0% 0.2% 0.0%
Iran 0.6% 0.1% 35.5% 51.1% 12.4% 0.1% 0.2% 0.0%
Kumyk 0.2% 0.2% 4.9% 85.0% 4.9% 0.9% 3.3% 0.7%
Kurdish 0.0% 0.0% 30.3% 62.3% 7.3% 0.0% 0.0% 0.0%
Lezgin Caucasus 0.2% 0.1% 0.6% 93.3% 5.5% 0.0% 0.0% 0.3%
Makrani Pakistan 3.4% 1.3% 16.5% 39.3% 39.5% 0.0% 0.0% 0.1%
Nogay 0.2% 0.3% 1.4% 72.1% 2.0% 3.8% 19.8% 0.4%
North Ossetia 0.0% 0.2% 5.2% 86.0% 3.7% 1.3% 3.3% 0.2%
Sindhi Pakistan 1.6% 1.6% 2.0% 29.5% 65.2% 0.0% 0.0% 0.0%
Tajik 0.4% 0.2% 0.2% 62.7% 23.4% 1.6% 10.0% 1.4%
Turkey 0.0% 0.0% 24.3% 69.1% 2.6% 1.1% 2.6% 0.3%
Turkmen 0.6% 0.4% 8.5% 55.7% 18.2% 2.9% 12.9% 0.8%
All contents © 2006-2012 DNA Tribes. DNA Tribes®. DNA Tribes patent pending analysis is available
exclusively from DNA Tribes. All rights reserved.
http://www.dnatribes.com/snp.htmlCustomerSupport:[email protected]
9/4/2012 Page9of32
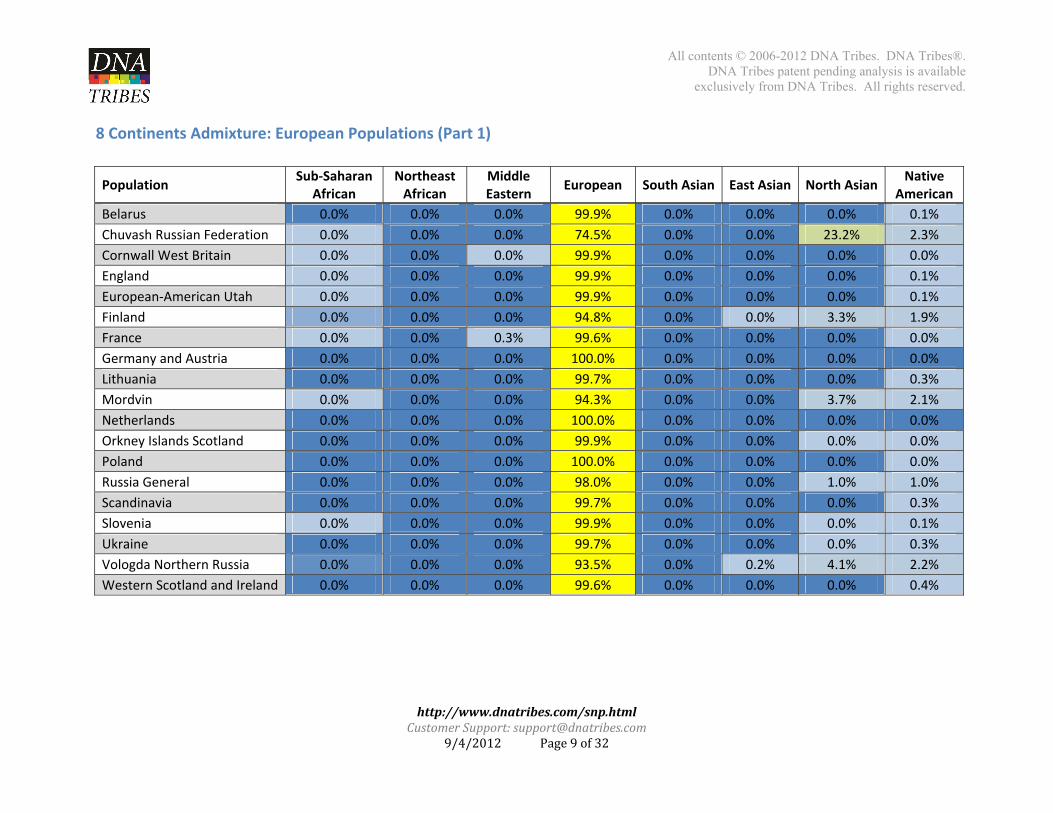
8 Continents Admixture: European Populations (Part 1)
Population Sub‐Saharan
African Northeast African
Middle Eastern
European South Asian East Asian North AsianNative
American
Belarus 0.0% 0.0% 0.0% 99.9% 0.0% 0.0% 0.0% 0.1%
Chuvash Russian Federation 0.0% 0.0% 0.0% 74.5% 0.0% 0.0% 23.2% 2.3%
Cornwall West Britain 0.0% 0.0% 0.0% 99.9% 0.0% 0.0% 0.0% 0.0%
England 0.0% 0.0% 0.0% 99.9% 0.0% 0.0% 0.0% 0.1%
European‐American Utah 0.0% 0.0% 0.0% 99.9% 0.0% 0.0% 0.0% 0.1%
Finland 0.0% 0.0% 0.0% 94.8% 0.0% 0.0% 3.3% 1.9%
France 0.0% 0.0% 0.3% 99.6% 0.0% 0.0% 0.0% 0.0%
Germany and Austria 0.0% 0.0% 0.0% 100.0% 0.0% 0.0% 0.0% 0.0%
Lithuania 0.0% 0.0% 0.0% 99.7% 0.0% 0.0% 0.0% 0.3%
Mordvin 0.0% 0.0% 0.0% 94.3% 0.0% 0.0% 3.7% 2.1%
Netherlands 0.0% 0.0% 0.0% 100.0% 0.0% 0.0% 0.0% 0.0%
Orkney Islands Scotland 0.0% 0.0% 0.0% 99.9% 0.0% 0.0% 0.0% 0.0%
Poland 0.0% 0.0% 0.0% 100.0% 0.0% 0.0% 0.0% 0.0%
Russia General 0.0% 0.0% 0.0% 98.0% 0.0% 0.0% 1.0% 1.0%
Scandinavia 0.0% 0.0% 0.0% 99.7% 0.0% 0.0% 0.0% 0.3%
Slovenia 0.0% 0.0% 0.0% 99.9% 0.0% 0.0% 0.0% 0.1%
Ukraine 0.0% 0.0% 0.0% 99.7% 0.0% 0.0% 0.0% 0.3%
Vologda Northern Russia 0.0% 0.0% 0.0% 93.5% 0.0% 0.2% 4.1% 2.2%
Western Scotland and Ireland 0.0% 0.0% 0.0% 99.6% 0.0% 0.0% 0.0% 0.4%

All contents © 2006-2012 DNA Tribes. DNA Tribes®. DNA Tribes patent pending analysis is available
exclusively from DNA Tribes. All rights reserved.
http://www.dnatribes.com/snp.htmlCustomerSupport:[email protected]
9/4/2012 Page10of32
8 Continents Admixture: European Populations (Part 2)
Population Sub‐Saharan
African Northeast African
Middle Eastern European South Asian East Asian
North Asian
Native American
Andalusia Spain 0.0% 0.0% 9.4% 90.6% 0.0% 0.0% 0.0% 0.0%
Ashkenazi Jewish Europe 0.0% 0.0% 31.2% 68.8% 0.0% 0.0% 0.0% 0.0%
Basque France 0.0% 0.0% 0.2% 99.8% 0.0% 0.0% 0.0% 0.0%
Basque Spain 0.0% 0.0% 0.9% 99.1% 0.0% 0.0% 0.0% 0.0%
Bergamo Italy 0.0% 0.0% 6.3% 93.7% 0.0% 0.0% 0.0% 0.0%
Bulgaria 0.0% 0.0% 2.3% 97.6% 0.0% 0.0% 0.0% 0.0%
Galicia Spain 0.0% 0.1% 6.9% 93.0% 0.0% 0.0% 0.0% 0.0%
Greek (Full Greek Only) 0.0% 0.0% 12.4% 87.6% 0.0% 0.0% 0.0% 0.0%
Hungary 0.0% 0.0% 0.0% 99.8% 0.0% 0.0% 0.0% 0.2%
Italy General 0.0% 0.0% 19.6% 80.4% 0.0% 0.0% 0.0% 0.0%
Jewish Morocco 0.0% 0.0% 51.2% 48.8% 0.0% 0.0% 0.0% 0.0%
Portugal 0.0% 0.8% 9.5% 89.7% 0.0% 0.0% 0.0% 0.0%
Romania 0.0% 0.0% 3.8% 96.1% 0.0% 0.0% 0.0% 0.1%
Sardinia 0.0% 0.0% 25.0% 75.0% 0.0% 0.0% 0.0% 0.0%
Sephardic Jewish Bulgaria 0.0% 0.0% 39.2% 60.8% 0.0% 0.0% 0.0% 0.0%
Sephardic Jewish Turkey 0.0% 0.0% 51.8% 48.2% 0.0% 0.0% 0.0% 0.0%
Southern Italy and Sicily 0.0% 0.0% 29.7% 70.3% 0.0% 0.0% 0.0% 0.0%
Spain 0.1% 0.0% 8.1% 91.8% 0.0% 0.0% 0.0% 0.0%
Tuscany Italy 0.0% 0.0% 15.4% 84.6% 0.0% 0.0% 0.0% 0.0%
All contents © 2006-2012 DNA Tribes. DNA Tribes®. DNA Tribes patent pending analysis is available
exclusively from DNA Tribes. All rights reserved.
http://www.dnatribes.com/snp.htmlCustomerSupport:[email protected]
9/4/2012 Page11of32
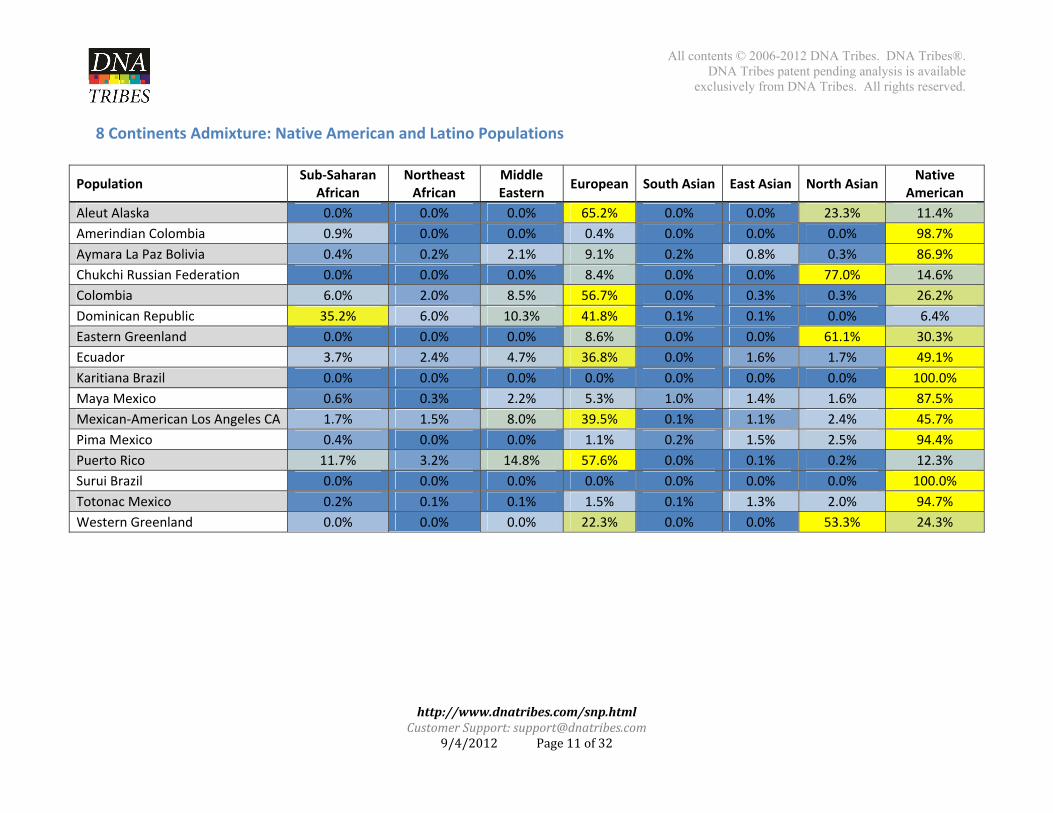
8 Continents Admixture: Native American and Latino Populations
Population Sub‐Saharan
African Northeast African
Middle Eastern
European South Asian East Asian North AsianNative
American
Aleut Alaska 0.0% 0.0% 0.0% 65.2% 0.0% 0.0% 23.3% 11.4%
Amerindian Colombia 0.9% 0.0% 0.0% 0.4% 0.0% 0.0% 0.0% 98.7%
Aymara La Paz Bolivia 0.4% 0.2% 2.1% 9.1% 0.2% 0.8% 0.3% 86.9%
Chukchi Russian Federation 0.0% 0.0% 0.0% 8.4% 0.0% 0.0% 77.0% 14.6%
Colombia 6.0% 2.0% 8.5% 56.7% 0.0% 0.3% 0.3% 26.2%
Dominican Republic 35.2% 6.0% 10.3% 41.8% 0.1% 0.1% 0.0% 6.4%
Eastern Greenland 0.0% 0.0% 0.0% 8.6% 0.0% 0.0% 61.1% 30.3%
Ecuador 3.7% 2.4% 4.7% 36.8% 0.0% 1.6% 1.7% 49.1%
Karitiana Brazil 0.0% 0.0% 0.0% 0.0% 0.0% 0.0% 0.0% 100.0%
Maya Mexico 0.6% 0.3% 2.2% 5.3% 1.0% 1.4% 1.6% 87.5%
Mexican‐American Los Angeles CA 1.7% 1.5% 8.0% 39.5% 0.1% 1.1% 2.4% 45.7%
Pima Mexico 0.4% 0.0% 0.0% 1.1% 0.2% 1.5% 2.5% 94.4%
Puerto Rico 11.7% 3.2% 14.8% 57.6% 0.0% 0.1% 0.2% 12.3%
Surui Brazil 0.0% 0.0% 0.0% 0.0% 0.0% 0.0% 0.0% 100.0%
Totonac Mexico 0.2% 0.1% 0.1% 1.5% 0.1% 1.3% 2.0% 94.7%
Western Greenland 0.0% 0.0% 0.0% 22.3% 0.0% 0.0% 53.3% 24.3%
All contents © 2006-2012 DNA Tribes. DNA Tribes®. DNA Tribes patent pending analysis is available
exclusively from DNA Tribes. All rights reserved.
http://www.dnatribes.com/snp.htmlCustomerSupport:[email protected]
9/4/2012 Page12of32
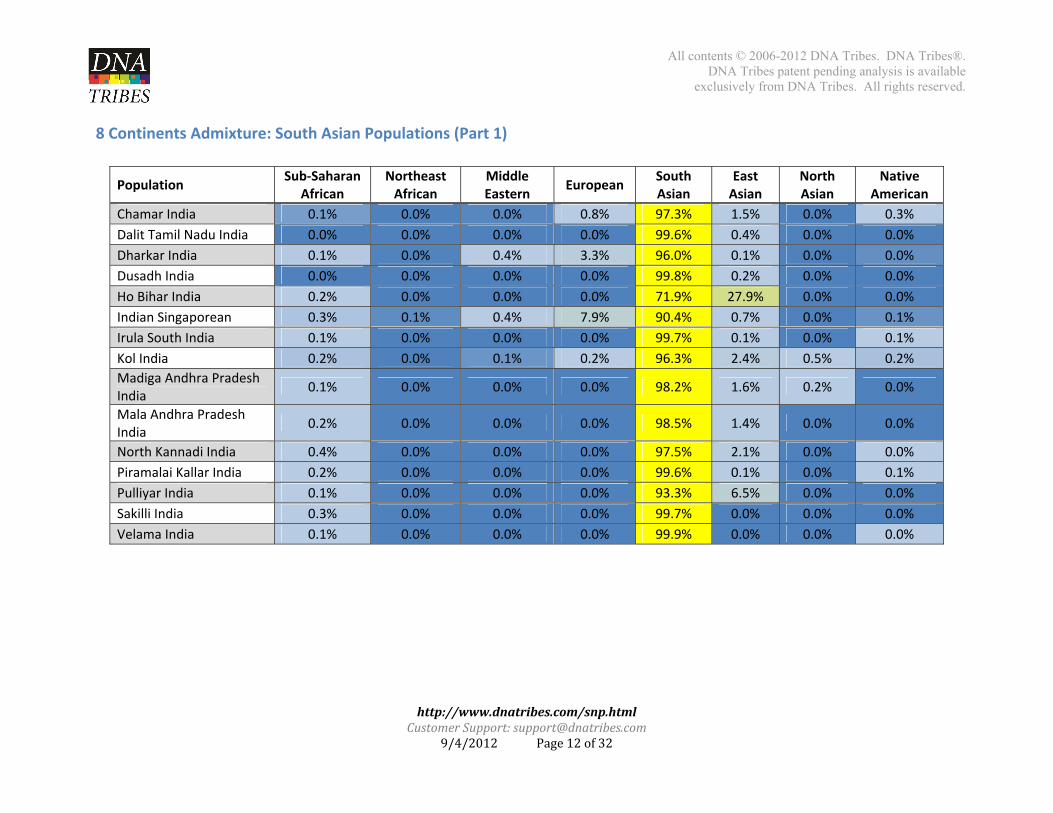
8 Continents Admixture: South Asian Populations (Part 1)
Population Sub‐Saharan
African Northeast African
Middle Eastern
European South Asian
East Asian
North Asian
Native American
Chamar India 0.1% 0.0% 0.0% 0.8% 97.3% 1.5% 0.0% 0.3%
Dalit Tamil Nadu India 0.0% 0.0% 0.0% 0.0% 99.6% 0.4% 0.0% 0.0%
Dharkar India 0.1% 0.0% 0.4% 3.3% 96.0% 0.1% 0.0% 0.0%
Dusadh India 0.0% 0.0% 0.0% 0.0% 99.8% 0.2% 0.0% 0.0%
Ho Bihar India 0.2% 0.0% 0.0% 0.0% 71.9% 27.9% 0.0% 0.0%
Indian Singaporean 0.3% 0.1% 0.4% 7.9% 90.4% 0.7% 0.0% 0.1%
Irula South India 0.1% 0.0% 0.0% 0.0% 99.7% 0.1% 0.0% 0.1%
Kol India 0.2% 0.0% 0.1% 0.2% 96.3% 2.4% 0.5% 0.2%
Madiga Andhra Pradesh India
0.1% 0.0% 0.0% 0.0% 98.2% 1.6% 0.2% 0.0%
Mala Andhra Pradesh India
0.2% 0.0% 0.0% 0.0% 98.5% 1.4% 0.0% 0.0%
North Kannadi India 0.4% 0.0% 0.0% 0.0% 97.5% 2.1% 0.0% 0.0%
Piramalai Kallar India 0.2% 0.0% 0.0% 0.0% 99.6% 0.1% 0.0% 0.1%
Pulliyar India 0.1% 0.0% 0.0% 0.0% 93.3% 6.5% 0.0% 0.0%
Sakilli India 0.3% 0.0% 0.0% 0.0% 99.7% 0.0% 0.0% 0.0%
Velama India 0.1% 0.0% 0.0% 0.0% 99.9% 0.0% 0.0% 0.0%
All contents © 2006-2012 DNA Tribes. DNA Tribes®. DNA Tribes patent pending analysis is available
exclusively from DNA Tribes. All rights reserved.
http://www.dnatribes.com/snp.htmlCustomerSupport:[email protected]
9/4/2012 Page13of32
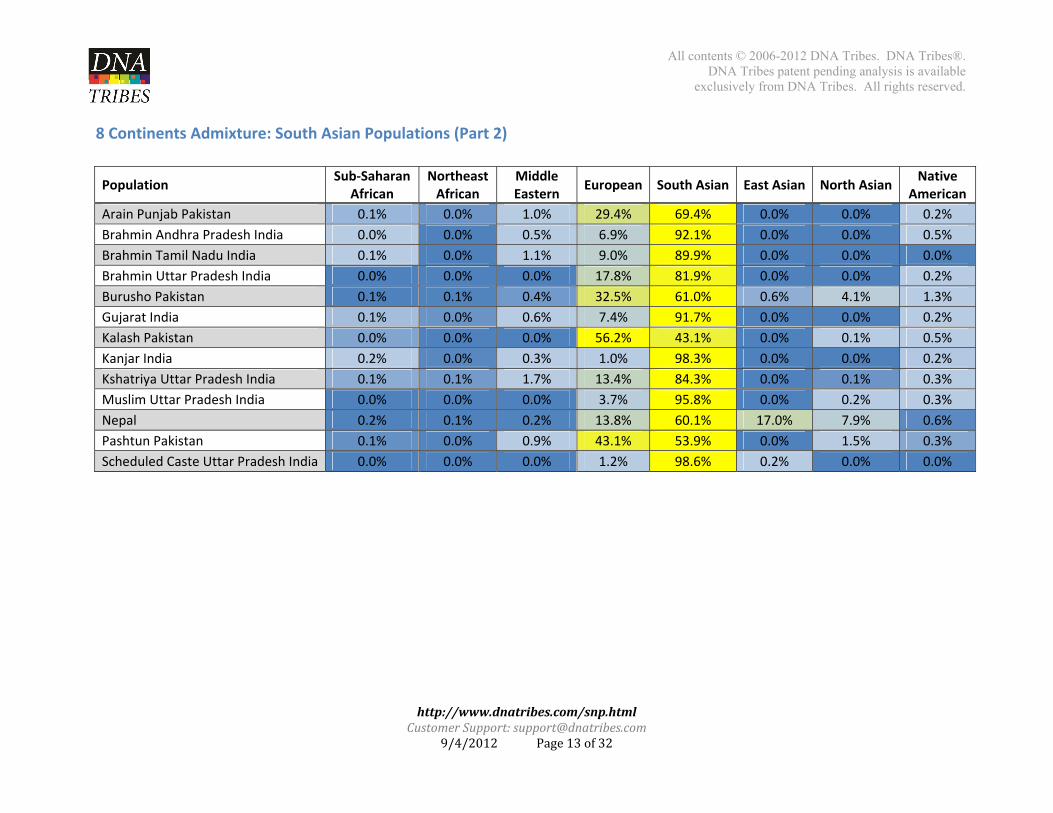
8 Continents Admixture: South Asian Populations (Part 2)
Population Sub‐Saharan
African Northeast African
Middle Eastern
European South Asian East Asian North AsianNative
American
Arain Punjab Pakistan 0.1% 0.0% 1.0% 29.4% 69.4% 0.0% 0.0% 0.2%
Brahmin Andhra Pradesh India 0.0% 0.0% 0.5% 6.9% 92.1% 0.0% 0.0% 0.5%
Brahmin Tamil Nadu India 0.1% 0.0% 1.1% 9.0% 89.9% 0.0% 0.0% 0.0%
Brahmin Uttar Pradesh India 0.0% 0.0% 0.0% 17.8% 81.9% 0.0% 0.0% 0.2%
Burusho Pakistan 0.1% 0.1% 0.4% 32.5% 61.0% 0.6% 4.1% 1.3%
Gujarat India 0.1% 0.0% 0.6% 7.4% 91.7% 0.0% 0.0% 0.2%
Kalash Pakistan 0.0% 0.0% 0.0% 56.2% 43.1% 0.0% 0.1% 0.5%
Kanjar India 0.2% 0.0% 0.3% 1.0% 98.3% 0.0% 0.0% 0.2%
Kshatriya Uttar Pradesh India 0.1% 0.1% 1.7% 13.4% 84.3% 0.0% 0.1% 0.3%
Muslim Uttar Pradesh India 0.0% 0.0% 0.0% 3.7% 95.8% 0.0% 0.2% 0.3%
Nepal 0.2% 0.1% 0.2% 13.8% 60.1% 17.0% 7.9% 0.6%
Pashtun Pakistan 0.1% 0.0% 0.9% 43.1% 53.9% 0.0% 1.5% 0.3%
Scheduled Caste Uttar Pradesh India 0.0% 0.0% 0.0% 1.2% 98.6% 0.2% 0.0% 0.0%
All contents © 2006-2012 DNA Tribes. DNA Tribes®. DNA Tribes patent pending analysis is available
exclusively from DNA Tribes. All rights reserved.
http://www.dnatribes.com/snp.htmlCustomerSupport:[email protected]
9/4/2012 Page14of32
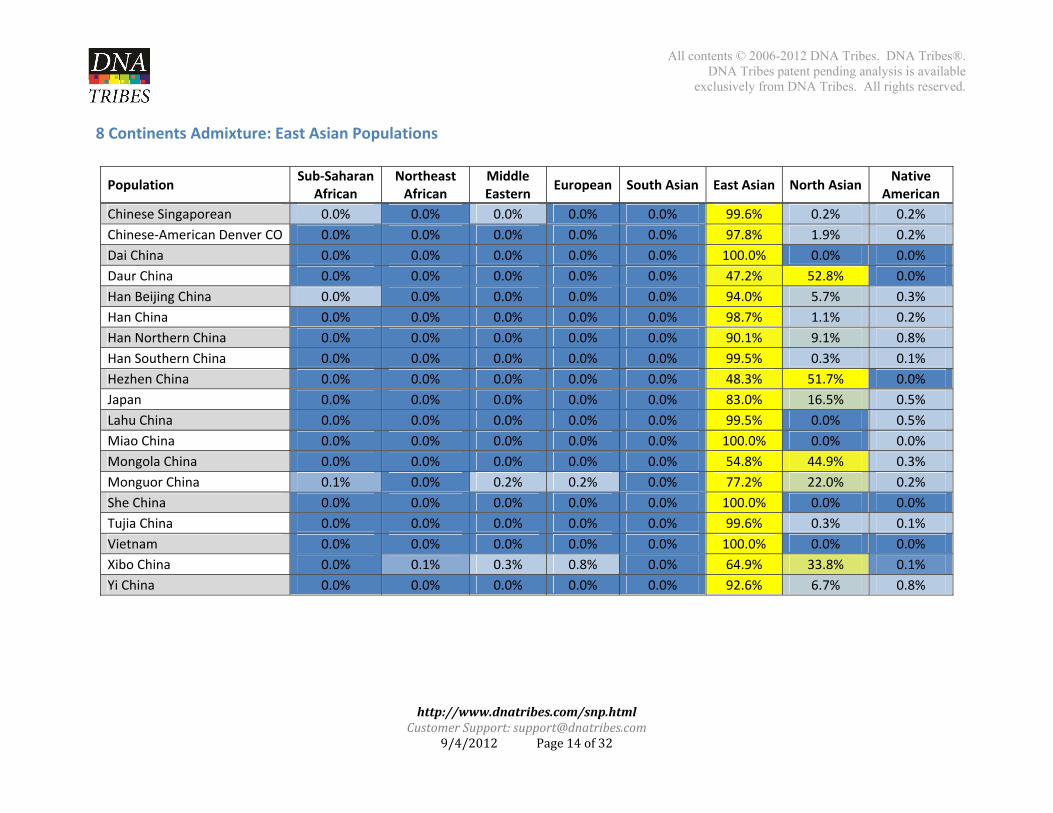
8 Continents Admixture: East Asian Populations
Population Sub‐Saharan
African Northeast African
Middle Eastern
European South Asian East Asian North AsianNative
American
Chinese Singaporean 0.0% 0.0% 0.0% 0.0% 0.0% 99.6% 0.2% 0.2%
Chinese‐American Denver CO 0.0% 0.0% 0.0% 0.0% 0.0% 97.8% 1.9% 0.2%
Dai China 0.0% 0.0% 0.0% 0.0% 0.0% 100.0% 0.0% 0.0%
Daur China 0.0% 0.0% 0.0% 0.0% 0.0% 47.2% 52.8% 0.0%
Han Beijing China 0.0% 0.0% 0.0% 0.0% 0.0% 94.0% 5.7% 0.3%
Han China 0.0% 0.0% 0.0% 0.0% 0.0% 98.7% 1.1% 0.2%
Han Northern China 0.0% 0.0% 0.0% 0.0% 0.0% 90.1% 9.1% 0.8%
Han Southern China 0.0% 0.0% 0.0% 0.0% 0.0% 99.5% 0.3% 0.1%
Hezhen China 0.0% 0.0% 0.0% 0.0% 0.0% 48.3% 51.7% 0.0%
Japan 0.0% 0.0% 0.0% 0.0% 0.0% 83.0% 16.5% 0.5%
Lahu China 0.0% 0.0% 0.0% 0.0% 0.0% 99.5% 0.0% 0.5%
Miao China 0.0% 0.0% 0.0% 0.0% 0.0% 100.0% 0.0% 0.0%
Mongola China 0.0% 0.0% 0.0% 0.0% 0.0% 54.8% 44.9% 0.3%
Monguor China 0.1% 0.0% 0.2% 0.2% 0.0% 77.2% 22.0% 0.2%
She China 0.0% 0.0% 0.0% 0.0% 0.0% 100.0% 0.0% 0.0%
Tujia China 0.0% 0.0% 0.0% 0.0% 0.0% 99.6% 0.3% 0.1%
Vietnam 0.0% 0.0% 0.0% 0.0% 0.0% 100.0% 0.0% 0.0%
Xibo China 0.0% 0.1% 0.3% 0.8% 0.0% 64.9% 33.8% 0.1%
Yi China 0.0% 0.0% 0.0% 0.0% 0.0% 92.6% 6.7% 0.8%
All contents © 2006-2012 DNA Tribes. DNA Tribes®. DNA Tribes patent pending analysis is available
exclusively from DNA Tribes. All rights reserved.
http://www.dnatribes.com/snp.htmlCustomerSupport:[email protected]
9/4/2012 Page15of32
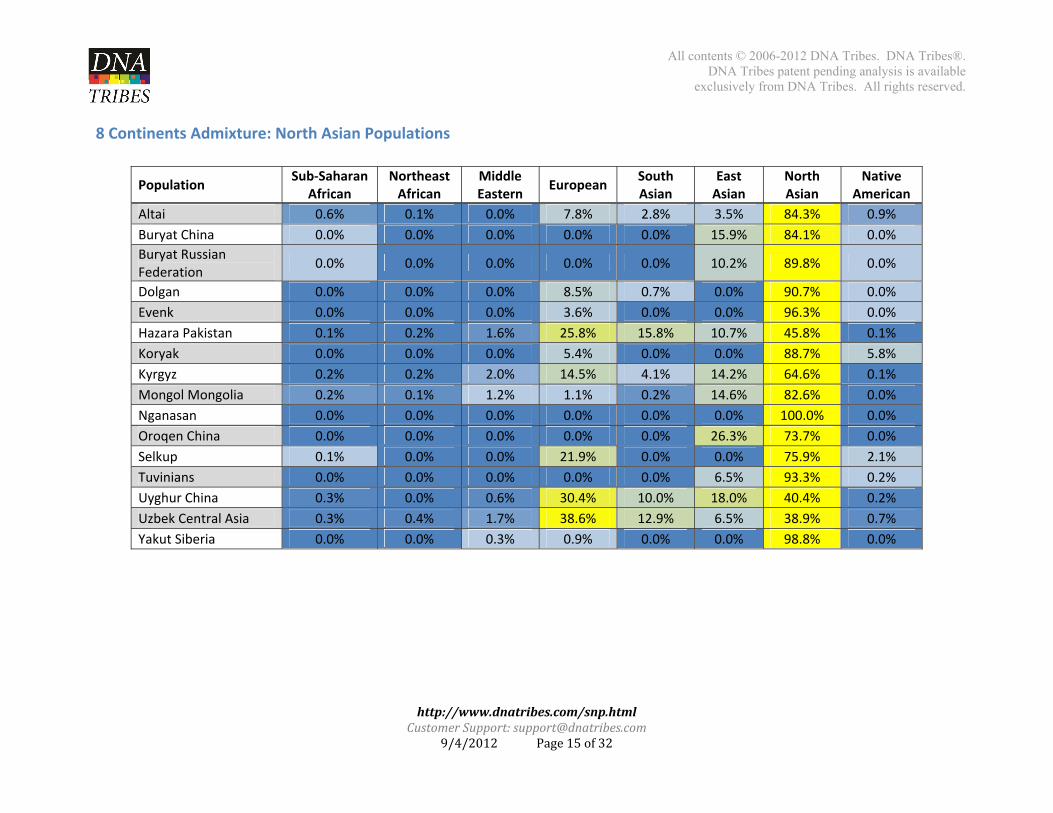
8 Continents Admixture: North Asian Populations
Population Sub‐Saharan
African Northeast African
Middle Eastern
European South Asian
East Asian
North Asian
Native American
Altai 0.6% 0.1% 0.0% 7.8% 2.8% 3.5% 84.3% 0.9%
Buryat China 0.0% 0.0% 0.0% 0.0% 0.0% 15.9% 84.1% 0.0%
Buryat Russian Federation
0.0% 0.0% 0.0% 0.0% 0.0% 10.2% 89.8% 0.0%
Dolgan 0.0% 0.0% 0.0% 8.5% 0.7% 0.0% 90.7% 0.0%
Evenk 0.0% 0.0% 0.0% 3.6% 0.0% 0.0% 96.3% 0.0%
Hazara Pakistan 0.1% 0.2% 1.6% 25.8% 15.8% 10.7% 45.8% 0.1%
Koryak 0.0% 0.0% 0.0% 5.4% 0.0% 0.0% 88.7% 5.8%
Kyrgyz 0.2% 0.2% 2.0% 14.5% 4.1% 14.2% 64.6% 0.1%
Mongol Mongolia 0.2% 0.1% 1.2% 1.1% 0.2% 14.6% 82.6% 0.0%
Nganasan 0.0% 0.0% 0.0% 0.0% 0.0% 0.0% 100.0% 0.0%
Oroqen China 0.0% 0.0% 0.0% 0.0% 0.0% 26.3% 73.7% 0.0%
Selkup 0.1% 0.0% 0.0% 21.9% 0.0% 0.0% 75.9% 2.1%
Tuvinians 0.0% 0.0% 0.0% 0.0% 0.0% 6.5% 93.3% 0.2%
Uyghur China 0.3% 0.0% 0.6% 30.4% 10.0% 18.0% 40.4% 0.2%
Uzbek Central Asia 0.3% 0.4% 1.7% 38.6% 12.9% 6.5% 38.9% 0.7%
Yakut Siberia 0.0% 0.0% 0.3% 0.9% 0.0% 0.0% 98.8% 0.0%
All contents © 2006-2012 DNA Tribes. DNA Tribes®. DNA Tribes patent pending analysis is available
exclusively from DNA Tribes. All rights reserved.
http://www.dnatribes.com/snp.htmlCustomerSupport:[email protected]
9/4/2012 Page16of32
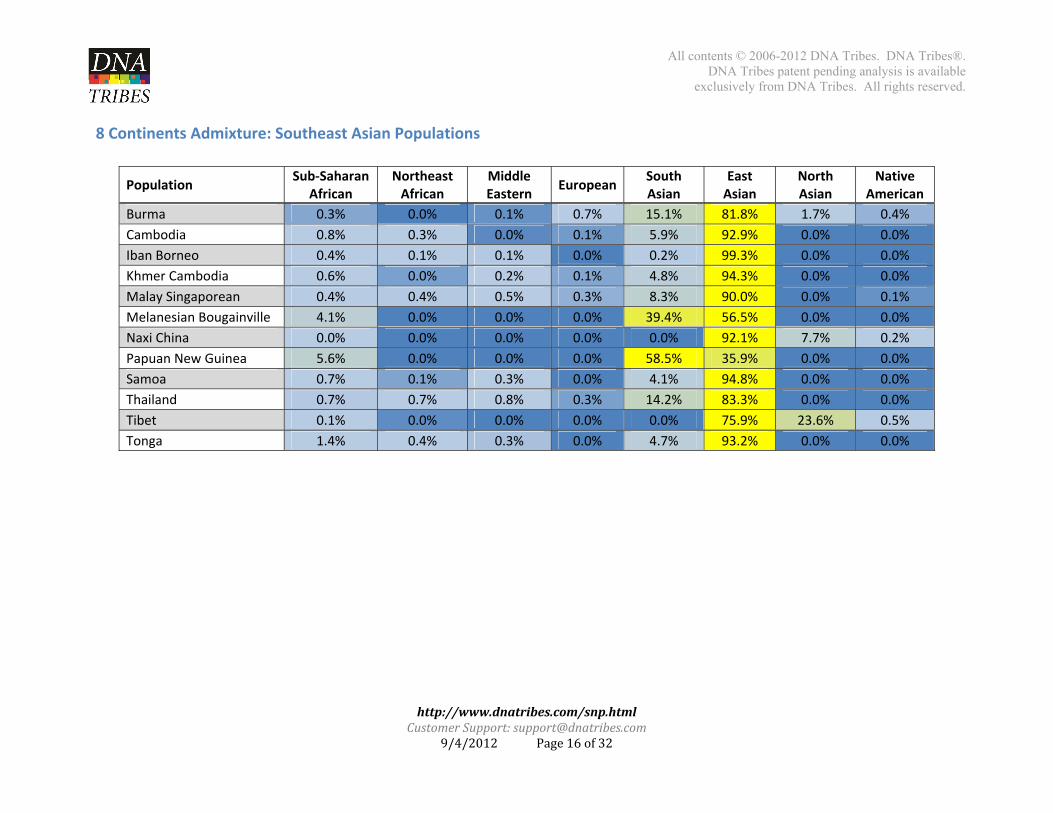
8 Continents Admixture: Southeast Asian Populations
Population Sub‐Saharan
African Northeast African
Middle Eastern
European South Asian
East Asian
North Asian
Native American
Burma 0.3% 0.0% 0.1% 0.7% 15.1% 81.8% 1.7% 0.4%
Cambodia 0.8% 0.3% 0.0% 0.1% 5.9% 92.9% 0.0% 0.0%
Iban Borneo 0.4% 0.1% 0.1% 0.0% 0.2% 99.3% 0.0% 0.0%
Khmer Cambodia 0.6% 0.0% 0.2% 0.1% 4.8% 94.3% 0.0% 0.0%
Malay Singaporean 0.4% 0.4% 0.5% 0.3% 8.3% 90.0% 0.0% 0.1%
Melanesian Bougainville 4.1% 0.0% 0.0% 0.0% 39.4% 56.5% 0.0% 0.0%
Naxi China 0.0% 0.0% 0.0% 0.0% 0.0% 92.1% 7.7% 0.2%
Papuan New Guinea 5.6% 0.0% 0.0% 0.0% 58.5% 35.9% 0.0% 0.0%
Samoa 0.7% 0.1% 0.3% 0.0% 4.1% 94.8% 0.0% 0.0%
Thailand 0.7% 0.7% 0.8% 0.3% 14.2% 83.3% 0.0% 0.0%
Tibet 0.1% 0.0% 0.0% 0.0% 0.0% 75.9% 23.6% 0.5%
Tonga 1.4% 0.4% 0.3% 0.0% 4.7% 93.2% 0.0% 0.0%
ATcdv
AdmixtureAThe second groupcultures and landescriptions). Advary based on wh
Analysis:24p of admixture taguages and crosmixture results lihat genetic mater
WorldRegiables is based onss perceived bousted below are arial each person h
http://www.CustomerSuppo
9/4/2012
ions the 24 world regundaries betweeverage scores fohas inherited and
dnatribes.com/snort:support@dnat2 Page17o
gions (illustrateden modern counor individual memd the genetic vari
All c
np.htmltribes.comf32
in the map belontries and ethnicmbers of each poation within each
contents © 2006-2DNA Tribes pa
exclusively from
ow). Each geneticc groups (see neopulation. Howevh population.
012 DNA Tribes. atent pending analyDNA Tribes. All r
c region can incluext page for mover, each person’
DNA Tribes®. ysis is available rights reserved.
ude multiple ore detailed s results will
All contents © 2006-2012 DNA Tribes. DNA Tribes®. DNA Tribes patent pending analysis is available
exclusively from DNA Tribes. All rights reserved.
http://www.dnatribes.com/snp.htmlCustomerSupport:[email protected]
9/4/2012 Page18of32
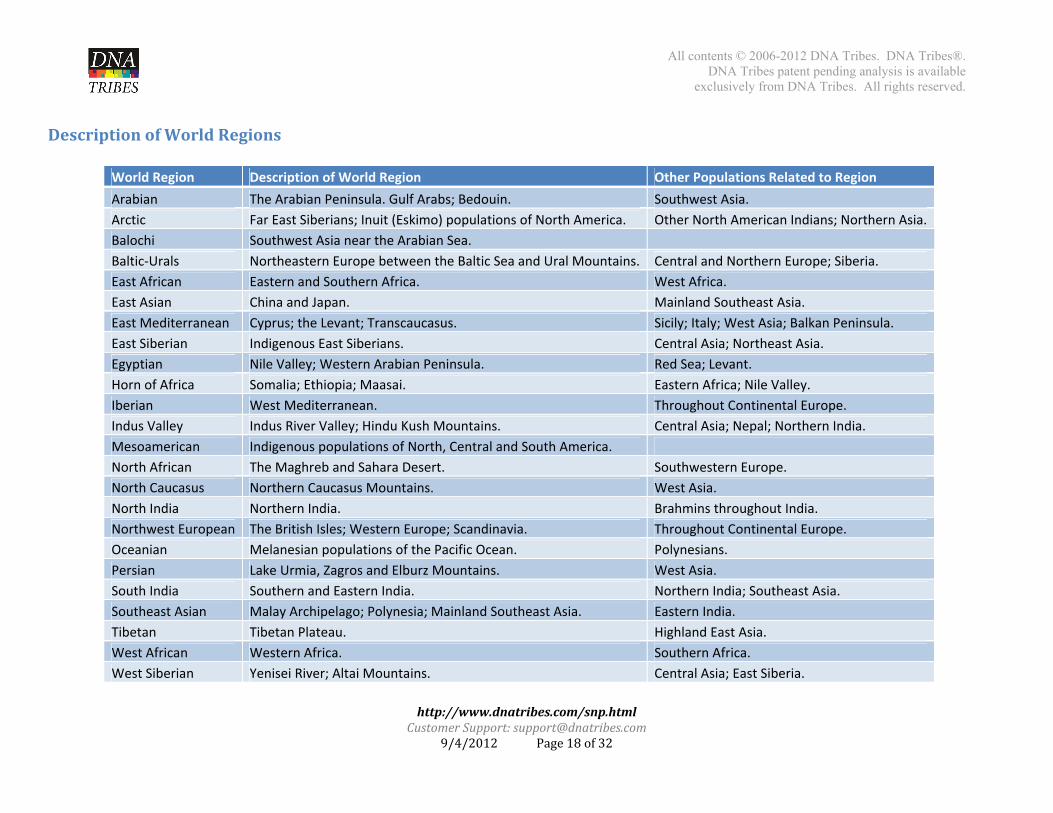
DescriptionofWorldRegions
World Region Description of World Region Other Populations Related to Region
Arabian The Arabian Peninsula. Gulf Arabs; Bedouin. Southwest Asia.
Arctic Far East Siberians; Inuit (Eskimo) populations of North America. Other North American Indians; Northern Asia.
Balochi Southwest Asia near the Arabian Sea.
Baltic‐Urals Northeastern Europe between the Baltic Sea and Ural Mountains. Central and Northern Europe; Siberia.
East African Eastern and Southern Africa. West Africa.
East Asian China and Japan. Mainland Southeast Asia.
East Mediterranean Cyprus; the Levant; Transcaucasus. Sicily; Italy; West Asia; Balkan Peninsula.
East Siberian Indigenous East Siberians. Central Asia; Northeast Asia.
Egyptian Nile Valley; Western Arabian Peninsula. Red Sea; Levant.
Horn of Africa Somalia; Ethiopia; Maasai. Eastern Africa; Nile Valley.
Iberian West Mediterranean. Throughout Continental Europe.
Indus Valley Indus River Valley; Hindu Kush Mountains. Central Asia; Nepal; Northern India.
Mesoamerican Indigenous populations of North, Central and South America.
North African The Maghreb and Sahara Desert. Southwestern Europe.
North Caucasus Northern Caucasus Mountains. West Asia.
North India Northern India. Brahmins throughout India.
Northwest European The British Isles; Western Europe; Scandinavia. Throughout Continental Europe.
Oceanian Melanesian populations of the Pacific Ocean. Polynesians.
Persian Lake Urmia, Zagros and Elburz Mountains. West Asia.
South India Southern and Eastern India. Northern India; Southeast Asia.
Southeast Asian Malay Archipelago; Polynesia; Mainland Southeast Asia. Eastern India.
Tibetan Tibetan Plateau. Highland East Asia.
West African Western Africa. Southern Africa.
West Siberian Yenisei River; Altai Mountains. Central Asia; East Siberia.
All contents © 2006-2012 DNA Tribes. DNA Tribes®. DNA Tribes patent pending analysis is available
exclusively from DNA Tribes. All rights reserved.
http://www.dnatribes.com/snp.htmlCustomerSupport:[email protected]
9/4/2012 Page19of32
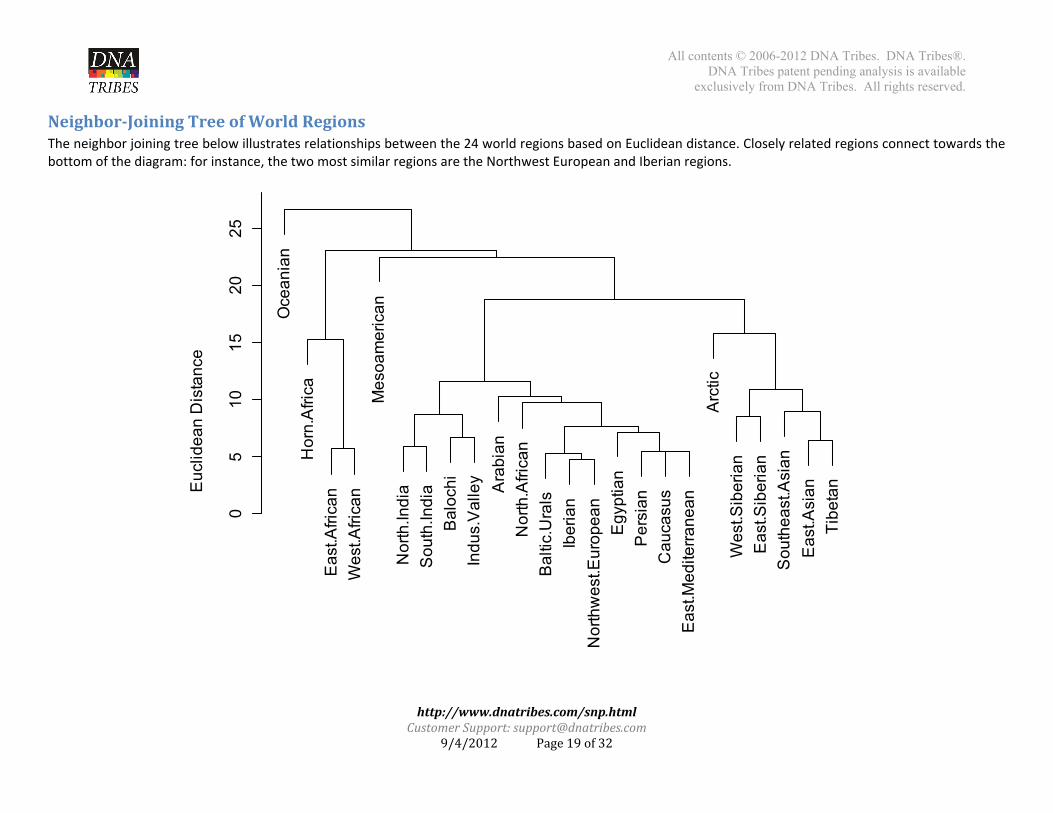
Neighbor‐JoiningTreeofWorldRegionsThe neighbor joining tree below illustrates relationships between the 24 world regions based on Euclidean distance. Closely related regions connect towards the bottom of the diagram: for instance, the two most similar regions are the Northwest European and Iberian regions.
Oce
ania
nH
orn.
Afri
caE
ast.A
frica
nW
est.A
frica
nM
esoa
mer
ican
Nor
th.In
dia
Sou
th.In
dia
Bal
ochi
Indu
s.V
alle
y Ara
bian
Nor
th.A
frica
nB
altic
.Ura
lsIb
eria
nN
orth
wes
t.Eur
opea
nE
gypt
ian
Per
sian
Cau
casu
sE
ast.M
edite
rrane
anA
rctic
Wes
t.Sib
eria
nE
ast.S
iber
ian
Sou
thea
st.A
sian
Eas
t.Asi
anTi
beta
n
05
1015
2025
Euc
lidea
n D
ista
nce

All contents © 2006-2012 DNA Tribes. DNA Tribes®. DNA Tribes patent pending analysis is available
exclusively from DNA Tribes. All rights reserved.
http://www.dnatribes.com/snp.htmlCustomerSupport:[email protected]
9/4/2012 Page20of32
24 World Regions Admixture: African Populations (Part 1)
Population West African
East African North AfricanHorn of Africa
Northwest European
Iberian EgyptianEast
MediterraneanOther
African‐American S.W. USA 66.1% 12.1% 2.3% 0.7% 11.5% 2.2% 0.0% 1.2% 3.9%
Bambara West Africa 86.0% 12.2% 0.4% 0.5% 0.0% 0.0% 0.2% 0.0% 0.7%
Bamoun Cameroon 73.8% 25.4% 0.0% 0.2% 0.0% 0.0% 0.0% 0.0% 0.7%
Brong 87.7% 10.8% 0.3% 0.2% 0.0% 0.0% 0.0% 0.0% 1.0%
Dogon West Africa 87.6% 9.7% 1.1% 0.5% 0.0% 0.0% 0.0% 0.0% 1.1%
Fang Cameroon 68.3% 31.2% 0.0% 0.0% 0.0% 0.0% 0.1% 0.0% 0.4%
Fulani Nigeria 50.5% 9.4% 31.3% 5.2% 0.2% 0.3% 1.3% 0.2% 1.7%
Hausa Nigeria 80.2% 17.7% 0.9% 0.3% 0.0% 0.0% 0.0% 0.0% 0.9%
Igbo Nigeria 83.0% 15.5% 0.1% 0.2% 0.0% 0.1% 0.0% 0.0% 1.1%
Kaba Chad 69.0% 28.7% 0.0% 1.4% 0.0% 0.0% 0.0% 0.0% 0.8%
Kongo 69.5% 30.3% 0.0% 0.0% 0.0% 0.0% 0.0% 0.0% 0.2%
Mandenka Senegal 81.6% 14.6% 2.2% 0.7% 0.0% 0.0% 0.0% 0.0% 1.0%
Yoruba Nigeria 88.5% 10.6% 0.0% 0.2% 0.0% 0.0% 0.1% 0.0% 0.6%
All contents © 2006-2012 DNA Tribes. DNA Tribes®. DNA Tribes patent pending analysis is available
exclusively from DNA Tribes. All rights reserved.
http://www.dnatribes.com/snp.htmlCustomerSupport:[email protected]
9/4/2012 Page21of32
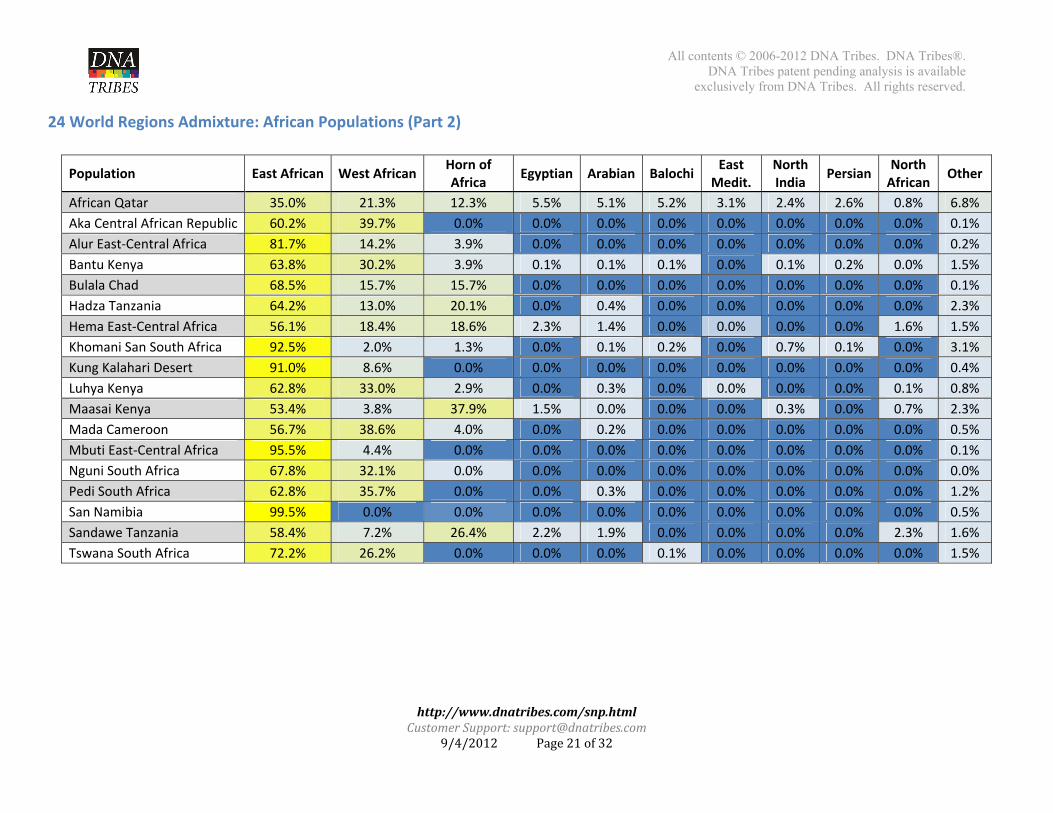
24 World Regions Admixture: African Populations (Part 2)
Population East African West AfricanHorn of Africa
Egyptian Arabian BalochiEast
Medit. North India
PersianNorth African
Other
African Qatar 35.0% 21.3% 12.3% 5.5% 5.1% 5.2% 3.1% 2.4% 2.6% 0.8% 6.8%
Aka Central African Republic 60.2% 39.7% 0.0% 0.0% 0.0% 0.0% 0.0% 0.0% 0.0% 0.0% 0.1%
Alur East‐Central Africa 81.7% 14.2% 3.9% 0.0% 0.0% 0.0% 0.0% 0.0% 0.0% 0.0% 0.2%
Bantu Kenya 63.8% 30.2% 3.9% 0.1% 0.1% 0.1% 0.0% 0.1% 0.2% 0.0% 1.5%
Bulala Chad 68.5% 15.7% 15.7% 0.0% 0.0% 0.0% 0.0% 0.0% 0.0% 0.0% 0.1%
Hadza Tanzania 64.2% 13.0% 20.1% 0.0% 0.4% 0.0% 0.0% 0.0% 0.0% 0.0% 2.3%
Hema East‐Central Africa 56.1% 18.4% 18.6% 2.3% 1.4% 0.0% 0.0% 0.0% 0.0% 1.6% 1.5%
Khomani San South Africa 92.5% 2.0% 1.3% 0.0% 0.1% 0.2% 0.0% 0.7% 0.1% 0.0% 3.1%
Kung Kalahari Desert 91.0% 8.6% 0.0% 0.0% 0.0% 0.0% 0.0% 0.0% 0.0% 0.0% 0.4%
Luhya Kenya 62.8% 33.0% 2.9% 0.0% 0.3% 0.0% 0.0% 0.0% 0.0% 0.1% 0.8%
Maasai Kenya 53.4% 3.8% 37.9% 1.5% 0.0% 0.0% 0.0% 0.3% 0.0% 0.7% 2.3%
Mada Cameroon 56.7% 38.6% 4.0% 0.0% 0.2% 0.0% 0.0% 0.0% 0.0% 0.0% 0.5%
Mbuti East‐Central Africa 95.5% 4.4% 0.0% 0.0% 0.0% 0.0% 0.0% 0.0% 0.0% 0.0% 0.1%
Nguni South Africa 67.8% 32.1% 0.0% 0.0% 0.0% 0.0% 0.0% 0.0% 0.0% 0.0% 0.0%
Pedi South Africa 62.8% 35.7% 0.0% 0.0% 0.3% 0.0% 0.0% 0.0% 0.0% 0.0% 1.2%
San Namibia 99.5% 0.0% 0.0% 0.0% 0.0% 0.0% 0.0% 0.0% 0.0% 0.0% 0.5%
Sandawe Tanzania 58.4% 7.2% 26.4% 2.2% 1.9% 0.0% 0.0% 0.0% 0.0% 2.3% 1.6%
Tswana South Africa 72.2% 26.2% 0.0% 0.0% 0.0% 0.1% 0.0% 0.0% 0.0% 0.0% 1.5%
All contents © 2006-2012 DNA Tribes. DNA Tribes®. DNA Tribes patent pending analysis is available
exclusively from DNA Tribes. All rights reserved.
http://www.dnatribes.com/snp.htmlCustomerSupport:[email protected]
9/4/2012 Page22of32
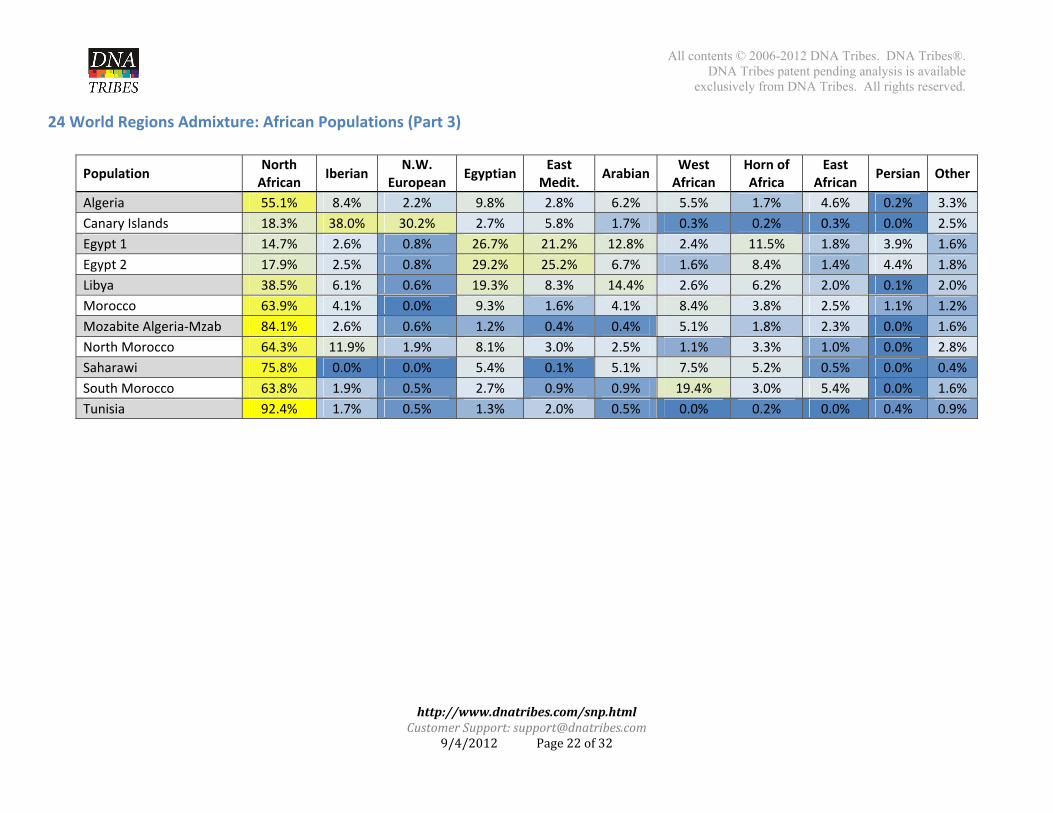
24 World Regions Admixture: African Populations (Part 3)
Population North African
Iberian N.W.
European Egyptian
East Medit.
Arabian West African
Horn of Africa
East African
Persian Other
Algeria 55.1% 8.4% 2.2% 9.8% 2.8% 6.2% 5.5% 1.7% 4.6% 0.2% 3.3%
Canary Islands 18.3% 38.0% 30.2% 2.7% 5.8% 1.7% 0.3% 0.2% 0.3% 0.0% 2.5%
Egypt 1 14.7% 2.6% 0.8% 26.7% 21.2% 12.8% 2.4% 11.5% 1.8% 3.9% 1.6%
Egypt 2 17.9% 2.5% 0.8% 29.2% 25.2% 6.7% 1.6% 8.4% 1.4% 4.4% 1.8%
Libya 38.5% 6.1% 0.6% 19.3% 8.3% 14.4% 2.6% 6.2% 2.0% 0.1% 2.0%
Morocco 63.9% 4.1% 0.0% 9.3% 1.6% 4.1% 8.4% 3.8% 2.5% 1.1% 1.2%
Mozabite Algeria‐Mzab 84.1% 2.6% 0.6% 1.2% 0.4% 0.4% 5.1% 1.8% 2.3% 0.0% 1.6%
North Morocco 64.3% 11.9% 1.9% 8.1% 3.0% 2.5% 1.1% 3.3% 1.0% 0.0% 2.8%
Saharawi 75.8% 0.0% 0.0% 5.4% 0.1% 5.1% 7.5% 5.2% 0.5% 0.0% 0.4%
South Morocco 63.8% 1.9% 0.5% 2.7% 0.9% 0.9% 19.4% 3.0% 5.4% 0.0% 1.6%
Tunisia 92.4% 1.7% 0.5% 1.3% 2.0% 0.5% 0.0% 0.2% 0.0% 0.4% 0.9%

All contents © 2006-2012 DNA Tribes. DNA Tribes®. DNA Tribes patent pending analysis is available
exclusively from DNA Tribes. All rights reserved.
http://www.dnatribes.com/snp.htmlCustomerSupport:[email protected]
9/4/2012 Page23of32
24 World Regions Admixture: Middle Eastern and Horn of Africa Populations
Population Horn of Africa
East African
West African
East Medit.
Arabian Egyptian Persian IberianNorth
Caucasus Balochi
Indus Valley
North African
Other
Amhara Ethiopia 50.4% 14.5% 0.3% 0.4% 8.0% 14.6% 1.3% 0.0% 0.0% 0.0% 0.0% 8.0% 2.5%
Arab Qatar 3.0% 0.5% 0.9% 16.2% 42.0% 23.2% 5.5% 1.3% 0.5% 1.2% 0.4% 3.3% 2.0%
Assyrian 0.0% 0.0% 0.0% 51.0% 3.8% 7.6% 16.8% 2.5% 17.0% 1.2% 0.0% 0.0% 0.0%
Bedouin Negev Desert 3.1% 0.4% 0.7% 17.0% 32.1% 25.5% 6.3% 3.8% 2.6% 1.1% 0.0% 6.7% 0.7%
Cyprus 0.2% 0.0% 0.0% 48.2% 5.2% 5.8% 2.5% 20.1% 11.9% 0.2% 0.0% 3.6% 2.3%
Druze Israel‐Carmel 0.0% 0.0% 0.0% 43.8% 9.7% 10.0% 8.8% 13.6% 6.8% 2.9% 0.6% 2.9% 0.9%
Jewish Azerbaijan 0.0% 0.0% 0.1% 65.4% 2.8% 3.6% 4.7% 0.4% 18.0% 3.7% 0.1% 0.0% 1.3%
Jewish Ethiopia 53.9% 15.5% 1.2% 0.5% 5.5% 15.5% 0.0% 0.4% 0.0% 0.0% 0.0% 6.4% 1.1%
Jewish Iraq 0.0% 0.0% 0.0% 54.1% 7.8% 10.5% 14.3% 2.3% 4.6% 4.5% 0.5% 0.0% 1.2%
Jewish Yemen 2.5% 0.0% 0.0% 28.3% 25.9% 34.3% 3.5% 3.0% 0.0% 0.0% 0.0% 2.2% 0.2%
Jordan 4.0% 2.8% 0.9% 33.6% 10.3% 14.8% 11.8% 4.4% 4.9% 3.1% 0.5% 7.2% 1.7%
Lebanon 2.8% 0.3% 0.0% 35.7% 4.4% 20.2% 10.0% 9.3% 5.0% 3.2% 0.7% 2.7% 5.8%
Oromo Ethiopia 58.2% 27.0% 1.3% 0.0% 2.1% 4.6% 0.2% 0.0% 0.2% 0.0% 0.3% 4.7% 1.4%
Palestinian Israel 4.0% 0.2% 0.1% 30.9% 11.1% 23.2% 9.6% 7.8% 4.7% 2.0% 0.1% 4.8% 1.5%
Persian Qatar 1.9% 2.1% 1.0% 11.2% 5.1% 7.0% 25.6% 2.2% 13.0% 14.9% 9.4% 1.6% 5.1%
Saudi Arabia 1.4% 1.2% 1.1% 16.8% 42.0% 24.5% 3.5% 0.6% 1.6% 2.3% 0.3% 2.4% 2.2%
Somalia 60.8% 22.8% 0.0% 0.3% 3.3% 4.2% 0.0% 0.0% 0.3% 0.1% 0.0% 5.7% 2.6%
Syria 1.5% 0.1% 0.3% 30.7% 9.2% 19.4% 9.7% 7.8% 10.3% 3.3% 0.8% 2.9% 3.9%
Tigray Ethiopia 52.2% 12.4% 0.6% 0.0% 8.0% 16.4% 0.0% 0.0% 0.0% 0.2% 0.0% 9.1% 1.1%
Yemen 6.0% 7.4% 5.3% 8.5% 18.4% 30.1% 7.7% 2.1% 1.5% 2.1% 2.2% 5.4% 3.2%
All contents © 2006-2012 DNA Tribes. DNA Tribes®. DNA Tribes patent pending analysis is available
exclusively from DNA Tribes. All rights reserved.
http://www.dnatribes.com/snp.htmlCustomerSupport:[email protected]
9/4/2012 Page24of32
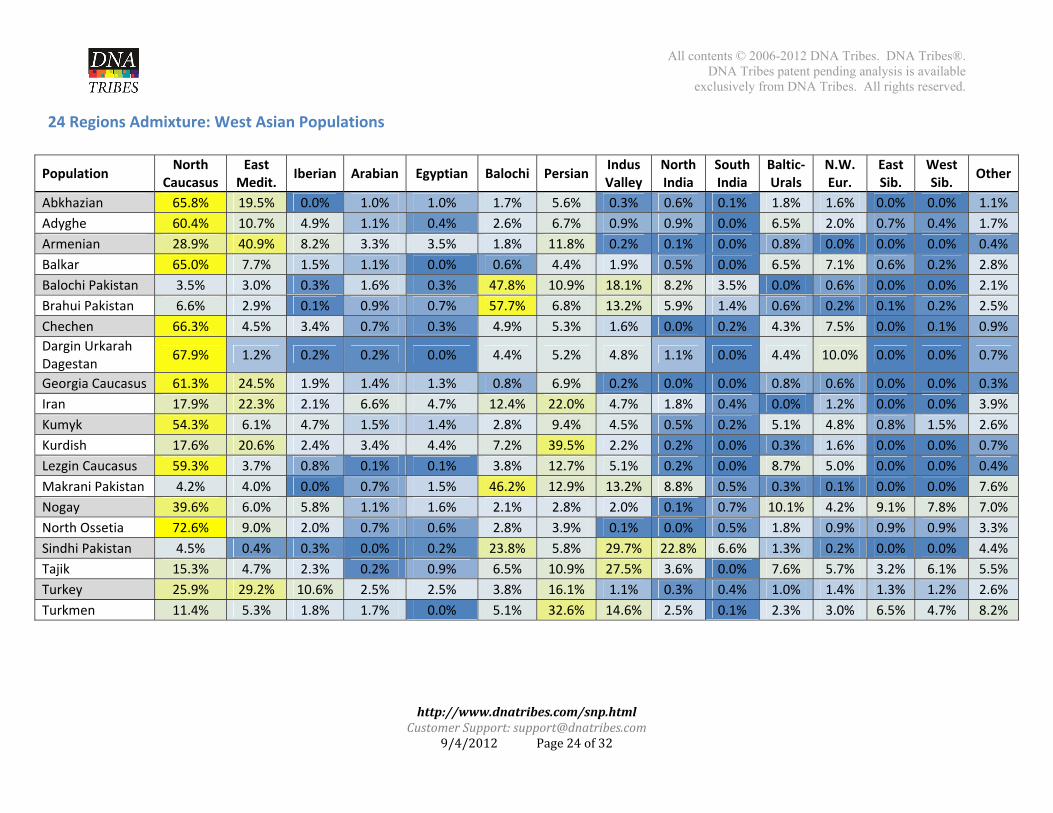
24 Regions Admixture: West Asian Populations
Population North
Caucasus East
Medit. Iberian Arabian Egyptian Balochi Persian
Indus Valley
North India
South India
Baltic‐Urals
N.W. Eur.
East Sib.
West Sib.
Other
Abkhazian 65.8% 19.5% 0.0% 1.0% 1.0% 1.7% 5.6% 0.3% 0.6% 0.1% 1.8% 1.6% 0.0% 0.0% 1.1%
Adyghe 60.4% 10.7% 4.9% 1.1% 0.4% 2.6% 6.7% 0.9% 0.9% 0.0% 6.5% 2.0% 0.7% 0.4% 1.7%
Armenian 28.9% 40.9% 8.2% 3.3% 3.5% 1.8% 11.8% 0.2% 0.1% 0.0% 0.8% 0.0% 0.0% 0.0% 0.4%
Balkar 65.0% 7.7% 1.5% 1.1% 0.0% 0.6% 4.4% 1.9% 0.5% 0.0% 6.5% 7.1% 0.6% 0.2% 2.8%
Balochi Pakistan 3.5% 3.0% 0.3% 1.6% 0.3% 47.8% 10.9% 18.1% 8.2% 3.5% 0.0% 0.6% 0.0% 0.0% 2.1%
Brahui Pakistan 6.6% 2.9% 0.1% 0.9% 0.7% 57.7% 6.8% 13.2% 5.9% 1.4% 0.6% 0.2% 0.1% 0.2% 2.5%
Chechen 66.3% 4.5% 3.4% 0.7% 0.3% 4.9% 5.3% 1.6% 0.0% 0.2% 4.3% 7.5% 0.0% 0.1% 0.9%
Dargin Urkarah Dagestan
67.9% 1.2% 0.2% 0.2% 0.0% 4.4% 5.2% 4.8% 1.1% 0.0% 4.4% 10.0% 0.0% 0.0% 0.7%
Georgia Caucasus 61.3% 24.5% 1.9% 1.4% 1.3% 0.8% 6.9% 0.2% 0.0% 0.0% 0.8% 0.6% 0.0% 0.0% 0.3%
Iran 17.9% 22.3% 2.1% 6.6% 4.7% 12.4% 22.0% 4.7% 1.8% 0.4% 0.0% 1.2% 0.0% 0.0% 3.9%
Kumyk 54.3% 6.1% 4.7% 1.5% 1.4% 2.8% 9.4% 4.5% 0.5% 0.2% 5.1% 4.8% 0.8% 1.5% 2.6%
Kurdish 17.6% 20.6% 2.4% 3.4% 4.4% 7.2% 39.5% 2.2% 0.2% 0.0% 0.3% 1.6% 0.0% 0.0% 0.7%
Lezgin Caucasus 59.3% 3.7% 0.8% 0.1% 0.1% 3.8% 12.7% 5.1% 0.2% 0.0% 8.7% 5.0% 0.0% 0.0% 0.4%
Makrani Pakistan 4.2% 4.0% 0.0% 0.7% 1.5% 46.2% 12.9% 13.2% 8.8% 0.5% 0.3% 0.1% 0.0% 0.0% 7.6%
Nogay 39.6% 6.0% 5.8% 1.1% 1.6% 2.1% 2.8% 2.0% 0.1% 0.7% 10.1% 4.2% 9.1% 7.8% 7.0%
North Ossetia 72.6% 9.0% 2.0% 0.7% 0.6% 2.8% 3.9% 0.1% 0.0% 0.5% 1.8% 0.9% 0.9% 0.9% 3.3%
Sindhi Pakistan 4.5% 0.4% 0.3% 0.0% 0.2% 23.8% 5.8% 29.7% 22.8% 6.6% 1.3% 0.2% 0.0% 0.0% 4.4%
Tajik 15.3% 4.7% 2.3% 0.2% 0.9% 6.5% 10.9% 27.5% 3.6% 0.0% 7.6% 5.7% 3.2% 6.1% 5.5%
Turkey 25.9% 29.2% 10.6% 2.5% 2.5% 3.8% 16.1% 1.1% 0.3% 0.4% 1.0% 1.4% 1.3% 1.2% 2.6%
Turkmen 11.4% 5.3% 1.8% 1.7% 0.0% 5.1% 32.6% 14.6% 2.5% 0.1% 2.3% 3.0% 6.5% 4.7% 8.2%
All contents © 2006-2012 DNA Tribes. DNA Tribes®. DNA Tribes patent pending analysis is available
exclusively from DNA Tribes. All rights reserved.
http://www.dnatribes.com/snp.htmlCustomerSupport:[email protected]
9/4/2012 Page25of32
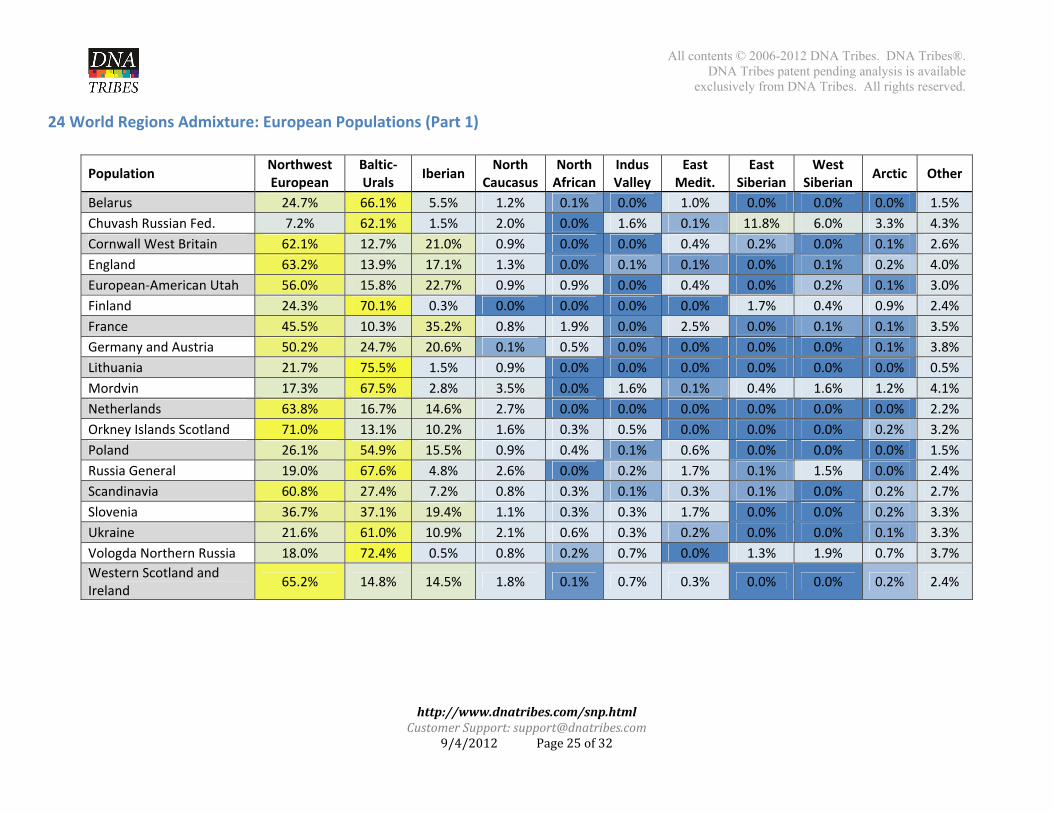
24 World Regions Admixture: European Populations (Part 1)
Population Northwest European
Baltic‐Urals
Iberian North
CaucasusNorth African
Indus Valley
East Medit.
East Siberian
West Siberian
Arctic Other
Belarus 24.7% 66.1% 5.5% 1.2% 0.1% 0.0% 1.0% 0.0% 0.0% 0.0% 1.5%
Chuvash Russian Fed. 7.2% 62.1% 1.5% 2.0% 0.0% 1.6% 0.1% 11.8% 6.0% 3.3% 4.3%
Cornwall West Britain 62.1% 12.7% 21.0% 0.9% 0.0% 0.0% 0.4% 0.2% 0.0% 0.1% 2.6%
England 63.2% 13.9% 17.1% 1.3% 0.0% 0.1% 0.1% 0.0% 0.1% 0.2% 4.0%
European‐American Utah 56.0% 15.8% 22.7% 0.9% 0.9% 0.0% 0.4% 0.0% 0.2% 0.1% 3.0%
Finland 24.3% 70.1% 0.3% 0.0% 0.0% 0.0% 0.0% 1.7% 0.4% 0.9% 2.4%
France 45.5% 10.3% 35.2% 0.8% 1.9% 0.0% 2.5% 0.0% 0.1% 0.1% 3.5%
Germany and Austria 50.2% 24.7% 20.6% 0.1% 0.5% 0.0% 0.0% 0.0% 0.0% 0.1% 3.8%
Lithuania 21.7% 75.5% 1.5% 0.9% 0.0% 0.0% 0.0% 0.0% 0.0% 0.0% 0.5%
Mordvin 17.3% 67.5% 2.8% 3.5% 0.0% 1.6% 0.1% 0.4% 1.6% 1.2% 4.1%
Netherlands 63.8% 16.7% 14.6% 2.7% 0.0% 0.0% 0.0% 0.0% 0.0% 0.0% 2.2%
Orkney Islands Scotland 71.0% 13.1% 10.2% 1.6% 0.3% 0.5% 0.0% 0.0% 0.0% 0.2% 3.2%
Poland 26.1% 54.9% 15.5% 0.9% 0.4% 0.1% 0.6% 0.0% 0.0% 0.0% 1.5%
Russia General 19.0% 67.6% 4.8% 2.6% 0.0% 0.2% 1.7% 0.1% 1.5% 0.0% 2.4%
Scandinavia 60.8% 27.4% 7.2% 0.8% 0.3% 0.1% 0.3% 0.1% 0.0% 0.2% 2.7%
Slovenia 36.7% 37.1% 19.4% 1.1% 0.3% 0.3% 1.7% 0.0% 0.0% 0.2% 3.3%
Ukraine 21.6% 61.0% 10.9% 2.1% 0.6% 0.3% 0.2% 0.0% 0.0% 0.1% 3.3%
Vologda Northern Russia 18.0% 72.4% 0.5% 0.8% 0.2% 0.7% 0.0% 1.3% 1.9% 0.7% 3.7%
Western Scotland and Ireland
65.2% 14.8% 14.5% 1.8% 0.1% 0.7% 0.3% 0.0% 0.0% 0.2% 2.4%

All contents © 2006-2012 DNA Tribes. DNA Tribes®. DNA Tribes patent pending analysis is available
exclusively from DNA Tribes. All rights reserved.
http://www.dnatribes.com/snp.htmlCustomerSupport:[email protected]
9/4/2012 Page26of32
24 World Regions Admixture: European Populations (Part 2)
Population Iberian Northwest European Baltic‐Urals
East Mediterranean Egyptian
North African
North Caucasus Arabian Persian Other
Andalusia Spain 51.5% 28.6% 3.3% 3.4% 2.5% 6.8% 0.1% 1.8% 1.2% 0.9%
Ashkenazi Jewish Europe 24.9% 10.4% 2.7% 36.3% 9.3% 3.6% 5.4% 3.8% 1.8% 1.9%
Basque France 60.5% 31.4% 3.7% 1.7% 0.2% 1.9% 0.0% 0.2% 0.0% 0.5%
Basque Spain 60.0% 33.1% 2.7% 0.5% 0.3% 2.0% 0.0% 0.5% 0.1% 0.9%
Bergamo Italy 49.1% 27.2% 2.7% 11.5% 1.2% 1.6% 2.5% 2.5% 0.5% 1.3%
Bulgaria 32.9% 18.9% 22.8% 13.0% 1.4% 0.9% 6.1% 2.0% 0.8% 1.2%
Galicia Spain 46.1% 34.8% 4.1% 1.8% 0.8% 9.6% 0.0% 0.8% 1.0% 1.0%
Greek (Full Greek Only) 39.8% 5.0% 15.9% 24.2% 0.0% 4.6% 9.5% 0.8% 0.0% 0.2%
Hungary 20.9% 31.6% 35.9% 3.6% 1.3% 0.2% 3.6% 0.6% 0.9% 1.4%
Italy General 41.2% 14.5% 4.9% 22.1% 6.1% 1.4% 2.7% 1.7% 4.7% 0.7%
Jewish Morocco 29.3% 4.6% 1.5% 28.4% 10.3% 12.9% 0.6% 5.2% 6.1% 1.1%
Portugal 43.3% 33.4% 3.9% 3.8% 0.8% 9.7% 1.6% 1.5% 0.0% 1.9%
Romania 33.5% 16.3% 22.1% 14.5% 1.1% 1.0% 7.2% 1.4% 1.2% 1.6%
Sardinia 79.1% 2.1% 0.0% 7.9% 0.5% 8.8% 0.0% 1.6% 0.0% 0.0%
Sephardic Jewish Bulgaria 28.0% 8.9% 1.7% 35.0% 5.3% 5.6% 2.7% 7.0% 4.8% 1.1%
Sephardic Jewish Turkey 30.2% 0.9% 0.3% 35.5% 14.1% 6.0% 5.0% 4.4% 1.4% 2.1%
Southern Italy and Sicily 33.3% 11.1% 0.2% 30.7% 4.8% 5.5% 7.9% 3.6% 2.2% 0.8%
Spain 51.5% 31.4% 3.2% 2.4% 1.0% 6.0% 0.7% 1.2% 1.0% 1.5%
Tuscany Italy 41.7% 22.4% 2.7% 21.9% 2.1% 2.2% 3.1% 1.8% 1.6% 0.6%

All contents © 2006-2012 DNA Tribes. DNA Tribes®. DNA Tribes patent pending analysis is available
exclusively from DNA Tribes. All rights reserved.
http://www.dnatribes.com/snp.htmlCustomerSupport:[email protected]
9/4/2012 Page27of32
24 World Regions Admixture: Native American and Latino Populations
Population Meso‐
american Arctic Iberian
N.W. Eur.
Baltic‐Urals
West African
East African
East Medit.
EgyptianNorth
Caucasus North African
Horn of Africa
East Siber.
Other
Aleut Alaska 7.7% 17.1% 2.3% 17.6% 44.6% 0.0% 0.0% 0.1% 0.0% 0.7% 0.1% 0.0% 2.5% 7.3%
Amerindian Colombia
93.2% 4.4% 0.0% 0.0% 0.0% 0.8% 0.0% 0.0% 0.0% 0.0% 0.3% 0.0% 0.3% 1.0%
Aymara La Paz Bolivia
80.1% 3.5% 4.8% 3.1% 0.7% 0.5% 0.0% 0.5% 0.6% 0.3% 0.9% 0.4% 0.4% 4.0%
Chukchi Russian Fed.
4.6% 71.9% 0.0% 1.9% 7.7% 0.1% 0.0% 0.0% 0.0% 0.2% 0.0% 0.0% 9.9% 3.8%
Colombia 25.6% 0.7% 29.7% 19.3% 4.2% 2.3% 3.0% 4.2% 1.5% 0.9% 4.7% 0.2% 0.1% 3.6%
Dominican Republic
8.3% 0.5% 14.9% 16.0% 4.7% 30.0% 6.7% 2.7% 0.9% 0.7% 8.0% 3.3% 0.1% 3.4%
Eastern Greenland
19.9% 65.9% 0.3% 7.9% 2.7% 0.0% 0.0% 0.0% 0.4% 1.2% 0.0% 0.0% 0.0% 1.7%
Ecuador 48.5% 1.5% 13.8% 10.5% 5.2% 2.9% 0.7% 1.2% 0.9% 1.8% 4.6% 0.8% 1.1% 6.5%
Karitiana Brazil
95.3% 3.9% 0.0% 0.0% 0.0% 0.0% 0.0% 0.0% 0.0% 0.0% 0.0% 0.0% 0.6% 0.3%
Maya Mexico 86.4% 2.1% 2.0% 0.4% 0.3% 0.4% 0.1% 0.0% 0.7% 1.1% 0.7% 0.4% 0.8% 4.7%
Mexican‐American CA
51.6% 2.5% 13.3% 8.5% 3.9% 1.4% 0.7% 2.4% 1.7% 1.1% 4.4% 0.8% 1.4% 6.2%
Pima Mexico 98.0% 0.9% 0.0% 0.4% 0.0% 0.0% 0.1% 0.0% 0.0% 0.0% 0.0% 0.0% 0.0% 0.7%
Puerto Rico 10.6% 0.6% 27.8% 18.6% 3.3% 9.3% 2.3% 5.1% 4.4% 3.3% 7.5% 2.3% 0.0% 4.9%
Surui Brazil 97.0% 2.3% 0.0% 0.0% 0.0% 0.0% 0.0% 0.0% 0.0% 0.0% 0.0% 0.0% 0.2% 0.6%
Totonac Mexico
96.5% 1.6% 0.1% 0.0% 0.1% 0.1% 0.0% 0.0% 0.0% 0.1% 0.1% 0.0% 0.3% 1.0%
Western Greenland
14.8% 53.2% 4.3% 17.5% 3.2% 0.0% 0.1% 0.0% 0.1% 0.5% 0.2% 0.0% 0.3% 5.9%
All contents © 2006-2012 DNA Tribes. DNA Tribes®. DNA Tribes patent pending analysis is available
exclusively from DNA Tribes. All rights reserved.
http://www.dnatribes.com/snp.htmlCustomerSupport:[email protected]
9/4/2012 Page28of32
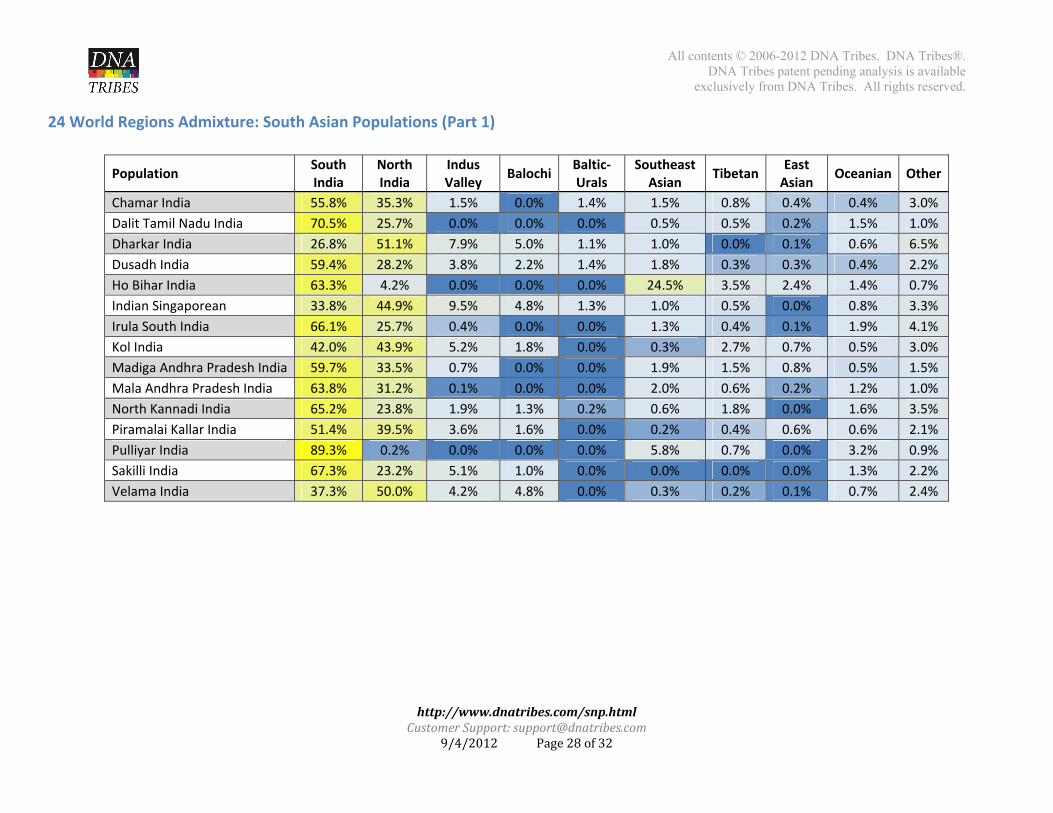
24 World Regions Admixture: South Asian Populations (Part 1)
Population South India
North India
Indus Valley
BalochiBaltic‐Urals
Southeast Asian
TibetanEast Asian
Oceanian Other
Chamar India 55.8% 35.3% 1.5% 0.0% 1.4% 1.5% 0.8% 0.4% 0.4% 3.0%
Dalit Tamil Nadu India 70.5% 25.7% 0.0% 0.0% 0.0% 0.5% 0.5% 0.2% 1.5% 1.0%
Dharkar India 26.8% 51.1% 7.9% 5.0% 1.1% 1.0% 0.0% 0.1% 0.6% 6.5%
Dusadh India 59.4% 28.2% 3.8% 2.2% 1.4% 1.8% 0.3% 0.3% 0.4% 2.2%
Ho Bihar India 63.3% 4.2% 0.0% 0.0% 0.0% 24.5% 3.5% 2.4% 1.4% 0.7%
Indian Singaporean 33.8% 44.9% 9.5% 4.8% 1.3% 1.0% 0.5% 0.0% 0.8% 3.3%
Irula South India 66.1% 25.7% 0.4% 0.0% 0.0% 1.3% 0.4% 0.1% 1.9% 4.1%
Kol India 42.0% 43.9% 5.2% 1.8% 0.0% 0.3% 2.7% 0.7% 0.5% 3.0%
Madiga Andhra Pradesh India 59.7% 33.5% 0.7% 0.0% 0.0% 1.9% 1.5% 0.8% 0.5% 1.5%
Mala Andhra Pradesh India 63.8% 31.2% 0.1% 0.0% 0.0% 2.0% 0.6% 0.2% 1.2% 1.0%
North Kannadi India 65.2% 23.8% 1.9% 1.3% 0.2% 0.6% 1.8% 0.0% 1.6% 3.5%
Piramalai Kallar India 51.4% 39.5% 3.6% 1.6% 0.0% 0.2% 0.4% 0.6% 0.6% 2.1%
Pulliyar India 89.3% 0.2% 0.0% 0.0% 0.0% 5.8% 0.7% 0.0% 3.2% 0.9%
Sakilli India 67.3% 23.2% 5.1% 1.0% 0.0% 0.0% 0.0% 0.0% 1.3% 2.2%
Velama India 37.3% 50.0% 4.2% 4.8% 0.0% 0.3% 0.2% 0.1% 0.7% 2.4%
All contents © 2006-2012 DNA Tribes. DNA Tribes®. DNA Tribes patent pending analysis is available
exclusively from DNA Tribes. All rights reserved.
http://www.dnatribes.com/snp.htmlCustomerSupport:[email protected]
9/4/2012 Page29of32
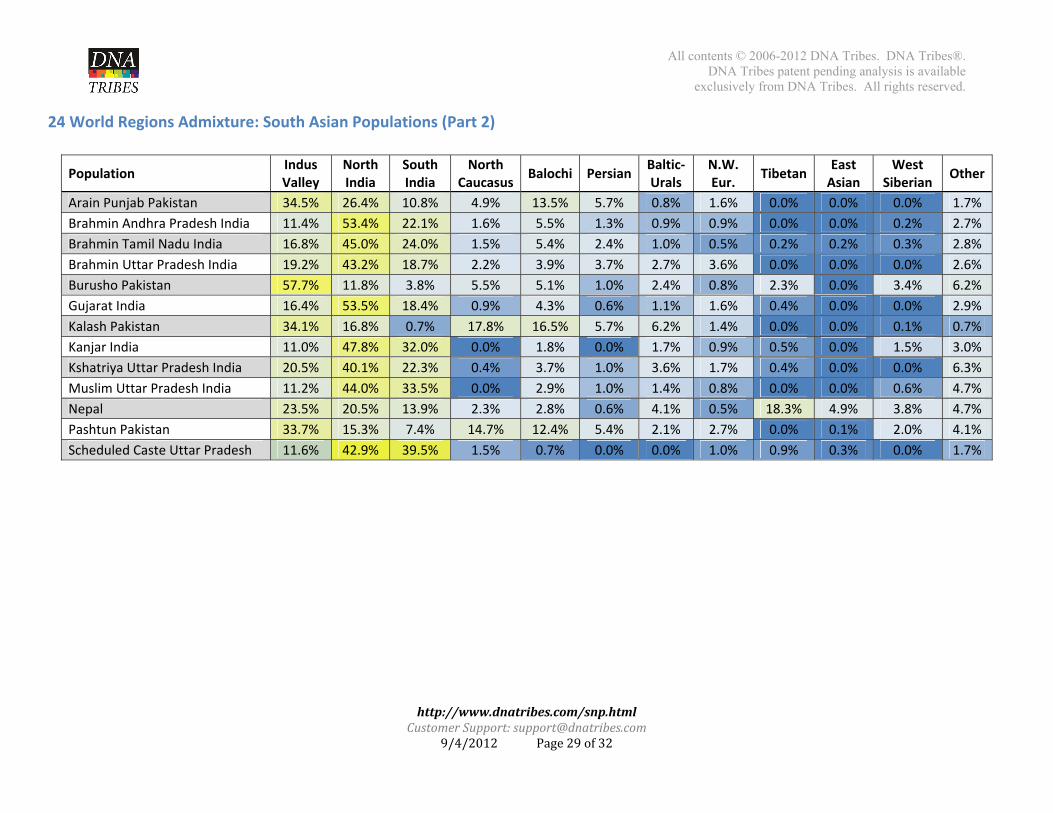
24 World Regions Admixture: South Asian Populations (Part 2)
Population Indus Valley
North India
South India
North Caucasus
Balochi Persian Baltic‐Urals
N.W. Eur.
TibetanEast Asian
West Siberian
Other
Arain Punjab Pakistan 34.5% 26.4% 10.8% 4.9% 13.5% 5.7% 0.8% 1.6% 0.0% 0.0% 0.0% 1.7%
Brahmin Andhra Pradesh India 11.4% 53.4% 22.1% 1.6% 5.5% 1.3% 0.9% 0.9% 0.0% 0.0% 0.2% 2.7%
Brahmin Tamil Nadu India 16.8% 45.0% 24.0% 1.5% 5.4% 2.4% 1.0% 0.5% 0.2% 0.2% 0.3% 2.8%
Brahmin Uttar Pradesh India 19.2% 43.2% 18.7% 2.2% 3.9% 3.7% 2.7% 3.6% 0.0% 0.0% 0.0% 2.6%
Burusho Pakistan 57.7% 11.8% 3.8% 5.5% 5.1% 1.0% 2.4% 0.8% 2.3% 0.0% 3.4% 6.2%
Gujarat India 16.4% 53.5% 18.4% 0.9% 4.3% 0.6% 1.1% 1.6% 0.4% 0.0% 0.0% 2.9%
Kalash Pakistan 34.1% 16.8% 0.7% 17.8% 16.5% 5.7% 6.2% 1.4% 0.0% 0.0% 0.1% 0.7%
Kanjar India 11.0% 47.8% 32.0% 0.0% 1.8% 0.0% 1.7% 0.9% 0.5% 0.0% 1.5% 3.0%
Kshatriya Uttar Pradesh India 20.5% 40.1% 22.3% 0.4% 3.7% 1.0% 3.6% 1.7% 0.4% 0.0% 0.0% 6.3%
Muslim Uttar Pradesh India 11.2% 44.0% 33.5% 0.0% 2.9% 1.0% 1.4% 0.8% 0.0% 0.0% 0.6% 4.7%
Nepal 23.5% 20.5% 13.9% 2.3% 2.8% 0.6% 4.1% 0.5% 18.3% 4.9% 3.8% 4.7%
Pashtun Pakistan 33.7% 15.3% 7.4% 14.7% 12.4% 5.4% 2.1% 2.7% 0.0% 0.1% 2.0% 4.1%
Scheduled Caste Uttar Pradesh 11.6% 42.9% 39.5% 1.5% 0.7% 0.0% 0.0% 1.0% 0.9% 0.3% 0.0% 1.7%
All contents © 2006-2012 DNA Tribes. DNA Tribes®. DNA Tribes patent pending analysis is available
exclusively from DNA Tribes. All rights reserved.
http://www.dnatribes.com/snp.htmlCustomerSupport:[email protected]
9/4/2012 Page30of32
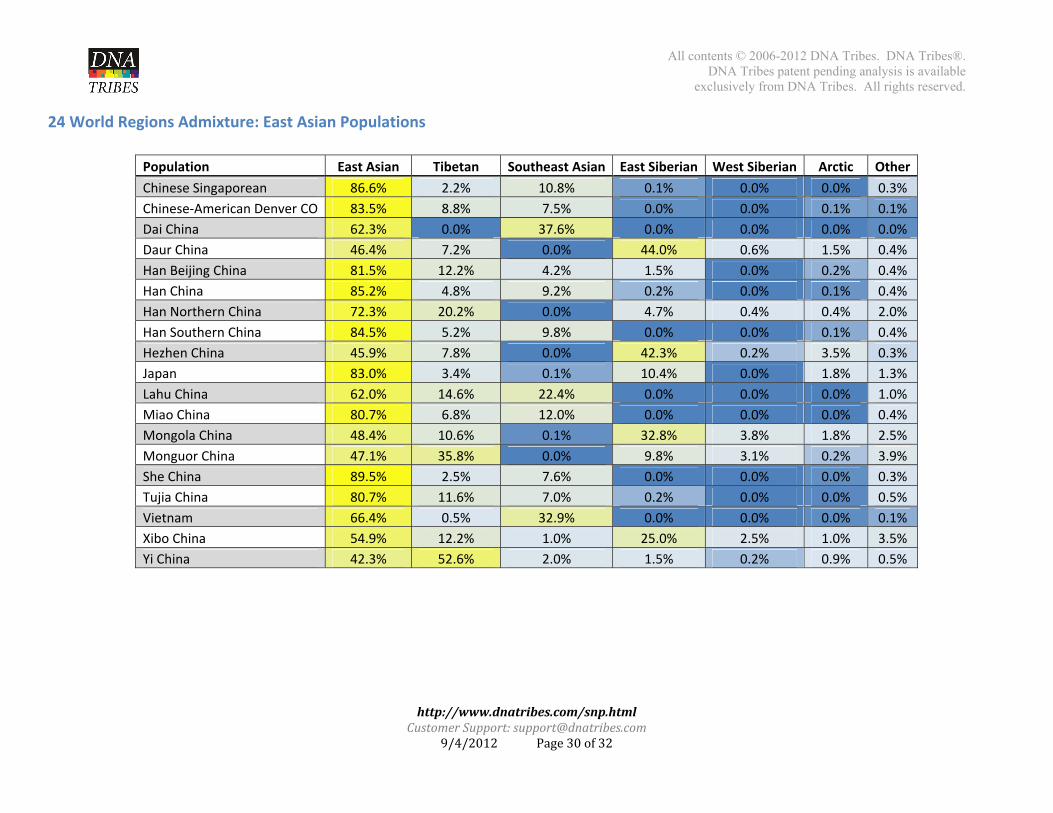
24 World Regions Admixture: East Asian Populations
Population East Asian Tibetan Southeast Asian East Siberian West Siberian Arctic Other
Chinese Singaporean 86.6% 2.2% 10.8% 0.1% 0.0% 0.0% 0.3%
Chinese‐American Denver CO 83.5% 8.8% 7.5% 0.0% 0.0% 0.1% 0.1%
Dai China 62.3% 0.0% 37.6% 0.0% 0.0% 0.0% 0.0%
Daur China 46.4% 7.2% 0.0% 44.0% 0.6% 1.5% 0.4%
Han Beijing China 81.5% 12.2% 4.2% 1.5% 0.0% 0.2% 0.4%
Han China 85.2% 4.8% 9.2% 0.2% 0.0% 0.1% 0.4%
Han Northern China 72.3% 20.2% 0.0% 4.7% 0.4% 0.4% 2.0%
Han Southern China 84.5% 5.2% 9.8% 0.0% 0.0% 0.1% 0.4%
Hezhen China 45.9% 7.8% 0.0% 42.3% 0.2% 3.5% 0.3%
Japan 83.0% 3.4% 0.1% 10.4% 0.0% 1.8% 1.3%
Lahu China 62.0% 14.6% 22.4% 0.0% 0.0% 0.0% 1.0%
Miao China 80.7% 6.8% 12.0% 0.0% 0.0% 0.0% 0.4%
Mongola China 48.4% 10.6% 0.1% 32.8% 3.8% 1.8% 2.5%
Monguor China 47.1% 35.8% 0.0% 9.8% 3.1% 0.2% 3.9%
She China 89.5% 2.5% 7.6% 0.0% 0.0% 0.0% 0.3%
Tujia China 80.7% 11.6% 7.0% 0.2% 0.0% 0.0% 0.5%
Vietnam 66.4% 0.5% 32.9% 0.0% 0.0% 0.0% 0.1%
Xibo China 54.9% 12.2% 1.0% 25.0% 2.5% 1.0% 3.5%
Yi China 42.3% 52.6% 2.0% 1.5% 0.2% 0.9% 0.5%
All contents © 2006-2012 DNA Tribes. DNA Tribes®. DNA Tribes patent pending analysis is available
exclusively from DNA Tribes. All rights reserved.
http://www.dnatribes.com/snp.htmlCustomerSupport:[email protected]
9/4/2012 Page31of32
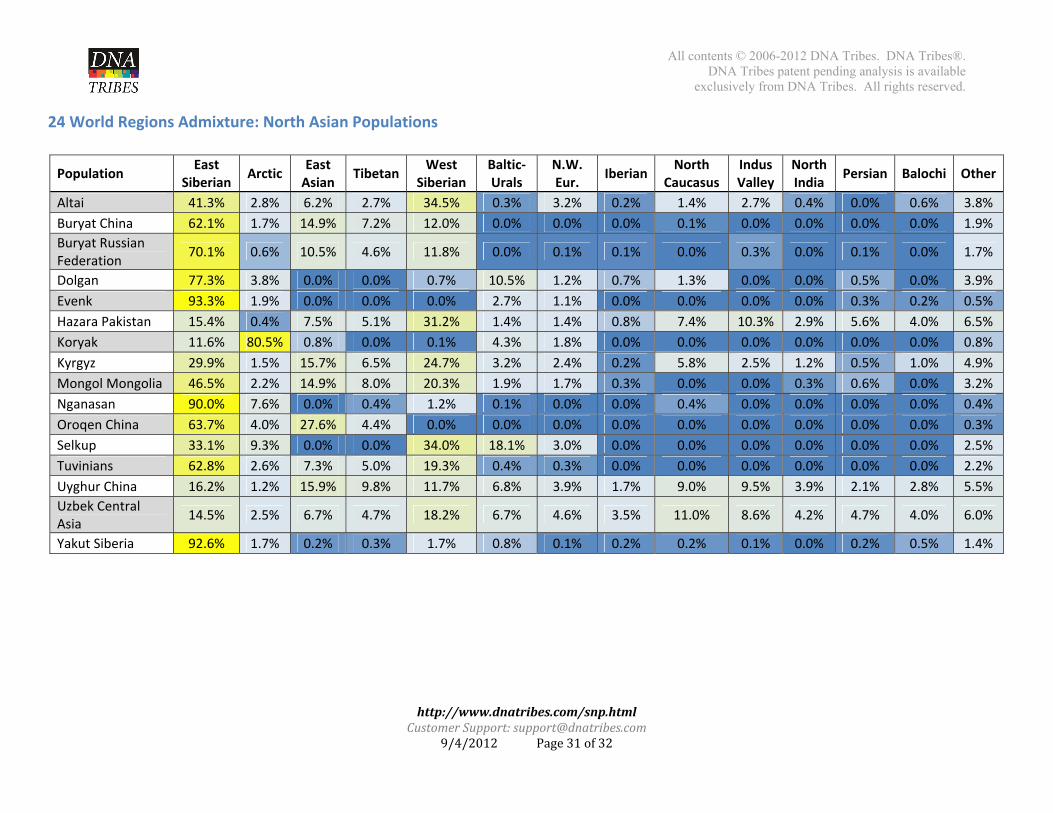
24 World Regions Admixture: North Asian Populations
Population East
Siberian Arctic
East Asian
TibetanWest
Siberian Baltic‐Urals
N.W. Eur.
Iberian North
Caucasus Indus Valley
North India
Persian Balochi Other
Altai 41.3% 2.8% 6.2% 2.7% 34.5% 0.3% 3.2% 0.2% 1.4% 2.7% 0.4% 0.0% 0.6% 3.8%
Buryat China 62.1% 1.7% 14.9% 7.2% 12.0% 0.0% 0.0% 0.0% 0.1% 0.0% 0.0% 0.0% 0.0% 1.9%
Buryat Russian Federation
70.1% 0.6% 10.5% 4.6% 11.8% 0.0% 0.1% 0.1% 0.0% 0.3% 0.0% 0.1% 0.0% 1.7%
Dolgan 77.3% 3.8% 0.0% 0.0% 0.7% 10.5% 1.2% 0.7% 1.3% 0.0% 0.0% 0.5% 0.0% 3.9%
Evenk 93.3% 1.9% 0.0% 0.0% 0.0% 2.7% 1.1% 0.0% 0.0% 0.0% 0.0% 0.3% 0.2% 0.5%
Hazara Pakistan 15.4% 0.4% 7.5% 5.1% 31.2% 1.4% 1.4% 0.8% 7.4% 10.3% 2.9% 5.6% 4.0% 6.5%
Koryak 11.6% 80.5% 0.8% 0.0% 0.1% 4.3% 1.8% 0.0% 0.0% 0.0% 0.0% 0.0% 0.0% 0.8%
Kyrgyz 29.9% 1.5% 15.7% 6.5% 24.7% 3.2% 2.4% 0.2% 5.8% 2.5% 1.2% 0.5% 1.0% 4.9%
Mongol Mongolia 46.5% 2.2% 14.9% 8.0% 20.3% 1.9% 1.7% 0.3% 0.0% 0.0% 0.3% 0.6% 0.0% 3.2%
Nganasan 90.0% 7.6% 0.0% 0.4% 1.2% 0.1% 0.0% 0.0% 0.4% 0.0% 0.0% 0.0% 0.0% 0.4%
Oroqen China 63.7% 4.0% 27.6% 4.4% 0.0% 0.0% 0.0% 0.0% 0.0% 0.0% 0.0% 0.0% 0.0% 0.3%
Selkup 33.1% 9.3% 0.0% 0.0% 34.0% 18.1% 3.0% 0.0% 0.0% 0.0% 0.0% 0.0% 0.0% 2.5%
Tuvinians 62.8% 2.6% 7.3% 5.0% 19.3% 0.4% 0.3% 0.0% 0.0% 0.0% 0.0% 0.0% 0.0% 2.2%
Uyghur China 16.2% 1.2% 15.9% 9.8% 11.7% 6.8% 3.9% 1.7% 9.0% 9.5% 3.9% 2.1% 2.8% 5.5%
Uzbek Central Asia
14.5% 2.5% 6.7% 4.7% 18.2% 6.7% 4.6% 3.5% 11.0% 8.6% 4.2% 4.7% 4.0% 6.0%
Yakut Siberia 92.6% 1.7% 0.2% 0.3% 1.7% 0.8% 0.1% 0.2% 0.2% 0.1% 0.0% 0.2% 0.5% 1.4%
All contents © 2006-2012 DNA Tribes. DNA Tribes®. DNA Tribes patent pending analysis is available
exclusively from DNA Tribes. All rights reserved.
http://www.dnatribes.com/snp.htmlCustomerSupport:[email protected]
9/4/2012 Page32of32
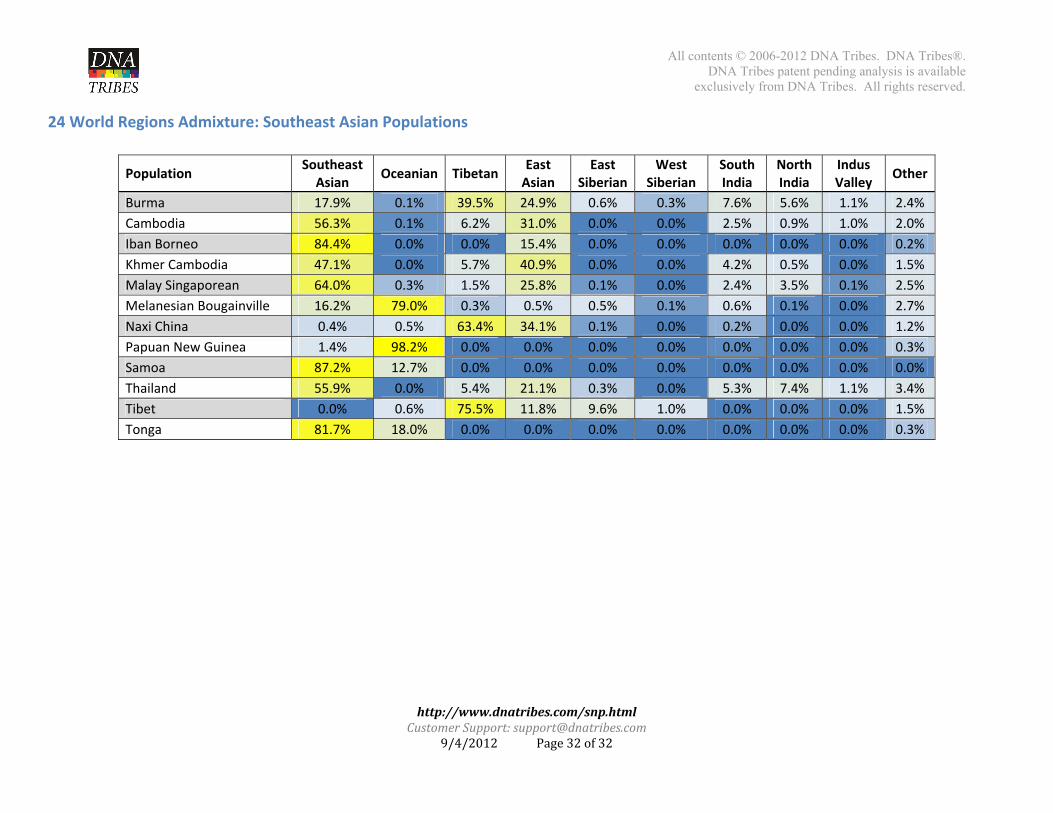
24 World Regions Admixture: Southeast Asian Populations
Population Southeast Asian
Oceanian TibetanEast Asian
East Siberian
West Siberian
South India
North India
Indus Valley
Other
Burma 17.9% 0.1% 39.5% 24.9% 0.6% 0.3% 7.6% 5.6% 1.1% 2.4%
Cambodia 56.3% 0.1% 6.2% 31.0% 0.0% 0.0% 2.5% 0.9% 1.0% 2.0%
Iban Borneo 84.4% 0.0% 0.0% 15.4% 0.0% 0.0% 0.0% 0.0% 0.0% 0.2%
Khmer Cambodia 47.1% 0.0% 5.7% 40.9% 0.0% 0.0% 4.2% 0.5% 0.0% 1.5%
Malay Singaporean 64.0% 0.3% 1.5% 25.8% 0.1% 0.0% 2.4% 3.5% 0.1% 2.5%
Melanesian Bougainville 16.2% 79.0% 0.3% 0.5% 0.5% 0.1% 0.6% 0.1% 0.0% 2.7%
Naxi China 0.4% 0.5% 63.4% 34.1% 0.1% 0.0% 0.2% 0.0% 0.0% 1.2%
Papuan New Guinea 1.4% 98.2% 0.0% 0.0% 0.0% 0.0% 0.0% 0.0% 0.0% 0.3%
Samoa 87.2% 12.7% 0.0% 0.0% 0.0% 0.0% 0.0% 0.0% 0.0% 0.0%
Thailand 55.9% 0.0% 5.4% 21.1% 0.3% 0.0% 5.3% 7.4% 1.1% 3.4%
Tibet 0.0% 0.6% 75.5% 11.8% 9.6% 1.0% 0.0% 0.0% 0.0% 1.5%
Tonga 81.7% 18.0% 0.0% 0.0% 0.0% 0.0% 0.0% 0.0% 0.0% 0.3%