Embed Size (px)
Citation preview
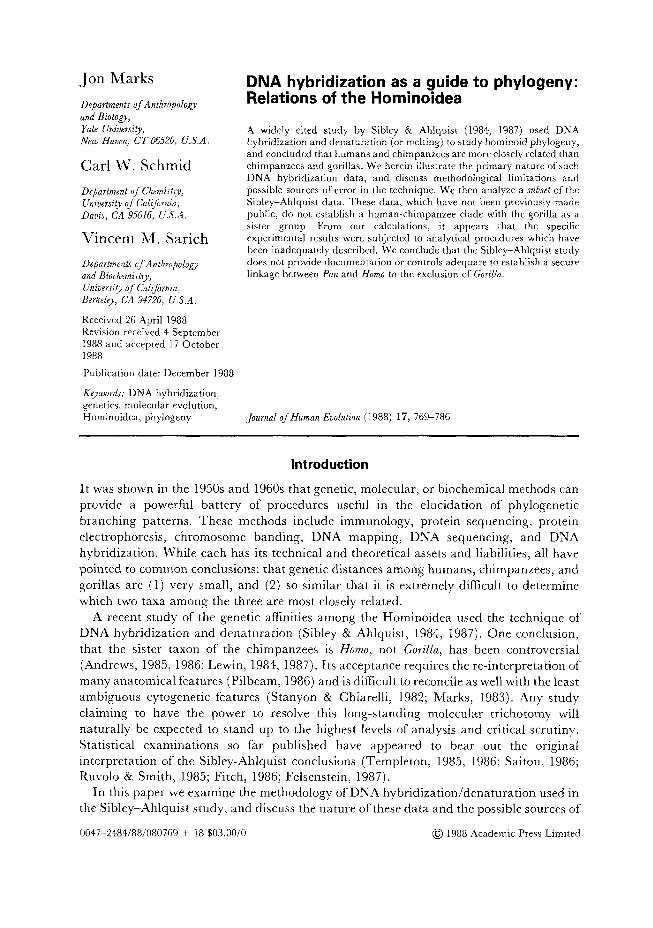
Jon Marks DNA hybridization as a guide to phylogeny:
Defmrtments of Anthrojolo,~.y Relations of the Hominoidea and Biology,
_
Yale University, New Haven, CT O&i-‘O, U.S.A.
Carl W. Schmid
Defmrtment OJ Chemistry, Uniuersi(y oj Calijmi~, Dauis, CA 95616, U.S.A
Vincent M. Sarich
Dqmtments of A&m~ology and Biochemistry, Uniuersit_y oj California, Berkeley, CA 9$720, U.S.A.
Received 26 April 1988 Revision received 4 September 1988 and accepted 17 October 1988
Publication date: December 1988
Keywords: DNA hybridization, genetics, molecular evolution, Hominoidea, phylogeny
A widely cited study by Sibley & Ahlquist (1984, 1987) used DNA hybridization and denaturation (or melting) to study horn&id phylogeny, and concluded that humans and chimpanzees are more closely related than chimpanzees and gorillas. We herein illustrate the primary nature of such DNA hybridization data, and discuss methodological limitations and possible sources of error in the technique. We then analyze a subset of the Sibley-Ahlquist data. These data, which have not been previously made public, do not establish a human-chimpanzee clade with the gorilla as a sister group. From our calculations, it appears that the specific experimental results were subjected to analytical procedures which have been inadequately described. We conclude that the Sibley-Ahlquist study does not provide documentation or controls adequate to establish a secure linkage between Pan and Homo to the exclusion of Gorilla.
Journal ofHuman Evolution (1988) 17, 769-786
Introduction
It was shown in the 1950s and 1960s that genetic, molecular, or biochemical methods can
provide a powerful battery of procedures useful in the elucidation of phylogenetic
branching patterns. These methods include immunology, protein sequencing, protein
electrophoresis, chromosome banding, DNA mapping, DNA sequencing, and DNA
hybridization. While each has its technical and theoretical assets and liabilities, all have
pointed to common conclusions: that genetic distances among humans, chimpanzees, and
gorillas are ( 1) very small, and (2) so similar that it is extremely difficult to determine
which two taxa among the three are most closely related.
A recent study of the genetic affinities among the Hominoidea used the technique of
DNA hybridization and denaturation (Sibley & Ahlquist, 1984, 1987). One conclusion,
that the sister taxon of the chimpanzees is Homo, not Gorilla, has been controversial
(Andrews, 1985, 1986; Lewin, 1984, 1987). Its acceptance requires the re-interpretation of
many anatomical features (Pilbeam, 1986) and is difficult to reconcile as well with the least
ambiguous cytogenetic features (Stanyon & Chiarelli, 1982; Marks, 1983). Any study
claiming to have the power to resolve this long-standing molecular trichotomy will
naturally be expected to stand up to the highest levels of analysis and critical scrutiny.
Statistical examinations so far published have appeared to bear out the original
interpretation of the Sibley-Ahlquist conclusions (Templeton, 1985, 1986; Saitou, 1986;
Ruvolo & Smith, 1985; Fitch, 1986; Felsenstein, 1987).
In this paper we examine the methodology of DNA hybridization/denaturation used in
the Sibley-Ahlquist study, and discuss the nature of these data and the possible sources of
0047%2484/88/080769 + 18 $03.00/O @ 1988 Academic Press Limited
770 J. MARKS ETAL.
error which should be considered in evaluating the accuracy of phylogenetic conclusions based upon such studies. A major problem involves the unavailablity of primary data and controls which would permit critical evaluation of the robusticity of Sibley & Ahlquist’s conclusions. We present here an independent analysis of a subset of the Sibley-Ahlquist data, identify several unexpected features of these data, and conclude that if these data are representative of the complete Sibley-Ahlquist set, then they raise questions about the ability to resolve the genetic trichotomy of human-chimpanzee-gorilla.
General Methodology
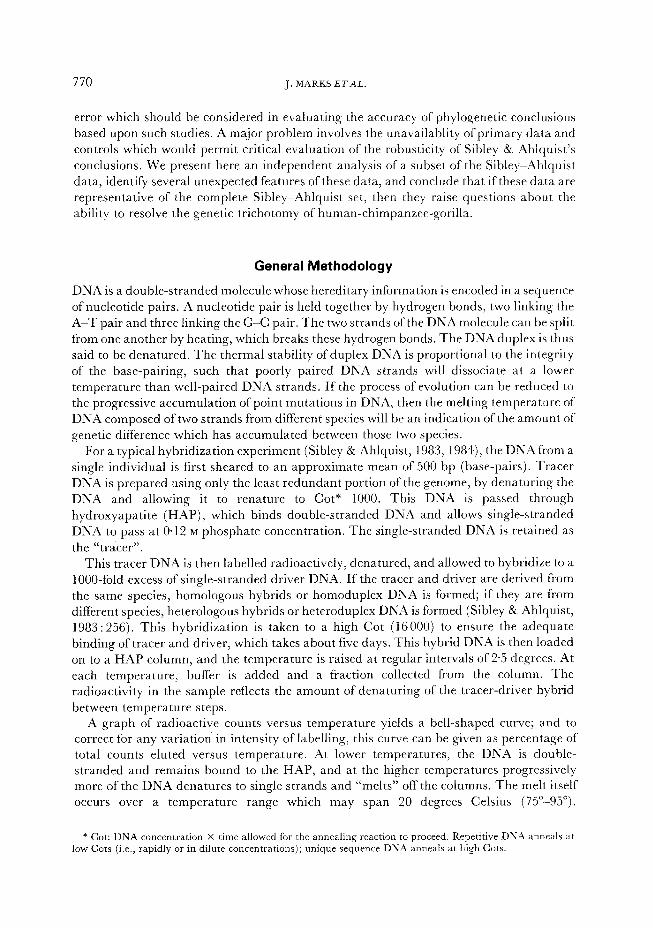
DNA is a double-stranded molecule whose hereditary information is encoded in a sequence of nucleotide pairs. A nucleotide pair is held together by hydrogen bonds, two linking the A-T pair and three linking the G-C pair. The two strands of the DNA molecule can be split from one another by heating, which breaks these hydrogen bonds, The DNA duplex is thus said to be denatured. The thermal stability of duplex DNA is proportional to the integrity of the base-pairing, such that poorly paired DNA strands will dissociate at a lower temperature than well-paired DNA strands. If the process of evolution can be reduced to the progressive accumulation of point mutations in DNA, then the melting temperature of DNA composed of two strands from different species will be an indication of the amount of genetic difference which has accumulated between those two species.
For a typical hybridization experiment (Sibley & Ahlquist, 1983, 1984), the DNA from a single individual is first sheared to an approximate mean of 500 bp (base-pairs). Tracer DNA is prepared using only the least redundant portion of the genome, by denaturing the DNA and allowing it to renature to Cot * 1000. This DNA is passed through
hydroxyapatite (HAP), which binds double-stranded DNA and allows single-stranded DNA to pass at 0.12 M phosphate concentration. The single-stranded DNA is retained as the “tracer”.
This tracer DNA is then labelled radioactively, denatured, and allowed to hybridize to a lOOO-fold excess of single-stranded driver DNA. If the tracer and driver are derived from the same species, homologous hybrids or homoduplex DNA is formed; if they are from different species, heterologous hybrids or heteroduplex DNA is formed (Sibley & Ahlquist, 1983 : 256). This hybridization is taken to a high Cot (16 000) to ensure the adequate binding of tracer and driver, which takes about five days. This hybrid DNA is then loaded on to a HAP column, and the temperature is raised at regular intervals of 2.5 degrees. At each temperature, buffer is added and a fraction collected from the column. The radioactivity in the sample reflects the amount of denaturing of the tracer-driver hybrid
between temperature steps. A graph of radioactive counts versus temperature yields a bell-shaped curve; and to
correct for any variation in intensity of labelling, this curve can be given as percentage of total counts eluted versus temperature. At lower temperatures, the DNA is double- stranded and remains bound to the HAP, and at the higher temperatures progressively more of the DNA denatures to single strands and “melts ” off the columns. The melt itself occurs over a temperature range which may span 20 degrees Celsius (75”-95”).
* Cot: DNA concentration X time allowed for the annealing reaction to proceed. Repetitive DNA anneals at low Cots (i.e., rapidly or in dilute concentrations); unique sequence DNA anneals at high Cots.
DNA HYBRIDIZATION 771
01 I I I
60 70 80 90 I
(b) Melting Profile (Homo)
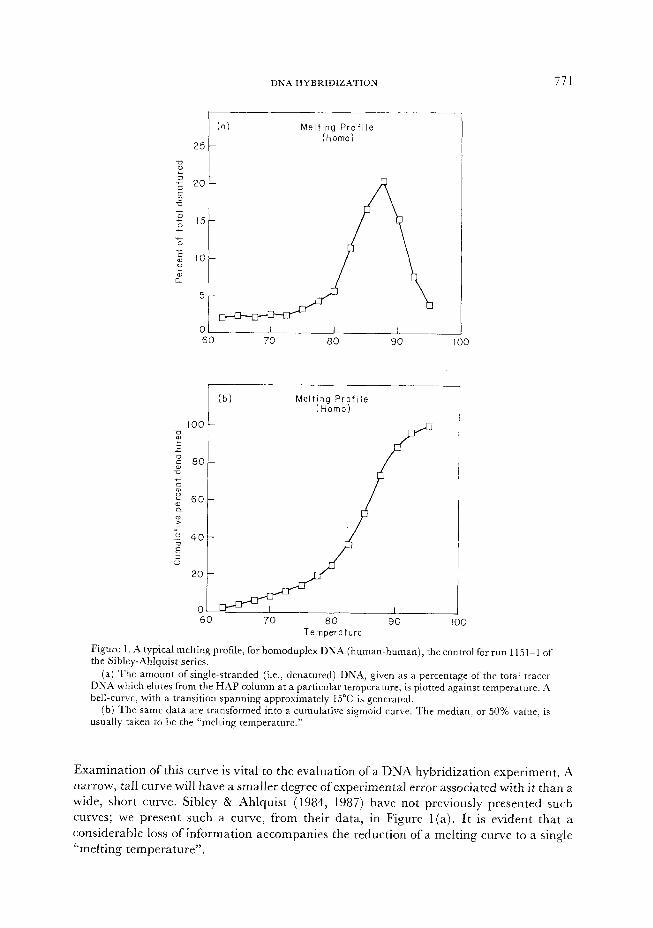
Figure 1. A typical melting profile, for homoduplex DNA (human-human), the control for run 115 l-l of the Sibley-Ahlquist series.
(a) The amount of single-stranded (i.e., denatured) DNA, given as a percentage of the total tracer DNA which elutes from the HAP column at a particular temperature, is plotted against temperature. A bell-curve, with a transition spanning approximately 15°C is generated.
(b) The same data are transformed into a cumulative sigmoid curve. The median, or 50% value. is usually taken to be the “melting temperature.”
Examination of this curve is vital to the evaluation of a DNA hybridization experiment. A narrow, tall curve will have a smaller degree of experimental error associated with it than a wide, short curve. Sibley & Ahlquist (1984, 1987) h ave not previously presented such curves; we present such a curve, from their data, in Figure 1 (a). It is evident that a considerable loss of information accompanies the reduction of a melting curve to a single “melting temperature”.
772 J. MARKS ET-AL.
A standard transformation from “amount of single-strand DNA” to “cumulative percentage of single-strand DNA” turns the approximately normal curve into a sigmoid curve. This graph is shown in Figure 1 (b). Th e melting temperature is usually determined as the median value-the point at which 50% of the DNA is single-stranded, and 50% is double-stranded.
Methodological questions
There are several questions which could legitimately be raised concerning the Sibley-Ahlquist study and which raise the possibility that a crude comparison of heteroduplex melting temperatures is not sufficiently sensitive a priori to resolve a close
phylogenetic split. First, the interval size at which Sibley and Ahlquist obtained data points is five times
larger than the 0.5 degree difference which separates Pan from Gorilla.
Second, the melting transition is affected by factors other than base-pair mismatch, such as heterogeneity in base composition (Vizard et al., 1977), as A-T is held together by two hydrogen bonds and C-C by three. Additionally, the binding of double-stranded DNA to HAP affects the DNA melting temperature (Fox et al., 1980; Martinson, 1973).
Third, Sibley and Ahlquist labelled the tracer DNA with 1251, which is specific for cytosine, and which involves highly invasive techniques, such as acid pH, which depurinates DNA. Orosz & Wetmur (1974) found that the extent of iodination proportionally decreases the melting temperature.
Fourth, the length to which the DNA is sheared will affect the melting temperature, by virtue of a “stacking effect”-DNA is easier to denature at the ends than in the middles.
Fifth, the interspersion pattern of repetitive and single-copy DNA will affect its behavior during the preparation of the tracer DNA (Schmid & Deininger, 1975). Repetitive DNA
can denature at low temperatures, and Davidson et al. (1971) found a 5-10% contamination of Xenopus single-copy DNA by repetitive DNA after a single renaturation/HAP fractionation. The presence of human-ape DNA heteroduplexes melting at relatively low temperatures [uide infia, Fig. 2(c)] suggests just such contamination in the Sibley-Ahlquist hominoid data.
Sixth, duplex DNA may thermally elute from the HAP column without undergoing denaturation into single strands (Fox et al., 1980; Martinson, 1973). This is a further source of possible contamination of tracer DNA by repetitive DNA.
Seventh, other studies cite a range of 0.9 to 2.4”C as the reduction in melting between human-chimpanzee heteroduplexes and human homoduplexes (Hoyer et al., 1972;
Deininger & Schmid, 1976; Benveniste & Todaro, 1976; O’Brien et al., 1985). Indeed, the dendrogram drawn by O’Brien et al. (1985) b ased on DNA hybridization experiments clustered human and gorilla, not human and chimpanzee.
Eighth, there are several measures of “melting temperature” available. Some researchers (e.g., Brownell, 1983; Bledsoe, 1987)) use the mode (the highest point on the graph), as most adequately representing the thermal stability of the tracer-driver hybrids. Others (e.g., Sheldon, 1987; Caccone et al., 1988) use the median or 50% point (7’,o or T,) of the DNA which did form hybrids. Sibley and Ahlquist have based their conclusions on a different statistic: T,eH, the median value of the DNA which could kaoe formed hybrids. As we’will demonstrate below, the choice of statistic can affect the phylogenetic conclusions drawn, and TjoH may detect artifactual differences. These data are consequently vital for
DNA HYBRIDIZATION 773
the proper interpretation of the Sibley-Ahlquist experiments, but have not been made
available.
We reiterate that there exists a strong potential for generating well-supported
conclusions about phylogeny from DNA hybridization, provided that the data and method
of analysis are made available and clear. Like any other analytical technique, this method
has limits of resolution, which are set largely by the factors we have just discussed. These
eight possible sources of experimental and analytical error may simply constitute a moot
point, if the data are of high precision and the distances among taxa are highly consistent
and replicable. Alternatively, these reasons may explain a failure of this DNA
hybridization technique to distinguish phylogenetic relations. It depends upon a close
examination of the data. Whether this technique has indeed broken the apparent
trichotomy among humans, chimpanzees and gorillas is therefore an empirical question. It
is a question that cannot be addressed or answered, however, until the actual data and
methods of analysis have been made available and clear. We have analyzed a subset of the
Sibley-Ahlquist data, and present the results of this analysis here. These data had been
given to Roy Britten by Sibley and Ahlquist and were sent by Britten, with permission of
Sibley, to J. M. on 2 December 1987.
Analysis of the Sibley-Ahlquist Data Subset
Our analysis of the human-chimpanzee-gorilla split covers Sibley and Ahlquist’s
experiment 115 1 ( 10 Homo-Pan troglodytes, 12 Homo-Gorilla), their experiment 1165 (3
Homo-Pan troglodytes, 1 Homo-Pan paniscus, 8 Homo-Gorilla), and their experiment 843 ( 1 Pan
pan&us-Homo). There are thus 15 melts comparing humans and chimpanzees, and 20 melts
comparing humans and gorillas.
The experiments were performed in runs of 25: using a tracer DNA sample, and
hybridizing/melting it simultaneously to a sequence of 25 drivers, beginning with at least
one homologous (control) DNA sample. With regard to the primates, we have all the
available melts in experiments 115 1 and 1165 (Homo tracer), 1200 (P@io tracer), and the
first seven melts in experiment 843 (Pan paniscus tracer).
We begin this analysis by noting some difficulties with the TsOH statistic. When the
hybrid mixture is loaded onto the HAP column, some tracer DNA fails to hybridize. This
DNA thus fails to bind to the HAP and elutes immediately at the start of the melting
experiment, and permits an estimate of the percentage of hybridization relative to the
homoduplex. As the temperature is raised, the DNA which has formed duplex structures
begins to denature. When the median value is calculated, one therefore has the choice
between taking 50% of the tracer DNA actually melting out of double-stranded structures
(T,), or 50% of the tracer DNA originating in both double-stranded and single-stranded
structures ( TseH). The TsoH statistic assumes that all the DNA which did not hybridize was too divergent
to do so. It thus assumes that all the unhybridized DNA is unhybridizable DNA. For closely
related primate taxa, however, this equation is unwarranted: variation in the extent of
hybridization is likely due not to extreme divergence, but rather to experimental error.
Thus Sheldon (1987, p. 64) writes that “[flor an unknown reason, [percent hybridization]
among closely related organisms often has an unusually large variance”. We believe that
the incorporation of unhybridized DNA into the calculation of the median, by assuming it is
774 J. MARKS ETAL.
(0) Homo tracer PanandGorflla driver
60 I I I 1
70 80 90 100
7 Homo tracer
Pan and Gorilla driver
-3 Chimp 1165-2
-X- Gorilla 1165-13
01 I I I I 1 60 70 00 90 100
Temperature
DNA HYBRIDIZATION 775
unhybridiznble DNA, introduces an incorrect assumption and a substantial amount of
experimental error into the calculation of the median value. TjoH therefore measures not simply the thermal stability of the heteroduplexes, but the
extent to which hybridization actually occurred as well-the initial conditions of the DNA melting experiment. A small difference in the extent of hybridization between tracer and driver will cause a difference in the TsOH which is not related to the relative thermal stability of the hybrid DNAs. The percent hybridization incorporated into &OH can indeed affect the phylogenetic results, as noted by Templeton (1986).
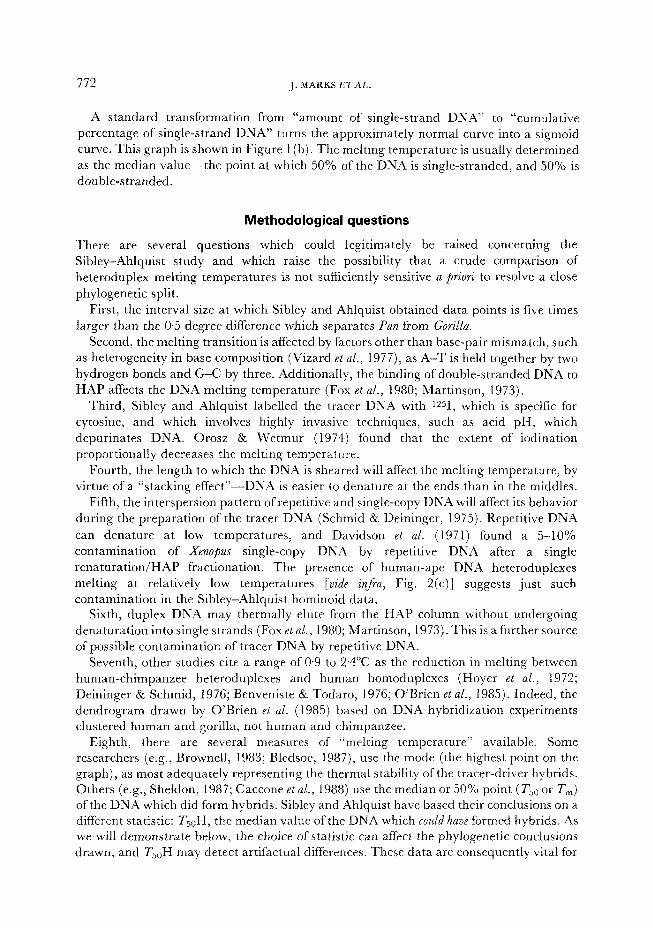
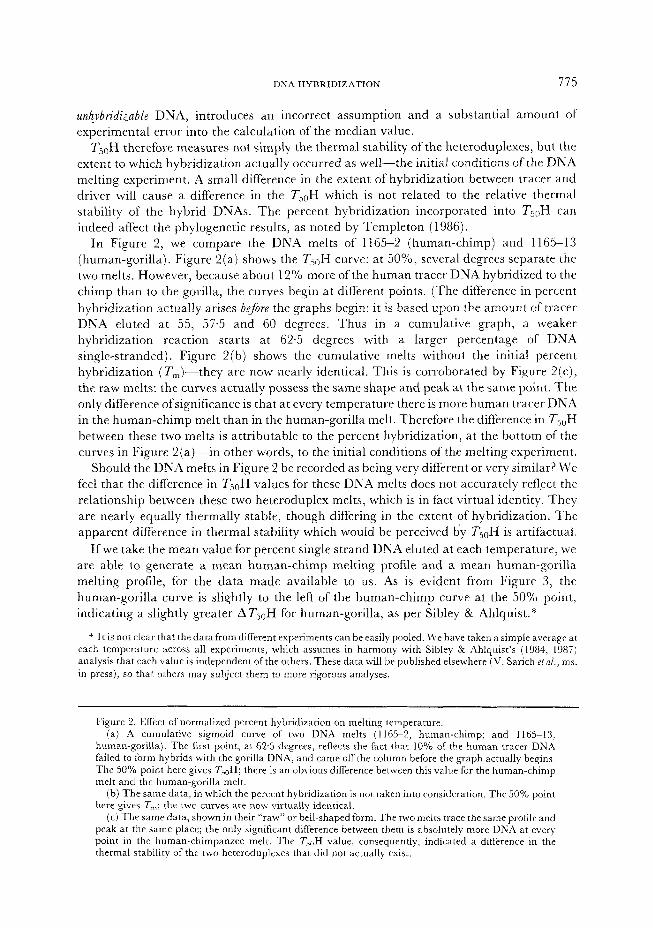
In Figure 2, we compare the DNA melts of 1165-2 (human-chimp) and 1165-13 (human-gorilla). Figure 2(a) shows the TjaH curve: at 50%, several degrees separate the two melts. However, because about 12% more ofthe human tracer DNA hybridized to the chimp than to the gorilla, the curves begin at different points. (The difference in percent
hybridization actually arises before the graphs begin: it is based upon the amount of tracer DNA eluted at 55, 57.5 and 60 degrees. Thus in a cumulative graph, a weaker hybridization reaction starts at 62.5 degrees with a larger percentage of DNA single-stranded). Figure 2(b) shows the cumulative melts without the initial percent hybridization (T,)-they are now nearly identical. This is corroborated by Figure 2(c), the raw melts: the curves actually possess the same shape and peak at the same point. The only difference ofsignificance is that at every temperature there is more human tracer DNA in the human-chimp melt than in the human-gorilla melt. Therefore the difference in Ts,)H between these two melts is attributable to the percent hybridization, at the bottom of the curves in Figure 2(a)-in other words, to the initial conditions of the melting experiment.
Should the DNA melts in Figure 2 be recorded as being very different or very similar? We feel that the difference in T&H values for these DNA melts does not accurately reflect the relationship between these two heteroduplex melts, which is in fact virtual identity. They are nearly equally thermally stable, though differing in the extent of hybridization. The apparent difference in thermal stability which would be perceived by T,,H is artifactual.
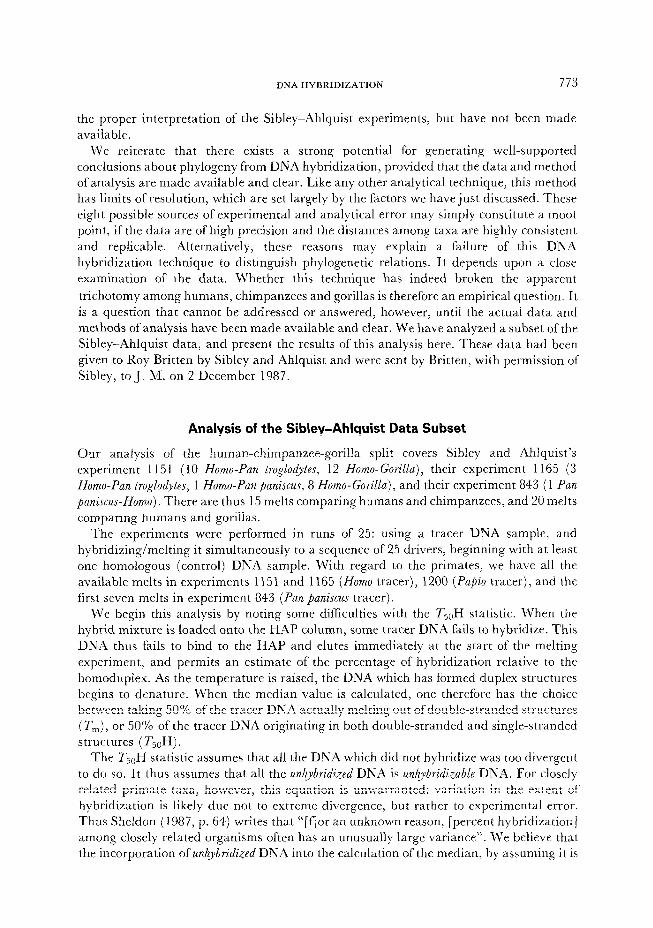
If we take the mean value for percent single strand DNA eluted at each temperature, we are able to generate a mean human-chimp melting profile and a mean human-gorilla melting profile, for the data made available to us. As is evident from Figure 3, the human-gorilla curve is slightly to the left of the human-chimp curve at the 50% point, indicating a slightly greater AT,eH for human-gorilla, as per Sibley & Ahlquist.”
* It is not clear that the data from different experiments can be easily pooled. We have taken a simple average at each temperature across all experiments, which assumes in harmony with Sibley & Ahlquist’s (1984, 1987) analysis that each value is independent ofthe others. These data will be published elsewhere (V. Sarich et ai.. ms. in press). so that others may subject them to more rigorous analyses.
Figure 2. Effect of normalized percent hybridization on melting temperature. (a) A cumulative sigmoid curve of two DNA melts (1165-2, human-chimp; and 1165-13.
human-gorilla). The first point, at 62.5 degrees, reflects the fact that 10% of the human tracer DNA failed to form hybrids with the gorilla DNA, and came off the column before the graph actually begins The 50% point here gives T;,H; there is an obvious difference between this value for the human-chimp melt and the human-gorilla melt.
(b) The same data, in which the percent hybridization is not taken into consideration. The 50% point here gives T,; the two curves are now virtually identical.
(c) The same data, shown in their “raw” or bell-shaped form. The two melts trace the same profile and peak at the same place; the only significant difference between them is absolutely more DNA at ever); point in the human-chimpanzee melt. The T,,H value, consequently, indicated a difference in the thermal stability of the two heteroduplexes that did not actually exist.
776 J. MARKS ETAL.
Homo-Pan-Gorilla, T50H 15 Homo-Pan, 20 Homo-Gorilla
Temperature
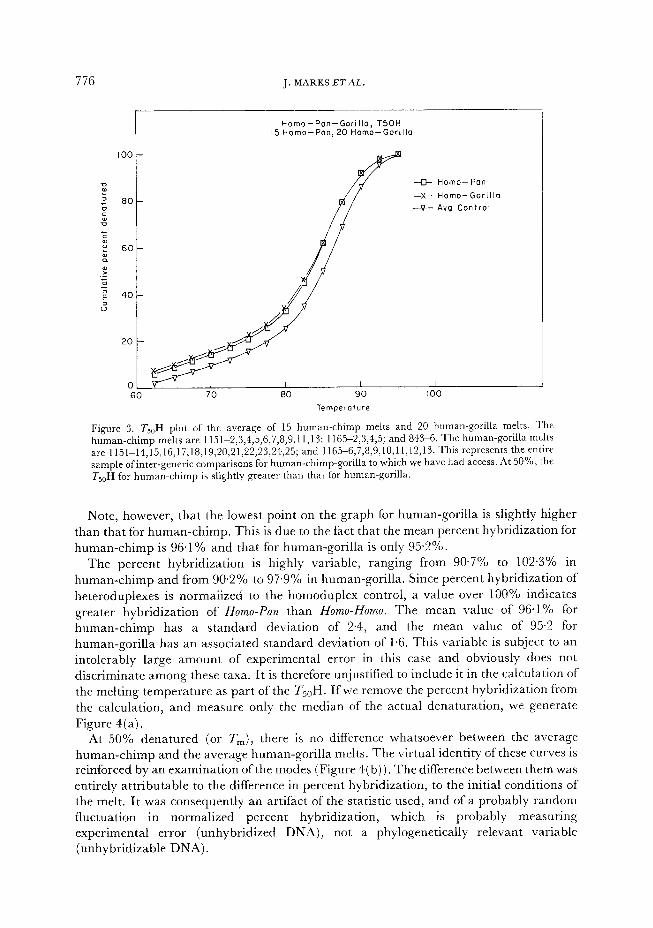
Figure 3. T,,H plot of the average of 15 human-chimp melts and 20 human-gorilla melts. The human-chimp melts are 1151L2,3,4,5,6,7,8,9,11,13; 1165-2,3,4,5; and 843-6. The human-gorilla melts are 1151-14,15,16,17,18,19,20,21,22,23,24,25; and 1165-6,7,8,9,10,11,12,13. This represents the entire sample ofinter-generic comparisons for human-chimp-gorilla to which we have had access. At 50%) the TsoH for human-chimp is slightly greater than that for human-gorilla.
Note, however, that the lowest point on the graph for human-gorilla is slightly higher than that for human-chimp. This is due to the fact that the mean percent hybridization for human-chimp is 96.1% and that for human-gorilla is only 95.2%.
The percent h b d’ y ri ization is highly variable, ranging from 90.7% to 102.3% in human-chimp and from 90.2% to 97.9 / ‘0 in human-gorilla. Since percent hybridization of heteroduplexes is normalized to the homoduplex control, a value over 100% indicates greater hybridization of Homo-Pan than Homo-Homo. The mean value of 96.1% for
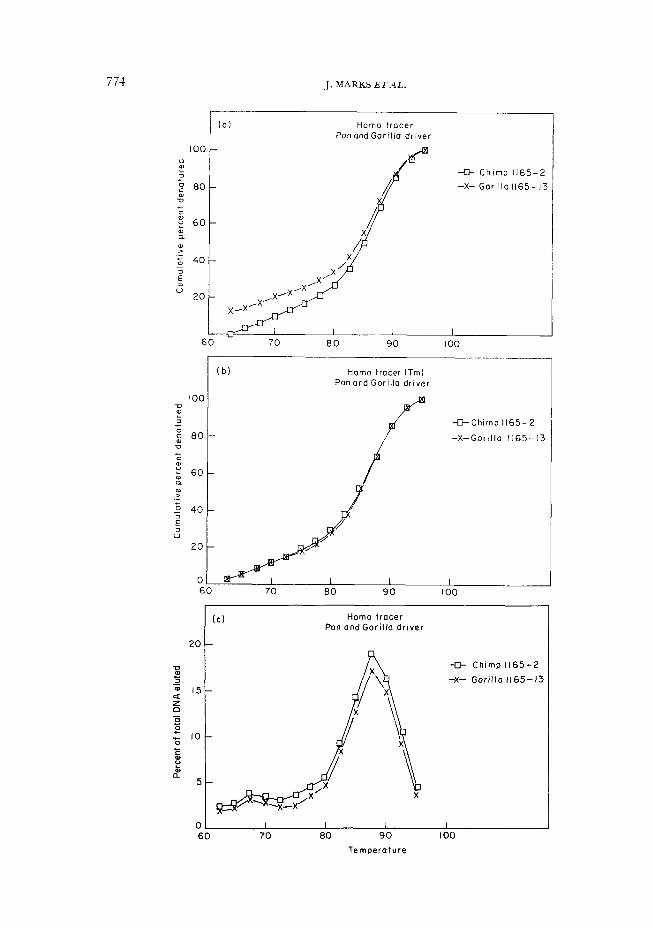
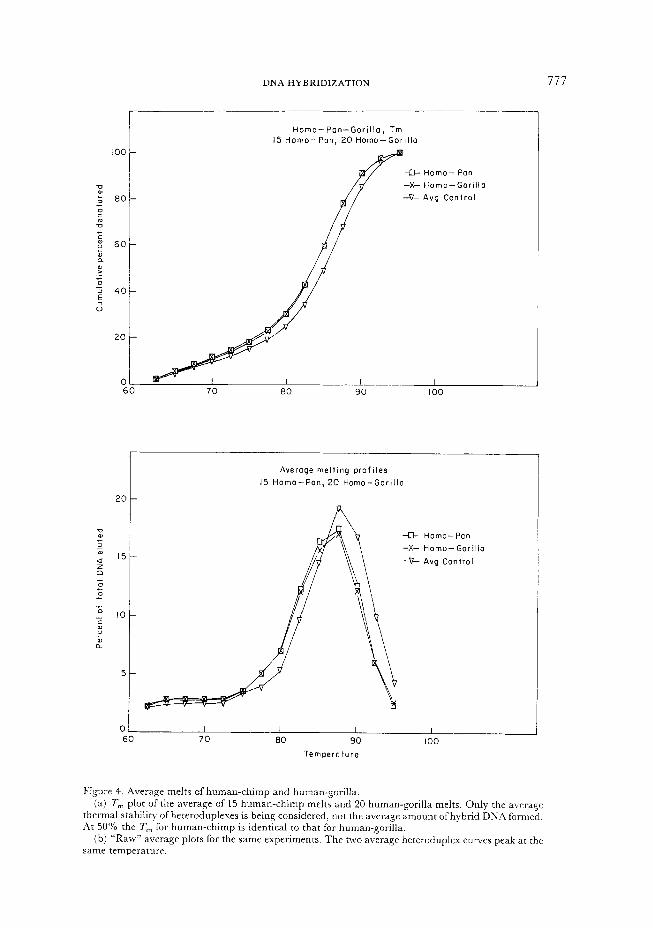
human-chimp has a standard deviation of 2.4, and the mean value of 95.2 for human-gorilla has an associated standard deviation of 1.6. This variable is subject to an intolerably large amount of experimental error in this case and obviously does not discriminate among these taxa. It is therefore unjustified to include it in the calculation of the melting temperature as part of the T,,H. Ifwe remove the percent hybridization from the calculation, and measure only the median of the actual denaturation, we generate Figure 4(a).
At 50% denatured (or 7’,), there is no difference whatsoever between the average human-chimp and the average human-gorilla melts. The virtual identity of these curves is reinforced by an examination of the modes (Figure 4( b)). The difference between them was entirely attributable to the difference in percent hybridization, to the initial conditions of the melt. It was consequently an artifact of the statistic used, and of a probably random fluctuation in normalized percent hybridization, which is probably measuring experimental error (unhybridized DNA), not a phylogenetically relevant variable (unhybridizable DNA).
DNA HYBRIDIZATION 777
Homo-Pan-Gorilla, Tm
I5 Homo-Pan, 20 Homo-Gorilla
100 -
: ; Eio-
5 g 2 x 60-
2 0)
2 ‘0 3 40- E
;
20
0 60
Average melting profiles
15 Homo-Pan, 20 Homo-Gorilla
(a) T, plot of the average of 15 human-chimp melts and 20 human-gorilla melts. Only the average
thermal stability ofheteroduplexes is being considered, not the average amount ofhybrid DNA formed. At 50% the T,,, for human-chimp is identical to that for human-gorilla.
(b) “Raw” average plots for the same experiments. The two average heteroduplex curves peak at the
same temperature.
6u I” tw 90 100
Temperature
Figure 4. Average melts of human-chimp and human-gorilla
778 J. MARKS ETAL.
Repotting the Values
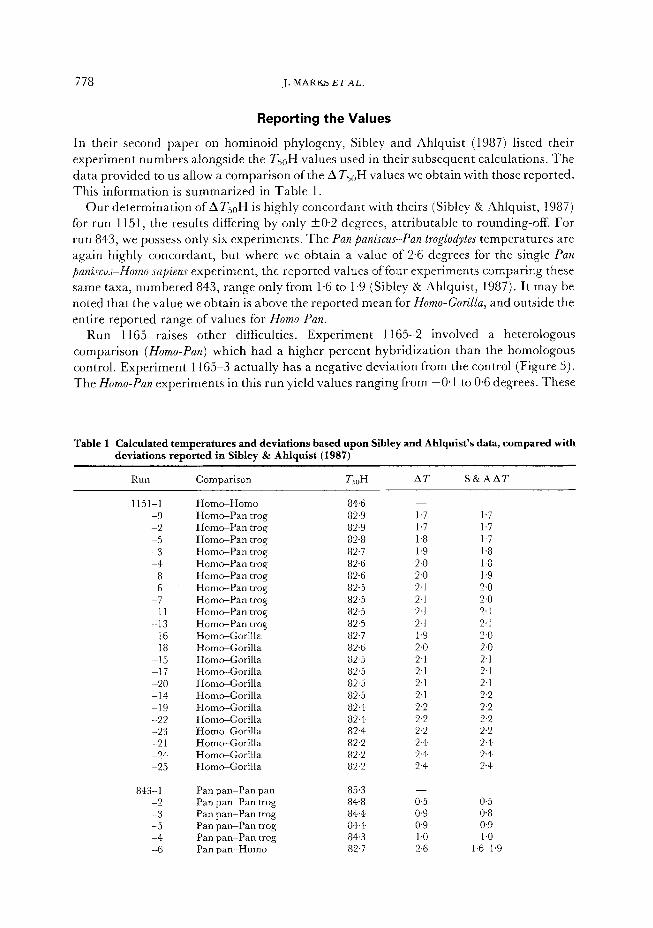
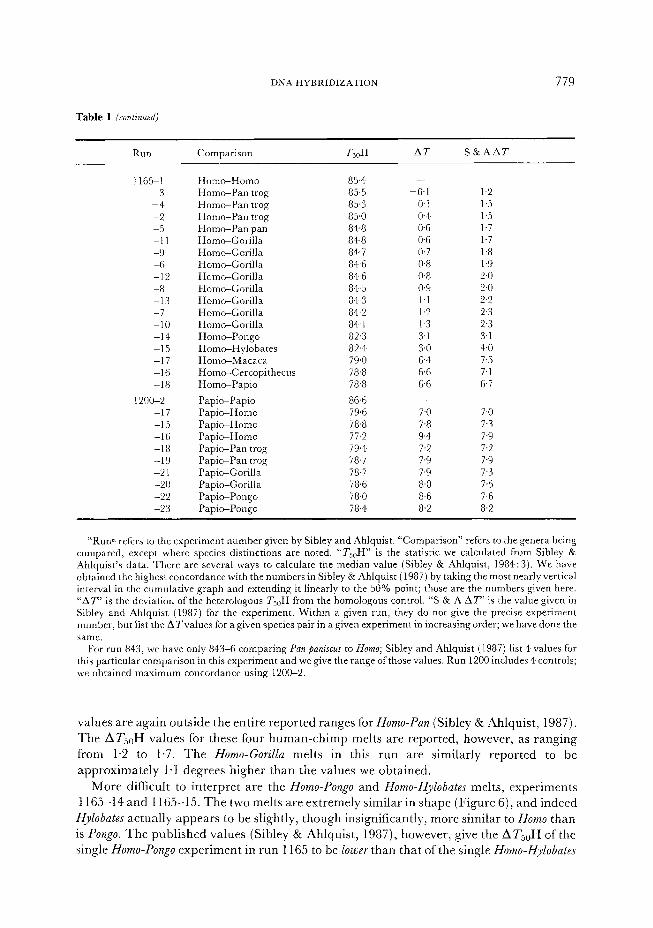
In their second paper on hominoid phylogeny, Sibley and Ahlquist (1987) listed their experiment numbers alongside the TsoH values used in their subsequent calculations. The data provided to us allow a comparison of the ATSoH values we obtain with those reported. This information is summarized in Table 1.
Our determination of AT,,H is highly concordant with theirs (Sibley & Ahlquist, 1987) for run 1151, the results differing by only +0.2 degrees, attributable to rounding-off. For run 843, we possess only six experiments. The Pan paniscus-Pan troglodytes temperatures are again highly concordant, but where we obtain a value of 2.6 degrees for the single Pan
paniscus-Homo sa,hns experiment, the reported values of four experiments comparing these same taxa, numbered 843, range only from 1.6 to 1.9 (Sibley & Ahlquist, 1987). It may be noted that the value we obtain is above the reported mean for Homo-Gorilla, and outside the entire reported range of values for Homo-Pan.
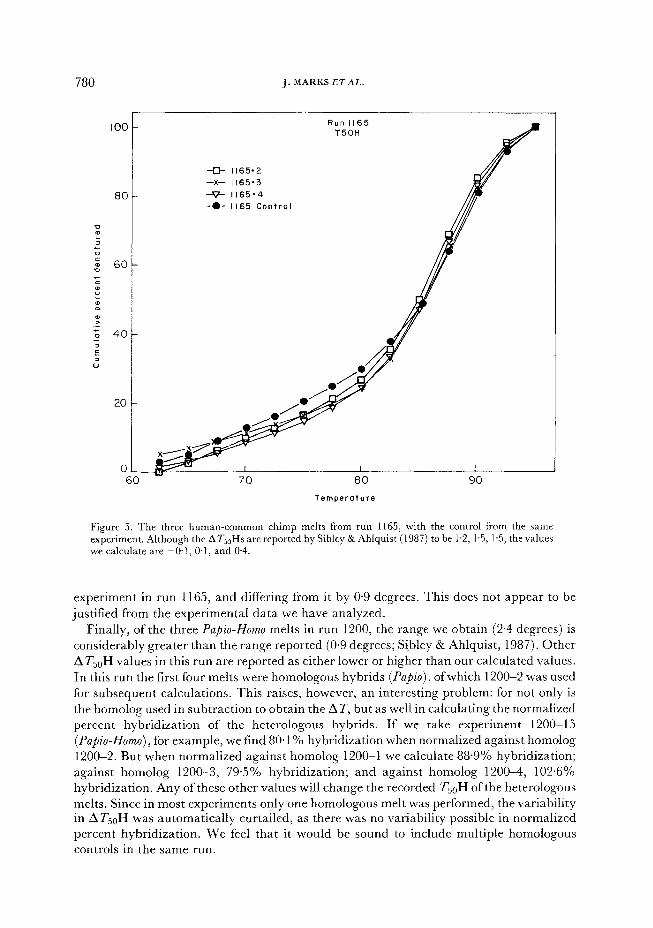
Run 1165 raises other diffkulties. Experiment 1165-2 involved a heterologous comparison (Homo-Pan) which had a higher percent hybridization than the homologous control. Experiment 1165-3 actually has a negative deviation from the control (Figure 5). The Homo-Pan experiments in this run yield values ranging from -0.1 to 0.6 degrees. These
Table 1 Calculated temperatures and deviations based upon Sibley and Ahlquist’s data, compared with
deviations reported in Sibley & Ahlquist (1987)
RUtI Comparison TsuH A7 S&AAT
1151-1 Homo-Homo 84.6 -9 Homo-Pan trog 82.9 -2 HomcePan trog 82.9 -5 HomwPan trog 82.8 -3 Homo-Pan trog 82.7 -4 Homo-Pan trog 82.6 -8 Homo-Pan trog 82.6 -6 Homo-Pan trog 82.5 -7 Horn-Pan trog 82.5 -11 Hom+Pan trog 82.5 -13 Horn-Pan trog 82-5 -16 HomeGorilla 82.7 -18 Hom+Gorilla 82-6 -15 Horn-Gorilla 82.5 -17 Homo-Gorilla 82.5 -20 Horn-Gorilla 82.5 -14 HomeGorilla 82.5 -19 Horn-Gorilla 82.4 -22 HomeGorilla 82.4 -23 Horn-Gorilla 82.4 -21 Horn-Gorilla 82.2 -24 Homc+Gorilla 82.2 -25 Horn-Gorilla 82.2
843-l Pan pan-Pan pan 85.3 -2 Pan pan-Pan trog 84.8 -3 Pan pan-Pan trog 844 -5 Pan pan-Pan trog 84-4 -4 Pan pan-Pan trog 84.3 -6 Pan pan-Homo 82.7
1.7 1.7 1.7 1.7 1.8 1.7 1.9 1.8 2.0 1.8 2.0 1.9 2.1 2.0 2.1 2.0 2.1 2.1 2.1 2.1 1.9 2-o 2.0 2.0 2.1 2.1 2.1 2.1 2.1 2.1 2.1 2.2 2.2 2.2 2.2 2.2 2.2 2.2 2.4 2.4 2.4 2.4 2.4 2.4
0.5 0.5 o-9 0.8 0.9 0.9 1.0 1.0 2.6 1.61.9
DNA HYBRIDIZATION 779
Table 1 (continuedj
RUIl Comparison Tx,H AT S&AAT
1165-1 -3 -4 -2 -5 -11 -9 -6 -12 -8 -13 -7 -10 -14 -15 -17 -16 -18
1200-2 -17 -15 -16 -18 -19 -21 -20 -22 -23
Homo-Homo Homo-Pan trog Hom~Pan trog Homo-Pan trog Homo-Pan pan Homc+Gorilla Hom+Gori!la Homo-Gorilla Horn-Gorilla Homo-Gorilla Homo-Gorilla Homc+Gorilla Homo-Gorilla Homo-Pongo HomeHylobates Hom~Macaca HomeCercopithecus Homc+Papio
Papic+Papio Pap&Homo Pap&Homo Pap&Homo Pap&Pan trog Pap&Pan trog Pap&Gorilla Pap&Gorilla Papic+Pongo Papi*Pongo
85.4 85.5 85.3 85.0 84.8 84.8 84.7 84.6 8+6 84.5 84.3 84.2 84.1 82.3 82.4 79.0 78.8 78.8
86.6 79.6 78.8 77.2 79.4 78.7 78.5 78.6 78.0 78.4
-0.1 1.2 0.1 1.5 04 1.5 0.6 1.7 0.6 1.7 0.7 1.8 0.8 1.9 0.8 2.0 0.9 2.0 1.1 2.2 1.2 2.3 1.3 2-3 3.1 3.1 3.0 4.0 6.4 7.5 6.6 7.1 6.6 6.7
7.0 7.0 7.8 7.3 9.4 7.9 7.2 7.2 7.9 7.9 7.9 7-3 8.0 7.5 8.6 7.6 8.2 8.2
“Runn refers to the experiment number given by Sibley and Ahlquist. “Comparison” refers to the genera being compared, except where species distinctions are noted. “Ts,H” is the statistic we calculated from Sibley & Ahlquist’s data. There are several ways to calculate the median value (Sibley & Ahlquist, 1984: 3). We have obtained the highest concordance with the numbers in Sibley & Ahlquist (1987) by taking the most nearly vertical interval in the cumulative graph and extending it linearly to the 50% point; those are the numbers given here. “A?” is the deviation of the heterologous T,,H from the homologous control. “S & A AT’ is the value given in Sibley and Ahlquist (1987) for the experiment. Within a given run, they do not give the precise experiment number, but List the ATvalues for a given species pair in a given experiment in increasing order; we have done the same.
For run 843, we have only 843-6 comparing Pan paniscus to Homo; Sibley and Ahlquist (1987) list 4 values for this particular comparison in this experiment and we give the range of those values. Run 1200 includes 4 controls; we obtained maximum concordance using 120@2.
values are again outside the entire reported ranges for Homo-Pan (Sibley & Ahlquist, 1987). The ATsOH values for these four human-chimp melts are reported, however, as ranging from 1.2 to 1.7. The Homo-Gorilla melts in this run are similarly reported to be approximately l-1 degrees higher than the values we obtained.
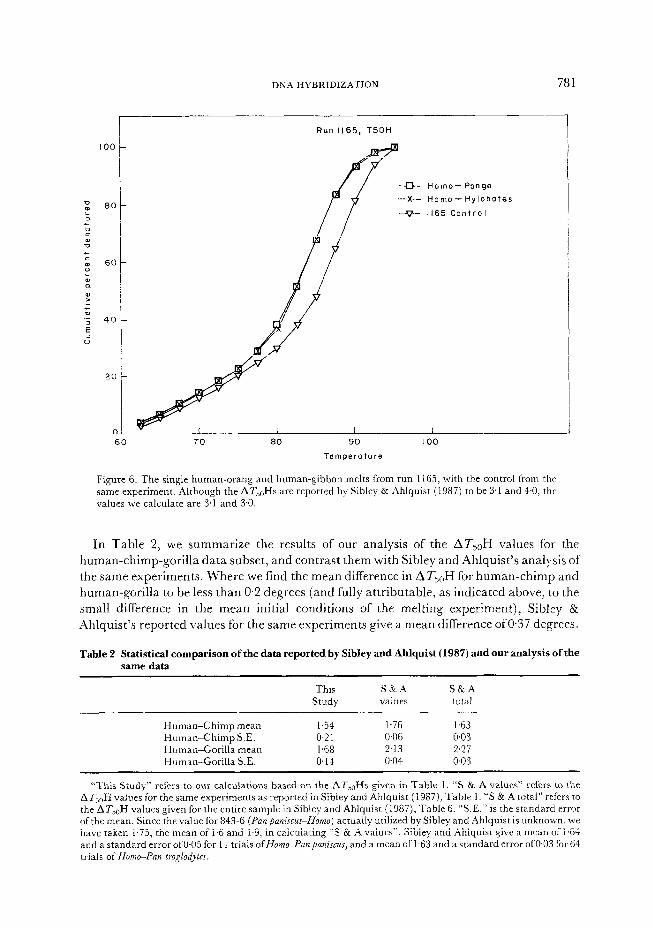
More difficult to interpret-are the Homo-Pongo and Homo-Hylobates melts, experiments 1165-14 and 1165-15. The two melts are extremely similar in shape (Figure 6), and indeed
Hylobates actually appears to be slightly, though insignificantly, more similar to Homo than is Pongo. The published values (Sibley & Ahlquist, 1987), however, give the ATjoH of the single Homo-Pongo experiment in run 1165 to be lower than that of the single Homo-H_ylobates
780 J. MARKS ETAL.
a- 1165.2
-x- 1165.3
80 _P 1165.4
-.- II65 Control
100 Run II65
T50H
TemperatuTe
Figure 5. The three human-common chimp melts from run 1165, with the control from the same experiment. Although the AT,,Hs are reported by Sibley & Ahlquist (1987) to be 1.2, 1.5, 1.5, the values we calculate are -O-l, 0.1, and 0.4.
experiment in run 1165, and differing from it by 0.9 degrees. This does not appear to be justified from the experimental data we have analyzed.
Finally, of the three Papia-Homo melts in run 1200, the range we obtain (2-4 degrees) is considerably greater than the range reported (0.9 degrees; Sibley & Ahlquist, 1987). Other AT5aH values in this run are reported as either lower or higher than our calculated values. In this run the first four melts were homologous hybrids (Papio), ofwhich 1200-2 was used for subsequent calculations. This raises, however, an interesting problem: for not only is the homolog used in subtraction to obtain the AT, but as well in calculating the normalized percent hybridization of the heterologous hybrids. If we take experiment 1200-15 (Pa@-Homo), for example, we find 80.1% hybridization when normalized against homolog 1200-2. But when normalized against homolog 1200-l we calculate 88.9% hybridization; against homolog 1200-3, 79.5% hybridization; and against homolog 1200-4, 1026% hybridization. Any of these other values will change the recorded T50H of the heterologous melts. Since in most experiments only one homologous melt was performed, the variability in ATscH was automatically curtailed, as there was no variability possible in normalized percent hybridization. We feel that it would be sound to include multiple homologous controls in the same run.
DNA HYBRIDIZATION 781
60 70 80 90
Temperature
-&- Homo- Pongo
-X- Homo- Hylobotes
-v_ 1165 Control
i 100
Figure 6. The single human-orang and human-gibbon melts from run 1165, with the control from the same experiment. Although the AT,,H s are reported by Sibley & Ahlquist (1987) to be 3.1 and 4.0, the values we calculate are 3.1 and 3.0.
In Table 2, we summarize the results of our analysis of the AT50H values for the human-chimp-gorilla data subset, and contrast them with Sibley and Ahlquist’s analysis of the same experiments. Where we find the mean difference in A TsoH for human-chimp and human-gorilla to be less than 0.2 degrees (and fully attributable, as indicated above, to the small difference in the mean initial conditions of the melting experiment), Sibley & Ahlquist’s reported values for the same experiments give a mean difference of0.37 degrees.
Table ‘2 Statistical comparison of the data reported by Sibley and Ahlquist (1987) and our analysis of the
same data
This Study
S&A values
S&A total
Human-Chimp mean Human-Chimp S.E. Human-Gorilla mean Human-Gorilla S.E.
1.54 1.76 1.63 0.21 0.06 0.03 1.68 2.13 2.27 0.14 O-04 0.03
“This Study” refers to our calculations based on the AT,*Hs given in Table 1. “S & A values“ refers to the AT,,H values for the same experiments as reported in Sibley and Ahlquist (1987), Table 1. “S & A total” refers to the ATjoH values given for the entire sample in Sibley and Ahlquist (1987), Table 6. “S.E.“ is the standard error of the mean. Since the value for 843.6 (Pan paniscusPHomo) actually utilized by Sibley and Ahlquist is unknown, we have taken 1.75, the mean of 1.6 and 1.9, in calculating “S & A values”. Sibley and Ahlquist give a mean of 1.64 and a standard error of 0.05 for 11 trials ofHam-Panpanircus, and a mean of l-63 and a standard error of 0.03 for 64 trials of Hom+Pan troglodytes.
782 J. MARKS ETAL.
The standard errors of these means, by our calculation, are approximately three times greater than those calculable from their reported values for these experiments (Table 2). The means and standard errors based on Sibley & Ahlquist (1987) for these 35 inter-generic comparisons are in close agreement with the means and standard errors they reported for all 226 inter-generic comparisons.
We are therefore unable to replicate the AT50H calculations of Sibley and Ahlquist for nearly 40% of the experiments for which numerical replication is possible, and we generally find the range and standard errors of AT50H values to be much greater than they have reported. This only covers a small fraction of their data; however, the possibility that the complete data set may be subject to the same sorts of discrepancies would render precise statistical analyses based on those published values, such as those of Felsenstein (1987), meaningless.
Discussion
DNA hybridization is a powerful tool to assist primate biologists in the elucidation of branch-points among taxa. Yet in spite of claims for high-level resolution, no documentation has been presented by its proponents that would indicate this technique has in fact resolved the Homo-Pan-Gorilla split. We believe that the data reported by Sibley & Ahlquist (1987) have been faultily analyzed, and in the absence of documentation, we believe the reported conclusions are open to doubt.
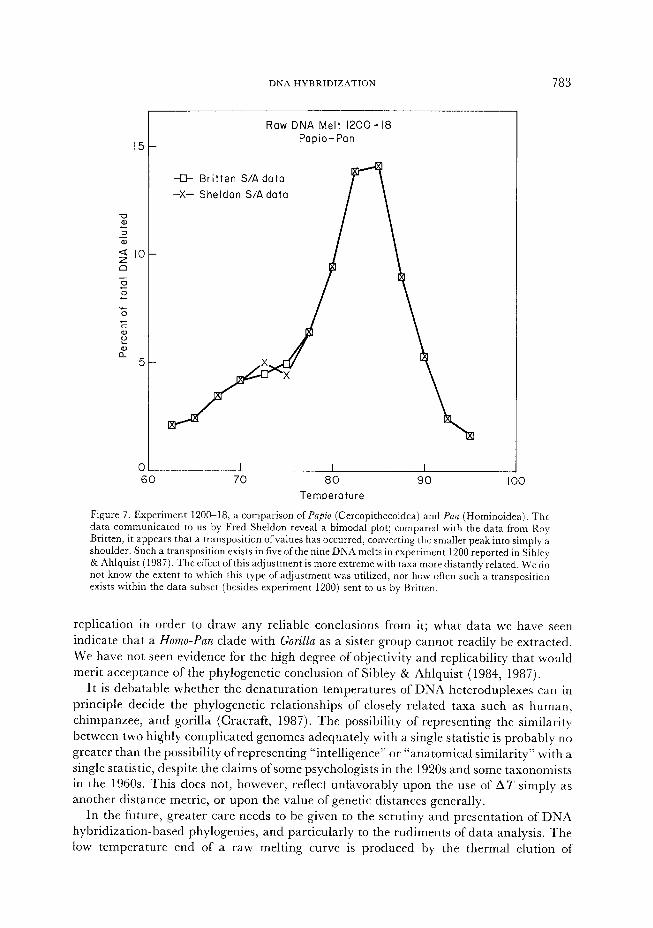
The methods of analysis have also included several post-experimental adjustments which have not been mentioned in Sibley 82 Ahlquist’s publications, and which we have deduced by comparing ATseH values for a subset of their data with published ATsaH values for the same experiments in Sibley & Ahlquist (1987). These adjustments are of at least three sorts. First, the melting temperature of a homoduplex control was altered to adjust a bank of experiments ( 1165). Sheldon (1987) d’ rscusses this manner of adjustment, and invokes it only when the median melting temperature of the homoduplex control is discordant from that of other homoduplexes. Although the shape of the raw 1165 homoduplex melt is aberrant, Table 1 shows that the median temperature of this melt is well within the range for other homoduplex controls. Second, an experiment was exempted from this adjustment apparently to fit a preconception of the branching order (1165-14). Third, the percent hybridization of an experiment was altered to obtain a different AT&H value than the experiment directly indicated (843-6; J. Ahlquist, personal communication to J.M., 21 March 1988). Other sorts of adjustments, the specific natures of which we cannot identify, were apparently made to the 1200 series. A comparison of melting experiments sent to us by Fred Sheldon with data from the same experiments sent to us by Britten (Figure 7) suggests that some values may have been transposed, converting an originally bimodal melting curve into a unimodal curve.
Cumulatively, these adjustments had the effect of changing the distances among taxa, the standard errors of those distances, and the topology of trees based on the experimental results. Though the published summaries of Sibley and Ahlquist’s analytical techniques have recently been defended by Diamond ( 1988)) ‘t I is abundantly clear to us that the data analysis leading to the conclusions of Sibley & Ahlquist (1985, 1987) was considerably more complex than the published accounts have indicated.
The DNA hybridization study will require full documentation and independent
DNA HYBRIDIZATION 783
Raw DNA Melt 1200-18 Papio-Pan
--E- Britten S/A data
-X- Sheldon S/A data
60 70 80
Temperature
90 I( 0
Figure 7. Experiment 120&l& a comparison of Papi0 (Cercopithecoidea) and Pan (Hominoidea). The
data communicated to us by Fred Sheldon reveal a bimodal plot; compared with the data from Roy
Britten, it appears that a transposition ofvalues has occurred, converting the smaller peak into simply a
shoulder. Such a transposition exists in five of the nine DNA melts in experiment 1200 reported in Sibley
& Ahlquist (1987). The effect of this adjustment is more extreme with taxa more distantly related. We do
not know the extent to which this type of adjustment was utilized, nor how often such a transposition
exists within the data subset (besides experiment 1200) sent to us by Britten.
replication in order to draw any reliable conclusions from it; what data we have seen indicate that a Homo-Pan clade with Gorilla as a sister group cannot readily be extracted. We have not seen evidence for the high degree of objectivity and replicability that would merit acceptance of the phylogenetic conclusion of Sibley & Ahlquist (1984, 1987).
It is debatable whether the denaturation temperatures of DNA heteroduplexes can in principle decide the phylogenetic relationships of closely related taxa such as human, chimpanzee, and gorilla (Cracraft, 1987). The possibility of representing the similarity between two highly complicated genomes adequately with a single statistic is probably no greater than the possibility of representing “intelligence” or “anatomical similarity” with a single statistic, despite the claims ofsome psychologists in the 1920s and some taxonomists in the 1960s. This does not, however, reflect unfavorably upon the use of AT simply as another distance metric, or upon the value of genetic distances generally.
In the future, greater care needs to be given to the scrutiny and presentation of DNA hybridization-based phylogenies, and particularly to the rudiments of data analysis. The low temperature end of a raw melting curve is produced by the thermal elution of
784 J. MARKS ETAL.
unhybridized DNA, divergent unhybridizable DNA, low-temperature peaks and shoul- ders [as in Figure 2(c)], poorly hybridized DNA, and AT-rich DNA. The high temperature end represents well-paired and GC-rich DNA. A TsoH median temperature simply reflects the relative sizes of these heterogeneous classes. A modal value (highest point) gives the temperature at which the greatest quantity of DNA melted. We believe that the modal temperature is the statistic of greatest biological and biochemical significance, and is therefore the statistic of choice for representing the relations of species’ unique sequence genomes by a scalar quantity (Brownell, 1983; Beldsoe, 1987; Sarich et al., ms. in press).
If one eliminates the effects of base composition differences, genomic complexity, paralogous pairing, and low-temperature peaks, then the simple median (T, or T5,,) can be highly concordant with the mode, and closely correlated with overall base-pair mismatch, as Caccone et al. (198%) have shown. Therefore, where it can be shown that there arc no low-temperature peaks, or anomalies in the shape of the raw data curve, the simple median (T, or T5,-,) may be acceptable. The T5eH statistic is unacceptable.
Finally, we wish to raise an issue about the “trichotomy” and about “breaking” it. By trichotomy, we mean the existence of a very short internodal distance on a dendrogram (outside the limits of technical resolution and leading in this case to human-chimp), relative to another, longer internodal distance (leading to human-chimp-gorilla). Most molecular studies show the latter node to be about 5 times larger than the former (Dene et al., 1976; Sarich & Cronin, 1976; Ferris et al., 1981; Hixson et al., 1986; Koop et al., 1987; Maeda et al., 1987). Yet Sibley & Ahlquist reported a difference of less than two-fold (and in the unpublished, but already cited work of Caccone & Powell (1988; Diamond, 19881 they are even more similar). To “break” the trichotomy, the nodes must be measured precisely and the relatiue branch lengths must be retained, if the evolutionary rates are similar across lineages, which appears to hold for DNA hybridization. If the internodal distance to human-chimp is not relatively short, then the gorilla split is not a very close one, although a considerable body of data suggests that it should be. In other words, one must identify a close split before resolving it. This is not merely a semantic point, but one of considerable gravity for a phenetic analysis, where phylogenetic inferences are to be based on distances, not character states. The failure to find a close split creates a major discordance between this DNA hybridization work and other phenetic studies of the hominoid primates.
Conclusions
In our analysis of a subset of Sibley and Ahlquist’s data, we find that an apparent linkage of human-chimpanzee is an artifact of the T5,H statistic, reflecting slightly greater average hybridization of human-chimpanzee than human-gorilla, but not a difference in the thermal stability of duplexes formed. Further, these data were subjected to a battery of unreported manipulations in Sibley & Ahlquist (1984, 1987), which had the principal effect of converting outlier values into inlier values. The variability we find in delta-TjoH values for any pair ofspecies is much greater than that reported in Sibley Pr Ahlquist (1984, 1987).
We feel the DNA hybridization data are ambiguous with respect to the amount of difference between the single-copy sequences of human and chimpanzee. The DNA hybridization techniques afford a good, but rough, estimate of genomic similarity, and the data we have been permitted to examine merit a conservative conclusion: that humans,
DNA HYBRIDIZATION 785
chimpanzees, and gorillas are exceedingly similar in their genetic makeup (Goodman,
1963; Sarich & Wilson, 1967).
Acknowledgements
We gratefully acknowledge the helpful comments of Patrick Foley, Randy Skelton, and John Gillespie on an early draft, Lawrence Martin, Fred Sheldon, and Tony Bledsoe on a late draft, and many anonymous reviewers. We thank as well Eric Delson, Maryellen Ruvolo, and Peter Andrews for their patience, assistance and input; and Charles Sibley, Jon Ahlquist, Roy Britten, and Emile Zuckerkandl for the opportunity and permission to examine some of the data.
References
Andrews, P. (1985). Improved timing of horn&id evolution with a DNA clock. Nature 314, 498-499.
Andrews, P. (1986). Molecular evidence for catarrhine evolution. In (B. Wood, L. Martin & P. Andrews, Eds)
:Maj,~ Topics in Primate and Human Evolution, pp. 107-129. New York: Cambridge University Press.
Benveniste, R. E. & Todaro, G. J. (1976). Evolution of type C viral genes: Evidence for Asian origin ofman. Xature
261, 101-108. Bledsoe, .4. H. (1987) DNA evolutionary rates in nine-primaried passerine birds. Mol. Biol. Euol. 4: 559-57 1.
Brownell, E. (1983). DNA/DNA hybridization studies of muroid rodents: Symmetry and rates of molecular
evolution. Em&ion 37, 1043-1051.
Caccone, A., DeSalle, R. & Powell, J. R. (1988). Calibration of the change in thermal stability of DNA duplrxcs
and degree of base pair mismatch. J. mol. Evol. 27, 212-216.
Caccone, A. & Powell, J. R. (1988). A reevaluation of higher primate phylogeny based on scnDNA. Paper
presented at the Society for the Study of Evolution meeting, June 1988.
Cantor, C. Sr Schimmel: P. (1980). Biophyszcal Chem’strv. San Francisco: W. H. Freeman.
Cracraft, J. (1987). DNA hybridization and avian phylogenetics. In (M. K. Hecht, B. Wallace & G. T. Prance.
Eds) Euolutionary Biology, Vol. 21, pp. 47-96. New York, Plenum Press.
Davidson, E. H., Hough, B. R., Amenson, C. S. & Britten, R. J. (1973). G eneral interspersion of repetitive with
non-repetitive sequence elements in the DNA of Xenopus. J. mol. Biol. 77, l-23. Deininger, P.L. & Schmid, C. W. (1976). Thermal stability of human DNA and chimpanzee DNA4
heteroduplexes. Scierrce 194, 846-848.
Den?, H. T.: Goodman, M. & Prychodko, W. (1976). Immunodiffusion evidence on the phylogeny of the
primates. In (M. Goodman & R. E. Tashian, Eds) Mol~cuiar Anthropolo~, pp. 171-196. New York: Plenum. Diamond, J. (1988). Relationships of humans to chimps and gorillas. Nature 334, 656. Felsenstein, ,J. (1987). Estimation of hominoid phylogeny from a DNA hybridization data set. J. mol. Euol. 26,
123-131.
Ferris. S. D.; Brown, W. M., Davidson, W. S. Sr Wilson, A. C. (1981). Extensive polymorphism in the
mitochondrial DNA of apes. Proc. Nat/. Acad. Sci.; USA, 78, 6319-6323.
Ferris; S. D.. Wilson, A. C. & Brown, W. M. (1981). Evolutionary tree for apes and humans based on cleal-age
maps of mitochondrial DNA. Proc. Nuti. Acud. Sci.: USA, 78, 2432-2436. Fitch, W. M. (1986). Commentary. Mol. Bioi. Euol. 3, 296298. Fox. G. M.; Umeda, J., Lee, R. K.-Y. & Schmid, C. W. (1980). A phase diagram of the binding of mismatched
duplex DNAs to hydroxyapatite. Biochim. Biop/gs. dcta 609, 364-371. Goodman, M. (1963). Serological analysis of the systematics of recent hominoids. Hum. Biol. 35, 377-436.
Hixson,J. E. 8r Brown. W. M. (1986). A comparison of the small ribosomal DNA genes from the mitochondrial
DXA of the great apes and humans: structure, evolution, and phylogenetic implications. Mol. Biol. Ecol. 3,
l-18.
Hoyer, B. H.: van de Velde, N. W., Goodman, M. & Roberts, R. B. (1972). Examination ofhominoid evolution
by DXA sequence homology. J. hum. Eooi. I, 645-649. Koop. B. F., Goodman, M., Xu: P., Chan, Ii. & Slightom, J. (1986). Primate eta-globin DNA sequences and
man’s place among the great apes. Xuture 319, 234-238.
Lewin. R. (1984). DNA reveals surprises in human family tree. Science 226, 1179-l 182.
Lewin. R. (1987). My close cousin the chimpanzee. Science 238, 273-275.
Maeda, N., Wu, C.-I.; Bliska, J. & Reneke. J. (1988). Molecular evolution ofintergenic DSA in higher primates:
Pattern of DNA changes. molecular clock, and evolution of repetitive sequences. Mol. Biol. Evol. 5, l-20.
786 J. MARKS ETAL.
Marks, J. (1983). Hominoid cytogenetics and cvoiution. Pnjs. dnt~;irii~:-YrUL~~--25, -i25-i53. Martinson, H. G. (1973). The nucleic acid-hydroxylapatite interaction. II. Phase transitions in the
deoxyribonucleic acid-hydroxylapatite system. Biochemistry 12, 145-150. O’Brien, S. J., Nash, W. G., Wildt, D. E., Bush, M. E. & Benveniste, R. E. (1985). A molecular solution to the
riddle of the giant panda’s phylogeny. Nature 317, 140-144. Pilbeam, D. (1986). Hominoid evolution and hominoid origins. Am. Anthrop. 88, 295-312. Ruvolo, M. & Smith, T. F. (1985). Phylogeny and DXA-DNA hybridization. Mol. Biol. Euol. 3, 285-289. Saitou, N. (1986). On the delta-Q test of Templeton. Mol. Biol. Euoi. 3, 282-284. Sarich, V. M. & Cronin, J. E. (1976). Molecular systematics ofthe primates. In (M. Goodman & R. E. Tashian,
Eds) Molecular Anthropologv, pp. 141-170. New York: Plenum. Sarich, V. M., Schmid, C. W. & Marks,J. (n.d.). DNA hybridization as a guide to phylogeny: A critical analysis.
Cladistics (in press). &rich, V. M. & Wilson, A. C. (1967). I mmunological time scale for hominid evolution. Science 158, 1200-1204. Schmid, C. W. & Deininger, P. L. (1975). Sequence organization of the human genome. Cell 6, 435-358. Sheldon, F. (1987). Rates of single-copy DNA evolution in herons. Mol. Biol. Euol. 4, 56-69. Sibley, C. G. & Ahlquist, J. E. (1983). Phylogeny and classification of birds based on the data of DNA-DNA
hybridization, In (R. F. Johnston, Ed.) Current Omithologv, Vol. 1, pp. 245-292. New York: Plenum Press. Sibley, C. G. & Ahlquist, J. E. (1984). The phylogeny of the hominoid primates, as indicated by DNA-DNA
hybridization. J. mol. Euol. 20, 2-15. Sibley, C. G. & Ahlquist, J. E. (1987). DNA hybridization evidence of hominoid phylogeny: Results from an
expanded data set. f. mol. Euol. 26, 99-121. Stanyon, R. & Chiarelli, B. (1982). Phylogeny of the Hominoidea: The chromosome evidence. J. hum. Evol. 11,
493-504. Templeton, A. R. (1985). The phylogeny of the hominoid primates: A statistical analysis of the DNA-DNA
hybridization data. Mol. Biol. Evol. 2, 42G433. Templeton, A. R. (1986). Further comments on the statistical analysis of DNA-DNA hybridization data. Mol.
Biol. Euol. 3, 29Q295. Vizard, D. L., Rinehart, F. P., Rubin, C. M. & Schmid, C. W. (1977). Intramolecular base composition
heterogeneity of human DNA. Nucl. Acids Res. 4, 3753-3768.