Embed Size (px)
Citation preview
DNA HELIX-STACK SWITCHING AS THE BASIS FOR THE DESIGN OF VERSATILE DEOXYRIBOSENSORS
Carlo Giovanni Sankar B.Sc., Simon Fraser University, 200 1
THESIS SUBMITTED IN PARTIAL FULFILLMENT OF THE REQUIREMENTS FOR THE DEGREE OF
MASTER OF SCIENCE
In the Department of Molecular Biology and Biochemistry
O Carlo Giovanni Sankar 2004
SIMON FRASER UNIVERSITY
Fall 2004
All rights reserved. This work may not be reproduced in whole or in part, by photocopy
or other means, without permission of the author.
SIMON FRASER UNIVERSITY
PARTIAL COPYRIGHT LICENCE The author, whose copyright is declared on the title page of this work, has granted to Simon Fraser University the right to lend this thesis, project or extended essay to users of the Simon Fraser University Library, and to make partial or single copies only for such users or in response to a request from the library of any other university, or other educational institution, on its own behalf or for one of its users.
The author has further granted permission to Simon Fraser University to keep or make a digital copy for use in its circulating collection.
The author has further agreed that permission for multiple copying of this work for scholarly purposes may be granted by either the author or the Dean of Graduate Studies.
It is understood that copying or publication of this work for financial gain shall not be allowed without the author's written permission. \
Permission for public performance, or limited permission for private scholarly use, of any multimedia materials forming part of this work, may have been granted by the author. This information may be found on the separately catalogued multimedia material and in the signed Partial Copyright Licence.
The original Partial Copyright Licence attesting to these terms, and signed by this author, may be found in the original bound copy of this work, retained in the Simon Fraser University Archive.
W. A. C. Bennett Library Simon Fraser University
Bumaby, BC, Canada
APPROVAL
Name: Carlo Giovanni Sankar
Degree: Master of Science
Title of Thesis: DNA Helix-Stack Switching as the Basis for the Design of Versatile Deoxyribosensors
Examining Committee:
Chair: Dr. N. Branda
Dr. D. Sen Senior Supervisor Professor I Departments of Molecular Biology and Biochemistry and Chemistry
Dr. P.J. Unrau Committee Member Assistant Professor Department of Molecular Biology and Biochemistry
--
Dr. H. Yu Committee Member Assistant Professor Department of Chemistry
- -
Dr. R. H. Hill Committee Member Associate Professor Department of Chemistry
Dr. J. L. Thewalt Public Examiner Associate Professor1 Departments of Molecular Biology and Biochemistry and Physics
Date Approved:&, h& 2 . 200 /, vs, -. I
ABSTRACT
The charge conduction properties of deoxyribonucleic acids (DNA) can be
harnessed for monitoring the binding of a ligand to its receptor. Here, we show how
DNA-based sensors (deoxyribosensors) consisting of a photo-activated oxidant tethered
to a receptor-containing DNA molecule can be used to monitor the presence of a ligand.
Phosphorescence measurements, reflective of changes in charge conduction to a targeted
region in these deoxyribosensors are made in the presence and absence of the test ligand.
The deoxyribosensors described here, exploit established rules for DNA helical stacking
in three-way junctions and use previously selected aptamer sequences as receptors for
target analytes. More specifically, a systematic investigation outlining the characteristics
of a deoxyribosensor for the detection of the amino acid derivative, argininamide are
presented. These results suggest a general design for deoxyribosensors for any molecular
ligand for which an aptamer sequence can be obtained. Also, a new methodology for
investigating helical stacking of nucleic acids of unknown tertiary structure, such as
DNAzymes or RNAzymes is discussed.

DEDICATION
This thesis is dedicated to my family. Through our toughest times we have been
there for each other and I could not have accomplished this with out your support,
patience and motivation.
ACKNOWLEDGEMENTS
I would like to express my utmost gratitude to my senior supervisor Dr. Dipankar Sen for his relentless support, patience and guidance throughout my graduate studies. Dr. Sen has been an extraordinary mentor and friend; his passion for science, open mindedness and willingness to explore new frontiers, has given me the opportunity to be part of a very stimulating research environment.
Dr. Peter J. Unrau for helpful discussions, friendship and support throughout my graduate studies.
Dr. Hogan Yu for his helpful discussions, friendship, sense of humour and optimism throughout my graduate studies.
Dr. Ross H. Hill and Dr. Jenifer L. Thewalt for their patience and support in putting together this thesis.
Dr. Richard Fahlman for training me in the lab, his friendship and helpful discussions. Dr. Fahlman's input on the work presented in this thesis was invaluable.
Past and present members of the Sen Lab for their friendship and helpful discussions; Richard Fahlman, Anat Feldman, Dennis Wang, Dan Chinnapen, Yong Liu, Ed Leung, Kelly Cadiuex, Yi-Jeng (Y.J.) Huang, Becky Thorne and Hyun-Wu Lee.
My collaborators from the Yu Lab; Chuan-Yun Luo, Lily Su and Navanita Sarrna.
Koman Joe for his and help with the HPLC, his friendship and helpful discussions.
Everyone in the MBB Department, especially: Leslie Mitchell, Dan Chinnapen, Himani Hutkhede, Ashvinder Bhogal, Carlo Artieri, Amit Goel, Will Hsiao, Jim Stewart, Laila Singh, Kush Dalal, Jillian Smith, Michael Ng, Luis Del Rio, Anat Feldman, Alfredo Menendez, Marinieve Montero, Melita Irving, Bari Zahedi, Minna Roh, Wendy Lee, Andrea Uetrecht, Yong Liu, Jackie Watson, Jay Cadiuex, Alex Ebhardt, Hani Zaher, Victor Lundin, Peter Stirling, Michel Leroux, Linda Pinto, Anna Gifford, Dev Sharma, Bruce Brandhorst, Willie Davidson, Evelyn Davidson, Ingrid Northwood, Andy Yim and Jenny Lum.
The Gang: Ferdinand Bancosta, Sheldon Hu, Rizwan Mohamed, Ramil Javerina, Hanna de Guzman and Ken Fung. You are my friends for life.
Last but definitely not least, my family; for their support, patience and motivation. Thank you mom, dad and Diana.
TABLE OF CONTENTS
.. Approval ........................................................................................................................... 11
... Abstract .......................................................................................................................... 111
Dedication ......................................................................................................................... iv
Acknowledgements ............................................................................................................ v
............................................................................................................. Table of Contents vi .. .................................................................................................................. List of Figures vn . .
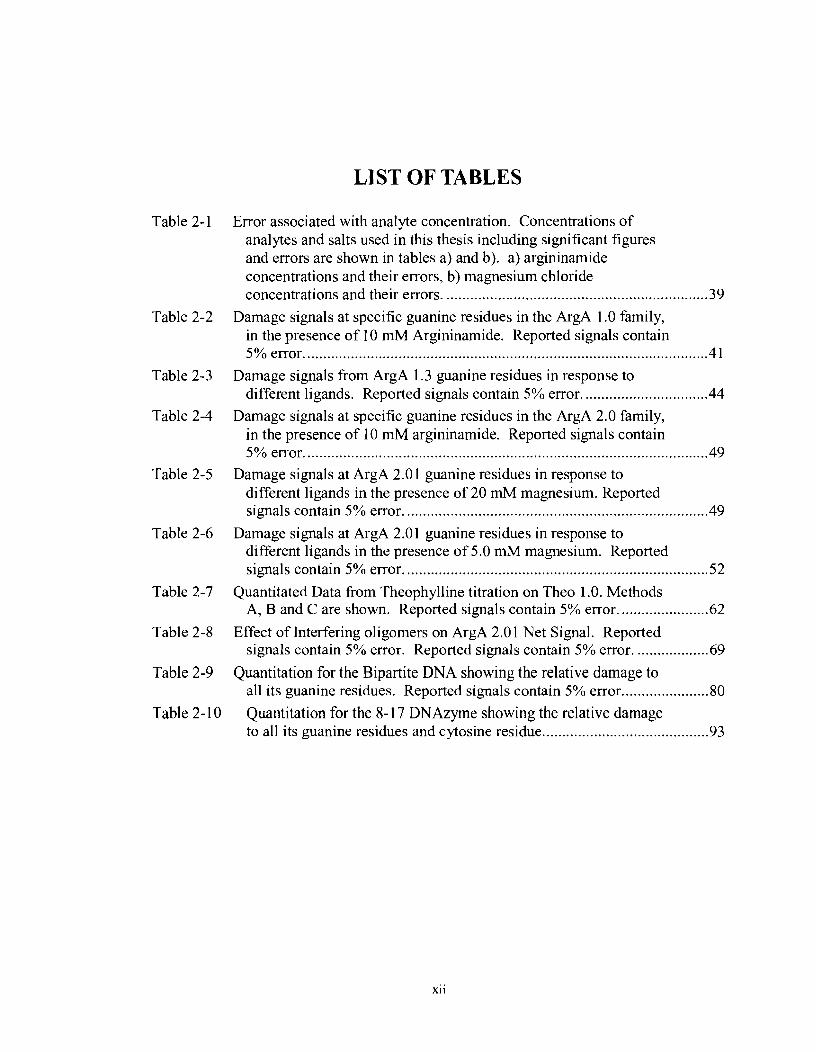
List of Tables ................................................................................................................... xi1 ...
List of Abbreviations ..................................................................................................... xlll
Chapter 1: Introduction ............................................................................................... 1
............................................................................................... 1.1 The Role of DNA 1 1.2 DNA Structure and Properties ........................................................................... 3
................................................................ 1.2.1 Structure of the DNA Double Helix 6 ........................................................... 1.2.2 DNA Structures of Higher Complexity 8
............................................................................... 1.2.3 Charge Transfer in DNA 1 8 ........................................................................ 1.2.4 Monitoring Charge Transport 23
Chapter 2: General Electrical Biosensors made of DNA ........................................ 28 ..................................................................................................... 2.1 Introduction -28
2.2 Materials and Methods ..................................................................................... 33 ................................................................................. 2.2.1 DNA Oligonucleotides -33
............................................................................................. 2.2.2 Photoirradiation 35 ................................................................................................. 2.2.3 Data Analysis 36
........................................................................................ 2.2.4 Experimental Error 37 2.3 Results and Discussion .................................................................................... 39
2.3.1 An electrical Switch modulated by Argininamide: The ArgA 1.0 ....................................................................................................... Family -39
.................................................................................... 2.3.2 The ArgA 2.0 Family 46 2.3.3 Expanding the versatility of the ArgA 2.0 Deoxyribosensor ........................ 57
................... 2.3.4 Further Optimization of the Signal to Noise ratio in ArgA 2.0 1 65 2.4 Structure Probing of DNAzyrnes Using Charge Transport ............................. 72
..................................................... 2.4.1 Introduction and Experimental Approach 72 ................................ 2.4.2 Probing for Helical-Ann stacking Partners in Bipartite 74
....................................... 2.4.3 Probing for Helical-Arm stacking Partners in 8- 17 80
Chapter 3: Conclusions ............................................................................................... 94
References ....................................................................................................................... 100
LIST OF FIGURES
Figure 1 - 1
Figure 1-2
Figure 1-3
Figure 1-4
Figure 1-5
Figure 1-6
Figure 1-7
Figure 1-8
Figure 1-9
Figure 2- 1
Figure 2-2
The elements of DNA: a) Nomenclature for the assignment of positions in the nitrogenous bases and sugar; b) Watson-Crick base pairing in DNA. Strand Polarity is indicated as (+) or (-), which represent the backbone going into or coming out of the plane respectively. Strand polarity is defined as the backbone going into the page in the 3'to 5' direction and is designated (+). R represents the deoxyribose sugar. ................................................................................. .2 A simplified scheme for SELEX. This scheme outlines the steps involved in selecting a DNA molecule which binds Ligand (L). Nucleic acid molecules of this type are referred to as "aptamers". .............. 4
Models of double stranded DNA. The three families of double helices are shown; the A,B and Z-type helices. A view looking down the top of the helix is included above each model. Yellow represent the sugar and phosphate backbone and purple represent the nitrogenous bases. Models were constructed using the freeware program Jmol (http://jmol.sourceforge.net/). ............................................... 8 Common DNA (as well as RNA) secondary structure motifs. .................. 10
Some examples of non-Watson & Crick base pairs. Two columns are shown (SYNIANTI), depicting the relative configuration of the bases about the glycosidic bond. ................................................................ 12 Variability of the Glycosidic Bond. The normal conformation about the glycosidic bond is the ANTI, found in the Watson-Crick . . base painng conformation. ......................................................................... 13 Schematic of a three-way junction with two unpaired bases and its conformers. a) Upon addition of divalent cations, the bulged three- way junction undergoes a conformational change where b) two conformers are possible. Model is based on (Lilley 2000). ...................... 17
The Pyrimidine Rule for defining stacking partners in a three-way junction with a two nucleotide bulge. The identity of the penultimate base pair on the stem opposite the two base pair bulge determines which arms stack on which. Model is based on (van Buuren et al. 2000). .................................................................................... 18
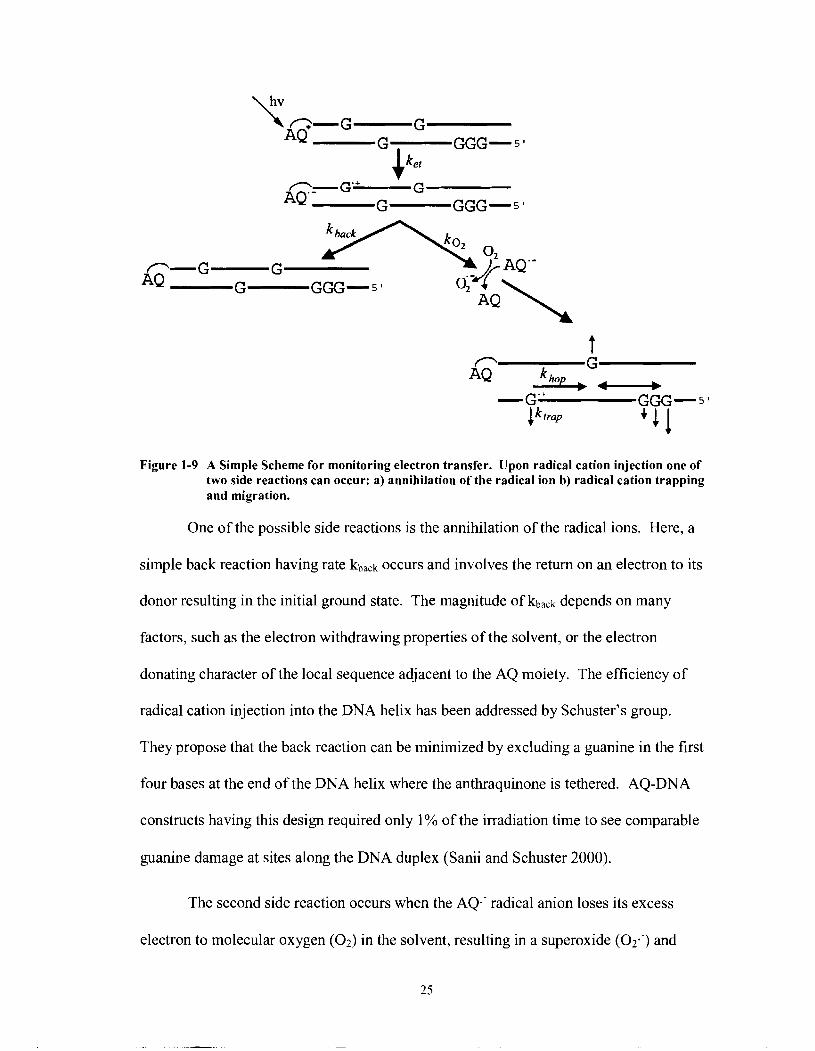
A Simple Scheme for monitoring electron transfer. Upon radical cation injection one of two side reactions can occur: a) annihilation
....................... of the radical ion b) radical cation trapping and migration. 25 ............................................. Design for two classes of deoxyribosensors. 3 1
Secondary structure of the argininamide aptamer and its ligand L- . . argininamide. .............................................................................................. 32
Figure 2-3
Figure 2-4
Figure 2-5
Figure 2-6
Figure 2-7
Figure 2-8
Figure 2-9 Figure 2- 10
Figure 2-1 1
The ArgA 1.0 Family. a) The secondary structure of the coupled deoxyribosensor construct ArgA 1 .O, incorporating the DNA aptamer for ArgA. b) Junction base pairs for variant members of the ArgA 1.0 family sensors.. .................................................................... -40
Electrophoretic gel for construct ArgA 1.3. Guanine damage patterns for the deoxyribosensors ArgA 1.3 in the presence and absence of light as well as of different analyst, including L- argininamide (ArgA); L-arginine (Arg); L-lysine(Lys); and spermidine (Spd). Reference C+T and G ladders are shown to the left. Dark indicates a sample not exposed to either analyte or light; 0 indicates a sample not incubated with analyte but exposed to light like the other samples shown in the gel. To the right, construct ArgA 1.3. .................................................................................................... 42 Chemical structures of a) L-argininamide, b) L-arginine, c) L- lysine and d) spermidine. .......................................................................... .45 The ArgA 2.0 Family. (a) Junction base-pairs for variant members of the ArgA 2.0 family of sensors. (b) Left, gel showing guanine damage patterns in the deoxyribosensor construct ArgA 2.01, in the presence and in the absence of light as well as of different analytes, including L-argininamide (ArgA); L-arginine (Arg); L-lysine (Lys); and, spermidine (Spd). Reference C + T and G ladders are shown to the left. Dark indicates a sample not exposed to either analyte or light; 0 indicates a sample not incubated with any analyte, but exposed to light like the other samples shown in the gel. Right, the secondary structure of the deoxyribosensor, ArgA
G8 damage dependence on magnesium chloride concentration for construct ArgA 2.0 1. Damage signals for a particular concentration were obtained in the presence or absence of 10 mM ArgA and the fold increase in G8 damage is reported. Reported signals contain 5% error. ............................................................................ 50
Gels of Temperature dependence on G8 Damage for Construct ArgA 2.01. Three different temperatures are represented, 4"C, 19•‹C and 37•‹C. Samples irradiated in the presence (+) or absence of argininamide (-). .................................................................................... 53 Temperature Dependence on G8 Cleavage in ArgA 2.01. ......................... 53 Guanine damage patterns in deoxyribosensor construct ArgA 2.01 in response to titration with increasing concentrations of L- argininamide (ArgA). ................................................................................ -55
Response signals from analyte binding (measured as the ratio of oxidative damage at G8 in the deoxyribosensor construct ArgA 2.01 in the presence versus absence of added analyte) as functions of analyte concentrations.. ......................................................................... -56
Figure 2- 12
Figure 2- 1 3
Figure 2- 14
Figure 2- 15
Figure 2- 16
Figure 2- 17
Figure 2- 1 8
Figure 2-19
Figure 2-20
Figure 2-2 1
Figure 2-22
Figure 2-23
Figure 2-24
Structure of the theophylline deoxyribosensor, Theo 1.0 along with the structure of its cognate ligand and closely related analog, caffeine. .................................................................................................... ..59
Theophylline titration on construct Theo 1 .O. ............................................ 60
Constructs for the Theo Thru 1.0 sensor and their controls. In red are the aptamer regions, upper case represents DNA nucleotides and lower case represents RNA nucleotides, a brake in a line indicate where a strand nick is located. ...................................................... 63
Thru Theo 1.0 and control constructs. Gels depicting a theophylline titration, and general charge transport in the control variants. ...................................................................................................... 65
A model conceptualizing "Signal Enhancement of Nucleic Acid Biosensors Using Small Oligomers". A short oligonucleotide complementary to the aptamer sequence is added to perturb the initial deoxyribosensor conformation in the absence of the ligand argininamide. The interfering oligo would serve as to minimize the amount of charge transfer to the detector stem in the absence of ligand and thus lower the background signal. ............................................ 67
Arg 2.0 1 construct and set of Interfering oligomers. The six asterix at the tip of the aptamer region show how ArgI-6 would bind to the Arg 2.0 1 construct. The rest of the ArgI family variants would then advance towards the junction of the construct in two . . nucleotide increments. .............................................................................. ..68
Gels depicting the effect of an interfering oligomer on the net signal produced by construct Arg 2.0 1. The arrow refers to position G8, nucleotide number 8 from the 5'end of the aptamer- containing strand. +/- Refer to the presence or absence of . . Argininamide.. ........................................................................................... .7 1 Secondary structure of RNA cleaving DNA enzymes. Top: the "Bipartite" DNAzyrne, Bottom: the "8- 17" DNAzyrne. The arrows indicate where the DNAzymes cleave their RNA substrate. The conserved enzymatic core for "8- 17" is highlighted in blue, the conserved enzymatic core for "Bipartite" is the entire loop, commencing at A and ending at C. ............................................................ 74
Damage Patterns for the Bipartite DNA enzyme. See text for explanation. ................................................................................................ 76
Graphical representation outlining the damage patterns for G33 in Bipartite. Reported signals contain 5% error. ........................................... 78
Graphical representation outlining the damage patterns for G3 1 in Bipartite. Reported signals contain 5% error. ........................................... 78
Graphical representation outlining the damage patterns for G27 in ........................................... Bipartite. Reported signals contain 5% error. 79
Graphical representation outlining the damage patterns for G 16 in Bipartite. Reported signals contain 5% error. ........................................... 79
Figure 2-25 Graphical representation outlining the damage patterns for G22 in Bipartite. Reported signals contain 5% error. ........................................... 80
Figure 2-26 Damage Patterns for the 8-1 7 DNAzyme. See Text for explanation. ............................................................................................... .83
Figure 2-27 Graphical representation outlining the damage patterns for G30 in the 8- 17 DNAzyme. Reported signals contain 5% error. .......................... 84
Figure 2-28 Graphical representation outlining the damage patterns for G28 in the
Figure 2-29
Figure 2-30
Figure 2-3 1
Figure 2-32
Figure 2-33
Figure 2-34
Figure 2-35
Figure 2-36
Figure 2-37
Figure 2-38
Figure 2-39
Figure 2-40
Figure 3-1
8- 17 DNAzyme. Reported signals contain 5% error. ................................ 84
Graphical representation outlining the damage patterns for G25 in the 8-1 7 DNAzyme. Reported signals contain 5% error. ........................... 85 Graphical representation outlining the damage patterns for G22 in the 8- 17 DNAzyme. Reported signals contain 5% error ........................... 85 Graphical representation outlining the damage patterns for G2 1 in the 8- 1 7 DNAzyme. Reported signals contain 5% error. ......................... .86
Graphical representation outlining the damage patterns for G 18 in .......................... the 8- 17 DNAzyme. Reported signals contain 5% error. 86
Graphical representation outlining the damage patterns for G16 in the 8- 1 7 DNAzyme. Reported signals contain 5% error. ......................... .87
Graphical representation outlining the damage patterns for G12 in the 8-17 DNAzyme. Reported signals contain 5% error ........................... 87
Graphical representation outlining the damage patterns for G 10 in the 8- 17 DNAzyme. Reported signals contain 5% error. .......................... 88
Graphical representation outlining the damage patterns for G8 in the 8-1 7 DNAzyme. Reported signals contain 5% error. .......................... 88
Graphical representation outlining the damage patterns for G7 in the 8- 17 DNAzyme. Reported signals contain 5% error. .......................... 89
Graphical representation outlining the damage patterns for G6 in the 8- 17 DNAzyme. Reported signals contain 5% error. .......................... 89
Graphical representation outlining the damage patterns for C24 in the 8- 17 DNAzyme. Reported signals contain 5% error.. ........................ .90
FRET model of the 8-1 7 DNA enzyme. Figure is based on (Liu and Lu 2002). This schematic demonstrates a two-step folding process in the presence of the divalent cation zinc. The magnitude of the conformational change in this DNAzyme reflects the damage patterns of oxidative damage where in place of the green fluorophor, the AQ moiety is covalently tethered. ..................................... 91
A schematic showing two possible modes of attachment of a deoxyribosensor to the conductive surface of a chip (indicated as gold). Ox refers to a tethered redox-active species to initiate charge transfer. Left: this mode would permit the monitoring of charge flow in the designated detector arm of the sensor; however, charge flow through specific guanine residues at other locations in the
sensor could be monitored by direct attachment of such guanine residues to the conductive surface (right). ................................................. 96
LIST OF TABLES
Table 2-1
Table 2-2
Table 2-3
Table 2-4
Table 2-5
Table 2-6
Table 2-7
Table 2-8
Table 2-9
Table 2- 10
Error associated with analyte concentration. Concentrations of analytes and salts used in this thesis including significant figures and errors are shown in tables a) and b). a) argininamide concentrations and their errors, b) magnesium chloride concentrations and their errors. .................................................................. 39
Damage signals at specific guanine residues in the ArgA 1.0 family, in the presence of 10 mM Argininamide. Reported signals contain 5% error ...................................................................................................... 41
Damage signals from ArgA 1.3 guanine residues in response to different ligands. Reported signals contain 5% error. ............................... 44
Damage signals at specific guanine residues in the ArgA 2.0 family, in the presence of 10 mM argininamide. Reported signals contain
.................................................................................................... 5% error. -49 Damage signals at ArgA 2.0 1 guanine residues in response to
different ligands in the presence of 20 mM magnesium. Reported signals contain 5% error. ............................................................................ 49
Damage signals at ArgA 2.0 1 guanine residues in response to different ligands in the presence of 5.0 mM magnesium. Reported signals contain 5% error. ............................................................................ 52
Quantitated Data from Theophylline titration on Theo 1 .O. Methods A, B and C are shown. Reported signals contain 5% error. ...................... 62
Effect of Interfering oligomers on ArgA 2.0 1 Net Signal. Reported signals contain 5% error. Reported signals contain 5% error. .................. 69
Quantitation for the Bipartite DNA showing the relative damage to all its guanine residues. Reported signals contain 5% error ...................... 80
Quantitation for the 8-1 7 DNAzyme showing the relative damage to all its guanine residues and cytosine residue .......................................... 93
xii
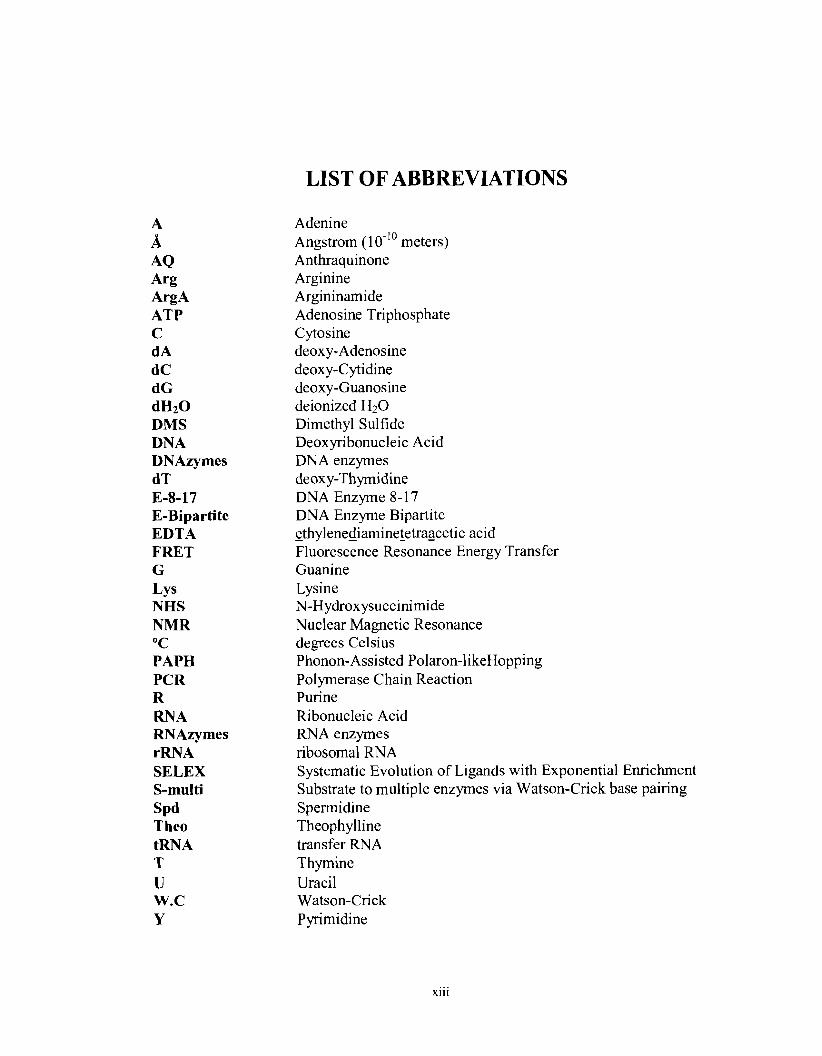
LIST OF ABBREVIATIONS
A A AQ Arg ArgA ATP C dA dC dG dHzO DMS DNA DNAzymes dT E-8- 17 E-Bipartite EDTA FRET G
LY s NHS NMR "C PAPH PCR R RNA RNAzymes rRNA SELEX S-multi S P ~ Theo tRN A T u W.C Y
Adenine Angstrom (1 0-'O meters) Anthraquinone Arginine Argininamide Adenosine Triphosphate Cytosine deoxy-Adenosine deoxy-Cytidine deoxy-Guanosine deionized H 2 0 Dimethyl Sulfide Deoxyribonucleic Acid DNA enzymes deoxy-Thymidine DNA Enzyme 8- 17 DNA Enzyme Bipartite ethylenediamineietragcetic acid - Fluorescence Resonance Energy Transfer Guanine Lysine N-Hydroxysuccinimide Nuclear Magnetic Resonance degrees Celsius Phonon-Assisted Polaron-IikeHopping Polymerase Chain Reaction Purine Ribonucleic Acid RNA enzymes ribosomal RNA Systematic Evolution of Ligands with Exponential Enrichment Substrate to multiple enzymes via Watson-Crick base pairing Spermidine Theophylline transfer RNA Thymine Uracil Watson-Crick Pyrimidine
CHAPTER 1: INTRODUCTION AND BACKGROUND
1.1 Chapter Overview
The material in this chapter is intended to give a brief background of the work
presented in this thesis. The thesis work combines three well-studied areas of nucleic
acids; nucleic acid aptamers, properties of three-way junctions and charge transfer
through the DNA helix. These characteristics of nucleic acids are exploited to produce
biosensors made of DNA (deoxynbosensors). This chapter takes DNA out of its typical
biological role and describes it in an in vitro setting. Fundamental nucleic acid structures
and properties are introduced to emphasize the structural variability of DNA giving rise
to unique structures such as aptamers. Also, background information on the
conformational variability of branched DNA, specifically of three-way DNA junctions, is
described. The chapter concludes with a background on the phenomenon of charge
transport in DNA, the key process for signal detection of the deoxyribosensors presented
in this thesis.
1.2 The Biological Role of DNA
In the central dogma of molecular biology, the role that comes to mind for DNA
is one for the storage of genetic information; which is the starting point for the passage of
information: DNA-RNA-Protein. The ground-breaking discovery of the structure of
DNA as a double helix in 1953 by Watson and Crick ultimately elucidated how DNA
was replicated and transcribed (Watson and Crick 1953). The cornplemetary base pairing
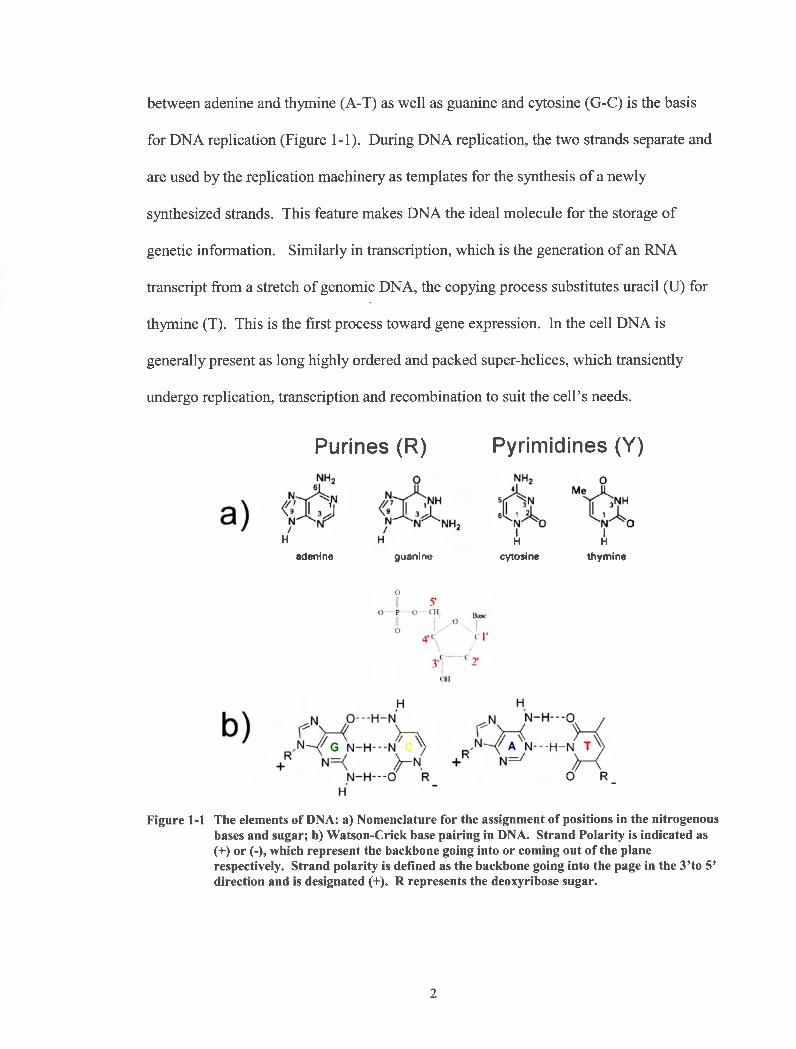
between adenine and thymine (A-T) as well as guanine and cytosine (G-C) is the basis
for DNA replication (Figure 1 - 1). During DNA replication, the two strands separate and
are used by the replication machinery as templates for the synthesis of a newly
synthesized strands. This feature makes DNA the ideal molecule for the storage of
genetic information. Similarly in transcription, which is the generation of an RNA
transcript from a stretch of genomic DNA, the copying process substitutes uracil (U) for
thymine (T). This is the first process toward gene expression. In the cell DNA is
generally present as long highly ordered and packed super-helices, which transiently
undergo replication, transcription and recombination to suit the cell's needs.
Purines (R)
H
adenine guanine
Pyrimidines (Y)
li cytosine
li thymine
Figure 1-1 The elements of DNA: a) Nomenclature for the assignment of positions in the nitrogenous bases and sugar; b) Watson-Crick base pairing in DNA. Strand Polarity is indicated as (+) or (-), which represent the backbone going into or coming out of the plane respectively. Strand polarity is defined as the backbone going into the page in the 3'to 5' direction and is designated (+). R represents the deoxyribose sugar.
1.3 DNA Structure and Properties
Aside from being the molecule of choice for the storage of genetic material, DNA
(as well as RNA) offers a plethora of structural and physical properties which can be
exploited in vitro. Given the opportunity, DNA as a class of molecules, has the potential
to offer structural variability by adopting complex three-dimensional conformations
giving this family of molecules properties typically not associated with DNA. In the field
of nucleic acids, in vitro selection, or SELEX (Systematic Evolution of Ligands with
Exponential enrichment) has empowered researchers to obtain such complexly folded
DNA molecules having properties typically not associated with them. Some of these
DNA molecules that have been obtained through SELEX have catalytic properties
(DNAzymes or if RNA, RNAzymes) and ligand binding sequences called aptamers. An
aptamer is a DNA molecule that has the property of binding its cognate ligand with high
specificity and affinity. This name is an amalgamation of the Latin word "aptus",
meaning to fit and the Greek word "mer" meaning parts or units. A simplified example
for the selection of a DNA sequence, which binds a Ligand (L), is described in Figure
1-2.
DNAs with no affinity for the Ligand (L) pass through
different synthetic DNA sequences N= 30
Ligand (L) is bound to a column with a linker of choice.
- Elute bound DNA with free Ligand (L) 1 ' -
Amplification of Ligand (L) binding DNAs by Polymerase Chain Reaction
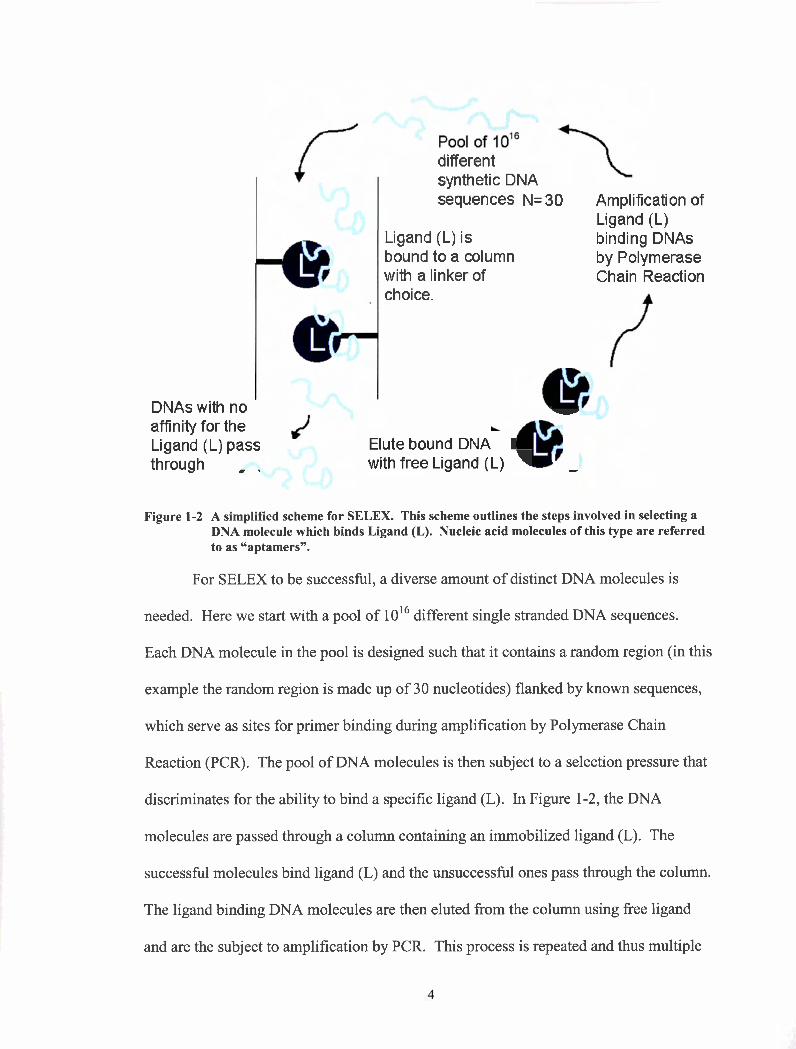
Figure 1-2 A simplified scheme for SELEX. This scheme outlines the steps involved in selecting a DNA molecule which binds Ligand (L). Nucleic acid molecules of this type are referred to as "aptamers".
For SELEX to be successful, a diverse amount of distinct DNA molecules is
needed. Here we start with a pool of 1016 different single stranded DNA sequences.
Each DNA molecule in the pool is designed such that it contains a random region (in this
example the random region is made up of 30 nucleotides) flanked by known sequences,
which serve as sites for primer binding during amplification by Polymerase Chain
Reaction (PCR). The pool of DNA molecules is then subject to a selection pressure that
discriminates for the ability to bind a specific ligand (L). In Figure 1-2, the DNA
molecules are passed through a column containing an immobilized ligand (L). The
successful molecules bind ligand (L) and the unsuccessful ones pass through the column.
The ligand binding DNA molecules are then eluted from the column using free ligand
and are the subject to amplification by PCR. This process is repeated and thus multiple
rounds of "selection" are performed to obtain a DNA sequence(s) that bind the ligand
with high specificity and affinity.
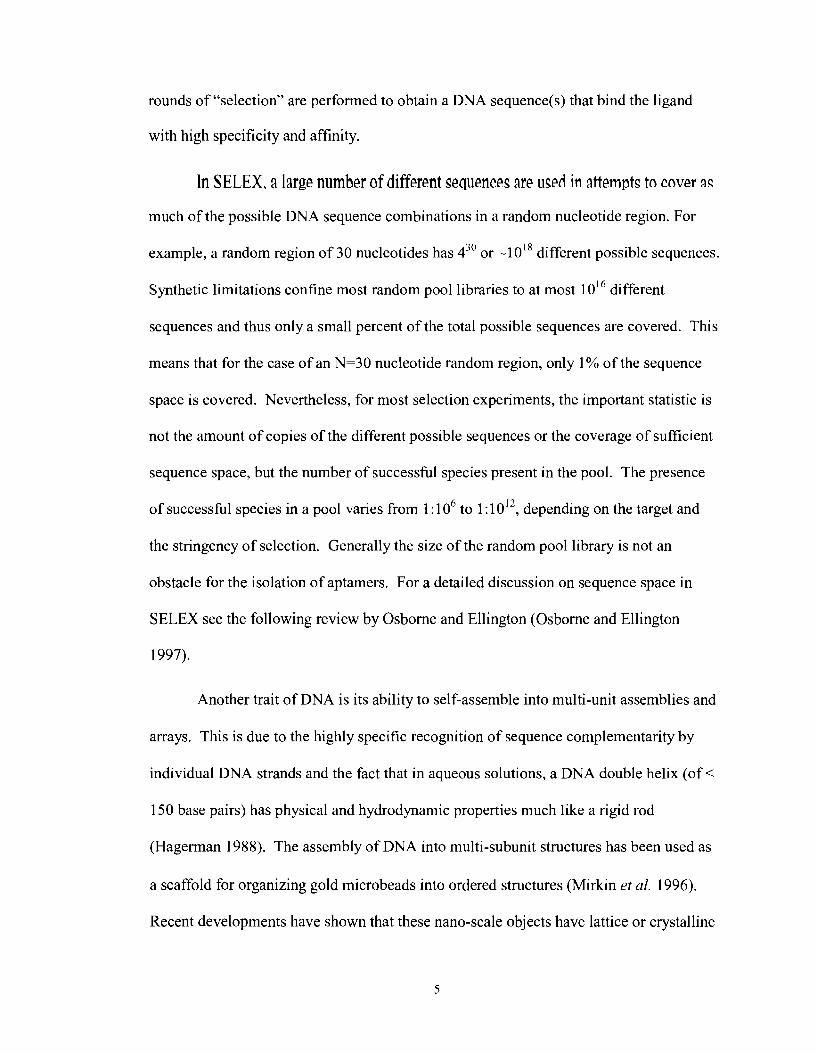
In SELEX, a large number of different sequences are used in attempts to cover as
much of the possible DNA sequence combinations in a random nucleotide region. For
example, a random region of 30 nucleotides has 4" or -10'' different possible sequences.
Synthetic limitations confine most random pool libraries to at most 10'"ifferent
sequences and thus only a small percent of the total possible sequences are covered. This
means that for the case of an N=30 nucleotide random region, only 1% of the sequence
space is covered. Nevertheless, for most selection experiments, the important statistic is
not the amount of copies of the different possible sequences or the coverage of sufficient
sequence space, but the number of successful species present in the pool. The presence
of successful species in a pool varies from 1 : 1 o6 to 1 : 1 012, depending on the target and
the stringency of selection. Generally the size of the random pool library is not an
obstacle for the isolation of aptamers. For a detailed discussion on sequence space in
SELEX see the following review by Osborne and Ellington (Osborne and Ellington
1997).
Another trait of DNA is its ability to self-assemble into multi-unit assemblies and
arrays. This is due to the highly specific recognition of sequence complementarity by
individual DNA strands and the fact that in aqueous solutions, a DNA double helix (of <
150 base pairs) has physical and hydrodynamic properties much like a rigid rod
(Hagerman 1988). The assembly of DNA into multi-subunit structures has been used as
a scaffold for organizing gold microbeads into ordered structures (Mirkin et al. 1996).
Recent developments have shown that these nano-scale objects have lattice or crystalline
like structure (Paukstelis et al. 2004). For a more detailed discussion on nano-scale
objects made of DNA see the following reviews by Seeman (Seeman 1999; Seeman
2003; Seeman 2003).
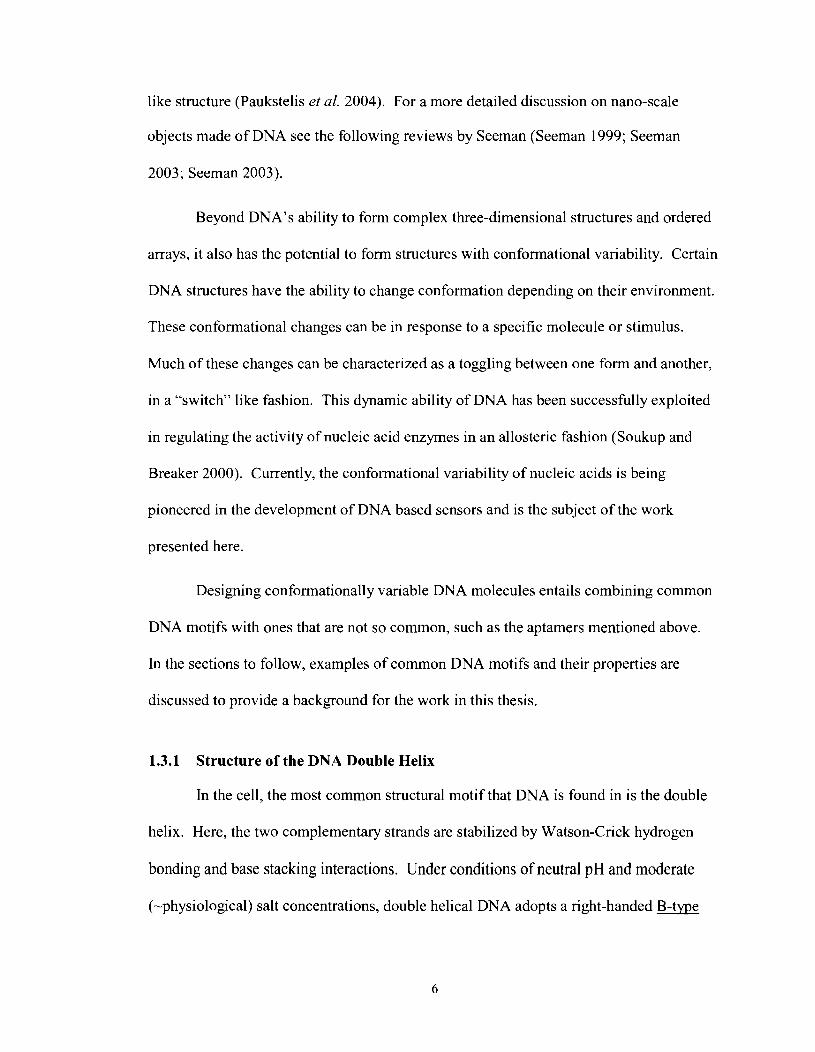
Beyond DNA's ability to form complex three-dimensional structures and ordered
arrays, it also has the potential to form structures with conformational variability. Certain
DNA structures have the ability to change conformation depending on their environment.
These conformational changes can be in response to a specific molecule or stimulus.
Much of these changes can be characterized as a toggling between one form and another,
in a "switch" like fashion. This dynamic ability of DNA has been successfully exploited
in regulating the activity of nucleic acid enzymes in an allosteric fashion (Soukup and
Breaker 2000). Currently, the conformational variability of nucleic acids is being
pioneered in the development of DNA based sensors and is the subject of the work
presented here.
Designing conformationally variable DNA molecules entails combining common
DNA motifs with ones that are not so common, such as the aptamers mentioned above.
In the sections to follow, examples of common DNA motifs and their properties are
discussed to provide a background for the work in this thesis.
1.3.1 Structure of the DNA Double Helix
In the cell, the most common structural motif that DNA is found in is the double
helix. Here, the two complementary strands are stabilized by Watson-Crick hydrogen
bonding and base stacking interactions. Under conditions of neutral pH and moderate
(-physiological) salt concentrations, double helical DNA adopts a right-handed B-type
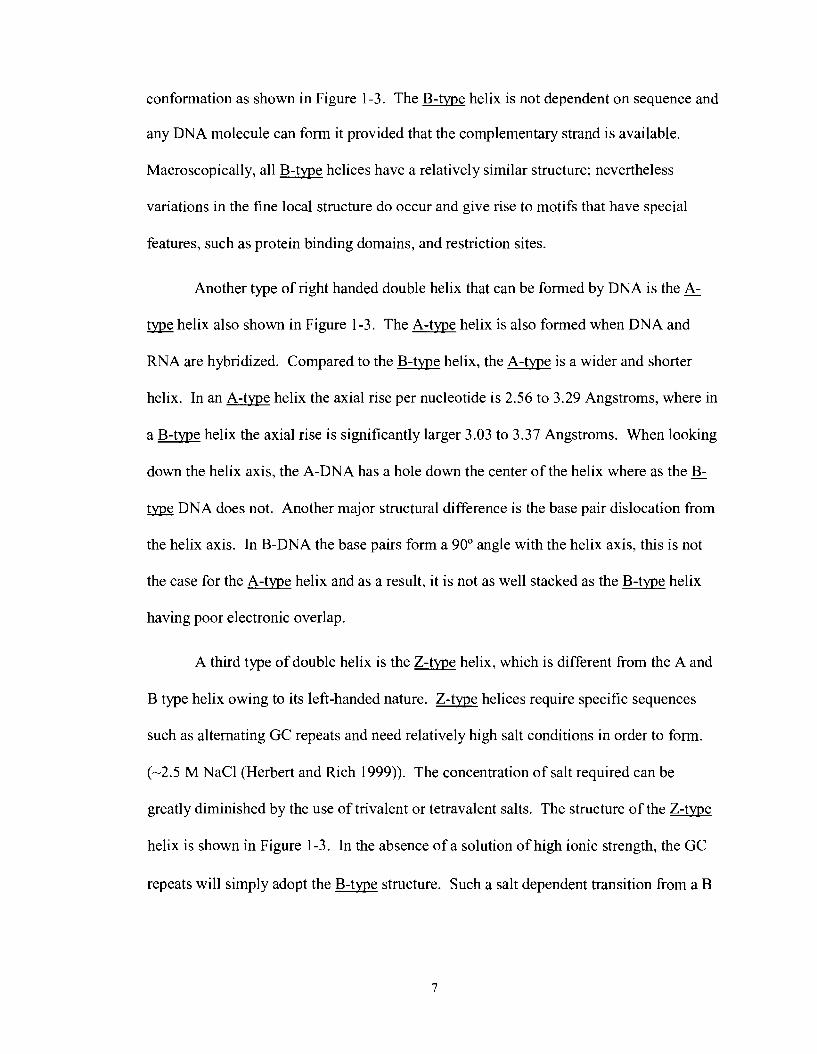
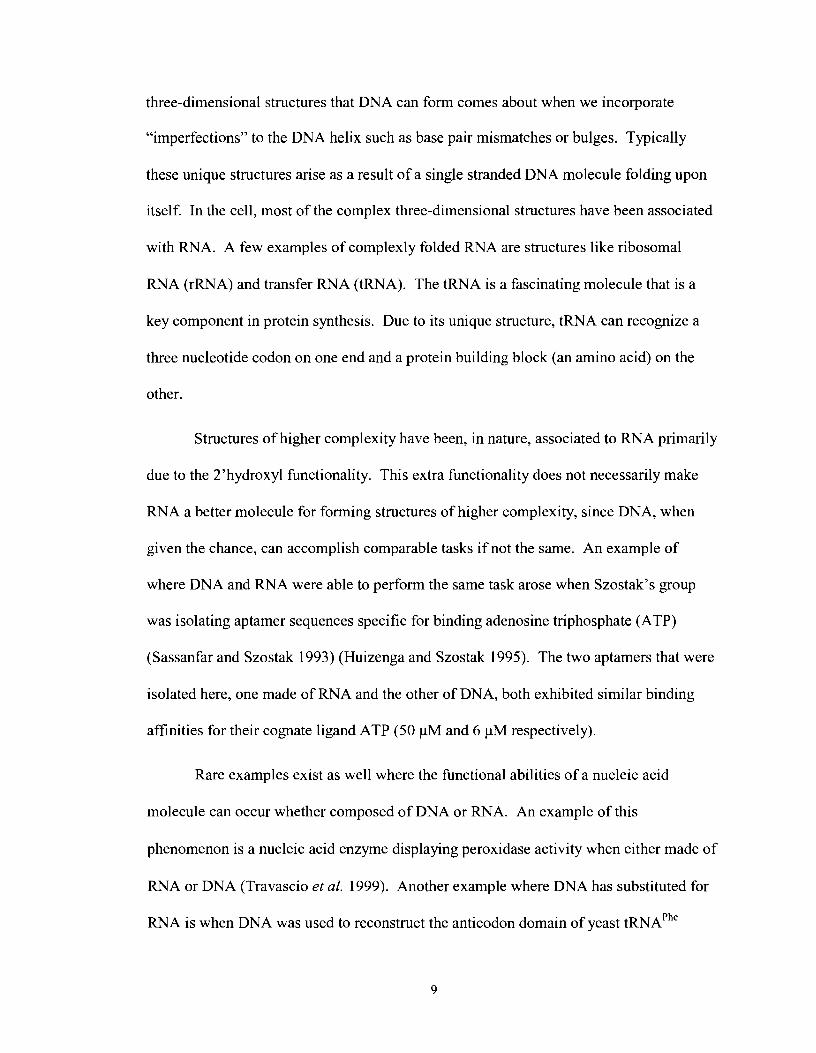
conformation as shown in Figure 1-3. The B-type helix is not dependent on sequence and
any DNA molecule can form it provided that the complementary strand is available.
Macroscopically, all B-type helices have a relatively similar structure; nevertheless
variations in the fine local structure do occur and give rise to motifs that have special
features, such as protein binding domains, and restriction sites.
Another type of right handed double helix that can be formed by DNA is the A-
= helix also shown in Figure 1-3. The A-type helix is also formed when DNA and
RNA are hybridized. Compared to the B-type helix, the A-type is a wider and shorter
helix. In an A-tme helix the axial rise per nucleotide is 2.56 to 3.29 Angstroms, where in
a B-type helix the axial rise is significantly larger 3.03 to 3.37 Angstroms. When looking
down the helix axis, the A-DNA has a hole down the center of the helix where as the 5
DNA does not. Another major structural difference is the base pair dislocation from
the helix axis. In B-DNA the base pairs form a 90" angle with the helix axis, this is not
the case for the A-type helix and as a result, it is not as well stacked as the B-type helix
having poor electronic overlap.
A third type of double helix is the Z-type helix, which is different from the A and
B type helix owing to its left-handed nature. Z-type helices require specific sequences
such as alternating GC repeats and need relatively high salt conditions in order to form.
(-2.5 M NaCl (Herbert and Rich 1999)). The concentration of salt required can be
greatly diminished by the use of trivalent or tetravalent salts. The structure of the Z-type
helix is shown in Figure 1-3. In the absence of a solution of high ionic strength, the GC
repeats will simply adopt the B-type structure. Such a salt dependent transition from a B
to a Z -type helix has been exploited in the rational design of a DNA mechanical switch
(Mao et al. 1999).
Major Groove
p v inor or Groove
5 Minor Groove
t . Major Groove 1
Figure 1-3 Models of double stranded DNA. The three families of double helices are shown; the A,B and Z-type helices. A view looking down the top of the helix is included above each model. Yellow represent the sugar and phosphate backbone and purple represent the nitrogenous bases. Models were constructed using the freeware program Jmol (http://jmol.sourceforge.net/).
1.3.2 DNA Structures of Higher Complexity
The structure of three different families of double helical DNA has been
introduced. In the cell, DNA exists primarily as a double helix. The myriad of complex,
three-dimensional structures that DNA can form comes about when we incorporate
"imperfections" to the DNA helix such as base pair mismatches or bulges. Typically
these unique structures arise as a result of a single stranded DNA molecule folding upon
itself. In the cell, most of the complex three-dimensional structures have been associated
with RNA. A few examples of complexly folded RNA are structures like ribosomal
RNA (rRNA) and transfer RNA (tRNA). The tRNA is a fascinating molecule that is a
key component in protein synthesis. Due to its unique structure, tRNA can recognize a
three nucleotide codon on one end and a protein building block (an amino acid) on the
other.
Structures of higher complexity have been, in nature, associated to RNA primarily
due to the 2'hydroxyl functionality. This extra functionality does not necessarily make
RNA a better molecule for forming structures of higher complexity, since DNA, when
given the chance, can accomplish comparable tasks if not the same. An example of
where DNA and RNA were able to perform the same task arose when Szostak's group
was isolating aptamer sequences specific for binding adenosine triphosphate (ATP)
(Sassanfar and Szostak 1993) (Huizenga and Szostak 1995). The two aptamers that were
isolated here, one made of RNA and the other of DNA, both exhibited similar binding
affinities for their cognate ligand ATP (50 pM and 6 pM respectively).
Rare examples exist as well where the functional abilities of a nucleic acid
molecule can occur whether composed of DNA or RNA. An example of this
phenomenon is a nucleic acid enzyme displaying peroxidase activity when either made of
RNA or DNA (Travascio et al. 1999). Another example where DNA has substituted for
RNA is when DNA was used to reconstruct the anticodon domain of yeast ~RNA'~'
(Basti et al. 1996). For the resulting structure to be functional, some modifications had to
be made to the DNA molecule. This lack of functionality shouldn't be regarded as DNA
being inferior in its ability to form more complex functional structures because yeast
~RNA'~" itself also needs the aid of some modified RNA bases, the most common of
which are pseudouridine and inosine.
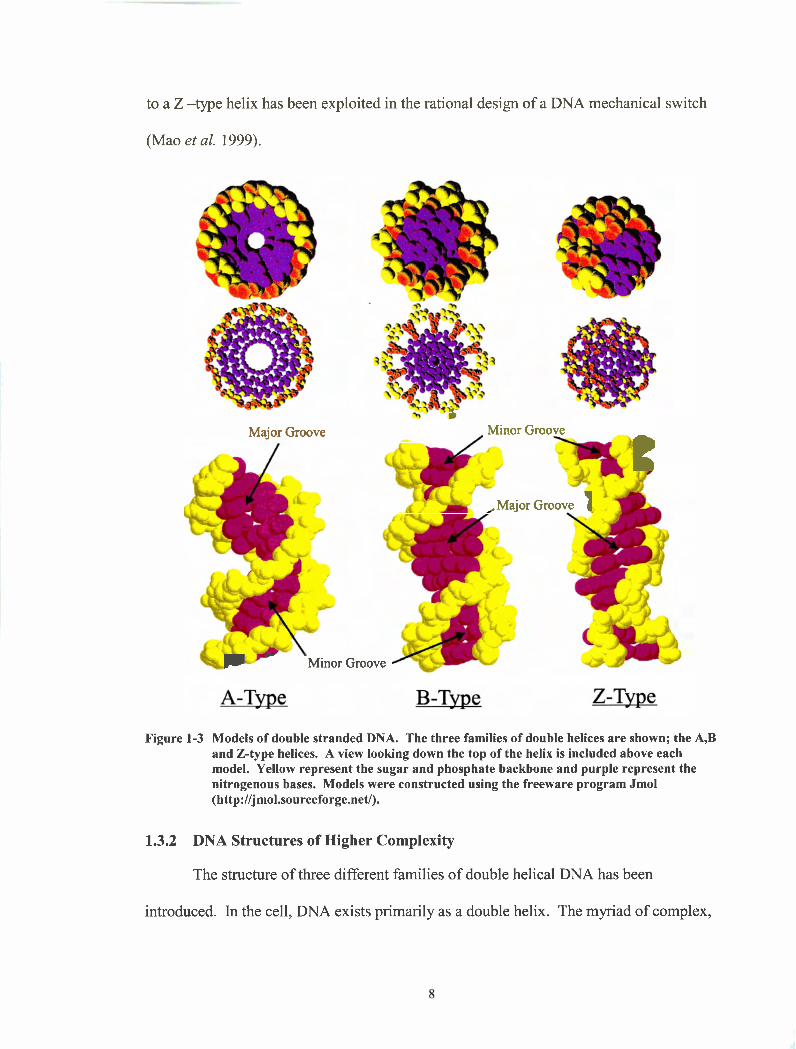
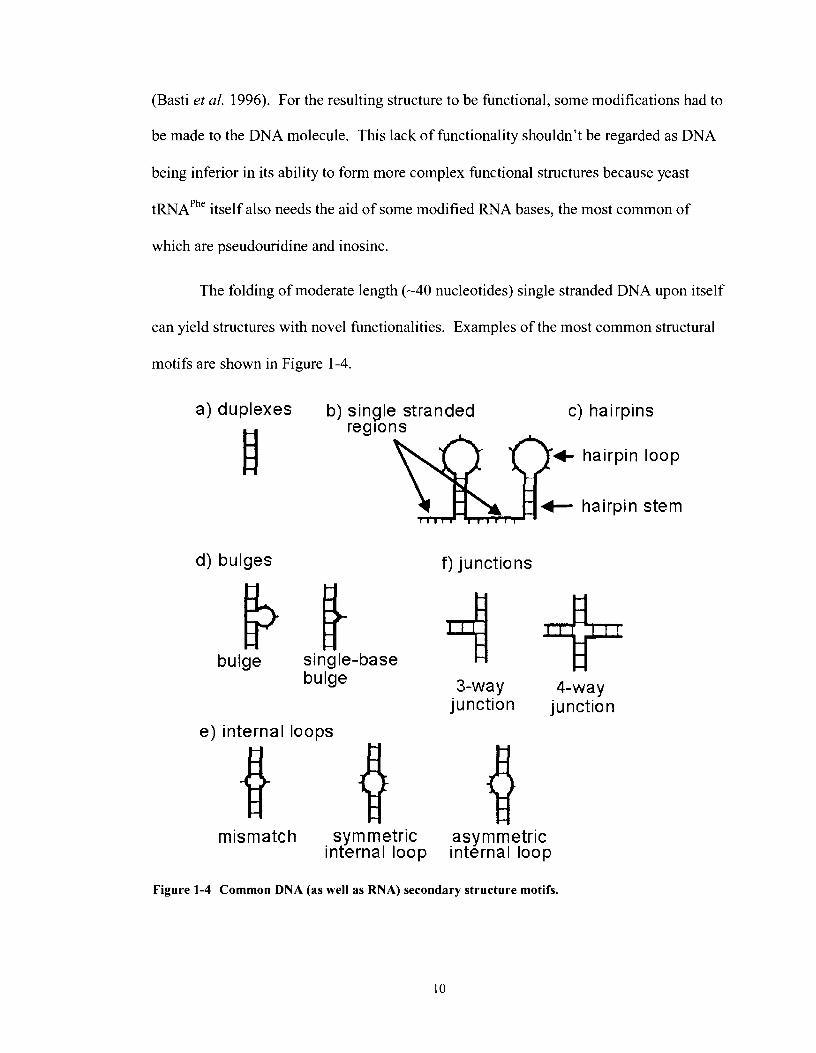
The folding of moderate length (-40 nucleotides) single stranded DNA upon itself
can yield structures with novel functionalities. Examples of the most common structural
motifs are shown in Figure 1-4.
a) duplexes
d) bulges
bulge
b) single stranded c) hairpins reglons
single-base bulge
+ hairpin loop
4- hairpin stem
f) junctions
3-way 4-way junction junction
e) internal loops
mismatch symmetric asymmetric internal loop internal loop
Figure 1-4 Common DNA (as well as RNA) secondary structure motifs.
1.3.2.1 Hairpins and Single stranded Regions
Single stranded regions, as the name implies, are regions in nucleic acids that do
not base pair with any other part of the DNA molecule (Figure 1 -4b). These single
stranded regions can arise when certain sections of a single stranded DNA molecule
contain internal complementary sequences and fold upon themselves making unique
structures such as hairpins (see Figure 1 -4c). The regions not involved in the hairpin
stem are referred to as single stranded regions. Single stranded regions can serve as
linking-structures, separating two DNA motifs (such as the two hairpins in Figure 1-4c).
The actual hairpin loops themselves can also be referred to as single stranded regions, as
well as bulges and internal loops (discussed below). It is also important to note that the
bases in a single stranded loop can interact with themselves by the formation of intra-loop
hydrogen bonds and base stacking interactions. Such interactions can influence the
stability of the adjoining hairpin stem. One such example is that of tetra-loops, loops
containing four nucleotides having sequence 5'-YYYR-3'(Santini et al. 2003).
1.3.2.2 Mismatches, Internal Loops and Bulges
DNA has the ability to form double helices even when not all of the nucleotides in
the two strands are fully complementary. The local structures lacking complementarity
can include base pair mismatches, bulges and internal loops. Not all mismatches interact
with each other, but within this realm exist non-canonical base-pairs which do interact
with each other, but in a much less efficient manner than the normal Watson-Crick
interaction. In the cell, mismatches occur from time to time as a result of mutagenic
processes and are corrected by a variety of repairing enzymes. In vitro, however,
mismatches and non-canonical base pairs can give rise to properties that are typically not
associated with the regular, fully complementary B-twe DNA.
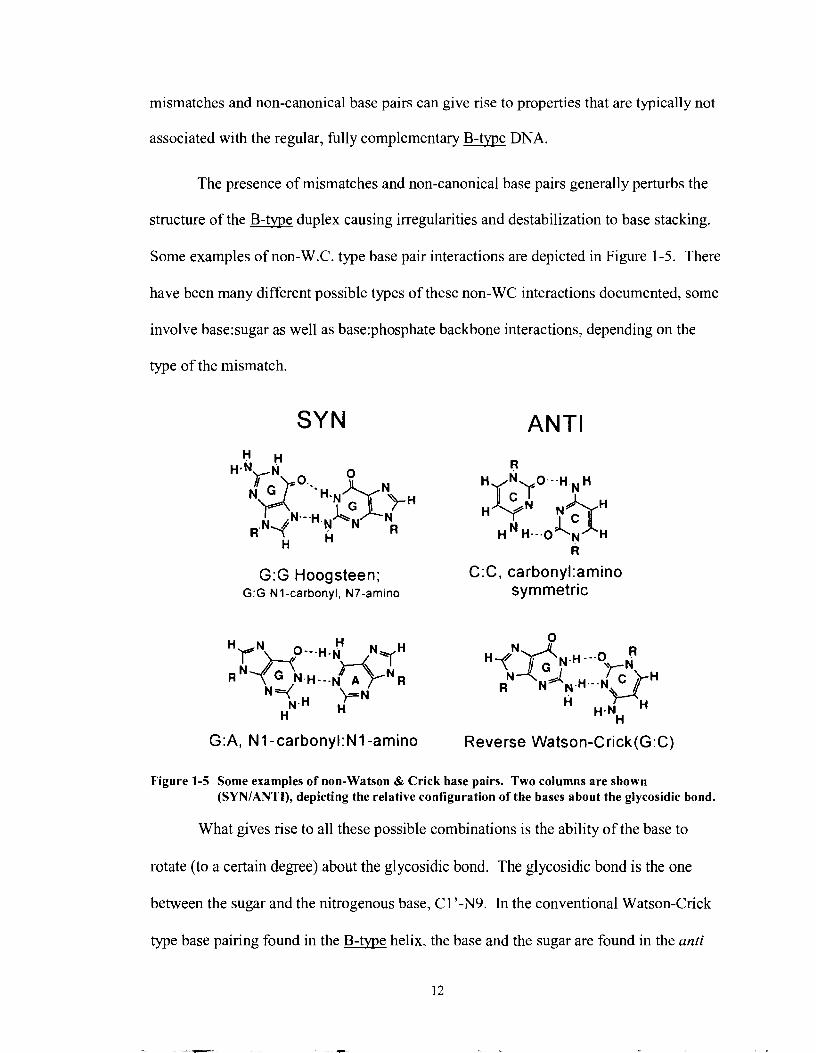
The presence of mismatches and non-canonical base pairs generally perturbs the
structure of the B-twe duplex causing irregularities and destabilization to base stacking.
Some examples of non-W.C. type base pair interactions are depicted in Figure 1-5. There
have been many different possible types of these non-WC interactions documented, some
involve base:sugar as well as base:phosphate backbone interactions, depending on the
type of the mismatch.
ANTI
G:G Hoogsteen; C:C, carbonyl:amino G:G NI-carbony~, ~7 -am ino symmetric
G:A, N1 -carbonyI:N1 -amino Reverse Watson-Crick(G:C)
Figure 1-5 Some examples of non-Watson & Crick base pairs. Two columns are shown (SYNIANTI), depicting the relative configuration of the bases about the glycosidic bond.
What gives rise to all these possible combinations is the ability of the base to
rotate (to a certain degree) about the glycosidic bond. The glycosidic bond is the one
between the sugar and the nitrogenous base, C 1 '-N9. In the conventional Watson-Crick
type base pairing found in the B-twe helix, the base and the sugar are found in the anti
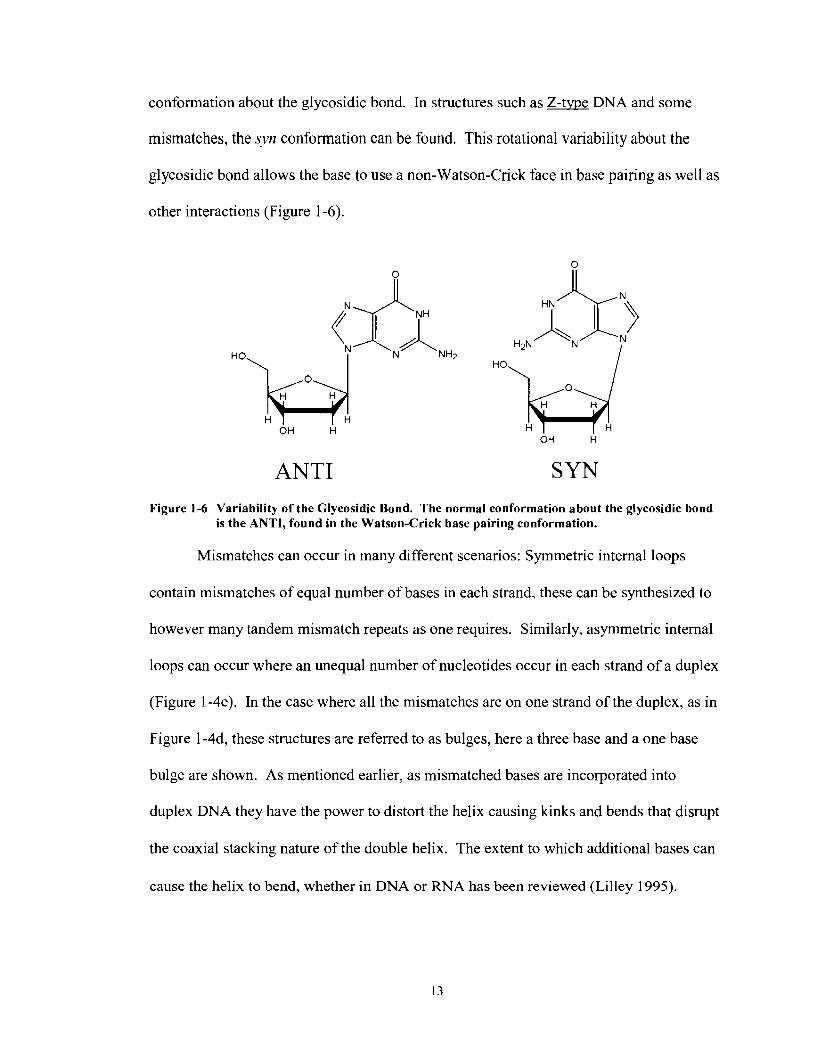
conformation about the glycosidic bond. In structures such as Z-tme DNA and some
mismatches, the syn conformation can be found. This rotational variability about the
glycosidic bond allows the base to use a non-Watson-Crick face in base pairing as well as
other interactions (Figure 1 -6).
ANTI
OH H
SYN
Figure 1-6 Variability of the Glycosidic Bond. The normal conformation about the glycosidic bond is the ANTI, found in the Watson-Crick base pairing conformation.
Mismatches can occur in many different scenarios: Symmetric internal loops
contain mismatches of equal number of bases in each strand, these can be synthesized to
however many tandem mismatch repeats as one requires. Similarly, asymmetric internal
loops can occur where an unequal number of nucleotides occur in each strand of a duplex
(Figure 1-4e). In the case where all the mismatches are on one strand of the duplex, as in
Figure 1 -4d, these structures are referred to as bulges, here a three base and a one base
bulge are shown. As mentioned earlier, as mismatched bases are incorporated into
duplex DNA they have the power to distort the helix causing kinks and bends that disrupt
the coaxial stacking nature of the double helix. The extent to which additional bases can
cause the helix to bend, whether in DNA or RNA has been reviewed (Lilley 1995).
1.3.2.3 Branched DNA
So far we have seen that DNA can form a variety of structures depending on its
sequence and environment. Another set of special structures that DNA can form is that
of branched DNA. In nature, one of the most common branched DNA structures is that
of the four-way junction or Holliday Junction, which is an intermediate structure in
genetic recombination. During meiosis, homologous chromosomes pair up and become
pressed together at their centromeres. During this time of close proximity, the
homologous chromosomes can physically exchange genetic material by the breaking and
rejoining of their DNA molecules. This genetic recombination event, referred to as
"crossing-over", is facilitated by enzymes, which break and rejoin the two DNA
molecules. Initially both DNA molecules are nicked, and within the vicinity of the nick
partial unwinding of the DNA strands occurs. This is followed by an event where a
nicked strand from one duplex base-pairs with its unbroken complementary strand in the
other duplex and vice versa. Upon enzymatic ligation a crossed-strand intermediate is
generated, this is referred to as a Holliday junction or four-way junction. Since these are
homologous DNA duplexes a high degree of complementarity exists between the
junction branch points of this crossed-strand intermediate allowing the junction to
"migrate" by unwinding and rewinding of the duplexes. This isomerization event known
is known branch migration (Camerini-Otero and Hsieh 1993). When branch migration
subsides, the crossed four-way junction structure can resolved back into two separate
duplexes by the cleaving and ligating properties of enzymes, generating recombinant
duplexes. In vitro, the four-way junction motif can be engineered such that each arm
contains a different sequence and thus produces an "immobile" junction. In the presence
of moderate ionic conditions, the extended four-way junction (Figure 1-40 has been
shown to undergo coaxial stacking of its arms in a sequence dependant manner, resulting
in X-like structure.
Another type of branched DNA is the three-way junction; and is the basis for the
work described in this thesis. In a three-way junction with no unpaired bases, the
structure is generally thought to be unstacked and extended. From simple model
building, it can be deduced that it would not be possible for a perfect three-way junction
with no unpaired bases (3H) to form a structure where two of its arms are coaxially
stacked arms without actually breaking one of the strands; Recall from before that the
axial distance between two stacked bases in a B-type helix is -3.4 A. This would mean
that we would be trying to fit the width of a helix (-20 A) in to a space only big enough
for the space between two bases. Comparative gel-shift mobility assays (Duckett and
Lilley 1990) and FRET studies (Stuhrneier et al. 1997) on the perfectly base paired three-
way junction confirm that its overall global orientation is one that is unstacked and
extended. Fluorescence resonance energy transfer (FRET) is a spectroscopy technique
used to determine physical distances within a molecule, in this case the distances and
inter arm angles branches of a DNA three way junction molecule. The spectroscopy
technique involves the incorporation of a fluorophor molecule and a quencher molecule
covalently attached at the branch endpoints of a three-way junction. The changes in
fluorescence are measured, and by using a series of algorithms spatial features giving
insight into the structure of a molecule are revealed.
Generally, for a perfectly base paired three-way junction, the inter-helical angles
are similar, ranging from 60-90". Also, the structure does not typically fold by pair-wise
coaxial stacking and does not undergo any major conformational changes upon
increasing the ionic strength of its environment, as seen for Z-DNA or 4-way junctions.
However, some perfectly base paired three-way junctions have been found to be quite
asymmetrical in their global structure, suggesting that the simple "Y" unstacked structure
may be an oversimplification for some sequences (Lu et al. 199 1).
When unpaired bases are incorporated between two stems of a perfect three-way
junction (3H), the structural constraints with respect to flexibility about the junction are
relaxed. Preliminary experiments of incorporating a single stranded region or a bulge
between the helical arms showed that the resulting structure had increased stability in gel
electrophoretic studies (Leontis et al. 199 1). It was later shown that such three-way
junctions were able to undergo a conformational change upon addition of magnesium or
other multivalent ions (Welch et al. 1993). The resulting structure was thought to be one
where two arms became coaxially stacked while the third was subtended at an angle
which was dependent on the number of unpaired bases, this was confirmed by FRET
studies (Stuhmeier et al. 1997).
Conformer I Conformer I1
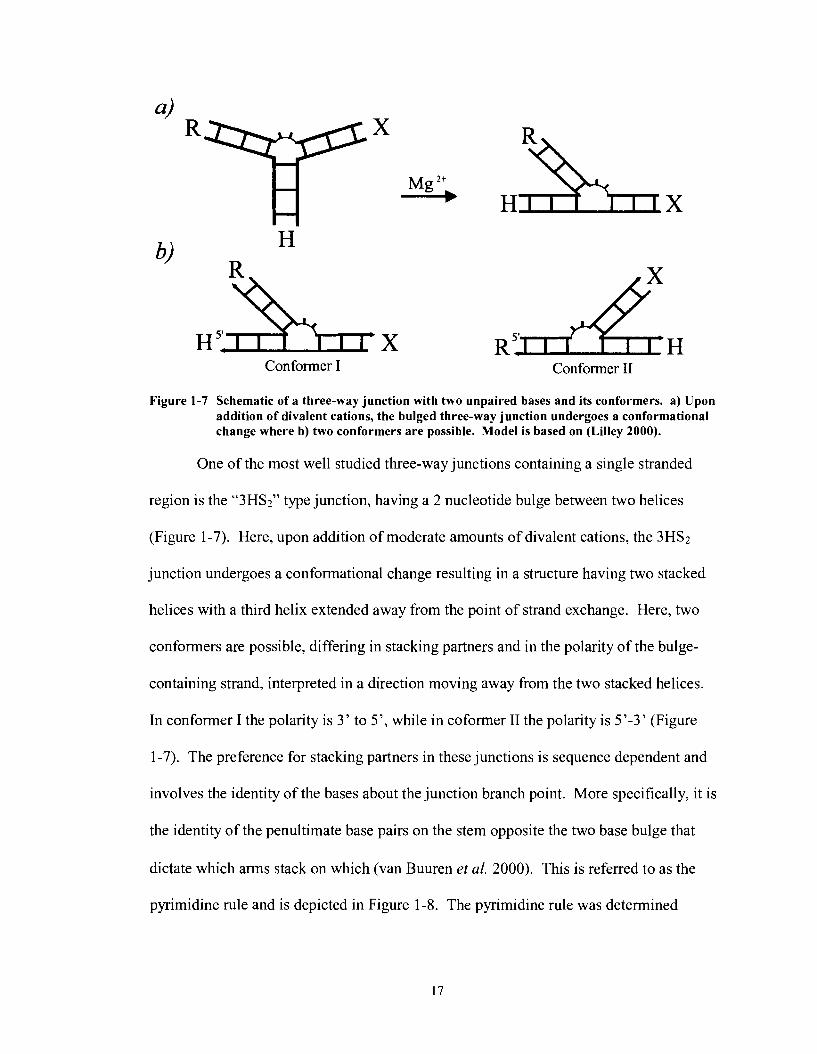
Figure 1-7 Schematic of a three-way junction with two unpaired bases and its conformers. a) Upon addition of divalent cations, the bulged three-way junction undergoes a conformational change where b) two conformers are possible. Model is based on (Lilley 2000).
One of the most well studied three-way junctions containing a single stranded
region is the "3HS2" type junction, having a 2 nucleotide bulge between two helices
(Figure 1-7). Here, upon addition of moderate amounts of divalent cations, the 3HS2
junction undergoes a conformational change resulting in a structure having two stacked
helices with a third helix extended away from the point of strand exchange. Here, two
conformers are possible, differing in stacking partners and in the polarity of the bulge-
containing strand, interpreted in a direction moving away from the two stacked helices.
In conformer I the polarity is 3' to 5', while in coformer I1 the polarity is 5'-3' (Figure
1-7). The preference for stacking partners in these junctions is sequence dependent and
involves the identity of the bases about the junction branch point. More specifically, it is
the identity of the penultimate base pairs on the stem opposite the two base bulge that
dictate which arms stack on which (van Buuren et al. 2000). This is referred to as the
pyrimidine rule and is depicted in Figure 1-8. The pyrimidine rule was determined
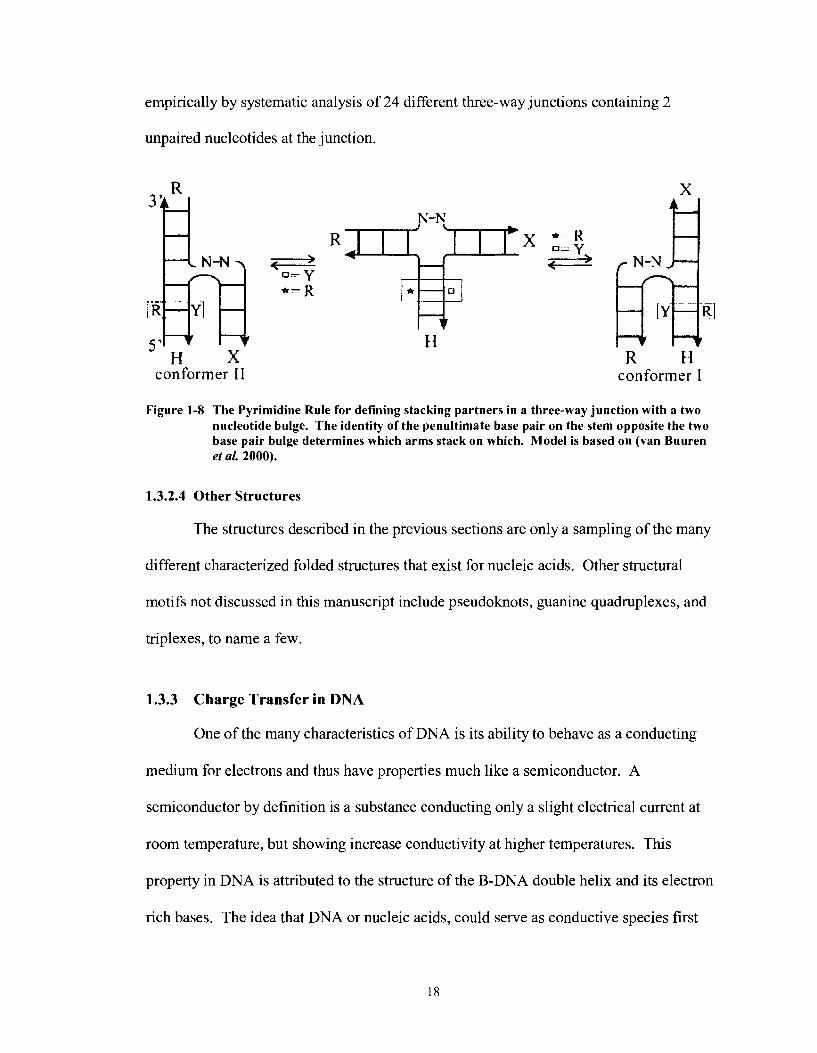
empirically by systematic analysis of 24 different three-way junctions containing 2
unpaired nucleotides at the junction.
H X conformer I I
R H conformer I
Figure 1-8 The Pyrimidine Rule for defining stacking partners in a three-way junction with a two nucleotide bulge. The identity of the penultimate base pair on the stem opposite the two base pair bulge determines which arms stack on which. Model is based on (van Buuren et al. 2000).
1.3.2.4 Other Structures
The structures described in the previous sections are only a sampling of the many
different characterized folded structures that exist for nucleic acids. Other structural
motifs not discussed in this manuscript include pseudoknots, guanine quadruplexes, and
triplexes, to name a few.
1.3.3 Charge Transfer in DNA
One of the many characteristics of DNA is its ability to behave as a conducting
medium for electrons and thus have properties much like a semiconductor. A
semiconductor by definition is a substance conducting only a slight electrical current at
room temperature, but showing increase conductivity at higher temperatures. This
property in DNA is attributed to the structure of the B-DNA double helix and its electron
rich bases. The idea that DNA or nucleic acids, could serve as conductive species first
arose over 40 years ago (Eley and Spivey 1962). The topic was then revived and
supported in the 1990's when it was demonstrated that photo-induced charge transfer
could occur over distances of more than 40 A between metallo-intercalators tethered at
opposite ends of a 15 base pair duplex (Murphy et al. 1993). This observation and many
others that followed led to a heated debate over the mechanism of this process (Turro and
Barton 1998). Elucidating the mechanism in which DNA behaves as a semiconductor is
relevant to many areas of nanotechnology research. From a biological standpoint, it is
also beneficial to understand the mechanism of this process as oxidative damage to DNA
in vivo can lead to mutations and cancer.
1.3.3.1 Mechanisms of Charge TransferITransport
The mechanism of electron transfer is a topic of intense research, with different
groups having different opinions on the details of the process (Turro and Barton 19%).
The two main models for DNA charge conduction that are generally accepted are; the 1)
super-exchange model and the 2) hole hopping model. A variation of the hole-hopping
model has been described by Schuster and coined "phonon-assisted polaron-like
hopping" (Liu et al. 2004). These contrasting models are believed to occur in different
charge transport scenarios, particularly, those that affect the distance of charge separation
between the donor and acceptor molecules; particularly the length and sequence of the
bridging DNA (Jortner et al. 1998) . These models offer characteristic distance and
sequence dependences for charge transport as well as different rates for the process. The
super-exchange model holds true for short distances of up to three base pairs, while the
hole hopping model and the phonon-assisted polaron like hopping model appears to be
applicable for charge transport over longer distances (-200 A). The views on this issue
are evolving such that it is now accepted that both models (super exchange and hole
hopping) work in synergy, depending on the driving force of the reaction and the
sequences being tested. The terms "transfer" and "transport" are frequently used in the
literature; charge transfer refers to the single step tunnelling and is appropriate for
describing the super exchange mechanism. Charge transport on the other hand, is a
multistep hopping reaction, with each step of the hopping process being a transfer
reaction (Giese 2000); (Jortner et al. 1998). For a more detailed review on charge
transportltransfer, please see reviews by Giese (Giese 2002) and Barton (Delaney and
Barton 2003).
1.3.3.2 The Super Exchange Mechanism
The super exhange mechanism was one of the first ways that electron transfer in
DNA was conceived to occur. In this model, the n-orbitals of the bases form delocalized
molecular orbitals, sometimes referred to as the DNA n -way (Murphy et al. 1993).
Here, the n-orbitals of a given base are in direct contact with the n -orbitals of a
neighbouring base. This would allow for rapid electron transfer from donor to acceptor,
depicting DNA as molecular wire. This process is believed to occur when the donor and
acceptor molecules are in very close proximity and decays exponentially with distance
(Jortner et al. 1998).
DNA is a dynamic molecule, with its constituent atoms, corresponding counter
ions, and solvating water molecules, having motions in time-scales ranging from
femtoseconds to milliseconds or longer (Beveridge and McConnell2000) (Braun et al.
1998). For these reasons it is conceivable that super-exchange occurs only over short
distances, as longer stretches of DNA tend to be more dynamic and offer less favourable
conformations for super-exchange to occur.
1.3.3.3 The Hole Hopping Mechanism
As the name implies, this model depicts an electron hole, or radical cation, to
migrate through DNA by a "hopping" mechanism. In the hole-hopping mechanism, the
radical cation uses the nucleobases with the lowest oxidation potential as resting spots.
In DNA, the purines (primarily guanines) are the carriers of the positive charge owing to
their relatively lower oxidation potentials (Seidel et al. 1996). The reduction potential of
the free bases are as follows: dG (1.29 V), dA (1.42 V), dC (1.6 V) and dT (1.7 V)
(Steenken and Jovanovic 1997). The radical cation migration process is initiated by an
oxidation event to the DNA where a single electron is robbed creating a radical cation
(G.+). The electron hole is allowed to rest on these bases (Gs) of relatively lower energy
and hop from G to G in a random walk, robbing electrons from neighbouring guanines
(Meggers et al. 1998). Thus, for efficient charge transport to occur in such a system,
consisting of an electron acceptor and donor separated by a DNA bridge, sufficient
guanines must be present to provide "stepping stones" for the migration of the radical
cation. As a rule of thumb, when constructing DNA sequences for the purpose of long-
distance hole hopping, G:C base pairs should be separated by no more than one or two
A:T base pairs. If the DNA bridge only consists of an (A:T) tract, as the length of the
bridge increases, the adenines also become carriers of the positive charge (Giese et al.
2001). Giese has shown that when the DNA bridge only consists of (A:T) base pairs,
there is actually a change in mechanism from the rapid super exchange to hole hopping
mechanism by varying the length of the (A:T) DNA bridge between the donor and
acceptor molecules (Giese et al. 200 1). As the length of the DNA bridge increased from
1-3 base-pairs, a sharp decrease in the efficiency of electron transfer was observed
indicating a strong distance dependence. When the DNA bridge was greater than 4 base-
pairs the efficiency of electron transfer becomes nearly independent of distance (Giese
2002).
In addition to having sufficient guanines as stepping stones for the radical cation,
it is generally accepted that the higher the degree of base stacking that a DNA bridge has,
the more efficient the transport of the radical cation will be from donor to acceptor.
Perturbations to the axial stacking of the DNA bridge, such as bulges, mismatches and
single strands, all attenuate the efficiency of charge transport. In the cases where
perturbations to the helix caused little or no effect on the efficiency of charge transport,
such as certain G:A mismatches (Boone and Schuster 2002), or abasic sites (Gasper and
Schuster 1997), it is believed that the resulting structure was stacked, thus permiting
charge transport.
1.3.3.4 Other Mechanisms
The scenarios for electron transfer that have been discussed in the previous
sections all describe a general system where a single electron (an electron hole) travels
through oxidized DNA. Electron transfer through an oxidized DNA medium is the
system used to describe the work in this thesis. Much less is known about electron
transfer through reduced DNA, where the electron now is in excess. Here the excess
electron would migrate through the bases which are most easily reduced, C and T, owing
to their reduction potentials (Steenken and Jovanovic 1997). Also, because their
potentials are so similar, electron migration would occur in both of these bases, making
every base pair a carrier of the excess electron. The mechanisms that govern these
processes, whether hopping or tunnelling, is at an early stage, but it is conceivable that
because every base pair can carry the excess electron (radical anion), the electron
migration process would be well coupled and efficient. Several systems have been used
to explore this process, including electron injection into DNA by y-irradiation in ice, and
electron injection by photo activated flavins (Anderson and Wright 1999; Debije et al.
1999), (Razskazovskii et al. 1997), (Schwogler et al. 2000).
1.3.4 Monitoring Charge Transport
Several methods have been developed to monitor charge transport in DNA. The
ideal situation would be to directly attach electrodes at ends of a DNA molecule and
measure changes in current. Unfortunately, technical limitations make this task
impossible at the current time. The most direct measurements have been on "600 nm
ropes" consisting of a few DNA molecules twined into single structure of at least 600 nm
in length (Eley and Spivey 1962), (Fink and Schonenberger 1999). Measurements of
electrical current as a function of the potential applied across these 600 nm ropes showed
that efficient conduction through DNA was possible. Fink and Schonenberger measured
a resistance of 2.5 MR across the 600 nm DNA ropes indicating that DNA transports
electrical current as efficiently as a good semiconductor.
The most commonly studied systems involve chemical modifications to DNA
where an oxidant andlor reducing agent is covalently attached to the DNA at specific
positions, spanning a region where charge transport is monitored. These covalently
tethered compounds are typically light sensitive so that electron transport can be turned
on or off by irradiation with the correct wavelength of light. Several compounds have
been described as possible candidates as oxidantsheductants depending on whether one
wishes to monitor charge transport over long (-200 A) or shorter distances (-20 A). The
different compounds that have been incorporated into DNA for the purpose of monitoring
charge transport, have been reviewed by Grinstaff (Grinstaff 1999).
1.3.4.1 Monitoring Electron hole Migration in DNA
The most typical way to monitor electron hole migrationlphonon-assisted polaron
hopping in DNA is performed by injection of a radical cation into the DNA by photo-
excitation of a tethered oxidant. The tethered oxidant or electron acceptor used in this
work is an anthraquinone (AQ) derivative. A simplified scheme outlining electron hole
migration is depicted in Figure 1-9 below. The electron donor is the 5' most G of a GG
run or a GGG run in the DNA sequence. Upon irradiation of the anthraquinone-linked
DNA sample with ultraviolet light, a ground state electron in the anthraquinone moiety
gets excited into the singlet state. For the case of AQ, an intersystem crossing to the
triplet state may then follow. The excited AQ* then rapidly removes an electron from the
DNA resulting in a G.+ radical cation and an AQ.- radical anion. Anthraquinone is an
electron deficient, hydrophobic molecule that stacks well on top of the DNA by way of
dispersion forces. Depending on which system is being discussed, upon radical cation
injection, the radical cation localizes on either the first purine closest to the AQ (in the
phonon-assisted polaron hopping model) or on the first guanine, as a result of tunnelling
(in the hole hopping model). Here the radical ions can undergo different side reaction,
the two most interesting of which are explained below (see Figure 1-9).
F- G.+ AQ'-
G G GGG- 5 '
Figure 1-9 A Simple Scheme for monitoring electron transfer. Upon radical cation injection one of two side reactions can occur: a) annihilation of the radical ion b) radical cation trapping and migration.
One of the possible side reactions is the annihilation of the radical ions. Here, a
simple back reaction having rate kback occurs and involves the return on an electron to its
donor resulting in the initial ground state. The magnitude of kback depends on many
factors, such as the electron withdrawing properties of the solvent, or the electron
donating character of the local sequence adjacent to the AQ moiety. The efficiency of
radical cation injection into the DNA helix has been addressed by Schuster's group.
They propose that the back reaction can be minimized by excluding a guanine in the first
four bases at the end of the DNA helix where the anthraquinone is tethered. AQ-DNA
constructs having this design required only 1 % of the irradiation time to see comparable
guanine damage at sites along the DNA duplex (Sanii and Schuster 2000).
The second side reaction occurs when the AQ.- radical anion loses its excess
electron to molecular oxygen (02) in the solvent, resulting in a superoxide (02.-) and
ground state AQ, leaving the base radical cation G.+ with no local partner for
annihilation. The rate of this process is described by kOz in Figure 1-9. At this point, the
guanine radical cation can migrate in a random walk along the DNA double helix to other
guanines. This process is referred to as "hole hopping". This base radical cation
migrateshops along the DNA helix with rate described by khop (Figure 1-9). Migration of
the G.+ radical cation could terminate by undergoing a side reaction with water or
molecular oxygen resulting in a base labile guanine lesion in the DNA strand. This is
referred to as radical cation trapping and its rate is described by kt,,,. Radical cation
trapping can be visualized as breaks in the DNA using gel electrophoresis after treatment
of end-radiolabelled DNA samples with hot piperidine.
Although all guanines have the potential to react under oxidative stress to form
the oxidized G lesion, not all guanines react with the same efficiency. This is due to base
sequence effects about the single guanine. It has been demonstrated that due to the n-
stacking interactions of a 5'-GGG-3' run in a Watson-Crick DNA helix, the 5' most
guanine becomes the most electron donating and thus is more readily oxidized than the
any G residue on the 5'-GGG-3' run or any other G along the double helix (Saito et al.
1995)' (Sugiyama and Saito 1996). The 5' G reactivity of a 5'-GG-3' run has become a
signature of oxidative damage caused by electron hole migration and is used widely for
studies of long-range hole transport (Meggers et al. 1998) (Giese et al. 1999). In addition
to this, other sequence effects have been shown to modulate the oxidative reactivity of
the 5' guanine. Experimental evidence from Saito and co-workers has shown that the
efficiency of GG cleavage has the following hierarchy, (read 3'-NNN-5'): GGG > CGG
> AGG = TGG > TGT (Saito et al. 1998).
Another topic of interest and debate is the identity of the oxidized product.
Several heterocyclic compounds have been proposed, for a detailed discussion see the
following references: (Burrows and Muller 1998), (Cadet et al. 1997), (Kino et al. 1998).
Although many structures have been proposed, two major compounds have been
generally accepted as major oxidation products under oxidative stress to guanines, they
are 7,8-dihydro-8-oxoguanine (8-0x0-G) and 2-amino-imidazolone (Giese 2002). The
ionization potential of 8-0x0-G is slightly lower than a regular guanine (Sheu and Foote
1995) and can be used as a marker of oxidative stress or as an electron-sink in studies of
long-range hole transfer (Schuster 2000). From a biological standpoint, these two
oxidative products can produce mutations to the DNA sequence: 8-0x0-G can base pair
with adenine in a Hoogsteen fashion, and upon DNA replication in the cell, it would
induce a G:C to T:A transversion mutation (Shibutani et al. 1991). The imidazolone can
base pair with guanine and can cause a G:C to C:G transversion mutation upon DNA
replication (Duarte et al. 1999) (Kino and Sugiyama 200 1). Ongoing research into
characterizing the oxidation products of guanine and their mutations will give more
insight into how oxidative damage in DNA occurs (Duarte et al. 2001).
CHAPTER 2: GENERAL ELECTRICAL BIOSENSORS MADE OF DNA
2.1 Introduction
Since charge transport in DNA can be modulated by its conformational state, it is
this dependence that is used to design biosensors made of DNA. The idea of exploiting
charge transfer in DNA to monitor ligand-receptor binding events was first described by
Fahlman and Sen (Fahlman and Sen 2001). In their work, they successfully incorporated
a ligand-binding receptor to a conducting DNA molecule such that ligand binding to the
receptor changes the conformation of the conductive path. The resulting receptor-DNA
construct would constitute a biosensor for the ligandlanalyte in question. Such
deoxyribosensors for the ligand adenosine have been described by Fahlman and Sen
(Fahlman and Sen 200 1). In theory, any ligand-binding receptor, of biological or other
origin could potentially be used in such deoxynbosensors. For the receptor component of
these deoxyribosensors, the most obvious choice was to utilize receptors made of nucleic
acids, or "aptamers". In nature, certain nucleic acids are known to bind a myriad of
different molecules small or large for many cellular processes. An example is
riboswitches, which are segments of mRNA that can regulate the metabolites they sense.
Riboswitches for adenine, guanine, S-adenosylmethionie (SAM), lysine, thiamine
pyrophosphate (TPP), flavins mononucleotide (FMN) and coenzyme B 12 have be
recently identified (Mandal et al. 2003). Recent advances in in vitro selection technology
(SELEX) have empowered scientists to obtain nucleic acid aptamer sequences (whether
DNA or RNA) which are capable of binding their target ligands with high affinity and
specificity. The ligands for which one wishes to obtain an aptamer for, could be any
molecular species of choice, including many that do not normally interact with DNA or
RNA (Gold et al. 1995). Another feature of nucleic acid aptamers is that they exhibit an
induced-fit folding behaviour, where the aptamer by itself is unstructured in solution, it
can undergo significant compaction and structural stabilization upon binding to its
cognate ligand (Hermann and Pate1 2000).
Fahlman and Sen have described two related but distinct designs of
deoxyribosensors for the detection of the trial analyte, adenosine, which binds poorly, if
at all to double-stranded DNA but for which a moderate affinity (Kd - 1 pM) DNA
aptamer sequence has been in vitro selected (Huizenga and Szostak 1995) (see materials
and methods section for definition of &). Nuclear Magnetic Resonance (NMR') in
combination with molecular modelling have revealed that this aptamer binds two
adenosine molecules and undergoes adaptive folding and compaction, resulting in a
tightly hydrogen bonded and stacked helical structure (Lin and Pate1 1997).
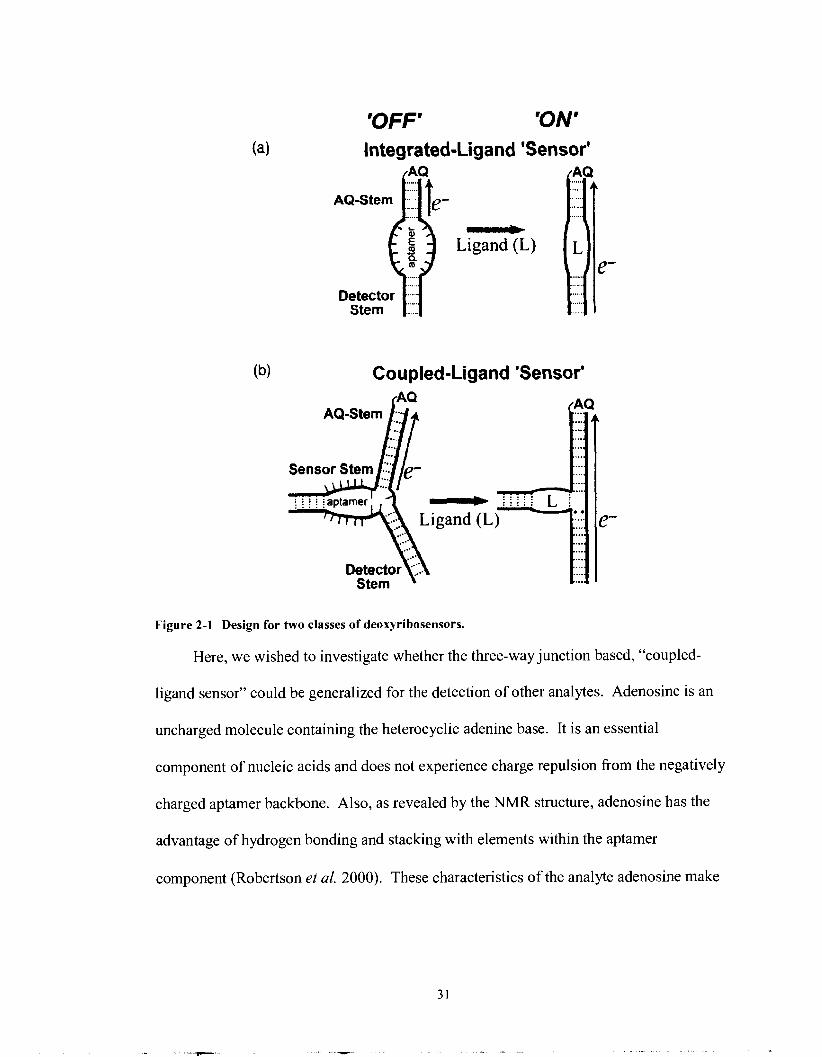
Figure 2-1 below illustrates the two designs for the adenosine deoxyribosensors.
Figure 2-la depicts the integrated ligand sensor in its off and on conformations. Here,
the aptamer region, a direct component of the electron transfer path to the detector stem is
I NMR spectroscopy is a valuable analytical technique that can be used to determine the three-dimensional structure and dynamics of macromolecules in solution with the aid of molecular modelling. Nuclear magnetic resonance results from the absorption of energy by a nucleus changing its orientation in a magnetic field. Protons ('H ) are the most commonly studied nuclei in NMR. The resonance spectrum that is produced by these nuclei is representative of the various groups and their relative orientations within molecule. The intramolecular distance information that can be obtained using NMR, can be grouped into two general classes of distance information; "through-bond" connectivity and "through-space" connectivity. The former is referred to as COSY for correlation spectroscopy and the latter is referred to as NOESY for Nuclear Overhauser Effect spectroscopy. NMR spectroscopy can become especially useful when studying the structure of nucleic acids; nucleobases contain aromatic ring systems where the n- electrons are free to move in an orbital not associated with any one atom. Ring currents can be set up in these delocalized electron systems giving rise to signature spectra for the resonating protons associated with the aromatic rings.
unstructured in the absence of ligand making it a poor DNA bridge for charge transport.
Upon binding of the ligand adenosine, the structure compacts and becomes stacked
permitting charge transport to the 5'GGG'3 containing electron sink in the detector stem,
where the signal is measured. In Figure 2- 1 b, a more versatile construct for the
adenosine deoxyribosensor is depicted, the coupled ligand sensor. Here, the aptamer
region is not part of the conduction path; instead it is adjacent to it. In the unbound form,
the aptamer region is unstructured and disturbs the co-axial stacking of the AQ-stem and
the detector stem, resulting in a sub-optimal DNA bridge to the detector stem. This is
rectified upon binding of the target analyte adenosine. These constructs as well as the
ones in the work to follow all use the light-activated photo-oxidant anthraquinone for
initiation of charge transport. Both of these deoxyribosensor constructs gave high levels
of charge transfer to their detector stems upon binding adenosine. The signal observed
was 10-20 fold for the integrated ligand sensor and 10- 15 fold for the three-way junction
based coupled ligand sensor (Fahlman and Sen 2001).
'OFF' 'ON' Integrated-Ligand 'Sensor'
Q ..... .....
Detector ..... ..... Stem ....
0 Ligand (L)
Coupled-Ligand 'Sensor'
.... ...
....
....
....
....
.... ....
.... .... .... ....
....
... Stem
Figure 2-1 Design for two classes of deoxyribosensors.
Here, we wished to investigate whether the three-way junction based, "coupled-
ligand sensor" could be generalized for the detection of other analytes. Adenosine is an
uncharged molecule containing the heterocyclic adenine base. It is an essential
component of nucleic acids and does not experience charge repulsion from the negatively
charged aptamer backbone. Also, as revealed by the NMR structure, adenosine has the
advantage of hydrogen bonding and stacking with elements within the aptamer
component (Robertson et al. 2000). These characteristics of the analyte adenosine make
it a good test analyte of choice because it easily incorporates into DNA in a manner to be
supportive of charge transfer.
As a next step, we wanted to test how robust nucleic acid sensors could be when
the analyte in question didn't have such desirable properties for neatly interacting with
DNA, as in the case for adenosine. We sought out to design a three-way junction based,
coupled-ligand sensor for a small molecule ligand that was not an aromatic heterocycle
and which contained a substantial positive charge. This positive charge may give the
ligand the undesired property of interacting non-specifically with the DNA backbone. As
a starting point we wished to investigate whether the existing coupled-ligand sensor for
adenosine could be converted into a sensor for a different analyte simply by replacing the
aptamer component of the sensor with a different aptamer of choice. The question was to
see to what extent aptamers of diverse secondary structure could, in modular fashion be
incorporated into a standard design of deoxyribosensors.
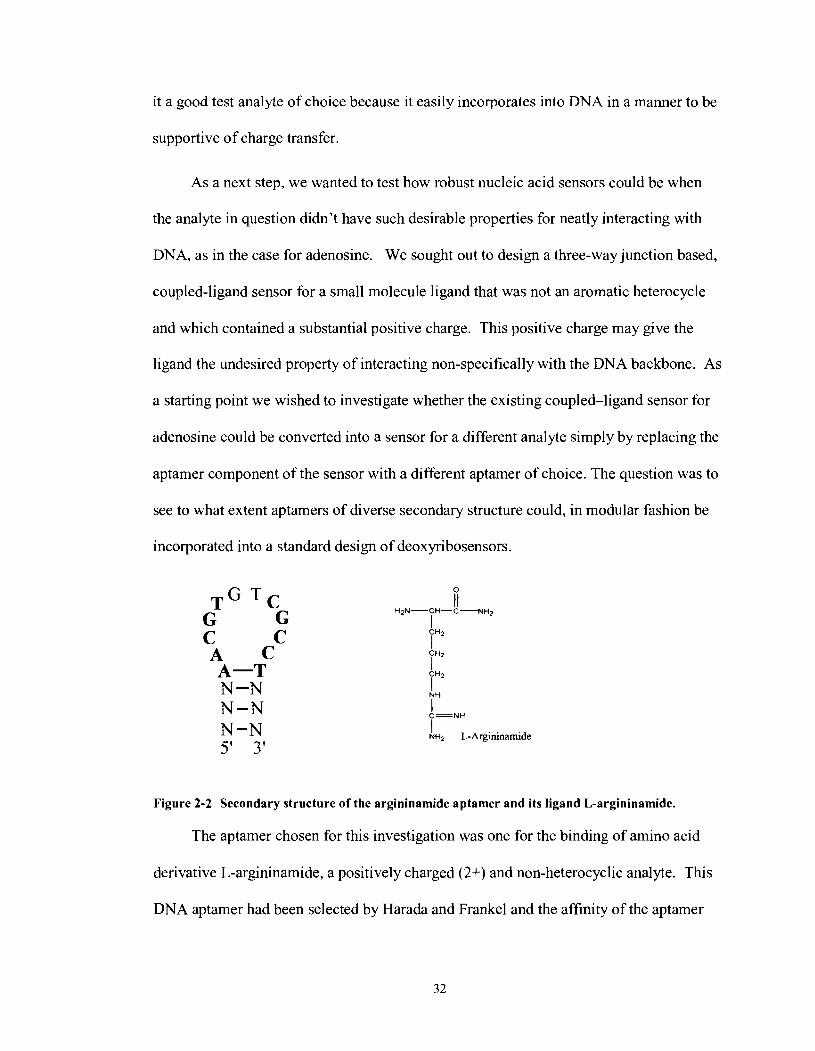
c C A C A-T N-N N-N N-N 5' 3'
Figure 2-2 Secondary structure of the argininamide aptamer and its ligand L-argininamide.
The aptamer chosen for this investigation was one for the binding of amino acid
derivative L-argininamide, a positively charged (2+) and non-heterocyclic analyte. This
DNA aptamer had been selected by Harada and Frankel and the affinity of the aptamer
for argininamide was measured to be - 100 pM (Harada and Frankel 1995) (Robertson et
al. 2000)(see Figure 2-2). The initial part of the research started out on the premise that
the existing coupled ligand sensor for adenosine could be converted into one for
argininamide by simple replacement of the aptamer sequence. Subsequent investigation
focussed on whether established rules for helical stacking in DNA three-way junctions
could be utilized for the design of better (having higher signal and specificity)
deoxyribosensors.
2.2 Materials and Methods
2.2.1 DNA Oligonucleotides
All DNA oligonucleotides were purchased from the University of Calgary Core
DNA Services. Treatment and handling of unmodified DNA sequences, and the
procedures for coupling of AQ to 5' amino modified DNA and subsequent purification
were carried out as described by Fahlman and Sen (Fahlman and Sen 200 1).
2.2.1.1 Treatment of Crude Oligonucleotides
All treatments of oligomers are based on a 0.2 micromole synthesis scale. Amine
coupled oligonucleotides containing a C6-NH2 modification on their 5'-end were treated
as follows: The lyophillized DNA pellet from the synthesis was resuspended in 100 p1 of
deionized H20 (dH20) and extracted three times with chloroform. The chloroform
extractions were carried out to remove nitrogenous contaminants from the original
oligonucleotide synthesis as they will compete the amine labelled DNA during the AQ
coupling reaction. The remaining aqueous solution containing the DNA was precipitated
by the addition of 30 p1 of 1M NaCl and 340 p1 of 100% ethanol. The resulting pellet
was washed two times with 70% ethanol and subsequently resuspended in 100 p1 of
dH20 where the concentration was determined by measuring the optical density. All
unmodified oligomers were dissolved in 50 pl of denaturing loading buffer, heated at
90•‹C for 3 minutes and run on an 8% denaturing polyacrylamide gel. Denaturing loading
buffer consisted of formamide, containing 1 mM EDTA pH 8.0 and trace amounts of
xylene cyan01 FF and bromophenol blue as tracking dyes. DNA was visualized by UV
shadowing and the appropriate band was cut out and eluted in 10 mM Tris-C1 pH 8 and
0.1 mM EDTA. The eluent was filtered through a 0.2 pm microfilter (Gelman Sciences),
concentrated by butanol extraction and ethanol precipitated by topping up the
concentrated DNA solution to 300 mM sodium acetate and adding 2.5 equivalents of
100% ethanol.
2.2.1.2 Anthraquinone Coupling
Approximately 5 mg of AQ-NHS ester was weighed out and resuspended in
DMSO (1 ml DMSO: 20 mg AQ-NHS ester). The majority of the mixture will not
dissolve and has a yellowish cloudy appearance. This mixture is vortexed and 7 pl of the
suspension is immediately transferred to a separate 0.6 ml Eppendorf tube to which 75 pl
of Sodium Borate pH 8.5 is added. Then 10 nanomoles of the chloroform extracted
amino-derrivatized oligonucleotide is added. The reaction vessel is covered in foil and
shaken overnight on a bench top vortex. The reacted DNA was then ethanol precipitated
by the addition of 27 pl of lM NaCl and 280 pl of ethanol. This is followed by another
ethanol precipitation by the addition of 100 p1300 mM NaCl and 250 pl of 100%
ethanol. The pellet is then washed with 70% ethanol and resuspended in 50 p1 of 100
mM triethyl ammonium acetate (TEAA) pH 7.0 and 100 pl chloroform. Here, a
chloroform extraction is performed to remove excess uncoupled AQ-NHS ester that has
not reacted with the amine group tethered to the 5 ' end of the DNA. This is then shaken
slowly for several hours until the pellet dissolves (it is important to note that the pellet
will look a chalkish yellow). This can be expedited by soaking the reaction vessel in a
37•‹C water bath and periodically vortexing the solution. Once the pellet has dissolved
the aqueous fraction is removed and placed in a speed vac to remove any residual
chloroform. This takes approximately 15 minutes under vacuum. The resulting solution
of TEAA would contain the AQ-coupled oligo ready for purification by HPLC.
2.2.1.3 DNA Assemblies
DNA assemblies were formed by annealing mixtures of constituent DNA
oligomers (1 pM each) in 100 mM Tris-HC1 (pH KO), 100 mM NaC1, 100 pM EDTA.
DNA solutions were heated to 85•‹C for two minutes and allowed to cool slowly until the
final temperature was 20 "C. These solutions were then diluted two-fold with MgC12 and
L-argininamide or other analytes, as appropriate; L-arginine, L-lysine and spermidine
were added to their final concentrations, as described in the text. Following mixing, the
solutions were incubated for 15 minutes at room temperature (20 "C) prior to
photoirradiation.
2.2.2 Photoirradiation
All irradiations were carried out at room temperature (20 "C). Samples pre-incubated at
20 "C were irradiated using a UVP Black-Ray hand-held lamp (model UVL-56 with a
366 nm wavelength maximum, at 18 W) for 90 minutes or for 35 minutes with a distance
of 4.0 cm between the bulb and the sample solution surface (Fahlman and Sen 2001).
Following irradiation, samples were precipitated in 300 mM sodium acetate and 2.5
equivalents of 100% ethanol and the DNA pellets dissolved in 10% (vlv) piperidine and
heated for 30 minutes at 90 "C in sealed tubes. The samples were then lyophilized,
dissolved in a standard denaturing loading buffer @H 8.0) containing 10 mM EDTA,
heated to 90 "C, cooled, and loaded on 12% (wlv) polyacrylamide sequencing gels. The
band patterns from gels were analyzed using a Molecular Dynamics Typhoon 94 10
Variable Mode Imager.
2.2.3 Data Analysis
All densitometry measurements were carried out using the ~ ~ ~ h o o n ~ " 9400 Variable
Mode Imager and Molecular Dynamics Image Quant 5.2 software for Windows NT.
Densitometry traces of entire lanes in a gel were obtained. The density of a peak of
interest, corresponding to damage at a particular nucleotide (e.g. G8) was taken as a
percentage (X) of the total signal contained within that particular lane. Such a
normalization was required to compensate for slightly uneven loading in different lanes.
The signal obtained from the addition of a particular concentration of analyte to the
relevant deoxyribosensor was then calculated as the percentage cleavage of the band in
the presence of analyte (XanaIfle) divided by the percentage cleavage of the corresponding
band in the complete absence of analyte (X,, analyte).
Calculation of the dissociation constant (Kd) was carried out using Graph Pad
Prism 4.0 assuming single site binding:
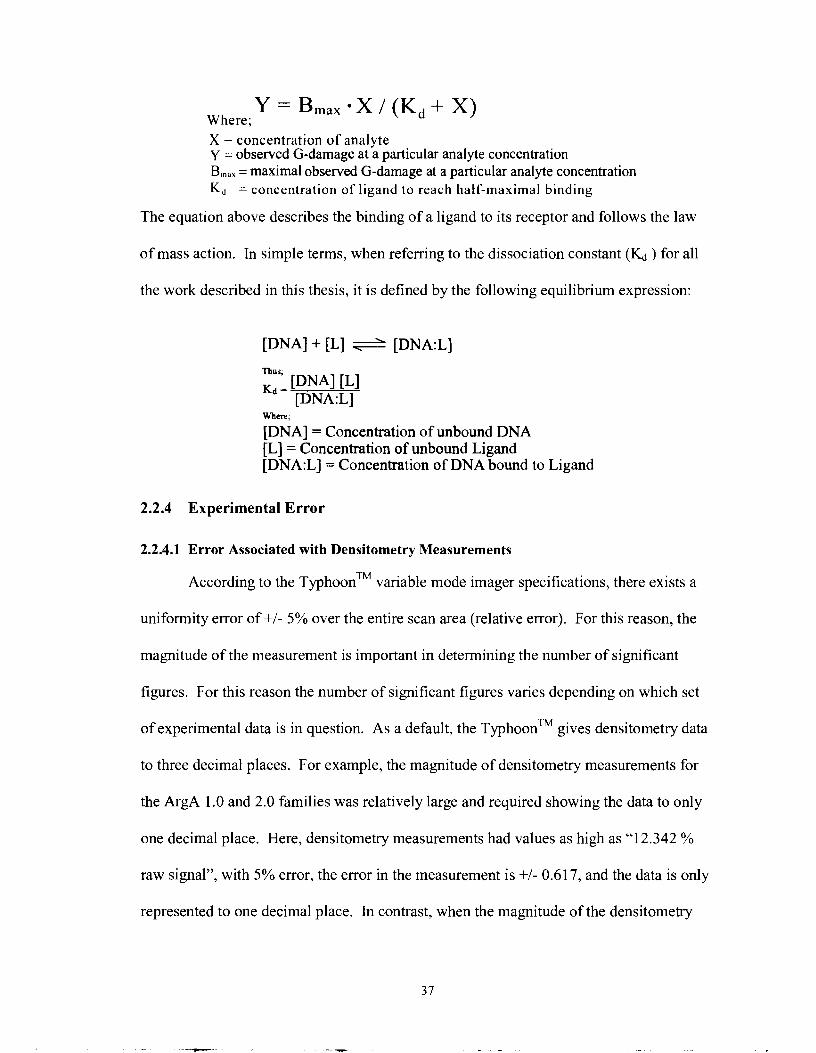
Where; Y = B m a x * X / ( K d + X)
X = concentration of analyte y = observed G-damage at a particular analyte concentration -
B,,,, = maximal observed G-damage at a particular analyte concentration K, = concentration of ligand to reach half-maximal binding
The equation above describes the binding of a ligand to its receptor and follows the law
of mass action. In simple terms, when referring to the dissociation constant (Kd ) for all
the work described in this thesis, it is defined by the following equilibrium expression:
[DNA] + [L] [DNA:L]
Thus;
Kd = [DNA1 [Ll [DNA:L]
Whm;
[DNA] = Concentration of unbound DNA [L] = Concentration of unbound Ligand [DNA:L] = Concentration of DNA bound to Ligand
2.2.4 Experimental Error
2.2.4.1 Error Associated with Densitometry Measurements
According to the TyphoonTM variable mode imager specifications, there exists a
uniformity error of +I- 5% over the entire scan area (relative error). For this reason, the
magnitude of the measurement is important in determining the number of significant
figures. For this reason the number of significant figures varies depending on which set
of experimental data is in question. As a default, the TyphoonTM gives densitometry data
to three decimal places. For example, the magnitude of densitometry measurements for
the ArgA 1.0 and 2.0 families was relatively large and required showing the data to only
one decimal place. Here, densitometry measurements had values as high as "12.342 %
raw signal", with 5% error, the error in the measurement is +I- 0.61 7, and the data is only
represented to one decimal place. In contrast, when the magnitude of the densitometry
data was relatively small the data was presented to 2 decimal places. For example; when
measurements were in the realm of "0.552 % raw signal", with 5% error, the error in the
measurement is +I- 0.027, and the data is only represented to 2 decimal places. For the
dissociation constant determination of the ArgA 2.0 deoxyribosensor and its cognate
ligand argininamide, 5 replicates were used to obtain the &value. The & given is 1.3
+I- 0.4 mM. The error described in this particular case is standard error.
2.2.4.2 Error Associated with Analyte concentrations
The initial high concentration (relatively) stock solutions of test analytes, such as
those for argininamide, arginine, lysine and spermidine were made using a Sartorius
CP2245S analytical balance and Class A volumetric flasks from Kimax. The Sartorious
analytical balance reads to the fourth decimal place and has a linearity error of +/- 0.0002
g. For making high concentration magnesium chlorides stocks a BP2 100s balance from
Sartorius was used, this balance reads to the second decimal place and has an error of +/-
0.02 g. Subsequent dilutions and experimental work was carried out using Gilson
Pipetman P pipetors, specifically, Pipetman P 10, P20, P200, and P 1000 were used.
These pipetors deliver volumes in the micro liter range and they are the standard tools for
volume delivery in the biosciences. For a full description of the tolerances and errors
associated with Gilson pipetors refer to the Gilson website. An example of analyte
concentrations including significant figures and errors are given for the argininamide
concentrations used in this work and represent the final concentrations in the reaction
vessel, Table 2- 1. Similarly, for concentrations of magnesium chloride used in this work
a table including significant figures and errors is given, see Table 2- 1 below.
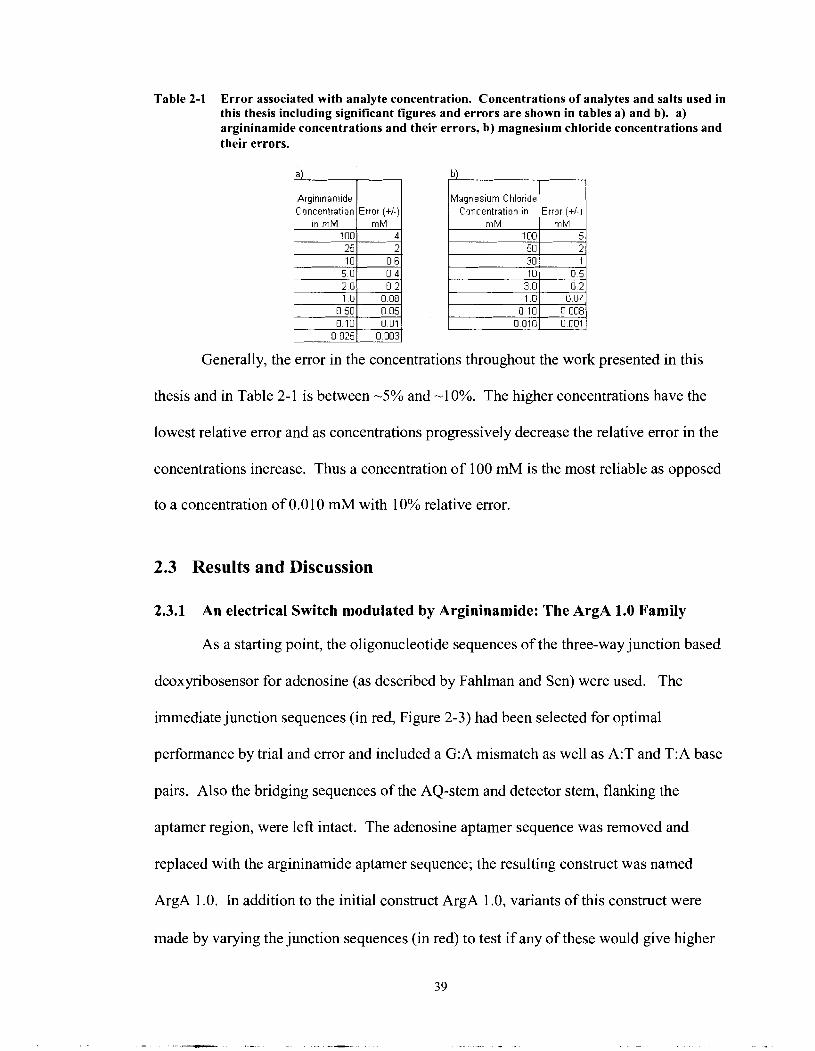
Table 2-1 Error associated with analyte concentration. Concentrations of analytes and salts used in this thesis including significant figures and errors are shown in tables a) and b). a) argininamide concentrations and their errors, b) magnesium chloride concentrations and their errors.
Generally, the error in the concentrations throughout the work presented in this
Argin~namide Concentration
in mM 100 25 10
5.0 2 0 1.0
0.50 0 1 0
0.025
thesis and in Table 2-1 is between -5% and -1 0%. The higher concentrations have the
Error (+/-) mM
4 2
0 6 0.4 0.2
0.08 0 05 0.01
0.003
lowest relative error and as concentrations progressively decrease the relative error in the
concentrations increase. Thus a concentration of 100 mM is the most reliable as opposed
to a concentration of 0.01 0 mM with 10% relative error.
2.3 Results and Discussion
2.3.1 An electrical Switch modulated by Argininamide: The ArgA 1.0 Family
As a starting point, the oligonucleotide sequences of the three-way junction based
deoxyribosensor for adenosine (as described by Fahlman and Sen) were used. The
immediate junction sequences (in red, Figure 2-3) had been selected for optimal
performance by trial and error and included a G:A mismatch as well as A:T and T:A base
pairs. Also the bridging sequences of the AQ-stem and detector stem, flanking the
aptamer region, were left intact. The adenosine aptamer sequence was removed and
replaced with the argininamide aptamer sequence; the resulting construct was named
ArgA 1 .O. In addition to the initial construct ArgA 1 .O, variants of this construct were
made by varying the junction sequences (in red) to test if any of these would give higher
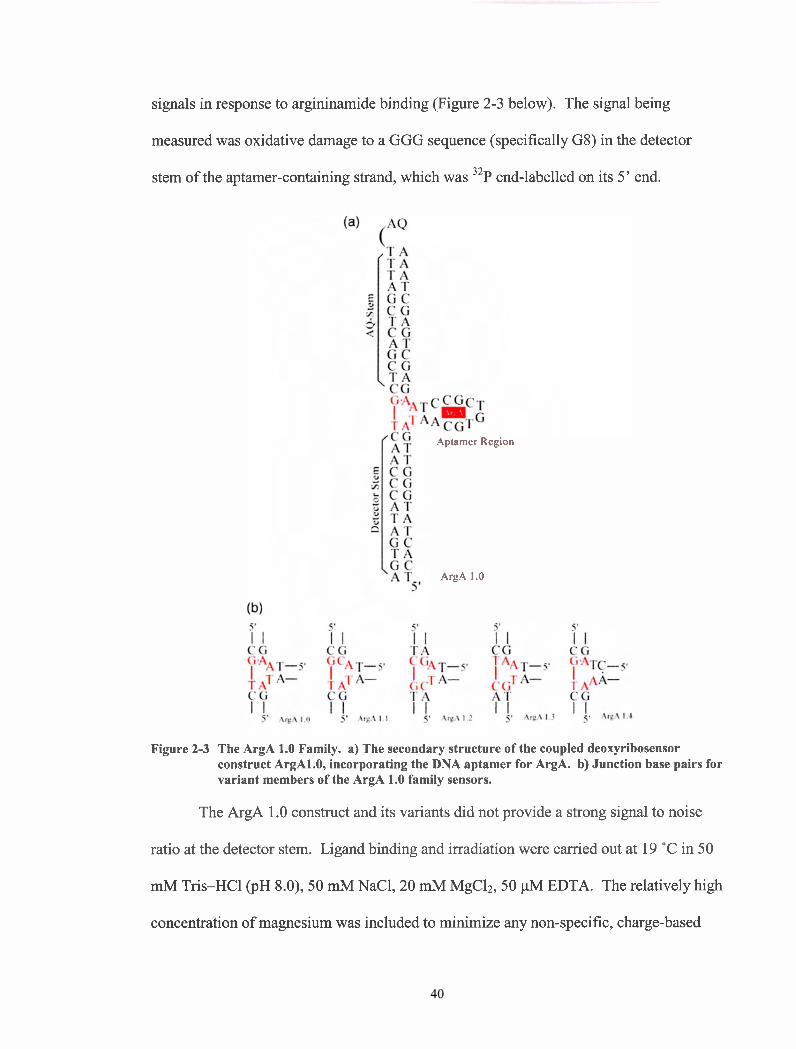
signals in response to argininamide binding (Figure 2-3 below). The signal being
measured was oxidative damage to a GGG sequence (specifically G8) in the detector
stem of the aptamer-containing strand, which was 3 2 ~ end-labelled on its 5' end.
Aptamer Region
ArgA 1.0
Figure 2-3 The ArgA 1.0 Family. a) The secondary structure of the coupled deoxyribosensor construct ArgAl.0, incorporating the DNA aptamer for ArgA. b) Junction base pairs for variant members of the ArgA 1.0 family sensors.
The ArgA 1.0 construct and its variants did not provide a strong signal to noise
ratio at the detector stem. Ligand binding and irradiation were carried out at 19 "C in 50
mM Tris-HC1 (pH 8.0), 50 rnM NaC1,20 mM MgC12, 50 pM EDTA. The relatively high
concentration of magnesium was included to minimize any non-specific, charge-based
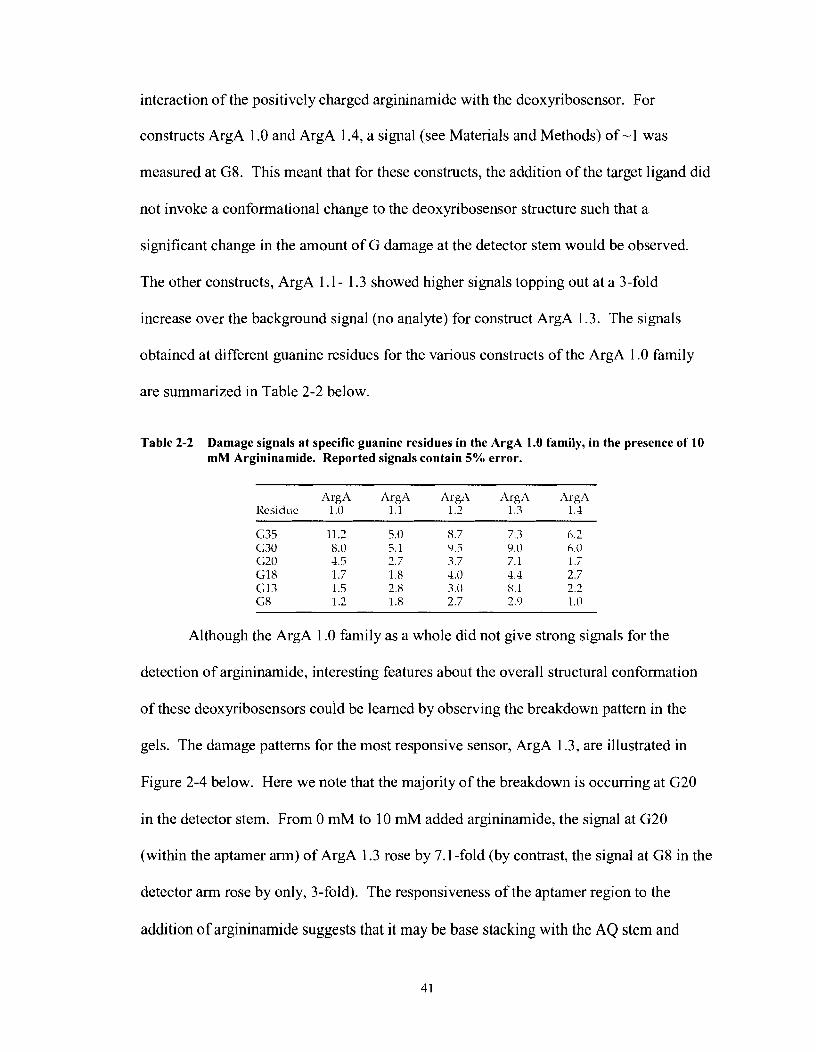
interaction of the positively charged argininamide with the deoxyribosensor. For
constructs ArgA 1.0 and ArgA 1.4, a signal (see Materials and Methods) of -1 was
measured at G8. This meant that for these constructs, the addition of the target ligand did
not invoke a conformational change to the deoxyribosensor structure such that a
significant change in the amount of G damage at the detector stem would be observed.
The other constructs, ArgA 1.1 - 1.3 showed higher signals topping out at a 3-fold
increase over the background signal (no analyte) for construct ArgA 1.3. The signals
obtained at different guanine residues for the various constructs of the ArgA 1.0 family
are summarized in Table 2-2 below.
Table 2-2 Damage signals at specific guanine residues in the ArgA 1.0 family, in the presence of 10 rnM Argininamide. Reported signals contain 5% error.
A r g A ArgA A r g A r\rg12 ,\rgA Residw 1.0 1.1 1.2 1.3 1.4
Although the ArgA 1.0 family as a whole did not give strong signals for the
detection of argininamide, interesting features about the overall structural conformation
of these deoxyribosensors could be learned by observing the breakdown pattern in the
gels. The damage patterns for the most responsive sensor, ArgA 1.3, are illustrated in
Figure 2-4 below. Here we note that the majority of the breakdown is occurring at G20
in the detector stem. From 0 mM to 10 mM added argininamide, the signal at G20
(within the aptamer arm) of ArgA 1.3 rose by 7.1 -fold (by contrast, the signal at G8 in the
detector arm rose by only, 3-fold). The responsiveness of the aptamer region to the
addition of argininamide suggests that it may be base stacking with the AQ stem and
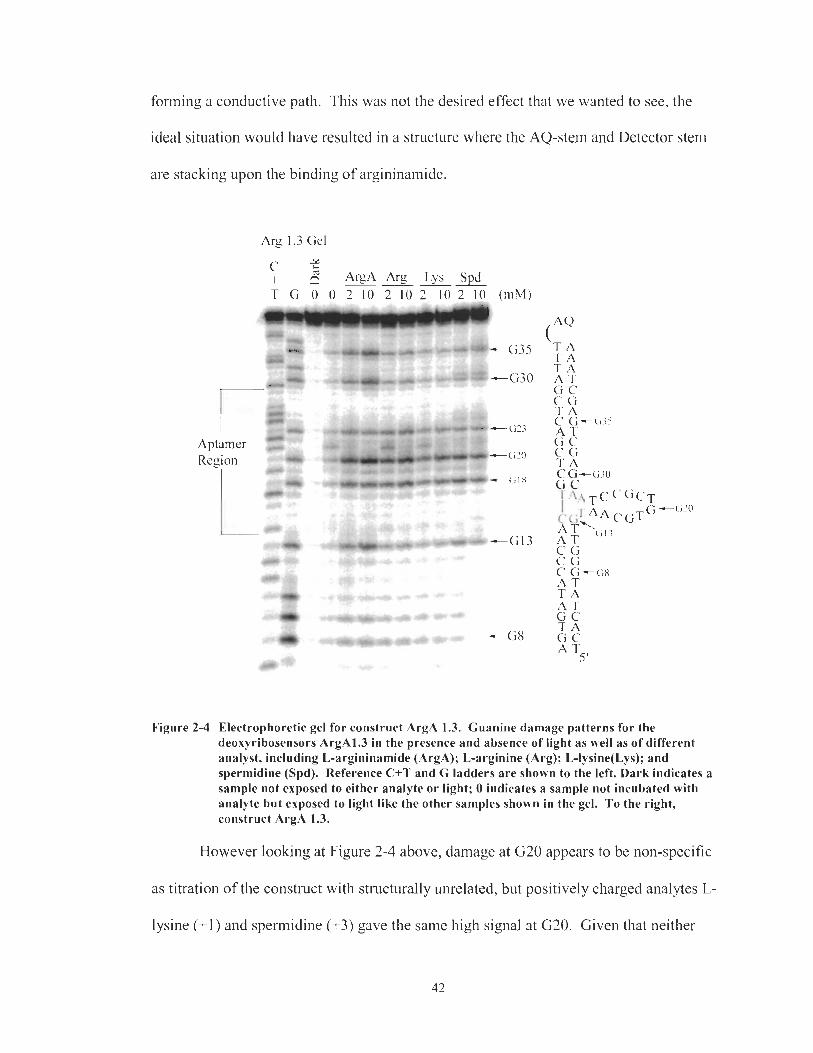
forming a conductive path. This was not the desired effect that we wanted to see, the
ideal situation would have resulted in a structure where the AQ-stem and Detector stem
are stacking upon the binding of argininamide.
+ - 4 ---- ArgA Arg Lys Spcl T G O 0 2 10 2 10 2 10 2 10 (HIM)
Aptamer Region
Figure 2-4 Electrophoretic gel for construct ArgA 1.3. Guanine damage patterns for the deoxyribosensors ArgA1.3 in the presence and absence of light as well as of different analyst, including L-argininamide (ArgA); L-arginine (Arg); L-lysine(Lys); and spermidine (Spd). Reference C+T and G ladders are shown to the left. Dark indicates a sample not exposed to either analyte or light; 0 indicates a sample not incubated with analyte but exposed to light like the other samples shown in the gel. To the right, construct ArgA 1.3.
However looking at Figure 2-4 above, damage at G20 appears to be non-specific
as titration of the construct with structurally unrelated, but positively charged analytes L-
lysine ( + I ) and spermidine (+3) gave the same high signal at G20. Given that neither
lysine or spermidine have any affinity for the aptamer, as the argininamide aptamer is
specific for the guanidinium group of argininamide (Harada and Frankel 1995), the signal
observed at G20 was probably a consequence of an overall, yet non-specific charge
stabilization and compaction of the deoxyribosensors that the high amount of MgC12
present could not normalize.
Another key feature of ArgA 1.3, (see Figure 2-4 above) is the substantial signal
increase at residues G30 and G35 located on the AQ-stem, out of proximity from the
aptamer region. The increase in damage at these residues is specific for the binding of
argininamide in contrast to lysine and spermidine. As the Argininamide concentration is
increased to 10 mM, a strong increase in the oxidative damage is observed at these
residues (G30 and G35). This demonstrates that argininamide binding to the aptamer
region can stabilize the entire construct, including areas far from the site of argininamide
binding (the AQ-stem) to a degree greater than the 20 mM rese resent in the reaction
buffer. As predicted, the presence of the amino acid L-arginine, which has a lower
affinity for the argininamide aptamer (-20 fold lower), gave lower signals than did
argininamide. This could be attributed to the difference in charge between the two amino
acids, L-argininamide having a +2 charge and L-Arginine having a +1 charge (Harada
and Frankel 1995). Table 2-3 below summarizes the signals measured at guanine
residues at different locations in construct ArgA 1.3 in response to different ligands.
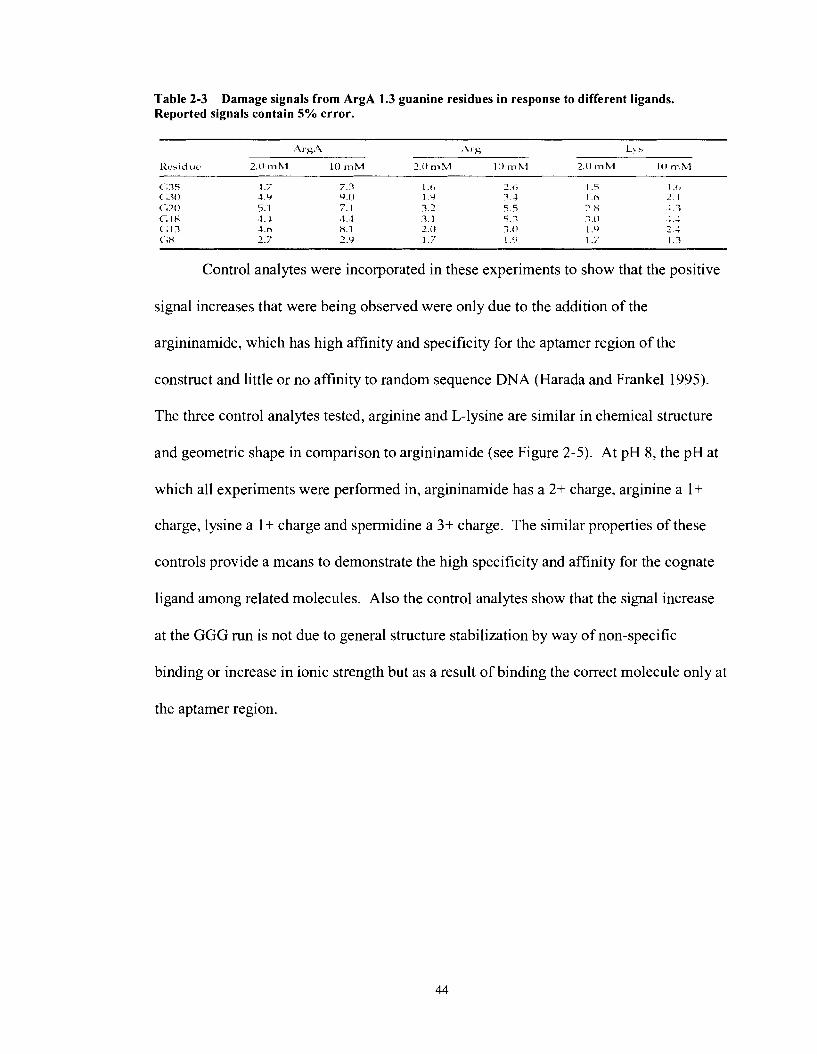
Table 2-3 Damage signals from ArgA 1.3 guanine residues in response to different ligands. Reported signals contain 5% error.
Control analytes were incorporated in these experiments to show that the positive
signal increases that were being observed were only due to the addition of the
argininamide, which has high affinity and specificity for the aptamer region of the
construct and little or no affinity to random sequence DNA (Harada and Frankel 1995).
The three control analytes tested, arginine and L-lysine are similar in chemical structure
and geometric shape in comparison to argininamide (see Figure 2-5). At pH 8, the pH at
which all experiments were performed in, argininamide has a 2+ charge, arginine a 1 +
charge, lysine a 1 + charge and spermidine a 3+ charge. The similar properties of these
controls provide a means to demonstrate the high specificity and affinity for the cognate
ligand among related molecules. Also the control analytes show that the signal increase
at the GGG run is not due to general structure stabilization by way of non-specific
binding or increase in ionic strength but as a result of binding the correct molecule only at
the aptamer region.
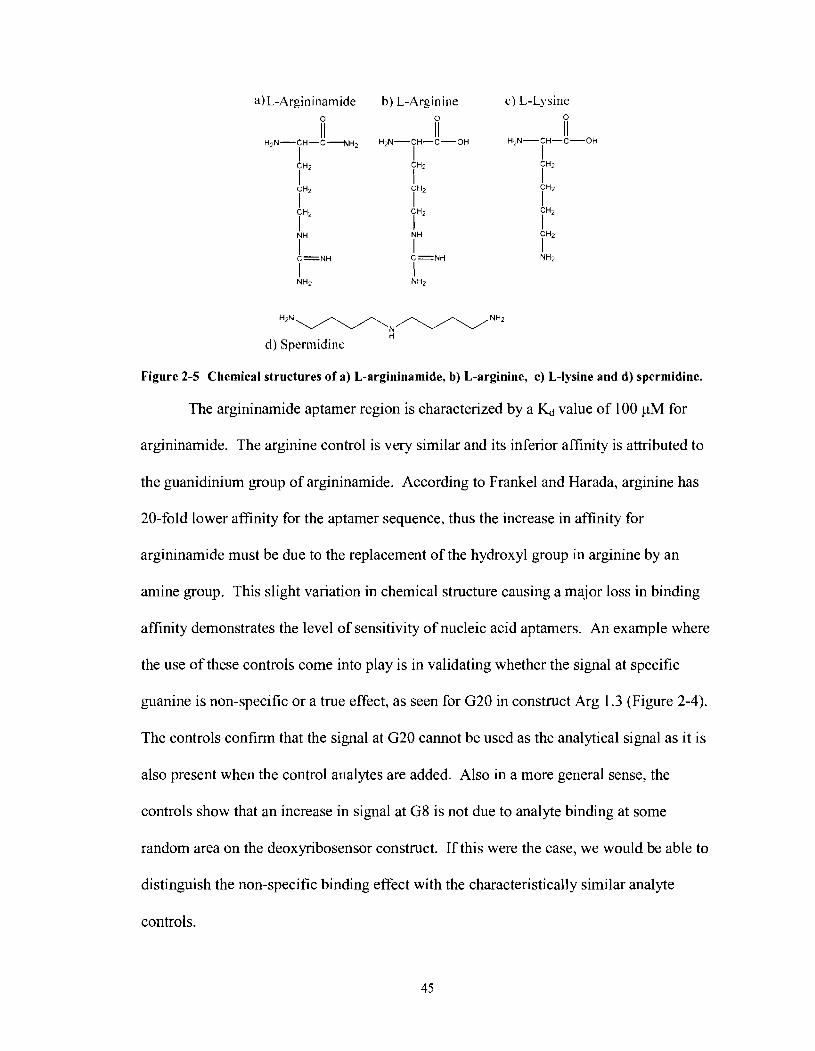
d) Spermidine
Figure 2-5 Chemical structures of a) L-argininamide, b) L-arginine, c) L-lysine and d) spermidine.
The argininamide aptamer region is characterized by a Kd value of 100 yM for
argininamide. The arginine control is very similar and its inferior affinity is attributed to
the guanidinium group of argininamide. According to Frankel and Harada, arginine has
20-fold lower affinity for the aptamer sequence, thus the increase in affinity for
argininamide must be due to the replacement of the hydroxyl group in arginine by an
amine group. This slight variation in chemical structure causing a major loss in binding
affinity demonstrates the level of sensitivity of nucleic acid aptamers. An example where
the use of these controls come into play is in validating whether the signal at specific
guanine is non-specific or a true effect, as seen for G20 in construct Arg 1.3 (Figure 2-4).
The controls confirm that the signal at G20 cannot be used as the analytical signal as it is
also present when the control analytes are added. Also in a more general sense, the
controls show that an increase in signal at GS is not due to analyte binding at some
random area on the deoxyribosensor construct. If this were the case, we would be able to
distinguish the non-specific binding effect with the characteristically similar analyte
controls.
2.3.2 The ArgA 2.0 Family
The difficulties that arose with the ArgA 1.0 family, in regard to the low signal,
rooted from the fact that we did not have control over which stem of the three-way
junction based deoxyribosensor would stack with the photo-oxidant containing AQ-stem.
Unfortunately, it appeared that most of the charge transport was occumng between the
AQ-stem and Aptamer region. To obtain a better handle on this matter we needed a
system where we could control the stacking of the stems. For regular DNA three-way
junctions, consisting of three fully base-paired helical stems of DNA (rather than two
helical stems and an aptamer loop, or arm) certain empirical rules have been established
to predict the overall conformation of the junction as a function of the identities of the
base-pairs immediately bordering the junction. Welch (Welch et al. 1995), as well as van
Buuren (van Buuren et al. 2000) established that the presence of a two nucleotide bulge
at the junction leads to preferential stacking of two of the three stems of the three-way
junction, and determined the role of specific junction base pairs in this process.
Based on their rules, a redesign of the ArgA 1.0 family of deoxyribosensors was
undertaken. These rules would give us control over the final stacked structure of the
deoxyribosensors in the presence of its cognate ligand, argininamide, that being one
where the AQ-stem and Detector stem are stacked. The stacking rules, however, strictly
hold where three fully base-paired helices (along with the unpaired two-nucleotide bulge)
constitute a three-way junction. In our case we had two helical stems and an aptamer
loop. The rules for preferential stacking dictate that it is the identity of the penultimate
base pairs of the in each stem where the junction is formed that determine which arms
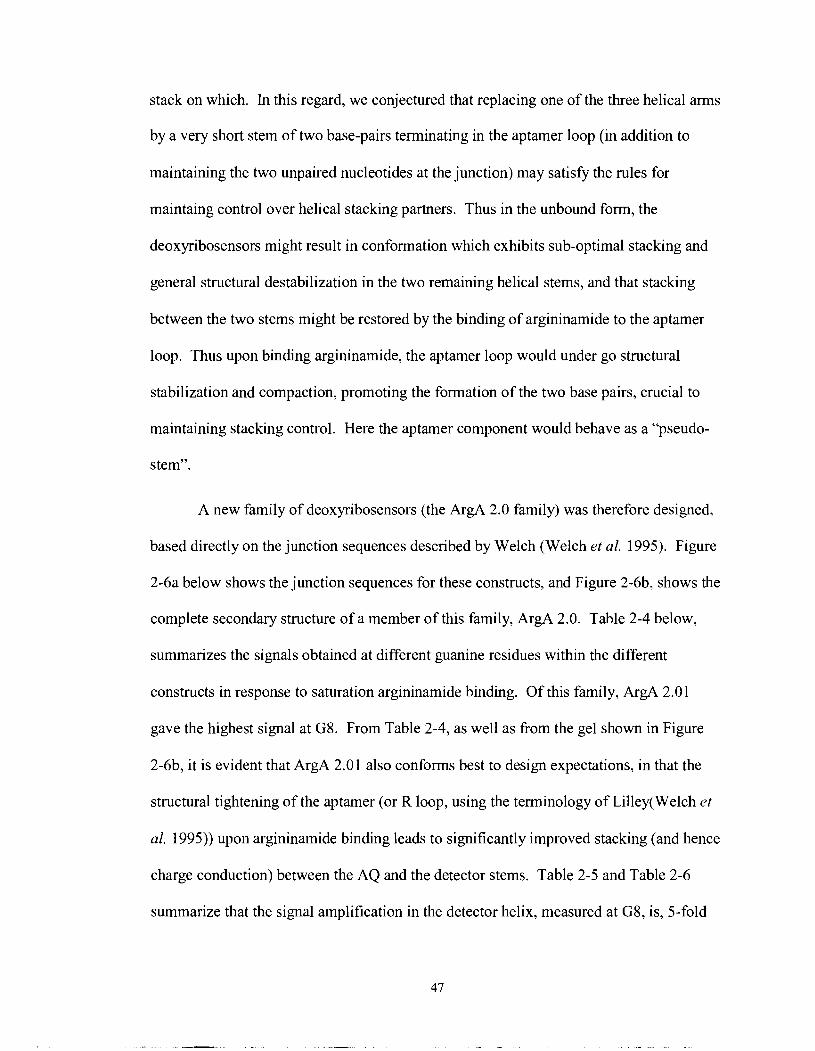
stack on which. In this regard, we conjectured that replacing one of the three helical arms
by a very short stem of two base-pairs terminating in the aptamer loop (in addition to
maintaining the two unpaired nucleotides at the junction) may satisfy the rules for
maintaing control over helical stacking partners. Thus in the unbound form, the
deoxyribosensors might result in conformation which exhibits sub-optimal stacking and
general structural destabilization in the two remaining helical stems, and that stacking
between the two stems might be restored by the binding of argininamide to the aptamer
loop. Thus upon binding argininamide, the aptamer loop would under go structural
stabilization and compaction, promoting the formation of the two base pairs, crucial to
maintaining stacking control. Here the aptamer component would behave as a "pseudo-
stem".
A new family of deoxyribosensors (the ArgA 2.0 family) was therefore designed,
based directly on the junction sequences described by Welch (Welch et al. 1995). Figure
2-6a below shows the junction sequences for these constructs, and Figure 2-6b, shows the
complete secondary structure of a member of this family, ArgA 2.0. Table 2-4 below,
summarizes the signals obtained at different guanine residues within the different
constructs in response to saturation argininamide binding. Of this family, ArgA 2.0 1
gave the highest signal at G8. From Table 2-4, as well as from the gel shown in Figure
2-6b, it is evident that ArgA 2.01 also conforms best to design expectations, in that the
structural tightening of the aptamer (or R loop, using the terminology of Lilley(We1ch et
al. 1995)) upon argininamide binding leads to significantly improved stacking (and hence
charge conduction) between the AQ and the detector stems. Table 2-5 and Table 2-6
summarize that the signal amplification in the detector helix, measured at G8, is, 5-fold
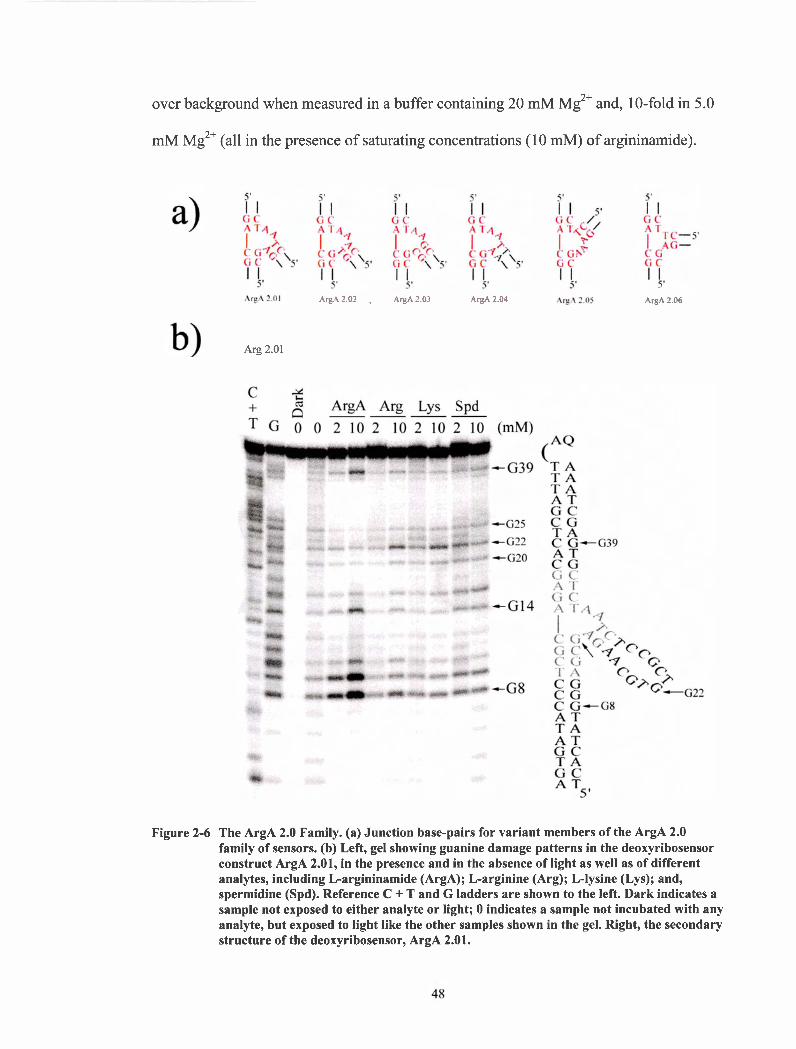
over background when measured in a buffer containing 20 mM M ~ ~ + and, 10-fold in 5.0
mM M ~ ~ + (all in the presence of saturating concentrations (10 mM) of argininamide).
Arg 2.01
ArgA 2.02 . AryA 2.03 ArgA 2.M ArgA 2.06
Figure 2-6 The ArgA 2.0 Family. (a) Junction base-pairs for variant members of the ArgA 2.0 family of sensors. (b) Left, gel showing guanine damage patterns in the deoxyribosensor construct ArgA 2.01, in the presence and in the absence of light as well as of different analytes, including L-argininamide (ArgA); L-arginine (Arg); L-lysine (Lys); and, spermidine (Spd). Reference C + T and G ladders are shown to the left. Dark indicates a sample not exposed to either analyte or light; 0 indicates a sample not incubated with any analyte, but exposed to light like the other samples shown in the gel. Right, the secondary structure of the deoxyribosensor, ArgA 2.01.
Furthermore, the large signal increase observed for ArgA 2.01 was also ligand
specific. Figure 2-6b as well as Table 2-5 and Table 2-6, show that the large increase in
signal at G8 of construct ArgA 2.0 1 was only produced by the cognate ligand,
argininamide, but poorly by the weak ligand arginine and the structurally similar ligands
L-lysine and spermidine. In contrast with the constructs of the ArgA 1.0 family, the
ArgA 2.0 family constructs gave relatively low levels of ligand-induced signal at the
guanine residues of the aptamer loop (for instance, G22). It can be concluded that the
aptamer region in these constructs is not the preferred stacking partner for the AQ stem
under all concentrations of ligand tested.
Table 2-4 Damage signals at specific guanine residues in the ArgA 2.0 family, in the presence of 10 mM argininamide. Reported signals contain 5% error.
ArgA ArgA ArgA ArgA ArgA ArgA Residue 2.01 2.02 2.03 2.04 2.05 2.06
Table 2-5 Damage signals at ArgA 2.01 guanine residues in response to different ligands in the presence of 20 mM magnesium. Reported signals contain 5% error.
A r p \ i2 r g 1 . n Spd
Residue 2.0nih4 10 nib7 2 . 0 d f I0 lnh! 2.0mM 10 mM 7.0mM 10 mhl
2.3.2.1 Magnesium Dependence on ArgA 2.01
The signal at G8 in the ArgA 2.01 construct was studied as a function of
magnesium concentration. Here, we wanted to see if varying the magnesium
concentration while keeping all other factors constant, would give a higher signal at the
G8 position. The gel of the magnesium dependence is shown in Figure 2-7 below. It was
found that at constant temperature (1 9"C), the G8 signal increased progressively in the
presence of 0-5mM magnesium, but decreased beyond this concentration.
G8 Damage Dependcnce on Magnesium Chloride Concetration (Holding Argininamide Constant at 10 mM)
Fold Increse in G8 Dnrnagc
? C - .- 4.9 7 .8 0,2 6.4
Figure 2-7 G8 damage dependence on magnesium chloride concentration for construct ArgA 2.01. Damage signals for a particular concentration were obtained in the presence or absence of 10 mM ArgA and the fold increase in C8 damage is reported. Reported signals contain 5% error.
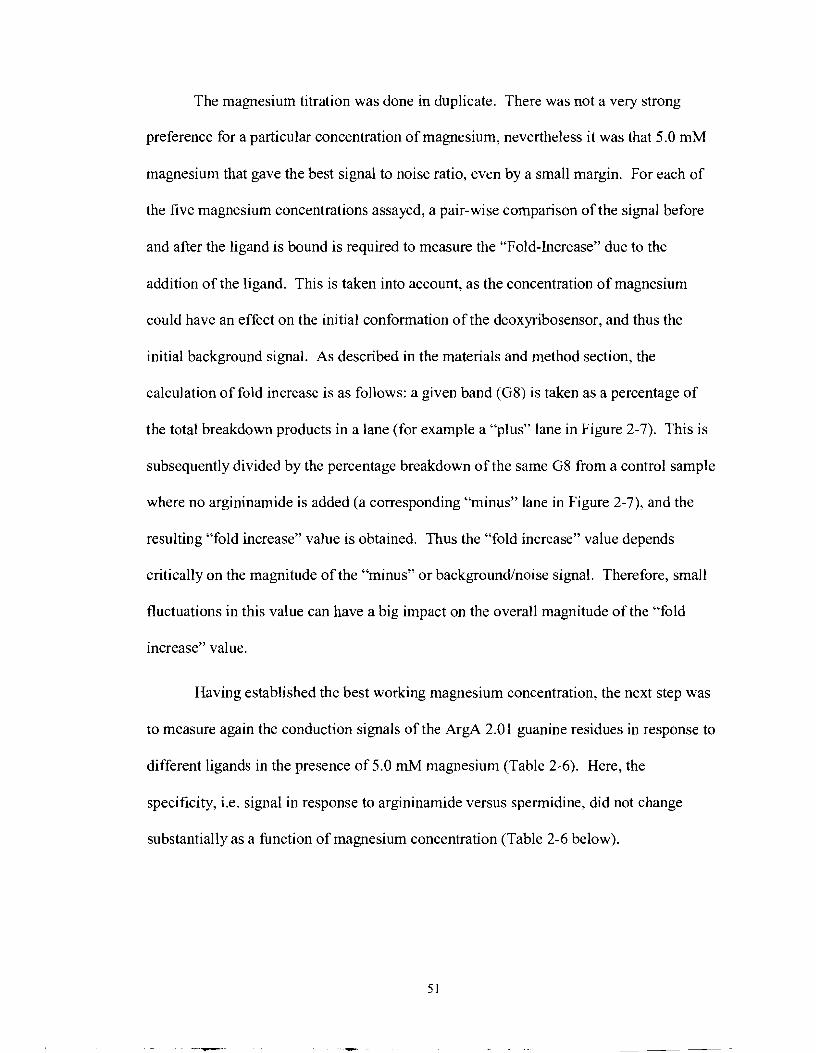
The magnesium titration was done in duplicate. There was not a very strong
preference for a particular concentration of magnesium, nevertheless it was that 5.0 mM
magnesium that gave the best signal to noise ratio, even by a small margin. For each of
the five magnesium concentrations assayed, a pair-wise comparison of the signal before
and after the ligand is bound is required to measure the "Fold-Increase" due to the
addition of the ligand. This is taken into account, as the concentration of magnesium
could have an effect on the initial conformation of the deoxyribosensor, and thus the
initial background signal. As described in the materials and method section, the
calculation of fold increase is as follows: a given band (G8) is taken as a percentage of
the total breakdown products in a lane (for example a "plus" lane in Figure 2-7). This is
subsequently divided by the percentage breakdown of the same G8 from a control sample
where no argininamide is added (a corresponding "minus" lane in Figure 2-7), and the
resulting "fold increase" value is obtained. Thus the "fold increase" value depends
critically on the magnitude of the "minus" or background/noise signal. Therefore, small
fluctuations in this value can have a big impact on the overall magnitude of the "fold
increase7' value.
Having established the best working magnesium concentration, the next step was
to measure again the conduction signals of the ArgA 2.0 1 guanine residues in response to
different ligands in the presence of 5.0 mM magnesium (Table 2-6). Here, the
specificity, i.e. signal in response to argininamide versus spennidine, did not change
substantially as a function of magnesium concentration (Table 2-6 below).
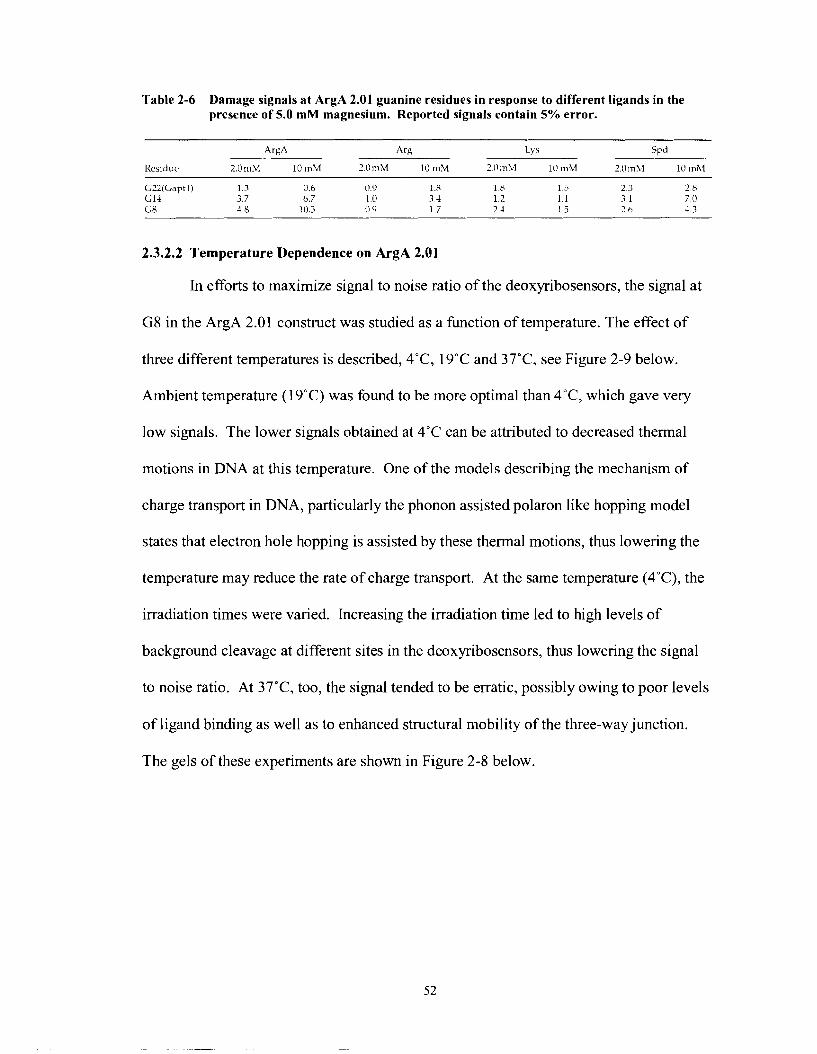
Table 2-6 Damage signals at ArgA 2.01 guanine residues in response to different ligands in the presence of 5.0 mM magnesium. Reported signals contain 5% error.
ArgA 4 Lk 5 Spl
I<esldue 2 OmM 10 1nb1 2 OmXt 10 n1?4 2 01nhl 10 m,M 2 (1 1nh1 10 1nR1
2.3.2.2 Temperature Dependence on ArgA 2.01
In efforts to maximize signal to noise ratio of the deoxyribosensors, the signal at
G8 in the ArgA 2.01 construct was studied as a function of temperature. The effect of
three different temperatures is described, 4"C, 19•‹C and 37"C, see Figure 2-9 below.
Ambient temperature (19•‹C) was found to be more optimal than 4"C, which gave very
low signals. The lower signals obtained at 4•‹C can be attributed to decreased thermal
motions in DNA at this temperature. One of the models describing the mechanism of
charge transport in DNA, particularly the phonon assisted polaron like hopping model
states that electron hole hopping is assisted by these thermal motions, thus lowering the
temperature may reduce the rate of charge transport. At the same temperature (4"C), the
irradiation times were varied. Increasing the irradiation time led to high levels of
background cleavage at different sites in the deoxyribosensors, thus lowering the signal
to noise ratio. At 37"C, too, the signal tended to be erratic, possibly owing to poor levels
of ligand binding as well as to enhanced structural mobility of the three-way junction.
The gels of these experiments are shown in Figure 2-8 below.
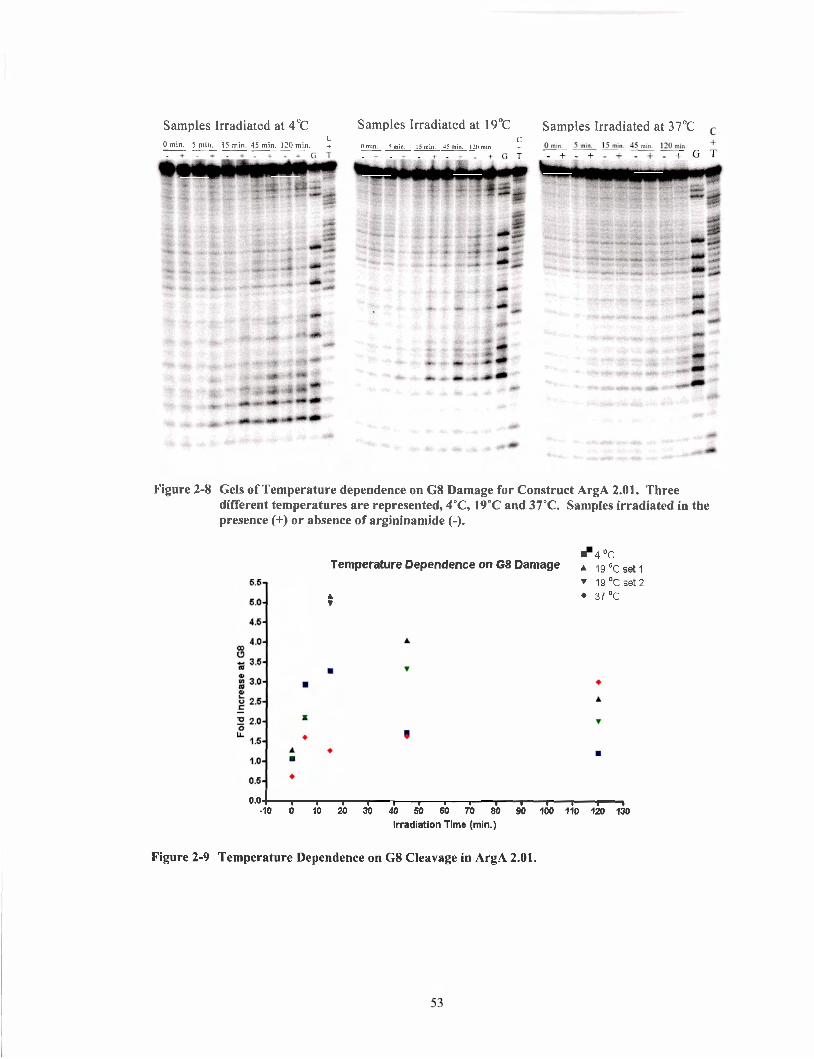
Samples Irradiated at 4 " ~ Samples Irradiated at 19OC Samples Irradiated at 37•‹C C
0 min. 5 min. 15 min. 45 min. I20 min. + - - - - C
Omln. 5 m m 15 mi". 45 mi". 1 3 1 min +
Figure 2-8 Gels of Temperature dependence on G8 Damage for Construct ArgA 2.01. Three different temperatures are represented, 4"C, 19•‹C and 37•‹C. Samples irradiated in the presence (+) or absence of argininamide (-).
4Oc Temperature Dependence on G8 Damage A q9 oc
r 1 9 ' ~ set2 A v + 37 Oc
o.o! , , , , r m , . , , , , , -10 0 10 20 30 40 50 60 70 80 90 100 110 120 130
Irradiation Time (min.)
Figure 2-9 Temperature Dependence on G8 Cleavage in ArgA 2.01.
2.3.2.3 Signal Sensitivity and Specificity for the Cognate Ligand, Argininamide
The mode of interaction and binding affinity of the free DNA aptamer for
argininamide, its ligand, have been studied extensively; the Kd for the aptamer-
argininamide complex has been measured to be, 100 pM (Harada and Frankel 1995). We
wished to investigate whether the sensitivity of these deoxyribosensors mirrored the
intrinsic affinity of the free aptamer for argininamide. Figure 2-10 shows the signals
obtained at various guanine residues within the ArgA 2.01 construct, measured in buffer
containing 5.0 mM M ~ * + . It was found that at argininamide concentrations greater than
10 mM the signal at G8 plateaued at -10-fold compared to the signal in the absence of
analyte. The effective dissociation constant (Kd) for the deoxyribosensor-aptamer
complex was 1.3 +I- 0.4 mM. This dissociation constant was deduced from five replicate
experiments. The structural or other factors contributing to this lower sensitivity of the
aptamer-containing sensor, relative to the free aptamer itself, remain to be identified; it is
likely that the structure of the aptamer is less stable in the context of being structurally
coupled to the bulky deoxyribosensor construct. In addition, ligand-binding is likely the
sole fuel for the gross conformational rearrangement of the deoxyribosensor. The
"energetic price" paid for this may be reflected in the weaker binding constant of ligand
to aptamer within the construct versus the free aptamer.
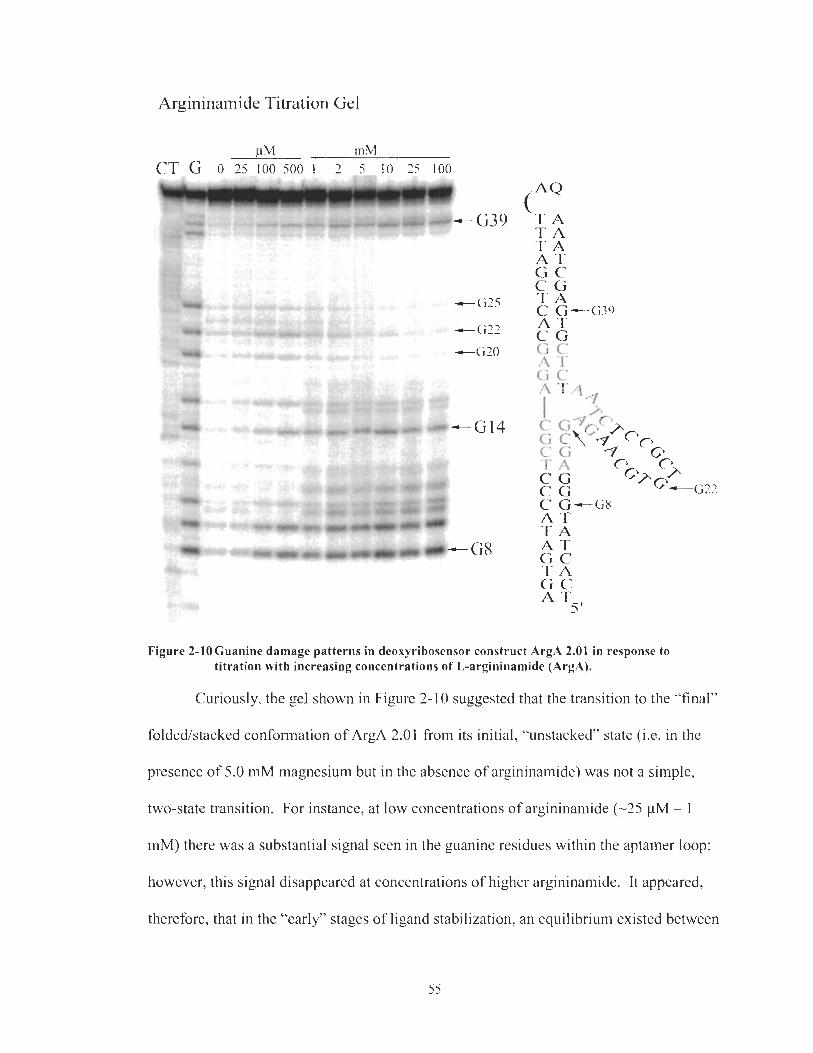
Argininamide Titration Gel
Figure 2-1OGuanine damage patterns in deoxgribosensor construct ArgA 2.01 in response to titration with increasing concentrations of L-argininarnide (ArgA).
Curiously, the gel shown in Figure 2-1 0 suggested that the transition to the "final"
folded/stacked conformation of ArgA 2.01 from its initial, "unstacked" state (i.e. in the
presence of 5.0 mM magnesium but in the absence of argininamide) was not a simple,
two-state transition. For instance, at low concentrations of argininamide (-25 pM - 1
mM) there was a substantial signal seen in the guanine residues within the aptamer loop;
however, this signal disappeared at concentrations of higher argininamide. It appeared.
therefore, that in the "early" stages of ligand stabilization, an equilibrium existed between
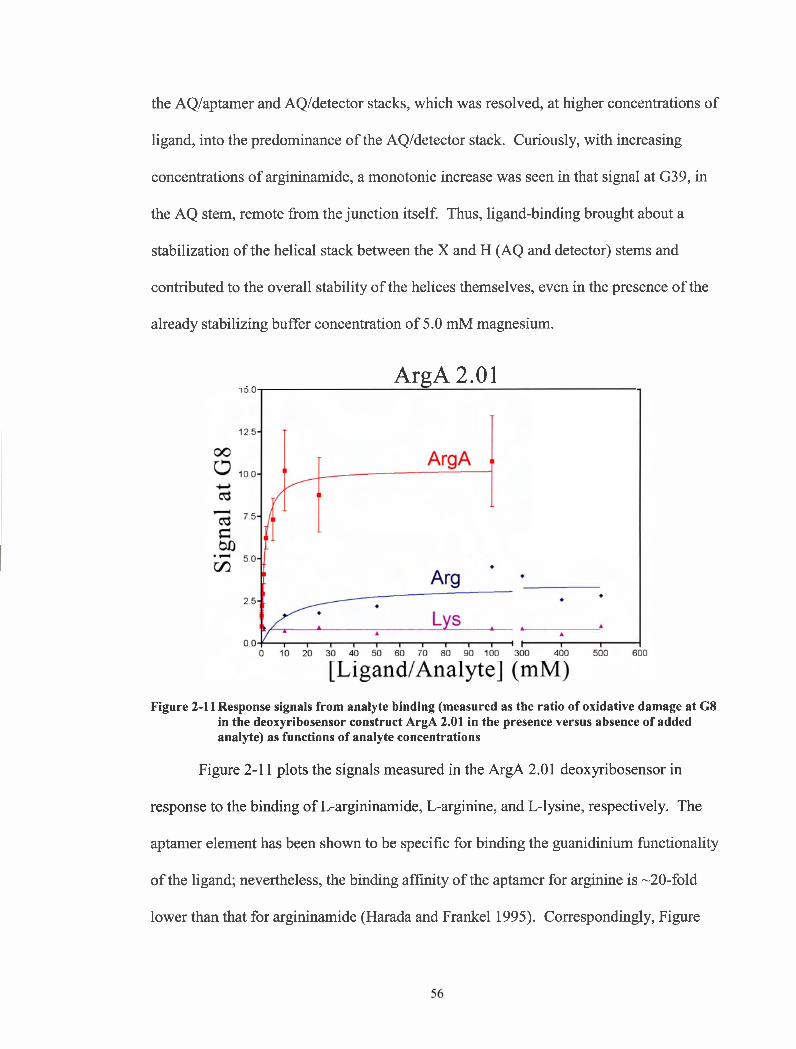
the AQIaptamer and AQIdetector stacks, which was resolved, at higher concentrations of
ligand, into the predominance of the AQIdetector stack. Curiously, with increasing
concentrations of argininamide, a monotonic increase was seen in that signal at G39, in
the AQ stem, remote from the junction itself. Thus, ligand-binding brought about a
stabilization of the helical stack between the X and H (AQ and detector) stems and
contributed to the overall stability of the helices themselves, even in the presence of the
already stabilizing buffer concentration of 5.0 mM magnesium.
AreA 2.01
Figure 2-11 Response signals from analyte binding (measured as the ratio of oxidative damage at G8 in the deoxyribosensor construct ArgA 2.01 in the presence versus absence of added analyte) as functions of analyte concentrations
Figure 2-1 1 plots the signals measured in the ArgA 2.01 deoxyribosensor in
response to the binding of L-argininamide, L-arginine, and L-lysine, respectively. The
aptamer element has been shown to be specific for binding the guanidinium fbnctionality
of the ligand; nevertheless, the binding affinity of the aptamer for arginine is -20-fold
lower than that for argininamide (Harada and Frankel 1995). Correspondingly, Figure
2-1 1 shows that a significantly higher concentration of arginine (50 mM) was required to
obtain the saturating arginine signal from the deoxynbosensor. Figure 2- 1 1 shows
clearly the specificity of the deoxyribosensor for its "natural" ligand, argininamide. The
aptamer has no special affinity for binding the amino acid lysine; correspondingly, the
signal response to lysine remains at the background level for the entire concentration
range of lysine tested. Another interesting observation is that even at saturation, the peak
signal from arginine binding is substantially lower than that obtained from argininamide
binding. The high-resolution NMR structure reported for this aptamer has been solved
with bound argininamide (Robertson et al. 2000). It may very well be that arginine does
not bind to the aptamer in exactly the same way. Moreover, conformational change
induced in the aptamer by arginine binding may not be identical with or, indeed, as
pronounced as that produced by argininamide binding. Changes in the overall
deoxyribosensor conformation, as monitored by changes in damage signal intensities,
may thus be different for saturation binding of argininamide and arginine.
2.3.3 Expanding the versatility of the ArgA 2.0 Deoxyribosensor
At this point, a working biosensor made of DNA for the detection of argininamide
had been established and the results were published in the Journal of Molecular Biology
(Sankar and Sen 2004). The original goal of the project was to see if a general construct
could be designed such that replacement of only the aptamer domain by a different
aptamer would change the specificity of the sensor. This is what was attempted in this
section, and the RNA aptamer for theophylline was chosen as the new recognition
element. Theophylline is a small, uncharged xanthine based molecule and differs from
caffeine by only a methyl group at the N-7 position (Figure 2-12 below). The aptamer
has a Kd of 0.1 pM for theophylline, and this binding affinity this 10,000 fold greater than
the aptamer's affinity for caffeine (Jenison et al. 1994). Theophylline is a biomedically
important compound, as it is used widely as a bronchodilator in the treatment of asthma,
bronchitis and emphysema (Hendeles and Weinberger 1983). Theophylline has a narrow
therapeutic index; not enough and the drug has no noticeable effect, too much and it
becomes toxic. Dosages vary from patient to patient depending on how they metabolize
the drug, one person may require a dosage 4 to 5 times higher than another (Hendeles and
Weinberger 1983). Thus, a patient wishing to make this drug work for them safely and
effectively must have their blood tested for the amount of theophylline present in order to
decide on a dosage that is right for them. Levels of theophylline in the blood must be
monitored carefully, as chemically similar compounds like theobromine (3,7-
dimethylxanthine), which like caffeine can be found in the blood stream. The RNA
theophylline aptamer does just that, it provides high specificity and affinity for its
cognate ligand (Jenison et al. 1994).
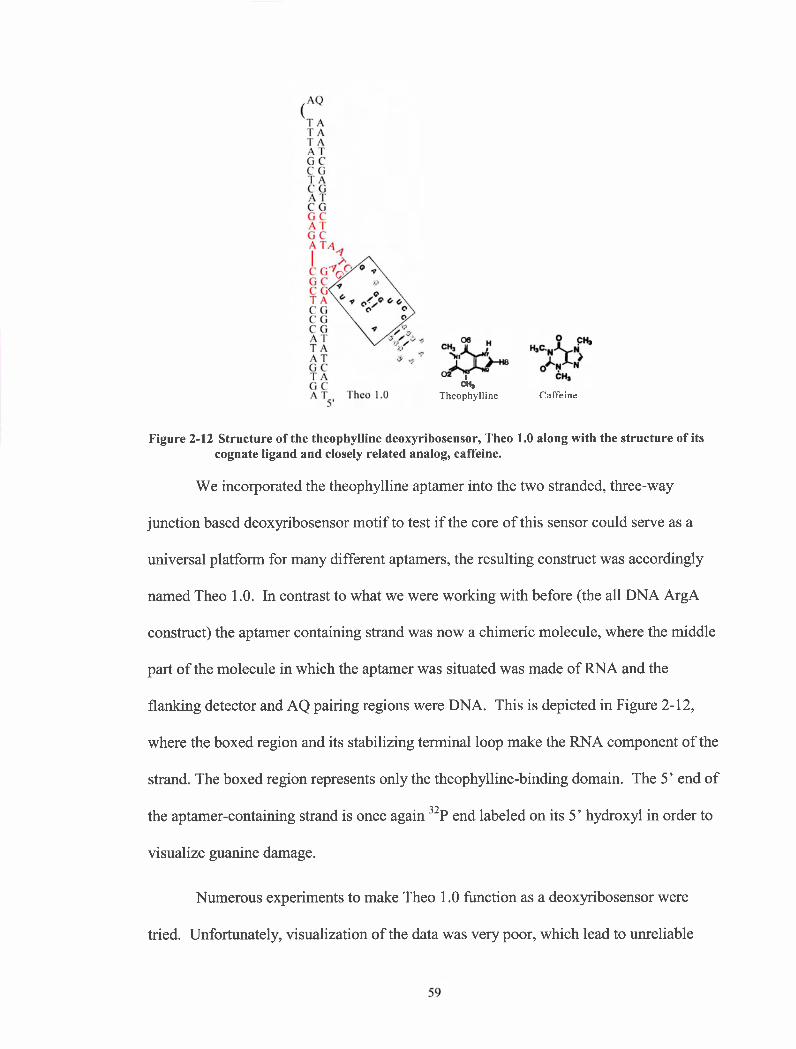
& Theophylline Caffeine
Figure 2-12 Structure of the theophylline deoxyribosensor, Theo 1.0 along with the structure of its cognate ligand and closely related analog, caffeine.
We incorporated the theophylline aptamer into the two stranded, three-way
junction based deoxyribosensor motif to test if the core of this sensor could serve as a
universal platform for many different aptamers, the resulting construct was accordingly
named Theo 1 .O. In contrast to what we were working with before (the all DNA ArgA
construct) the aptamer containing strand was now a chimeric molecule, where the middle
part of the molecule in which the aptamer was situated was made of RNA and the
flanking detector and AQ pairing regions were DNA. This is depicted in Figure 2- 12,
where the boxed region and its stabilizing terminal loop make the RNA component of the
strand. The boxed region represents only the theophylline-binding domain. The 5' end of
the aptamer-containing strand is once again 3 2 ~ end labeled on its 5' hydroxyl in order to
visualize guanine damage.
Numerous experiments to make Theo 1.0 function as a deoxyribosensor were
tried. Unfortunately, visualization of the data was very poor, which lead to unreliable
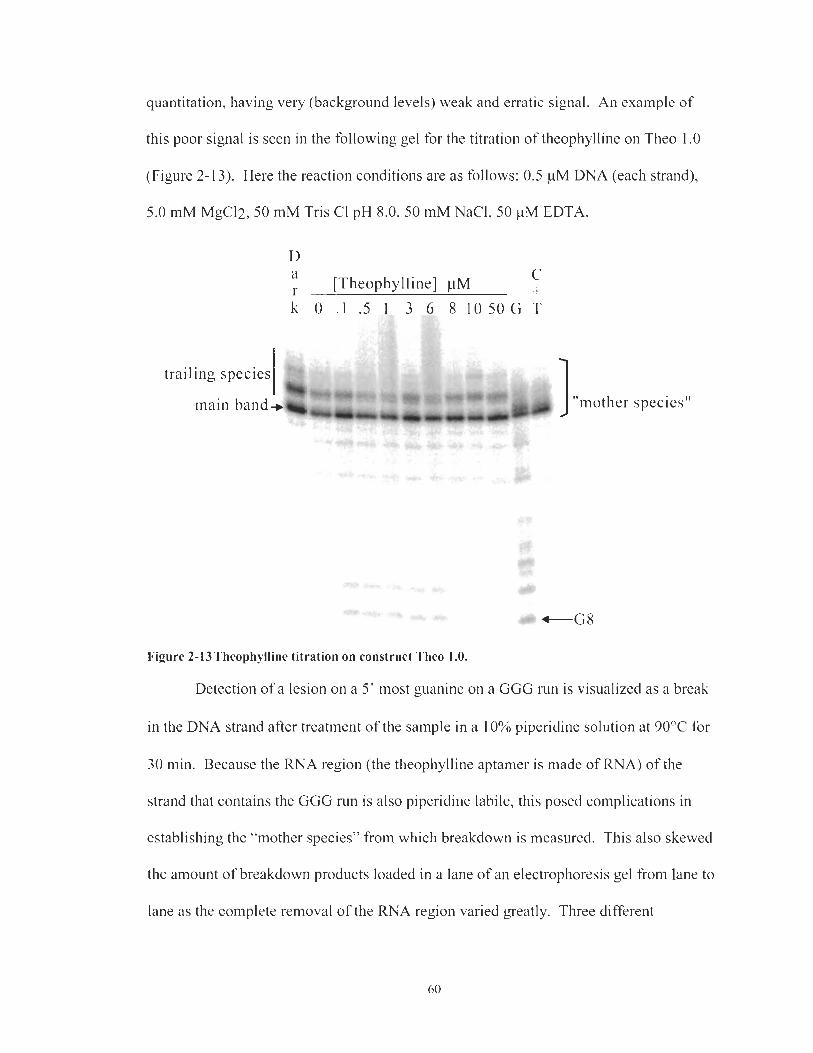
quantitation, having very (background levels) weak and erratic signal. An example of
this poor signal is seen in the following gel for the titration of theophylline on Theo 1.0
(Figure 2- 13). Here the reaction conditions are as follows: 0.5 pM DNA (each strand),
5.0 mM MgC12,50 mM Tris CI pH 8.0,50 mM NaCI, 50 pM EDTA.
trailing species
main band+ mother species"
-G8
Figure 2-13Theophylline titration on construct Theo 1.0.
Detection of a lesion on a 5' most guanine on a GGG run is visualized as a break
in the DNA strand after treatment of the sample in a 10% piperidine solution at 90•‹C for
30 min. Because the RNA region (the theophylline aptamer is made of RNA) of the
strand that contains the GGG run is also piperidine labile, this posed complications in
establishing the "mother species" from which breakdown is measured. This also skewed
the amount of breakdown products loaded in a lane of an electrophoresis gel from lane to
lane as the complete removal of the RNA region varied g-eatly. Three different
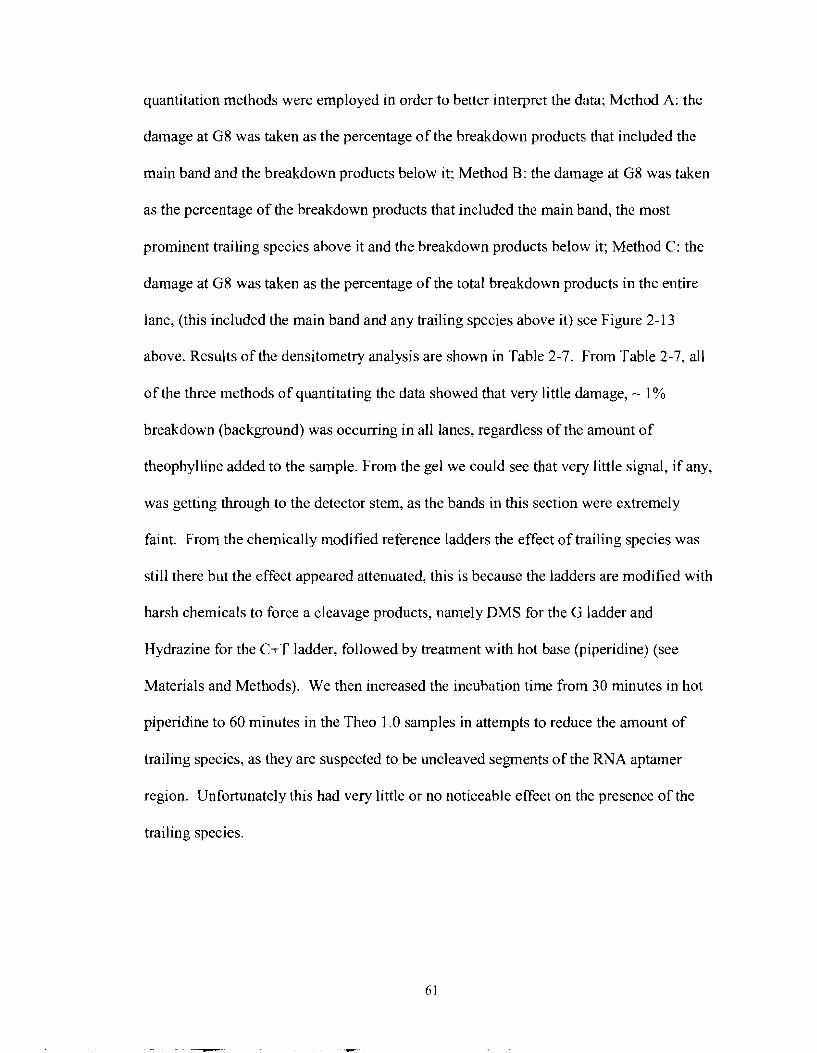
quantitation methods were employed in order to better interpret the data; Method A: the
damage at G8 was taken as the percentage of the breakdown products that included the
main band and the breakdown products below it; Method B: the damage at G8 was taken
as the percentage of the breakdown products that included the main band, the most
prominent trailing species above it and the breakdown products below it; Method C: the
damage at G8 was taken as the percentage of the total breakdown products in the entire
lane, (this included the main band and any trailing species above it) see Figure 2- 13
above. Results of the densitometry analysis are shown in Table 2-7. From Table 2-7, all
of the three methods of quantitating the data showed that very little damage, - 1 %
breakdown (background) was occurring in all lanes, regardless of the amount of
theophylline added to the sample. From the gel we could see that very little signal, if any,
was getting through to the detector stem, as the bands in this section were extremely
faint. From the chemically modified reference ladders the effect of trailing species was
still there but the effect appeared attenuated, this is because the ladders are modified with
harsh chemicals to force a cleavage products, namely DMS for the G ladder and
Hydrazine for the C+T ladder, followed by treatment with hot base (piperidine) (see
Materials and Methods). We then increased the incubation time from 30 minutes in hot
piperidine to 60 minutes in the Theo 1.0 samples in attempts to reduce the amount of
trailing species, as they are suspected to be uncleaved segments of the RNA aptamer
region. Unfortunately this had very little or no noticeable effect on the presence of the
trailing species.
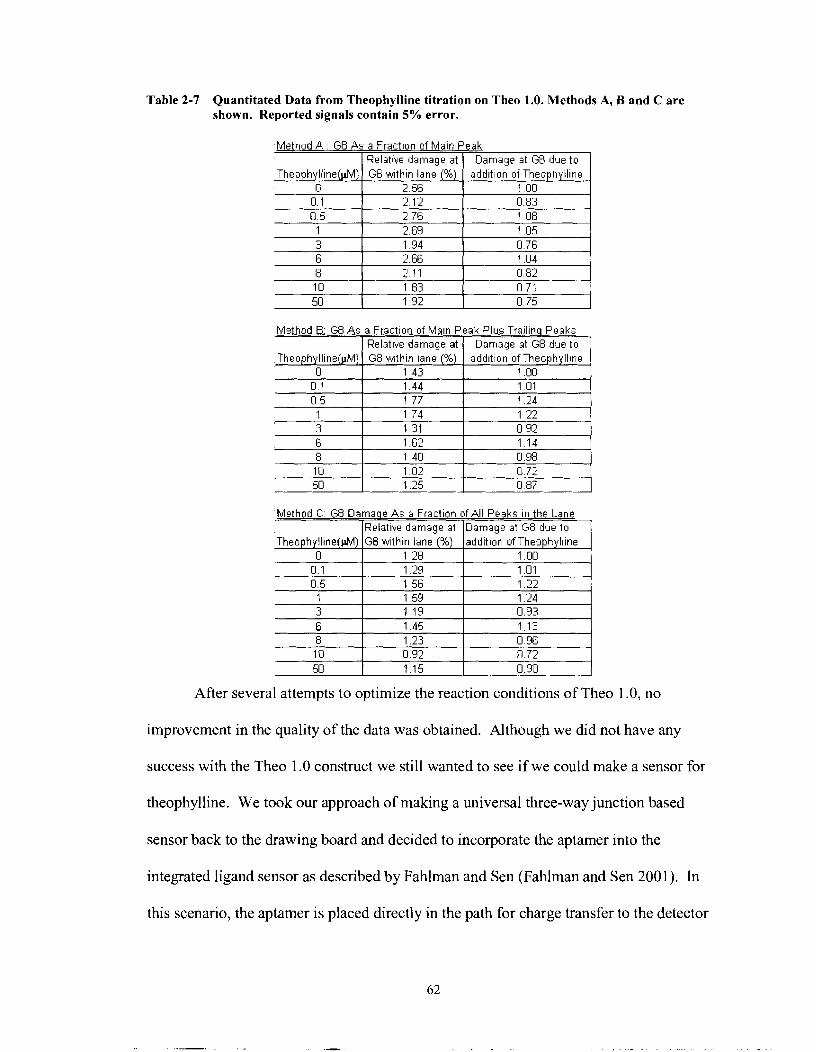
Table 2-7 Quantitated Data from Theophylline titration on Theo 1.0. Methods A, B and C are shown. Reported signals contain 5% error.
Method A : G8 As a Fraction of Ma in Peak I Relative darnage at ( Damage at G8 due to 1
Method C G8 Damaae As a Fraction o f A l l Peaks In the Lane l ~ e l a t w e damage at IDamage at G 8 due t o 1
Theophyllme()lM) 0
0 1 U 5
1 3 6 8
After several attempts to optimize the reaction conditions of Theo 1 .O, no
GB wlthm lane (%) 2 56 2 12 2 76 2 69 1 94 2 66 2 11
Theophylline(pM) 0
0.1 0.5
1 3 6 8 10 50
improvement in the quality of the data was obtained. Although we did not have any
a d d ~ t ~ o n ot Theophyllme 1 UO 0 83 1 08 1 05 0 7E 1 U4 0 8 2
success with the Theo 1.0 construct we still wanted to see if we could make a sensor for
G8 within lane (%) 1 28 1.29 1.56 1.59 1.19 1.45 1.23 0.92 1.15
theophylline. We took our approach of making a universal three-way junction based
addition of Theophylline 1 .OO 1.01 1.22 1.24 0.93 1.13 0.96 0.72 0.90
sensor back to the drawing board and decided to incorporate the aptamer into the
integrated ligand sensor as described by Fahlman and Sen (Fahlman and Sen 2001). In
this scenario, the aptamer is placed directly in the path for charge transfer to the detector
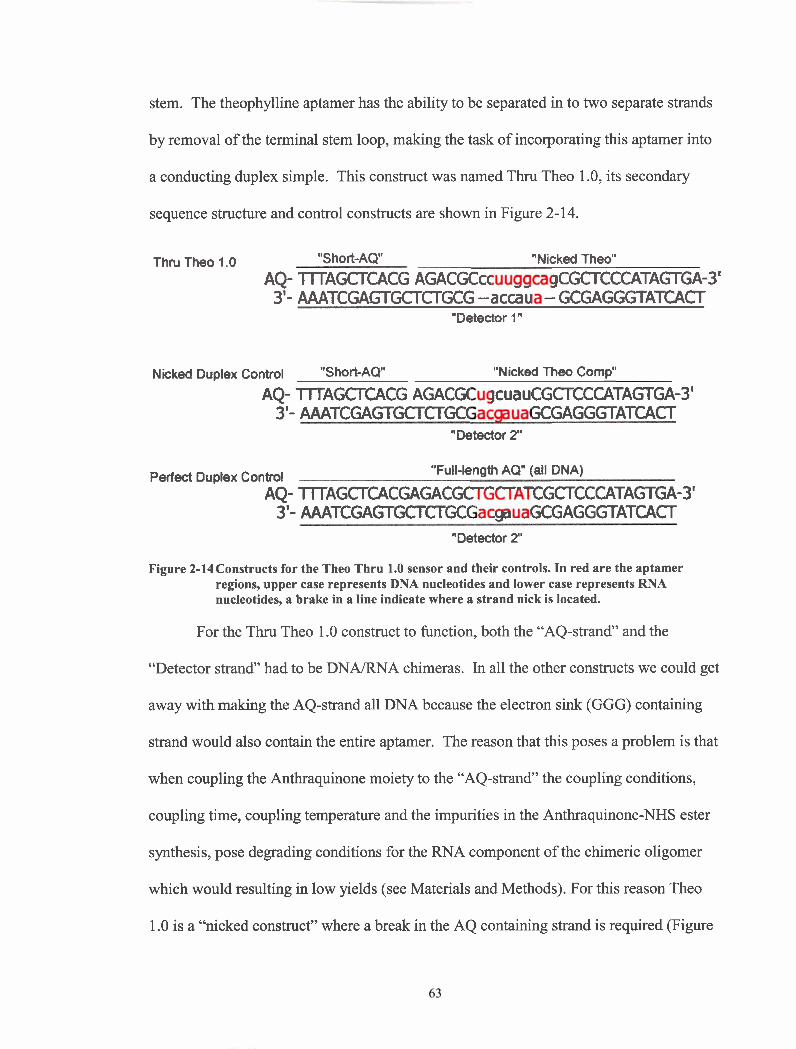
stem. The theophylline aptamer has the ability to be separated in to two separate strands
by removal of the terminal stem loop, making the task of incorporating this aptamer into
a conducting duplex simple. This construct was named Thru Theo 1 .O, its secondary
sequence structure and control constructs are shown in Figure 2-14.
Thru Theo 1.0 "Short-AQ" "Nicked Theo" AQ- TTTAGCTCACG AGACGCcc -- ~CGCTCCCATAGT;GA-3'
3'- AAATCGAc7TGCTCTGCG -accau - GCGAGGGTATCACT "Detector 1 "
Nicked Duplex Control "Short-AQ" "Nicked Theo Comp"
AQ- TlTAGCTCACG AGACGC ~J~uCGCTCCCATAGTGA-3' 3'- AAATCGAGTGCTCTGCX "XGAGGGTATCACT
"Detector 2"
Perfect Duplex Control "Full-length AQ" (all DNA)
AO- TTTAGCTCACGAGACGC"-ATGCTCCCATAGTGA-3' P- AAATCGAGTGCTCTGCC g GCGAGGGTATCACT
"Detector 2"
Figure 2-14Constructs for the Theo Thru 1.0 sensor and their controls. In red are the aptamer regions, upper case represents DNA nucleotides and lower case represents RNA nucleotides, a brake in a line indicate where a strand nick is located.
For the Thru Theo 1.0 construct to function, both the "AQ-strand" and the
"Detector strand" had to be DNMRNA chimeras. In all the other constructs we could get
away with making the AQ-strand all DNA because the electron sink (GGG) containing
strand would also contain the entire aptamer. The reason that this poses a problem is that
when coupling the Anthraquinone moiety to the "AQ-strand" the coupling conditions,
coupling time, coupling temperature and the impurities in the Anthraquinone-NHS ester
synthesis, pose degrading conditions for the RNA component of the chimeric oligomer
which would resulting in low yields (see Materials and Methods). For this reason Theo
1.0 is a "nicked construct" where a break in the AQ containing strand is required (Figure
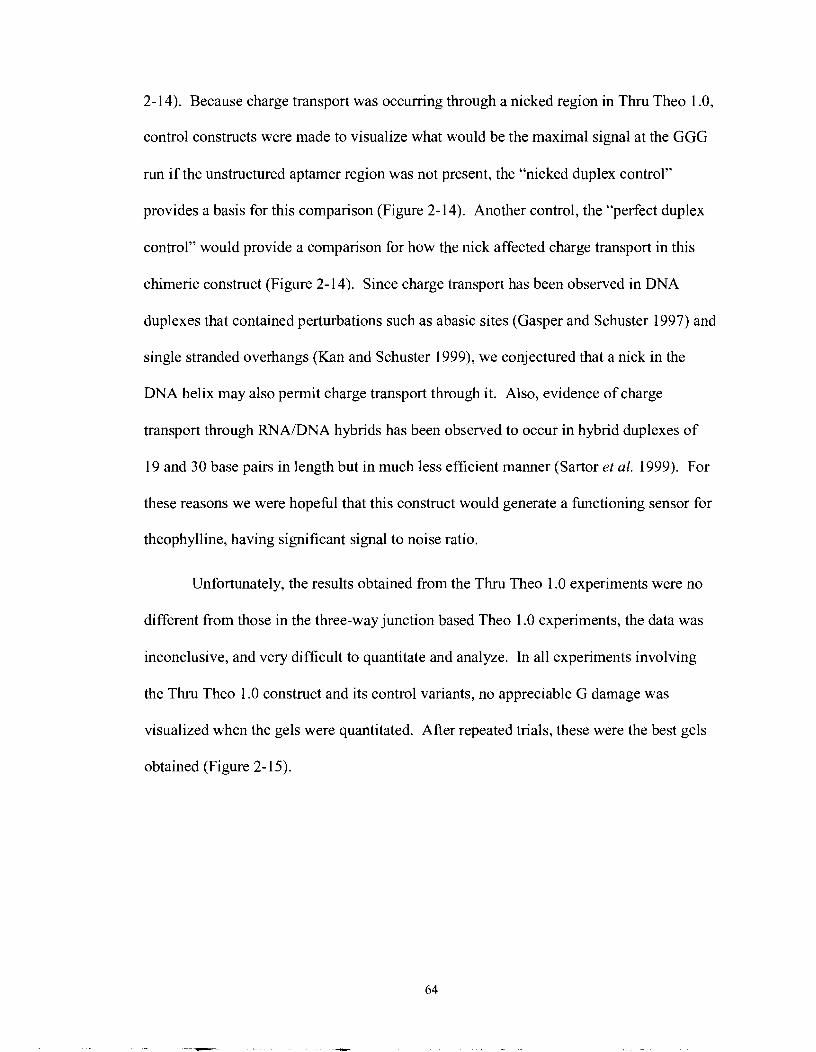
2- 14). Because charge transport was occurring through a nicked region in Thru Theo 1 .O,
control constructs were made to visualize what would be the maximal signal at the GGG
run if the unstructured aptamer region was not present, the "nicked duplex control"
provides a basis for this comparison (Figure 2-14). Another control, the "perfect duplex
control" would provide a comparison for how the nick affected charge transport in this
chimeric construct (Figure 2- 14). Since charge transport has been observed in DNA
duplexes that contained perturbations such as abasic sites (Gasper and Schuster 1997) and
single stranded overhangs (Kan and Schuster 1999), we conjectured that a nick in the
DNA helix may also permit charge transport through it. Also, evidence of charge
transport through RNAIDNA hybrids has been observed to occur in hybrid duplexes of
19 and 30 base pairs in length but in much less efficient manner (Sartor et al. 1999). For
these reasons we were hopeful that this construct would generate a functioning sensor for
theophylline, having significant signal to noise ratio.
Unfortunately, the results obtained from the Thru Theo 1.0 experiments were no
different from those in the three-way junction based Theo 1.0 experiments, the data was
inconclusive, and very difficult to quantitate and analyze. In all experiments involving
the Thru Theo 1.0 construct and its control variants, no appreciable G damage was
visualized when the gels were quantitated. After repeated trials, these were the best gels
obtained (Figure 2- 15).
Figure 2-15Thru Theo 1.0 and control constructs. Gels depicting a theophylline titration, and general charge transport in the control variants.
Other conditions were attempted in efforts to improve the damage sibma1 at G8,
including increasing the irradiation time and irradiating at a few different temperatures
(namely 4,19 and 35 degrees Celsius). After several attempts to optimize the reaction
conditions of Thru Theo 1 .O, no improvement in the quality of the data was obtained. In
one such experiment, an RNA sequencing method as described by Peattie (Peattie 1979)
allowed us to visualize any damage if any occurring at the RNA region (see Materials
and Methods). Although the data was messy, the RNA sequencing experiment on the
"perfect duplex control" revealed two bands in the RNA region which stood out.
Unfortunately the damage at these two bands was the same in the UV irradiated samples
as in the dark controls. From this we can confirm that conduction through these
RNAIDNA chimeras was very poor, if i t was occurring at all.
2.3.4 Further Optimization of the Signal to Noise ratio in ArgA 2.01
Although at this point the signal to noise ratio that we obtained for the ArgA 2.0 1
construct was reasonably appreciable, we set out to further increase the signal to noise
ratio. The issue was not so much in the actual amount of G damage observed when the
ligand bound the aptamer region, but in the amount of G damage even before the ligand
was added (background signal). Since the signal for damage at the G8 position is
calculated as the "fold increase" in signal over the background, effectively lowering the
background signal, even slightly, would proportionally increase the responselfold
increase signal. For example; if the background signal is 2.0% and the bound signal is
lo%, if we effectively lower the background to 1.0 %, then a five-fold increase in signal
becomes a tenfold increase in signal. One way to achieve lowering of the background
signal would be by initial disruption of the deoxyribosensor structure such that the path
for charge transport between the AQ stem and Detector stems is severely affected. This is
what is attempted in this section. The concept was to incorporate a short oligomer,
having complementary sequence to the aptamer region, as part of the initial
deoxyribosensors construct. This would disrupt the structure of the deoxyribosensor
construct and thus the electron path to the detector stem. Varymg length of these
"interfering-oligos" could then be tested to find the optimal size which would effectively
lower the background signal. Upon addition of the true ligand (ArgA) the interfering
oligo, would be displaced and a signal would be detected see Figure 2-16 below.
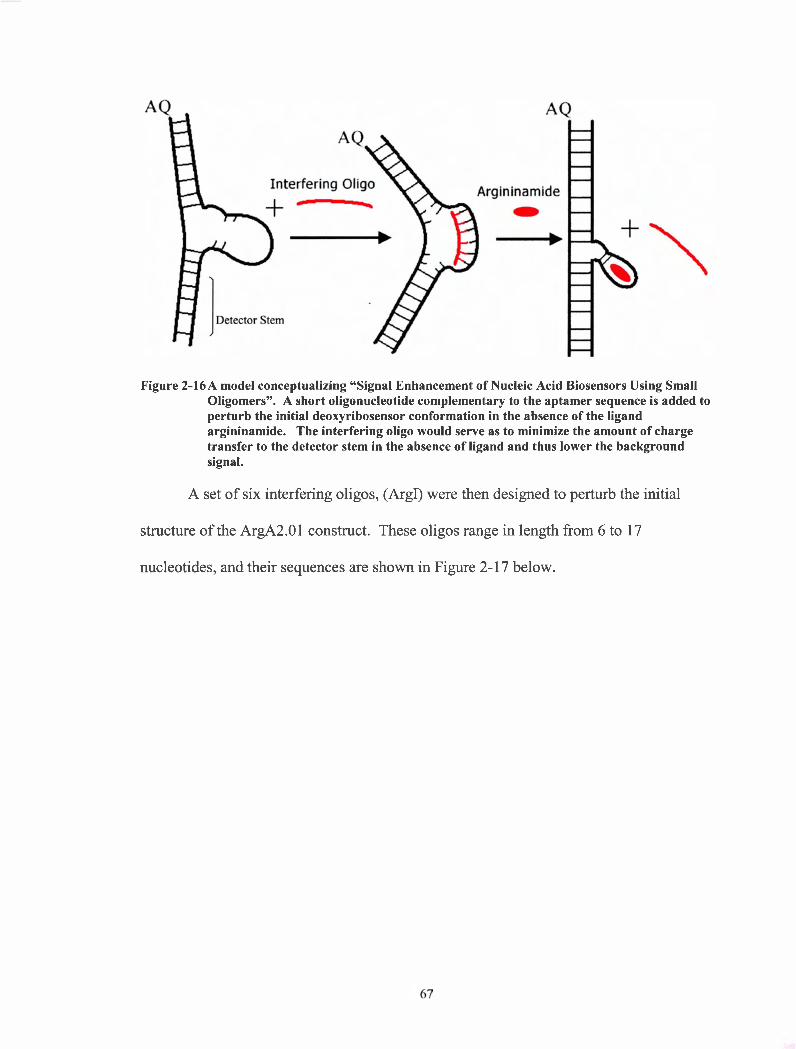
Figure 2-16A model conceptualizing "Signal Enhancement of Nucleic Acid Biosensors Using Small Oligomers". A short oligonucleotide complementary to the aptamer sequence is added to perturb the initial deoxyribosensor conformation in the absence of the ligand argininamide. The interfering oligo would serve as to minimize the amount of charge transfer to the detector stem in the absence of ligand and thus lower the background signal.
A set of six interfering oligos, (ArgI) were then designed to perturb the initial
structure of the ArgA2.01 construct. These oligos range in length from 6 to 17
nucleotides, and their sequences are shown in Figure 2-1 7 below.
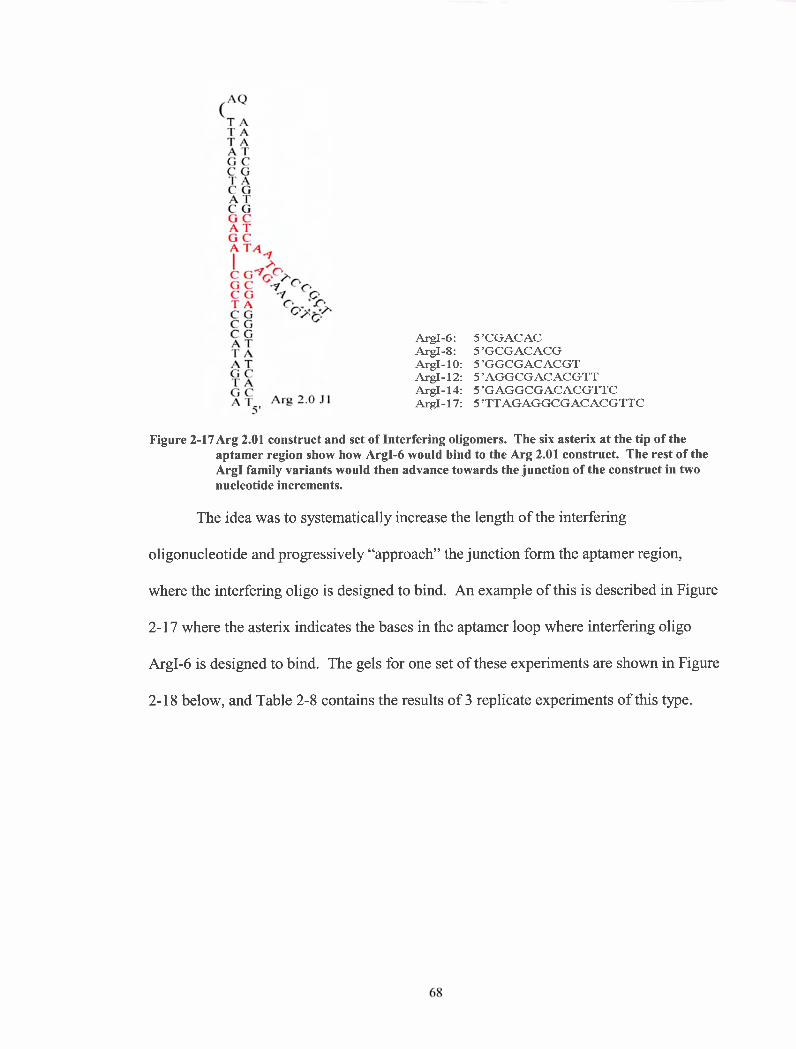
ArgI-6: 5 'CGACAC A@-8: 5 'GCGACACG ArgI- 10: 5 'GGCGACACGT ArgI- 12: 5 'AGGCGACACGTT ArgI- 14: 5 'GAGGCGACACGTTC ArgI- 17: 5 'TTAGAGGCGACACGTTC
Figure 2-17Arg 2.01 construct and set of Interfering oligomers. The six asterix at the tip of the aptamer region show how ArgI-6 would bind to the Arg 2.01 construct. The rest of the ArgI family variants would then advance towards the junction of the construct in two nucleotide increments.
The idea was to systematically increase the length of the interfering
oligonucleotide and progressively "approach" the junction form the aptamer region,
where the interfering oligo is designed to bind. An example of this is described in Figure
2- 17 where the asterix indicates the bases in the aptamer loop where interfering oligo
ArgI-6 is designed to bind. The gels for one set of these experiments are shown in Figure
2- 18 below, and Table 2-8 contains the results of 3 replicate experiments of this type.
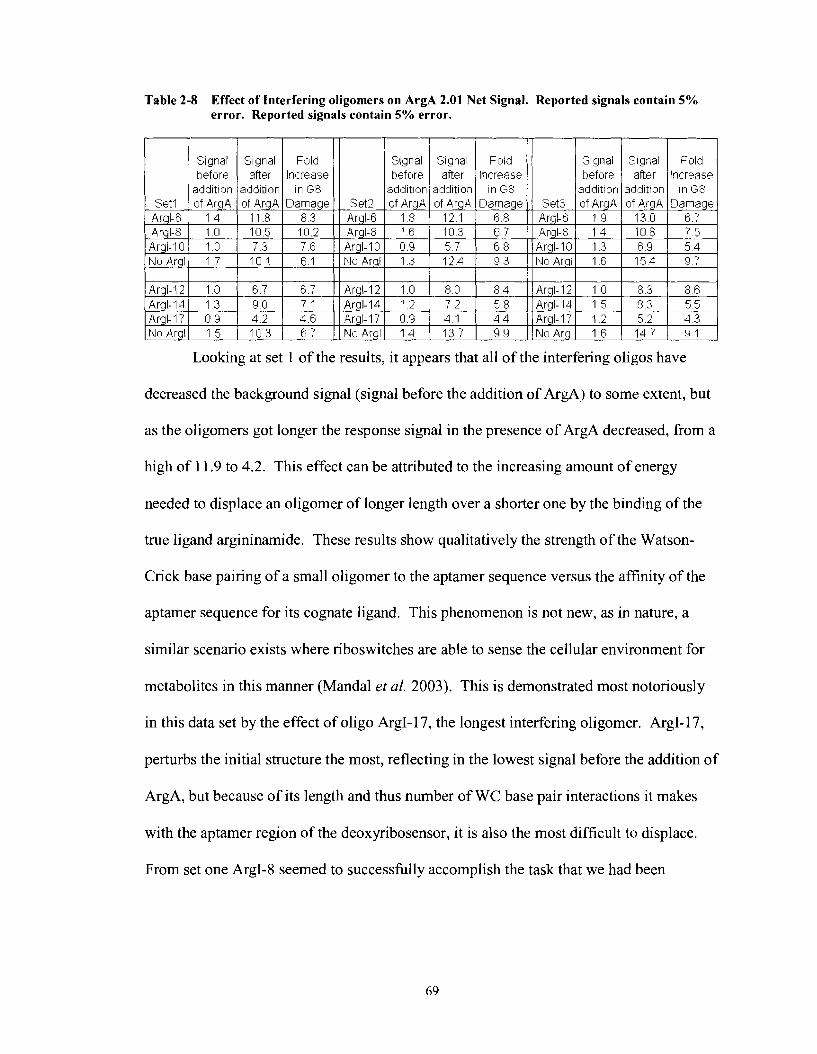
Table 2-8 Effect of Interfering oligomers on ArgA 2.01 Net Signal. Reported signals contain 5% error. Reported signals contain 5% error.
Looking at set 1 of the results, it appears that all of the interfering oligos have
Signal before
add~tion
decreased the background signal (signal before the addition of ArgA) to some extent, but
as the oligomers got longer the response signal in the presence of ArgA decreased, from a
ofArgAA
Signal after
addition
high of 11.9 to 4.2. This effect can be attributed to the increasing amount of energy
needed to displace an oligomer of longer length over a shorter one by the binding of the
Fold Increase
in G8
true ligand argininamide. These results show qualitatively the strength of the Watson-
Crick base pairing of a small oligomer to the aptamer sequence versus the affinity of the
S~gnal before
addit~on
aptamer sequence for its cognate ligand. This phenomenon is not new, as in nature, a
similar scenario exists where riboswitches are able to sense the cellular environment for
Signal after
addition
metabolites in this manner (Mandal et al. 2003). This is demonstrated most notoriously
in this data set by the effect of oligo ArgI-17, the longest interfering oligomer. ArgI-17,
perturbs the initial structure the most, reflecting in the lowest signal before the addition of
Fold Increase
in G8
ArgA, but because of its length and thus number of WC base pair interactions it makes
with the aptamer region of the deoxyribosensor, it is also the most difficult to displace.
Signal before
addition
From set one ArgI-8 seemed to successfully accomplish the task that we had been
S~gnal after
addition
Fold Increase
~n G8
seeking, lowering the initial background signal while maintaining the same response
signal.
Unfortunately, this effect was not reproducible as the data from sets 2 and 3 show
contrasting results where ultimately the deoxyribosensor ArgA 2.0 1 worked best in the
absence of any interfering oligomer (Table 2-8). Nevertheless, observing all the data
sets, a general trend exists; a longer oligomer will disrupt the initial structure best, and
thus reduce the background signal, but it will also lower the response signal. The
response signal is lowered to an extent which makes the use of these interfering oligos
pointless.
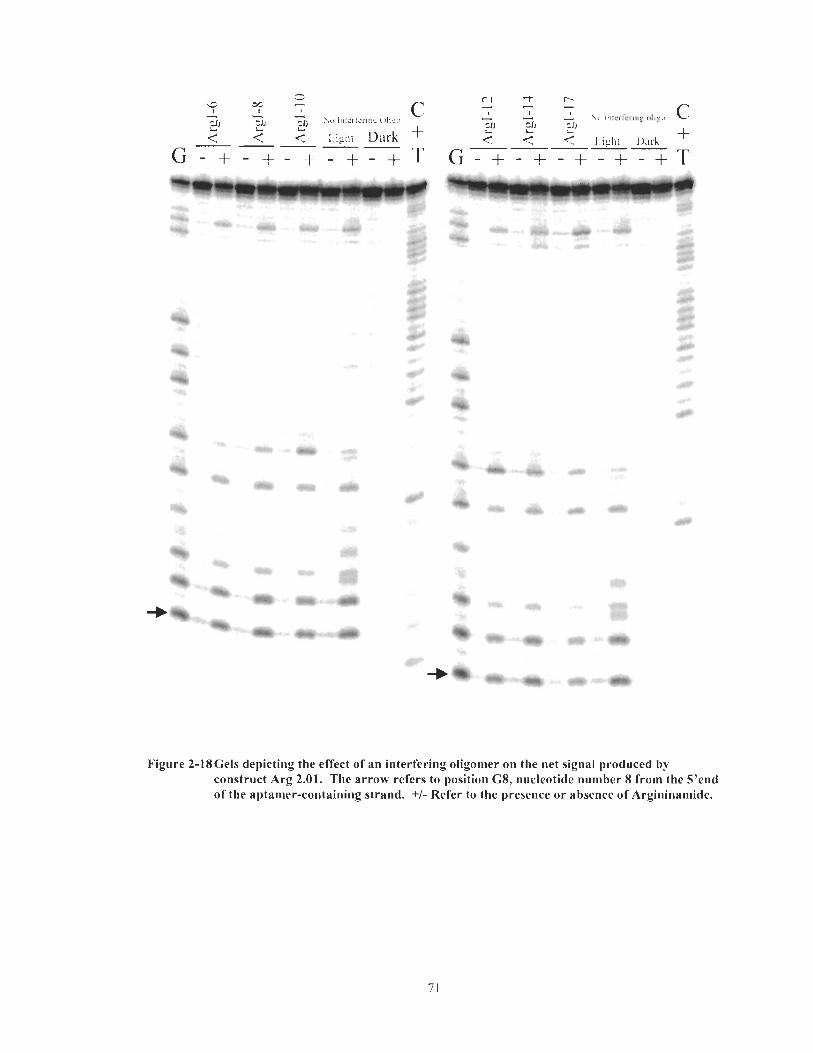
Figure 2-18Cels depicting the effect of an interfering oligomer on the net signal produced by construct Arg 2.01. The arrow refers to position G8, nucleotide number 8 from the S'end of the aptamer-containing strand. +/- Refer to the presence or absence of Argininaniide.
2.4 Structure Probing of DNAzymes Using Charge Transport
2.4.1 Introduction and Experimental Approach
Working in a lab where several DNA enzymes have been selected, and
thoroughly characterized for their enzymatic properties, elucidating the structure of these
DNAzymes would aid understanding their mode of action. Out of the many ways there
exist to characterize the structure of a complexly folded DNA molecule, such as X-ray
crystallography, NMR, or computer based molecular dynamics to name a few, simple
low-tech chemical probing can give significant qualitative and quantitative information
about the intramolecular interactions of these DNA enzymes.
As we saw earlier, Figure 2- 10 depicts a gel showing the titration of argininamide
on the ArgA 2.0 1 deoxyribosensor. This gel not only illustrates the doexyribosensor's
affinity for its cognate ligand but also gives us some information in the manner in which
the deoxyribosensors is structured. In this gel we see the transition from the initial
structure, where the AQ stem and the aptamer stem predominantly stack, to the final
structure where the AQ stem and detector stem appear to stack optimally. This effect is
seen where at low concentrations of argininamide oxidative damage occurs in the
aptamer loop, but as the concentration of argininamide increases this damage attenuates
and damage in the detector stem increases. In this fashion we can have a sense of which
helical stems are stacking with the oxidant-containing stem in a DNA molecule
containing a three-way junction.
In this section, such concepts are utilized to probe for the helical arm stacking
partners in the DNAzymes Bipartite (Feldman and Sen 200 l), which was selected for in
our lab, and the 8- 17 DNA enzyme selected by Santoro and Joyce (Santoro and Joyce
1997). Both of these enzymes are DNA molecules whose catalytic ability is to cleave an
RNA molecule at its phosphodiester bond. These DNA enzymes recognize their RNA
substrates in a Watson-crick base pairing fashion, and by varying the sequence of their
recognition arms they can potentially recognize any RNA substrate. Potentially these
enzymes may have applications in the pharmaceutical and biotechnology industry as they
can be designed to target any messenger RNA of choice. The goal of the work described
in these preliminary experiments is to see if probing for helical arm stacking partners in
branched DNA by monitoring charge transport can be used as a general tool for gaining
structural information from helix containing structures. The secondary structures of these
DNAzymes and a control double helix are shown in Figure 2-1 9. These constructs were
designed such that only one anthraquinone labeled DNA oligomer (S-multi) would have
to be synthesized. This would serve as a multiple substrate for both of these constructs.
For practical considerations, an all DNA substrate is used here in place of the native RNA
substrate, as RNA is easily susceptible to breakdown due to its 2'hydroxyl, facilitating
phosphodiester cleavage.
These E-Bipartite, E-8- 17 and E-comp strands were "P end labeled and irradiated
with UV light at 366 nm in a regular electron transfer experiment. Both of these
DNAzyrnes are, require divalent cations for catalysis, especially for magnesium. When
the magnesium concentrations are in the millimolar range (- 30 mM for Bipartite
whereas 8- 17 can tolerate magnesium concentrations in 100 mM range with increasing
catalytic rate) the DNAzymes display optimal catalytic rates. Therefore we performed a
magnesium titration on these constructs to investigate if we could see a transition from an
inactive conformation of the DNAzyme to an active one. In contrast to the previous
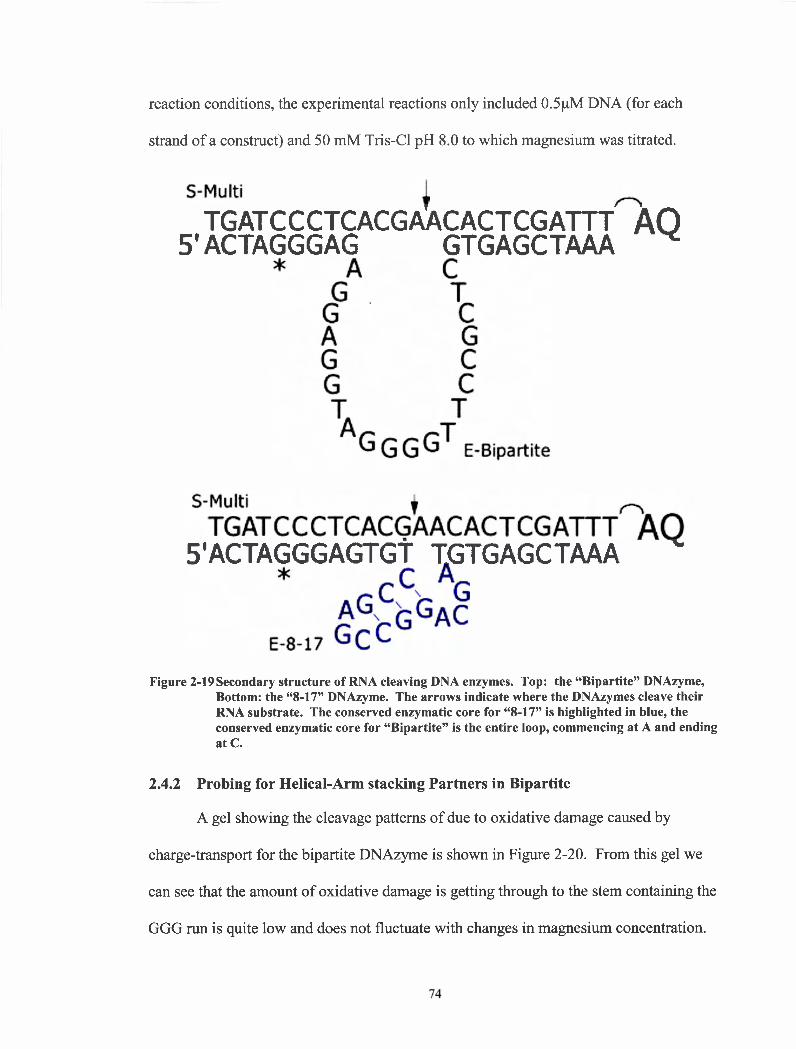
reaction conditions, the experimental reactions only included 0.5pM DNA (for each
strand of a construct) and 50 mM Tris-C1 pH 8.0 to which magnesium was titrated.
TGATCCCTCACGA'ACACTCGA~~~ AQ 5' ACTAGGGAG GTGAGCTAAA
5' ACTAGGGAGTGT TGTGAGCTAAA - - >
Figure 2-19 Secondary structure of RNA cleaving DNA enzymes. Top: the "Bipartite" DNAzyme, Bottom: the "8-17" DNAzyme. The arrows indicate where the DNAzymes cleave their RNA substrate. The conserved enzymatic core for "8-17" is highlighted in blue, the conserved enzymatic core for "Bipartite" is the entire loop, commencing at A and ending at C.
2.4.2 Probing for Helical-Arm stacking Partners in Bipartite
A gel showing the cleavage patterns of due to oxidative damage caused by
charge-transport for the bipartite DNAzyme is shown in Figure 2-20. From this gel we
can see that the amount of oxidative damage is getting through to the stem containing the
GGG run is quite low and does not fluctuate with changes in magnesium concentration.
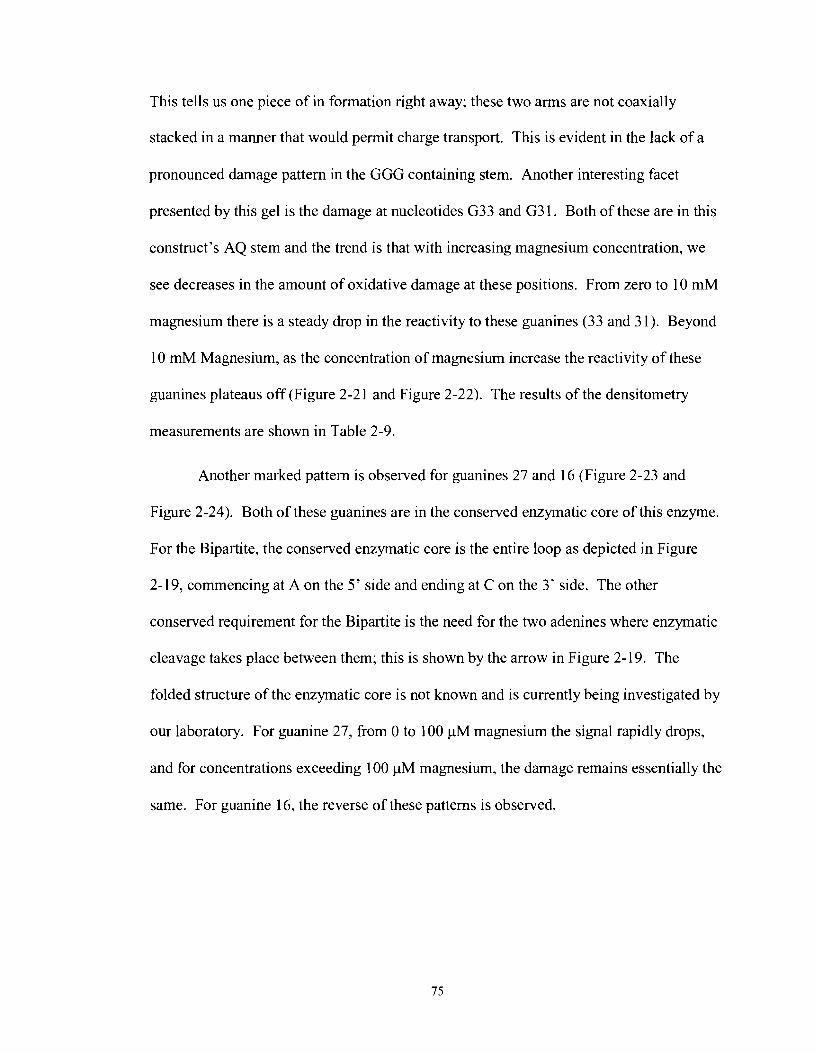
This tells us one piece of in formation right away; these two arms are not coaxially
stacked in a manner that would permit charge transport. This is evident in the lack of a
pronounced damage pattern in the GGG containing stem. Another interesting facet
presented by this gel is the damage at nucleotides G33 and G3 1. Both of these are in this
construct's AQ stem and the trend is that with increasing magnesium concentration, we
see decreases in the amount of oxidative damage at these positions. From zero to 10 mM
magnesium there is a steady drop in the reactivity to these guanines (33 and 3 1). Beyond
10 mM Magnesium, as the concentration of magnesium increase the reactivity of these
guanines plateaus off (Figure 2-21 and Figure 2-22). The results of the densitometry
measurements are shown in Table 2-9.
Another marked pattern is observed for guanines 27 and 16 (Figure 2-23 and
Figure 2-24). Both of these guanines are in the conserved enzymatic core of this enzyme.
For the Bipartite, the conserved enzymatic core is the entire loop as depicted in Figure
2- 19, commencing at A on the 5' side and ending at C on the 3' side. The other
conserved requirement for the Bipartite is the need for the two adenines where enzymatic
cleavage takes place between them; this is shown by the arrow in Figure 2-19. The
folded structure of the enzymatic core is not known and is currently being investigated by
our laboratory. For guanine 27, from 0 to 100 pM magnesium the signal rapidly drops,
and for concentrations exceeding 100 pM magnesium, the damage remains essentially the
same. For guanine 16, the reverse of these patterns is observed.
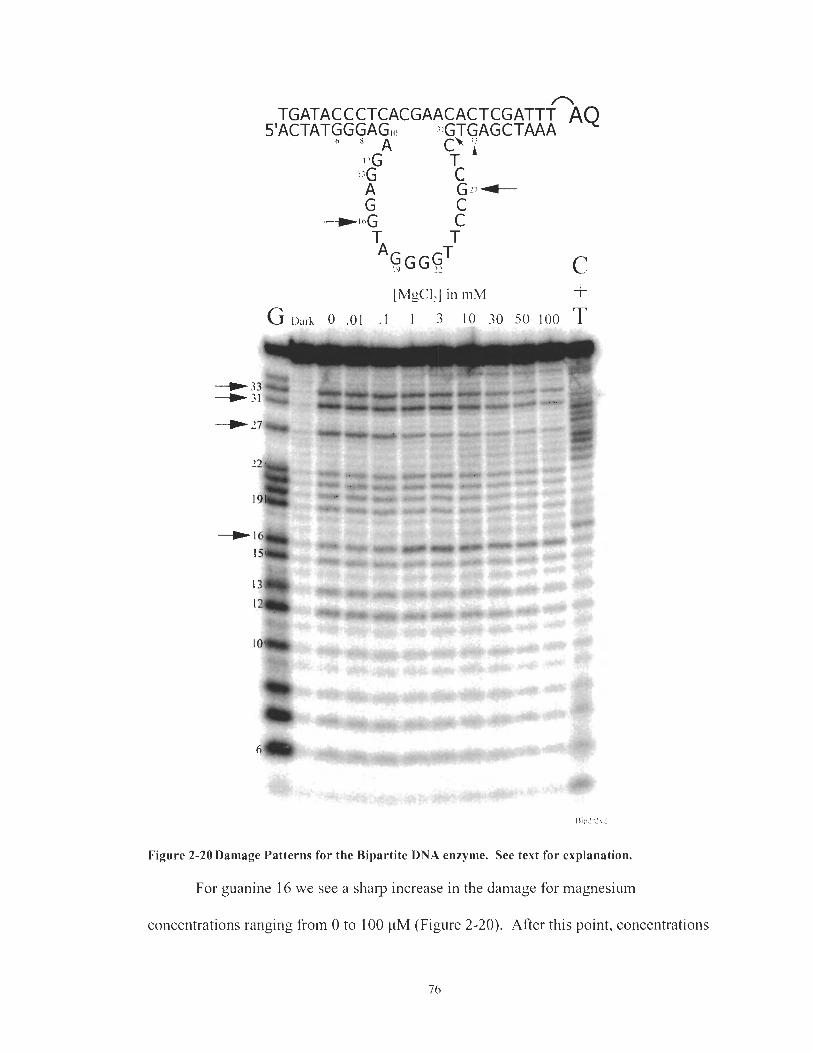
1\1p:r?\2
Figure 2-20 Damage Patterns for the Bipartite DNA enzyme. See text for explanation.
For guanine 16 we see a sharp increase in the damage for magnesium
concentrations ranging from 0 to 100 pM (Figure 2-20). After this point, concentrations
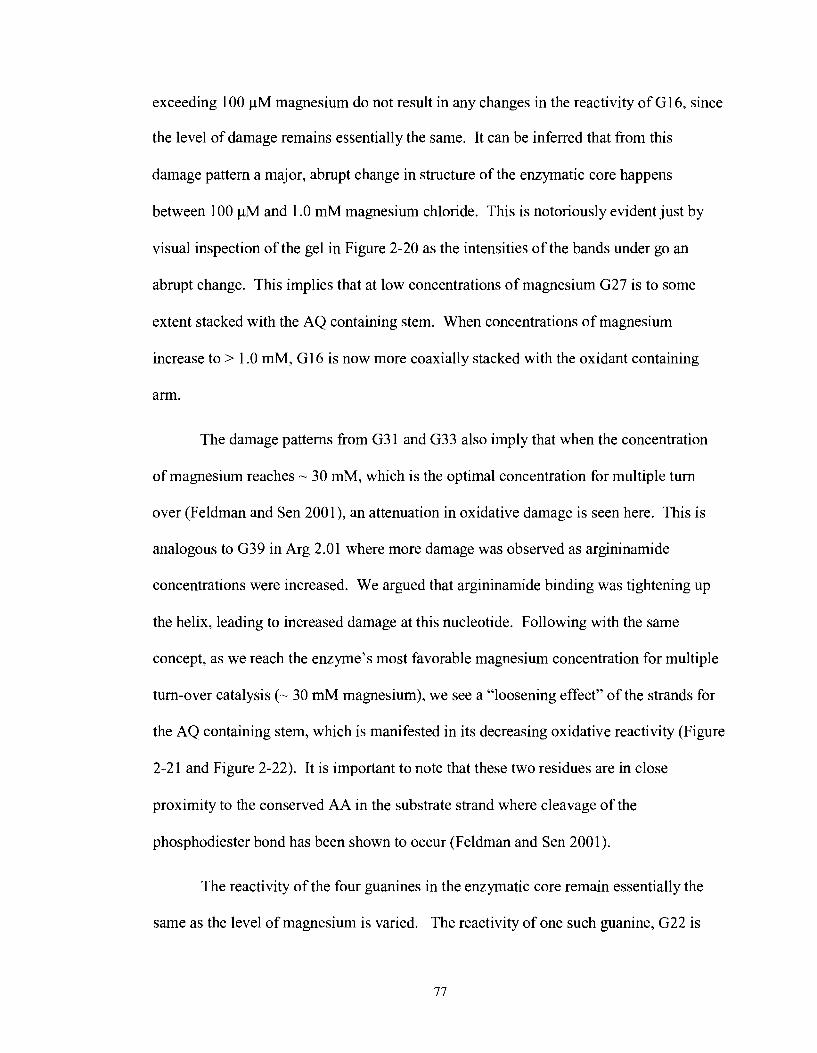
exceeding 100 yM magnesium do not result in any changes in the reactivity of G16, since
the level of damage remains essentially the same. It can be inferred that from this
damage pattern a major, abrupt change in structure of the enzymatic core happens
between 100 pM and 1.0 mM magnesium chloride. This is notoriously evident just by
visual inspection of the gel in Figure 2-20 as the intensities of the bands under go an
abrupt change. This implies that at low concentrations of magnesium G27 is to some
extent stacked with the AQ containing stem. When concentrations of magnesium
increase to > 1.0 mM, G16 is now more coaxially stacked with the oxidant containing
arm.
The damage patterns from G3 1 and G33 also imply that when the concentration
of magnesium reaches - 30 mM, which is the optimal concentration for multiple turn
over (Feldman and Sen 2001), an attenuation in oxidative damage is seen here. This is
analogous to G39 in Arg 2.0 1 where more damage was observed as argininamide
concentrations were increased. We argued that argininamide binding was tightening up
the helix, leading to increased damage at this nucleotide. Following with the same
concept, as we reach the enzyme's most favorable magnesium concentration for multiple
turn-over catalysis (- 30 mM magnesium), we see a "loosening effect" of the strands for
the AQ containing stem, which is manifested in its decreasing oxidative reactivity (Figure
2-21 and Figure 2-22). It is important to note that these two residues are in close
proximity to the conserved AA in the substrate strand where cleavage of the
phosphodiester bond has been shown to occur (Feldman and Sen 2001).
The reactivity of the four guanines in the enzymatic core remain essentially the
same as the level of magnesium is varied. The reactivity of one such guanine, G22 is
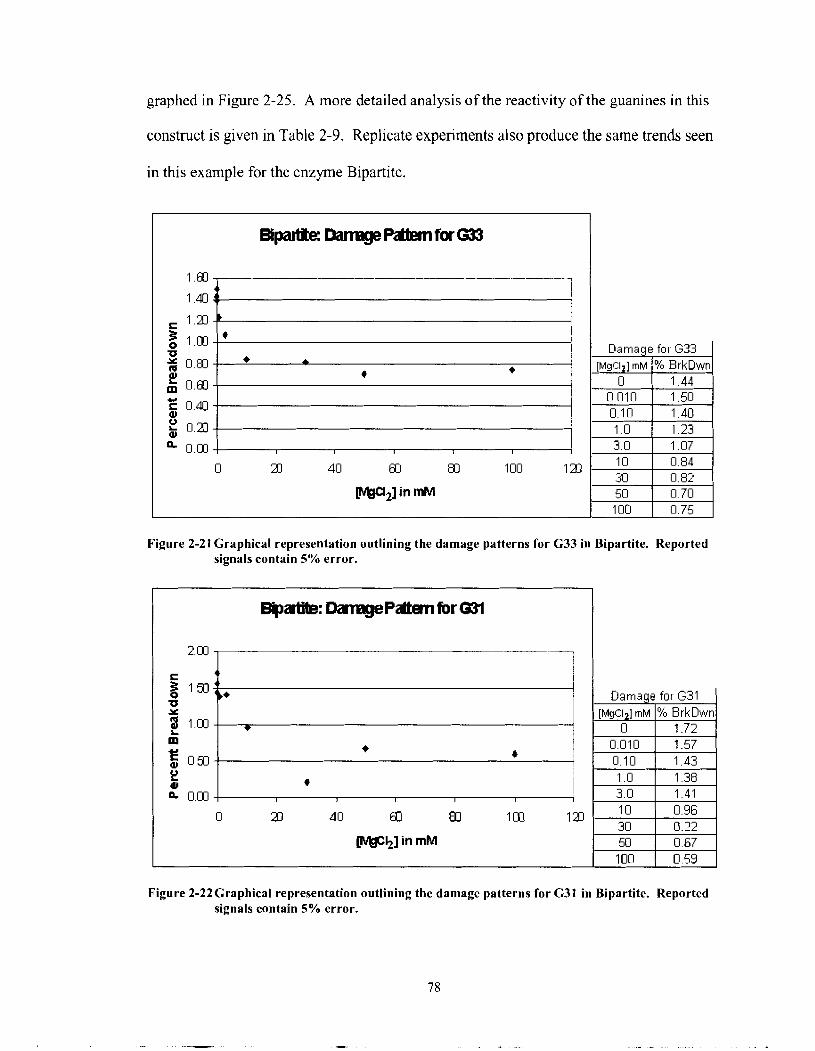
graphed in Figure 2-25. A more detailed analysis of the reactivity of the guanines in this
construct is given in Table 2-9. Replicate experiments also produce the same trends seen
in this example for the enzyme Bipartite.
Figure 2-21 Graphical representation outlining the damage patterns for G33 in Bipartite. signals contain 5% error.
for G33 % BrkDwn
Reported
Figure 2-22Craphical representation outlining the damage patterns for G31 in Bipartite. Reported signals contain 5% error.
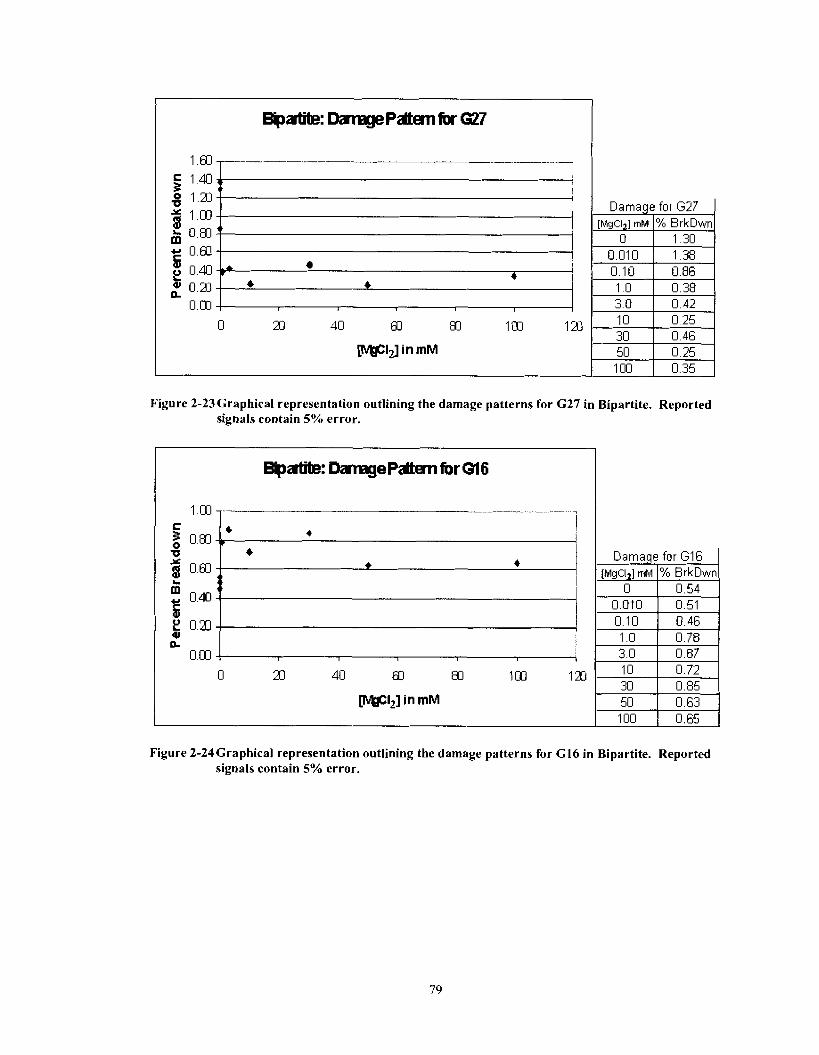
Figure 2-23Graphical representation outlining the damage patterns for G27 in Bipartite. Reported signals contain 5% error.
5 1 4 0 f I
Damage for GI6 I
g 1 . a 3 1 . m L. O.m " m - 0.80 5 2 0.40 Q, O.m L
O.m
Damage for G27
Figure 2-24Graphical representation outlining the damage patterns for G16 in Bipartite. Reported signals contain 5% error.
-+ t 4 4
I 8 I 1 1
[MgCI2] mM 0
0.010 0. I 0 1.0 3.0 10 30 50 100
n m 40 a m im 1 m
w12] in mM
% ErkDwn 1.30 1.38 0.86 0.38 0.42 0.25 0.46 0.25 0.35
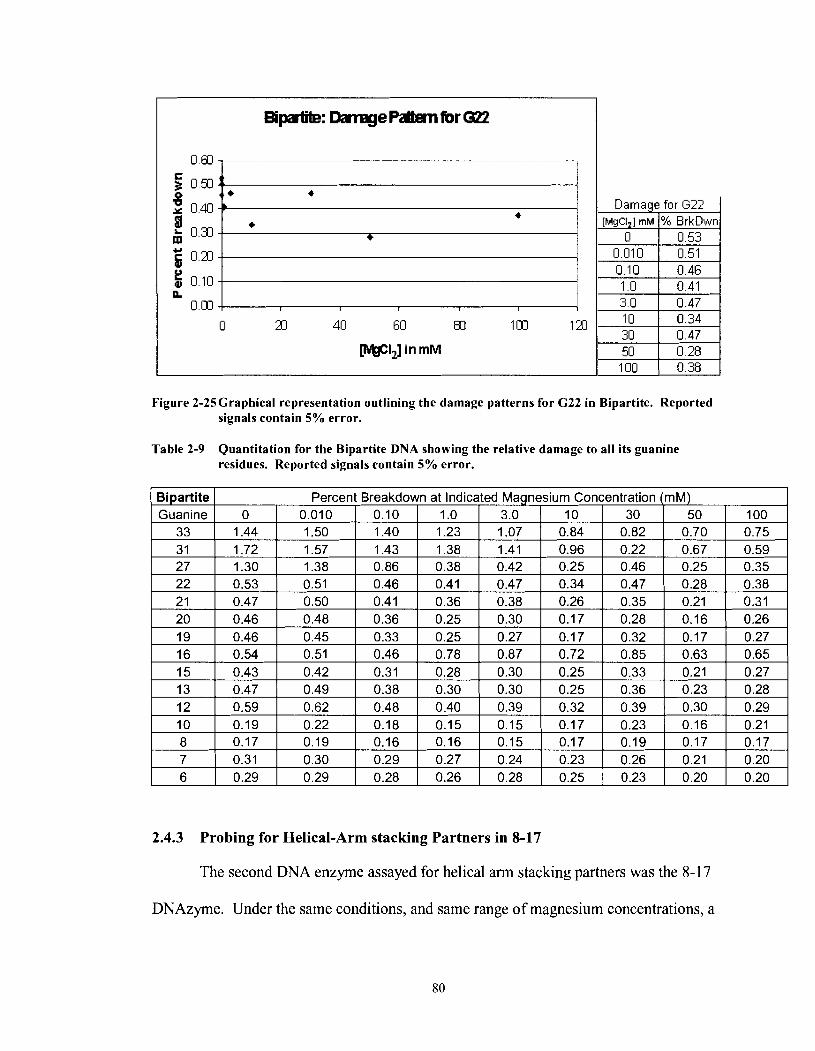
Figure 2-25Craphical representation outlining the damage patterns for C22 in Bipartite. Reported signals contain 5% error.
Table 2-9 Quantitation for the Bipartite DNA showing the relative damage to all its guanine residues. Reported signals contain 5% error.
2.4.3 Probing for Helical-Arm stacking Partners in 8-17
The second DNA enzyme assayed for helical arm stacking partners was the 8-1 7
DNAzyme. Under the same conditions, and same range of magnesium concentrations, a
gel showing novel results was obtained. The gel for the probing experiment on 8-1 7 is
shown in Figure 2-26. Graphs showing the results of the densitometry measurements for
the various guanines in the 8-1 7 DNAzyme are shown in Figure 2-27 to Figure 2-39.
Looking at the damage patterns for guanines 6,7, 8 and 10 in the GGG containing arm,
the reactivity appears noisy with a relatively small spread with respect to the
concentration of magnesium administered (Figure 2-36 to Figure 2-39). In general,
guanines 30 and 28 on the AQ stem, guanines 25, 22 and 2 1 in the catalytic core and
guanine 12 on the GGG containing stem (G12 is closest to the "junction" of the
construct) all see a sharp drop in reactivity under the range of 0-1mM magnesium. For
concentrations exceeding ImM magnesium, the signal stabilizes into a relatively flat line
(see corresponding figures below). This flat line effect is most evident in the 10 mM- 100
mM, where the DNAzyrne structure does not seem to undergo any major structural
changes. The sharp drop and decrease in reactivity is also punctuated by a burst-like
increase at -3mM magnesium, thereafter the signal drops and essentially stabilizes. The
other two guanines deep in the catalytic core, G 16 and G18, show no significant changes
in reactivity under all concentrations of magnesium (Figure 2-32 and Figure 2-33
respectively).
From these results it can be inferred that in the absence of, or at lower
concentrations of magnesium, both G12 in the detector stem and some guanines in the
catalytic core (G25, G22 and G21) are being damaged. This implies that, at zero or small
magnesium concentrations, the structure of the 8-1 7 DNAzyme has a fork like structure,
where both the detector arm and the catalytic core are partially stacking with the AQ
stem. As magnesium concentrations reach lOmM, the signals in the detector arm and the
catalytic core rapidly drop and stabilize without any further changes in guanine reactivity
as magnesium concentration is elevated from 10 to 100mM. This implies that for this
magnesium-dependent DNAzyrne, when it is fully folded, its GGG-containing stem and
the catalytic core are grossly out of plane from the AQ containing stem. This effect can
be confirmed by recent work from Liu and Lu where a FRET study on the structure of 8-
17 was performed (Liu and Lu 2002). The results revealed the relative orientations of the
three arms in transition from an unfolded to a folded state and those results coincide with
the damage patterns reported here. A model depicting the relative orientations of these
arms is given in Figure 2-40.
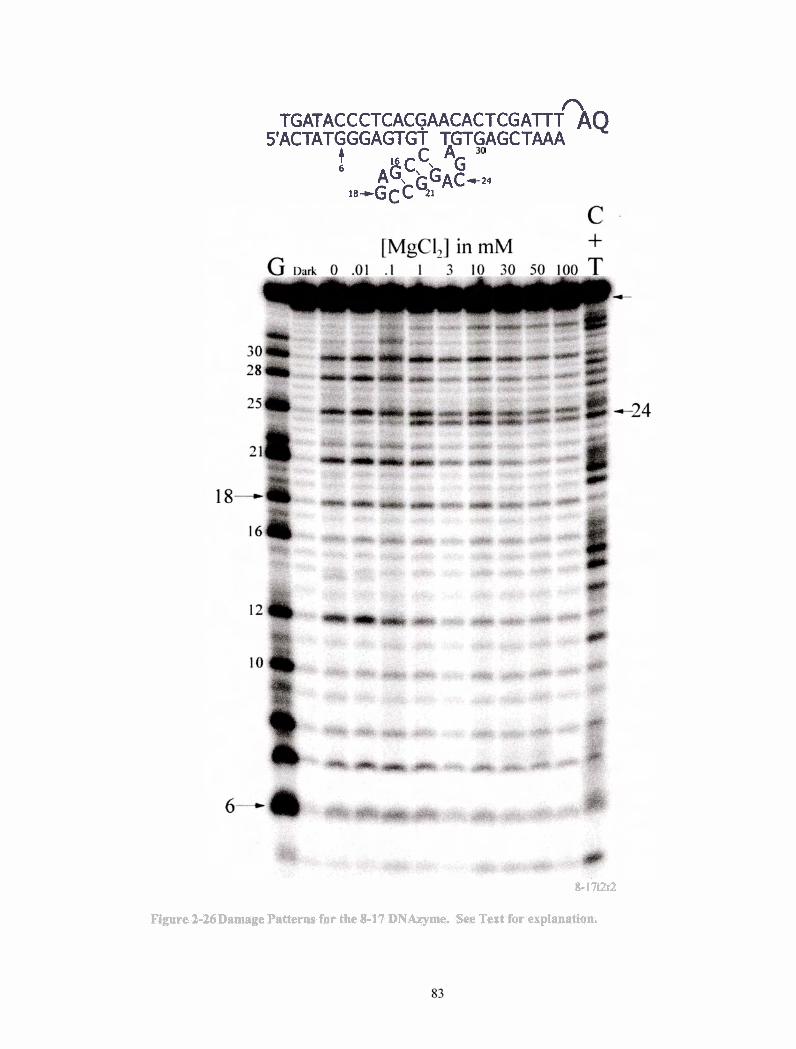
n TGATACCCTCACGAACACTCGATTT AQ
5'ACTATGGGAGTGT TGTGAGCTAAA t 6 l6 c\ C AG nG\ G ~ A ~ * ~ 4
ia-GcC 21
8-17t2r2
Figure 2-26Damage Patterns for the 8-17 DNAzyme. See Text for explanation.
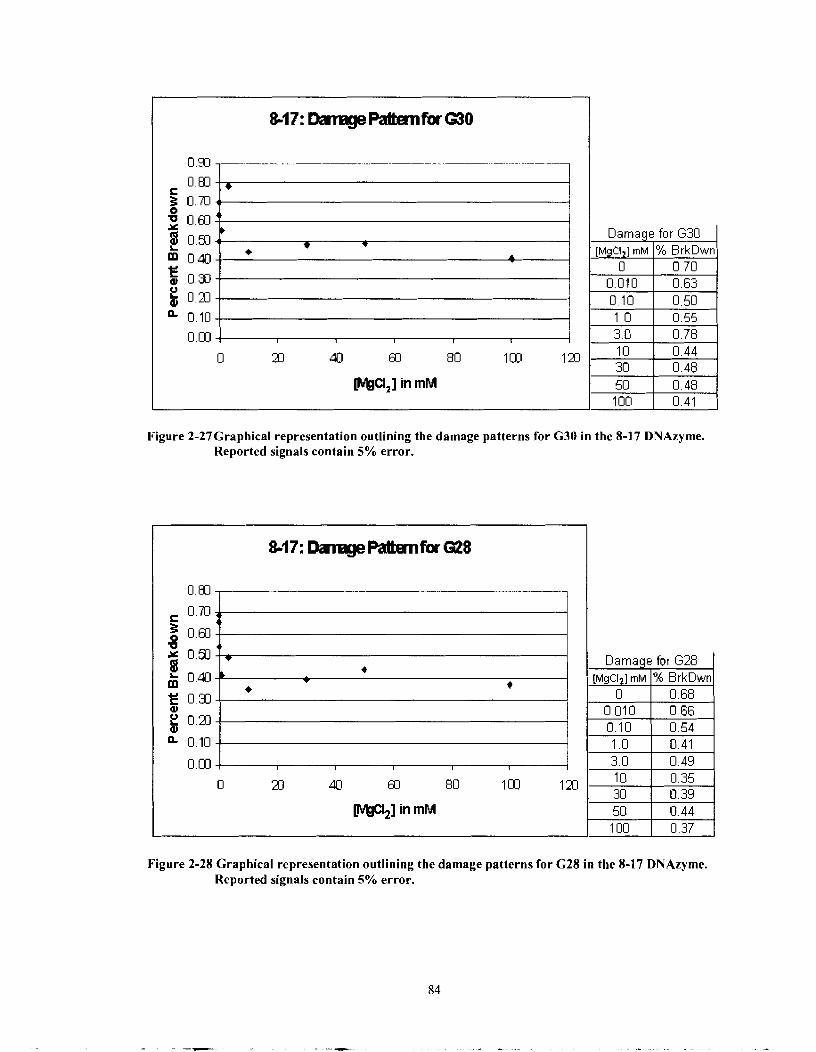
MU,] in mM
Damage for G30 I
Figure 2-27Graphical representation outlining the damage patterns for G30 i n the 8-17 DNAzyme. Reported signals contain 5% error.
Figure 2-28 Graphical representation outlining the damage patterns for G28 in the 8-17 DNAzyme. Reported signals contain 5% error.
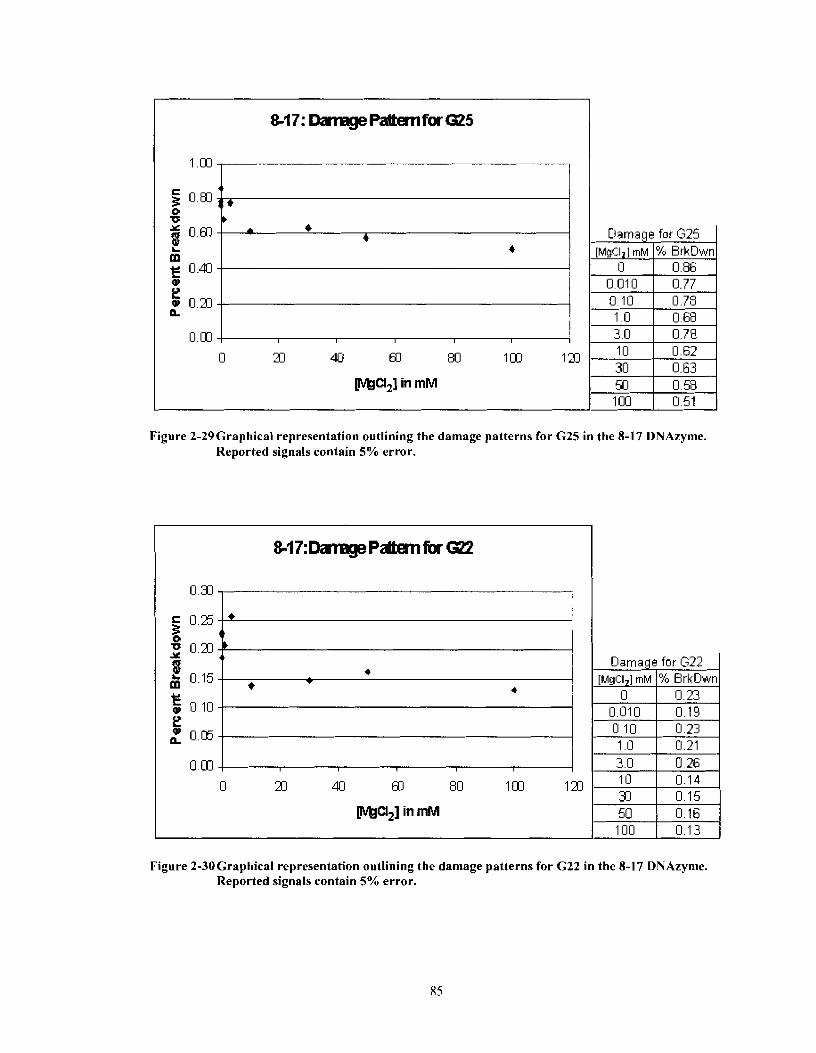
Damage fur G25 I [MgCI 1 mM % BrkDwn +I
Figure 2-29Graphical representation outlining the damage patterns for G25 in the 8-17 DNAzyme. Reported signals contain 5% error.
Damage for G22 1 [MgCI ] mM % BrkDwn +I
Figure 2-30Graphical representation outlining the damage patterns for G22 in the 8-17 DNAzyme. Reported signals contain 5% error.
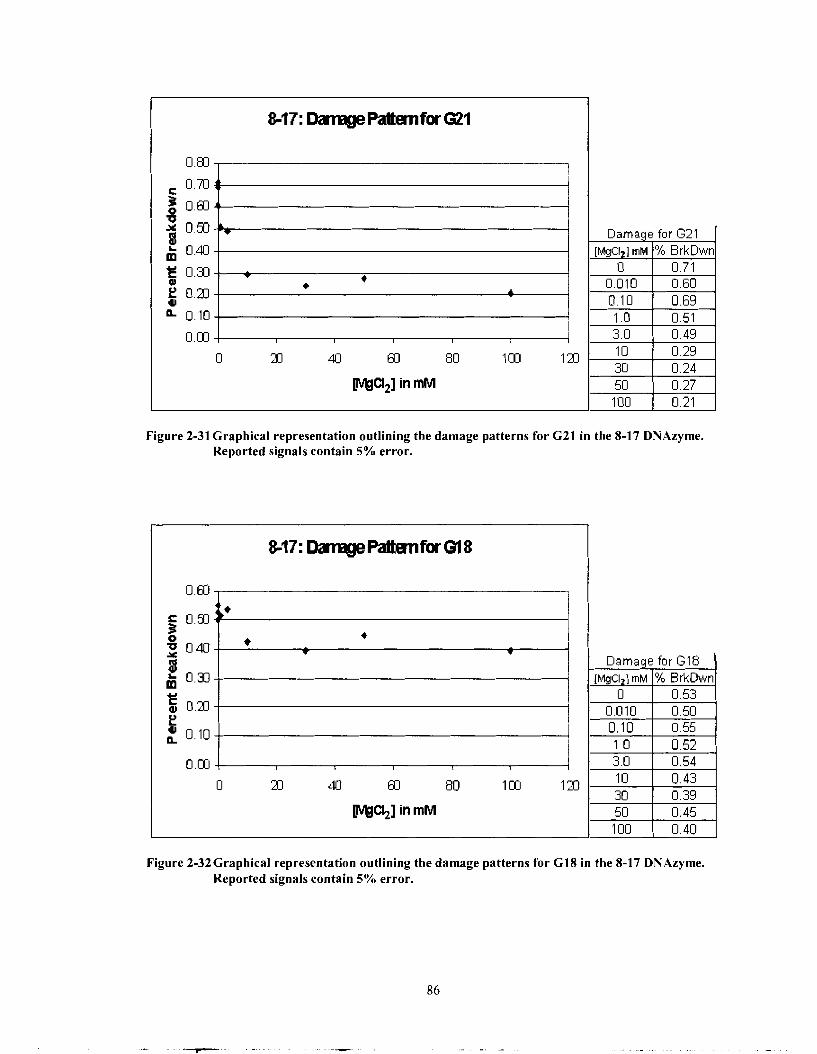
Damage fur G21 I
Figure 2-31 Graphical representation outlining the damage patterns for G21 in the 8-17 DNAzyme. Reported signals contain 5% error.
Damage for G I 8
Figure 2-32Graphical representation outlining the damage patterns for GI8 in the 8-17 DNAzyme. Reported signals contain 5% error.
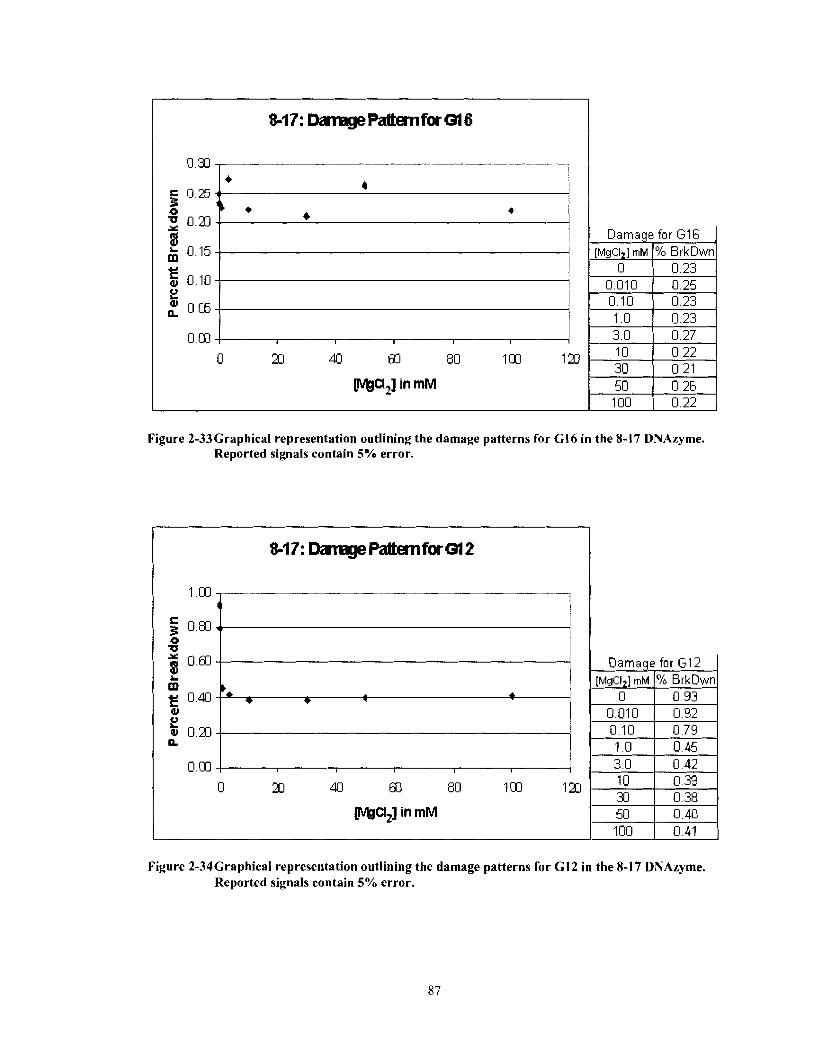
Damage for G I 6 I [Mgcl ] mM % BrkDwn
Figure 2-33Craphical representation outlining the damage patterns for GI6 in the 8-17 DNAzyme. Reported signals contain 5% error.
Figure 2-34Graphical representation outlining the damage patterns for G12 in the 8-17 DNAzyme. Reported signals contain 5% error.
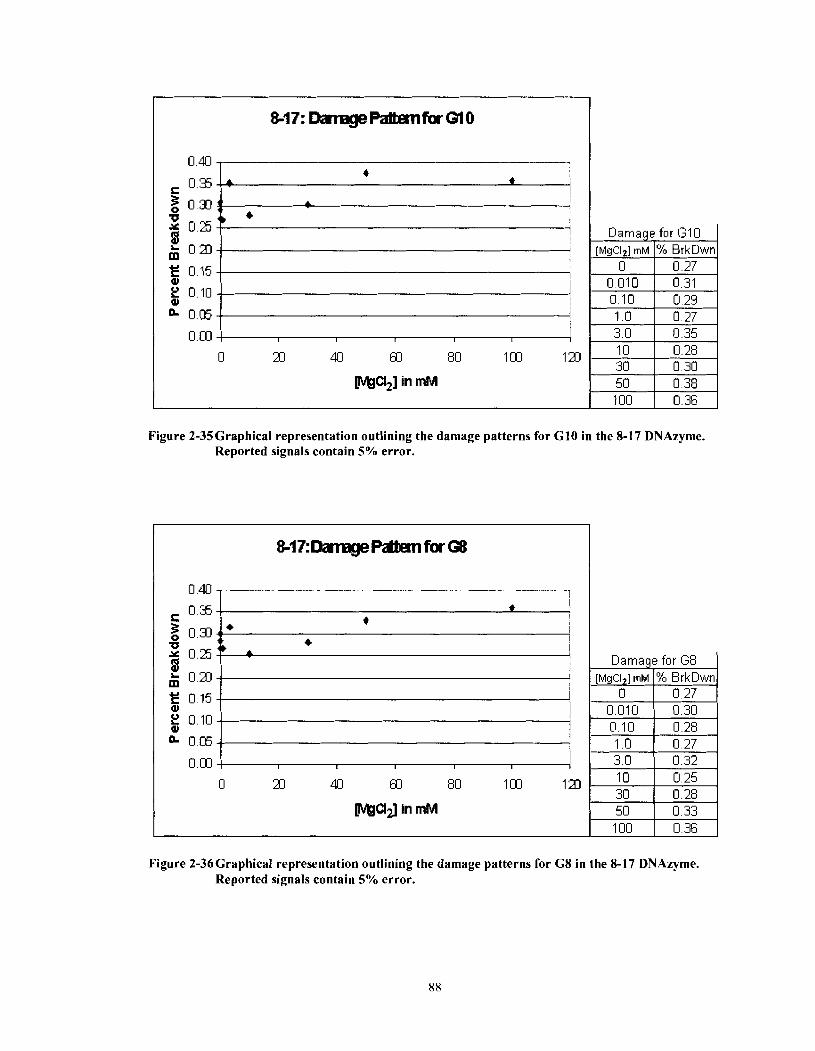
Figure 2-35Graphical representation outlining the damage patterns for GI0 in the 8-17 DNAzyme. Reported signals contain 5% error.
Damage for GI0
Figure 2-36Graphical representation outlining the damage patterns for G8 in the 8-17 DNAzyme. Reported signals contain 5% error.
[Mga,] mM 0
0.010 0.10 1 .O 3.0 10 30 50
% BrkDwn 0.27 0.31 0.29 0.27 n.35 0.28 0.30 0.38
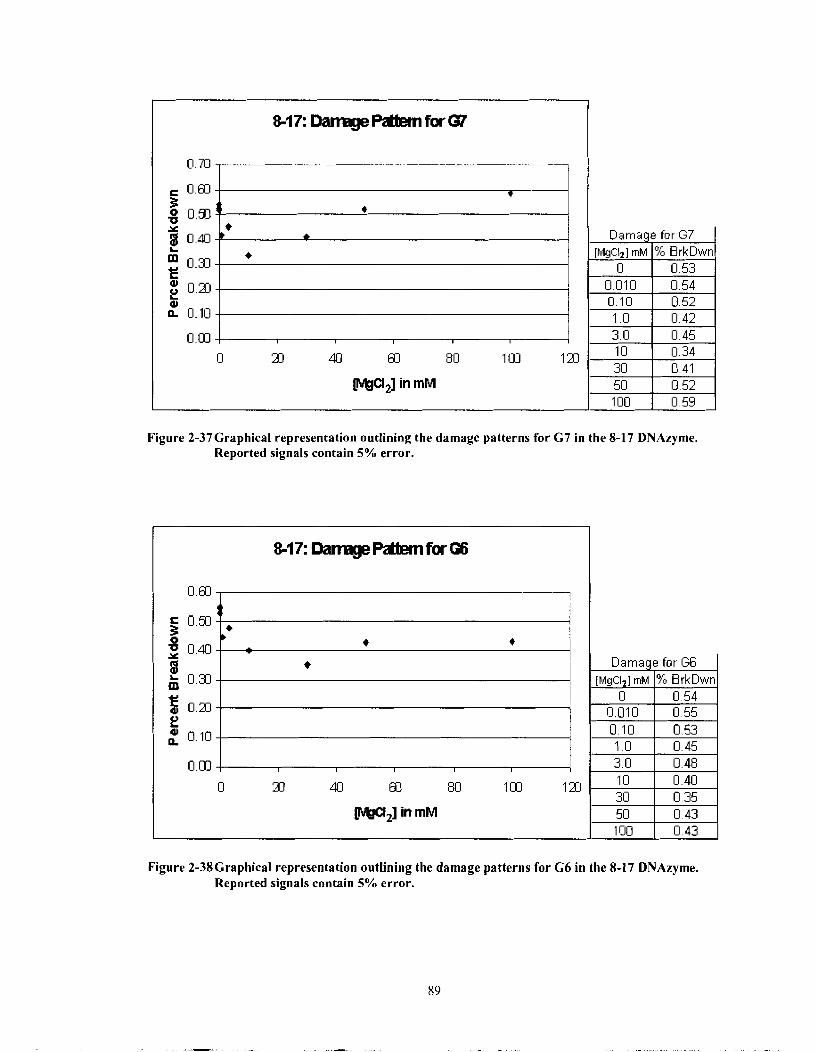
Figure 2-37Graphical representation outlining the damage patterns for G7 in the 8-17 DNAzyme. Reported signals contain 5% error.
Figure 2-38Graphical representation outlining the damage patterns for C6 in the 8-17 DNAzyme. Reported signals contain 5% error.
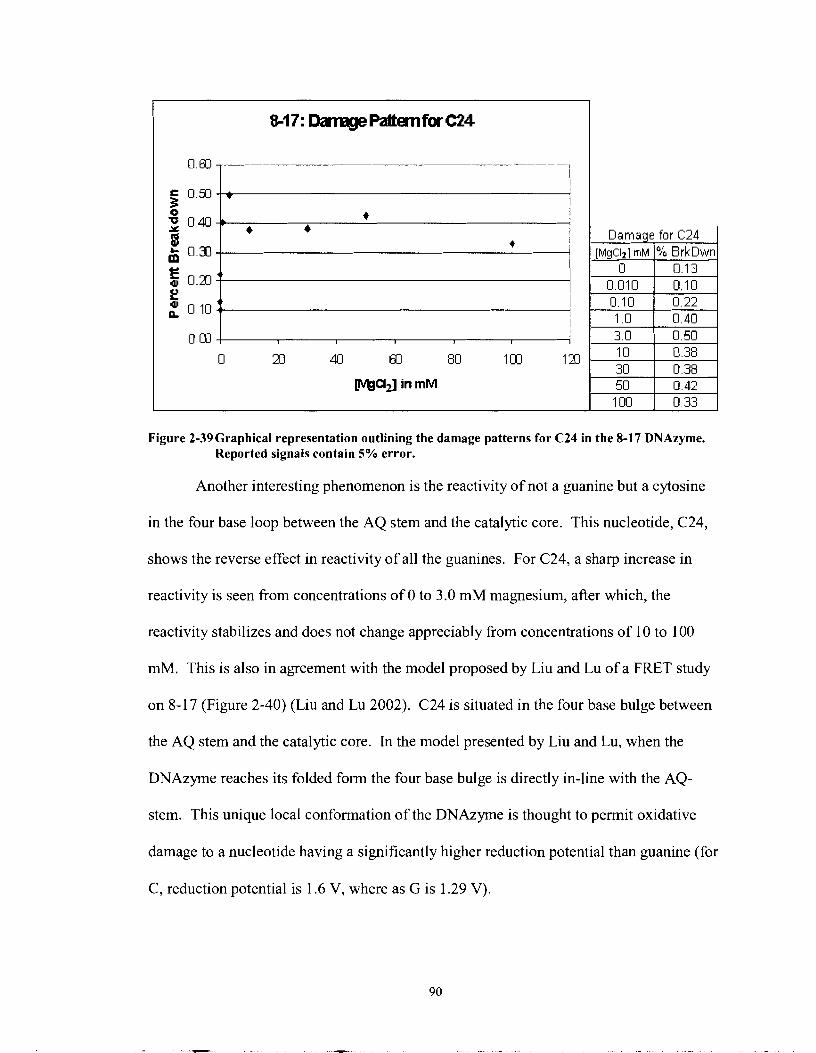
Figure 2-39Graphical representation outlining the damage patterns for C24 in the 8-17 DNAzyme. Reported signals contain 5% error.
Another interesting phenomenon is the reactivity of not a guanine but a cytosine
in the four base loop between the AQ stem and the catalytic core. This nucleotide, C24,
shows the reverse effect in reactivity of all the guanines. For C24, a sharp increase in
reactivity is seen from concentrations of 0 to 3.0 mM magnesium, after which, the
reactivity stabilizes and does not change appreciably from concentrations of 10 to 100
mM. This is also in agreement with the model proposed by Liu and Lu of a FRET study
on 8- 17 (Figure 2-40) (Liu and Lu 2002). C24 is situated in the four base bulge between
the AQ stem and the catalytic core. In the model presented by Liu and Lu, when the
DNAzyme reaches its folded form the four base bulge is directly in-line with the AQ-
stem. This unique local conformation of the DNAzyme is thought to permit oxidative
damage to a nucleotide having a significantly higher reduction potential than guanine (for
C, reduction potential is 1.6 V, where as G is 1.29 V).
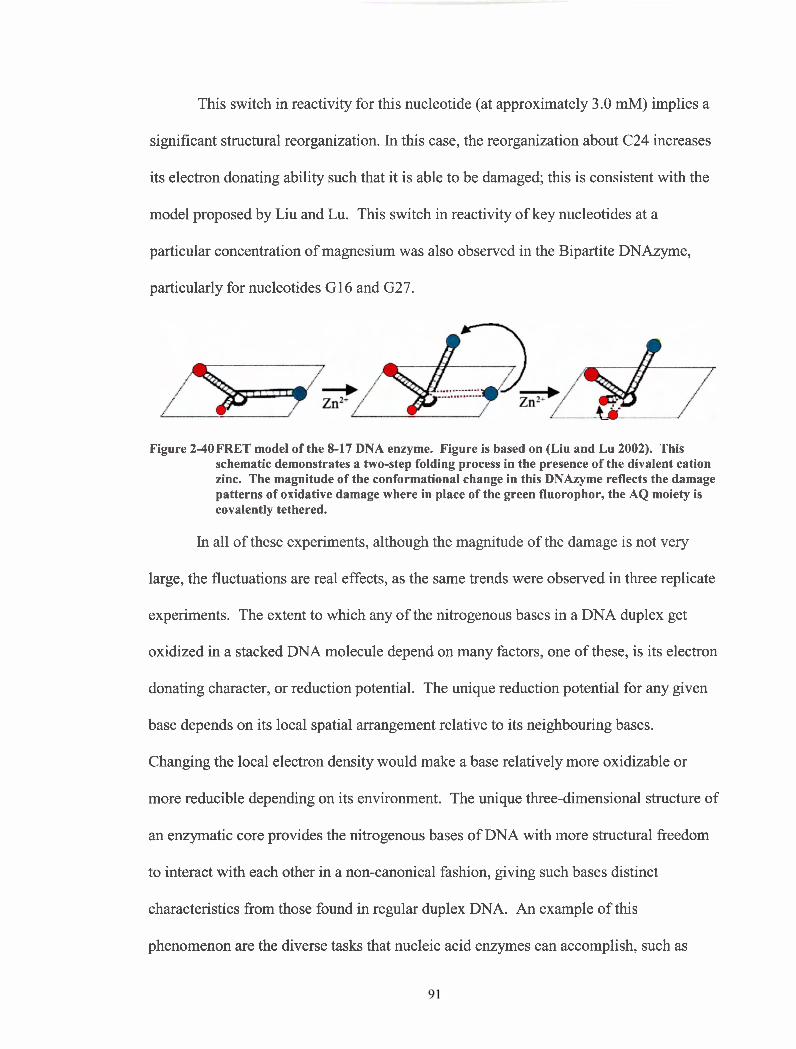
This switch in reactivity for this nucleotide (at approximately 3.0 mM) implies a
significant structural reorganization. In this case, the reorganization about C24 increases
its electron donating ability such that it is able to be damaged; this is consistent with the
model proposed by Liu and Lu. This switch in reactivity of key nucleotides at a
particular concentration of magnesium was also observed in the Bipartite DNAzyme,
particularly for nucleotides G16 and G27.
Figure 2-40 FRET model of the 8-17 DNA enzyme. Figure is based on (Liu and Lu 2002). This schematic demonstrates a two-step folding process in the presence of the divalent cation zinc. The magnitude of the conformational change in this DNAzyme reflects the damage patterns of oxidative damage where in place of the green fluorophor, the AQ moiety is covalently tethered.
In all of these experiments, although the magnitude of the damage is not very
large, the fluctuations are real effects, as the same trends were observed in three replicate
experiments. The extent to which any of the nitrogenous bases in a DNA duplex get
oxidized in a stacked DNA molecule depend on many factors, one of these, is its electron
donating character, or reduction potential. The unique reduction potential for any given
base depends on its local spatial arrangement relative to its neighbouring bases.
Changing the local electron density would make a base relatively more oxidizable or
more reducible depending on its environment. The unique three-dimensional structure of
an enzymatic core provides the nitrogenous bases of DNA with more structural freedom
to interact with each other in a non-canonical fashion, giving such bases distinct
characteristics from those found in regular duplex DNA. An example of this
phenomenon are the diverse tasks that nucleic acid enzymes can accomplish, such as
porphyrin metallation (Li and Sen 1996), and the use of relatively low energy light to
repair thymine dimers (Chinnapen and Sen 2004).
It is difficult as yet to solidly ascertain structural information from these patterns,
especially for guanines like 16 and 27 in the bipartite enzymatic core and cytosine 24 in
the 8-1 7 enzymatic core, as there needs to be a set of rules established to correlate a
damage pattern with a structural feature in a complexly folded nucleic acid molecule.
Although it would be a long systematic task to ultimately create a library of structural
information based on oxidative damage patterns in DNA, it would serve as a very
informative and economical method to discern complex nucleic acid structures. A
starting point would be to look at solved nucleic acid crystal structures, FRET models, or
NMR structures and compare them with the oxidative damage patterns caused by charge
transport. Once rules are established to correlate a structural motif to a damage pattern in
DNA, this would serve as very quick and practical method to study the structure of three-
dimensional nucleic acid molecules in contrast to the time consuming, low yielding
crystallography methods.
In addition, it is important to note that the reactivity of C24 occurs as ionic
strength conditions are increased and also occurs below a G residue on a given gel
(Figure 2-26 above). These are the same conditions that "trailing bands" appear on other
probing gels such as the one for the argininamide titration (Figure 2-10 above). It is
possible to argue that since oxidative damage is targeted to these guanines, as the amount
of cognate ligand is increased (ArgA), more of the population of the deoxynbosensor will
have a conformation where the AQ- stem and detector stem are stacking. This translates
into more piperidine labile product being produced at the guanines in the detector stem.
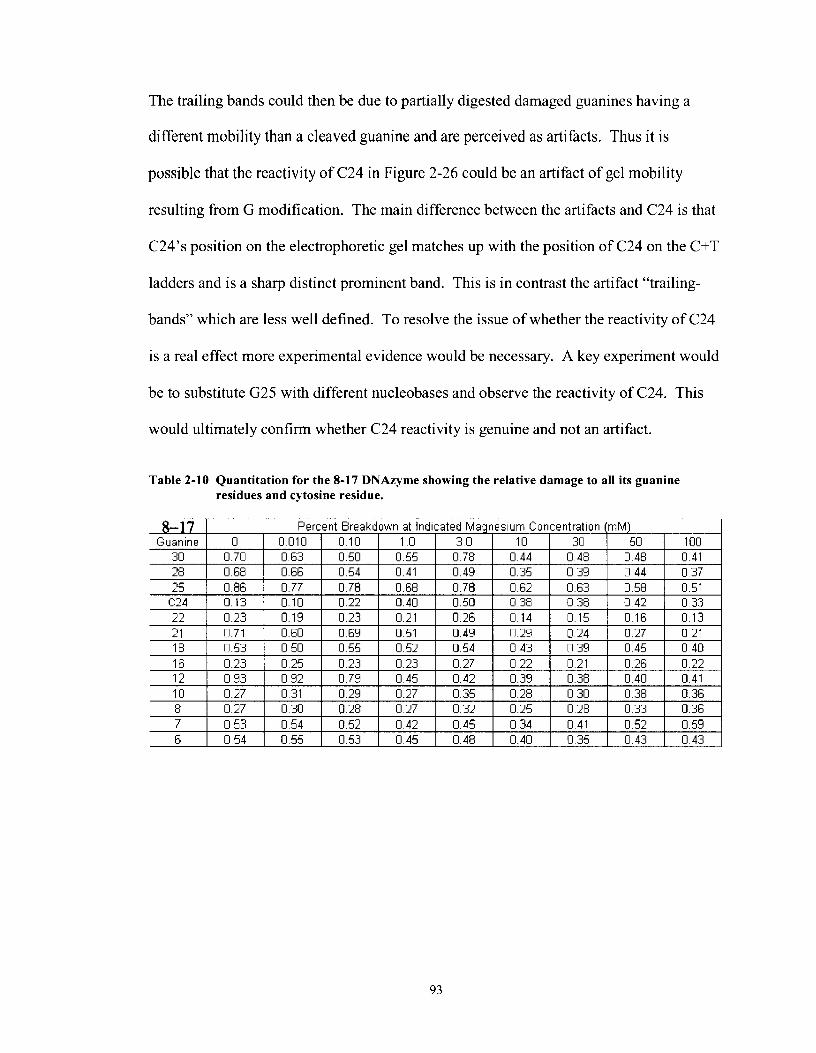
The trailing bands could then be due to partially digested damaged guanines having a
different mobility than a cleaved guanine and are perceived as artifacts. Thus it is
possible that the reactivity of C24 in Figure 2-26 could be an artifact of gel mobility
resulting from G modification. The main difference between the artifacts and C24 is that
C24's position on the electrophoretic gel matches up with the position of C24 on the C+T
ladders and is a sharp distinct prominent band. This is in contrast the artifact "trailing-
bands" which are less well defined. To resolve the issue of whether the reactivity of C24
is a real effect more experimental evidence would be necessary. A key experiment would
be to substitute G25 with different nucleobases and observe the reactivity of C24. This
would ultimately confirm whether C24 reactivity is genuine and not an artifact.
Table 2-10 Quantitation for the 8-17 DNAzyme showing the relative damage to all its guanine residues and cytosine residue.
CHAPTER 3: CONCLUSIONS
Here we have presented data that shows the general utility of deoxyribosensors
for monitoring different small-molecule species. Previous work by Fahlman and Sen
(2001) we had described an "integrated" and "coupled" deoxyribosensors for sensing the
electrically neutral analyte adenosine (which, being a nucleoside, n-stacks efficiently
within the aptamer element (Lin and Pate1 1997) and permits charge conduction through
itself), here we have demonstrated that the more versatile "coupled" deoxyribosensor
design can be used to sense a positively charged amino acid derivative, argininamide,
specifically and efficiently. The specificity and the efficiency of our deoxyribosensors
generally reflect the corresponding properties of the aptamer used in the sensor.
Therefore, newer generations of higher affinity and higher specificity aptamers (whether
made of DNA, RNA, or polypeptides) should give rise to correspondingly more sensitive
deoxyribosensors.
In attempts to diversify the specificity of the working deoxyribosensor described
here (ArgA 2.01), we have replaced the aptamer region specific for argininamide for one
specific for Theophylline. In this set of experiments, the Theo 1.0 or the Thru Theo 1 .O
constructs did not give desired results. It appeared that no charge transport was occurring
in the detector stems of both of these constructs as well as in the aptamer region made of
RNA. Due to the nature of the chimeric constructs, damage in the AQ stem could not be
visualized. It is suspected that most of the oxidative damage could be occurring in the
AQ stem as the RNA region may provide a barrier for charge transport.
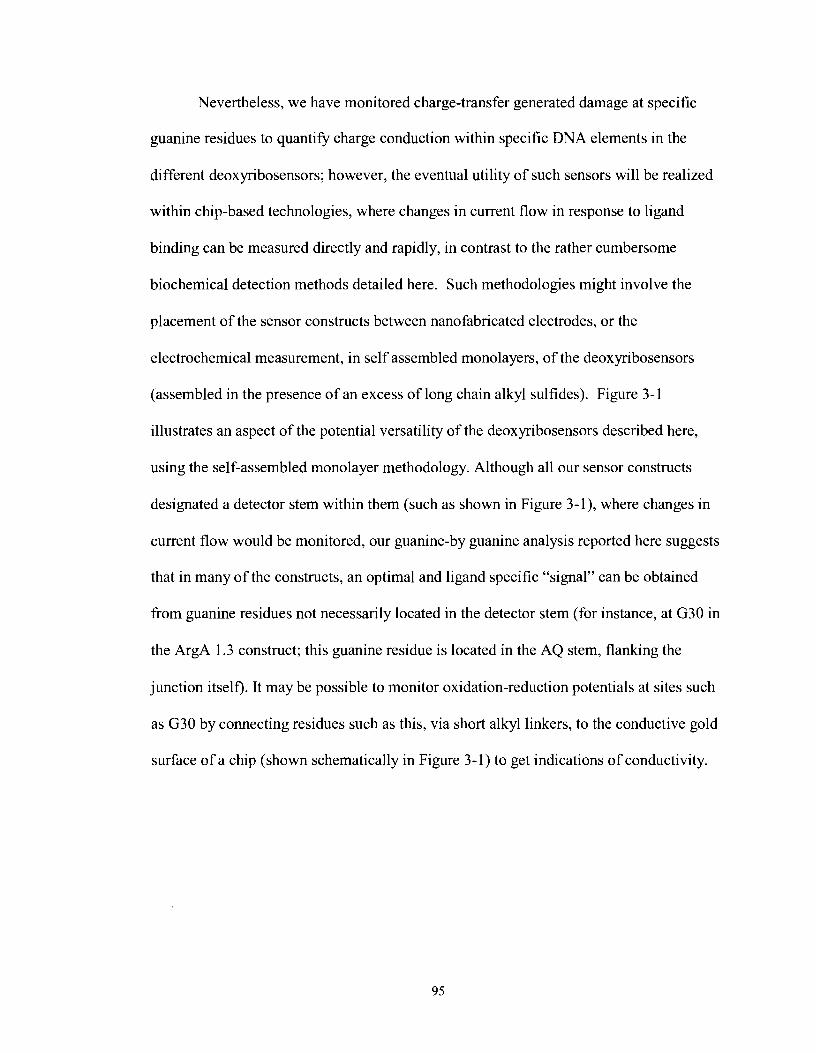
Nevertheless, we have monitored charge-transfer generated damage at specific
guanine residues to quantify charge conduction within specific DNA elements in the
different deoxyribosensors; however, the eventual utility of such sensors will be realized
within chip-based technologies, where changes in current flow in response to ligand
binding can be measured directly and rapidly, in contrast to the rather cumbersome
biochemical detection methods detailed here. Such methodologies might involve the
placement of the sensor constructs between nanofabricated electrodes, or the
electrochemical measurement, in self assembled monolayers, of the deoxyribosensors
(assembled in the presence of an excess of long chain alkyl sulfides). Figure 3- 1
illustrates an aspect of the potential versatility of the deoxyribosensors described here,
using the self-assembled monolayer methodology. Although all our sensor constructs
designated a detector stem within them (such as shown in Figure 3-l), where changes in
current flow would be monitored, our guanine-by guanine analysis reported here suggests
that in many of the constructs, an optimal and ligand specific "signal" can be obtained
from guanine residues not necessarily located in the detector stem (for instance, at G30 in
the ArgA 1.3 construct; this guanine residue is located in the AQ stem, flanking the
junction itself). It may be possible to monitor oxidation-reduction potentials at sites such
as G30 by connecting residues such as this, via short alkyl linkers, to the conductive gold
surface of a chip (shown schematically in Figure 3- 1) to get indications of conductivity.
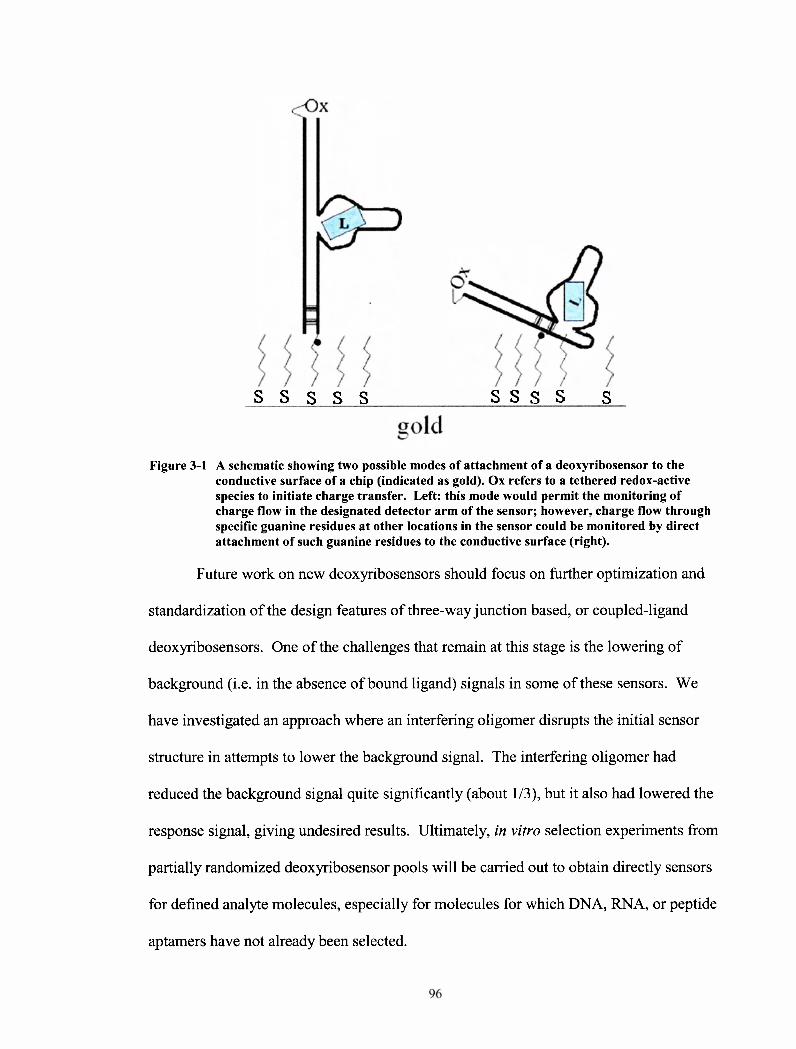
Figure 3-1
S S S S S S S S S s
A schematic showing two possible modes of attachment of a deoxyribosensor to the conductive surface of a chip (indicated as gold). Ox refers to a tethered redox-active species to initiate charge transfer. Left: this mode would permit the monitoring of charge flow in the designated detector arm of the sensor; however, charge flow through specific guanine residues at other locations in the sensor could be monitored by direct attachment of such guanine residues to the conductive surface (right).
Future work on new deoxyribosensors should focus on further optimization and
standardization of the design features of three-way junction based, or coupled-ligand
deoxyribosensors. One of the challenges that remain at this stage is the lowering of
background (i.e. in the absence of bound ligand) signals in some of these sensors. We
have investigated an approach where an interfering oligomer disrupts the initial sensor
structure in attempts to lower the background signal. The interfering oligomer had
reduced the background signal quite significantly (about 1/3), but it also had lowered the
response signal, giving undesired results. Ultimately, in vitro selection experiments from
partially randomized deoxyribosensor pools will be carried out to obtain directly sensors
for defined analyte molecules, especially for molecules for which DNA, RNA, or peptide
aptamers have not already been selected.
One of the most promising aspects of charge transport in DNA is its use as a tool
to discern complex DNA structures. More specifically, their use to discern helical arm
stacking partners in unresolved 3 dimensional DNA structures. We have performed
preliminary experiments on two DNA enzymes yielding promising results. In the
Bipartite DNAzyme, a switch in reactivity is observed for guanines 16 and 27 in the
conserved catalytic loop between the concentrations of 0.10 and 1.0 mM Magnesium.
This implies that in this range of magnesium concentrations, the enzyme must undergo a
gross structural change. For Bipartite we have discerned that regardless of magnesium
concentration, the GGG containing arm is not in enough electronic overlap with the AQ
containing stem as to produce oxidative damage to the guanines situated there. For the 8-
17 DNAzyme we have obtained results that resemble those of a FRET study on the
structure of 8-1 7. In the presence of very little or no magnesium, 8-1 7 adopts a
conformation such that both the GGG containing stem and the enzymatic core exhibit
some degree of stacking with the AQ- containing stem. When 8-1 7 reaches its mature
folded state, the GGG containing arm and the catalytic loop become out of electronic
overlap and this is reflected in the attenuated damage patterns observed by gel
electrophoresis.
A huge potential exists here for exploring unresolved nucleic acid structures by
interpreting the oxidative damage patterns left on the DNA. Future experiments should
aim at establishing a set of rules to correlate a certain damage pattern in DNA with a
structural motif. One approach would investigate the damage patterns produced in
structurally characterized nucleic acid molecules and compare them with their known
three-dimensional structures. In this way, some rules or a library of structural
information based on oxidative damage patterns in DNA could be created. This would
serve as a very quick and practical technique to study the three-dimensional structure of
nucleic acid molecules in solution in contrast to the time consuming crystallographic
methods, which address solid-state structures.
Although this method of exploring unresolved nucleic acid structures has a lot of
promise there are certainly foreseeable limitations. For instance, the work shown in this
thesis only outlines the use of charge transfer for discerning helical arm stacking partners
and not for exploring fine local structure of complexly folded nucleic acids. This limits
the "resolution" and the type of the structure that one is trying to study, to a level where
only structures containing helical arms can be studied. Limitations may also exist on size
of the DNA structure one is trying to study, the bigger and longer a DNA molecule
becomes, the electron transfer process becomes less efficient and the DNA structure also
becomes more dynamic. Structures being studied must contain at least one helical stem
for the purpose of injecting the radical cation from the photo activated AQ moiety. Also,
it is important to be able to assess which nucleic acid structures would be good
candidates for probing in this manner; since charge transfer through DNA highly depends
on n-orbital overlap and base stacking, the higher the degree of unpredictable folding or
regions of single stranded character may impede the radical cation from being able to
migrate from the injecting helical arm. The more ambiguous the nucleic acid structure is,
the greater chance that it would contain a low degree of n-orbital overlap from region to
region, thus reducing the chance that one would be able to see appreciable oxidative
damage due to charge transport.
Although certain criteria must be present for studying nucleic acid structures in
this fashion, it is these very constraints on charge transport through DNA that generate
the distinctive damage patterns for a particular structure. More research is required to
understand the intricacies of using this method to discern fine local conformations of
nucleic acid structures. As a starting point, the structure of a DNA hairpin with a 4 base
loop (tetra loop) can be studied for fine local structure by systematically varying the
identity of the bases in the loop. Correlating the changes in base sequence to changes in
damage patterns would then start to unveil the potential of this technique for studying
nucleic acid structure.
REFERENCES
Anderson, R. and G. Wright (1999). "Energetics and rate of electron transfer in DNA from base radical anions to electron-affinic intercalators in aqueous solution." Phys. Chem. Chem. Phys. 1: 4827-3 1.
Basti, M. M., J. W. Stuart, et al. (1996). "Design, biological activity and NMR-solution structure of a DNA analogue of yeast tRNA(Phe) anticodon domain." Nat Struct Biol3(1): 38-44. -
Beveridge, D. L. and K. J. McConnell(2000). "Nucleic acids: theory and computer simulation, Y2K." Curr Opin Struct Biol lO(2): 182-96.
Boone, E. and G. B. Schuster (2002). "Long-range oxidative damage in duplex DNA: the effect of bulged G in a G-C tract and tandem GIA mispairs." Nucleic Acids Res 30(3): 830-7.
Braun, E., Y. Eichen, et al. (1998). "DNA-templated assembly and electrode attachment of a conducting silver wire." Nature 391(6669): 775-8.
Burrows, C. J. and J. G. Muller (1998). "Oxidative Nucleobase Modifications Leading to Strand Scission." Chem Rev 98(3): 1 109- 1 152.
Cadet, J., M. Berger, et al. (1 997). "Oxidative damage to DNA: formation, measurement, and biological significance." Rev Phvsiol Biochem Pharmacol 131: 1-87.
Camerini-Otero, R. D. and P. Hsieh (1993). "Parallel DNA triplexes, homologous recombination, and other homology-dependent DNA interactions." Cell 73(2): 2 17-23.
Chinnapen, D. J. and D. Sen (2004). "A deoxyribozyme that harnesses light to repair thymine dimers in DNA." Proc Natl Acad Sci U S A lOl(1): 65-9.
Debije, M. G., M. T. Milano, et al. (1999). "DNA Responds to Ionizing Radiation as an Insulator, Not as a "Molecular Wire"." Annew Chem Int Ed Ennl38(18): 2752- 2756.
Delaney, S. and J. K. Barton (2003). "Long-range DNA charge transport." J Org Chem 68(17): 6475-83.
Duarte, V., D. Gasparutto, et al. (200 1). "Repair and mutagenic potential of oxaluric acid, a major product of singlet oxygen-mediated oxidation of 8-0x0-7,s- dihydroguanine." Chem Res Toxic01 14(1): 46-53.
Duarte, V., J. G. Muller, et al. (1999). "Insertion of dGMP and dAMP during in vitro DNA synthesis opposite an oxidized form of 7,8-dihydro-8-oxoguanine." Nucleic Acids Res 27(2): 496-502.
Duckett, D. R. and D. M. Lilley (1990). "The three-way DNA junction is a Y-shaped molecule in which there is no helix-helix stacking." Embo J 9(5): 1659-64.
Eley, D. D. and D. I. Spivey (1962). "Semiconductivity of organic substances. IX. Nucleic acid in the dry state." Transactions of the Faraday Society 58: 41 1-415.
Fahlman, R. P. and D. Sen (200 1). "DNA Conformational Switches as Sensitive Electronic Sensors of Analytes." J Am Chem Soc 124: 46 10- 16.
Feldman, A. R. and D. Sen (2001). "A new and efficient DNA enzyme for the sequence- specific cleavage of RNA." J Mol Biol313(2): 283-94.
Fink, H. W. and C. Schonenberger (1999). "Electrical conduction through DNA molecules." Nature 398(6726): 407- 10.
Gasper, S. M. and G. B. Schuster (1997). "Intramolecular Photoinduced Electron Transfer to Anthraquinones Linked to Duplex DNA: The Effect of Gaps and Traps on Long-Range Radical Cation Migration." J Am Chem Soc 119: 12762- 71.
Giese, B. (2000). "Long-distance charge transport in DNA: the hopping mechanism." Acc Chem Res 33(9): 63 1-6.
Giese, B. (2002). "Electron transfer in DNA." Curr Opin Chem Biol6(5): 612-8.
Giese, B. (2002). "Long-distance electron transfer through DNA." Annu Rev Biochem 71: 51-70.
Giese, B., J. Amaudrut, et al. (2001). "Direct observation of hole transfer through DNA by hopping between adenine bases and by tunnelling." Nature 412(6844): 3 18-20.
Giese, B., S. Wessely, et al. (1999). "On the Mechanism of Long-Range Electron Transfer through DNA." Angewandte Chemie International Edition 38(7): 996- 998.
Gold, L., B. Polisky, et al. (1995). "Diversity of oligonucleotide functions." Annu Rev Biochem 64: 763-97.
Grinstaff, M. W. (1999). "How Do Charges Travel through DNA?-An Update on a Current Debate." Angew Chem Int Ed End 38(24): 3629-3635.
Hagerman, P. J. (1988). "Flexibility of DNA." Annu Rev Biophvs Biophvs Chem 17: 265-86.
Harada, K. and A. D. Frankel (1995). "Identification of two novel arginine binding DNAs." Embo J 14(23): 5798-8 1 1.
Hendeles, L. and M. Weinberger (1983). "Theophylline. A "state of the art" review." Pharmacotherapv 3(1): 2-44.
Herbert, A. and A. Rich (1999). "Left-handed Z-DNA: structure and function." Genetica 106(1-2): 37-47.
Hermann, T. and D. J. Pate1 (2000). "Adaptive recognition by nucleic acid aptamers." Science 287(5454): 820-5.
Huizenga, D. E. and J. W. Szostak (1 995). "A DNA aptamer that binds adenosine and ATP." Biochemistry 34(2): 656-65.
Jenison, R. D., S. C. Gill, et al. (1994). "High-resolution molecular discrimination by RNA." Science 263(5 152): 1425-9.
Jortner, J., M. Bixon, et al. (1998). "Charge transfer and transport in DNA." Proc Natl Acad Sci U S A 95(22): 12759-65.
Kan, Y. and G. B. Schuster (1 999). "Long-Range Guanine Damage in Single-Stranded DNA: Charge Transport through a Duplex Bridge and in a Single-Stranded Overhang." J Am Chem Soc 121: 10857-64.
Kino, K., I. Saito, et al. (1998). "Product Analysis of GG-Specific Photooxidation of DNA via Electron Transfer: 2-Aminoimidazolone as a Major Guanine Oxidation Product." J Am Chem Soc 120: 7373-74.
Kino, K. and H. Sugiyama (200 1). "Possible cause of G-C-->C-G transversion mutation by guanine oxidation product, imidazolone." Chem BiolS(4): 369-78.
Leontis, N. B., W. Kwok, et al. (1 991). "Stability and structure of three-way DNA junctions containing unpaired nucleotides." Nucleic Acids Res 19(4): 759-66.
Li, Y. and D. Sen (1996). "A catalytic DNA for porphyrin metallation." Nat Struct Biol 3(9): 743-7.
Lilley, D. M. (1995). "Kinking of DNA and RNA by base bulges." Proc Natl Acad Sci U 92(16): 7140-2.
Lilley, D. M. (2000). "Structures of helical junctions in nucleic acids." Q Rev Biophvs 33(2): 109-59.
Lin, C. H. and D. J. Pate1 (1997). "Structural basis of DNA folding and recognition in an AMP-DNA aptamer complex: distinct architectures but common recognition motifs for DNA and RNA aptamers complexed to AMP." Chem Biol4(11): 8 17- 32.
Liu, C. S., R. Hernandez, et al. (2004). "Mechanism for radical cation transport in duplex DNA oligonucleotides." J Am Chem Soc 126(9): 2877-84.
Liu, J. and Y. Lu (2002). "FRET study of a trifluorophore-labeled DNAzyrne." J Am Chem Soc l24(5 1): 15208- 16.
Lu, M., Q. Guo, et al. (1991). "Effect of sequence on the structure of three-am DNA junctions." Biochemistrv 30(24): 58 15-20.
Mandal, M., B. Boese, et al. (2003). "Riboswitches control fundamental biochemical pathways in Bacillus subtilis and other bacteria." Cell 113(5): 577-86.
Mao, C., W. Sun, et al. (1999). "A nanomechanical device based on the B-Z transition of DNA." Nature 397(67 15): 144-6.
Meggers, E., M. E. Michel-Beyerle, et al. (1998). "Sequence Dependent Long Range Hole Transport in DNA." J. Am. Chem. Soc. 120: 12950-55.
Mirkin, C. A., R. L. Letsinger, et al. (1996). "A DNA-based method for rationally assembling nanoparticles into macroscopic materials." Nature 382(6592): 607-9.
Murphy, C. J., M. R. Arkin, et al. (1993). "Long-range photoinduced electron transfer through a DNA helix." Science 262(5 136): 1025-9.
Osborne, S. E. and A. D. Ellington (1997). "Nucleic Acid Selection and the Challenge of Combinatorial Chemistry." Chem Rev 97(2): 349-370.
Paukstelis, P. J., J. Nowakowski, et al. (2004). "Crystal structure of a continuous three- dimensional DNA lattice." Chem Biol 1 l(8): 1 1 19-26.
Peattie, D. A. (1979). "Direct chemical method for sequencing RNA." Proc Natl Acad Sci U S A 76(4): 1760-4.
Razskazovskii, Y., S. G. Swarts, et al. (1997). "Competitive Electron Scavenging by Chemically Modified Pyrimidine Bases in Bromine-Doped DNA: Relative Efficiencies and Relevance to Intrastrand Electron Migration Distances." J. Phys. Chem. B. 101: 1460-67.
Robertson, S. A., K. Harada, et al. (2000). "Structure determination and binding kinetics of a DNA aptamer-argininamide complex." Biochemistrv 39(5): 946-54.
Saito, I., T. Nakamura, et al. (1998). "Mapping of the hot spots for DNA damage by one- electron oxidation: Efficacy of GG doublets and GGG triplets as a trap in long- range hole migration." Journal of the American Chemical Society 120(48): 12686-12687.
Saito, I., M. Takayama, et al. (1 995). "Photoinduced DNA Cleavage Via Electron- Transfer - Demonstration That Guanine Residues Located 5' to Guanine Are the Most Electron-Donating Sites." Journal of the American Chemical Society 117(23): 6406-6407.
Sanii, L. and G. B. Schuster (2000). "Long-Distance Charge Transport in DNA: Sequence-Dependent Radical Cation Injection Efficiency." J. Am. Chem. Soc. 122: 1 1545-46.
Sankar, C. G. and D. Sen (2004). "DNA helix-stack switching as the basis for the design of versatile deoxyribosensors." J Mol Biol340(3): 459-67.
Santini, G. P., C. Pakleza, et al. (2003). "DNA tri- and tetra-loops and RNA tetra-loops hairpins fold as elastic biopolymer chains in agreement with PDB coordinates." Nucleic Acids Res 31(3): 1086-96.
Santoro, S. W. and G. F. Joyce (1997). "A general purpose RNA-cleaving DNA enzyme." Proc Natl Acad Sci U S A 94(9): 4262-6.
Sartor, V., P. T. Henderson, et al. (1999). "Radical Cation Transport and Reaction in RNAIDNA Hybrid Duplexes: Effect of Global Structure on Reactivity." J Am Chem Soc 121(48): 11027-1 1033.
Sassanfar, M. and J. W. Szostak (1993). "An RNA motif that binds ATP." Nature 364(6437): 550-3.
Schuster, G. B. (2000). "Long-range charge transfer in DNA: transient structural distortions control the distance dependence." Acc Chem Res 33(4): 253-60.
Schwogler, A., L. Burgdorf, et al. (2000). "Self-Repairing DNA Based on a Reductive Electron Transfer through the Base Stack." Angewandte Chemie International Edition 39(2 1): 39 18-20.
Seeman, N. C. (1 999). "DNA engineering and its application to nanotechnology." Trends Biotechnol 17(11): 437-43.
Seeman, N. C. (2003). "At the crossroads of chemistry, biology, and materials: structural DNA nanotechnology." Chem Biol lO(12): 1 15 1-9.
Seeman, N. C. (2003). "DNA in a material world." Nature 421(6921): 427-3 1
Seidel, C. A. M., A. Schulz, et al. (1996). "Nucleobase-Specific Quenching of Fluorescent Dyes. 1. Nucleobase One-Electron Redox Potentials and Their Correlation with Static and Dynamic Quenching Efficiencies." J. Phvs. Chem. 100: 5541-53.
Sheu, C. and C. S. Foote (1995). "Reactivity toward Singlet Oxygen of a 7,8-Dihydro-8- oxoguanosine ("8-Hydroxyguanosine") Formed by Photooxidation of a Guanosine Derivative." J Am Chem Soc 117: 6439-42.
Shibutani, S., M. Takeshita, et al. (1991). "Insertion of Specific Bases During DNA- Synthesis Past the Oxidation-Damaged Base 8-Oxodg." Nature 349(6308): 43 1 - 434.
Soukup, G. A. and R. R. Breaker (2000). "Allosteric nucleic acid catalysts." Curr Opin Struct Biol lO(3): 3 18-25.
Steenken, S. and S. V. Jovanovic (1 997). "How Easily Oxidizable Is DNA? One-Electron Reduction Potentials of Adenosine and Guanosine Radicals in Aqueous Solution." J. Am. Chem. Soc. 119: 61 7-1 8.
Stuhrneier, F., J. B. Welch, et al. (1997). "Global structure of three-way DNA junctions with and without additional unpaired bases: a fluorescence resonance energy transfer analysis." Biochemistry 36(44): 1 3530-8.
Sugiyama, H. and I. Saito (1996). "Theoretical studies of GC-specific photocleavage of DNA via electron transfer: Significant lowering of ionization potential and 5'- localization of HOMO of stacked GG bases in B-form DNA." Journal of the American Chemical Society 118(30): 7063-7068.
Travascio, P., A. J. Bennet, et al. (1999). "A ribozyme and a catalytic DNA with peroxidase activity: active sites versus cofactor-binding sites." Chem Biol6(11): 779-87.
Turro, N. and J. K. Barton (1 998). "Paradigms, supermolecules, electron transfer and chemistry at a distance. What's the problem? The science or the paradigm?" Journal of Biological Inorganic Chemistn, 3(2): 201 - 209.
van Buuren, B. N., F. J. Overmars, et al. (2000). "Solution structure of a DNA three-way junction containing two unpaired thymidine bases. Identification of sequence features that decide conformer selection." J Mol Biol304(3): 37 1-83.
Watson, J. D. and F. H. Crick (1 953). "Molecular structure of nucleic acids; a structure for deoxyribose nucleic acid." Nature 171(4356): 737-8.
Welch, J. B., D. R. Duckett, et al. (1993). "Structures of bulged three-way DNA junctions." Nucleic Acids Res 21(19): 4548-55.
Welch, J. B., F. Walter, et al. (1995). "Two inequivalent folding isomers of the three-way DNA junction with unpaired bases: sequence-dependence of the folded conformation." J Mol Biol251(4): 507- 19.