Embed Size (px)
Citation preview
• • j t
DNA Genotyping of Kelampayang (Neolamarckia cadamba) Progenies (Sample Set I) Using Inter Simple Sequence Repeat (ISSR) Marker
Valeria S Kabalon 25323
QK 495 RI5 Vl63 Bacbelor of Science with Honours 2812 (Resource Biotechnology)
2012

! .
. .
ACKNOWLEDGEMENT
First and foremost, I give praise to God for the endless blessings, strength,
endurance and brainpower that are given to me throughout this project. I also wish to
thanks my supervisor, Dr. Ho Wei Seng and my co-supervisor, Dr. Pang Shek Ling
(Research Officer ofSarawak Forestry Corporation (SFC)) for their supervisions, guidance
and supports throughout the completion of this project. Special thanks are owed to SFC for
providing the Kelampayan seedlings samples and also for supporting me with the essential
equipments needed for this project to be completed in time.
Credits are also given to the postgraduate students of Forest Genomics and
Informatics Lab (/GiL), Miss Lai Pei Sing, Miss Tiong Shing Yiing, and Mr. Phui Seng
Loi, and my supportive laboratory mates for their sincerity and enthusiasm to guide and
support me in the progress of this project and also to share useful information and critical
reviews needed for the completion of this project.
Finally and most importantly, I am very grateful to my family for always being
supportive, caring and loving, and encouraging throughout the completion of my final year
project.
I
I ,'. ,' " ,r
Acknowledgement
Declaration
Table of Contents
List of Figures
List ofTables
List of Abbreviations
Abstract
Abstrak
Chapter 1
Chapter 2
Chapter 3
Chapter 4
Pusat Khidmat Maldumat Akademik UNIVERSm MALAYSIA SARAWAK
TABLE OF CONTENT
I
II
III
v
VI
VII
1
1
Introduction 2
Literature Review
2.1 Neolamarckia cadamba (Roxb.) Bosser 4
2.2 DNA genotyping 6
2.3 ISSR markers and ISSR-PCR 7
Materials and Methods
3.1 Sampling of plant materials 10
3.2 DNA extraction 10
3.3 ISSR-PCR optimization 10
3.4 AGE and PCR products visualization 11
3.5 Data analysis 12
Results and Discussion
4.1 ISSR-PCR optimization 14
4.2 ISSR-PCR analysis 15
4.3 Data analysis
4.3.1 Data scoring 16
II
'. ' t I I i'·' • " I
Chapter 5
References
Appendix A
Appendix B
Appendix C
4.3.2
4.3.3
Genetic diversity
Genetic relatedness
Conclusion and Recommendations
17
21
26
28
33
34
37
III
..f •• 1f t it;..· IIIII
LIST OF FIGURES
Figure Page
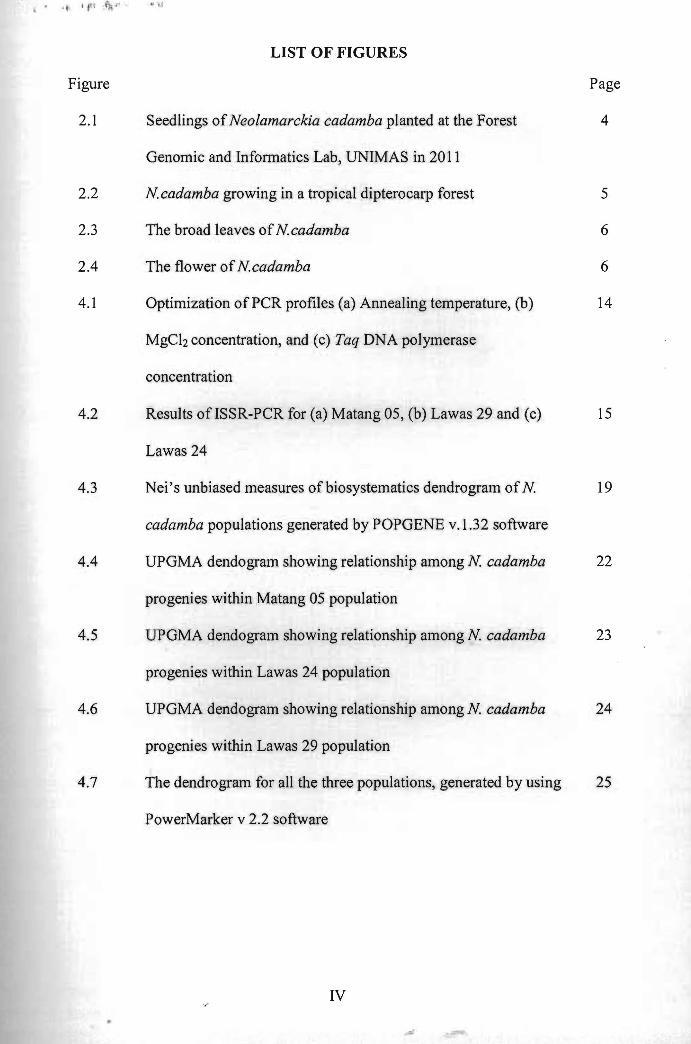
2.1 Seedlings ofNeolamarckia cadamba planted at the Forest 4
Genomic and Informatics Lab, UNIMAS in 2011
2.2 Ncadamba growing in a tropical dipterocarp forest 5
2.3 The broad leaves ofN.cadamba 6
2.4 The flower ofNcadamba 6
4.1 Optimization ofPCR profiles (a) Annealing temperature, (b) 14
MgCh concentration, and (c) Taq DNA polymerase
concentration
4.2 Results ofISSR-PCR for (a) Matang OS, (b) Lawas 29 and (c) 15
Lawas 24
4.3 Nei's unbiased measures of biosystematics dendrogram of N. 19
cadamba populations generated by POPGENE v.l.32 software
4.4 UPGMA dendogram showing relationship among N cadamba 22
progenies within Matang 05 population
4.5 UPGMA dendogram showing relationship among N cadamba 23
progenies within Lawas 24 population
4.6 UPGMA dendogram showing relationship among N cadamba 24
progenies within Lawas 29 population
4.7 The dendrogram for all the three populations, generated by using 25
PowerMarker v 2.2 software
IV
..
LIST OF TABLES
Table Page
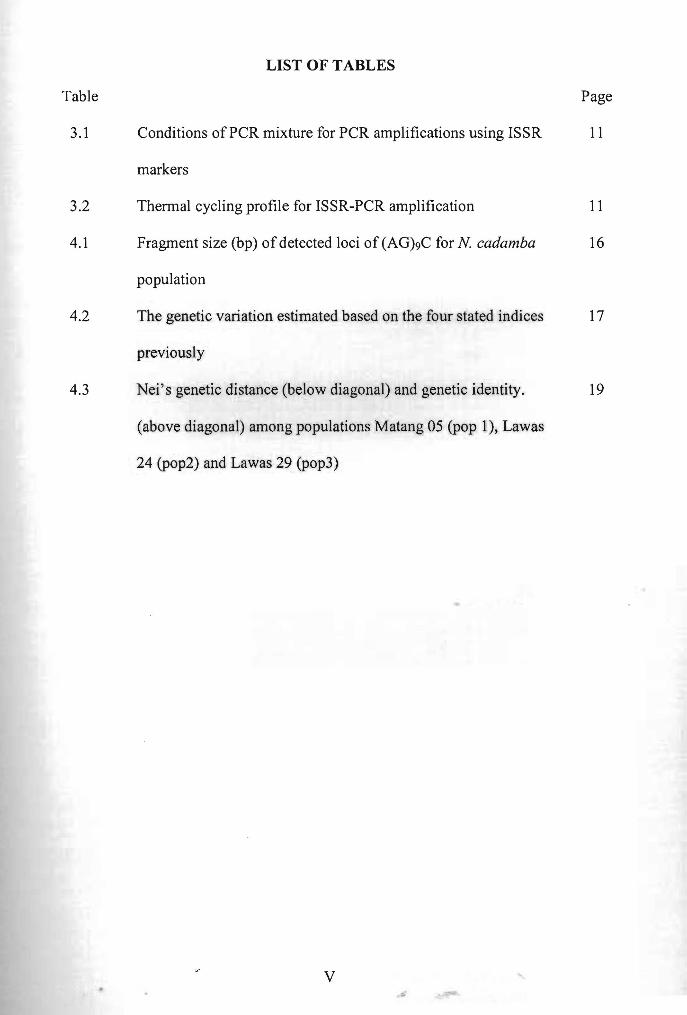
3.1 Conditions ofPCR mixture for PCR amplifications using ISSR 11
markers
3.2 Thermal cycling profile for ISSR-PCR amplification 11
4.1 Fragment size (bp) of detected loci of (AG)9C for N. cadamba 16
population
4.2 The genetic variation estimated based on the four stated indices 17
previously
4.3 Nei's genetic distance (below diagonal) and genetic identity. 19
(above diagonal) among populations Matang 05 (pop 1), Lawas
24 (pop2) and Lawas 29 (pop3)
v
AGE
bp
cm
DNA
ddH20
dNTP
EtBr
ISSR
ISSR-PCR
m
mL
mm
mM
NTSYS
PCR
RALP
RAPD
SFC
SSR
Taq
UPGMA
UV
~L
LIST OF ABBREVIATIONS
Agarose gel electrophoresis
Base pair
Centimetre
Deoxyribonucleic acid
Double distilled water (Ultrapure water)
Deoxynucleotide-triphosphate
Ethidium bromide
Inter-simple sequence repeat
Inter~simple sequence repeat- polymerase chain reaction
Meter
Millilitre
Millimetre
Millimolar
Numerical taxonomy system for Windows
Polymerase chain reaction
Random amplified length polymorphism
Randomly Amplified polymorphic DNA
Sarawak Forestry Corporation
Simple sequence repeats
Thermus aquaticus
Unweighted pair group mean average
Ultraviolet
Volt
Microliter
VI
V
1
' t
DNA Genotyping of Kelampayan (Neolamarckia cadamba) Progenies (Sample Set I)
Using Inter Simple Sequence Repeat (ISSR) Marker
Valeria S Kabalon
Resource Biotechnology Programme Faculty of Resource Science and Technology
University Malaysia Sarawak
ABSTRACT
Neolamarckia cadamba, commonly known as Kdampayan is a fast-growing tropical timber species. It has many commercial applications such as production of plywood, pulp and paper, boxes and crates, furniture and light construction components. Currently, Kelampayan is a valuable species for the commercial forest plantation industry as it is able to help double the profits gained from timber industry. Molecular characterization of Ncadamba is needed so that the qualities of its progenies are maintained. In this project, DNA genotyping of Kelampayan were carried out to determine the genetic relatedness of Kelampayan progenies. One selected ISSR primers: (AGhC was used to assess the genetic diversity and genetic relatedness of ISO Ncadamba progenies (halfsib) from Matang OS, Lawas 24 and Lawas 29. This primer had successfully amplified 17 loci ranging between 389 bp to 1,047 bp, by which Lawas 29 was the most polymorphic (100% polymorphic). The Shannon's diversity index for Lawas 29 was the highest (0.44S3) compared to Matang OS (0.2064) and Lawas 24 (0.173 1) populations while the Gst value for the populations was 2.S837.The gene diversity within the population (Hs) was 0.1783, whereas the total gene diversity (H.) between the populations was 0.2128.
Keywords: Neolamarckia cadamba, ISSR markers, molecular characterization, genetic relatedness, genetic diversity.
ABSTRAK
Neolamarckia cadamba. umumnya diketahui sebagai Kelampayan merupakan spesis kayu balak tropika yang cepat membesar. fa mempunyai pelbagai aplikasi komersial seperti penghasilan papan lapis, pulpa dan kertas, kotak dan peti, komponen perabot dan pembinaan ringan. Kelampayan merupakan spesis bernilai dalam industri penanaman hutan secara komersial pada masa kini kerana ianya mampu melipatgandakan keuntungan yang diperoleh daripada industri pembalakan. Pengkarakteran molekular Ncadamba diperlukan supaya kualiti generasinya dapat dikekalkan. Pengkarakteran DNA bagi Kelampayan telah dilaksanakan dalam projek ini untuk mengenalpasti keberkaitan genetik baka-baka Kelampayan. Satu primer fSSR iaitu (A GhC telah dipilih untuk menentukan kepelbagaian genetik dan keberkaitan genetik bagi 150 anak benih Ncadamba yang berasal daripada Matang 05, Lawas 24 dan Lawas 29. Primer ini telah berjaya mengamplifikasikan 17 lokus-Iokus, yang bernilai antara 389 pa sehingga 1,047 pa, dan populasi Lawas 29 mempunyai kadar polimorjik yang tertinggi (J 00% polimorjik). fndeks kepelbagaian Shannon's bagi Lawas 29 merupakan yang tertinggi (0.4453) berbanding dengan populasi Matang 05 (0.2064) dan lawas 24 (0.1731), manakala nilai GS1 bagi ketiga-tiga populasi adalall 2.5837. Nilai bagi kepelbagaian gen di antara populasi adalah 0.1783, manakala jumlall keseluruhan bagi kepelbagaian gen (HJ di antara populasi adalah 0.2128.
Kala Kunci: Neolamarckia cadamba, penanda fSSR, pengkarakteran molekular, keberkaitan genetik, kepelbagaian genetik.
1 ..
• f r t ". ~ . " · 1
CHAPTER 1
INTRODUCTION
Malaysian timber industry continues to be a major export benefactor for the nation
as the demand for tropical timbers is always on hike. However, the country's timber
industry is now facing a serious problem as the prime sources for natural forest species are
becoming limited due to deforestation activities. In order to ensure the continuous
availability of timber sources in the future, commercial forest plantations of fast-growing
species are practiced. Neolamarckia cadamba (Roxb.) Bosser (N. cadamba) of the
Rubiaceae family is a typical pioneer, fast-growing tree species which grows up to 45 m
tall, without branches for more than 25 m (Joker, 2000). N. cadamba self prunes and
adapts very well in exploited areas (Ismail et al., 1995). It grows on varieties of soiis and
tolerates intennittent flooding (Joker, 2000). N. cadamba is widely distributed from India,
Nepal, through Thailand and Indo-China, to Papua New Guinea (Willis 1973; Ridsdale
1978; Wong 1989; Joker 2000). It is commonly found within initia1 secondary forest areas
below 1000 m altitude which receives more than 1500 mm rain per year, (Wong, 1989).
Joker (2000) reported that due to its fast growing ability, N. cadamba is suitable for
reforestation in watersheds and eroded areas, and also for windbreakers in agroforestry
systems. According to Joker (2000), N. cadamba is a lightweight hardwood with poor
durability, thus making it suitable for production of pulp for low- and medium- quality
paper as well as for light indoors construction work (Joker, 2000). It is also reported that
the leaves and bark of N. cadamba contains medicinal values (Patel and Kumar, 2007) and
other commercial values (Joker, 2000). To date, the genetic infonnation on N. cadamba is
still limited and further research on it is of demand. Proper documentation on the genetic
information of N.cadamba needs to be done for better understanding on this species itself.
The aim of this study is to perfonn the DNA genotyping of N.cadamba using the ISSR
2
, . ,.... ~. ""
markers. The term DNA fingerprinting refers to the method developed by Sir Alec Jeffreys
(Jeffreys, 1985) and his associates in 1985 for the simultaneous detection of highly
variable DNA fragments by hybridisation of specific multilocus probes to
electrophoretically separated restriction fragments (Bhat, 2001). According to Bhat (2001),
the DNA fingerprints which resembles barcodes, are unique to individuals and thus used in
much the same way as conventional fingerprint which helps to identify individuals with
supreme certainty. In this project, the ISSR markers are used to determine the genetic
diversity of N cadamba. Molecular markers which are based on DNA sequence
polymorphisms are not influenced by environmental conditions and developmental stage of
a particular plant and show high levels of polymorphisms (Domyati et aI., 2010). ISSR
markers have been developed as an anonymous, RAPDs-like approach which accesses
variation in numerous microsatellites regions dispersed throughout the genome
(Zietkiewicz et at., 1994). The ISSR markers are simple and have reproducibility and it
requires small amount of DNA and does not require information on DNA sequence (Gupta
et at., 1996). ISSR primers are designed from SSR motifs and can be undertaken for any
plant species containing sufficient number and distribution of SSR motifs in the genome
(Buhulikar et at., 2004). ISSR marker is based on a peR-amplification of 100-3000 base
pair regions between inversely oriented SSRs or microsatellites (Bussell et at., 2005).
Objective of this study was to determine the genetic diversity and genetic relatedness ofN
cadamba progenies using ISSR marker.
The results from this research are useful for the conservation of gene and the tree
improvement programme of this species.
3
, - o j \ I I 1 I: • • •
CHAPTER 2
LITERATURE REVIEW
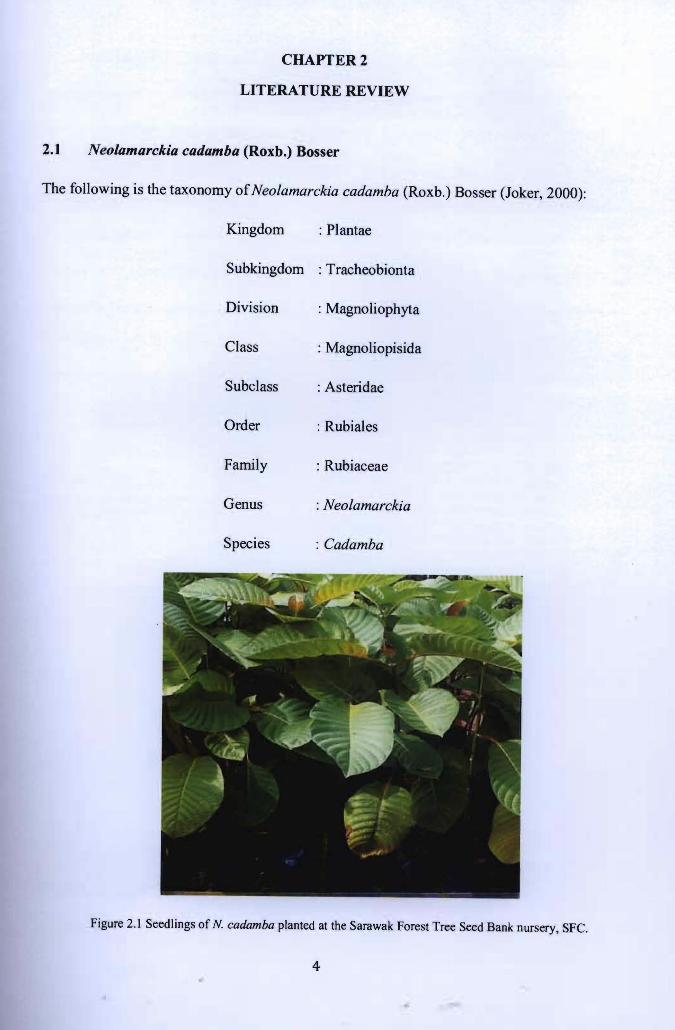
2.1 Neolamarckia cadamba (Roxb.) Bosser
The following is the taxonomy ofNeolamarckia cadamba (Roxb.) Bosser (Joker, 2000):
Kingdom : Plantae
Subkingdom : Tracheobionta
Division : Magnoliophyta
Class : Magnoliopisida
Subclass : Asteridae
Order : Rubiales
Family : Rubiaceae
Genus : Neolamarckia
Species : Cadamba
Figure 2.1 Seedlings of N. cadamba planted at the Sarawak Forest Tree Seed Bank nursery, SFC.
4
Pusat Khidmat MakJumat Akademik I ' , ' UNlVERSTIl MALAYSIA SAKAWA){
Neolamarckia cadamba (Roxb.) Bosser is a tropical rainforest timber species that
grows fast and denominates the initial re-growth stage of tropical secondary forest (Meijer,
1970). Ncadamba (Roxb.) Bosser is well distributed from Nepal, India through Thailand
and Indo-China to Malaysian Archipelago to Papua New Guinea. Joker (2000) also
reported that it has been successfully introduced to Africa and Central America.
Ncadamba (Roxb.) Bosser is commonly known as Kadam (India), Jabon (Jawa), Bangkal
(Philippines), Laran (Sabah) and Kelampayan (Sarawak) (Joker, 2000). This timber species
is a lightweight hardwood suitable for productions and manufactures of general utility
furniture, plywood, pulps for low- and medium- quality papers. It is suitable for
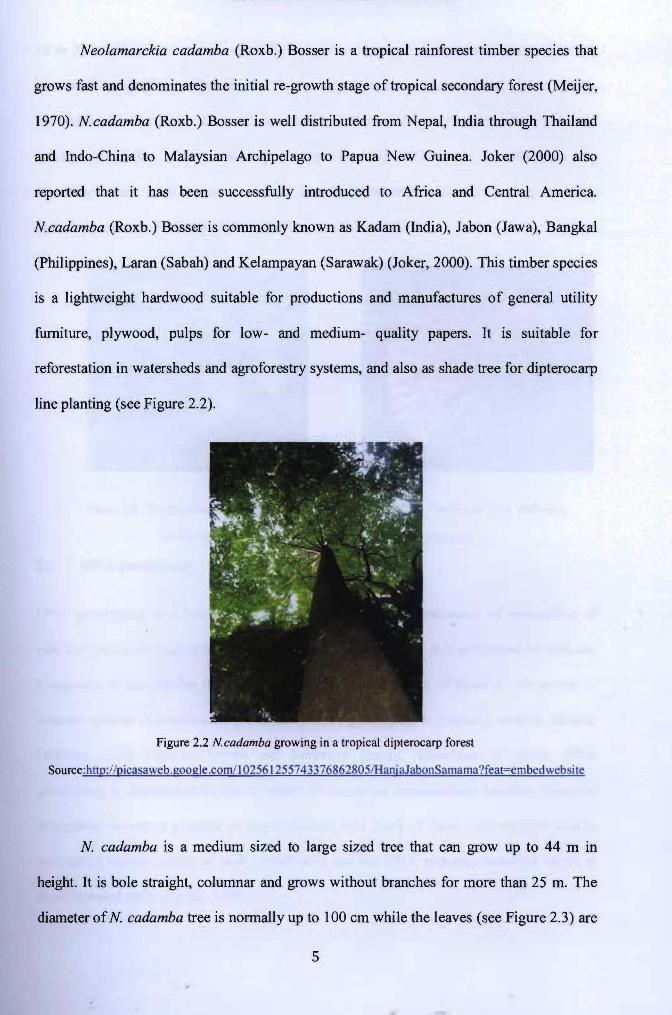
reforestation in watersheds and agroforestry systems, and also as shade tree for dipterocarp
line planting (see Figure 2.2).
Figure 2.2 Ncadamba growing in a tropical dipterocarp forest
Source:http://picasaweb.google.comJ I 025612557433 76862805IHanj alabonSamama?feat=embedwebsi Ie
N cadamba is a medium sized to large sized tree that can grow up to 44 m in
height. It is bole straight, columnar and grows without branches for more than 25 m. The
diameter of N cadamba tree is normally up to 100 cm while the leaves (see Figure 2.3) are
5
-- -....
I "
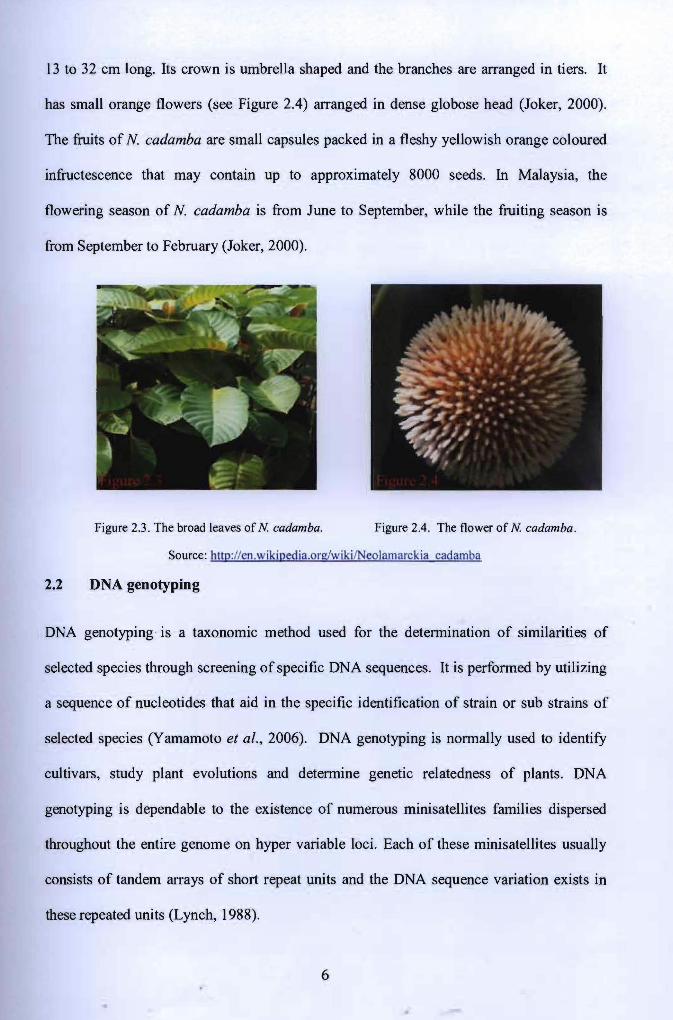
13 to 32 cm long. Its crown is umbrella shaped and the branches are arranged in tiers. It
has small orange flowers (see Figure 2.4) arranged in dense globose head (Joker, 2000).
The fruits of N. cadamba are small capsules packed in a fleshy yellowish orange coloured
infructescence that may contain up to approximately 8000 seeds. In Malaysia, the
flowering season of N. cadamba is from June to September, while the fruiting season is
from September to February (Joker, 2000).
Figure 2.3. The broad leaves of N cadamba. Figure 2.4. The flower of N cadamba .
Source: http://en.wikipedia.org/wikilNeolamarckia cadamba
2.2 DNA genotyping
DNA genotyping is a taxonomic method used for the determination of similarities of
selected species through screening of specific DNA sequences. It is performed by utilizing
a sequence of nucleotides that aid in the specific identification of strain or sub strains of
selected species (Yamamoto et at., 2006). DNA genotyping is normally used to identify
cultivars, study plant evolutions and determine genetic relatedness of plants. DNA
genotyping is dependable to the existence of numerous mini satellites families dispersed
throughout the entire genome on hyper variable loci. Each of these mini satellites usually
consists of tandem arrays of short repeat units and the DNA sequence variation exists in
these repeated units (Lynch, 1988).
6
" '"
2.3 ISSR markers and ISSR-PCR
Knowledge of genetic diversity within and among populations is basically important for
conservation management (Jian et al., 2004). Accurate estimates of genetic diversity are
therefore useful for optimizing sampling strategies for conserving and managing the
genetic diversity of trees (Hamrick and Godt, 1996).
To date, molecular markers have become common for measurement of diversity
within plant populations (Smith and Wayne, 1996; Lalhruaitluanga and Prasad, 2009).
DNA markers specifically characterize cultivars, provenances or genotypes and measure
their genetic relationships. The markers are well heritable, environmentally stable and
display adequate polymorphism to distinguish very closely related genotypes (Narayanan
et al. 2007). The evaluation of genetic diversity and construction of linkage maps has been
considered as desirable for the efficient use of genetic variations in the breeding
programme (Tanksley et al., 1989).
ISSR-PCR is a genotyping technique based on variation found in the regions
between microsatellites. It has been used in genetic fingerprinting (Blair et al., 1999), gene
tagging (Ammiraju et al., 2001), detection of clonal variation (Leroy and Leon, 2000),
cultivar identification (Wang et al., 2009), phylogenetic analysis (Gupta et al., 2008),
detection of genomic instability (Anderson et al., 2001), and assessment of hybridization in
many plant and animal species (Wolfe et al., 1998). The versatility of this genotyping
technique makes ISSR useful for researchers interested in diverse fields such as
conservation biology and cancer research.
ISSR markers are rapid and cost-effective and are broadly used for diversity
analysis, mapping and genotype identification of plant species, including forest trees (Karp
et al. 1998). ISSR analysis reported in the present work could be useful to select parents to
be crossed for generating appropriate populations intended for both genome mapping and
7
" f ' " " I
breeding purposes (Gupta et al., 2008). ISSR markers have been successfully used for
varietal identification and assessment of genetic relationships in many plant species
(Ajibade et al. 2000).
ISSR primers are able to amplify highly variable yet small segments, for example
regions between two microsatellites of the genome (McGregor et al. 2000) and possibly
make few loci available for amplification by ISSR primers (Zietkiewicz et al. 1994). ISSR
technique also uses longer primers enabling higher annealing temperatures that result in
greater reproducibility of the bands (Wolfe and Liston, 1998). In higher plants or animals,
ISSR markers are of higher demand, because they are recognized to be abundant, very
reproducible, highly polymorphic, highly infonnative and rapid in use (Zietkiewicz et al.,
1994, Bornet et al., 2002). ISSRs was proposed for genetic diversity by Lalhruaitluanga
and Prasad (2009) and commonly used in population genetics, taxonomy and phylogeny of
many plant species (Wolf and Randle, 2001). ISSR primers can also confinn specific
amplified DNA polymorphic fragments within varieties (Li and Ge, 2001).
ISSR fingerprinting is a method that combines most of the advantages of SSR and
AFLP to the universality of RAPD. The main limitations of RAPD, AFLP, and SSR
methods are low reproducibility ofRAPD and high cost of AFLP while flanking sequences
have to be known to develop species-specific primers for SSR polymorphism. ISSR
overcomes most of these limitations (Reddy et al., 2002). ISSR fingerprinting was
developed in a way that no sequence knowledge was required. Primers based on a repeat
sequence and the resultant peR reaction amplifies the sequence between two SSRs,
yielding a multi locus marker system useful for fingerprinting, diversity analysis and
genome mapping. ISSR would be a better tool than RAPD for phylogenetic studies
(Ajibade et al., 2000; Galvan et al., 2003). The main disadvantages of ISSR are the
dominant nature and lower multiplex ratio (Yilmaz et aI., 2009).
8
•
(j " " -I
ISSR analysis is more economical and reliable than that of RAPD. Earlier studies
also reported that ISSR technique generates large number of polymorphisms in chickpea
(Collard et al., 2003). Because of the high polymorphism, ISSR have also been employed
successfully in population genetic studies in many cultivated and wild plants (Huang and
Sun, 2000; Esselman et al., 1999). ISSR also have proven useful in evaluating genetic
diversity in the mangrove species Aegieeras eornieulatum and Ceriops tagal (Ge and Sun,
1999, 2001). In a study done by Jian et al. (2004), the detection of high levels of
polymorphism makes ISSR analysis a powerful tool for assessing genetic diversity in
Heritiera littoralis. None of the individuals was genetically identical based on the ISSRs,
indicating that the level of resolution in our study was sufficient to distinguish all
genotypes. In preliminary studies, Jian et al. (2004) examined the repeatability of bands by
both repeating the ISSR process in its entirety and running the same PCR product twice in
separate lanes across 20 samples. It proves that patterns of ISSR are highly reproducible.
The previous study by Narayanan (2007), they have reported the use of RAPD and ISSR
markers for assessment of genetic diversity and DNA polymorphism among 48 plus trees
of Teetona grandis (Teak) species. Results were useful for the efficient conservation of
these plus trees and their sustainable use as suitable diverse parents in breeding strategy or
as donors in clonal propagation of superior stock for teak improvement programmes.
Based on the research done by Phong et al. (2011), they reported that the total
number of polymorphic bands (59) and average number of polymorphic bands/primer
(2.19) detected by ISSR primers were much higher in Dalbergia assamiea. This method is
obviously advantageous in differentiating closely related cultivars and has been used for
cultivar identification in numerous plant species, including rice (Joshi et al., 2000), apple
(Goulao and Oliveira, 2001), mulberry (Zhao et al., 2006) and strawberry (Arnau et al.,
2003).
9
..
"'.,
CHAPTER 3
MATERIALS AND METHODS
3.1 Sampling of plant materials
A total of 150 healthy N cadamba seedlings from Matang OS, Lawas 24 and Lawas 29
were chosen from the nursery of SFC as the research materials for this project. Green
young leaf with good physical characteristics was taken from each of the chosen seedlings
and packed into sampling bags which were then sealed carefully, numbered and labelled
respectively based on their respective origins to avoid confusion. These leaves samples
were then taken to the laboratory and were cleaned and sealed in clearly labelled sampling
bags prior to storage at -20°C freezer until subjected to further use (DNA extraction). It is
important that the amount of air in the sampling bags is minimized to ensure that the
samples will last longer. It is also advised that the DNA extraction is carried out as soon as
possible to get better qualities of DNA.
3.2 DNA extraction
DNA extractions of the N cadamba samples were successfully carried out by using the
JasTip-X method described by Lai (2009). A sterile condition should be maintained on the
working bench to avoid possible contaminations of the samples. 70% ethanol was used to
establish the sterile condition and appropriate protective outfits was worn throughout the
process. Six leaf discs were punched from each leaf sample by using 10 ilL pipette tips to
ensure uniform sizes of leaf discs. The leaf discs were placed in microcentrifuge tubes
filled with 50,IlL extraction buffer. The samples were then be incubated at 95°C for 10
minutes. The tube were then be mixed intermittently by inverting and tapping of the tube.
120J,lL of dilution buffer were added prior to storage at -20°C freezer.
10
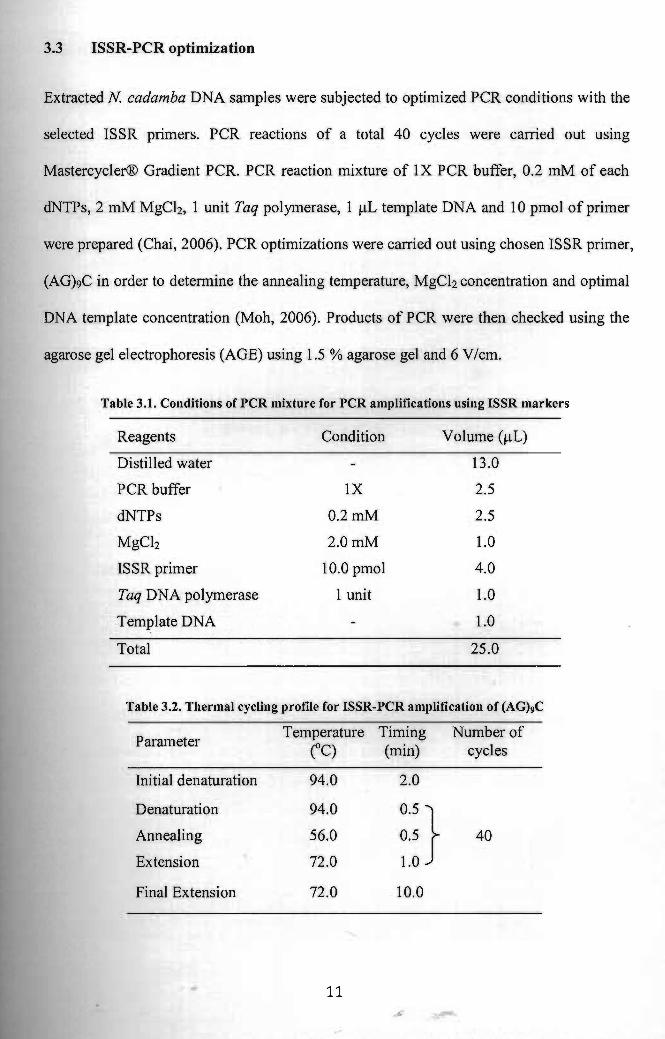
3.3 ISSR-PCR optimization
Extracted N. cadamba DNA samples were subjected to optimized PCR conditions with the
selected ISSR primers. PCR reactions of a total 40 cycles were carried out using
Mastercycler® Gradient PCR. PCR reaction mixture of IX PCR buffer, 0.2 mM of each
dNTPs, 2 mM MgCb, 1 unit Taq polymerase, 1 ilL template DNA and 10 pmol of primer
were prepared (Chai, 2006). PCR optimizations were carried out using chosen ISSR primer,
(AG)9C in order to determine the annealing temperature, MgCb concentration and optimal
DNA template concentration (Moh, 2006). Products of PCR were then checked using the
agarose gel electrophoresis (AGE) using 1.5 % agarose gel and 6 V/cm.
Table 3.1. Conditions of PCR mixture for PCR amplifications using ISSR markers
Reagents Condition Volume (ilL)
Distilled water
PCR buffer
dNTPs
MgCb
ISSR primer
Taq DNA polymerase
Template DNA
IX
0.2mM
2.0mM
10.0 pmol
1 unit
13.0
2.5
2.5
1.0
4.0
1.0
1.0
Total 25.0
Table 3.2. Thermal cycling profile for ISSR-PCR amplification of (AGhC
Temperature Timing Number ofParameter (OC) (min) cycles
Initial denaturation 94.0 2.0
Denaturation
Annealing
94.0
56.0 OoS} 0.5 40
Extension 72.0 1.0
Final Extension 72.0 10.0
11 ..
t •
3.4 AGE and peR products visualization
A total of 7 ilL of ISSR-PCR products were mixed with 2 ilL of IX loading dye (15%
Ficoll, 0.25% bromophenol blue, 0.25% xylene cayanol FF and 120 mM EDTA) and
loaded into the wells of 1.5% agarose gel that was prepared using the same buffer, the IX
TAE buffer, that was also used for electrophoresis. 2.5 ilL of 100 bp Invitrogen ladder was
mixed with 2 ilL of loading dye and loaded into the first well in the gel. AGE was run at 70
V for 2-3 hours. After electrophoresis, the gel was stained with EtBr for 5 seconds and de
stained in dH20 for 30 minutes. The staining and de-staining processes were done without
direct exposure to light. The gel was then visualized using the UV transilluminator and
documented using Geliance 200 Imaging System (PerkinElmer).
3.5 Data analysis
The products of ISSR-PCR were used for data scoring in the determination of genetic
relatedness among samplings (Chai, 2006). Firstly, amplified loci produced at in the range
of 200 bp to 1400 bp were determined and labelled with numbers, 1 or O. Number 1
indicates presence of the band while 0 indicates the absence of amplified loci. Sizes of
locus were estimated using the graph loglO marker fragment size versus migrated distance
of the band (Moh, 2006). The POPGENE v 1.32 software was used to calculate the indices
that quantify the amount of genetic diversity and genetic variation within and between the
populations examined.
12
· '. " H' I
The data were also quantified by using the NTSYS-pc software to estimate the
Jaccard's coefficient matrix (Jaccard, 1908), based on the formula given below to construct
the dendograms for all the populations by the unweighted pair group mean average
(UPGMA) (Sneath and Sokal, 1973).
Where,
Jij = Number of bands common to individuals "i" and "j"
Cij =Number of scored amplification products shared by two samples "i" and "j"
ni =Number of scored amplification products in sample "i"
nj = Number of scored amplification products in sample ''j''
13
CHAPTER 4
RESULTS AND DISCUSSION
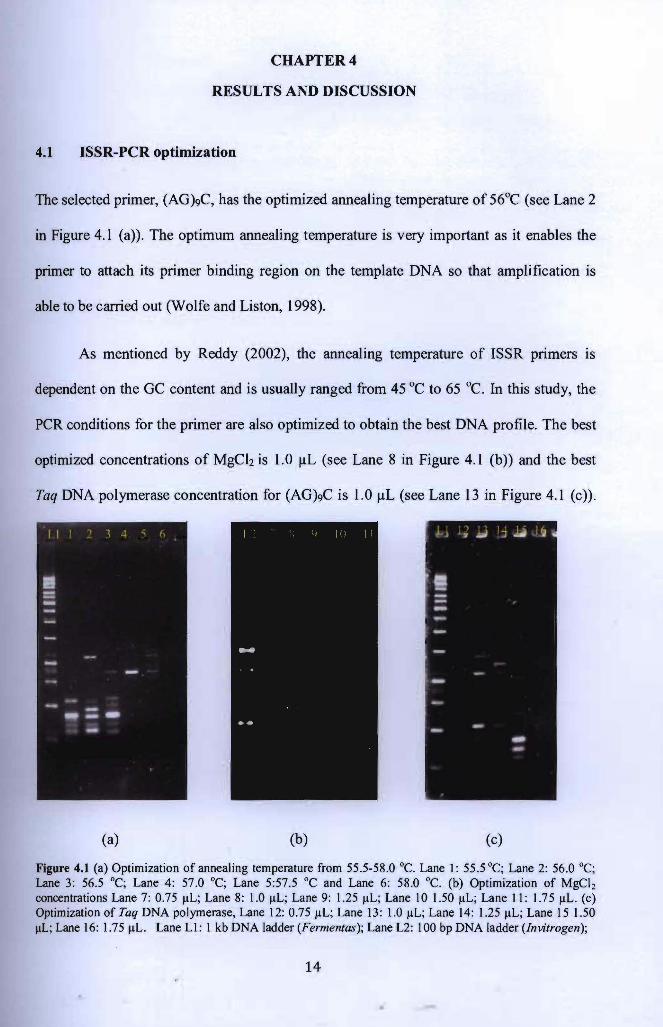
4.1 ISSR-PCR optimization
The selected primer, (AG)9C, has the optimized annealing temperature of 56°C (see Lane 2
in Figure 4.1 (a». The optimum annealing temperature is very important as it enables the
primer to attach its primer binding region on the template DNA so that amplification is
able to be carried out (Wolfe and Liston, 1998).
As mentioned by Reddy (2002), the annealing temperature of ISSR primers is
dependent on the GC content and is usually ranged from 45°C to 65 0c. In this study, the
PCR conditions for the primer are also optimized to obtain the best DNA profile. The best
optimized concentrations of MgCh is 1.0 ~L (see Lane 8 in Figure 4.1 (b» and the best
Taq DNA polymerase concentration for (AG)9C is 1.0 ~L (see Lane 13 in Figure 4.1 (c».
(a) (b) (c)
Figure 4.1 (a) Optimization of annealing temperature from 55.5-58.0 0c. Lane I: 55.5°C; Lane 2: 56.0 °C; Lane 3: 56.5 °C; Lane 4: 57.0 °C; Lane 5:57.5 °C and Lane 6: 58 .0 0c. (b) Optimization of MgCb concentrations Lane 7: 0.75 !LL; Lane 8: 1.0 !LL; Lane 9: 1.25 !LL; Lane 10 1.50 !LL; Lane II: 1.75 !LL. (c) Optimization of Taq DNA polymerase, Lane 12: 0.75 !LL; Lane 13: 1.0 !LL; Lane 14: 1.25 !LL; Lane 15 1.50 !LL; Lane 16: 1.75 !LL. Lane Ll: I kb DNA ladder (Fermentas); Lane L2: 100 bp DNA ladder (Invitrogen);
14
.' . ;
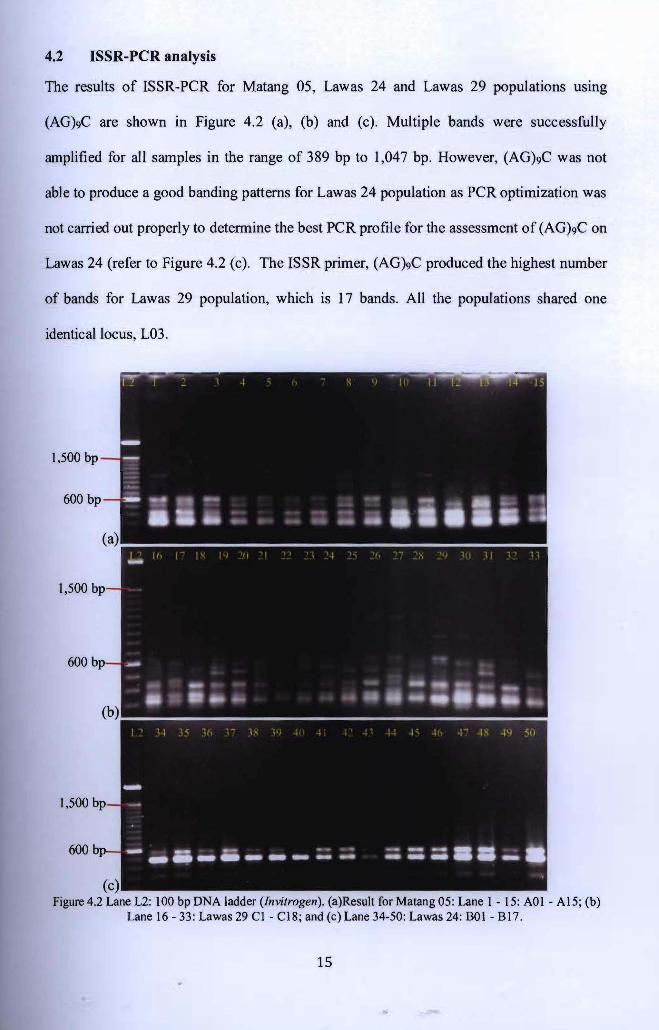
4.2 ISSR-PCR analysis
The results of ISSR-PCR for Matang 05, Lawas 24 and Lawas 29 populations usmg
(AG)9C are shown in Figure 4.2 (a), (b) and (c). Multiple bands were successfully
amplified for all samples in the range of 389 bp to 1,047 bp. However, (AG)9C was not
able to produce a good banding patterns for Lawas 24 population as PCR optimization was
not carried out properly to detennine the best PCR profile for the assessment of (AGhC on
Lawas 24 (refer to Figure 4.2 (c). The ISSR primer, (AG)9C produced the highest number
of bands for Lawas 29 popUlation, which is 17 bands. All the popUlations shared one
identical locus, L03.
600
1,500
600
( Figure 4.2 Lane L2: 100 bp DNA ladder (Invitrogen). (a)Result for Matang 05: Lane I - 15: AOI - A15; (b)
Lane 16 - 33: Lawas 29 Cl - CIS; and (c) Lane 34-50: Lawas 24: BOI - B17.
15
...
4.3 Data analysis
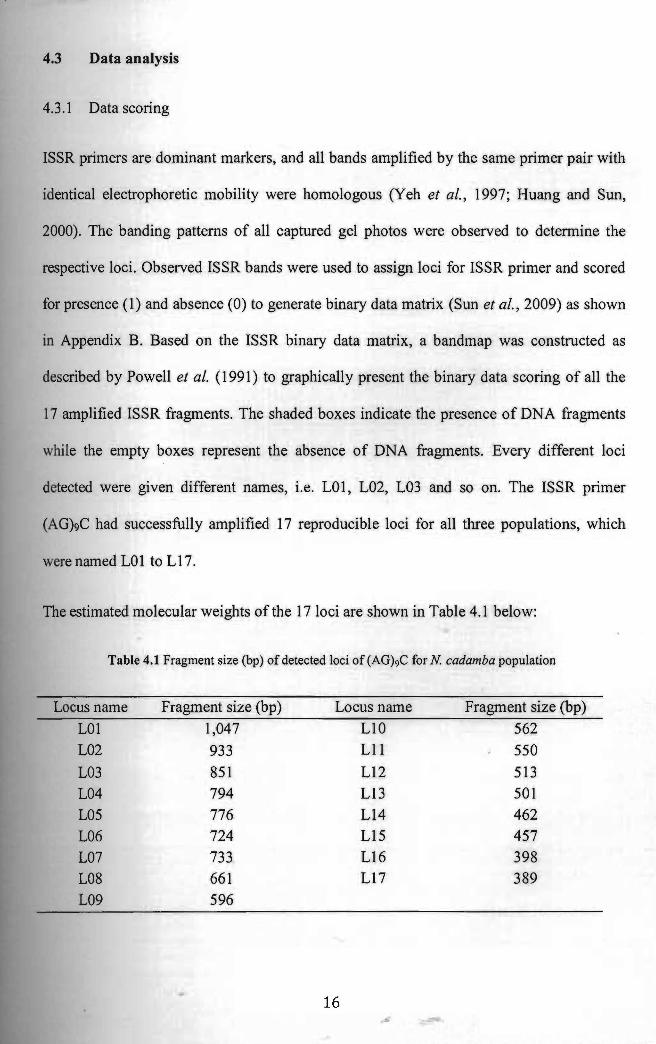
4.3.1 Data scoring
ISSR primers are dominant markers, and aU bands amplified by the same primer pair with
identical electrophoretic mobility were homologous (Yeh et al., 1997; Huang and Sun,
2000). The banding patterns of all captured gel photos were observed to determine the
respective loci. Observed ISSR bands were used to assign loci for ISSR primer and scored
for presence (1) and absence (0) to generate binary data matrix (Sun et al., 2009) as shown
in Appendix B. Based on the ISSR binary data matrix, a bandmap was constructed as
described by Powell et al. (1991) to graphically present the binary data scoring of all the
17 amplified ISSR fragments. The shaded boxes indicate the presence of DNA fragments
while the empty boxes represent the absence of DNA fragments. Every different loci
detected were given different names, i.e. L01, L02, L03 and so on. The ISSR primer
(AG)9C had successfully amplified 17 reproducible loci for all three populations, which
were named L01 to L17.
The estimated molecular weights of the 17 loci are shown in Table 4.1 below:
Table 4.1 Fragment size (bp) ofdetected loci of (AGhC for N cadamba population
Locus name Fragment size (bp) Locus name Fragment size (bp)
LOl 1,047 LlO 562
L02 933 L11 550
L03 851 L12 513 L04 794 L13 501 L05 776 L14 462
L06 724 L15 457
L07 733 L16 398
L08 661 L17 389 L09 596
16
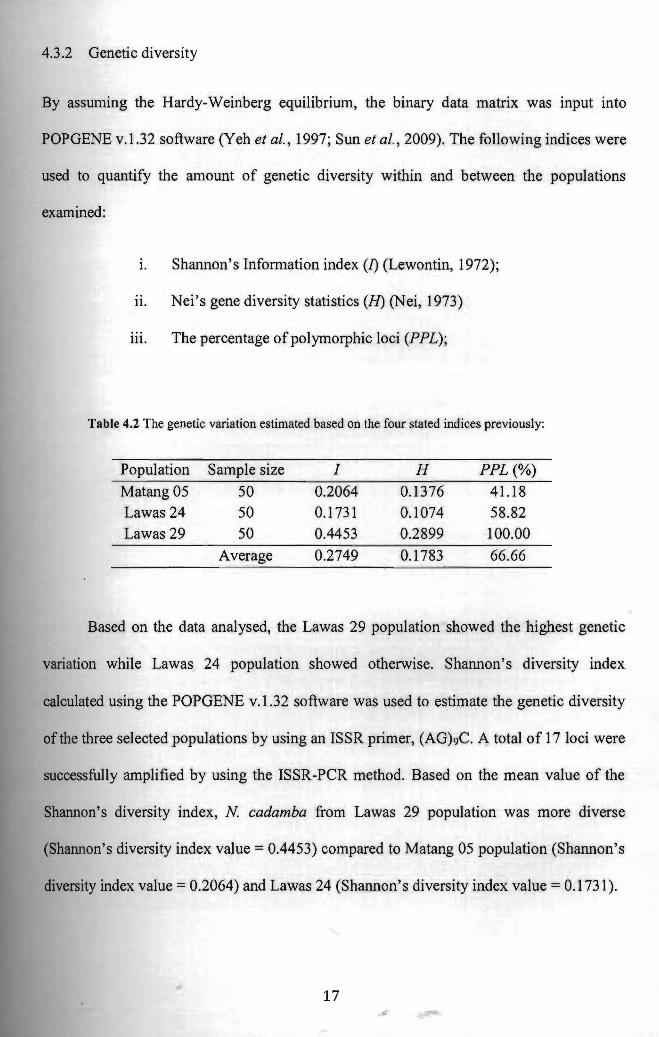
4.3.2 Genetic diversity
By assuming the Hardy-Weinberg equilibrium, the binary data matrix was input into
POPGENE v.1.32 software (Yeh et al., 1997; Sun et aI., 2009). The following indices were
used to quantify the amount of genetic diversity within and between the populations
examined:
i. Shannon's Information index (I) (Lewontin, 1972);
11. Nei's gene diversity statistics (H) (Nei, 1973)
111. The percentage of polymorphic loci (PPL);
Table 4.2 The genetic variation estimated based on the four stated indices previously:
Population Sample size I H PPL (%)
Matang 05 50 0.2064 0.1376 41.18 Lawas 24 50 0.1731 0.1074 58.82 Lawas 29 50 0.4453 0.2899 100.00
Average 0.2749 0.1783 66.66
Based on the data analysed, the Lawas 29 population showed the highest genetic
variation while Lawas 24 population showed otherwise. Shannon's diversity index
calculated using the POPGENE v.1.32 software was used to estimate the genetic diversity
of the three selected populations by using an ISSR primer, (AGhC. A total of 17 loci were
successfully amplified by using the ISSR-PCR method. Based on the mean value of the
Shannon's diversity index, N cadamba from Lawas 29 population was more diverse
(Shannon'S diversity index value = 0.4453) compared to Matang 05 population (Shannon'S
diversity index value = 0.2064) and Lawas 24 (Shannon's diversity index value = 0.1731).
17