Embed Size (px)
Citation preview
Degradation in Chromosomal DNA Assessed using PCR Amplification and Capillary Electrophoresis.
Final Report, August 2012
Robert W. Allen, PhD
Department of Forensic Sciences
Oklahoma State University, Center for Health Sciences
Tulsa, Oklahoma
1
Overall Objective
The overall objective of the proposal is to establish parameters that will enable the Q-TAT assay
to reliably identify DNA samples that are sufficiently degraded to require specialized testing
methods to produce a DNA profile.
Specific goals of the project are to:
1) Identify suitable conditions for the random degradation of both nDNA and mtDNA in a controlled fashion using chemical, physical, and/or enzymatic means in an attempt to mimic DNA degraded by natural processes.
2) To identify a “threshold ratio” of fluorescence in low molecular weight Q-TAT amplicons (i.e. HPRT and SRY) versus high molecular weight products (i.e. Amel-X and Amel-Y) that is diagnostic for an Analyst in assessing the extent of degradation of nuclear DNA recovered from a sample.
3) Apply the analysis criteria developed for the Q-TAT assay with idealized DNA samples produced in the laboratory to real world forensic samples provided as non-probative DNA samples from the Tulsa Police Laboratory.
Background
In a typical forensic DNA laboratory, evidentiary samples recovered from crime scenes are subjected to quantitation as one “quality indicator” capable of predicting whether or not an STR profile suitable for analysis is likely to be produced from the sample. However, in addition to quanity, the quality of DNA recovered from a sample (in terms of integrity) is important for the production of an STR profile, and an assay to assesses quality would be valuable to the forensic lab in distinguishing those samples likely to produce a probative profile versus those sufficiently degraded to be unlikely to produce a probative profile. Those unlikely to produce an STR profile with the typical STR kit (Identifiler or PP16) could be eliminated from further consideration by the lab, or be amplified with a specialized STR typing kit like Minifiler that is tailored for degraded samples. An assay that assists an Analyst in choosing only the best samples in a case to move forward to STR typing could contribute to the overall efficiency of the laboratory.
Once DNA has been extracted from a sample, accreditation standards mandate that the amount of human DNA be quantified (3). Quantitation methods in widespread use in forensic laboratories include qPCR using commercially available kits (Applied Biosystems, Inc. Foster City, CA, Promega Corp., Madison, WI), qPCR using primers directed against the Alu repeats in genomic DNA (4,5), and post-amplification quantitation of fluorescence in different PCR amplicons (6,7). While all of these technologies provide accurate estimates of the human nuclear DNA (nDNA) concentration in extracts, none also provide an estimate of the recovery of mitochondrial DNA (mtDNA) in the extract, an important consideration should mtDNA sequencing been needed. Moreover, none of the assays provides any significant information to the laboratory regarding integrity of the DNA recovered from the sample. Although
2
chromosomal DNA is fairly resilient to degradation, the molecule does degrade, and, when degraded, will produce an STR profile whose completeness will be proportional to the extent of template degradation. The DNA can be sufficiently degraded such that little to no STR profile will be produced with standard STR typing kits. For such DNA templates, the use of mini-STR typing kits may be the only way in which probative DNA testing results will be obtained.
A typical processing approach taken in forensic DNA labs is to subject extracted DNA to a “priority list” of DNA typing approaches, beginning with a standard STR typing multiplex (such as Identifiler or Powerplex 16). If probative results are obtained, no further work may be required. However, for a difficult sample (i.e. inadequate amount of DNA, limited male DNA in a sexual assault, or inhibited or degraded DNA), other testing lower down the list may be required. Thus, the approach is often to perform testing in a stepwise fashion which delays completing the processing of a case and compromises the efficiency of the testing process. If an assay existed that provided information regarding both the quantity and quality of the DNA recovered from a sample, an STR testing approach could be selected in advance with the knowledge that probative results would be produced. Moreover, if the assay not only provided this information for nDNA but for mtDNA as well, a complete picture of the subsequent testing plan would emerge and save time and resources for the laboratory charged with the DNA testing.
Methodologies
The Q-TAT method has been described previously (6,7). Briefly, the method represents a multiplex PCR reaction incorporating primers targeting the Amelogenin locus with products of 210 bp and 216 bp (8), the SRY locus (9,10) with a product of 113 bp, the HPRT locus (11) with a product of 99 bp, and a 200 bp portion a luciferase gene from the Sea Pansy (Renilla rentiformis) that is cloned in a plasmid and added to PCR reactions to detect the presence of PCR inhibitors present in a DNA extract (Promega Corp. Madison, WI).
Quantitation of nDNA in an unknown is accomplished by comparing fluorescence (RFU) in Amelogenin-X and –Y amplicons (Amel-X and Amel-Y respectively)in an unknown with RFU in these amplicons amplified from known amounts of nDNA isolated from a blood sample and quantified by multiple methods. To determine the amount of male DNA in a mixed sample, RFU contained within the SRY amplicon from an unknown is compared with SRY fluorescence in the amplicon from the standard curve prepared from known amounts of male DNA (7).
To assess the ability of the Q-TAT assay to detect DNA template degradation in a diagnostic way (in terms of the resulting STR profile that will be produced), intact genomic DNA extracted from freshly collected blood was subjected to degradation catalyzed by DNase I and also by heating at 95oC. Initial experiments with DNase I, although corroborating results produced by heating, suggested that the enzymatic treatment was incapable of degrading the genomic DNA as extensively as heating. Therefore, heating DNA at 95oC in a thermal cycler for varying periods of time became the experimental model for the study.
3

Results
PCR primers for nDNA targets (Amelogenin, SRY, and HPRT) have been published (6,7)(Table 1). To enhance the Q-TAT assay to include quantitation/possible characterization of mtDNA, two additional primer sets (labeled with the fluorescent dye NED) were developed (Table 1) to promote the amplification of targets in mtDNA in the D-loop vicinity close to the origin of replication for the mitochondrial genome. Experiments early during the course of this project demonstrated that the mtDNA primers promoting the amplification of the mt287 product were suitable for quantifying mtDNA in a sample (Figure 1). Thus, the Q-TAT assay is capable of simultaneously quantifying both nDNA and mtDNA in a sample.
Table 1. Primer sequences and amplicon characteristics for the Q-TAT multiplex assay.
Primer Name Primer Sequence PCR Product Size
AMEL forward 5’ – ACC TCA TCC TGG GCA CCC TGG – 3’ AMEL-X: 210 bp
AMEL-Y: 216 bpAMEL reverse (FAM) 5’ – AGG CTT GAG GCC AAC CAT CAG – 3’
SRY forward 5’ – ACG AAA GCC ACA CAC TCA AGA AT – 3’ SRY: 110 bp
SRY reverse (FAM) 5’ – CTA CAG CTT TGT CCA GTG GC – 3’
HPRT forward 5’ – TTA GTG AAA CTG GAA AAG CAA – 3’ HPRT: 99 bp
HPRT reverse (FAM) 5’ – TGA TAA TTT TAC TGG CGA TGT –3’
pRL forward 5’ – AAG GTG GTA AAC CTG ACG TTG – 3’ pRL: 200 bp
pRL reverse (FAM) 5’ – TTC ATC AGG TGC ATC TTC TTG – 3’
mt97 forward 5’ – AGC TCT CCA TGC ATT TGG –3’ mt97: 97 bp
mt97 reverse (NED) 5’ – AGA CAG ATA CTG CGA CAT A – 3’
mt287 forward 5’ – CAC CAT GAA TAT TGT ACG GT –3’ mt287: 287 bp
mt287 reverse (NED) 5’ – CAA GGG ACC CCT ATC TGA –3’
Amplification of known amounts of genomic DNA extracted from blood produced standard curves shown in Figure 1.
4
0 200 400 600 800 1000 12000
10000
20000
30000
40000
50000
60000
70000
80000
90000
100000
R² = 0.993499175997356
R² = 0.969572048792882
R² = 0.923818280584711mt97 [0.075 uM]Linear (mt97 [0.075 uM])mt287 [0.125 uM]Linear (mt287 [0.125 uM])nDNALinear (nDNA)
Input DNA [pg]
RFU
Figure 1. Standard curves produced from known amounts of input male DNA. The RFU values shown represent total area under the different amplicon peaks in the electropherograms which were averaged (total of 10 curves included). Fluorescence in mt97 and mt287 are shown as individual products whereas the line labeled nDNA consists of the sum of fluorescence in Amel-X + Amel-y.
It should also be noted that for quantitation of nDNA, the SRY amplicon or the HPRT amplicon can also be used to quantify nDNA in a sample (7). This is important in samples that are degraded where the higher molecular weight products may not reflect the concentration of DNA present, and in cases of mixed samples where one might want to quantify a small amount of male DNA in the presence of an excess of female DNA. Prior work of Wilson et.al. (7) has shown that the SRY amplicon produced in the Q-TAT assay can accurately quantify male DNA in a 100 fold excess of female DNA. Work recently completed by Laurie Ariola in the lab (16) has further demonstrated that the HPRT amplicon is also suitable for quantitation of nDNA in a sample using an amplicon produced from the X chromosome.
The dynamic range of the assay is from 32.25 pg to 1000 pg for nDNA but extends to lower quantities for the mtDNA template. Note also that, because of the molar excess of mtDNA versus nDNA in a typical cell, the standard curve clearly begins to plateau at 400-500 pg of input nDNA. Of the two amplicons, the mt287 amplicon shows better linearity at higher DNA levels and therefore is the principal amplicon used for quantitation. It is also important to note that mtDNA concentration has to be provided by the assay in terms of “cell equivalents” rather than by weight since a pure sample of human mtDNA was not available with which to produce the standard curve. Assauming 500 copies of mtDNA in each cell, the amount of fluorescence in the
5

mt287 product from an unknown would be placed on the mt287 standard curve. The nDNA quantity on the X axis corresponding to that point would be divided by 6 (pg) to ascertain the number of nDNA cell equivalents which would then be multiplied by 500 to estimate the number of cell equivalents of mtDNA in the sample. For the assay to be useful for a mtDNA typing laboratory, the lab would simply need to know how many cell equivalents of mtDNA are needed to produce a quality nucleotide sequence. Thus, in a single PCR assay, the amount of nDNA (and the amount of male DNA in a male:female mixture) and the cell equivalents of mtDNA could be determined.
One of the specific aims of this proposal was to evaluate the ability of the Q-TAT assay to detect DNA degradation; an ability that would be especially valuable for a forensic laboratory since often evidentiary samples are exposed to conditions that accelerate the decomposition of DNA contained within a sample. The experimental approach taken in these studies was to perform Q-TAT analyses on genomic DNA degraded in a systematic and controlled way, and in a way that mimicked the random degradation that occurs in nature. We chose to expose intact genomic DNA, extracted from a freshly procured blood sample and suspended in ultrapure water, to heating at 95oC in a thermal cycler for varying lengths of time (12, Byron Smith, Tulsa Police Laboratory, in preparation). Five micrograms of genomic DNA were suspended in 25 ul of water and subjected to heating. At 10 minute intervals to 90 minutes total, samples were removed from the heat and quickly chilled by adding 175 ul of ice cold TE-4 to the sample which was then placed on ice. After all samples had been heated, 1 ul of each was diluted a further 5 fold with TE-4 and 1 ul was amplified in the Q-TAT assay.
The rationale for the assay’s ability to detect degradation stems from the differently size PCR products produced. High molecular weight amplicons (such as Amel-X and –Y and mt287) would require a longer genomic DNA template to produce an amplicon than would the templates for shorter amplicons such as SRY, HPRT, and mt97. In completely intact genomic DNA, all amplicons should be present in electropherograms and the ratio of fluorescence in small versus large amplicons should ideally be about 1.0. However, if the genomic template is degraded, one would expect the large amplicons to be more quickly affected than small products and thus the ratio of fluorescence in small versus large products should increase. Moreover, if the ratio of Q-TAT amplicon fluorescence is correlated to the amplification of other loci, the ratio of Q-TAT products could be diagnostic for the ability to amplify the STR loci targeted in the different multiplex kits in widespread use in forensic labs. The ratio of fluorescence in small versus large mitochondrial amplicons could also predict whether or not HVI and HVII sequencing templates could be produced in a single PCR reaction, or, if multiple primer sets would be needed to amplify the mtDNA products subjected to DNA sequencing.
Shown in figure 2 below is an agarose gel containing a portion of each initially intact DNA sample subjected to heating at 95oC.
6
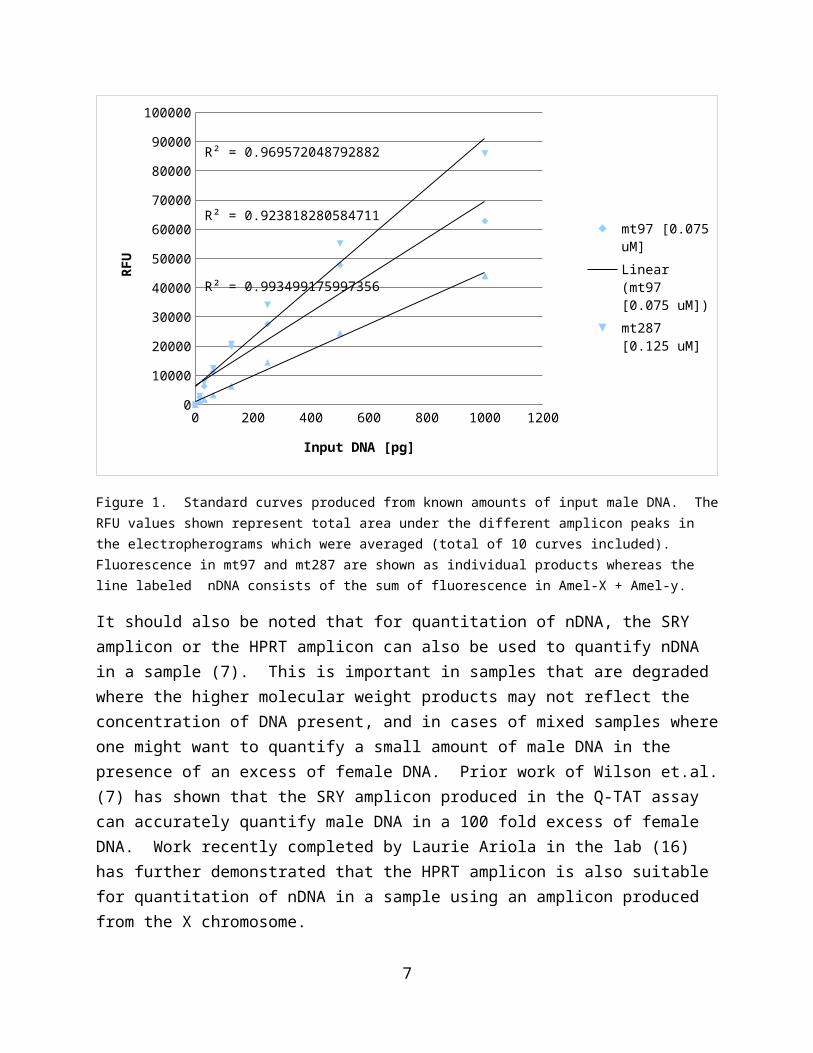
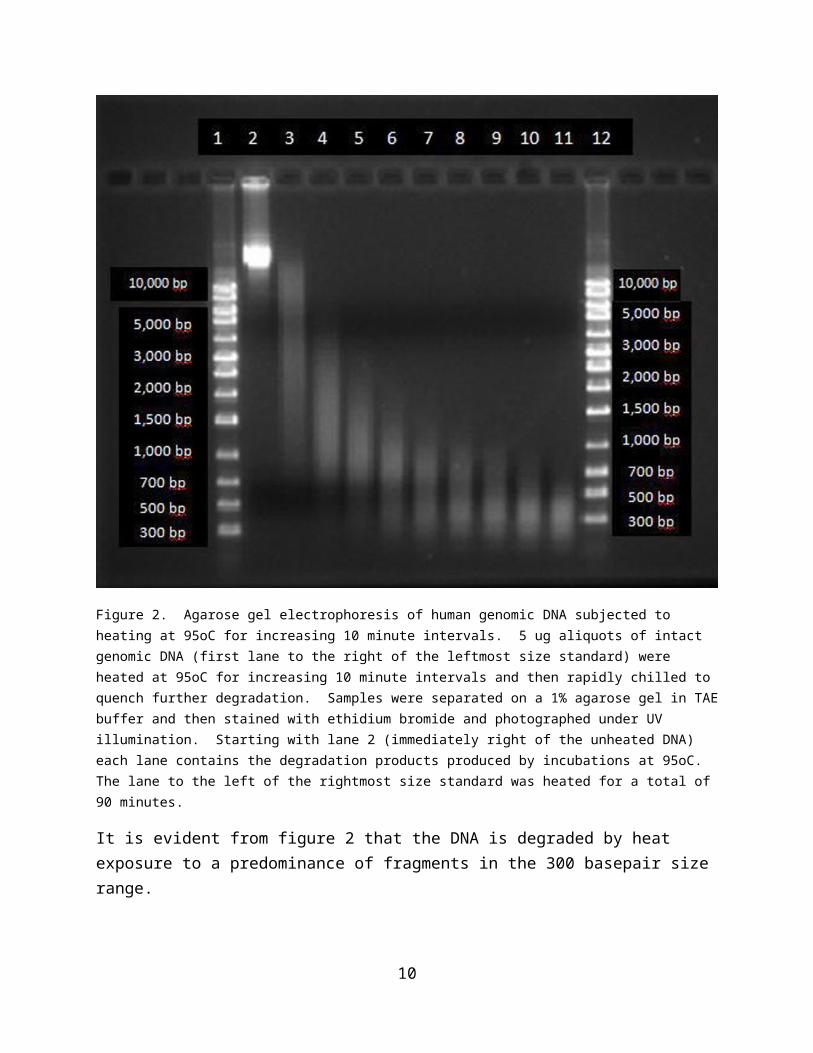
Figure 2. Agarose gel electrophoresis of human genomic DNA subjected to heating at 95oC for increasing 10 minute intervals. 5 ug aliquots of intact genomic DNA (first lane to the right of the leftmost size standard) were heated at 95oC for increasing 10 minute intervals and then rapidly chilled to quench further degradation. Samples were separated on a 1% agarose gel in TAE buffer and then stained with ethidium bromide and photographed under UV illumination. Starting with lane 2 (immediately right of the unheated DNA) each lane contains the degradation products produced by incubations at 95oC. The lane to the left of the rightmost size standard was heated for a total of 90 minutes.
It is evident from figure 2 that the DNA is degraded by heat exposure to a predominance of fragments in the 300 basepair size range.
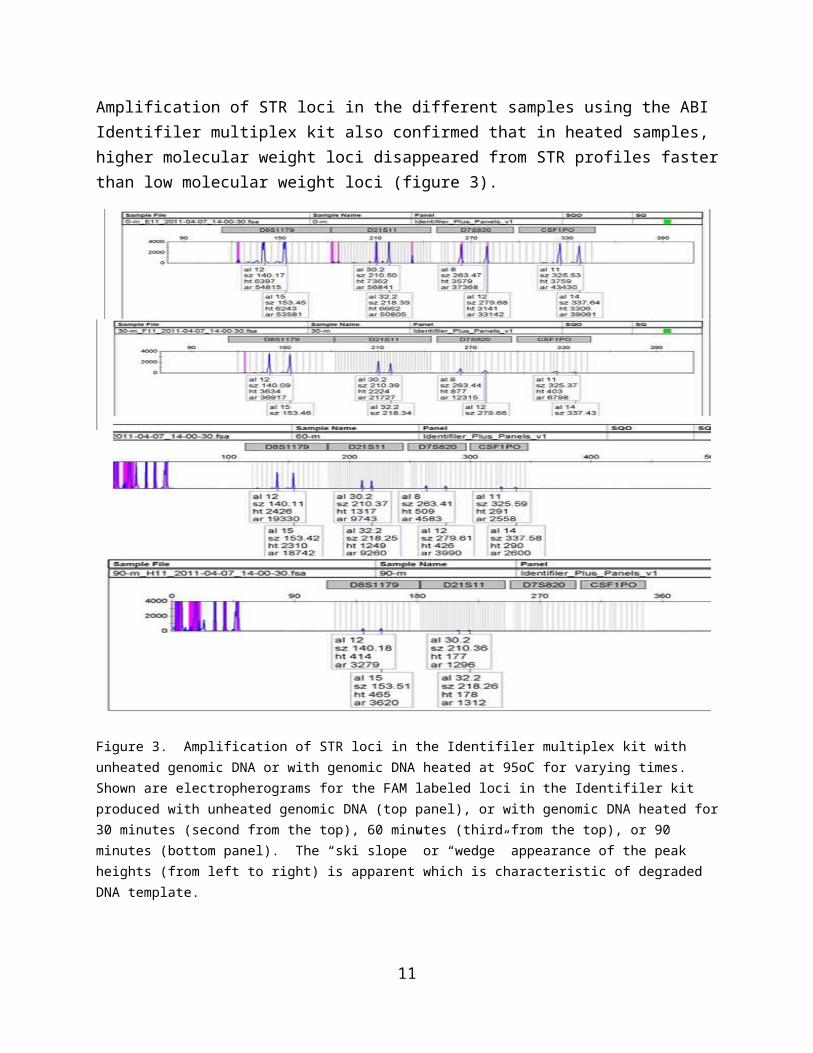
Amplification of STR loci in the different samples using the ABI Identifiler multiplex kit also confirmed that in heated samples, higher molecular weight loci disappeared from STR profiles faster than low molecular weight loci (figure 3).
7

Figure 3. Amplification of STR loci in the Identifiler multiplex kit with unheated genomic DNA or with genomic DNA heated at 95oC for varying times. Shown are electropherograms for the FAM labeled loci in the Identifiler kit produced with unheated genomic DNA (top panel), or with genomic DNA heated for 30 minutes (second from the top), 60 minutes (third from the top), or 90 minutes (bottom panel). The “ski slope” or “wedge” appearance of the peak heights (from left to right) is apparent which is characteristic of degraded DNA template.
In figure 4, the loss of fluorescence in the Amel-X + Amel-Y amplicons as well as in alleles from the D8S1179 and CSF1P0 loci are plotted.
8
0 10 20 30 40 50 60 70 80 90 1000
50001000015000200002500030000
Loss of Amelogenin amplicons with heating @ 95oC
Minutes at 95oC
RFU
(Tot
al a
rea)
0 10 20 30 40 50 60 70 80 90 1000
2000
4000
6000
8000
10000
12000
14000
D8S1179
CSF1P0
Time spent at 95oC
RFU
(sum
of p
eak
heig
hts)
Figure 4. Loss of fluorescence due to heating in Amelogenin (top panel) and D8S1179 and CSF1P0 alleles (bottom panel).
It is clear from figure 4 that the large STR alleles from the CSF1P0 locus are affected by the heat induced degradation of genomic DNA more rapidly that are STR alleles from the smaller D8S1179 locus. After 90 minutes of heating at 95oC, CSF1P0 allele peak heights fall below the analytical threshold and thus cannot be incorporated into a forensic analysis.
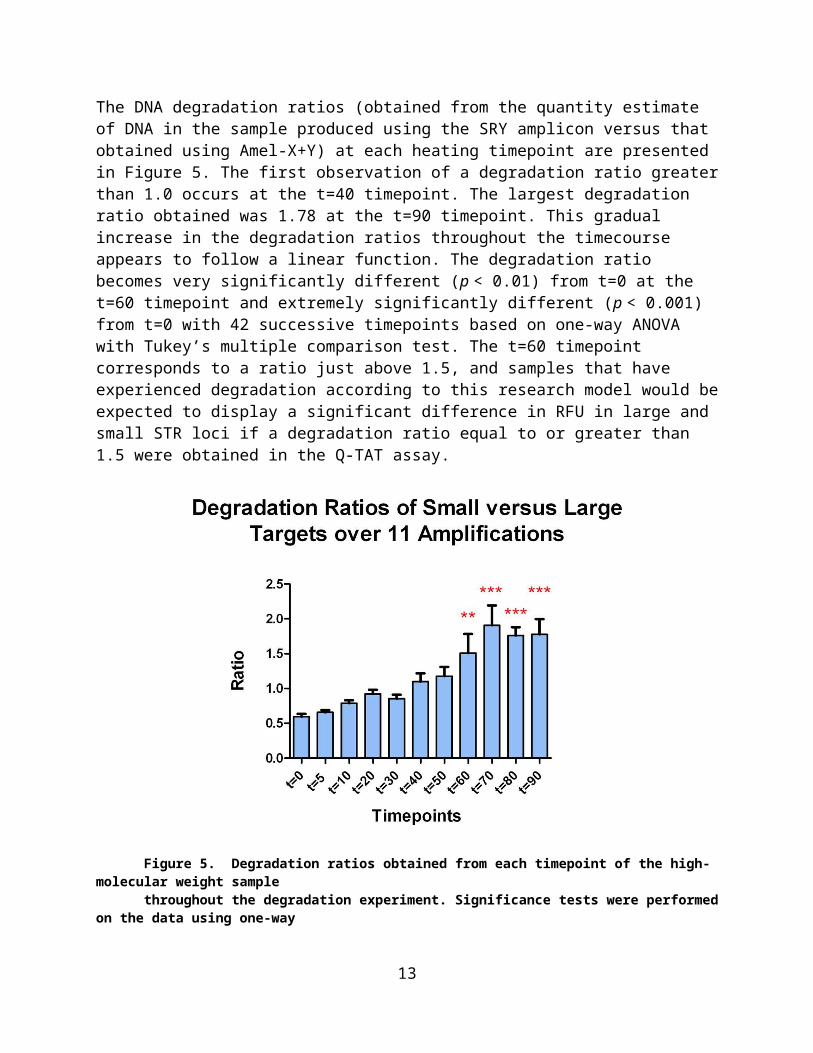
The DNA degradation ratios (obtained from the quantity estimate of DNA in the sample produced using the SRY amplicon versus that obtained using Amel-X+Y) at each heating timepoint are presented in Figure 5. The first observation of a degradation ratio greater than 1.0 occurs at the t=40 timepoint. The largest degradation ratio obtained was 1.78 at the t=90 timepoint. This gradual increase in the degradation ratios throughout the timecourse appears to follow a linear function. The degradation ratio becomes very significantly different (p < 0.01) from t=0 at the t=60 timepoint and extremely significantly different (p < 0.001) from t=0 with 42 successive timepoints based on one-way ANOVA with Tukey’s multiple comparison test. The t=60 timepoint corresponds to a ratio just above 1.5, and samples that have experienced
9
degradation according to this research model would be expected to display a significant difference in RFU in large and small STR loci if a degradation ratio equal to or greater than1.5 were obtained in the Q-TAT assay.
Figure 5. Degradation ratios obtained from each timepoint of the high-molecular weight samplethroughout the degradation experiment. Significance tests were performed on the data using one-wayANOVA with Tukey’s multiple comparison test. Notice that at the t=60 timepoint the ratios becomevery significant (p < 0.01), and successive timepoints indicate extreme significance (p < 0.001) in thedegradation ratios.
We also examined the effect of heating on the ability to produce the HVI and II mtDNA templates normally subjected to nucleotide sequencing in forensic labs (figure 6). The HVI and II amplicons amplified from genomic DNA were ~400 bp in length and could be amplified from the single primer pairs reported by ref et.al. (13).
10
0 10 20 30 40 50 60 70 80 90 1000
20000
40000
60000
80000
100000
120000
140000
160000
Degradation of HVI and HVII template
HVI RFUHVII RFU
Heating time (minutes)
RFU
(tot
al a
rea)
Figure 6. Amplification of HVI and HVII from unheated genomic DNA, or DNA exposed to 95oC for varying times. Aliquots of the genomic DNA heated for increasing 10 minute intervals were used as template for the amplification of HVI and HVII as described by Chong et.al. (13). Fluorescence in HVI and HVII amplicons was plotted as a function of time at 95oC.
As was stated above, the overall goal of the experiments with heated DNA was to evaluate a potential relationship between the ratio of fluorescence in small versus large Q-TAT amplification products and the amplification of STR alleles and/or mtDNA sequencing templates. Figure 7 summarizes the change in the ratio of small versus large Q-TAT templates for nuclear male and female targets (SRY/Amel-Y and HP/Amel-X amplicons respectively) and for mtDNA targets (mt97/mt287).
0 10 20 30 40 50 60 70 80 90-0.5
0
0.5
1
1.5
Log LMW/HMW RFU
Log SRY/YLog HP/XLog 97/287
Time @ 95oC
Log
of ra
tio
Figure 7. Change in the ratio of small (LMW) versus large (HMW) Q-TAT amplicons in DNA subjected to heating at 95oC. Shown in the figure is the log10 of the ratio of fluorescence in amplicons produced from
11

small versus large targets on the X chromosome (HP/Amel-X), Y chromosome (SRY/Amel-Y) and mitochondrial chromosome (mt97/mt287).
Logarithms were produced from the actual ratios to simplify the presentation of the data. Note the similar slopes of the curves for HP/Amel-X and SRY/Amel-Y and the steeper slope for mt97/mt287 likely due to the difference in size of the large amplicon products (i.e. ~210 bp for Amelogenin versus 287 bp for mt287).
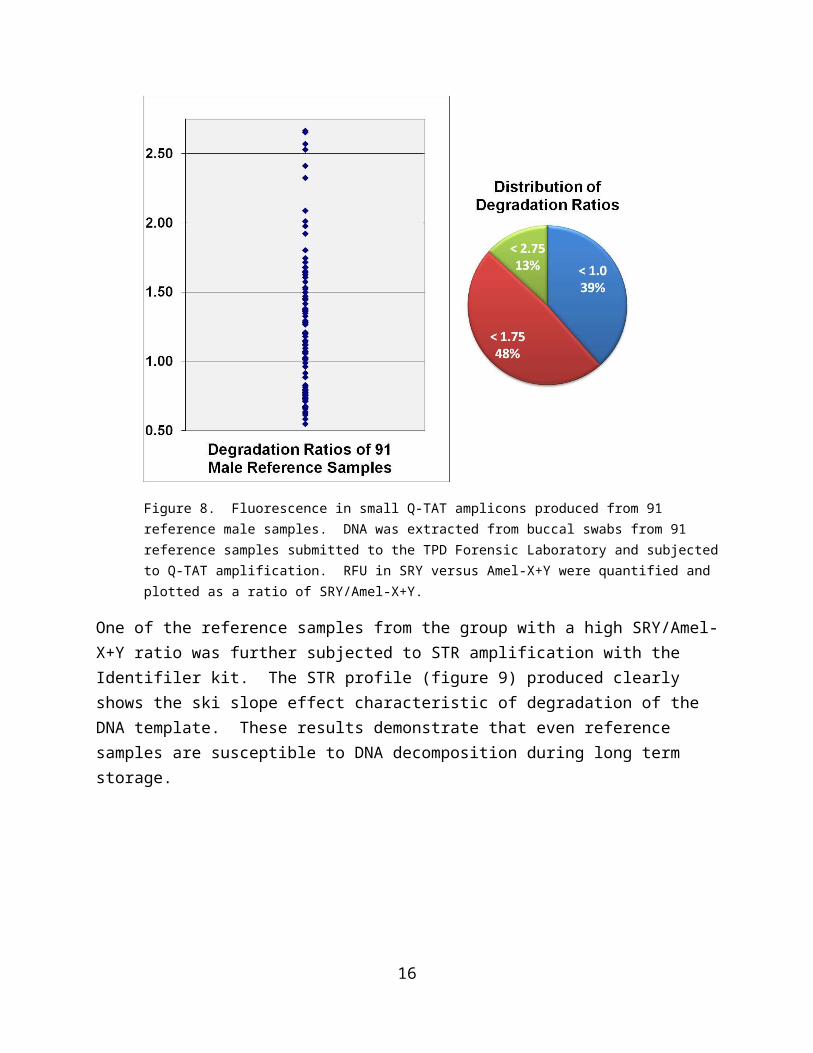
To assess the quality of DNA in reference samples (which are presumably collected and stored in a way to prevent decomposition), 91 male reference samples available in the Tulsa Police Laboratory were evaluated with the Q-TAT assay and the ratio of RFU in SRY to Amel-X+Y were plotted (Figure 8). Results show that about 87% of all samples have ratios of less than 1.75 which could serve as the threshold level for concluding that a DNA sample exhibits less than optimal integrity.
Figure 8. Fluorescence in small Q-TAT amplicons produced from 91 reference male samples. DNA was extracted from buccal swabs from 91 reference samples submitted to the TPD Forensic Laboratory and subjected to Q-TAT amplification. RFU in SRY versus Amel-X+Y were quantified and plotted as a ratio of SRY/Amel-X+Y.
One of the reference samples from the group with a high SRY/Amel-X+Y ratio was further subjected to STR amplification with the Identifiler kit. The STR profile (figure 9) produced clearly shows the ski slope effect characteristic of degradation of the DNA template. These
12
results demonstrate that even reference samples are susceptible to DNA decomposition during long term storage.
Figure 9. Identifiler® electropherogram from a male reference sample containing the uppermostdegradation ratio (2.67) with the assay in the 91-sample study.
Another way to look at the predictive value of the Q-TAT results in DNA template integrity is to correlate DNA quantity estimates produced using SRY or Amel-X+Y expressed as a ratio with ratios of fluorescence contained within low molecular weight versus high molecular weight STR alleles in an Identifiler profile produced from the same reference sample. Results for that correlation are shown in Figure 10.
13
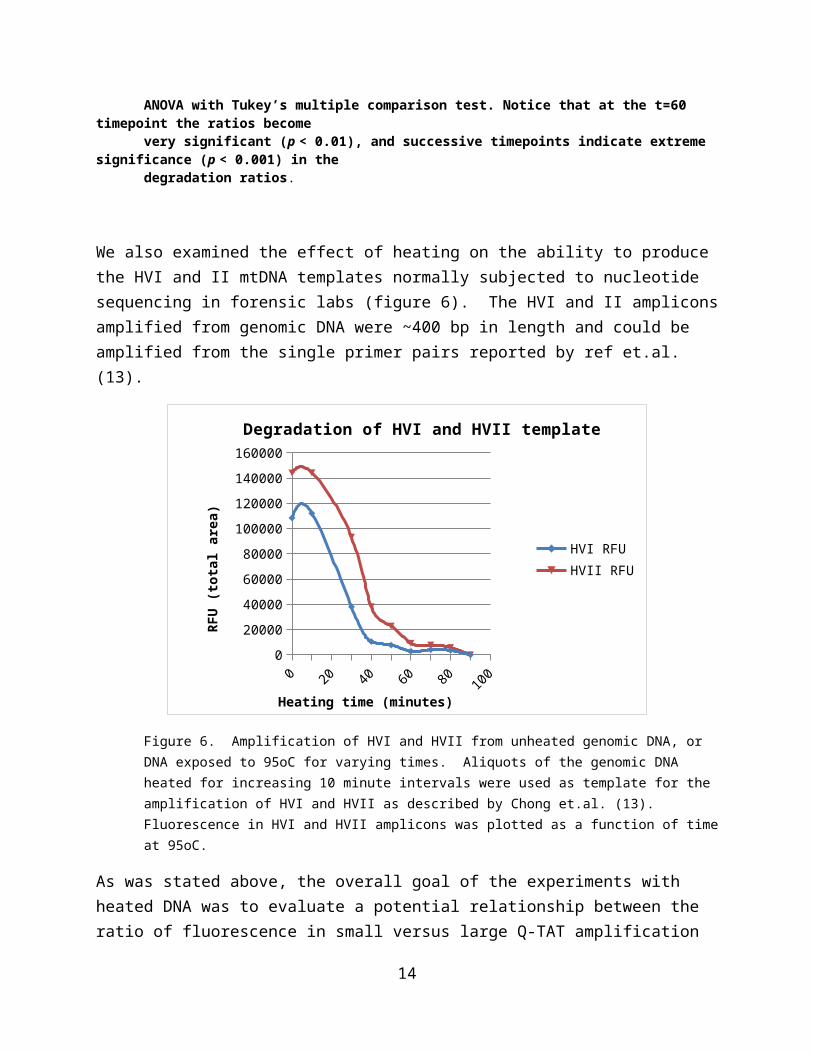
Figure 10. Statistical correlation between the Identifiler® HID ratios of the D3S1358 (small) versusthe D16S539 (large) loci and the ratios obtained from the quantitative assay in 37 casework malereference samples. Correlation was performed using one-way ANOVA with Tukey's multiplecomparison test. This analysis suggests a strong correlation (r 0.7478, p < 0.001) in the ability of thequantitative assay to predict the amplification performance of large targets in the Identifiler® HIDtyping kit. A decrease in large target performance is visually displayed as a “ski-slope” trend inelectropherogram data.
Among those samples with an SRY/Amel-X+Y ratio of less than about 2, the ratio of RFU in D3S1358 versus D16S539 alleles is comparable (as evidenced by the generally equivalent RFU ratios). As indicated in the legend to figure 10, the correlation was statistically significant. Therefore SRY/Amel-X+Y ratios are predictive of the STR results (at least for D3S1358 and S16S539) that will be produced with a given sample.
In summary, results produced from this project have demonstrated that the Q-TAT assay can be effective in allowing a DNA typing laboratory to both quantify and characterize DNA recovered from a biological sample. Advantages of the Q-TAT assay over other DNA quantitation methods (qPCR for example) include the fact that the assay requires the same instrumentation as will be required to produce an STR profile from the sample. Therefore no new instrumentation will be required for the lab. In addition, Q-TAT results are diagnostic relative to the integrity of both nuclear and mitochondrial DNA present in a sample. This information can be very valuable in deciding among the different STR kits and DNA typing technologies available in the laboratory. A nuclear template exhibiting degradation above a threshold of 2.5-3.0 can be expected to produce STR alleles from smaller loci only. Results produced with an STR kit like Minifiler (known to produce results from partially degraded DNA) might be more probative for investigating a case and the entire analytical process would be more efficient without wasting time amplifying the sample with a kit that would not produce a profile.
14

Similar benefits can be realized for a lab performing mtDNA analysis. Generally, such labs would like to amplify HVI and HVII in a single multiplex reaction to produce the templates that will be subjected to nucleotide sequencing. The Q-TAT assay (with the inclusion of the primers for mt97 and mt287 amplicons) will clearly detect degradation of mitochondrial DNA in the same way as nuclear DNA. The only complication associated with evaluating mtDNA is the need to establish the minimal number of cell equivalents of mtDNA needed to produce a complete mtDNA sequence since Q-TAT quantity estimates are in cell equivalents rather than in DNA weight.
It should be noted that the work reported here and supported by the MFRC is in preparation for publication in the Journal of Forensic Science.
References.
1. Protess B., Complex strands of DNA backlog. May 5, 2009 in Politico available at www.politico.com/news/stories/0509/22070.html.
2. Pinchin R., Eliminating DNA backlog. In: Forensic Magazine, August/September 2007, available at www.forensicmag.com/article/eliminating-dna-backlog?page=0.1
3. Standard 9.4, ASCLD Standards, American Society of Crime Laboratory Directors, Laboartory Accreditation Board. Published July 1, 2009.
4. Nicklas J.A. and Buel E. (2003) Development of an Alu-based realtime PCR method for quantitation of human DNA in forensic samples. J. For. Sci. 48:936-944.
5. Nicklas J.A. and Buel E. (2003) Development of an Alu-based, QSY 7-labeled primer PCR method for quantitation oof human DNA in forensic samples. J. For. Sci. 48:282-291.
6. Allen, R.W. and Fuller, V.M. (2006) Quantitation of human genomic DNA through amplification of the amelogenin locus. J. For. Sci. 51:76-81.
7. Wilson J., Fuller V., Benson G., Juroski D., Duvall E., Fuller V., Fu J., Pritchard J., and Allen R. (2010) Molecular assay for screening and quantitating DNA in biological evidence: The modified Q-TAT assay. Journal of Forensic Science, 55:1050-1057.
8. Sullivan, K.M., Mannucci, A., Kimpton, C.P. & Gill, P. (1993). A rapid and quantitative DNA sex test: Fluorescence-based PCR analysis of X-Y homologous gene amelogenin. BioTechniques, 15(4), 636-641.
9. McKeown, B., Strickley, J. & Riordan, A. (1999). Gender assignment by PCR of the
SRY gene: An improvement on Amelogenin. Progress In Forensic Genetics, 8, 433-435.
10. Su, H. & Lau, Y.C. (1993). Identification of the transcriptional unit, structural organization, and promoter sequence of the human sex-determining region Y (SRY) gene, using a reverse genetic approach. American Journal of Human Genetics, 52, 24-38.
11. Hypoxanthine phosphoribosyl transferase (HPRT), www.Wikipedia.org
15
12. Vandegrift E., Quantitation and characterization of human nuclear and mitochondrial DNA with PCR and capillary electrophoresis. Master’s thesis, Department of Forensic Sciences, Oklahoma State University, November 2010.
13. Chong, M., Calloway, C., Klein, S., Orrego, C., Buoncristiani, M. (2005). Optimization of a duplex amplification and sequencing strategy for the HVI/HVII regions of human mitochondrial DNA for forensic casework. Forensic Science International. 154(2). 137-148..
14. Butler J.M., Shen Y., and McCord B.R. (2003) The development of reduced size STR amplicons as tools for analysis of degraded DNA. J. For. Sci. 48:1054-1064.
15. Coble M.D., Hill C.R. Vallone P.M., and Butler J.M. (2006) Characterization and performance of new MiniSTR loci for typing degraded samples. In: International Congress Series 1288:504-506
16. Ariola, L (2012) Quantitation of DNA extracted from wax embedded biopsy specimens using two different methods. MSFS Thesis submitted to the faculty of OSU, July 2012.
16