Embed Size (px)
Citation preview
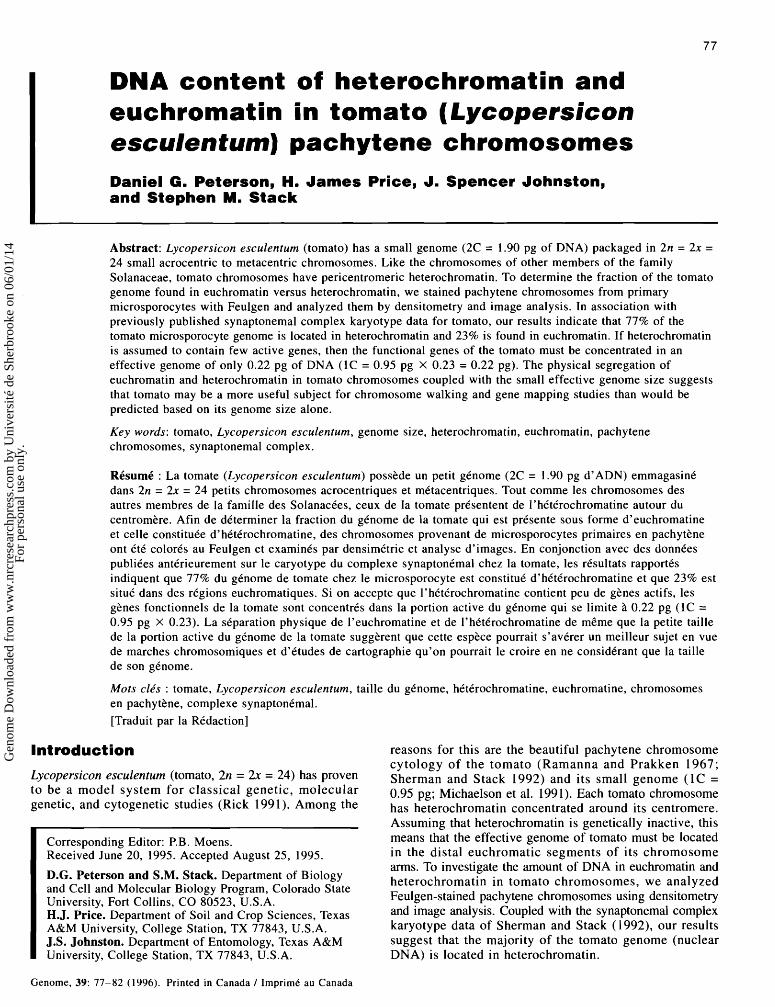
euchromatin in tomato (Lycopersicon esculentum) pachytene chromosomes Daniel G. Peterson, H. James Price, J. Spencer Johnston, and Stephen M. Stack
Abstract: Lycopersicon esculentum (tomato) has a small genome (2C = 1.90 pg of DNA) packaged in 2n = 2x = 24 small acrocentric to metacentric chromosomes. Like the chromosomes of other members of the family Solanaceae, tomato chromosomes have pericentromeric heterochromatin. To determine the fraction of the tomato genome found in euchromatin versus heterochromatin, we stained pachytene chromosomes from primary microsporocytes with Feulgen and analyzed them by densitometry and image analysis. In association with previously published synaptonemal complex karyotype data for tomato, our results indicate that 77% of the tomato microsporocyte genome is located in heterochromatin and 23% is found in euchromatin. If heterochromatin is assumed to contain few active genes, then the functional genes of the tomato must be concentrated in an effective genome of only 0.22 pg of DNA (IC = 0.95 pg X 0.23 = 0.22 pg). The physical segregation of euchromatin and heterochromatin in tomato chromosomes coupled with the small effective genome size suggests that tomato may be a more useful subject for chromosome walking and gene mapping studies than would be predicted based on its genome size alone.
Key words: tomato, Lycopersicon esculentum, genome size, heterochromatin, euchromatin, pachytene chromosomes, synaptonemal complex.
RCsumC : La tomate (Lycopersicon esculentum) posskde un petit genome (2C = 1.90 pg d'ADN) emmagasin6 dans 2n = 2x = 24 petits chromosomes acrocentriques et metacentriques. Tout comme les chromosomes des autres membres de la famille des SolanacCes, ceux de la tomate prCsentent de I'hCtCrochromatine autour du centromkre. Afin de determiner la fraction du gCnome de la tomate qui est prCsente sous forme d'euchromatine et celle constituCe d'hCtCrochromatine, des chromosomes provenant de microsporocytes primaires en pachytkne ont CtC colorCs au Feulgen et examines par densimktrie et analyse d'images. En conjonction avec des donnCes publiCes antkrieurement sur le caryotype du complexe synaptonCmal chez la tomate, les rCsultats rapportCs indiquent que 77% du genome de tomate chez le microsporocyte est constituC d'hCtCrochromatine et que 23% est situC dans des rCgions euchromatiques. Si on accepte que 1'hCtCrochromatine contient peu de gknes actifs, les gknes fonctionnels de la tomate sont concentrCs dans la portion active du gCnome qui se limite h 0.22 pg (IC = 0.95 pg X 0.23). La separation physique de l'euchromatine et de I'hCtCrochromatine de mCme que la petite taille de la portion active du gCnome de la tomate suggkrent que cette espkce pourrait s'avCrer un meilleur sujet en vue de marches chromosomiques et d'Ctudes de cartographie qu'on pourrait le croire en ne considerant que la taille de son gCnome.
Mots cle's : tomate, Lycopersicon esculentum, taille du gCnome, hCtCrochromatine, euchromatine, chromosomes en pachytkne, complexe synaptonCma1. [Traduit par la RCdaction]
Introduction reasons for this are the beautiful pachytene chromosome cytology of the tomato (Ramanna and Prakken 1967;
Lycopersicon esculentum (tomato, 2n = k = 24) has Proven Sherman and Stack 1992) and its small genome (1C = to be a mode1 system for genetic, 0.95 pg; Michaelson et al. 1991). Each tomato chromosome genetic, and cytogenetic studies (Rick 1991). the has heterochrornatin concentrated around its centromere.
Corresponding Editor: P.B. Moens. Received June 20, 1995. Accepted August 25, 1995.
D.G. Peterson and S.M. Stack. Department of Biology and Cell and Molecular Biology Program, Colorado State University, Fort Collins, CO 80523, U.S.A. H.J. Price. Department of Soil and Crop Sciences, Texas A&M University, College Station, TX 77843, U.S.A. J.S. Johnston. Department of Entomology, Texas A&M University, College Station, TX 77843, U.S.A.
Assuming that heterochromatin is genetically inactive, this means that the effective genome of tomato must be located in the distal euchromatic segments of its chromosome arms. To investigate the amount of DNA in euchromatin and heterochromatin in tomato chromosomes, we analyzed Feulgen-stained pachytene chromosomes using densitometry and image analysis. Coupled with the synaptonemal complex karyotype data of Sherman and Stack (1992), our results suggest that the majority of the tomato genome (nuclear DNA) is located in heterochrornatin.
Genome, 39: 77-82 (1996). Printed in Canada 1 ImprimC au Canada
Gen
ome
Dow
nloa
ded
from
ww
w.n
rcre
sear
chpr
ess.
com
by
Uni
vers
ité d
e Sh
erbr
ooke
on
06/0
1/14
For
pers
onal
use
onl
y.
Genome, Vol. 39, 1996
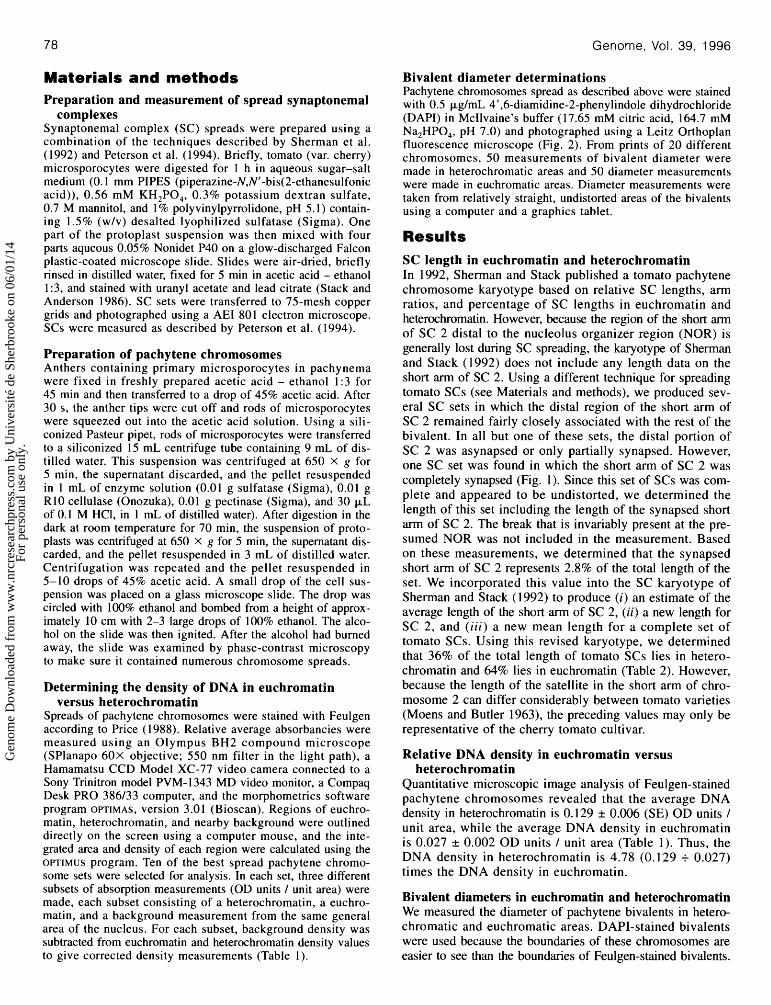
Materials and methods Preparation and measurement of spread synaptonemal
complexes Synaptonemal complex (SC) spreads were prepared using a combination of the techniques described by Sherman et al. (1992) and Peterson et al. (1994). Briefly, tomato (var. cherry) microsporocytes were digested for 1 h in aqueous sugar-salt medium (0.1 mm PIPES (piperazine-N,N'-bis(2-ethanesulfonic acid)), 0.56 mM KH2P04, 0.3% potassium dextran sulfate, 0.7 M mannitol, and 1% polyvinylpyrrolidone, pH 5.1) contain- ing 1.5% (wlv) desalted lyophilized sulfatase (Sigma). One part of the protoplast suspension was then mixed with four parts aqueous 0.05% Nonidet P40 on a glow-discharged Falcon plastic-coated microscope slide. Slides were air-dried, briefly rinsed in distilled water, fixed for 5 min in acetic acid - ethanol 1 :3, and stained with uranyl acetate and lead citrate (Stack and Anderson 1986). SC sets were transferred to 75-mesh copper grids and photographed using a AEI 801 electron microscope. SCs were measured as described by Peterson et al. (1994).
Preparation of pachytene chromosomes Anthers containing primary microsporocytes in pachynema were fixed in freshly prepared acetic acid - ethanol 1:3 for 45 min and then transferred to a drop of 45% acetic acid. After 30 s, the anther tips were cut off and rods of microsporocytes were squeezed out into the acetic acid solution. Using a sili- conized Pasteur pipet, rods of microsporocytes were transferred to a siliconized 15 mL centrifuge tube containing 9 mL of dis- tilled water. This suspension was centrifuged at 650 X g for 5 min, the supernatant discarded, and the pellet resuspended in 1 mL of enzyme solution (0.01 g sulfatase (Sigma), 0.01 g R10 cellulase (Onozuka), 0.01 g pectinase (Sigma), and 30 pL of 0.1 M HC1, in 1 rnL of distilled water). After digestion in the dark at room temperature for 70 min, the suspension of proto- plasts was centrifuged at 650 X g for 5 min, the supernatant dis- carded, and the pellet resuspended in 3 mL of distilled water. Centrifugation was repeated and the pellet resuspended in 5-10 drops of 45% acetic acid. A small drop of the cell sus- pension was placed on a glass microscope slide. The drop was circled with 100% ethanol and bombed from a height of approx- imately 10 cm with 2-3 large drops of 100% ethanol. The alco- hol on the slide was then ignited. After the alcohol had burned away, the slide was examined by phase-contrast microscopy to make sure it contained numerous chromosome spreads.
Determining the density of DNA in euchromatin versus heterochromatin
Spreads of pachytene chromosomes were stained with Feulgen according to Price (1988). Relative average absorbancies were measured using an Olympus BH2 compound microscope (SPlanapo 60X objective; 550 nm filter in the light path), a Hamamatsu CCD Model XC-77 video camera connected to a Sony Trinitron model PVM- 1343 MD video monitor, a Compaq Desk PRO 386133 computer, and the morphometrics software program OPTIMAS, version 3.01 (Bioscan). Regions of euchro- matin, heterochromatin, and nearby background were outlined directly on the screen using a computer mouse, and the inte- grated area and density of each region were calculated using the OPTIMUS program. Ten of the best spread pachytene chromo- some sets were selected for analysis. In each set, three different subsets of absorption measurements (OD units I unit area) were made, each subset consisting of a heterochrornatin, a euchro- matin, and a background measurement from the same general area of the nucleus. For each subset, background density was subtracted from euchromatin and heterochromatin density values to give corrected density measurements (Table 1).
Bivalent diameter determinations Pachytene chromosomes spread as described above were stained with 0.5 pg1mL 4',6-diamidine-2-phenylindole dihydrochloride (DAPI) in McIlvaine7s buffer (17.65 mM citric acid, 164.7 mM Na2HP04, pH 7.0) and photographed using a Leitz Orthoplan fluorescence microscope (Fig. 2). From prints of 20 different chromosomes, 50 measurements of bivalent diameter were made in heterochromatic areas and 50 diameter measurements were made in euchromatic areas. Diameter measurements were taken from relatively straight, undistorted areas of the bivalents using a computer and a graphics tablet.
SC length in euchromatin and heterochromatin In 1992, Sherman and Stack published a tomato pachytene chromosome karyotype based on relative SC lengths, arm ratios, and percentage of SC lengths in euchromatin and heterochromatin. However, because the region of the short arm of SC 2 distal to the nucleolus organizer region (NOR) is generally lost during SC spreading, the karyotype of Sherman and Stack (1992) does not include any length data on the short arm of SC 2. Using a different technique for spreading tomato SCs (see Materials and methods), we produced sev- eral SC sets in which the distal region of the short arm of SC 2 remained fairly closely associated with the rest of the bivalent. In all but one of these sets, the distal portion of SC 2 was asynapsed or only partially synapsed. However, one SC set was found in which the short arm of SC 2 was completely synapsed (Fig. 1). Since this set of SCs was com- plete and appeared to be undistorted, we determined the length of this set including the length of the synapsed short arm of SC 2. The break that is invariably present at the pre- sumed NOR was not included in the measurement. Based on these measurements, we determined that the synapsed short arm of SC 2 represents 2.8% of the total length of the set. We incorporated this value into the SC karyotype of Sherman and Stack (1992) to produce (i) an estimate of the average length of the short arm of SC 2, (ii) a new length for SC 2, and (iii) a new mean length for a complete set of tomato SCs. Using this revised karyotype, we determined that 36% of the total length of tomato SCs lies in hetero- chromatin and 64% lies in euchromatin (Table 2). However, because the length of the satellite in the short arm of chro- mosome 2 can differ considerably between tomato varieties (Moens and Butler 1963), the preceding values may only be representative of the cherry tomato cultivar.
Relative DNA density in euchromatin versus heterochromatin
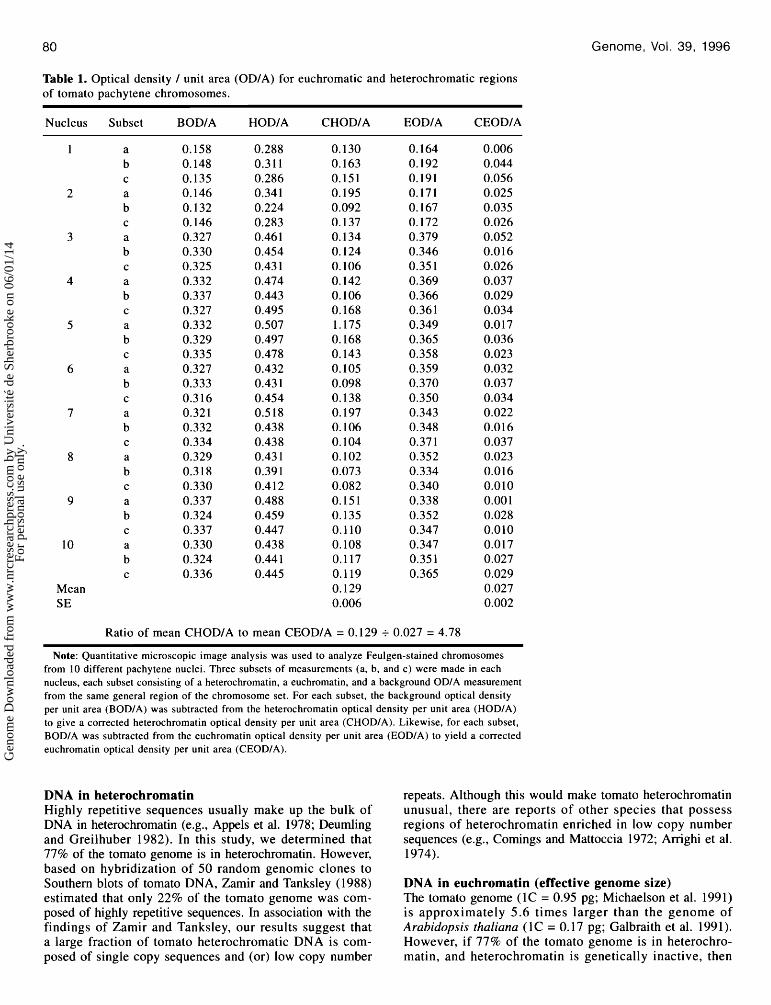
Quantitative microscopic image analysis of Feulgen-stained pachytene chromosomes revealed that the average DNA density in heterochromatin is 0.129 k 0.006 (SE) OD units I unit area, while the average DNA density in euchromatin is 0.027 0.002 OD units I unit area (Table 1). Thus, the DNA density in heterochromatin is 4.78 (0.129 + 0.027) times the DNA density in euchromatin.
Bivalent diameters in euchromatin and heterochromatin We measured the diameter of pachytene bivalents in hetero- chromatic and euchromatic areas. DAPI-stained bivalents were used because the boundaries of these chromosomes are easier to see than the boundaries of Feulgen-stained bivalents.
Gen
ome
Dow
nloa
ded
from
ww
w.n
rcre
sear
chpr
ess.
com
by
Uni
vers
ité d
e Sh
erbr
ooke
on
06/0
1/14
For
pers
onal
use
onl
y.
Peterson et al. 79
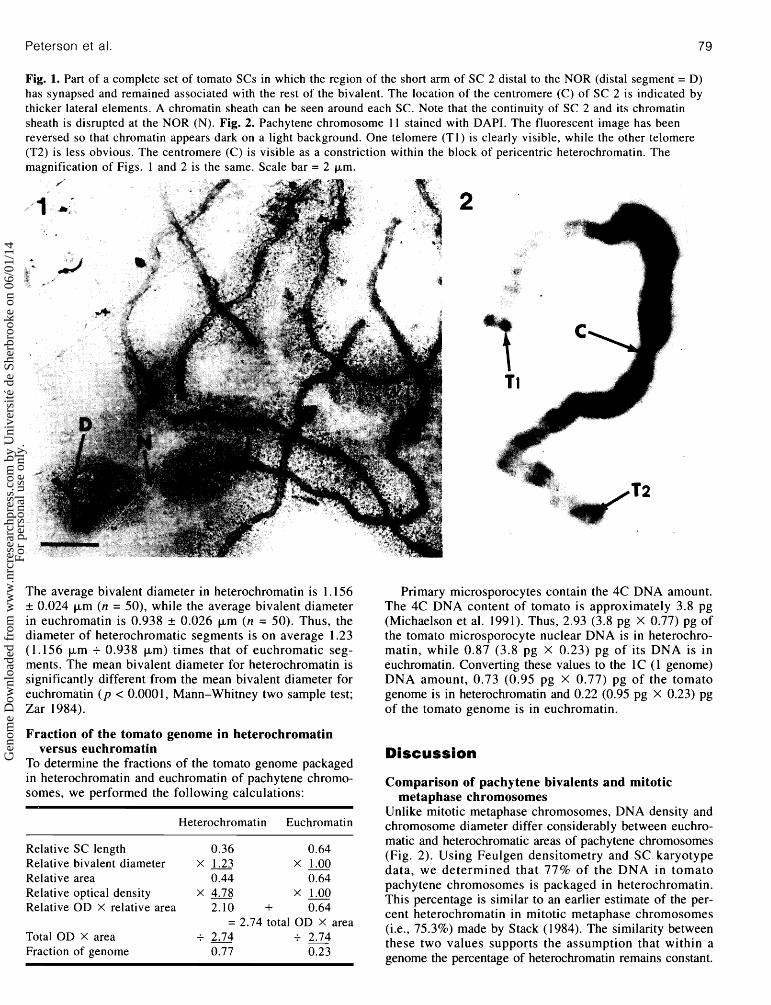
Fig. 1. Part of a complete set of tomato SCs in which the region of the short arm of SC 2 distal to the NOR (distal segment = D) has synapsed and remained associated with the rest of the bivalent. The location of the centromere (C) of SC 2 is indicated by thicker lateral elements. A chromatin sheath can be seen around each SC. Note that the continuity of SC 2 and its chromatin sheath is disrupted at the NOR (N). Fig. 2. Pachytene chromosome 11 stained with DAPI. The fluorescent image has been reversed so that chromatin appears dark on a light background. One telomere (Tl) is clearly visible, while the other telomere (T2) is less obvious. The centromere (C) is visible as a constriction within the block of pericentric heterochrornatin. The magnification of Figs. 1 and 2 is the same. Scale bar = 2 pm.
The average bivalent diameter in heterochrornatin is 1.156 k 0.024 p m (n = 50), while the average bivalent diameter in euchromatin is 0.938 k 0.026 p m (n = 50). Thus, the diameter of heterochromatic segments is on average 1.23 (1.156 p m + 0.938 pm) times that of euchromatic seg- ments. The mean bivalent diameter for heterochromatin is significantly different from the mean bivalent diameter for euchromatin (p < 0.0001, Mann-Whitney two sample test; Zar 1984).
Fraction of the tomato genome in heterochromatin versus euchromatin
To determine the fractions of the tomato genome packaged in heterochrornatin and euchromatin of pachytene chromo- somes, we performed the following calculations:
Heterochromatin Euchromatin
Relative SC length 0.36 0.64 Relative bivalent diameter X 1.23 X 1.00 Relative area 0.44 0.64 Relative optical density X 4.78 X 1.00 Relative OD X relative area 2.10 + 0.64
= 2.74 total OD X area Total OD X area + 2.74 + 2.74 Fraction of genome 0.77 0.23
Primary microsporoc ytes contain the 4C DNA amount. The 4C DNA content of tomato is approximately 3.8 pg (Michaelson et al. 1991). Thus, 2.93 (3.8 pg X 0.77) pg of the tomato microsporocyte nuclear DNA is in heterochro- matin, while 0.87 (3.8 pg X 0.23) pg of its DNA is in euchromatin. Converting these values to the 1C (1 genome) DNA amount, 0.73 (0.95 pg X 0.77) pg of the tomato genome is in heterochromatin and 0.22 (0.95 pg X 0.23) pg of the tomato genome is in euchromatin.
Discussion
Comparison of pachytene bivalents and mitotic metaphase chromosomes
Unlike mitotic metaphase chromosomes, DNA density and chromosome diameter differ considerably between euchro- matic and heterochromatic areas of pachytene chromosomes (Fig. 2). Using Feulgen densitometry and SC karyotype data, we determined that 77% of the DNA in tomato pachytene chromosomes is packaged in heterochrornatin. This percentage is similar to an earlier estimate of the per- cent heterochrornatin in mitotic metaphase chromosomes (i.e., 75.3%) made by Stack (1984). The similarity between these two values supports the assumption that within a genome the percentage of heterochrornatin remains constant.
Gen
ome
Dow
nloa
ded
from
ww
w.n
rcre
sear
chpr
ess.
com
by
Uni
vers
ité d
e Sh
erbr
ooke
on
06/0
1/14
For
pers
onal
use
onl
y.
Genome, Vol. 39, 1996
Table 1. Optical density I unit area (ODIA) for euchromatic and heterochromatic regions of tomato pachytene chromosomes.
Nucleus Subset BODIA HODIA CHODIA EODIA CEODIA
Mean SE
Ratio of mean CHODIA to mean CEODIA = 0.129 + 0.027 = 4.78
Note: Quantitative microscopic image analysis was used to analyze Feulgen-stained chromosomes from 10 different pachytene nuclei. Three subsets of measurements (a, b, and c) were made in each nucleus, each subset consisting of a heterochromatin, a euchromatin, and a background ODIA measurement from the same general region of the chromosome set. For each subset, the background optical density per unit area (BODIA) was subtracted from the heterochromatin optical density per unit area (HODIA) to give a corrected heterochromatin optical density per unit area (CHODIA). Likewise, for each subset, BODIA was subtracted from the euchromatin optical density per unit area (EODIA) to yield a corrected euchromatin optical density per unit area (CEODIA).
DNA in heterochromatin Highly repetitive sequences usually make up the bulk of DNA in heterochromatin (e.g., Appels et al. 1978; Deurnling and Greilhuber 1982). In this study, we determined that 77% of the tomato genome is in heterochromatin. However, based on hybridization of 50 random genomic clones to Southern blots of tomato DNA, Zamir and Tanksley (1988) estimated that only 22% of the tomato genome was com- posed of highly repetitive sequences. In association with the findings of Zamir and Tanksley, our results suggest that a large fraction of tomato heterochromatic DNA is com- posed of single copy sequences and (or) low copy number
repeats. Although this would make tomato heterochrornatin unusual, there are reports of other species that possess regions of heterochrornatin enriched in low copy number sequences (e.g., Comings and Mattoccia 1972; Arrighi et al. 1974).
DNA in euchromatin (effective genome size) The tomato genome (1C = 0.95 pg; Michaelson et al. 1991) is approximately 5.6 times larger than the genome of Arabidopsis thaliana (1C = 0.17 pg; Galbraith et al. 1991). However, if 77% of the tomato genome is in heterochro- matin, and heterochromatin is genetically inactive, then
Gen
ome
Dow
nloa
ded
from
ww
w.n
rcre
sear
chpr
ess.
com
by
Uni
vers
ité d
e Sh
erbr
ooke
on
06/0
1/14
For
pers
onal
use
onl
y.
Peterson et al
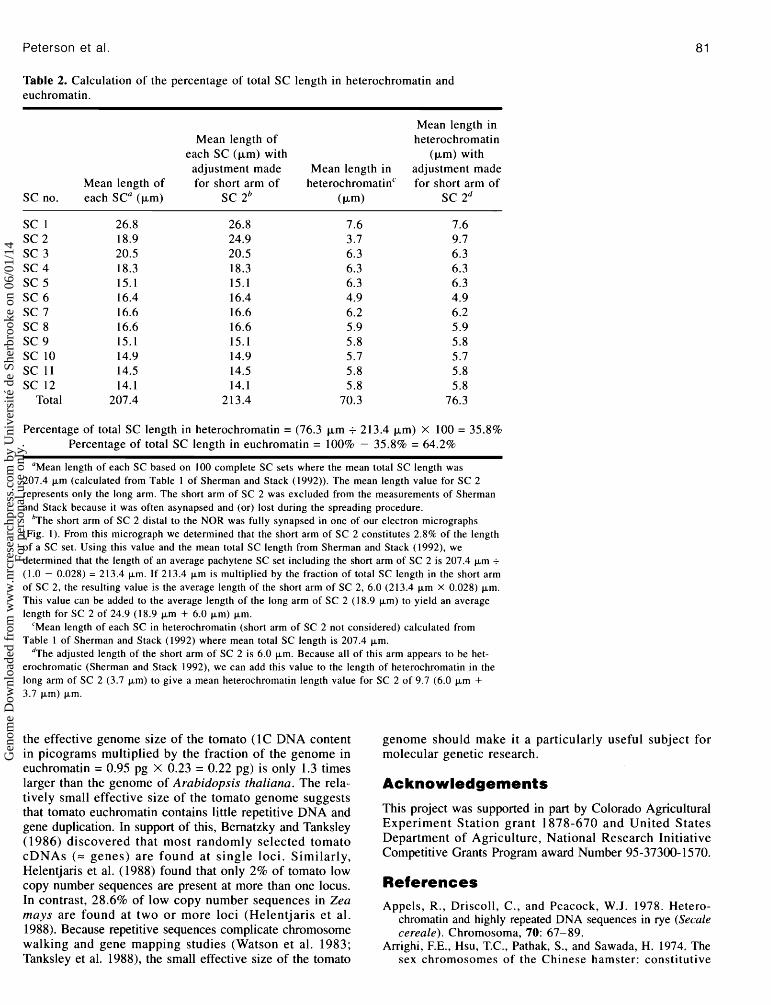
Table 2. Calculation of the percentage of total SC length in heterochrornatin and euchromatin.
Mean length in Mean length of heterochromatin
each SC (km) with (km) with adjustment made Mean length in adjustment made
Mean length of for short arm of heterochromatin'' for short arm of SCno. eachSCa(km) SC 2b (km) SC 2d
SC 1 SC 2 SC 3 SC 4 SC 5 SC 6 SC 7 SC 8 SC 9 SC 10 SC 11 SC 12
Total
Percentage of total SC length in heterochromatin = (76.3 km i 213.4 km) X 100 = 35.8% Percentage of total SC length in euchromatin = 100% - 35.8% = 64.2%
"Mean length of each SC based on 100 complete SC sets where the mean total SC length was 207.4 Fm (calculated from Table 1 of Sherman and Stack (1992)). The mean length value for SC 2 represents only the long arm. The short arm of SC 2 was excluded from the measurements of Sherman and Stack because it was often asynapsed and (or) lost during the spreading procedure.
b ~ h e short arm of SC 2 distal to the NOR was fully synapsed in one of our electron micrographs (Fig. 1). From this micrograph we determined that the short arm of SC 2 constitutes 2.8% of the length of a SC set. Using this value and the mean total SC length from Sherman and Stack (1992), we determined that the length of an average pachytene SC set including the short arm of SC 2 is 207.4 Fm + (1.0 - 0.028) = 213.4 Fm. If 213.4 Fm is multiplied by the fraction of total SC length in the short arm of SC 2, the resulting value is the average length of the short arm of SC 2, 6.0 (213.4 Fm X 0.028) Fm. This value can be added to the average length of the long arm of SC 2 (18.9 Fm) to yield an average length for SC 2 of 24.9 (18.9 Fm + 6.0 Fm) Fm.
'Mean length of each SC in heterochromatin (short arm of SC 2 not considered) calculated from Table 1 of Sherman and Stack (1992) where mean total SC length is 207.4 Fm.
d ~ h e adjusted length of the short arm of SC 2 is 6.0 Fm. Because all of this arm appears to be het- erochromatic (Sherman and Stack 1992), we can add this value to the length of heterochrornatin in the long arm of SC 2 (3.7 Fm) to give a mean heterochrornatin length value for SC 2 of 9.7 (6.0 Fm + 3.7 Fm) Fm.
the effective genome size of the tomato (1C DNA content genome should make it a particularly useful subject for in picograms multiplied by the fraction of the genome in molecular genetic research: euchromatin = 0.95 pg X 0.23 = 0.22 pg) is only 1.3 times larger than the genome of ~ r a b i d o ~ s i s ihaliana-. The rela- Acknowledgements tively small effective size of the tomato genome suggests that tomato euchromatin contains little repetitive DNA and This project was supported in part by Colorado Agricultural gene duplication. In support of this, Bernatzky and Tanksley grant 878-670 and United States (1986) discovered that most randomly selected tomato Department of Agriculture, National Research Initiative c ~ ~ ~ s (= genes) are found at single loci, similarly, Competitive Grants Program award Number 95-37300-1570. Helentjaris et al. (1988) found that only 2% of tomato low copy number sequences are present at more than one locus. References In 28.6% of low number sequences in Zea Appels, R., Driscoll, C., and Peacock, W.J. 1978. Hetero- mays are found at two or more loci (Helentjaris et al. chromatin and highly repeated DNA sequences in rye (Secale 1988). Because repetitive sequences complicate chromosome cereale). Chromosoma. 70: 67- 89. walking and gene mapping studies (Watson et al. 1983; Arrighi, F.E., Hsu, T.C., ~'athak, S., and Sawada, H. 1974. The Tanksley et al. 1988), the small effective size of the tomato sex chromosomes of the Chinese hamster: constitutive
Gen
ome
Dow
nloa
ded
from
ww
w.n
rcre
sear
chpr
ess.
com
by
Uni
vers
ité d
e Sh
erbr
ooke
on
06/0
1/14
For
pers
onal
use
onl
y.
Genome, Vol. 39, 1996
heterochromatin deficient in repetitive DNA sequences. Cytogenet. Cell Genet. 13: 268-274.
Bernatzky, R., and Tanksley, S.D. 1986. Majority of random cDNA clones correspond to single loci in the tomato genome. Mol. Gen. Genet. 203: 8-14.
Comings, D.E., and Mattoccia, E. 1972. DNA of mammalian and avian heterochromatin. Exp. Cell Res. 71: 1 1 3-1 3 1 .
Deumling, B., and Greilhuber, J. 1982. Characterization of heterochromatin in different species of the Scilla siberica group (Liliaceae) by in situ hybridization of satellite DNAs and fluorochrome banding. Chromosoma, 84: 535-555.
Galbraith, D.W., Harkins, K.R., and Knapp, S. 1991. Systemic endopolyploidy in Arabidopsis thaliana. Plant Physiol. 96: 985-989.
Helentjaris, T., Weber, D., and Wright, S. 1988. Identification of the genomic locations of duplicate nucleotide sequences in maize by analysis of restriction fragment length poly- morphism~. Genetics, 118: 353-363.
Michaelson, M.J., Price, H.J., Ellison, J.R., and Johnston, J.S. 1991. Comparison of plant DNA contents determined by Feulgen microspectrophotometry and laser flow cytometry. Am. J. Bot. 78: 183-188.
Moens, P., and Butler, L. 1963. The genetic location of the centromere of chromosome no. 2 in the tomato (Lycopersicon esculentum). Can. J. Genet. Cytol. 5: 364-370.
Peterson, D.G., Stack, S.M., Healy, J.L., Donohoe, B.S., and Anderson, L.K. 1994. The relationship between synaptonemal complex length and genome size in four vertebrate classes (Osteicthyes, Reptilia, Aves, Mammalia). Chromosome Res. 2: 153-162.
Price, H.J. 1988. DNA content variation among higher plants. Ann. Mo. Bot. Gard. 75: 1248-1257.
Ramanna, M.S., and Prakken, R. 1967. Structure and homology between pachytene and somatic metaphase chromosomes of the tomato. Genetica, 38: 1 15-1 33.
Rick, C.M. 1991. Tomato paste: a concentrated review of genetic highlights from the beginnings to the advent of molecular genetics. Genetics, 128: 1-5.
Sherman, J.D., and Stack, S.M. 1992. Two-dimensional spreads of synaptonemal complexes from solanaceous plants. V. Tomato (Lycopersicon esculentum) karyotype and idio- gram. Genome, 35: 354-359.
Sherman, J.D., Herickhoff, L.A., and Stack, S.M. 1992. Silver staining two types of meiotic nodules. Genome, 35: 907-915.
Stack, S.M. 1984. Heterochromatin, the synaptonemal complex and crossing over. J. Cell Sci. 71: 159-176.
Stack, S.M., and Anderson, L.K. 1986. Two-dimensional spreads of synaptonemal complexes from solanaceous plants. 11. Synapsis in Lycopersicon esculentum (tomato). Am. J. Bot. 73: 264-281.
Tanksley, S.D., Miller, J., Paterson, A., and Bernatzky, R. 1988. Molecular mapping of plant chromosomes. In Chromosome structure and function. Edited by J. Gustafson and R. Appels. Plenum Press, New York. pp. 157-172.
Watson, J.D., Tooze, J., and Kurtz, D.T. 1983. Recombinant DNA: a short course. W.H. Freeman and Co., New York.
Zamir, D., and Tanksley, S.D. 1988. Tomato genome is com- prised largely of fast evolving low copy number sequences. Mol. Gen. Genet. 213: 254-261.
Zar, J.H. 1984. Biostatistical analysis. 2nd ed. Prentice Hall, Englewood Cliffs, N.J.
Gen
ome
Dow
nloa
ded
from
ww
w.n
rcre
sear
chpr
ess.
com
by
Uni
vers
ité d
e Sh
erbr
ooke
on
06/0
1/14
For
pers
onal
use
onl
y.