Embed Size (px)
Citation preview
DMD #40212
1
Title Page
Title: Differences in the Disposition of Silymarin Between Patients with Non-Alcoholic Fatty Liver
Disease and Chronic Hepatitis C
Authors: Sarah J. Schrieber1, Roy L. Hawke, Zhiming Wen, Philip C. Smith, K. Rajender Reddy, Abdus
S. Wahed, Steven H. Belle, Nezam H. Afdhal, Victor J. Navarro, Catherine M. Meyers, Edward Doo,
and Michael. W. Fried for The SyNCH Trial Group
Affiliations: Division of Pharmacotherapy & Experimental Therapeutics (S.J.S., R.L.H.), and Division
of Molecular Pharmaceutics (Z.W., P.C.S.), UNC Eshelman School of Pharmacy, and Division of
Gastroenterology and Hepatology, School of Medicine (M.W.F.), University of North Carolina, Chapel
Hill, North Carolina; Division of Gastroenterology, University of Pennsylvania (K.R.R.); Department of
Biostatistics (A.S.W.), and Department of Epidemiology (S.H.B.), University of Pittsburgh; Liver
Center, Beth Israel Deaconess Medical Center (N.H.A.); Division of Gastroenterology and Hepatology,
Thomas Jefferson University (V.J.N.); National Center for Complementary and Alternative Medicine
(C.M.M.), and Liver Diseases Research Branch, Division of Digestive Diseases and Nutrition, National
Institute of Diabetes and Digestive and Kidney Diseases (E.D.), National Institutes of Health, Bethesda,
Maryland.
DMD Fast Forward. Published on August 24, 2011 as doi:10.1124/dmd.111.040212
Copyright 2011 by the American Society for Pharmacology and Experimental Therapeutics.
This article has not been copyedited and formatted. The final version may differ from this version.DMD Fast Forward. Published on August 24, 2011 as DOI: 10.1124/dmd.111.040212
at ASPE
T Journals on January 28, 2022
dmd.aspetjournals.org
Dow
nloaded from
DMD #40212
2
Running Title Page
Running Title: Pharmacokinetics of silymarin in chronic HCV and NAFLD patients
Corresponding Author: Roy L. Hawke, Pharm.D., Ph.D.
Division of Pharmacotherapy and Experimental Therapeutics
UNC Eshelman School of Pharmacy,
CB #7360, Kerr Hall Rm 3310
Chapel Hill, NC 27599-7360
Fax: 919-962-0644
Email: [email protected]
Document
Text pages …………… 23
Tables ……………… 4
Figures ……………… 3
References ………… 40
Words in Abstract …… 249
Words in Introduction … 822
Words in Discussion …… 1602
ABBREVIATIONS
NAFLD, nonalcoholic fatty liver disease; HCV, hepatitis C virus; LC-MS, liquid chromatography-mass
spectrometry; HPLC, high performance liquid chromatography; Cmax, maximum plasma concentration;
Tmax, peak time at Cmax; t1/2, terminal elimination half-life; CL/F, apparent clearance; AUC0→24h, area
under the plasma concentration-time curve from time 0 to 24 hours; ALT, alanine aminotransaminase
This article has not been copyedited and formatted. The final version may differ from this version.DMD Fast Forward. Published on August 24, 2011 as DOI: 10.1124/dmd.111.040212
at ASPE
T Journals on January 28, 2022
dmd.aspetjournals.org
Dow
nloaded from
DMD #40212
3
ABSTRACT
Silymarin, derived from the milk thistle plant Silybum marianum and widely used for self-treatment of
liver diseases, is comprised of six major flavonolignans including silybin A and silybin B which are the
predominant flavonolignans quantified in human plasma. The single and multiple dose
pharmacokinetics of silymarin flavonolignans were examined in patients with nonalcoholic fatty liver
disease (NAFLD) or hepatitis C virus (HCV) to determine if silymarin’s disposition, and therefore its
potential efficacy, varies between liver disease populations. Cohorts of eight subjects with non-cirrhotic
liver disease were randomized 3:1 to oral silymarin or placebo (280 or 560 mg) every 8 hours for 7 days.
48-Hour blood sampling was conducted following the first and final doses. In general, plasma
concentrations of silybin A and silybin B were higher while concentrations of conjugates were lower in
NAFLD compared to HCV. After adjusting AUC0-8h for weight and dose, only silybin B and silybin B
conjugates differed significantly between disease types. For NAFLD, the adjusted mean AUC0-8h was
higher for silybin B (p<0.05) but lower for silybin B conjugates (p<0.05) compared to HCV. At the 280
mg dose, steady-state plasma concentrations of silybin B conjugates for NAFLD subjects were
characterized by 46% lower AUC0-8h (p<0.05) and 42% lower Cmax (p<0.05) compared to HCV subjects.
Evidence of enterohepatic cycling of flavonolignans was only observed in NAFLD subjects. In
summary, silymarin’s efficacy may be more readily observed in NAFLD patients due to higher
flavonolignan plasma concentrations and more extensive enterohepatic cycling compared to patients
with HCV.
This article has not been copyedited and formatted. The final version may differ from this version.DMD Fast Forward. Published on August 24, 2011 as DOI: 10.1124/dmd.111.040212
at ASPE
T Journals on January 28, 2022
dmd.aspetjournals.org
Dow
nloaded from

DMD #40212
4
INTRODUCTION
Silymarin is an herbal product that has been used for centuries for diseases of the liver (Flora et
al., 1998), and approximately one-third of patients seen in US liver clinics report the use of some CAM
to self-treat their liver disease (Strader et al, 2002). Derived from the milk thistle plant, Silybum
marianum, silymarin is a complex mixture of six major flavonolignans (silybins A and B, isosilybins A
and B, silychristin, and silydianin), as well as other minor polyphenolic compounds (Kim et al., 2003).
Silymarin has been shown to have antioxidant, anti-inflammatory/immunomodulatory, and anti-fibrotic
properties in various in vitro and animal models (Abenavoli et al., 2010). However, it is the antioxidant
activity of silymarin that is most likely to attenuate the pathologic effects initiated by oxidative stress in
the liver which influence pathways of inflammation, necrosis, and fibrosis in chronic liver disease (Galli
et al., 2005; Medina and Moreno-Otero, 2005).
Silymarin may be the most potent antioxidant in nature by virtue of its free radical scavenger
reactivity and favorable membrane-lipid/water partitioning (György et al., 1992). Oxidative stress is
thought to play a central role in the etiology of nonalcoholic steatohepatitis (NASH), a specific subset of
nonalcoholic fatty liver disease (NAFLD), and is hypothesized to represent a ‘second hit’ triggering the
necroinflammatory response characteristic of NASH (Day and James, 1998). Therefore, the antioxidant
properties of silymarin may be particularly beneficial as a treatment for NASH since patients have
significantly increased levels of serum lipid peroxidation products (Chalasani et al., 2004) as well as
other oxidative stress markers and decreased levels of antioxidant enzymes (Koruk et al., 2004). In
addition, oxidative stress is a key feature of disease activity in HCV infection. Elevated levels of
oxidative stress markers have been associated with the grade and stage of liver disease in patients with
HCV (Jain et al., 2002) which suggests that antioxidant therapy may be effective in slowing disease
This article has not been copyedited and formatted. The final version may differ from this version.DMD Fast Forward. Published on August 24, 2011 as DOI: 10.1124/dmd.111.040212
at ASPE
T Journals on January 28, 2022
dmd.aspetjournals.org
Dow
nloaded from

DMD #40212
5
progression in the absence of antiviral effects. These observations provide the rationale for current
Phase 2 trials on the effects of silymarin in HCV and NASH populations.
The type and stage of liver disease has been recently shown to influence the single dose
pharmacokinetics of the major silymarin flavonolignans (Schrieber et al., 2008). An unexpected finding
was that total silymarin flavonolignan exposures were 3- to 5- fold higher for patient cohorts compared
to healthy controls (Schrieber et al., 2008). While this study demonstrated that the pharmacokinetics of
silymarin depend upon the type and grade/stage of liver disease, pharmacokinetic differences between
patients with chronic HCV infection and NAFLD were not fully elucidated due to the low plasma
concentrations.
Silymarin flavonolignans are metabolized via phase 2 conjugation pathways (Jancova et al.,
2011; Sridar et al., 2004) and the majority of glucuronide and sulfate conjugates undergo hepatobiliary
excretion via multi-drug resistance protein-2 (Mrp2) (Miranda et al., 2008). In obesity and NAFLD
animal models, Mrp2 has been shown to have altered hepatic expression and function (Cheng et al.,
2008; Geier et al., 2005). In addition, functional genetic polymorphisms in MRP2 have been associated
with susceptibility to NAFLD and disease severity (Sookoian et al., 2009). Therefore, disease-specific
modulation of silymarin metabolizing enzymes or hepatic transporters may account for alterations in
silymarin pharmacokinetics that have been previously observed in different types of liver diseases and
therefore may have a profound effect on the efficacy in different patient populations.
We have previously reported on the ascending multiple dose pharmacokinetics of silymarin in
noncirrhotic patients with chronic HCV infection (Hawke et al., 2010) obtained from a double-blind,
placebo-controlled Phase 1 trial that was conducted in patients with either HCV or NAFLD.
Unexpectedly, dose proportionality in the pharmacokinetics of parent silymarin flavonolignans was not
This article has not been copyedited and formatted. The final version may differ from this version.DMD Fast Forward. Published on August 24, 2011 as DOI: 10.1124/dmd.111.040212
at ASPE
T Journals on January 28, 2022
dmd.aspetjournals.org
Dow
nloaded from
DMD #40212
6
observed in HCV patients with well-compensated liver disease at silymarin doses above 560 mg when
administered orally every eight hours (Hawke et al., 2010). Since the steady-state pharmacokinetics of
silymarin in patients with NALFD has not been previously described, and because silymarin’s
pharmacokinetics may be different in different types of liver diseases (Schrieber et al., 2008), we now
report on the pharmacokinetics of silymarin in NAFLD subjects enrolled in the Phase 1 trial. To
determine if the disposition of silymarin differs between patients with NAFLD or HCV liver disease, we
also compare the single and multiple dose pharmacokinetics of silybin A and silybin B and their
conjugates between patients with NAFLD or HCV. Finally, since silymarin’s pharmacokinetics appears
to be nonlinear in patients with HCV, the pharmacokinetics of silymarin was evaluated at silymarin
doses of 280 mg and 560 mg to assess the interaction between dose and disease type. These trials were
conducted to optimize oral silymarin dosing for Phase 2 efficacy trials in patients with either HCV or
NASH (Lang, 2006). In these Phase 2 trials, which are now ongoing, oral doses higher than the
customary dose of 140 mg every 8 hours are utilized in an attempt to overcome silymarin’s high first-
pass metabolism and achieve therapeutic, steady-state plasma concentrations.
This article has not been copyedited and formatted. The final version may differ from this version.DMD Fast Forward. Published on August 24, 2011 as DOI: 10.1124/dmd.111.040212
at ASPE
T Journals on January 28, 2022
dmd.aspetjournals.org
Dow
nloaded from

DMD #40212
7
MATERIALS AND METHODS
Subjects
Forty male and female subjects ≥ 18 years of age with chronic noncirrhotic NAFLD and HCV
were enrolled into the study within 28 days of screening (N=8 per cohort). Subjects were required to
have elevated alanine aminotransferase levels ≥ 65 IU/L within 1 year prior to screening, and a
creatinine clearance (calculated according to Cockcroft-Gault equation) > 60 ml/min at screening as well
as a negative urine pregnancy screen for females of child-bearing potential who were also required to
use barrier methods of contraception during the study. .
Subjects were excluded if they had either a history of or, in the clinical opinion of the
investigator’s, evidence of decompensated liver disease defined by: serum albumin < 3.2 g/dl, total
bilirubin > 1.5 mg/dl, or PT/INR > 1.3 times normal, history or presence of ascites, encephalopathy,
portal hypertension, or bleeding from esophageal varices. Subjects were also excluded if they had
evidence of other chronic liver disease or serologic evidence of infection with human immunodeficiency
virus. Other exclusion criteria included: an allergy to milk thistle or its preparations; use of silymarin or
other milk thistle preparations, or use of high doses of other antioxidants such as vitamin E, vitamin C,
glutathione, alpha-tocopherol, within 30 days of randomization through study completion. However,
use of standard doses of over-the-counter multivitamins or cough/cold preparations was allowed. Also
excluded was the chronic use of acetaminophen > 2 grams/day; use of oral contraceptive, warfarin,
metronidazole, or concurrent use of the following cytochrome CYP3A4 inducers: aminoglutethimide,
aprepitant, carbamazepine, dexamethasone, efavirenz, ethosuximide, garlic supplements,
glucocorticoids, glutethimide, griseofulvin, modafinil, nafcillin, nevirapine, oxcarbazepine,
phenobarbital, phenytoin, primidone, rifabutin, rifampin, rifapentine, and St. John's Wort; historical liver
This article has not been copyedited and formatted. The final version may differ from this version.DMD Fast Forward. Published on August 24, 2011 as DOI: 10.1124/dmd.111.040212
at ASPE
T Journals on January 28, 2022
dmd.aspetjournals.org
Dow
nloaded from
DMD #40212
8
biopsy demonstrating the presence of cirrhosis (Ishak stage 5 or 6), or ≥ 15% steatosis, or evidence of
steatohepatitis; positive urine screen for drugs of abuse; alcohol consumption of > 12 grams/day for ≥ 6
months prior to screening; or other evidence of alcohol or drug abuse within 6 months of screening.
Women who were pregnant or breast-feeding were also excluded. All subjects agreed not to consume
alcohol 48 hours prior to study randomization through study completion.
Trial Design
Specific details on the design of this Phase 1 study have been previously described (Hawke et al.,
2010). Briefly, dose cohorts of eight subjects each were randomized 3:1, via a web-based randomization
system used by each site’s pharmacist, to receive oral silymarin or placebo every 8 hours for 7 days. 48-
hour pharmacokinetic samples were collected following an initial single dose administration before the 7
day treatment and a final dose following the 7 day treatment for a total of 23 doses. Only pharmacists
were unblinded to treatment assignments until trial completion. The sample size was selected to provide
information on safety, tolerability, and pharmacokinetics of silymarin and based on historical experience
for Phase 1 trials and not on statistical considerations. Cohorts were enrolled sequentially at doses of
280 mg or 560 mg Legalon®. Legalon® (Madaus, Germany now Rottapharm|Madaus, Italy) brand of
silymarin was selected as the clinical trial material for the Silymarin Product Development Program for
use in NIH-sponsored clinical trials for liver diseases from competing bids in response to a Notice of
Opportunity by the National Center for Complementary and Alternative Medicine and the National
Institute of Diabetes and Digestive and Kidney Diseases of the National Institutes of Health.
The first and last doses for the pharmacokinetic studies were administered on days 1 and 10,
respectively. To control for potential variability induced by fed versus fasted states, doses were
This article has not been copyedited and formatted. The final version may differ from this version.DMD Fast Forward. Published on August 24, 2011 as DOI: 10.1124/dmd.111.040212
at ASPE
T Journals on January 28, 2022
dmd.aspetjournals.org
Dow
nloaded from

DMD #40212
9
administered with 240 ml of water 30 minutes after breakfast to subjects who were fasted overnight.
Subjects were allowed to choose from a fixed list of items on the clinical research breakfast menu.
Grapefruit juice was not allowed. Subjects remained in the research unit for 48 hours for collection of
blood. Fourteen serial blood samples were collected at 0 (pre-dose), 0.5, 1, 1.5, 2, 4, 6, 8, 12, 15, 18, 24,
32, and 48 hours post-dose. Twenty-one doses were dispensed to subjects upon discharge after
collection of the 48 hour post-dose sample on day 3. The first of these 21 doses was self-administered
under direct supervision in the clinical research center. 8-Hour post-dose trough plasma samples were
collected during safety visits on days 6 and 8. Patient adherence was assessed by patient drug diary, pill
counts, and by maintaining records of drugs dispensed and returned.
Subjects were enrolled from December 2006 to July 2008 at 4 clinical centers, which included
University of North Carolina at Chapel Hill, Beth Israel Deaconess Medical Center, University of
Pennsylvania, and Thomas Jefferson University. Institutional review boards of participating centers
approved the protocol; all subjects provided written informed consent. The study was conducted in
accordance with the Declaration of Helsinki and guidelines on Good Clinical Practice.
Safety Assessment
Safety was assessed before dosing on study days 1 (baseline), 6, 8, and 10, which consisted of
clinical laboratory tests and reports of clinical adverse events using a symptom assessment
questionnaire. Additionally, on days 1 and 10, the questionnaire was also completed at approximately
24 and 48 hours postdose. Common Terminology Criteria for Adverse Events (CTCAE v3.0) was
utilized to grade the severity of adverse events. Physical examinations and electrocardiograms were
completed at baseline and at end-of-study. Decisions to dose escalate were made after a safety
This article has not been copyedited and formatted. The final version may differ from this version.DMD Fast Forward. Published on August 24, 2011 as DOI: 10.1124/dmd.111.040212
at ASPE
T Journals on January 28, 2022
dmd.aspetjournals.org
Dow
nloaded from

DMD #40212
10
evaluation by a designated safety committee masked to treatment. The safety committee consisted of
the principal investigators from the four clinical centers and an external safety monitor.
Study Drug
Silymarin (Legalon®) and matching placebo were manufactured in hard capsules by Madaus
Rottapharm Group (Cologne, Germany); all study doses were administered from Lot No. 0418901.
Each dose consisted of five silymarin and/or placebo capsules packaged in single use medicine dose
cups. The flavonolignan content of each capsule was determined according to previously published LC-
MS methods as follows: 23.2 mg, silybin A; 32.0 mg, silybin B; 11.8 mg, isosilybin A; 6.6 mg,
isosilybin B; 24.9 mg, silychristin; and 29.0 mg, silydianin (Wen et al., 2008) . These six flavonolignans
account for 70.8% (127.5 mg silymarin equivalent to 140 mg of silymarin as determined by the
manufacturer’s DNPH method) of the 180 mg milk thistle extract contained in each capsule. Based on
interim stability testing results performed by the manufacturer, Legalon® capsules are stable under
normal conditions (25° C, 60% relative humidity) for at least 9 months. For the purpose of the
pharmacokinetic analyses described in this report, one Legalon® capsule was considered equal to 140
mg of silymarin in accordance with the manufacturer’s specifications.
Analysis of Silymarin Flavononlignans
Whole blood samples were collected in two 3 ml EDTA-lined tubes (K2-EDTA tubes; BD,
Franklin Lakes, NJ, USA) and centrifuged at 1200 x g for 10 minutes at 4oC. Plasma was aspirated and
transferred to polypropylene tubes. Plasma samples were temporarily stored at -70°C by each clinical
This article has not been copyedited and formatted. The final version may differ from this version.DMD Fast Forward. Published on August 24, 2011 as DOI: 10.1124/dmd.111.040212
at ASPE
T Journals on January 28, 2022
dmd.aspetjournals.org
Dow
nloaded from

DMD #40212
11
site for < 30 days prior to shipment to the University of North Carolina where they were acidified by
addition of glacial acetic acid (final concentration 1% acetic acid) and stored at -70°C until analysis.
For the determination of parent (i.e. nonconjugated) flavonolignan concentrations in plasma, a
125 μl aliquot of each patient sample was buffered using sodium acetate (pH 5.0, 0.125 M) and
incubated for 6 hours at 37ºC without hydrolytic enzymes. A second 125 μl aliquot was also buffered
using sodium acetate (pH 5.0, 0.125 M) and incubated with a mixture of sulfatase (80 U/ml, S9626 Type
H-1) and β-glucuronidase (8000 U/ml, G0501 Type B-10) (Sigma-Aldrich, St. Louis, MO) for the
determination of total (i.e. parent + conjugates) flavonolignan concentrations which were expressed as
“Parent Flavonolignan Equivalents”. After incubation, 50 ng of naringenin (internal standard) in 25 μl
of 50% MeOH was added to the samples which were then deproteinized and processed using a high-
throughput protein filtration procedure as previously described (Hawke et al., 2010). Following
filtration, 75 μl of the plasma sample supernatants were transferred to glass HPLC vials and
concentrations of silymarin flavonolignans were quantified by LC-ESI-MS as previously described
using a Luna C18 analytical column (50 × 2.0 mm i.d., 3 μm; Phenomenex, Torrance, CA); an isocratic
mobile phase consisting of 43% methanol, 56% water, and 1% glacial acetic acid (pH 2.8); a flow rate,
0.3 ml/min; a 25 µl injection volume; and a 13 minute run time (Wen et al., 2008). For each silymarin
flavonolignan, the limit of detection was 20 ng/ml and the quantitative ranges for parent and for total
flavonolignan were 50 – 2,500 ng/ml and 100 – 20,000 ng/ml, respectively. The accuracy for each
flavonolignan was within 95.4 – 107.4% and intra- and inter-day precisions were 1.7 – 11% and 4.5 –
14%, respectively.
Data Analysis
This article has not been copyedited and formatted. The final version may differ from this version.DMD Fast Forward. Published on August 24, 2011 as DOI: 10.1124/dmd.111.040212
at ASPE
T Journals on January 28, 2022
dmd.aspetjournals.org
Dow
nloaded from

DMD #40212
12
Pharmacokinetic parameters including: area under plasma concentration-time curve (AUC);
maximum plasma concentration (Cmax); time to Cmax (Tmax); and terminal half-life (T½) were calculated
using noncompartmental methods, WinNonlin-Pro (v5.2; Pharsight Corp, Mountain View, CA). A
constant dosing interval (tau) of 8 hours was assumed for the calculation of steady-state AUC0-8h using
the linear up/log down trapezoidal method. To obtain pharmacokinetic parameters for the conjugate
flavonolignan concentrations, the parent flavonolignan concentrations were subtracted from the total
flavonolignan concentrations at each time point over the entire sampling period prior to performing a
pharmacokinetic analysis. Pharmacokinetic parameters are reported as geometric means with 95%
confidence intervals, except for Tmax which is reported as median with minimum and maximum values.
For our primary analysis, differences in steady-state exposures (i.e., AUC0-8h) between disease cohorts
were compared, following log transformation, using a parametric two-sample t-test, p < 0.05 was used
for statistical significance. In addition, to eliminate weight as a potential confounder in the assessment
of differences in flavonolignan exposures between cohorts, a linear regression model with log AUC0-8h
as outcome was used. The model included dose, disease, and weight as independent variables in order
to adjust for variable weights across dose groups (280 mg vs. 560 mg) or disease type (HCV vs.
NAFLD) while comparing AUC0-8h. Least-square means (adjusted means) were reported with 95%
confidence intervals and tested using t-tests. All statistical analyses were performed by using SAS 9.2
or SAS JMP 9 (SAS Institute Inc., Cary, NC).
This article has not been copyedited and formatted. The final version may differ from this version.DMD Fast Forward. Published on August 24, 2011 as DOI: 10.1124/dmd.111.040212
at ASPE
T Journals on January 28, 2022
dmd.aspetjournals.org
Dow
nloaded from

DMD #40212
13
RESULTS
Subjects
Baseline demographics are presented in Table I. Study subjects in the HCV cohorts were
predominantly males with ages ranging from 43 – 59 years, while males and females were more equally
represented in the NAFLD cohorts with ages ranging from 28 – 58 years. Subjects were characterized
by well-compensated, noncirrhotic liver disease as evidenced by total bilirubin (range: 0. 3 – 2.6 mg/dl)
and platelet counts (range: 150 – 327 cells/mm3).
Efficacy and Safety Endpoints
When compared to their screening baseline values, no reductions in serum transaminases for
either HCV or NAFLD subjects, or reductions in HCV RNA titer for HCV subjects were observed at the
end of the 7 day treatment period (data not shown).
There were no abnormal deviations from baseline laboratory values reported with silymarin
administration for any cohort. For the HCV cohorts, 3 subjects who received a single 280 mg dose of
silymarin reported a total of 4 adverse events. Three of the adverse events were classified as
neurological (e.g., headache) while the other was classified as gastrointestinal. Only one adverse event
(dizziness) was considered possibly related Legalon® administration and resolved in less than 1 day.
For NAFLD cohorts, two out of 12 subjects (16.7%) receiving silymarin reported at least one
adverse event compared to 1 out of 4 subjects (25%) receiving placebo. Adverse events reported with
silymarin included upper respiratory infection and abdominal pain, both of which occurred in the 560
mg dose cohort. All adverse events reported with silymarin were determined to be mild to moderate,
self-limiting, and were considered unrelated to treatment.
This article has not been copyedited and formatted. The final version may differ from this version.DMD Fast Forward. Published on August 24, 2011 as DOI: 10.1124/dmd.111.040212
at ASPE
T Journals on January 28, 2022
dmd.aspetjournals.org
Dow
nloaded from

DMD #40212
14
Single dose Pharmacokinetics of Silybin A and Silybin B
A comparison of the pharmacokinetics of silybin A and silybin B between HCV and NAFLD
cohorts following single oral doses of either 280 or 560 mg silymarin are presented in Table II. Silybin
A was the predominant flavonolignan in plasma for both HCV and NAFLD cohorts and was
characterized by a 2.7- to 3.3-fold greater Cmax and a 2- to 4.5-fold greater AUC0-48h compared to silybin
B.
At the 280 mg dose, no differences were observed in the pharmacokinetics of silybin A or silybin
B between HCV and NAFLD subjects. Short elimination half-lives were observed for both silybin A
and silybin B (range 0.9 – 1.8 hours).
However, at the 560 mg dose, pharmacokinetic differences were observed between HCV and
NAFLD subjects. Compared to HCV subjects, AUC0-48h for silybin A and silybin B were 1.5-fold (p >
0.05) and 2.1-fold (p < 0.05) greater, respectively, for NAFLD subjects. A similar trend was observed
in the Cmax for silybin A and silybin B, although the 1.4- to 1.6-fold differences between HCV and
NAFLD subjects did not achieve statistical significance. Elimination half-lives were similar between
the disease groups (range 1.1 – 1.5 hours), while Tmax was delayed by 1 hour in NAFLD subjects.
Steady-State Pharmacokinetics of Silybin A and Silybin B
The steady-state pharmacokinetics of silybin A and silybin B for the HCV and NAFLD cohorts
following chronic oral administration of either 280 or 560 mg silymarin every 8 hours for 7 days are
presented in Table III. Similar to the data obtained following single doses, silybin A was the
predominant flavonolignan in plasma for both HCV and NAFLD cohorts and was characterized by a
2.1- to 3.6-fold greater Cmax and a 2.6- to 4.9-fold greater AUC0-8h compared to silybin B. In addition,
This article has not been copyedited and formatted. The final version may differ from this version.DMD Fast Forward. Published on August 24, 2011 as DOI: 10.1124/dmd.111.040212
at ASPE
T Journals on January 28, 2022
dmd.aspetjournals.org
Dow
nloaded from

DMD #40212
15
there was no evidence of accumulation for either flavonolignan following repeated dosing with
elimination half-lives ranging between 0.7 to 1.3 hours. Also similar to the single dose data,
pharmacokinetic differences between HCV and NAFLD cohorts were only observed at the 560 mg dose.
The AUC0-8h for silybin A and silybin B were 1.6-fold and 2.5-fold greater, respectively, in NAFLD
subjects compared to HCV subjects at the 560 mg while differences in the Cmax between cohorts ranged
between 1.5- to 2.2-fold. After adjusting for weight and disease type, silybin A and silybin B AUC0-8h
differed significantly between the 280 and 560 mg dose groups (p ≤ 0.004), such that for either HCV or
NAFLD or at any weight level, the 560 mg dose was associated with higher AUC0-8h. When adjusted
for weight and dose, only silybin B differed significantly across disease types such that adjusted mean
AUC0-8h for silybin B was higher for NAFLD compared to HCV (p = 0.004). The higher silybin B
exposures in NAFLD subjects suggest the metabolism or hepatic uptake of silybin B may be reduced in
NAFLD compared to HCV.
Single dose and Steady-State Pharmacokinetics of Silybin A and Silybin B Conjugates
To further explore the effect of NAFLD on silymarin’s metabolism, differences in the plasma
concentrations of silybin A and silybin B conjugates between HCV and NAFLD subjects were
examined. As defined in Methods, plasma concentrations of conjugates were estimated from the
subtraction of parent flavonolignan concentrations from total (parent + conjugate) flavonolignan
concentrations.
The single dose and steady-state pharmacokinetic data for total conjugates of silybin A and
silybin B for both disease cohorts are presented in Tables IV and V, respectively. Whereas plasma
concentrations were observed to be greater for silybin A than for silybin B, the converse was true for
This article has not been copyedited and formatted. The final version may differ from this version.DMD Fast Forward. Published on August 24, 2011 as DOI: 10.1124/dmd.111.040212
at ASPE
T Journals on January 28, 2022
dmd.aspetjournals.org
Dow
nloaded from

DMD #40212
16
their conjugates. The Cmax and AUC0-8h for silybin B conjugates were 3- to 4-fold greater than for
silybin A conjugates across both dose levels and disease cohorts.
Differences between HCV and NAFLD subjects were observed in the pharmacokinetics for
plasma conjugates of silybin A and silybin B at either dose level following single or chronic dosing.
However, these differences only achieved significance between HCV and NAFLD cohorts dosed at 280
mg every 8 hours whereas conjugates of silybin B in plasma of NAFLD subjects were characterized by
46% lower AUC0-8h (p < 0.05) and 42% lower Cmax (p < 0.05) compared to HCV subjects. Figure 1
depicts the mean steady-state plasma concentration versus time profiles for silybin B (inset) and silybin
B conjugates for HCV and NAFLD subjects at the 280 mg dose. Plasma concentrations of silybin B
conjugates were lower in NAFLD subjects compared to HCV subjects over the entire 8 hour dosing
interval (Figure 1). In contrast, plasma concentrations of silybin B were higher in NAFLD subjects until
peak concentrations were achieved and then declined similarly (Figure 1 inset). These data suggest that
reduced silymarin metabolism may result in differences in silymarin exposures between NAFLD and
HCV subjects, rather than differences in absorption.
After adjusting for weight and disease type, the AUC0-8h for silybin A conjugates and for silybin
B conjugates differed significantly between the 280 and 560 mg dose groups (p ≤ 0.004), such that for
either HCV or NAFLD or at any weight level, the 560 mg dose was associated with higher AUC0-8h.
When adjusted for weight and dose, only silybin B conjugates differed significantly across disease types
such that adjusted mean AUC0-8h for silybin B conjugates was significantly lower for NAFLD subjects
compared to HCV (p = 0.03).
To further quantify differences in the extent of flavonolignan conjugation between HCV and
NAFLD subjects, steady-state metabolic ratios were calculated as the ratio of AUC0-8h for silybin B
This article has not been copyedited and formatted. The final version may differ from this version.DMD Fast Forward. Published on August 24, 2011 as DOI: 10.1124/dmd.111.040212
at ASPE
T Journals on January 28, 2022
dmd.aspetjournals.org
Dow
nloaded from

DMD #40212
17
divided by AUC0-8h for silybin B conjugates at the 560 mg dose. Metabolic ratios differed 4-fold (p <
0.05) between HCV and NAFLD with means (± SD) of 0.016 ± 0.011 and 0.060 ± 0.041, respectively.
These data suggest that there is less conjugation of silybin B in NAFLD subjects compared to HCV at a
silymarin dose of 560 mg. In summary, plasma concentrations of silybin A and silybin B were generally
greater and the concentrations of their conjugates lower in NAFLD subjects compared to HCV subjects
irrespective of the dose and frequency of oral silymarin administration.
Flavonolignan Accumulation
The ratio of parent silybin A steady-state AUC0-8h divided by single-dose AUC0-8h was calculated
as an indication of the extent of accumulation following chronic three times daily dosing. Silybin A
ratios of 1.3 and 1.4 were calculated for HCV and NAFLD, respectively, at the 560 mg dose, which
indicates no significant accumulation in either cohort with repeated dosing. Similar ratios were
calculated for silybin B. This finding is consistent with the short half-life of the silymarin
flavonolignans.
While no evidence for parent silybin A and silybin B accumulation was observed, the overall
amount of parent flavonolignans in plasma was significantly higher in NAFLD subjects compared to
HCV subjects at the 560 mg dose due to the appearance of additional parent flavonolignans. Figure 2
compares mean steady-state peak plasma concentrations of the six parent silymarin flavonolignans for
HCV and NAFLD subjects at the 560 mg dose, as well as their sum concentration. As seen in Figure 2,
plasma concentrations of isosilybin A, isosilybin B, silychristin, and silydianin were significantly greater
in NAFLD subjects compared to HCV subjects. Interestingly, silychristin and silydianin were not
detected in the plasma of HCV subjects. To gain insight into the mechanism(s) behind these observed
This article has not been copyedited and formatted. The final version may differ from this version.DMD Fast Forward. Published on August 24, 2011 as DOI: 10.1124/dmd.111.040212
at ASPE
T Journals on January 28, 2022
dmd.aspetjournals.org
Dow
nloaded from

DMD #40212
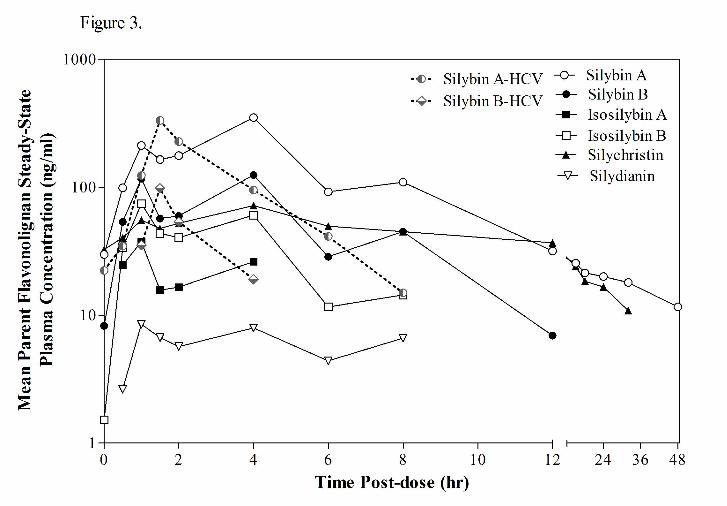
18
differences, we evaluated the plasma concentration versus time profile for each flavonolignan over the
48 hour sampling period following administration of the last 560 mg dose (Figure 3). Significant
enterohepatic cycling of the six flavonolignans were observed in NAFLD subjects as indicated by a
prominent second peak at 4 hours following the absorption peak at 1 hour. Most flavonolignans also
showed evidence of a third peak at 8 hours post dose. In contrast, there was less evidence of
enterohepatic cycling in HCV subjects where no secondary peaks were observed for either silybin A or
silybin B following the early absorption peak. Silychristin represented a major flavonolignan in the
plasma of NAFLD subjects at the dose 560 mg dose. Silychristin’s steady-state pharmacokinetics
(geometric mean and 95% confident intervals) were characterized by a Cmax of 67 ng/ml (-2.5, 174), an
AUC0-8h of 325 ng●hr/ml (-145, 1100), and a T½ of 3.1 hr (1.2, 6.3). The steady-state pharmacokinetics
of the conjugates of silychristin in NAFLD subjects were characterized by a Cmax of 663 ng/ml (367,
1394), an AUC0-8h of 3800 ng●hr/ml (1628, 8462), and a T½ of 4.5 hr (2.2, 8.6).
This article has not been copyedited and formatted. The final version may differ from this version.DMD Fast Forward. Published on August 24, 2011 as DOI: 10.1124/dmd.111.040212
at ASPE
T Journals on January 28, 2022
dmd.aspetjournals.org
Dow
nloaded from

DMD #40212
19
DISCUSSION
The expression of drug disposition genes and their protein products have been shown to be
altered in liver disease (Congiu et al., 2009; Fisher et al., 2009; Congiu et al., 2002), and effects of liver
disease on the disposition of drugs have been demonstrated and tend to be more severe in patients with
more advanced cirrhotic disease (Chalon et al., 2003). In contrast, significant differences in the
disposition of drugs between different types of liver disease have not been demonstrated. We have
shown that the disposition of silymarin, an herbal medicine widely used by patients with liver disease, is
significantly altered in patients with liver disease (Schrieber et al., 2008). Concentrations of total
silymarin species found in plasma, which consist primarily of flavonolignan conjugates, were found to
be approximately 5-fold higher in patients with chronic HCV infection or NAFLD when compared to
healthy controls. Pharmacokinetic differences were also observed between healthy subjects and patients
with NAFLD or patients with HCV cirrhosis. In contrast, differences were not observed between
healthy subjects and patients with noncirrhotic HCV disease possibly due to wide disease heterogeneity
in patient cohorts or reduced sensitivity as a result of low plasma concentrations of flavonolignans
associated with the low oral dose of a generic brand of silymarin that was used in this study (Schrieber
et al., 2008). These results raised the possibility that the disposition of silymarin, and its potential
beneficial effects, may be different in various liver disease populations with early stage disease. To
determine if the disposition of silymarin is different between patients with different types of the liver
disease, this study examined the pharmacokinetics of higher than customary oral doses of silymarin in
noncirrhotic patients with either chronic HCV infection or NAFLD. The results of our study show that
NAFLD patients are characterized by higher plasma concentrations of certain silymarin flavonolignans
and lower concentrations of flavonolignan conjugates compared to HCV patients administered the same
This article has not been copyedited and formatted. The final version may differ from this version.DMD Fast Forward. Published on August 24, 2011 as DOI: 10.1124/dmd.111.040212
at ASPE
T Journals on January 28, 2022
dmd.aspetjournals.org
Dow
nloaded from

DMD #40212
20
dose. While silymarin flavonolignans appear to share common pathways of metabolism and transport,
differences in their affinity for these processes have been noted (Miranda et al., 2008; Sridar et al., 2004)
which likely account for the different relationships between AUC exposure and dose for silybin A and
silybin B observed in our study.
In vitro and in vivo studies suggest silymarin flavonolignans are primarily metabolized through
glucuronidation and sulfation pathways with various UDP-glucuronosyltransferases (UGTs) sharing
overlapping specificity (Sridar et al., 2004; Jancova et al., 2011). In addition, the extent in which
various flavonolignans undergo glucuronidation or sulfation appears to vary (Wen et al., 2008). There
are several possibilities that could explain why the ratio of parent flavonolignan (e.g., silybin B) to
flavonolignan conjugates was higher in patients with NAFLD compared to HCV in our study. The
simplest explanation is that the expression or activity of UGTs is decreased in NAFLD subjects.
Nonalcoholic steatohepatitis, a specific subset of NAFLD, is characterized by hepatic steatosis, and
varying degrees of inflammation which can lead to decreased UGT expression which has been observed
in rodents (Richardson et al., 2006) and in human liver tissue (Congiu et al., 2002). Therefore it is
plausible that the major UGT isoforms involved in metabolism of silymarin may be lower in NAFLD
subjects resulting in higher plasma levels of parent flavonolignans and lower concentrations of
conjugates. Since silybin B conjugates represents 99% of the total (parent + conjugates) silybin B
species in HCV patient plasma, metabolism stoichiometry predicts that the 40% reduction in silymarin
conjugates observed in our NAFLD cohort should result in an ~30-fold increase in silybin B plasma
concentrations. However, plasma concentrations of silybin B were comparable between HCV and
NAFLD patients. Therefore, reduced UGT activity does not appear to be a viable explanation for the
differences in silymarin pharmacokinetics between HCV and NAFLD in our study. In addition, the
This article has not been copyedited and formatted. The final version may differ from this version.DMD Fast Forward. Published on August 24, 2011 as DOI: 10.1124/dmd.111.040212
at ASPE
T Journals on January 28, 2022
dmd.aspetjournals.org
Dow
nloaded from

DMD #40212
21
lower plasma concentration of flavonolignan conjugates in NAFLD compared to HCV does not appear
to be related to reduced intestinal absorption since parent flavonolignans would also be expected to be
lower in plasma.
Alterations in the expression and function of hepatobilary transporters may be a more plausible
explanation for the decrease in flavonolignan conjugates and the higher plasma concentrations of parent
flavonolignans observed in the NAFLD cohorts. Evidence for extensive enterohepatic cycling of
silymarin and their conjugates has been observed at high doses of silymarin (Hawke et al., 2010;
Schrieber et al., 2008). Enterohepatic cycling is regulated by hepatobiliary transporters involved in the
active uptake of anionic and cationic compounds from the blood such as the organic anion transporting
polypeptides, OATP1B1 and OATP2B1, located on the basolateral membrane of the hepatocyte
(Chandra et al., 2004). In many instances, these compounds undergo metabolism to more polar
conjugates followed by transport and biliary excretion by ATP-binding cassette transporters such as P-
glycoprotein , multidrug resistance associated protein 2 (MRP2), and breast cancer resistance protein,
located at the canalicular membrane of the hepatocyte (Leslie et al., 2005; Schinkel and Jonker, 2003).
Once delivered to the small intestine, parent compounds can be reformed by bacterial deconjugation and
returned to portal blood for delivery to the liver for reuptake. In competition with biliary efflux, is the
efflux of substrates from the hepatocyte to blood by other members of the MRP family, such as MRP3
and MRP4 (MRPs 3/4), which are located on the basolateral (sinusoidal) membrane. It is generally
thought that MRP2 and MRP3 work in concert in liver disease to promote hepatic efflux and protect the
hepatocyte from the effects of cholestasis (Van de Steeg et al., 2010; Wagner et al., 2005).
The most intriguing observation in the current study was the suggestion of significant
enterohepatic recycling of silymarin flavonolignans in NAFLD subjects in contrast to HCV subjects
This article has not been copyedited and formatted. The final version may differ from this version.DMD Fast Forward. Published on August 24, 2011 as DOI: 10.1124/dmd.111.040212
at ASPE
T Journals on January 28, 2022
dmd.aspetjournals.org
Dow
nloaded from

DMD #40212
22
where there was no evidence of enterohepatic cycling (see Figure 3). Silymarin flavonolignans
demonstrate high affinity for MRP4 (Wu et al., 2005) while silymarin conjugates, but not parent
flavonolignans, appear to be better substrates for MRP2 (Miranda et al., 2008). Glucuronides that are
substrates for MRP2, such as conjugated bilirubin, can also be substrates for MRPs 3/4 (Borst et al.,
2006; Zelcer et al., 2006). Therefore, differences in the disposition and enterohepatic cycling of
silymarin flavonolignans may reflect alterations in the function of hepatobilary transporters as a result of
liver disease.
In obesity and NAFLD animal models, Mrp2 has been shown to have altered hepatic expression
and function (Cheng et al., 2008; Geier et al., 2005). In addition, Mrp2, Mrp3, and Mrp4 protein
expression were significantly increased in a rodent model of NAFLD (Lickteig et al., 2007). The biliary
excretion of glucuronide and sulfate conjugates of silymarin flavonolignans was shown to be dependent
on Mrp2 using isolated perfused livers, and some flavonolignans such as silychristin and silydianin were
almost quantitatively secreted into bile (Miranda et al., 2008). Therefore, enterohepatic cycling of
silymarin flavonolignans may be increased in NAFLD due to increased MRP2-dependent biliary efflux
and diversion of silymarin conjugates away from sinusoidal efflux to blood. An increase in MRP4
would also contribute to greater sinusoidal efflux of parent flavonolignans. These changes would result
in lower plasma concentrations of silymarin conjugates with higher concentrations of recycling
silymarin flavonolignans in NAFLD patients compared to HCV.
Alternatively, the differences observed in the disposition of silymarin between NAFLD and
HCV patients may reflect HCV-specific alterations in hepatobiliary function. HCV infection was shown
to be associated with increased hepatic expression of MRP4, decreased expression of MRP2, and
decreased expression of OATP1B1 in cirrhotic and noncirrhotic liver while the expression of MRP3 and
This article has not been copyedited and formatted. The final version may differ from this version.DMD Fast Forward. Published on August 24, 2011 as DOI: 10.1124/dmd.111.040212
at ASPE
T Journals on January 28, 2022
dmd.aspetjournals.org
Dow
nloaded from

DMD #40212
23
OATP2B1 were similar to that in normal human liver (Ogasawara et al., 2010). Therefore, the
differences in the disposition of silymarin between HCV and NAFLD subjects observed in our study
may reflect a diversion of silymarin conjugates to sinusoidal efflux in HCV patients due to reduced
biliary efflux by MRP2 or reduced uptake by OATP1B1, which would also result in higher plasma
concentrations of silymarin conjugates and decreased enterohepatic cycling of silymarin flavonolignans
compared to patients with NAFLD. While the results of our study cannot delineate between these
various potential mechanisms, it is possible that silymarin’s disposition is altered by different, disease-
specific mechanisms in NAFLD and HCV populations. This conclusion is supported by our previous
observation that plasma concentrations of silymarin conjugates are significantly higher in both NAFLD
and HCV patients compared to concentrations found in healthy volunteers (Schrieber et al., 2008).
In summary, differences in the disposition of silymarin between NAFLD and HCV patients may
reflect different disease-specific alterations in the function of hepatobiliary transport proteins. These
observations are significant because differences in the disposition of drugs between different types of
liver disease have not been demonstrated, perhaps because of their more restrictive use indications.
Importantly, the antioxidant activity and potential antiinflammatory and antifibrotic effects of silymarin
on disease progression will be dependent on its hepatic disposition. Oxidative stress has been associated
with all stages of chronic HCV liver disease (Jain et al., 2002) and recent data from the HALT-C trial
suggest that silymarin use among patients with advanced HCV liver disease may be associated with
reduced progression to cirrhosis (Freedman et al., 2011). Compared to HCV infection, silymarin may
demonstrate greater benefits in patients with NAFLD since oxidative stress is thought to play a central
role in the etiology of NASH (Day et al., 1998) and there are no approved therapies. In addition, the
results of this study suggest silymarin’s effects on liver disease progression may also be greater in
This article has not been copyedited and formatted. The final version may differ from this version.DMD Fast Forward. Published on August 24, 2011 as DOI: 10.1124/dmd.111.040212
at ASPE
T Journals on January 28, 2022
dmd.aspetjournals.org
Dow
nloaded from

DMD #40212
24
NAFLD patients due to higher flavonolignan plasma concentrations and more extensive enterohepatic
cycling compared to patients with HCV. These observations were critical in the design of a Phase 2
silymarin trial in NASH which is currently ongoing (Lang, 2006).
This article has not been copyedited and formatted. The final version may differ from this version.DMD Fast Forward. Published on August 24, 2011 as DOI: 10.1124/dmd.111.040212
at ASPE
T Journals on January 28, 2022
dmd.aspetjournals.org
Dow
nloaded from

DMD #40212
25
Acknowledgements
The authors are indebted to Dr. Josh Berman and Dr. Qi-Ying Liu for their important early efforts in
study design and to Dr. Ulrich Mengs for championing this work. In addition, the authors wish to thank
the patients who volunteered for this trial, and Dr. Tedi Soule, Joseph Colagreco, Mary Hammond, and
Deborah Moretti, who served as the study coordinators, and Sharon Lawlor, who was the DCC
coordinator, for their invaluable assistance in the conduct of this trial. The authors would also like to
thank Dr. Craig W. Hendrix, M.D. who graciously agreed to serve as the independent safety monitor.
This article has not been copyedited and formatted. The final version may differ from this version.DMD Fast Forward. Published on August 24, 2011 as DOI: 10.1124/dmd.111.040212
at ASPE
T Journals on January 28, 2022
dmd.aspetjournals.org
Dow
nloaded from

DMD #40212
26
Authorship Contributions
Participated in research design: Hawke, Reddy, Belle, Afdhal, Navarro, Meyers, Doo, Fried
Conducted experiments: Wen, Schrieber
Contributed new reagents or analytic tools: Hawke, Smith
Performed data analysis: Schrieber, Wahed
Wrote or contributed to the writing of the manuscript: Schrieber, Hawke
This article has not been copyedited and formatted. The final version may differ from this version.DMD Fast Forward. Published on August 24, 2011 as DOI: 10.1124/dmd.111.040212
at ASPE
T Journals on January 28, 2022
dmd.aspetjournals.org
Dow
nloaded from
DMD #40212
27
REFERENCES
Abenavoli L, Capasso R, Milic N, and Capasso F (2010). Milk Thistle in Liver Diseases: Past, Present,
Future. Phytother Res 24:1423-1432.
Borst P, Zelcer N, and van de Wetering K (2006) MRP2 and 3 in health and disease. Cancer Lett
234:51-61.
Chalasani N, Deeg MA, and Crabb DW (2004) Systemic levels of lipid peroxidation and its metabolic
and dietary correlates in patients with nonalcoholic steatohepatitis. Am J Gastroenterol 99:1497-1502.
Chalon SA, Desager JP, Desante KA, Frye RF, Witcher J, Long AJ, Sauer JM, Golnez JL, Smith BP,
Thomasson HR, and Horsmans Y (2003) Effect of hepatic impairment on the pharmacokinetics of
atomoxetine and its metabolites. Clin Pharmacol Ther 73:178-191.
Chandra P and Brouwer KL (2004) The complexities of hepatic drug transport: current knowledge and
emerging concepts. Pharm Res 21:719-735.
Cheng Q, Aleksunes LM, Manautou JE, Cherrington NJ, Scheffer GL, Yamasaki H, and Slitt AL (2008)
Drug-metabolizing enzyme and transporter expression in a mouse model of diabetes and obesity. Mol
Pharm 5:77-91.
This article has not been copyedited and formatted. The final version may differ from this version.DMD Fast Forward. Published on August 24, 2011 as DOI: 10.1124/dmd.111.040212
at ASPE
T Journals on January 28, 2022
dmd.aspetjournals.org
Dow
nloaded from

DMD #40212
28
Cheng Z, Radominska-Pandya A, and Tephly TR (1999) Studies on the substrate specificity of human
intestinal UDP- glucuronosyltransferases 1A8 and 1A10. Drug Metab Dispos 27:1165-1170.
Congiu M, Mashford ML, Slavin JL, and Desmond PV (2002) UDP Glucuronosyltransferase mRNA
levels in human liver disease. Drug Metab Dispos 30:129-134.
Congiu M, Mashford ML, Slavin JL, and Desmond PV (2009) Coordinate regulation of metabolic
enzymes and transporters by nuclear transcription factors in human liver disease. J Gastroenterol
Hepatol 24:1038-1044.
Day CP and James OF (1998) Steatohepatitis: a tale of two "hits"? Gastroenterology 114:842-845.
Fisher CD, Lickteig AJ, Augustine LM, Ranger-Moore J, Jackson JP, Ferguson SS, and Cherrington NJ
(2009) Hepatic cytochrome P450 enzyme alterations in humans with progressive stages of nonalcoholic
fatty liver disease. Drug Metab Dispos 37:2087-2094.
Flora K, Hahn M, Rosen H, and Benner K (1998) Milk thistle (Silybum marianum) for the therapy of
liver disease. Am J Gastroenterol 93:139-143.
Freedman ND, Curto TM, Morishima C, Seeff LB, Goodman ZD, Wright EC, Sinha R, and Everhart JE;
HALT-C Trial Group (2011) Silymarin use and liver disease progression in the Hepatitis C Antiviral
Long-Term Treatment against Cirrhosis trial. Alimentary Pharmacol & Therapeut 33:127-137.
This article has not been copyedited and formatted. The final version may differ from this version.DMD Fast Forward. Published on August 24, 2011 as DOI: 10.1124/dmd.111.040212
at ASPE
T Journals on January 28, 2022
dmd.aspetjournals.org
Dow
nloaded from
DMD #40212
29
Galli A, Svegliati-Baroni G, Ceni E, Milani S, Ridolfi F, Salzano R, Tarocchi M, Grappone C, Pellegrini
G, Benedetti A, Surrenti C, and Casini A (2005) Oxidative stress stimulates proliferation and
invasiveness of hepatic stellate cells via a MMP2-mediated mechanism. Hepatology 41:1074-1084.
Geier A, Dietrich CG, Grote T, Beuers U, Prüfer T, Fraunberger P, Matern S, Gartung C, Gerbes AL,
and Bilzer M (2005) Characterization of organic anion transporter regulation, glutathione metabolism
and bile formation in the obese Zucker rat. J Hepatol 43:1021-1030.
György I, Antus S, Blázovics A, and Földiák G (1992) Substituent effects in the free radical reactions of
silybin: radiation-induced oxidation of the flavonoid at neutral pH. Int J Radiat Biol 61:603-609.
Hawke RL, Schrieber SJ, Soule TA, Wen Z, Smith PC, Reddy KR, Wahed AS, Belle SH, Afdhal NH,
Navarro VJ, Berman J, Liu QY, Doo E, and Fried MW; SyNCH Trial Group (2010) Silymarin
Ascending Multiple Oral Dosing Phase I Study In Non-Cirrhotic Patients with Chronic Hepatitis C. J
Clin Pharmacol 50:434-449.
Jain SK, Pemberton PW, Smith A, McMahon RF, Burrows PC, Aboutwerat A, and Warnes TW (2002)
Oxidative stress in chronic hepatitis C: not just a feature of late stage disease. J Hepatol 36:805-811.
Jancova P, Siller M, Anzenbacherova E, Kren V, Anzenbacher P, Simanek V (2011) Evidence for
differences in regioselective and stereoselective glucuronidation of silybin diastereomers from milk
This article has not been copyedited and formatted. The final version may differ from this version.DMD Fast Forward. Published on August 24, 2011 as DOI: 10.1124/dmd.111.040212
at ASPE
T Journals on January 28, 2022
dmd.aspetjournals.org
Dow
nloaded from

DMD #40212
30
thistle (Silybum marianum) by human UDP-glucuronosyltransferases. Xenobiotica 0:1-9.
(doi:10.3109/00498254.2011.573017)
Kim NC, Graf TN, Sparacino CM, Wani MC, and Wall ME (2003) Complete isolation and
characterization of silybins and isosilybins from milk thistle (Silybum marianum). Org Biomol Chem
1:1684-1689.
Koruk M, Taysi S, Savas MC, Yilmaz O, Akcay F, and Karakok M (2004) Oxidative stress and
enzymatic antioxidant status in patients with nonalcoholic steatohepatitis. Ann Clin Lab Sci 34:57-62.
Lang I (2006) Phase I/II clinical trial to explore silymarin in chronic liver diseases. Gastroenterology
and Hepatology News 131:990.
Leslie EM, Deeley RG, and Cole SP (2005) Multidrug resistance proteins: role of P-glycoprotein,
MRP1, MRP2, and BCRP (ABCG2) in tissue defense. Toxicol Appl Pharmacol 204:216–237.
Lickteig AJ, Fisher CD, Augustine LM, Aleksunes LM, Besselsen DG, Slitt AL, Manautou JE, and
Cherrington NJ (2007) Efflux transporter expression and acetaminophen metabolite excretion are altered
in rodent models of nonalcoholic fatty liver disease. Drug Metab Dispos 35:1970-1978.
This article has not been copyedited and formatted. The final version may differ from this version.DMD Fast Forward. Published on August 24, 2011 as DOI: 10.1124/dmd.111.040212
at ASPE
T Journals on January 28, 2022
dmd.aspetjournals.org
Dow
nloaded from

DMD #40212
31
Little JM, Williams L, Xu J, and Radominska-Pandya A (2002) Glucuronidation of the dietary fatty
acids, phytanic acid and docosahexaenoic acid, by human UDP-glucuronosyltransferases. Drug Metab
Dispos 30:531-533.
Medina J and Moreno-Otero R (2005) Pathophysiological basis for antioxidant therapy in chronic liver
disease. Drugs 65:2445-2461.
Miranda SR, Lee JK, Brouwer KL, Wen Z, Smith PC, and Hawke RL (2008) Hepatic metabolism and
biliary excretion of silymarin flavonolignans in isolated perfused rat livers: role of multidrug resistance-
associated protein 2 (abcc2). Drug Metab Dispos 36:2219-2226.
Ogasawara K, Terada T, Katsura T, Hatano E, Ikai I, Yamaoka Y, and Inui K (2010) Hepatitis C virus-
related cirrhosis is a major determinant of the expression levels of hepatic drug transporters. Drug Metab
Pharmacokinet 25:190-199.
Richardson TA, Sherman M, Kalman D, and Morgan ET (2006) Expression of UDP-
glucuronosyltransferase isoform mRNAs during inflammation and infection in mouse liver and kidney.
Drug Metab Dispos 34:351-353.
Schinkel AH and Jonker JW (2003) Mammalian drug efflux transporters of the ATP binding cassette
(ABC) family: an overview. Adv Drug Deliv Rev 55:3-29.
This article has not been copyedited and formatted. The final version may differ from this version.DMD Fast Forward. Published on August 24, 2011 as DOI: 10.1124/dmd.111.040212
at ASPE
T Journals on January 28, 2022
dmd.aspetjournals.org
Dow
nloaded from
DMD #40212
32
Schrieber SJ, Wen Z, Vourvahis M, Smith PC, Fried MW, Kashuba AD, and Hawke RL (2008) The
pharmacokinetics of silymarin is altered in patients with hepatitis C virus and nonalcoholic Fatty liver
disease and correlates with plasma caspase-3/7 activity. Drug Metab Dispos 36:1909-1916.
Sookoian S, Castaño G, Gianotti TF, Gemma C, and Pirola CJ (2009) Polymorphisms of MRP2
(ABCC2) are associated with susceptibility to nonalcoholic fatty liver disease. J Nutr Biochem 20:765-
770.
Strader DB, Bacon BR, Lindsay KL, La Brecque DR, Morgan T, Wright EC, Allen J, Khokar MF,
Hoofnagle JH, and Seeff LB (2002) Use of complementary and alternative medicine in patients with
liver disease. Am J Gastroenterol 97:2391-2397.
Sridar C, Goosen TC, Kent UM, Williams JA, and Hollenberg PF (2004) Silybin inactivates
cytochromes P450 3A4 and 2C9 and inhibits major hepatic glucuronosyltransferases. Drug Metab
Dispos 32:587-594.
Trauner M, Wagner M, Fickert P, and Zollner G (2005) Molecular regulation of hepatobiliary transport
systems: clinical implications for understanding and treating cholestasis. J Clin Gastroenterol 39:S111-
24.
This article has not been copyedited and formatted. The final version may differ from this version.DMD Fast Forward. Published on August 24, 2011 as DOI: 10.1124/dmd.111.040212
at ASPE
T Journals on January 28, 2022
dmd.aspetjournals.org
Dow
nloaded from

DMD #40212
33
Wagner M, Halilbasic E, Marschall HU, Zollner G, Fickert P, Langner C, Zatloukal K, Denk H, and
Trauner M (2005) CAR and PXR agonists stimulate hepatic bile acid and bilirubin detoxification and
elimination pathways in mice. Hepatology 42:420-430.
Wen Z, Dumas TE, Schrieber SJ, Hawke RL, Fried MW, and Smith PC (2008) Pharmacokinetics and
metabolic profile of free, conjugated, and total silymarin flavonolignans in human plasma after oral
administration of milk thistle extract. Drug Metab Dispos 36:65-72.
Wu C-P, Calcagno AM, Hladky SB, Ambudkar SV, and Barrand MA (2005) Modulatory effects of
plant phenols on human multidrug-resistance proteins 1, 4 and 5 (ABCC1, 4 and 5). FEBS Journal
272:4725-4740.
Yamashita A, Nagatsuka T, Watanabe M, Kondo H, Sugiura T, and Waku K (1997) Inhibition of UDP-
glucuronosyltransferase activity by fatty acyl-CoA. Kinetic studies and structure-activity relationship.
Biochem Pharmacol 53:561-570.
Zelcer N, van de Wetering K, de Waart R, Scheffer GL, Marschall HU, Wielinga PR, Kuil A, Kunne C,
Smith A, van der Valk M, Wijnholds J, Elferink RO, and Borst P (2006) Mice lacking Mrp3 (Abcc3)
have normal bile salt transport, but altered hepatic transport of endogenous glucuronides. J Hepatol
44:768-775.
This article has not been copyedited and formatted. The final version may differ from this version.DMD Fast Forward. Published on August 24, 2011 as DOI: 10.1124/dmd.111.040212
at ASPE
T Journals on January 28, 2022
dmd.aspetjournals.org
Dow
nloaded from
DMD #40212
34
Footnote
This was an investigator-initiated trial, and Rottapharm|Madaus had no direct or indirect
involvement in the design of the trial, data collection, preparation, or submission of the manuscript for
this registered (http://clinicaltrials.gov/ct2/show/NCT00389376) investigator-initiated trial. None of the
authors have a personal conflict of interest with the manufacturer of any of the marketed silymarin
formulations.
This research was supported from the cooperative agreements from the National Institutes of
Health, National Center for Complementary and Alternative Medicine [Grants UO1 AT003571, UO1
AT003560, UO1 AT003573, UO1 AT003566, UO1 AT003574], with co-funding from the National
Institute of Diabetes and Digestive and Kidney Diseases; and from the General Clinical Research
Centers program of the Division of Research Resources [Grant RR00046]. In addition, Rottapharm /
Madaus, Italy, provided silymarin and placebo and partly funded the trial.
Address requests for reprints to: Roy L. Hawke, PharmD, PhD, Clinical Assistant Professor,
Division of Pharmacotherapy and Experimental Therapeutics, UNC Eshelman School of Pharmacy, CB
#7360, Kerr Hall Rm 3310, University of North Carolina at Chapel Hill, Chapel Hill, NC 27599-7360.
Email: [email protected].
1Current affiliation: US Food and Drug Administration (FDA), Silver Spring, MD. No official
endorsement by the FDA is intended or should be inferred.
This article has not been copyedited and formatted. The final version may differ from this version.DMD Fast Forward. Published on August 24, 2011 as DOI: 10.1124/dmd.111.040212
at ASPE
T Journals on January 28, 2022
dmd.aspetjournals.org
Dow
nloaded from
DMD #40212
35
Figure Legends
Figure 1. Steady-state plasma concentration vs. time profiles for silybin B conjugates and parent
silybin B (inset) at 280 mg silymarin in HCV (●) and NALFD (□) subjects.
48-hour plasma samples were obtained after a final single dose administration following an every 8 hour
x 7 day dose regimen. AUC0-8h and Cmax for silybin B conjugates were 46% and 42% lower,
respectively, in NAFLD subjects compared to HCV subjects, p < 0.05.
Figure 2. Maximum steady-state plasma concentrations for silymarin flavonolignans at 560 mg
silymarin in HCV (■) and NAFLD (□) subjects.
Plasma concentrations of isosilybin A, isosilybin B, silychristin, and silydianin were significantly
greater in NAFLD subjects compared to HCV subjects. Silychristin and silydianin were not detected in
the plasma of HCV subjects.
Figure 3. Steady-state plasma concentration vs. time profiles for silymarin flavonolignans at 560
mg silymarin in HCV and NAFLD subjects.
48-hour plasma samples were obtained after a final single dose administration following an every 8 hour
x 7 day dose regimen. Evidence of enterohepatic recycling of flavonolignans by the appearance of
secondary peaks was observed in NAFLD subjects (–), while no evidence of enterohepatic recycling for
silybin A or silybin B was observed in HCV subjects (--). In addition to silybin A and silybin B,
silychristin (▲) represented a major flavonolignan in NAFLD subjects. For presentation clarity, error
bars were not included.
This article has not been copyedited and formatted. The final version may differ from this version.DMD Fast Forward. Published on August 24, 2011 as DOI: 10.1124/dmd.111.040212
at ASPE
T Journals on January 28, 2022
dmd.aspetjournals.org
Dow
nloaded from

DMD #40212
36
Table I. Subject baseline demographics.
Group and Cohort
HCV NAFLD
280 mg* 560 mg 280 mg 560 mg
Male : Female, n 8:4 5:1 3:3 2:4
White : Black, n 10:2 4:2 6:0 6:0
Age, years 50 (44, 59) 51 (43, 54) 51 (28, 58) 48 (28, 52)
Weight, kg 92 (67, 99) 104 (86, 123) 104 (79.0, 150) 101 (78.2, 143)
BMI, kg/m2 28 (25, 42) 33 (26, 41) 38 (27, 42) 38 (27, 43)
Total bilirubin,
mg/dl
0.8 (0.3, 1.0) 0.6 (0.3, 1.4) 0.6 (0.3, 1.1) 0.5 (0.3, 2.6)
ALT, U/L 95 (58, 288) 113 (81, 214) 99 (52, 322) 104 (77, 115)
AST, U/L 64 (43, 271) 89 (46, 110) 60 (38, 325) 66 (54, 104)
Platelets, cells/mm3 208 (177, 327) 192 (150, 225) 275 (157, 341) 282 (162, 319)
*Two cohorts of 6 subjects were used to study single and multiple dose pharmacokinetics. Data
are presented as medians (minimum, maximum). BMI, body mass index.
This article has not been copyedited and formatted. The final version may differ from this version.DMD Fast Forward. Published on August 24, 2011 as DOI: 10.1124/dmd.111.040212
at ASPE
T Journals on January 28, 2022
dmd.aspetjournals.org
Dow
nloaded from

DMD #40212
37
Table II. Single dose pharmacokinetics of parent silybin A and silybin B.
Single Dose Pharmacokinetics a
Flavonolignan SA SB
Cohort PK Parameter HCV NAFLD HCV NAFLD
280 mg
AUC0-48h
(ng●hr/ml)
201 (115, 338) 228 (75, 469) b 93 (15, 188) c 80 (70, 91) b
Cmax (ng/ml) 78 (32, 147) 82 (35, 153) b 27 (8, 50) c 30 (16, 53) b
Tmax (hr) 2.0 (1.0, 4.0) c 2.0 (1.0, 6.0) b 3.0 (1.0, 4.0) c 2.0 (2.0, 6.0) b
T1/2 (hr) 1.3 (0.7, 2.0) 1.8 (-2.2, 7.6) 0.9 (-0.9, 6.3) c 1.8 (-1.6, 6.6)
560 mg
AUC0-48h
(ng●hr/ml)
557 (470, 657) 859 (508, 1397) 125 (94, 160) b
┼
261 (164, 395)
Cmax (ng/ml) 192 (147, 250) 275 (127, 491) 58 (31, 92) b 93 (55, 145)
Tmax (hr) 1.5 (1.0, 4.0) 2.7 (1.5, 4.0) 1.5 (0.5, 4.0) b 2.7 (1.0, 4.0)
T1/2 (hr) 1.4 (0.9, 2.1) 1.4 (0.8, 2.3) 1.1 (0.7, 1.7) b 1.5 (0.6, 2.9)
a Results are shown as geometric mean (95% confidence interval), except for Tmax which is shown as
median (minimum, maximum). Data are for N=6 subjects.
b N=5
c N=4
┼ p < 0.05
This article has not been copyedited and formatted. The final version may differ from this version.DMD Fast Forward. Published on August 24, 2011 as DOI: 10.1124/dmd.111.040212
at ASPE
T Journals on January 28, 2022
dmd.aspetjournals.org
Dow
nloaded from

DMD #40212
38
Table III. Steady-state pharmacokinetics of silybin A and silybin B.
Steady-State Pharmacokinetics a
Group SA SB
Cohort PK Parameter HCV NAFLD HCV NAFLD
280 mg
AUC0-8h
(ng●hr/ml)
370 (279, 480) 317 (191, 499) 86 (66, 109) 123 (53, 219) b
Cmax (ng/ml) 143 (78, 242) 133 (60, 262) 45 (28, 72) 64 (30, 111) b
Tmax (hr) 1.8 (1.0, 4.0) 1.3 (0.5, 4.4) 1.5 (0.5, 4.0) 1.2 (0.5, 2.0) b
T1/2 (hr) 1.1 (0.7, 1.6) 1.1 (0.3, 2.6) 0.7 (0.4, 1.2) b 0.9 (0.2, 2.1) b
560 mg AUC0-8h
(ng●hr/ml)
729 (371, 1195) 1166 (589, 2128) 149 (40, 310) 376 (161, 759)
Cmax (ng/ml) 308 (104, 620) 448 (255, 724) 86 (26, 186) 187 (93, 332)
Tmax (hr) 1.5 (1.5, 2.0) 3.0 (0.5, 4.0) 1.5 (1.5, 2.0) 3 (0.5, 4.0)
T1/2 (hr) 1.3 (0.9, 1.9) 1.0 (0.6, 1.6) 1.1 (0.3, 2.2) 0.7 (0.4, 1.0)
a Results are shown as geometric mean (95% confidence interval), except for Tmax which is shown as
median (minimum, maximum). Data are for N=6 subjects, except for the HCV 560 mg steady-state
cohort where N=5, one subject was dropped from the pharmacokinetic analysis due to incorrect dosing
for pharmacokinetic sampling at steady-state on day 8.
b N=5
This article has not been copyedited and formatted. The final version may differ from this version.DMD Fast Forward. Published on August 24, 2011 as DOI: 10.1124/dmd.111.040212
at ASPE
T Journals on January 28, 2022
dmd.aspetjournals.org
Dow
nloaded from

DMD #40212
39
Table IV. Single dose pharmacokinetics of silybin A conjugates and silybin B
conjugates.
Single Dose Pharmacokinetics a
Group SAconjugates SBconjugates
Cohort PK Parameter HCV NAFLD HCV NAFLD
280 mg AUC0-48h
(ng●hr/ml)
1327 (860,
1925)
1003 (672,
1456)
4094(2465,
6308)
3120 (2247,
4233)
Cmax (ng/ml) 144 (96, 205) 80 (45, 125) 586 (441,
762)
388 (266,
544)
Tmax (hr) 2 (1.5, 4.0) 4.0 (2.0, 12.0) 2.0 (1.5, 4.0) 3.0 (2.0, 8.0)
T1/2 (hr) 5.7 (4.0, 7.7) 6.4 (4.5, 9.0) 4.3 (3.1, 5.6) 4.5 (2.5, 7.2)
560 mg AUC0-48h
(ng●hr/ml)
3468 (1747,
6024)
2844 (1493,
4779)
12760 (6505,
22432)
7850 (4501,
12664)
Cmax (ng/ml) 339 (169,
621)
278 (126,
488)
1691 (1003,
2774)
1125 (805,
1570)
Tmax (hr) 3.0 (2.0, 4.0) 4.0 (4.0, 6.2) 4.0 (1.0, 4.0) 3.0 (1.5, 6.0)
T1/2 (hr) 6.6 (4.5, 9.2) 7.0 (5.0, 9.7) 4.7 (3.7, 6.0) 6.2 (3.3, 10.3)
a Results are shown as geometric means (95% confidence interval), except for Tmax which is
shown as median (minimum, maximum). Data are for N=6 subjects.
This article has not been copyedited and formatted. The final version may differ from this version.DMD Fast Forward. Published on August 24, 2011 as DOI: 10.1124/dmd.111.040212
at ASPE
T Journals on January 28, 2022
dmd.aspetjournals.org
Dow
nloaded from

DMD #40212
40
Table V. Steady-state pharmacokinetics of silybin A conjugates and silybin B conjugates.
Steady-State Pharmacokinetics a
Group SAconjugates SBconjugates
Cohort PK Parameter HCV NAFLD HCV NAFLD
280 mg AUC0-8h
(ng●hr/ml)
2048 (1465,
2815)
1297 (652,
2271)
7278 (5633,
9287) ┼
3962 (2338,
6292)
Cmax (ng/ml) 369 (294,
459) ┼
233 (146,
352)
1294 (1040,
1589) ┼
750 (563, 981)
Tmax (hr) 2 (1, 4) 2 (0, 4) 2 (1, 4) 1.8 (0, 2)
T1/2 (hr) 5 (3, 8.3) 6.8 (2.5, 15.5) 4.3 (2.8, 6.3) 5.1 (1.2, 12.7)
560 mg AUC0-8h
(ng●hr/ml)
3229 (1618,
5348)
2902 (1403,
5163)
11003 (3244,
21930)
7745 (4312,
12547)
Cmax (ng/ml) 543 (182,
1050)
529 (287,
894)
2074 (700,
4103)
1592 (927,
2600)
Tmax (hr) 2 (0, 4) 4 (0, 6) 2 (2, 4) 3 (0, 4)
T1/2 (hr) 6.2 (3.6, 9.3) 3.6 (2.7, 4.7) 4.1 (2.9, 5.6) 2.8 (1.9, 3.9)
a Results are shown as geometric means (95% confidence interval), except for Tmax which is
shown as median (minimum, maximum). Data are for N=6 subjects, except for the HCV 560
mg steady-state cohort where N=5; one subject was dropped from the pharmacokinetic analysis
due to incorrect dosing for pharmacokinetic sampling at steady-state on day 8.
┼ p < 0.05
This article has not been copyedited and formatted. The final version may differ from this version.DMD Fast Forward. Published on August 24, 2011 as DOI: 10.1124/dmd.111.040212
at ASPE
T Journals on January 28, 2022
dmd.aspetjournals.org
Dow
nloaded from

This article has not been copyedited and formatted. The final version may differ from this version.DMD Fast Forward. Published on August 24, 2011 as DOI: 10.1124/dmd.111.040212
at ASPE
T Journals on January 28, 2022
dmd.aspetjournals.org
Dow
nloaded from

This article has not been copyedited and formatted. The final version may differ from this version.DMD Fast Forward. Published on August 24, 2011 as DOI: 10.1124/dmd.111.040212
at ASPE
T Journals on January 28, 2022
dmd.aspetjournals.org
Dow
nloaded from
This article has not been copyedited and formatted. The final version may differ from this version.DMD Fast Forward. Published on August 24, 2011 as DOI: 10.1124/dmd.111.040212
at ASPE
T Journals on January 28, 2022
dmd.aspetjournals.org
Dow
nloaded from