Embed Size (px)
Citation preview

Stormwater Management Report City of Peterborough P-20-12 – Parkway Corridor Class Environmental Assessment Clonsilla Avenue to Parkhill Road West D.M. Wills Project No. 12-5061 D.M. Wills Associates Limited PARTNERS IN ENGINEERING Peterborough North Bay
Revised January 2014 December 2013 Prepared for: City of Peterborough Otonabee Region Conservation Authority
Table of Contents
1.0 Purpose ............................................................................................................................. 1
2.0 Site Description ................................................................................................................. 3
3.0 Methodology .................................................................................................................... 5
3.1 Medical Drive .................................................................................................................... 5
3.2 Stormwater Management Plan ..................................................................................... 6
4.0 Stormwater Management ............................................................................................. 11
4.1 Stormwater Quality Control .......................................................................................... 11
4.1.1 Stormwater Management Wet Pond Facility .................................................... 12
4.1.2 Stormwater Management Oil / Grit Separator .................................................. 13
4.2 Stormwater Quantity Control ....................................................................................... 15
4.2.1 Byersville Creek – Wet Pond Facility ..................................................................... 15
4.2.2 Kinsmen Park – Uncontrolled ................................................................................. 20
4.3 Hydraulic Elements ......................................................................................................... 20
4.4 Thermal Mitigation .......................................................................................................... 21
5.0 Conclusion ...................................................................................................................... 22
List of Figures & Tables
Figure 1 – Location Plan ................................................................................................................ 4 Figure 2 – Pre-Development Drainage Area Plan .................................................................. 9 Figure 3 – Post-Development Drainage Area Plan .............................................................. 10 Figure 4 – Post-Development Floodplain Assessment ........................................................ 19
Table 1 – Post-Development Hydrologic Parameters ........................................................... 7 Table 2 – Extended Detention, Wet Pond Features ................................................................. 13 Table 3 – Existing & Proposed Uncontrolled 100 Year Peak Flows – Byersville Creek ...... 16 Table 4 – Existing & Proposed Uncontrolled Peak Flows – Byersville Creek ....................... 16 Table 5 – Stage-Storage-Discharge – Wet Pond Facility .................................................... 17 Table 6 – Existing & Proposed Controlled Peak Flows – Byersville Creek ........................... 18 Table 7 – Existing & Proposed Uncontrolled 100 Yr Peak Flows – Kinsmen Park ............... 20
List of Appendices
Appendix A – Hydrologic Parameters
Appendix B – Quality and Quantity Controls
Appendix C – VO2 Model
Appendix D – Hydraulic Elements

Parkway Environmental Assessment SWM Report – Parkway Corridor – South End
D.M. Wills Associates Limited Page 1 Project No. 12-5061
1.0 Purpose
D.M. Wills Associates Limited (Wills) has been retained by AECOM to provide Drainage and Stormwater Management expertise as part of the project engineering team for The Parkway Corridor Environmental Assessment, in the City of Peterborough. The consultant team is led by AECOM (Engineering Consultant), with the assistance of Wills in the field of Stormwater Management, Drainage and Structural Engineering. The study has proceeded as a Schedule C under the Municipal Class Environmental Assessment (Class EA) process according to the guidelines set out in the Municipal Class EA document (as amended in 2007 and 2011). The purpose for the process is to ensure that municipal infrastructure projects are planned, designed and constructed such that proper consideration is given to the full range of environmental impacts. By adhering to the approved Municipal Class EA guidelines, municipal infrastructure projects will comply with the requirements of the Province’s Environmental Assessment Act. The Municipal Class Environmental Assessment process consists of five phases, which include:
Phase 1 – Problems and Opportunity
Phase 2 – Alternative Solutions
Phase 3 – Alternative Design Concepts for Preferred Solution
Phase 4 – Environmental Study Reports
Phase 5 – Implementation Through the first three (3) phases of the Class EA process, which included discussions with the City of Peterborough, ORCA, stakeholders and the public through four (4) Public Information Sessions (PIC), a preferred solution for The Parkway has been identified. As part of the fourth phase of the Class EA, Drainage and SWM Reports are to be prepared to demonstrate how the implementation of the preferred alternative may proceed without negatively impacting the upstream and downstream lands and watercourses in terms of both water quantity and water quality. Consideration was given to flood potential, erosion, thermal impacts, current and future drainage patterns, infrastructure improvement opportunities, social economic value and aesthetics. This report has been prepared specifically for the City of Peterborough and the Otonabee Region Conservation Authority (ORCA) to address stormwater management issues as part of The Parkway Class EA process.

Parkway Environmental Assessment SWM Report – Parkway Corridor – South End
D.M. Wills Associates Limited Page 2 Project No. 12-5061
The following reports were used as reference to compile the Stormwater Management Reports for The Parkway Class EA:
City of Peterborough – Flood Reduction Master Plan, prepared by UMA / AECOM in April of 2005.
City of Peterborough - Jackson Creek Flood Reduction Master Plan, prepared by AECOM in April of 2010.
Jackson Diversion Project – Hydrology and Hydraulic Model Updates, prepared by AECOM in 2013 (DRAFT).
Byersville/Harper Creek Detailed Flood Reduction Study, prepared by XCG in April of 2007.
Bears Creek Flood Reduction Master Plan, prepared by XCG in February of 2008;
Riverview Creek Detailed Flood Reduction Study, prepared by Greenland International Consulting Ltd., in March of 2009.
Flood Risk Mapping – Otonabee River – Tributary Byersville Creek, prepared by Marshall Macklin Monaghan Limited and Totten Sims Hubicki Associates Limited in March of 1999.
Stormwater Quality Management Master Plan Project Report – prepared by XCG in May of 2013 (DRAFT).
Peterborough Regional Health Centre (PRHC) Access Road – Stormwater Management Report, prepared by D.M. Wills Limited, in March of 2010.
The Stormwater Management component of The Parkway Class EA will be broken down into four (4) individual Stormwater Management Reports. Each of the four (4) reports will correspond to a different outlet location along The Parkway. The four (4) reports include:
Parkway Corridor – Clonsilla Avenue to Parkhill Road West
Parkway Corridor – Jackson Creek, Parkhill Road West to Chemong Road
Parkway Corridor – Sunset Park, Chemong Road to Hilliard Street
Parkway Corridor – Hilliard Street to Water Street This report will focus solely on The Parkway Corridor – Clonsilla Avenue to Parkhill Road West.
Parkway Environmental Assessment SWM Report – Parkway Corridor – South End
D.M. Wills Associates Limited Page 3 Project No. 12-5061
2.0 Site Description
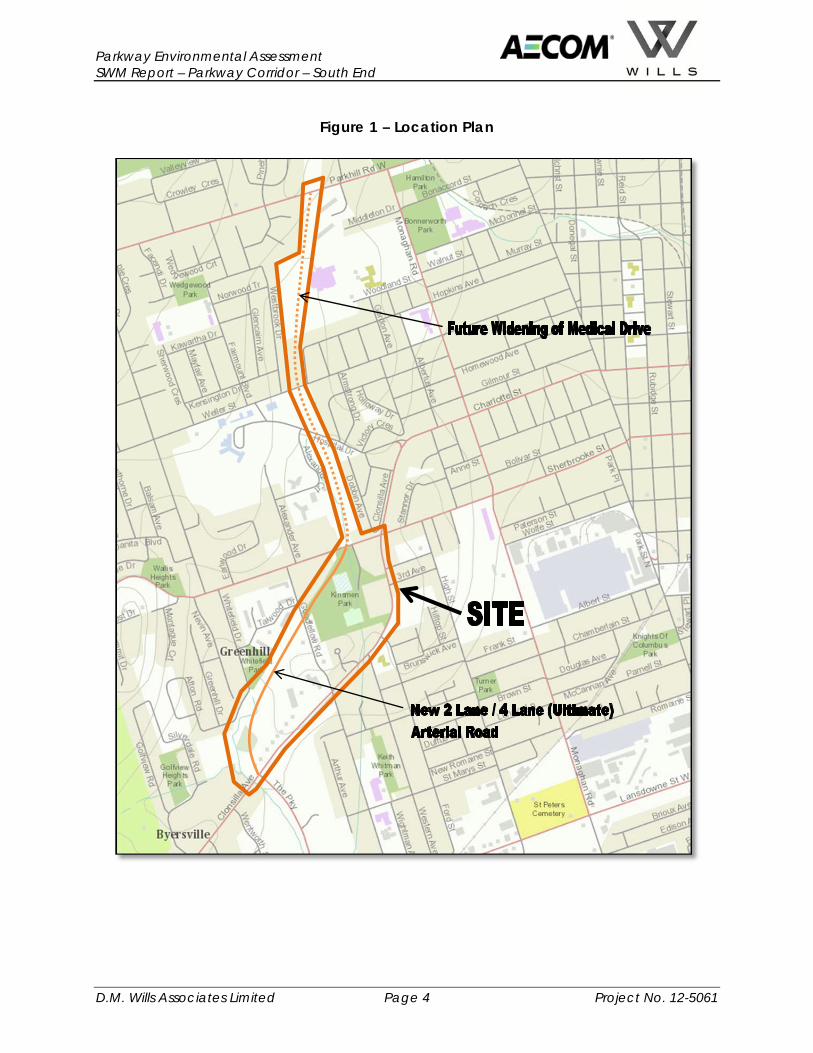
The Parkway Corridor extends from Clonsilla Avenue to Parkhill Road West and accepts drainage from Sherbrooke Street, Goodfellow Road, Whitefield Drive and Medical Drive. The focus of this report is The Parkway Corridor between Clonsilla Avenue and Sherbrooke Street. The location of the Site is shown on Figure 1. The surrounding land use includes mixed residential areas to the north and east, commercial and institutional areas to the south and a tributary to Byersville / Harper Creek to the southwest. The existing Parkway corridor consists primarily of vegetated areas (grass areas) and impervious areas (existing building with asphalt parking area external to The Parkway Corridor). The topography of the property is moderately flat, draining from east to west into Byersville Creek and from north to south into Kinsmen Park. The proposed change in land use includes the removal of vegetated areas to allow for the construction of a four (4) lane arterial road including sidewalks and a multi-use trail system. The proposed development will introduce new impervious surfaces and therefore alter the runoff rate leaving the site and impact downstream stormwater quantity and quality. The location and elevation of existing site features were determined based on 0.5 m contour information, obtained from the City of Peterborough which were also used to determine drainage patterns and to establish the proposed grades. The Flood Reduction Master Plan (UMA / AECOM, 2005) and the Byersville/Harper Creek Detailed Flood Reduction Study (XCG, 2007) were also used to help define catchment boundaries and drainage patterns.
Parkway Environmental Assessment SWM Report – Parkway Corridor – South End
D.M. Wills Associates Limited Page 4 Project No. 12-5061
Figure 1 – Location Plan
Parkway Environmental Assessment SWM Report – Parkway Corridor – South End
D.M. Wills Associates Limited Page 5 Project No. 12-5061
3.0 Methodology
The present hierarchy of watershed planning in Ontario can be described by the following descending order: Watershed Plans, Sub-watershed Plans and individual Stormwater Management Plans. The Parkway Corridor between Clonsilla Avenue to Parkhill Road West is contained within the study area of the Byersville/Harper Creek Flood Reduction Study (XCG, 2007). The following recommendations have been made for this area or areas to which runoff from The Parkway will contribute:
Construct a new Regional facility for peak flows attenuation on the west side of The Parkway Corridor, south of Clonsilla.
Create a constructed enhanced wetland to provide enhanced water quality control within The Parkway Corridor, north of Clonsilla.
The lands intended for the recommended Regional facility are beyond the limits of this study and address a significantly larger contributing area than just those under current consideration. As such, the Regional Facility was not explored in detail, but the current recommended alternative will allow for this initiative as a future project. It is likely that the Regional Facility will utilize the full extent of the available lands, regardless of the recommended stormwater management strategy for The Parkway Corridor, in order to maximize the potential for flood reduction within the Byersville Creek Watershed. Unfortunately, the preferred alternative for The Parkway Corridor traverses the land recommended for the proposed enhanced wetland and therefore will become unfeasible to implement. There may be an opportunity to relocate the enhanced wetland on the 2.86 ha parcel of land to the west of The Parkway Corridor at 960 Whitefield Drive. The Regulatory Floodplain of Byersville Creek should be considered if the proposed wetland is to be relocated to this parcel of land. Additional recommendations for quality and quantity treatment are provided within the Byersville/Harper Creek Flood Reduction Study (XCG, 2007). The City of Peterborough is also currently developing a Stormwater Quality Management Master Plan (SWQMMP) for the entire City. It is anticipated the SWQMMP will recommend quality treatment be provided for the Byersville / Harper Creek watershed.
3.1 Medical Drive
The preferred alternative includes the future expansion of Medical Drive from two (2) lanes to four (4) lanes. The current configuration of Medical Drive outlets into one (1) of two (2) Dry Pond facilities located to the east of Medical Drive and north of Sherbrooke Street. These dry pond facilities were envisioned as part of the Byersville/Harper Creek Flood Reduction Study (XCG, 2007) to alleviate frequent flooding concerns. The detailed design of the two (2) dry pond facilities is outlined in the PRHC Access Road Stormwater Management Report (Wills, 2010).

Parkway Environmental Assessment SWM Report – Parkway Corridor – South End
D.M. Wills Associates Limited Page 6 Project No. 12-5061
The design of the two (2) facilities, located to the east of Medical Drive and north of Sherbrooke Street was based on providing the maximum storage possible in the space allotted and controlling runoff from approximately 110 ha of contributing lands based on the downstream capacity of the existing storm sewer system. As a result, the two (2) ponds substantially overcompensated for the construction of the two (2) lane Medical Drive. The overcompensation provided by the dry pond facilities far outweighs the expected increase in flow generated from expansion of Medical Drive from two (2) lanes to four (4) lanes. Therefore, an additional analysis of the two (2) dry ponds for the purpose of Quantity Control will not be considered as part of this report. Quality controls were incorporated into the design of the two (2) Dry Ponds in the form of a flat, vegetated channel through the ponds. A wet pond facility for enhanced quality control was not envisioned at this location because all available storage was prioritized for flood reduction. It is expected that sediment within the effluent of the two (2) ponds would re-suspend within the significant length of storm sewer downstream of the ponds. Therefore, an additional analysis of Medical Drive for the purpose of Quality Control will not be considered as part of this report. As part of the alteration to Medical Drive, a small watercourse on the west side of Medical Drive between Alexander Court and Hospital Drive has been identified; however it will not be affected as part of the reconstruction.
3.2 Stormwater Management Plan
Ultimately, the proposed Parkway Corridor between Clonsilla Avenue to Parkhill Road West was prepared as an individual Stormwater Management Plan. The following list summarizes the design strategy:
Provide stormwater quantity control by maintaining post-development flows at or below pre-development levels.
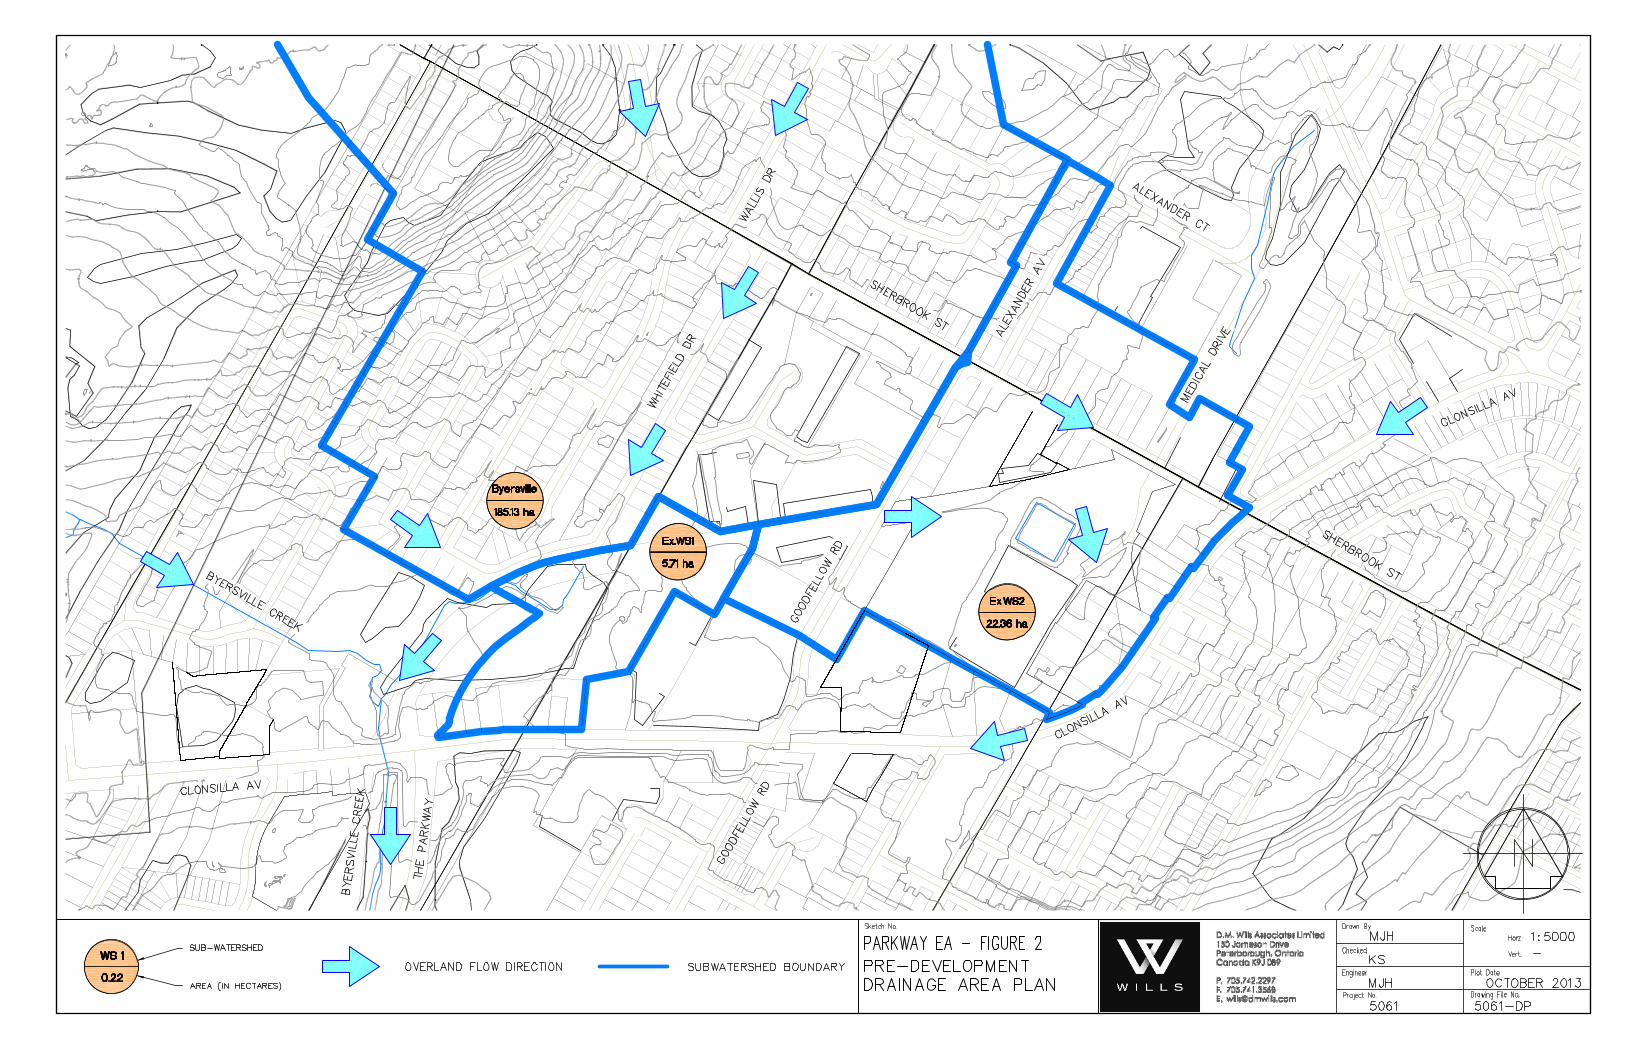
Provide water quality control to Enhanced (Level 1) protection. For the pre-development condition, the entire site was analyzed as two (2) catchment areas based on the existing topography of the site. The existing catchments are shown on Figure 2 and includes:
Catchment area Ex.WS1 includes the lands draining to The Parkway Corridor and outleting to the tributary to Byersville / Harper Creek. The catchment is comprised primarily of vegetated areas (grass) and impervious areas (buildings and asphalt). The catchment slopes moderately from east to west from approximately 150 m west of Goodfellow Road.
Catchment area Ex.WS2 includes the lands draining to The Parkway Corridor outleting to a storm sewer inlet adjacent to the entrance to the Kinsmen Civic Centre. The catchment is comprised primarily of vegetated areas (grass) and impervious areas (buildings and asphalt). The catchment slopes moderately from north to south, from the intersection of Alexander Avenue and Alexander
Parkway Environmental Assessment SWM Report – Parkway Corridor – South End
D.M. Wills Associates Limited Page 7 Project No. 12-5061
Crescent to a storm sewer connection within Kinsmen Park. This section of sewer ultimately discharges into Byersville / Harper Creek.
For the post-development condition, the two (2) existing catchment areas will be redistributed based on the proposed grading intent of the site. The proposed catchment areas are shown on Figure 3 and include:
Catchment area WS101 includes the lands draining to The Parkway Corridor and outleting to the tributary to Byersville / Harper Creek. The catchment is comprised primarily of vegetated areas (grass) and impervious areas (buildings and asphalt). This catchment is derived from the existing catchment Ex.WS1 and includes additional impervious areas from the four (4) lane roadway within The Parkway Corridor. The catchment slopes moderately from east to west from Goodfellow Road and into a proposed stormwater management facility before outleting to the tributary of Byersville / Harper Creek.
Catchment area WS201 includes the lands draining to The Parkway Corridor outleting to a storm sewer inlet adjacent to the entrance to the Kinsmen Civic Centre. The catchment is comprised primarily of vegetated areas (grass) and impervious areas (buildings and asphalt). This catchment is derived from the existing catchment Ex.WS2 and includes additional impervious areas from the four (4) lane roadway within The Parkway Corridor. The catchment slopes moderately from north to south, from the intersection of Alexander Avenue and Alexander Crescent to a storm sewer connection within Kinsmen Park. This section of sewer ultimately discharges into Byersville / Harper Creek.
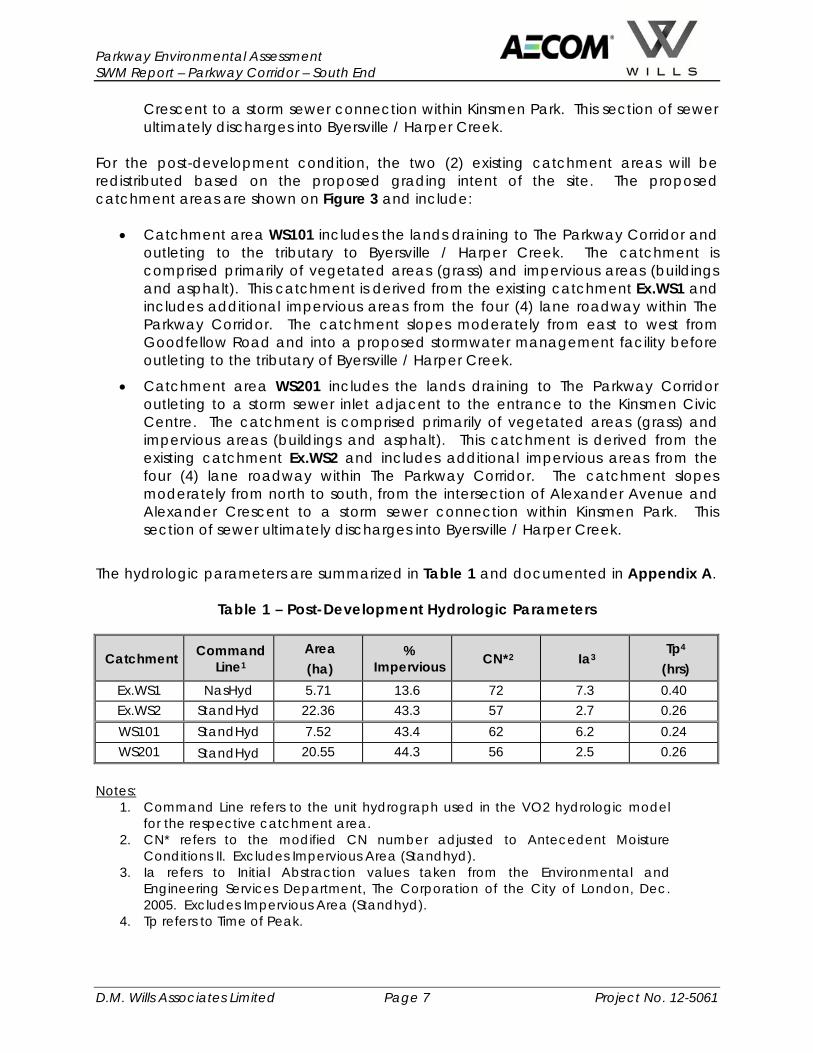
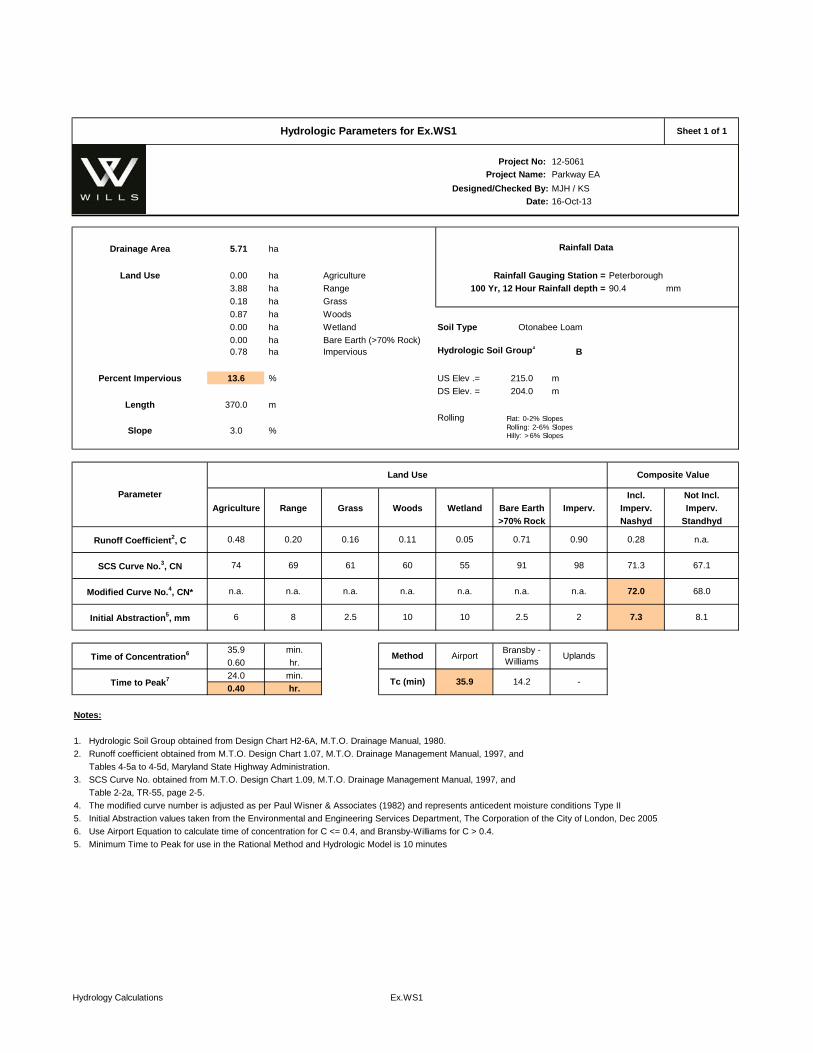
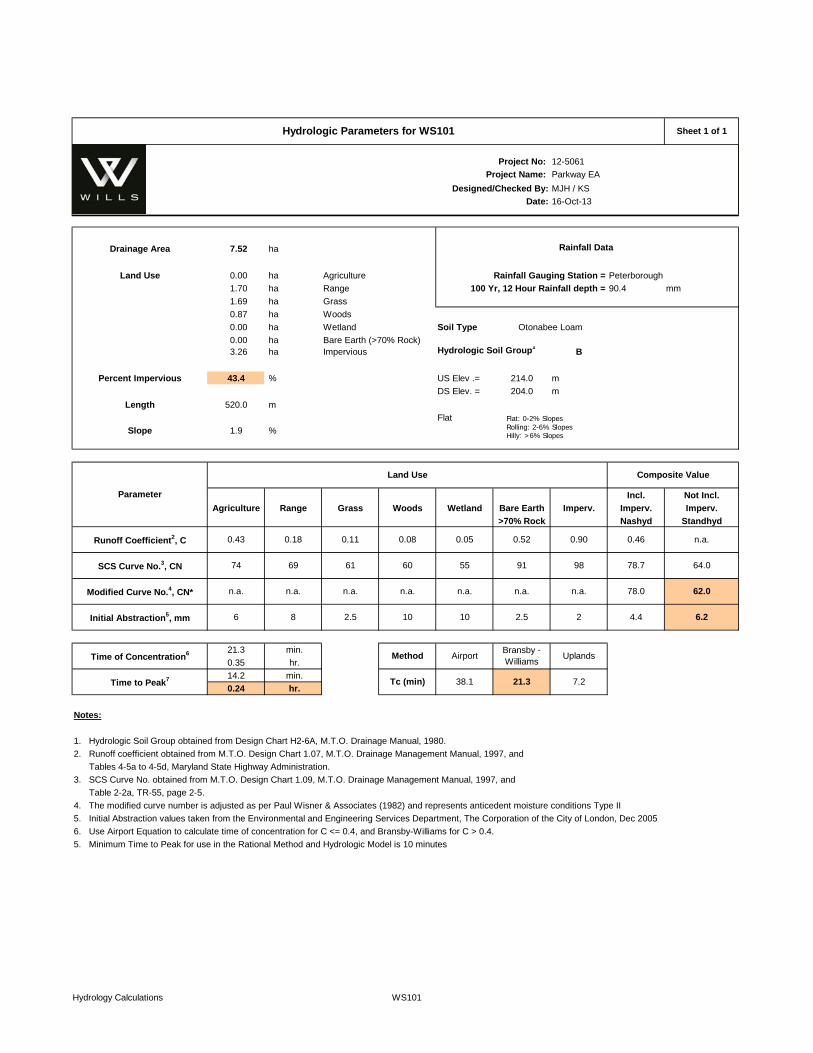
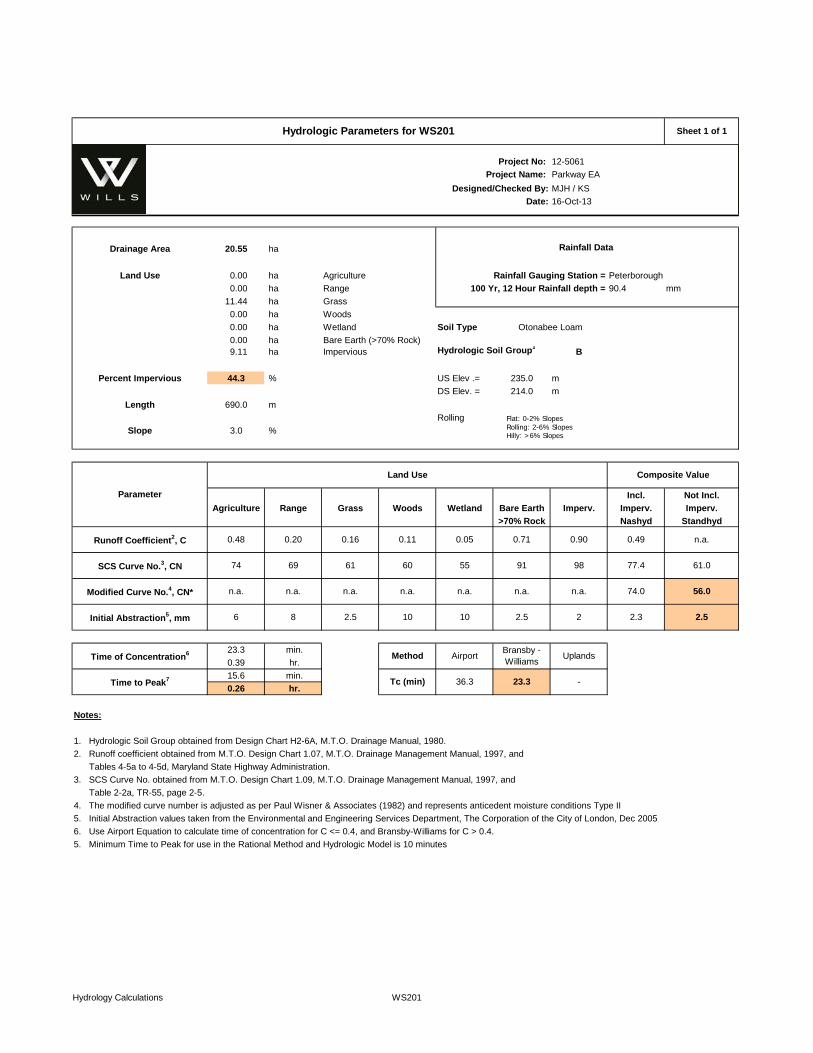
The hydrologic parameters are summarized in Table 1 and documented in Appendix A.
Table 1 – Post-Development Hydrologic Parameters
Catchment Command Line1
Area (ha)
% Impervious CN*2 Ia3
Tp4 (hrs)
Ex.WS1 NasHyd 5.71 13.6 72 7.3 0.40 Ex.WS2 StandHyd 22.36 43.3 57 2.7 0.26 WS101 StandHyd 7.52 43.4 62 6.2 0.24 WS201 StandHyd 20.55 44.3 56 2.5 0.26
Notes:
1. Command Line refers to the unit hydrograph used in the VO2 hydrologic model for the respective catchment area.
2. CN* refers to the modified CN number adjusted to Antecedent Moisture Conditions II. Excludes Impervious Area (Standhyd).
3. Ia refers to Initial Abstraction values taken from the Environmental and Engineering Services Department, The Corporation of the City of London, Dec. 2005. Excludes Impervious Area (Standhyd).
4. Tp refers to Time of Peak.

Parkway Environmental Assessment SWM Report – Parkway Corridor – South End
D.M. Wills Associates Limited Page 8 Project No. 12-5061
Hydrologic parameters such as soil infiltration properties, land use and runoff response were determined based on a literature review of reference materials as well as City of Peterborough and ORCA design standards. Topographic mapping and AutoCAD Civil 3D 2012 software were used to establish sub-watershed area, land use and slope. Rainfall data for the site is taken from the City of Peterborough and is included in Appendix A. Hydrology within this report is preliminary only, and is meant to give a preliminary assessment of the flows in and around The Parkway Corridor consistent with a preliminary design level of detail. Final hydrology will be revised during the detailed design phase of the project and may be adjusted accordingly.


Parkway Environmental Assessment SWM Report – Parkway Corridor – South End
D.M. Wills Associates Limited Page 11 Project No. 12-5061
4.0 Stormwater Management
4.1 Stormwater Quality Control
The construction of a new four (4) lane arterial road including sidewalk and multi-use trial will result in increased stormwater runoff, which may cause additional pollutants to be conveyed off-site. To address this a series of measures to improve stormwater quality will be required. The selection and sizing of the water quality measures will be based on the procedures set out in the Stormwater Management Planning and Design Manual (MOE, March 2003) for Enhanced (Level 1) protection. According to the Ministry of Environment (MOE) SWMP Planning and Design Manual, the goal of stormwater management is to preserve the natural hydrologic cycle. The manual also states that stormwater management measures should be assessed in the following order:
Stormwater lot level controls
Stormwater conveyance controls
End-of-pipe stormwater management facilities
Stormwater lot level controls represent measures, which are implemented at the individual lot level (soak-a-way pits, flatter grading, etc.). Stormwater conveyance controls represent the conveyance systems used to transport stormwater runoff from the lots to the receiving waters (pervious pipes, grassed swales, etc.). End-of-pipe stormwater management facilities represent the common urban stormwater management measures used to service numerous lots or whole subdivisions (wet ponds, wetlands, infiltration basins, etc.). Through The Parkway Class EA process, end-of-pipe quality controls were determined to be the most reasonable measures to address stormwater quality treatment within The Parkway Corridor. A review of the various controls was completed including but not limited to:
Wet ponds and wetlands
Dry ponds
Infiltration basins / infiltration trenches
Bio-retention swales
Filter strips
Sand filters
Underground storage
Oil/grit separators

Parkway Environmental Assessment SWM Report – Parkway Corridor – South End
D.M. Wills Associates Limited Page 12 Project No. 12-5061
The preferred solution was selected based on the size of the catchment being treated and land restrictions within the corridor, which indicates that a stormwater management wet pond facility, in conjunction with an Oil / Grit Separator (OGS), are the most feasible stormwater quality control measures for this portion of The Parkway Corridor. Surface runoff generated by catchment area WS101 will discharge directly into, and be controlled by, a stormwater management wet pond facility. The wet pond facility will discharge directly into Byersville Creek. Surface runoff generated by the developed portion catchment area WS201 will discharge uncontrolled through an OGS before outleting into a storm sewer connection within Kinsmen Park. Quality treatment will be provided for the area of new construction within The Parkway Corridor, sub-catchment area OGA201.
4.1.1 Stormwater Management Wet Pond Facility
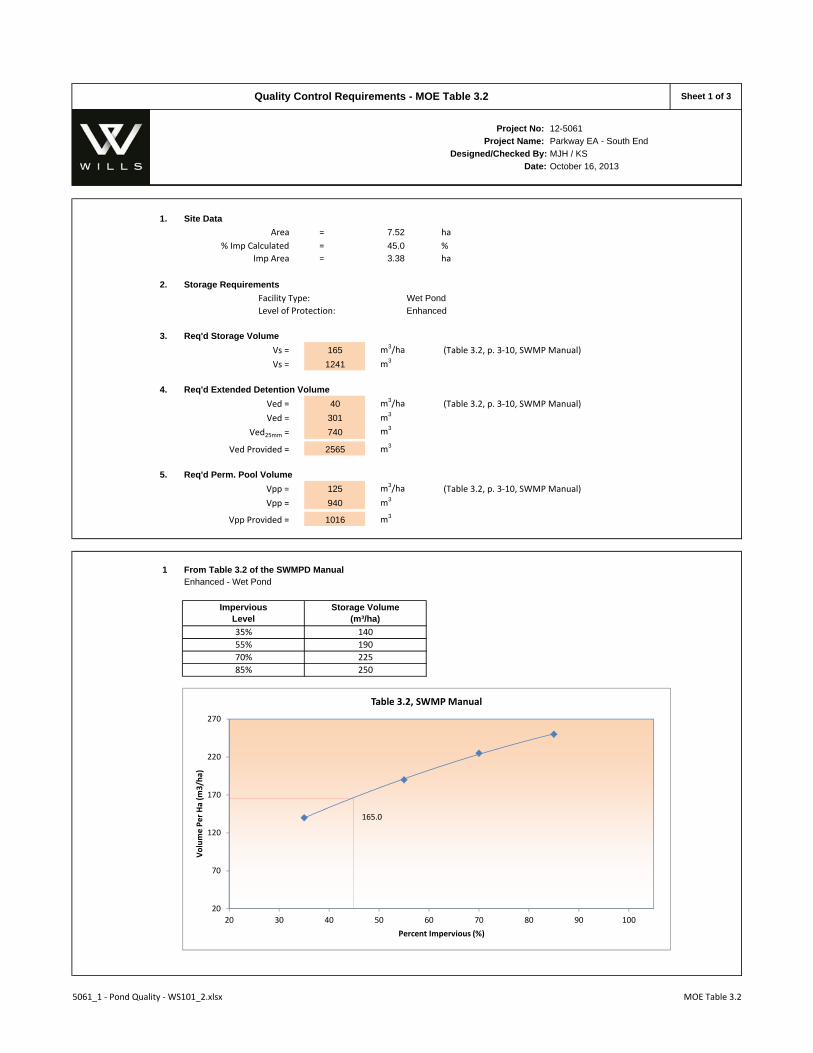
The proposed stormwater facility will incorporate several measures for quality treatment. The proposed stormwater pond will have a sediment forebay at the inlet end. The purpose of the sediment forebay is to improve pollutant removal by trapping larger particles near the inlet of the pond. In addition, the sediment forebay reduces the inflow velocities and minimizes the re-suspension of existing sediment in the forebay area. The second quality treatment measure consists of the permanent pool portion in the stormwater facility that never drains (except during maintenance). A 1.5 m deep permanent pool is located in the remaining portion of the pond, which provides two (2) functions. During a storm event, the pool acts as a buffer, such that any water being released from the facility is either clean or diluted. After the storm, pollutants remain trapped in the permanent pool. The inter-event settling is one of the main reasons why wet ponds are more effective in pollutant removal than dry ponds. The runoff originating from catchment WS101 will be collected by a storm sewer system within The Parkway right-of-way and discharge to the proposed wet pond facility. A total drainage area of 7.52 ha will discharge to the proposed extended detention, wet pond facility. The storage volumes required are based on Table 3.2, page 3-10, Stormwater Management Practices Planning and Design Manual (March 2003), Ministry of the Environment. Water quality objectives for the proposed Wet Pond Facility are presented in Table 2.

Parkway Environmental Assessment SWM Report – Parkway Corridor – South End
D.M. Wills Associates Limited Page 13 Project No. 12-5061
Table 2 – Extended Detention, Wet Pond Features
Feature Remarks
Level of Protection Enhanced (Level 1) Contributing Area 7.52 ha (WS101) Percent Impervious 45% Storage Volumes 165 m3/ha for 45% impervious
125 m3/ha for permanent pool Permanent Pool Design
Volume required is 940 m3 Volume provided is 1016 m3 Ponding depth is 1.5 m and side slope is 5 to 1
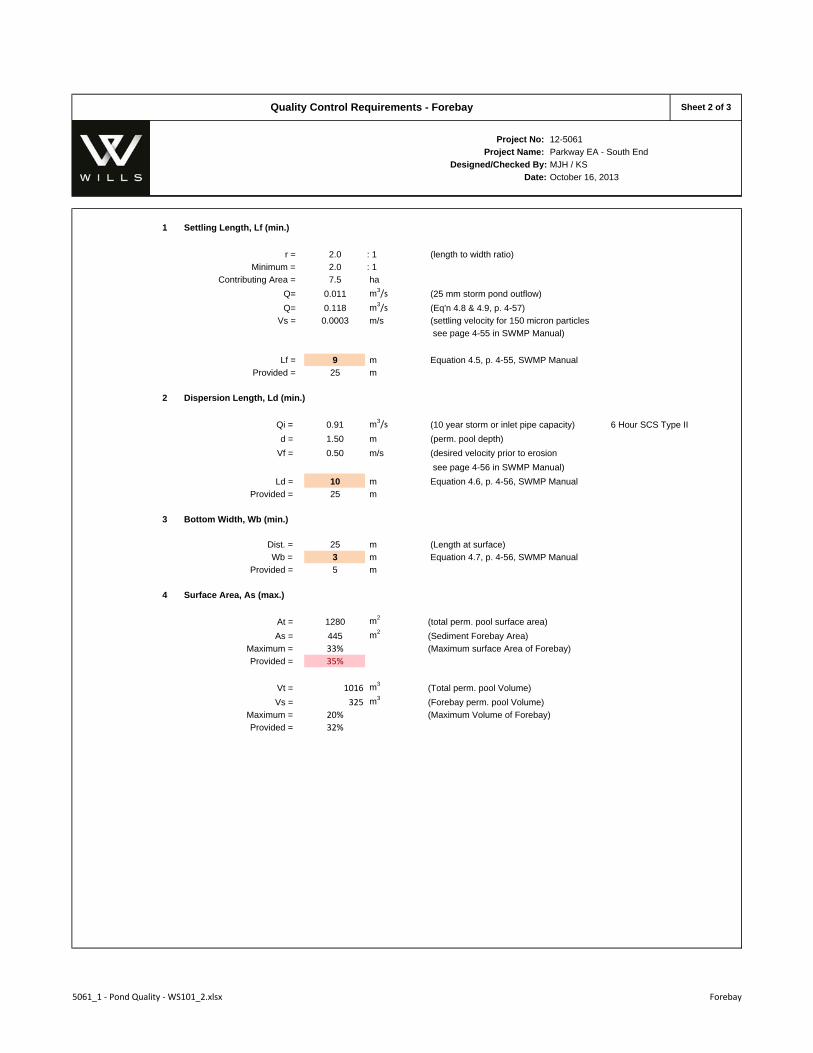
Forebay Design
Required settling length (Ls) is 9 m Required dispersion length (Ld) is 10 m Forebay length provided is 25 m
Extended Detention Design
Volume required is 740 m3 for quality control based on the 25 mm, 4 hour Chicago Distribution. Volume provided is 1155 m3 at a depth of 0.50 m for quality control
Outlet Design
2 stage outlet system: 100 mm dia. orifice (204.5 to 205.0 m) 325 mm dia. orifice (205.0 to 205.5 m)
25 mm drawdown time = 27 hours A review of Table 2 indicates that the proposed stormwater facility will achieve all of the water quality objectives. The supporting calculations for the wet pond are included in Appendix C. The pond locations and cross-sections are preliminary only, and are meant to give a representation of how the proposed stormwater management facilities will be constructed. Final configuration and design of the wet pond facility will be provided during the detailed design phase of the project and may be revised from the design provided within this report. During the detailed design phase of the project, the level of protection should not be reduced from what has been provided herein.
4.1.2 Stormwater Management Oil / Grit Separator
There are multiple options available for OGS sizing within the catchment WS201. The first option will provide quality treatment for the new section of road only between Goodfellow Road and Sherbrooke Street. To achieve this scenario, a secondary storm sewer system would be required to bypass existing flows discharging to the right-of-way around the OGS. This bypass would require additional capital cost to construct. The second option would provide quality treatment for the new section of road between Goodfellow Road and Sherbrooke Street, as well as runoff generated from Goodfellow Road. This scenario would still require a secondary storm sewer system to bypass external flows but would not be as substantial as Option 1. The third option would provide quality treatment for the new section of road between Goodfellow Road and
Parkway Environmental Assessment SWM Report – Parkway Corridor – South End
D.M. Wills Associates Limited Page 14 Project No. 12-5061
Sherbrooke Street, as well as all external areas discharging onto the new section of road. The sizing calculations for the oil-grit separators are included in Appendix D. The OGS unit will require periodic maintenance. The manufacturer will provide maintenance requirements for the selected system.
4.1.2.1 OGS – Option 1
A total drainage area of 1.04 ha at 61.5 % imperviousness (OGS201) will discharge into a proposed OGS via the proposed storm sewers within the right-of-way. The Ministry of Environment (MOE) guidelines for oil-grit separators for Normal (Level 1) protection are as follows:
80% total suspended solids (TSS) removal
Treat 85% of the annual runoff volume
The OGS analyzed is described below:
Stormceptor modeling tools recommend the Stormceptor System model STC 2000. The STC 2000 will achieve 83% TSS removal and treat 96% of annual runoff.
The proposed OGS exceeds the MOE requirements for Enhanced (Level 1) treatment for the proposed system.
4.1.2.2 OGS – Option 2
A total drainage area of 3.24 ha at 69.1 % imperviousness (OGS201 & OGS202) will discharge into a proposed OGS via the proposed storm sewers within the right-of-way. The OGS analyzed is described below:
Stormceptor modeling tools recommend the Stormceptor System model STC 9000. The STC 9000 will achieve 83% TSS removal and treat 96% of annual runoff.
The proposed OGS exceeds the MOE requirements for Enhanced (Level 1) treatment for the proposed development.
4.1.2.3 OGS – Option 3
A total drainage area of 4.71 ha at 75.6 % imperviousness (OGS201, OGS202 & OGS203) will discharge into a proposed OGS via the proposed storm sewers within the right-of-way.
Parkway Environmental Assessment SWM Report – Parkway Corridor – South End
D.M. Wills Associates Limited Page 15 Project No. 12-5061
The OGS analyzed is described below:
Stormceptor modeling tools recommend the Stormceptor System model STC 14000. The STC 14000 will achieve 82% TSS removal and treat 95% of annual runoff.
The proposed OGS exceeds the MOE requirements for Enhanced (Level 1) treatment for the proposed development.
4.2 Stormwater Quantity Control
The alteration of the existing area from open space into an ultimate four (4) lane arterial road will increase the imperviousness and the corresponding stormwater runoff leaving the site. In order to ensure that the new roadway does not increase downstream flooding, stormwater management facilities are typically required to maintain post-development flows to existing development levels, unless the receiving body of water will not be adversely effected by the increase in surface runoff. Peak flows were estimated in this report using the VO2 hydrologic model. Peak flows were calculated for the 100 year design storms considering the 1 hr., 4 hr. and 6 hr. Chicago storm distributions, the 1 hr., 6 hr. and 12 hr. AES storm distribution and the 12 hr. and 24 hr. SCS Type II storm duration, to determine the worst case scenario for the development. The 2, 5, 10, 25, 50 and 100 year design storms were then analyzed for the worst case scenarios. The 25 mm 4 hour Chicago storm distribution was also included as part of the analysis. A total of thirty (30) design storms were analyzed. The flow chart and the VO2 model is presented in Appendix C.
4.2.1 Byersville Creek – Wet Pond Facility
For the post-development conditions, catchment WS101 will discharge directly into the Wet Pond Facility between Whitefield Drive and The Parkway. Table 3 summarizes the 100 year peak flows for the pre-development condition compared to the post-development uncontrolled condition for all storm distributions discharging into the Byersville Creek.
Parkway Environmental Assessment SWM Report – Parkway Corridor – South End
D.M. Wills Associates Limited Page 16 Project No. 12-5061
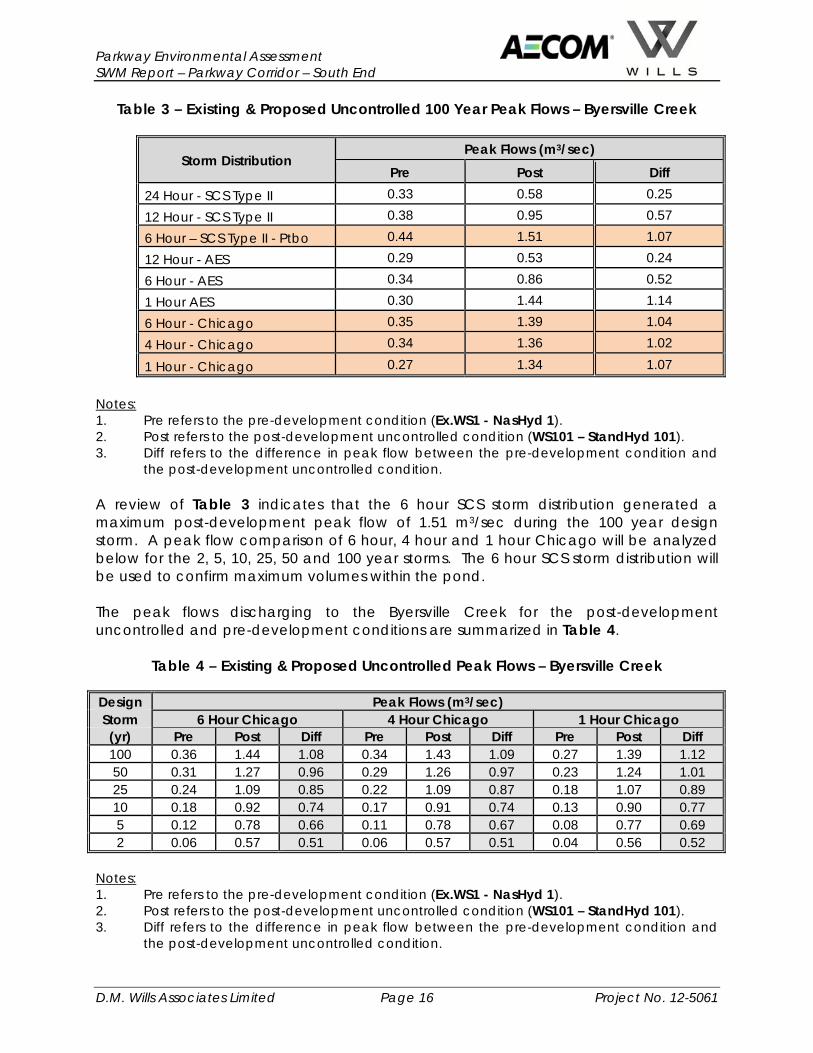
Table 3 – Existing & Proposed Uncontrolled 100 Year Peak Flows – Byersville Creek
Storm Distribution Peak Flows (m3/sec)
Pre Post Diff 24 Hour - SCS Type II 0.33 0.58 0.25
12 Hour - SCS Type II 0.38 0.95 0.57
6 Hour – SCS Type II - Ptbo 0.44 1.51 1.07
12 Hour - AES 0.29 0.53 0.24
6 Hour - AES 0.34 0.86 0.52
1 Hour AES 0.30 1.44 1.14
6 Hour - Chicago 0.35 1.39 1.04
4 Hour - Chicago 0.34 1.36 1.02
1 Hour - Chicago 0.27 1.34 1.07
Notes: 1. Pre refers to the pre-development condition (Ex.WS1 - NasHyd 1). 2. Post refers to the post-development uncontrolled condition (WS101 – StandHyd 101). 3. Diff refers to the difference in peak flow between the pre-development condition and
the post-development uncontrolled condition. A review of Table 3 indicates that the 6 hour SCS storm distribution generated a maximum post-development peak flow of 1.51 m3/sec during the 100 year design storm. A peak flow comparison of 6 hour, 4 hour and 1 hour Chicago will be analyzed below for the 2, 5, 10, 25, 50 and 100 year storms. The 6 hour SCS storm distribution will be used to confirm maximum volumes within the pond. The peak flows discharging to the Byersville Creek for the post-development uncontrolled and pre-development conditions are summarized in Table 4.
Table 4 – Existing & Proposed Uncontrolled Peak Flows – Byersville Creek
Design Peak Flows (m3/sec) Storm 6 Hour Chicago 4 Hour Chicago 1 Hour Chicago (yr) Pre Post Diff Pre Post Diff Pre Post Diff 100 0.36 1.44 1.08 0.34 1.43 1.09 0.27 1.39 1.12 50 0.31 1.27 0.96 0.29 1.26 0.97 0.23 1.24 1.01 25 0.24 1.09 0.85 0.22 1.09 0.87 0.18 1.07 0.89 10 0.18 0.92 0.74 0.17 0.91 0.74 0.13 0.90 0.77 5 0.12 0.78 0.66 0.11 0.78 0.67 0.08 0.77 0.69 2 0.06 0.57 0.51 0.06 0.57 0.51 0.04 0.56 0.52
Notes: 1. Pre refers to the pre-development condition (Ex.WS1 - NasHyd 1). 2. Post refers to the post-development uncontrolled condition (WS101 – StandHyd 101). 3. Diff refers to the difference in peak flow between the pre-development condition and
the post-development uncontrolled condition.
Parkway Environmental Assessment SWM Report – Parkway Corridor – South End
D.M. Wills Associates Limited Page 17 Project No. 12-5061
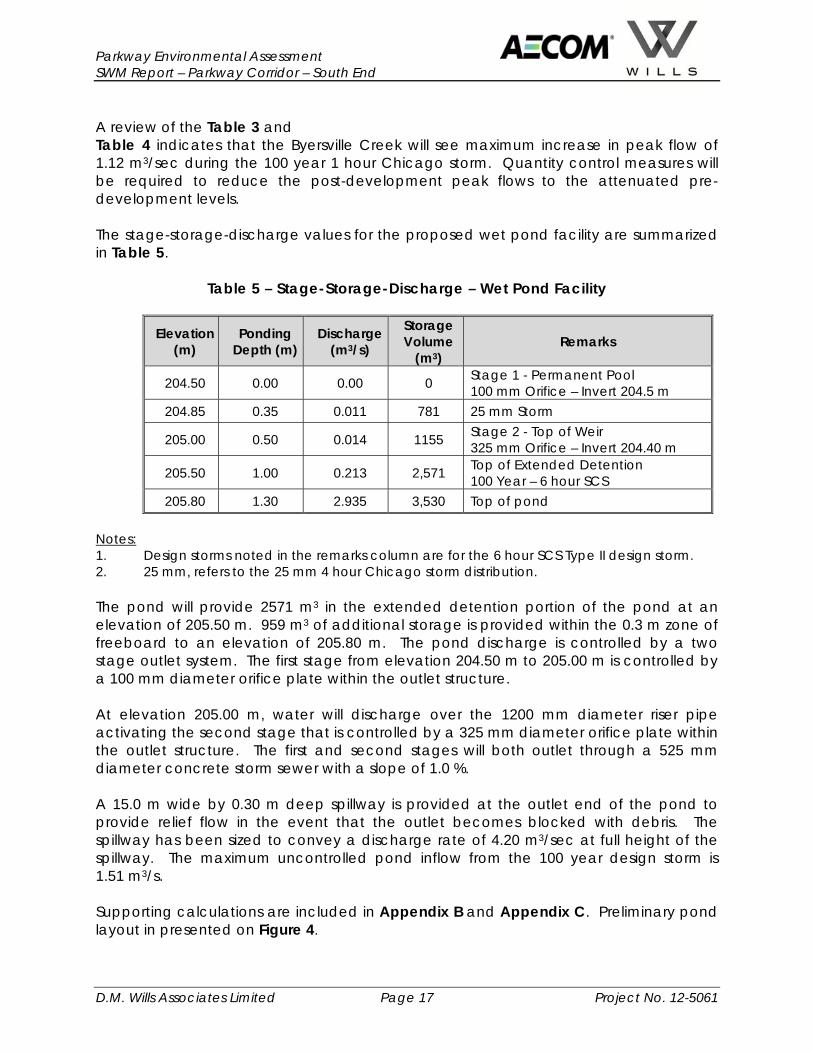
A review of the Table 3 and Table 4 indicates that the Byersville Creek will see maximum increase in peak flow of 1.12 m3/sec during the 100 year 1 hour Chicago storm. Quantity control measures will be required to reduce the post-development peak flows to the attenuated pre-development levels. The stage-storage-discharge values for the proposed wet pond facility are summarized in Table 5.
Table 5 – Stage-Storage-Discharge – Wet Pond Facility
Elevation (m)
Ponding Depth (m)
Discharge (m3/s)
Storage Volume
(m3) Remarks
204.50 0.00 0.00 0 Stage 1 - Permanent Pool 100 mm Orifice – Invert 204.5 m
204.85 0.35 0.011 781 25 mm Storm
205.00 0.50 0.014 1155 Stage 2 - Top of Weir 325 mm Orifice – Invert 204.40 m
205.50 1.00 0.213 2,571 Top of Extended Detention 100 Year – 6 hour SCS
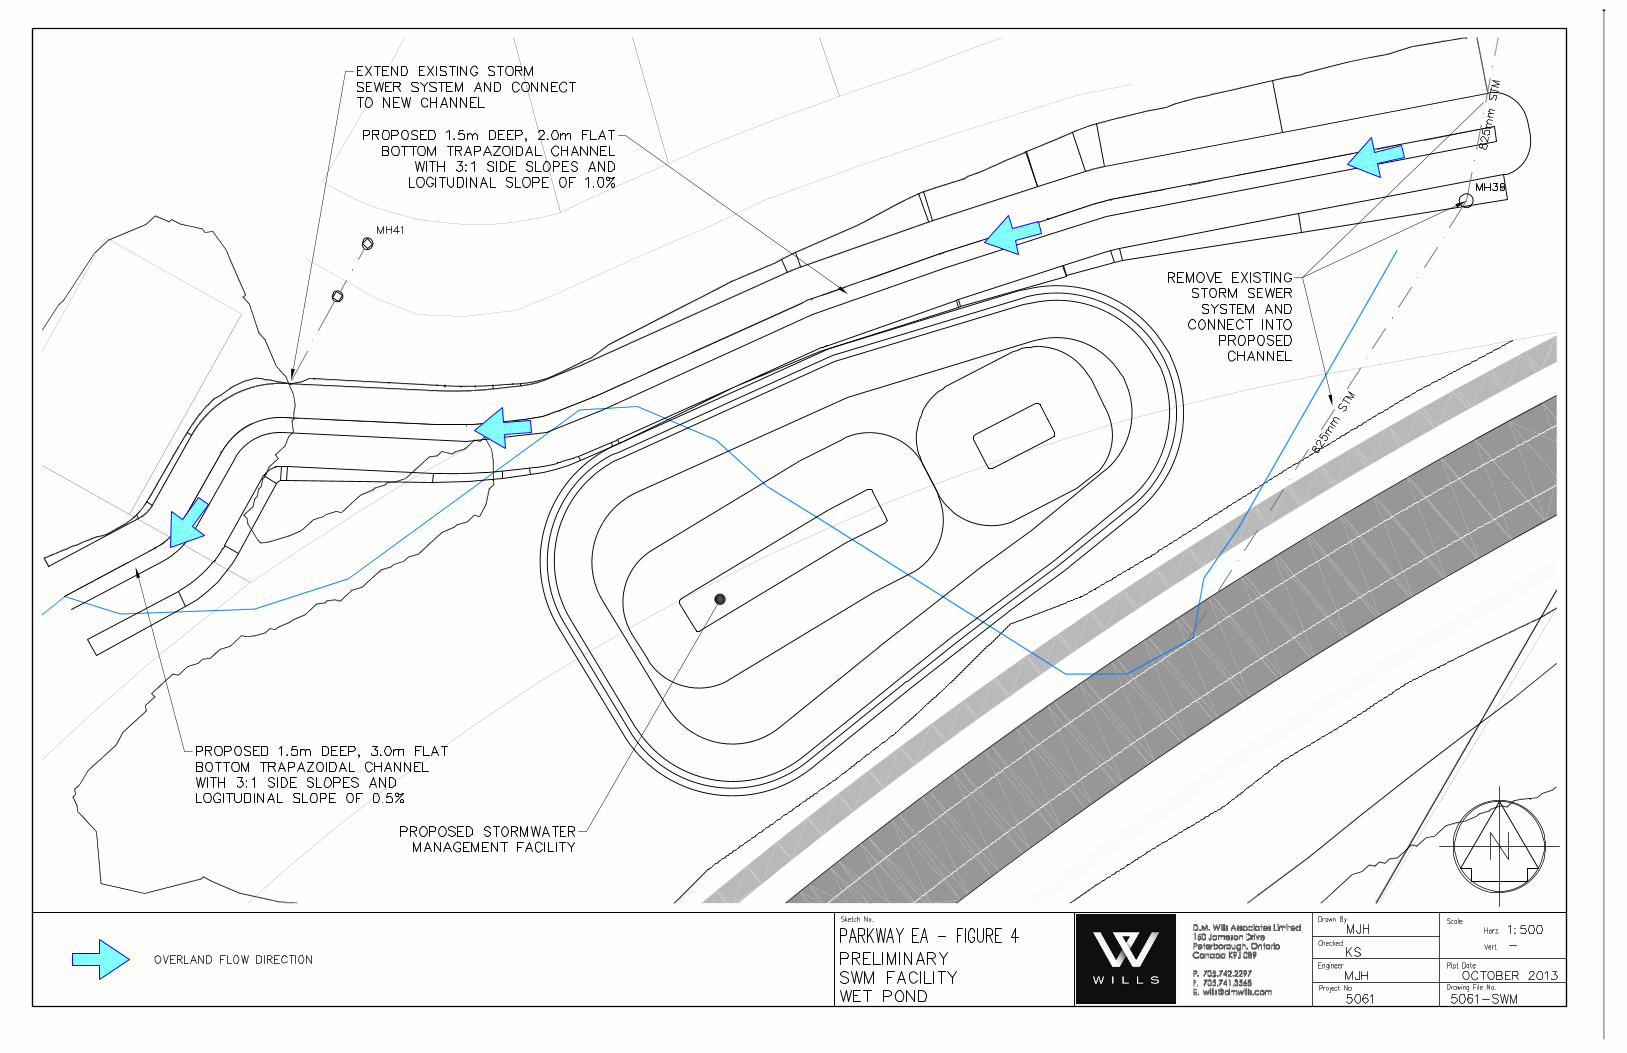
205.80 1.30 2.935 3,530 Top of pond Notes: 1. Design storms noted in the remarks column are for the 6 hour SCS Type II design storm. 2. 25 mm, refers to the 25 mm 4 hour Chicago storm distribution. The pond will provide 2571 m3 in the extended detention portion of the pond at an elevation of 205.50 m. 959 m3 of additional storage is provided within the 0.3 m zone of freeboard to an elevation of 205.80 m. The pond discharge is controlled by a two stage outlet system. The first stage from elevation 204.50 m to 205.00 m is controlled by a 100 mm diameter orifice plate within the outlet structure. At elevation 205.00 m, water will discharge over the 1200 mm diameter riser pipe activating the second stage that is controlled by a 325 mm diameter orifice plate within the outlet structure. The first and second stages will both outlet through a 525 mm diameter concrete storm sewer with a slope of 1.0 %. A 15.0 m wide by 0.30 m deep spillway is provided at the outlet end of the pond to provide relief flow in the event that the outlet becomes blocked with debris. The spillway has been sized to convey a discharge rate of 4.20 m3/sec at full height of the spillway. The maximum uncontrolled pond inflow from the 100 year design storm is 1.51 m3/s. Supporting calculations are included in Appendix B and Appendix C. Preliminary pond layout in presented on Figure 4.
Parkway Environmental Assessment SWM Report – Parkway Corridor – South End
D.M. Wills Associates Limited Page 18 Project No. 12-5061
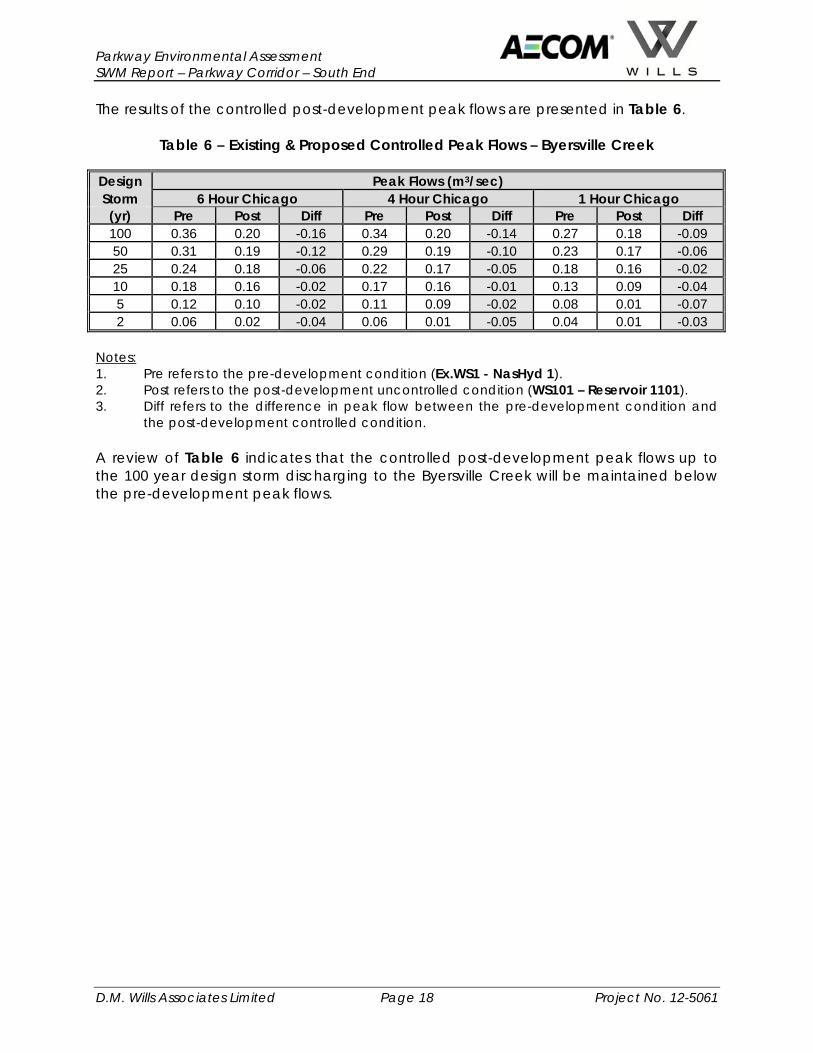
The results of the controlled post-development peak flows are presented in Table 6.
Table 6 – Existing & Proposed Controlled Peak Flows – Byersville Creek Design Peak Flows (m3/sec) Storm 6 Hour Chicago 4 Hour Chicago 1 Hour Chicago (yr) Pre Post Diff Pre Post Diff Pre Post Diff 100 0.36 0.20 -0.16 0.34 0.20 -0.14 0.27 0.18 -0.09 50 0.31 0.19 -0.12 0.29 0.19 -0.10 0.23 0.17 -0.06 25 0.24 0.18 -0.06 0.22 0.17 -0.05 0.18 0.16 -0.02 10 0.18 0.16 -0.02 0.17 0.16 -0.01 0.13 0.09 -0.04 5 0.12 0.10 -0.02 0.11 0.09 -0.02 0.08 0.01 -0.07 2 0.06 0.02 -0.04 0.06 0.01 -0.05 0.04 0.01 -0.03
Notes: 1. Pre refers to the pre-development condition (Ex.WS1 - NasHyd 1). 2. Post refers to the post-development uncontrolled condition (WS101 – Reservoir 1101). 3. Diff refers to the difference in peak flow between the pre-development condition and
the post-development controlled condition. A review of Table 6 indicates that the controlled post-development peak flows up to the 100 year design storm discharging to the Byersville Creek will be maintained below the pre-development peak flows.
Parkway Environmental Assessment SWM Report – Parkway Corridor – South End
D.M. Wills Associates Limited Page 20 Project No. 12-5061
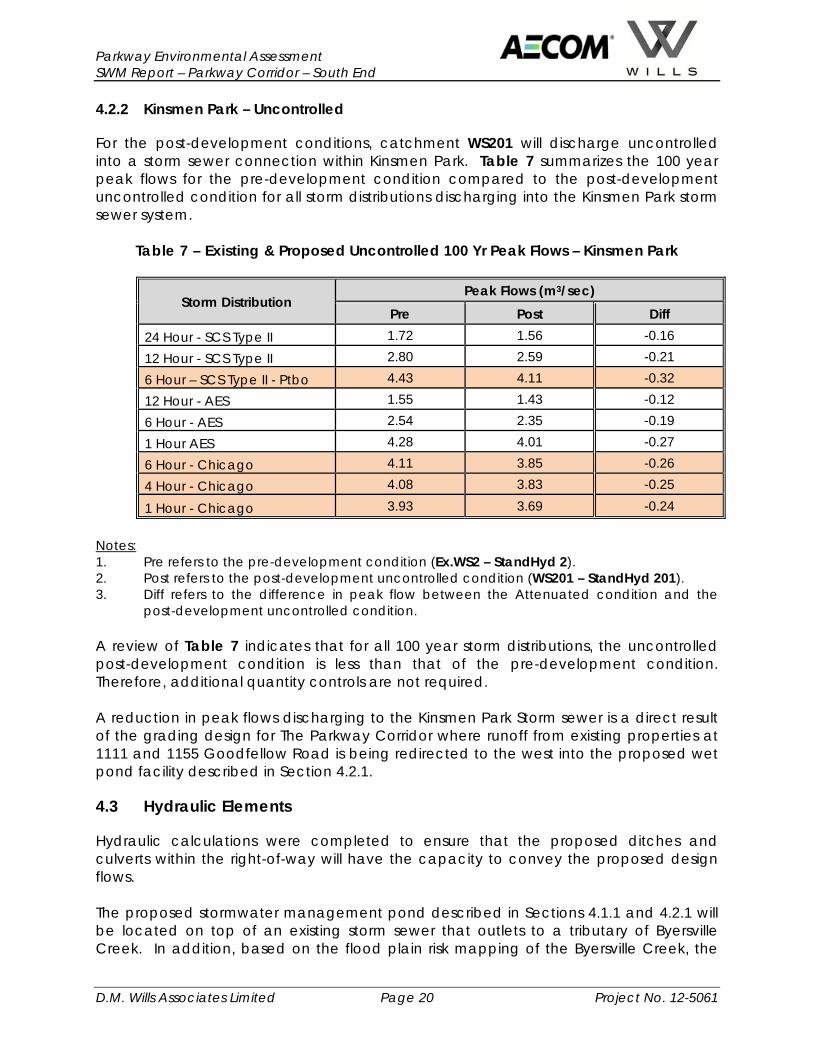
4.2.2 Kinsmen Park – Uncontrolled
For the post-development conditions, catchment WS201 will discharge uncontrolled into a storm sewer connection within Kinsmen Park. Table 7 summarizes the 100 year peak flows for the pre-development condition compared to the post-development uncontrolled condition for all storm distributions discharging into the Kinsmen Park storm sewer system.
Table 7 – Existing & Proposed Uncontrolled 100 Yr Peak Flows – Kinsmen Park
Storm Distribution Peak Flows (m3/sec)
Pre Post Diff 24 Hour - SCS Type II 1.72 1.56 -0.16
12 Hour - SCS Type II 2.80 2.59 -0.21
6 Hour – SCS Type II - Ptbo 4.43 4.11 -0.32
12 Hour - AES 1.55 1.43 -0.12
6 Hour - AES 2.54 2.35 -0.19
1 Hour AES 4.28 4.01 -0.27
6 Hour - Chicago 4.11 3.85 -0.26
4 Hour - Chicago 4.08 3.83 -0.25
1 Hour - Chicago 3.93 3.69 -0.24
Notes: 1. Pre refers to the pre-development condition (Ex.WS2 – StandHyd 2). 2. Post refers to the post-development uncontrolled condition (WS201 – StandHyd 201). 3. Diff refers to the difference in peak flow between the Attenuated condition and the
post-development uncontrolled condition. A review of Table 7 indicates that for all 100 year storm distributions, the uncontrolled post-development condition is less than that of the pre-development condition. Therefore, additional quantity controls are not required. A reduction in peak flows discharging to the Kinsmen Park Storm sewer is a direct result of the grading design for The Parkway Corridor where runoff from existing properties at 1111 and 1155 Goodfellow Road is being redirected to the west into the proposed wet pond facility described in Section 4.2.1.
4.3 Hydraulic Elements
Hydraulic calculations were completed to ensure that the proposed ditches and culverts within the right-of-way will have the capacity to convey the proposed design flows. The proposed stormwater management pond described in Sections 4.1.1 and 4.2.1 will be located on top of an existing storm sewer that outlets to a tributary of Byersville Creek. In addition, based on the flood plain risk mapping of the Byersville Creek, the
Parkway Environmental Assessment SWM Report – Parkway Corridor – South End
D.M. Wills Associates Limited Page 21 Project No. 12-5061
stormwater management wet pond facility, as well as the proposed Parkway extension is within the limits of the flood plain. Approximately 170 m of the existing tributary will be filled in to accommodate the proposed Parkway extension and stormwater management facility. In order to capture flows form the Whitefield Drive right-of-way a new channel is proposed between Whitefield Drive and the new wet pond facility, to direct flows into the tributary of the Byersville Creek. The proposed channel will incorporate naturalization during the detailed design phase of the project in order to provide compensation for loss of the existing channel. Peak flows discharging to the tributary of Byersville Creek were obtained from the Otonabee Region Conservation Authority and are estimated at 13.0 m3/s. The 200 m long channel is proposed as two individual sections. The first section runs parallel to Whitefield Drive and is a 1.5 m deep trapezoidal channel with 3:1 side slopes, a 2.0 m flat bottom and a longitudinal slope of 1.0%. The second section connects the first section of the channel to the tributary of Byersville Creek and is a 1.5 m deep trapezoidal channel with 3:1 side slopes, a 3.0 m flat bottom and a longitudinal slope of 0.5%. The minimum capacity of the channel was estimated at 21.2 m3/s. Minimum freeboard within the channel was estimated at 0.31 m. Channel velocities were estimated at 2.17 m/s, which exceeds the threshold value of 0.9 m/s to 1.7 m/s for a grassed surface. Therefore, erosion protection in the form of a permanent turf reinforcement mat is proposed within the channel. The hydraulic elements presented in this report are preliminary only, and meant to give a representation of how the water will be conveyed through the study area. A HEC-RAS analysis of the proposed channel should be completed during the detailed design phase of the project. Final configuration and design of the overland flow routes will be provided during the detailed design phase of the project and may be revised from the preliminary design provided within this report.
4.4 Thermal Mitigation
It is understood that the tributary to Byersville / Harper Creek serves as headwaters for sensitive fisheries habitat that currently support cold water species. As such, there are concerns that the proposed strategy and specifically the wet pond facility may result in a deleterious condition unless it can be shown that all thermal impacts are successfully mitigated. Through discussions with the conservation authority (ORCA), the importance of mitigating thermal impacts to the Byersville / Harper Creek is a key concern. The following mitigation measures were developed in consultation with ORCA and will be incorporated into a proposed wet pond facility during the detailed design phase of the project:
Canopy Trees, should be planted near water’s edge to provide shade and help cool the water within the wet pond facility.
Reverse slope drawdown pipe, should be installed in the wet pond facility to draw cooler water from deep within the pond before outleting from the facility.

Parkway Environmental Assessment SWM Report – Parkway Corridor – South End
D.M. Wills Associates Limited Page 23 Project No. 12-5061
Statement of Limitations This report has been prepared by D.M. Wills Associates Limited on behalf of the AECOM to prepare a Stormwater Management Report for The Parkway Environmental Assessment to address the requirements of the City of Peterborough. The conclusions and recommendations in this report are based on available background documentation and discussions with applicable agencies at the time of preparation. The report is intended to demonstrate the means whereby stormwater runoff originating from the site will be managed with respect to both quantity and quality control. The report is applicable only to the project described in the text, constructed substantially in accordance with the plans and details accompanying this report. Any use which a third party makes of this report other than a stormwater management report for the proposed development is the responsibility of such third parties. D.M. Wills Associates Limited accepts no responsibility for damages, if any, suffered by a third party as a result of decisions made or action taken based on using this report for purposes other than a stormwater management report for The Parkway Environmental Assessment. D.M. Wills Associates Limited is not responsible for any changes made to the stormwater management measures which are not in accordance with the design drawings. Any person(s) relying on the “as-constructed” stormwater measures should confirm that the field conditions are in accordance with the design drawings.

Appendix A Hydrology
Project No: 12-5061
Project Name: Parkway EA
Designed/Checked By: MJH / KS
Date: 16-Oct-13
Drainage Area 5.71 ha
Land Use 0.00 ha Agriculture
3.88 ha Range 90.4 mm
0.18 ha Grass
0.87 ha Woods
0.00 ha Wetland Soil Type
0.00 ha Bare Earth (>70% Rock)0.78 ha Impervious Hydrologic Soil Group1
B
Percent Impervious 13.6 % US Elev .= 215.0 m
DS Elev. = 204.0 m
Length 370.0 m
Rolling
Slope 3.0 %
Incl. Not Incl.
Agriculture Range Grass Woods Wetland Bare Earth Imperv. Imperv. Imperv.
>70% Rock Nashyd Standhyd
35.9 min.
0.60 hr.
24.0 min.
0.40 hr.
Notes:
1. Hydrologic Soil Group obtained from Design Chart H2-6A, M.T.O. Drainage Manual, 1980.
2. Runoff coefficient obtained from M.T.O. Design Chart 1.07, M.T.O. Drainage Management Manual, 1997, and
Tables 4-5a to 4-5d, Maryland State Highway Administration.
3. SCS Curve No. obtained from M.T.O. Design Chart 1.09, M.T.O. Drainage Management Manual, 1997, and
Table 2-2a, TR-55, page 2-5.
4. The modified curve number is adjusted as per Paul Wisner & Associates (1982) and represents anticedent moisture conditions Type II
5. Initial Abstraction values taken from the Environmental and Engineering Services Department, The Corporation of the City of London, Dec 2005
6. Use Airport Equation to calculate time of concentration for C <= 0.4, and Bransby-Williams for C > 0.4.
5. Minimum Time to Peak for use in the Rational Method and Hydrologic Model is 10 minutes
Hydrologic Parameters for Ex.WS1 Sheet 1 of 1
Rainfall Data
Parameter
Land Use Composite Value
Rainfall Gauging Station = Peterborough
100 Yr, 12 Hour Rainfall depth =
Otonabee Loam
0.71 0.90 0.28 n.a.
SCS Curve No.3, CN 74 69 61 60
Runoff Coefficient2, C 0.48 0.20 0.16 0.11 0.05
55 91 98 71.3 67.1
8.1
n.a. n.a. n.a. 72.0 68.0
Initial Abstraction5, mm 6 8 2.5 10
Modified Curve No.4, CN* n.a. n.a. n.a. n.a.
10 2.5 2 7.3
Time of Concentration6 Method AirportBransby - Williams
Uplands
Time to Peak7 Tc (min) 35.9 14.2 -
Flat: 0-2% SlopesRolling: 2-6% SlopesHilly: >6% Slopes
Hydrology Calculations Ex.WS1

Project No: 12-5061
Project Name: Parkway EA
Designed/Checked By: MJH / KS
Date: 16-Oct-13
Drainage Area 22.36 ha
Land Use 0.00 ha Agriculture
0.46 ha Range 90.4 mm
12.21 ha Grass
0.00 ha Woods
0.00 ha Wetland Soil Type
0.00 ha Bare Earth (>70% Rock)9.69 ha Impervious Hydrologic Soil Group1
B
Percent Impervious 43.3 % US Elev .= 235.0 m
DS Elev. = 214.0 m
Length 690.0 m
Rolling
Slope 3.0 %
Incl. Not Incl.
Agriculture Range Grass Woods Wetland Bare Earth Imperv. Imperv. Imperv.
>70% Rock Nashyd Standhyd
23.1 min.
0.38 hr.
15.5 min.
0.26 hr.
Notes:
1. Hydrologic Soil Group obtained from Design Chart H2-6A, M.T.O. Drainage Manual, 1980.
2. Runoff coefficient obtained from M.T.O. Design Chart 1.07, M.T.O. Drainage Management Manual, 1997, and
Tables 4-5a to 4-5d, Maryland State Highway Administration.
3. SCS Curve No. obtained from M.T.O. Design Chart 1.09, M.T.O. Drainage Management Manual, 1997, and
Table 2-2a, TR-55, page 2-5.
4. The modified curve number is adjusted as per Paul Wisner & Associates (1982) and represents anticedent moisture conditions Type II
5. Initial Abstraction values taken from the Environmental and Engineering Services Department, The Corporation of the City of London, Dec 2005
6. Use Airport Equation to calculate time of concentration for C <= 0.4, and Bransby-Williams for C > 0.4.
5. Minimum Time to Peak for use in the Rational Method and Hydrologic Model is 10 minutes
Time of Concentration6 Method AirportBransby - Williams
Uplands
Time to Peak7 Tc (min) 36.7 23.1 -
2.7
n.a. n.a. n.a. 74.0 57.0
Initial Abstraction5, mm 6 8 2.5 10
Modified Curve No.4, CN* n.a. n.a. n.a. n.a.
10 2.5 2 2.4
0.71 0.90 0.48 n.a.
SCS Curve No.3, CN 74 69 61 60
Runoff Coefficient2, C 0.48 0.20 0.16 0.11 0.05
55 91 98 77.2 61.3
Parameter
Land Use Composite Value
Rainfall Gauging Station = Peterborough
100 Yr, 12 Hour Rainfall depth =
Otonabee Loam
Rainfall Data
Hydrologic Parameters for Ex.WS2 Sheet 1 of 1
Flat: 0-2% SlopesRolling: 2-6% SlopesHilly: >6% Slopes
Hydrology Calculations Ex.WS2
Project No: 12-5061
Project Name: Parkway EA
Designed/Checked By: MJH / KS
Date: 16-Oct-13
Drainage Area 7.52 ha
Land Use 0.00 ha Agriculture
1.70 ha Range 90.4 mm
1.69 ha Grass
0.87 ha Woods
0.00 ha Wetland Soil Type
0.00 ha Bare Earth (>70% Rock)3.26 ha Impervious Hydrologic Soil Group1
B
Percent Impervious 43.4 % US Elev .= 214.0 m
DS Elev. = 204.0 m
Length 520.0 m
Flat
Slope 1.9 %
Incl. Not Incl.
Agriculture Range Grass Woods Wetland Bare Earth Imperv. Imperv. Imperv.
>70% Rock Nashyd Standhyd
21.3 min.
0.35 hr.
14.2 min.
0.24 hr.
Notes:
1. Hydrologic Soil Group obtained from Design Chart H2-6A, M.T.O. Drainage Manual, 1980.
2. Runoff coefficient obtained from M.T.O. Design Chart 1.07, M.T.O. Drainage Management Manual, 1997, and
Tables 4-5a to 4-5d, Maryland State Highway Administration.
3. SCS Curve No. obtained from M.T.O. Design Chart 1.09, M.T.O. Drainage Management Manual, 1997, and
Table 2-2a, TR-55, page 2-5.
4. The modified curve number is adjusted as per Paul Wisner & Associates (1982) and represents anticedent moisture conditions Type II
5. Initial Abstraction values taken from the Environmental and Engineering Services Department, The Corporation of the City of London, Dec 2005
6. Use Airport Equation to calculate time of concentration for C <= 0.4, and Bransby-Williams for C > 0.4.
5. Minimum Time to Peak for use in the Rational Method and Hydrologic Model is 10 minutes
Time of Concentration6 Method AirportBransby - Williams
Uplands
Time to Peak7 Tc (min) 38.1 21.3 7.2
6.2
n.a. n.a. n.a. 78.0 62.0
Initial Abstraction5, mm 6 8 2.5 10
Modified Curve No.4, CN* n.a. n.a. n.a. n.a.
10 2.5 2 4.4
0.52 0.90 0.46 n.a.
SCS Curve No.3, CN 74 69 61 60
Runoff Coefficient2, C 0.43 0.18 0.11 0.08 0.05
55 91 98 78.7 64.0
Parameter
Land Use Composite Value
Rainfall Gauging Station = Peterborough
100 Yr, 12 Hour Rainfall depth =
Otonabee Loam
Rainfall Data
Hydrologic Parameters for WS101 Sheet 1 of 1
Flat: 0-2% SlopesRolling: 2-6% SlopesHilly: >6% Slopes
Hydrology Calculations WS101
Project No: 12-5061
Project Name: Parkway EA
Designed/Checked By: MJH / KS
Date: 16-Oct-13
Drainage Area 20.55 ha
Land Use 0.00 ha Agriculture
0.00 ha Range 90.4 mm
11.44 ha Grass
0.00 ha Woods
0.00 ha Wetland Soil Type
0.00 ha Bare Earth (>70% Rock)9.11 ha Impervious Hydrologic Soil Group1
B
Percent Impervious 44.3 % US Elev .= 235.0 m
DS Elev. = 214.0 m
Length 690.0 m
Rolling
Slope 3.0 %
Incl. Not Incl.
Agriculture Range Grass Woods Wetland Bare Earth Imperv. Imperv. Imperv.
>70% Rock Nashyd Standhyd
23.3 min.
0.39 hr.
15.6 min.
0.26 hr.
Notes:
1. Hydrologic Soil Group obtained from Design Chart H2-6A, M.T.O. Drainage Manual, 1980.
2. Runoff coefficient obtained from M.T.O. Design Chart 1.07, M.T.O. Drainage Management Manual, 1997, and
Tables 4-5a to 4-5d, Maryland State Highway Administration.
3. SCS Curve No. obtained from M.T.O. Design Chart 1.09, M.T.O. Drainage Management Manual, 1997, and
Table 2-2a, TR-55, page 2-5.
4. The modified curve number is adjusted as per Paul Wisner & Associates (1982) and represents anticedent moisture conditions Type II
5. Initial Abstraction values taken from the Environmental and Engineering Services Department, The Corporation of the City of London, Dec 2005
6. Use Airport Equation to calculate time of concentration for C <= 0.4, and Bransby-Williams for C > 0.4.
5. Minimum Time to Peak for use in the Rational Method and Hydrologic Model is 10 minutes
Hydrologic Parameters for WS201 Sheet 1 of 1
Rainfall Data
Parameter
Land Use Composite Value
Rainfall Gauging Station = Peterborough
100 Yr, 12 Hour Rainfall depth =
Otonabee Loam
0.71 0.90 0.49 n.a.
SCS Curve No.3, CN 74 69 61 60
Runoff Coefficient2, C 0.48 0.20 0.16 0.11 0.05
55 91 98 77.4 61.0
2.5
n.a. n.a. n.a. 74.0 56.0
Initial Abstraction5, mm 6 8 2.5 10
Modified Curve No.4, CN* n.a. n.a. n.a. n.a.
10 2.5 2 2.3
Time of Concentration6 Method AirportBransby - Williams
Uplands
Time to Peak7 Tc (min) 36.3 23.3 -
Flat: 0-2% SlopesRolling: 2-6% SlopesHilly: >6% Slopes
Hydrology Calculations WS201

Project No: 12-5061
Project Name: Parkway EA
Designed/Checked By: MJH / KS
Date: 16-Oct-13
Drainage Area 1.04 ha
Land Use 0.00 ha Agriculture
0.00 ha Range 90.4 mm
0.40 ha Grass
0.00 ha Woods
0.00 ha Wetland Soil Type
0.00 ha Bare Earth (>70% Rock)0.64 ha Impervious Hydrologic Soil Group1
B
Percent Impervious 61.5 % US Elev .= 216.0 m
DS Elev. = 214.0 m
Length 480.0 m
Flat
Slope 0.4 %
Incl. Not Incl.
Agriculture Range Grass Woods Wetland Bare Earth Imperv. Imperv. Imperv.
>70% Rock Nashyd Standhyd
32.5 min.
0.54 hr.
21.8 min.
0.36 hr.
Notes:
1. Hydrologic Soil Group obtained from Design Chart H2-6A, M.T.O. Drainage Manual, 1980.
2. Runoff coefficient obtained from M.T.O. Design Chart 1.07, M.T.O. Drainage Management Manual, 1997, and
Tables 4-5a to 4-5d, Maryland State Highway Administration.
3. SCS Curve No. obtained from M.T.O. Design Chart 1.09, M.T.O. Drainage Management Manual, 1997, and
Table 2-2a, TR-55, page 2-5.
4. The modified curve number is adjusted as per Paul Wisner & Associates (1982) and represents anticedent moisture conditions Type II
5. Initial Abstraction values taken from the Environmental and Engineering Services Department, The Corporation of the City of London, Dec 2005
6. Use Airport Equation to calculate time of concentration for C <= 0.4, and Bransby-Williams for C > 0.4.
5. Minimum Time to Peak for use in the Rational Method and Hydrologic Model is 10 minutes
Hydrologic Parameters for OGS201 Sheet 1 of 1
Rainfall Data
Parameter
Land Use Composite Value
Rainfall Gauging Station = Peterborough
100 Yr, 12 Hour Rainfall depth =
Otonabee Loam
0.52 0.90 0.60 n.a.
SCS Curve No.3, CN 74 69 61 60
Runoff Coefficient2, C 0.43 0.18 0.11 0.08 0.05
55 91 98 83.8 61.0
2.5
n.a. n.a. n.a. 81.0 57.0
Initial Abstraction5, mm 6 8 2.5 10
Modified Curve No.4, CN* n.a. n.a. n.a. n.a.
10 2.5 2 2.2
Time of Concentration6 Method AirportBransby - Williams
Uplands
Time to Peak7 Tc (min) 48.0 32.5 -
Flat: 0-2% SlopesRolling: 2-6% SlopesHilly: >6% Slopes
Hydrology Calculations OGS201

Project No: 12-5061
Project Name: Parkway EA
Designed/Checked By: MJH / KS
Date: 16-Oct-13
Drainage Area 2.20 ha
Land Use 0.00 ha Agriculture
0.00 ha Range 90.4 mm
0.60 ha Grass
0.00 ha Woods
0.00 ha Wetland Soil Type
0.00 ha Bare Earth (>70% Rock)1.60 ha Impervious Hydrologic Soil Group1
B
Percent Impervious 72.7 % US Elev .= 216.0 m
DS Elev. = 214.0 m
Length 230.0 m
Flat
Slope 0.9 %
Incl. Not Incl.
Agriculture Range Grass Woods Wetland Bare Earth Imperv. Imperv. Imperv.
>70% Rock Nashyd Standhyd
12.5 min.
0.21 hr.
8.3 min.
0.17 hr.
Notes:
1. Hydrologic Soil Group obtained from Design Chart H2-6A, M.T.O. Drainage Manual, 1980.
2. Runoff coefficient obtained from M.T.O. Design Chart 1.07, M.T.O. Drainage Management Manual, 1997, and
Tables 4-5a to 4-5d, Maryland State Highway Administration.
3. SCS Curve No. obtained from M.T.O. Design Chart 1.09, M.T.O. Drainage Management Manual, 1997, and
Table 2-2a, TR-55, page 2-5.
4. The modified curve number is adjusted as per Paul Wisner & Associates (1982) and represents anticedent moisture conditions Type II
5. Initial Abstraction values taken from the Environmental and Engineering Services Department, The Corporation of the City of London, Dec 2005
6. Use Airport Equation to calculate time of concentration for C <= 0.4, and Bransby-Williams for C > 0.4.
5. Minimum Time to Peak for use in the Rational Method and Hydrologic Model is 10 minutes
Time of Concentration6 Method AirportBransby - Williams
Uplands
Time to Peak7 Tc (min) 21.5 12.5 -
2.5
n.a. n.a. n.a. 86.0 57.0
Initial Abstraction5, mm 6 8 2.5 10
Modified Curve No.4, CN* n.a. n.a. n.a. n.a.
10 2.5 2 2.1
0.52 0.90 0.68 n.a.
SCS Curve No.3, CN 74 69 61 60
Runoff Coefficient2, C 0.43 0.18 0.11 0.08 0.05
55 91 98 87.9 61.0
Parameter
Land Use Composite Value
Rainfall Gauging Station = Peterborough
100 Yr, 12 Hour Rainfall depth =
Otonabee Loam
Rainfall Data
Hydrologic Parameters for OGS202 Sheet 1 of 1
Flat: 0-2% SlopesRolling: 2-6% SlopesHilly: >6% Slopes
Hydrology Calculations OGS202

Project No: 12-5061
Project Name: Parkway EA
Designed/Checked By: MJH / KS
Date: 16-Oct-13
Drainage Area 1.47 ha
Land Use 0.00 ha Agriculture
0.00 ha Range 90.4 mm
0.15 ha Grass
0.00 ha Woods
0.00 ha Wetland Soil Type
0.00 ha Bare Earth (>70% Rock)1.32 ha Impervious Hydrologic Soil Group1
B
Percent Impervious 90.0 % US Elev .= 216.0 m
DS Elev. = 214.0 m
Length 150.0 m
Flat
Slope 1.3 %
Incl. Not Incl.
Agriculture Range Grass Woods Wetland Bare Earth Imperv. Imperv. Imperv.
>70% Rock Nashyd Standhyd
7.8 min.
0.13 hr.
5.2 min.
0.17 hr.
Notes:
1. Hydrologic Soil Group obtained from Design Chart H2-6A, M.T.O. Drainage Manual, 1980.
2. Runoff coefficient obtained from M.T.O. Design Chart 1.07, M.T.O. Drainage Management Manual, 1997, and
Tables 4-5a to 4-5d, Maryland State Highway Administration.
3. SCS Curve No. obtained from M.T.O. Design Chart 1.09, M.T.O. Drainage Management Manual, 1997, and
Table 2-2a, TR-55, page 2-5.
4. The modified curve number is adjusted as per Paul Wisner & Associates (1982) and represents anticedent moisture conditions Type II
5. Initial Abstraction values taken from the Environmental and Engineering Services Department, The Corporation of the City of London, Dec 2005
6. Use Airport Equation to calculate time of concentration for C <= 0.4, and Bransby-Williams for C > 0.4.
5. Minimum Time to Peak for use in the Rational Method and Hydrologic Model is 10 minutes
Time of Concentration6 Method AirportBransby - Williams
Uplands
Time to Peak7 Tc (min) 10.1 7.8 -
2.5
n.a. n.a. n.a. 95.0 56.0
Initial Abstraction5, mm 6 8 2.5 10
Modified Curve No.4, CN* n.a. n.a. n.a. n.a.
10 2.5 2 2.1
0.52 0.90 0.82 n.a.
SCS Curve No.3, CN 74 69 61 60
Runoff Coefficient2, C 0.43 0.18 0.11 0.08 0.05
55 91 98 94.3 61.0
Parameter
Land Use Composite Value
Rainfall Gauging Station = Peterborough
100 Yr, 12 Hour Rainfall depth =
Otonabee Loam
Rainfall Data
Hydrologic Parameters for OGS203 Sheet 1 of 1
Flat: 0-2% SlopesRolling: 2-6% SlopesHilly: >6% Slopes
Hydrology Calculations OGS203

Fitted Measured5 90.0110 69.0015 56.5830 37.7960 23.75120 14.37240 8.51360 6.23720 3.631440 2.11
a b c662 7.5 0.79
Fitted Measured5 93.7710 72.1415 59.2530 39.6560 24.92120 15.06240 8.90360 6.50720 3.781440 2.19
a b c710 7.8 0.79
Fitted Measured5 115.3610 90.9815 75.6630 51.2960 32.26120 19.31240 11.22360 8.11720 4.611440 2.61
a b c1098 10.1 0.83
Intensity (mm/hr)
Intensity Duration Frequency Statistics for Peterborough
Parameters as supplied by City of Peterborough on Nov. 8, 2006
Parameters values based on data analyis for Peterborough Airport
Intensity (mm/hr)Duration (min)
2 Year Return Interval
5 Year Return Interval
Rainfall Intensity (mm/hr) = a/(Tc+b)^cwhere Tc is the Time of concentration in minutes
2.33 Year Return Interval (Interpolated)
Duration (min)Intensity (mm/hr)
Duration (min)

Fitted Measured5 129.8910 105.2115 88.8330 61.4260 38.96120 23.26240 13.38360 9.58720 5.361440 2.98
a b c1560 13 0.86
Fitted Measured5 150.6210 122.6315 103.8230 71.9460 45.53120 27.00240 15.38360 10.94720 6.041440 3.31
a b c2010 14 0.88
Fitted Measured5 165.2610 135.6215 115.4530 80.8260 51.66120 30.91240 17.76360 12.69720 7.061440 3.90
a b c2200 14.6 0.87
Fitted Measured5 181.1710 148.6115 126.4330 88.3160 56.25120 33.50240 19.13360 13.62720 7.531440 4.13
a b c2507 14.8 0.88
Duration (min)Intensity (mm/hr)
50 Year Return Interval
Duration (min)Intensity (mm/hr)
100 Year Return Interval
25 Year Return Interval
Duration (min)Intensity (mm/hr)
Duration (min)Intensity (mm/hr)
10 Year Return Interval

Appendix B Quality and Quantity

Byersville Creek
Project No: 12-5061
Project Name: Parkway EA - South End
Designed/Checked By: MJH / KS
Date:
1. Site Data
Area = 7.52 ha
% Imp Calculated = 45.0 %
Imp Area = 3.38 ha
2. Storage Requirements
Facility Type:
Level of Protection:
3. Req'd Storage Volume
Vs = 165 m3/ha (Table 3.2, p. 3‐10, SWMP Manual)
Vs = 1241 m3
4. Req'd Extended Detention Volume
Ved = 40 m3/ha (Table 3.2, p. 3‐10, SWMP Manual)
Ved = 301 m3
Ved25mm = 740 m3
Ved Provided = 2565 m3
5. Req'd Perm. Pool Volume
Vpp = 125 m3/ha (Table 3.2, p. 3‐10, SWMP Manual)
Vpp = 940 m3
Vpp Provided = 1016 m3
1 From Table 3.2 of the SWMPD ManualEnhanced - Wet Pond
Quality Control Requirements - MOE Table 3.2 Sheet 1 of 3
Impervious Level
Storage Volume(m³/ha)
35% 140
55% 190
70%
250
October 16, 2013
Wet Pond
Enhanced
225
85%
165.0
20
70
120
170
220
270
20 30 40 50 60 70 80 90 100
Volume Per Ha (m
3/ha)
Percent Impervious (%)
Table 3.2, SWMP Manual
5061_1 ‐ Pond Quality ‐ WS101_2.xlsx MOE Table 3.2
Project No: 12-5061
Project Name: Parkway EA - South End
Designed/Checked By: MJH / KS
Date:
1 Settling Length, Lf (min.)
r = 2.0 : 1 (length to width ratio)
Minimum = 2.0 : 1
Contributing Area = 7.5 ha
Q= 0.011 m3/s (25 mm storm pond outflow)
Q= 0.118 m3/s (Eq'n 4.8 & 4.9, p. 4-57)
Vs = 0.0003 m/s (settling velocity for 150 micron particles
see page 4-55 in SWMP Manual)
Lf = 9 m Equation 4.5, p. 4-55, SWMP Manual
Provided = 25 m
2 Dispersion Length, Ld (min.)
Qi = 0.91 m3/s (10 year storm or inlet pipe capacity) 6 Hour SCS Type II
d = 1.50 m (perm. pool depth)
Vf = 0.50 m/s (desired velocity prior to erosion
see page 4-56 in SWMP Manual)
Ld = 10 m Equation 4.6, p. 4-56, SWMP Manual
Provided = 25 m
3 Bottom Width, Wb (min.)
Dist. = 25 m (Length at surface)
Wb = 3 m Equation 4.7, p. 4-56, SWMP Manual
Provided = 5 m
4 Surface Area, As (max.)
At = 1280 m2(total perm. pool surface area)
As = 445 m2(Sediment Forebay Area)
Maximum = 33% (Maximum surface Area of Forebay)
Provided = 35%
Vt = 1016 m3(Total perm. pool Volume)
Vs = 325 m3(Forebay perm. pool Volume)
Maximum = 20% (Maximum Volume of Forebay)
Provided = 32%
Quality Control Requirements - Forebay Sheet 2 of 3
October 16, 2013
5061_1 ‐ Pond Quality ‐ WS101_2.xlsx Forebay
Project No: 12-5061
Project Name: Parkway EA - South End
Designed/Checked By: MJH / KS
Date:
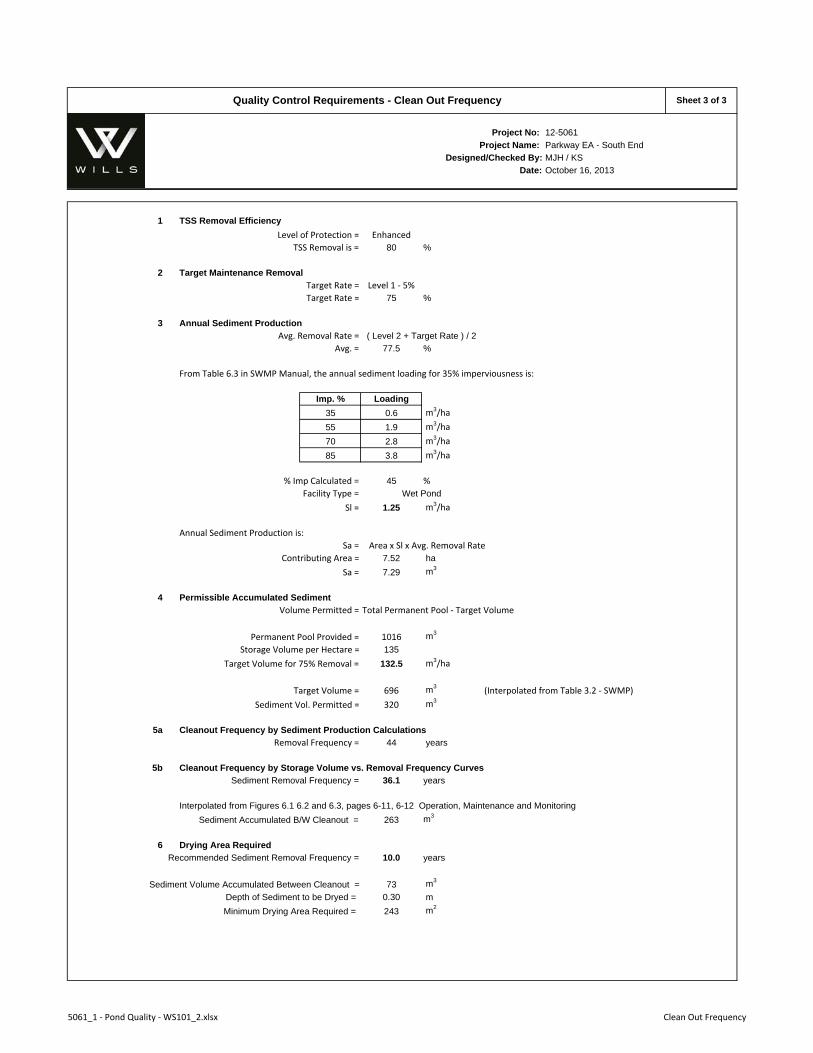
1 TSS Removal Efficiency
Level of Protection = Enhanced
TSS Removal is = 80 %
2 Target Maintenance Removal
Target Rate = Level 1 ‐ 5%
Target Rate = 75 %
3 Annual Sediment Production
Avg. Removal Rate =
Avg. = 77.5 %
From Table 6.3 in SWMP Manual, the annual sediment loading for 35% imperviousness is:
Imp. % Loading
35 0.6 m3/ha
55 1.9 m3/ha
70 2.8 m3/ha
85 3.8 m3/ha
% Imp Calculated = 45 %
Facility Type =
Sl = 1.25 m3/ha
Annual Sediment Production is:
Sa = Area x Sl x Avg. Removal Rate
Contributing Area = 7.52 ha
Sa = 7.29 m3
4 Permissible Accumulated Sediment
Volume Permitted = Total Permanent Pool ‐ Target Volume
Permanent Pool Provided = 1016 m3
Storage Volume per Hectare = 135
Target Volume for 75% Removal = 132.5 m3/ha
Target Volume = 696 m3(Interpolated from Table 3.2 ‐ SWMP)
Sediment Vol. Permitted = 320 m3
5a Cleanout Frequency by Sediment Production Calculations
Removal Frequency = 44 years
5b Cleanout Frequency by Storage Volume vs. Removal Frequency Curves
Sediment Removal Frequency = 36.1 years
Interpolated from Figures 6.1 6.2 and 6.3, pages 6-11, 6-12 Operation, Maintenance and Monitoring
Sediment Accumulated B/W Cleanout = 263 m3
6 Drying Area Required
Recommended Sediment Removal Frequency = 10.0 years
Sediment Volume Accumulated Between Cleanout = 73 m3
Depth of Sediment to be Dryed = 0.30 m
Minimum Drying Area Required = 243 m2
( Level 2 + Target Rate ) / 2
Wet Pond
Quality Control Requirements - Clean Out Frequency Sheet 3 of 3
October 16, 2013
5061_1 ‐ Pond Quality ‐ WS101_2.xlsx Clean Out Frequency
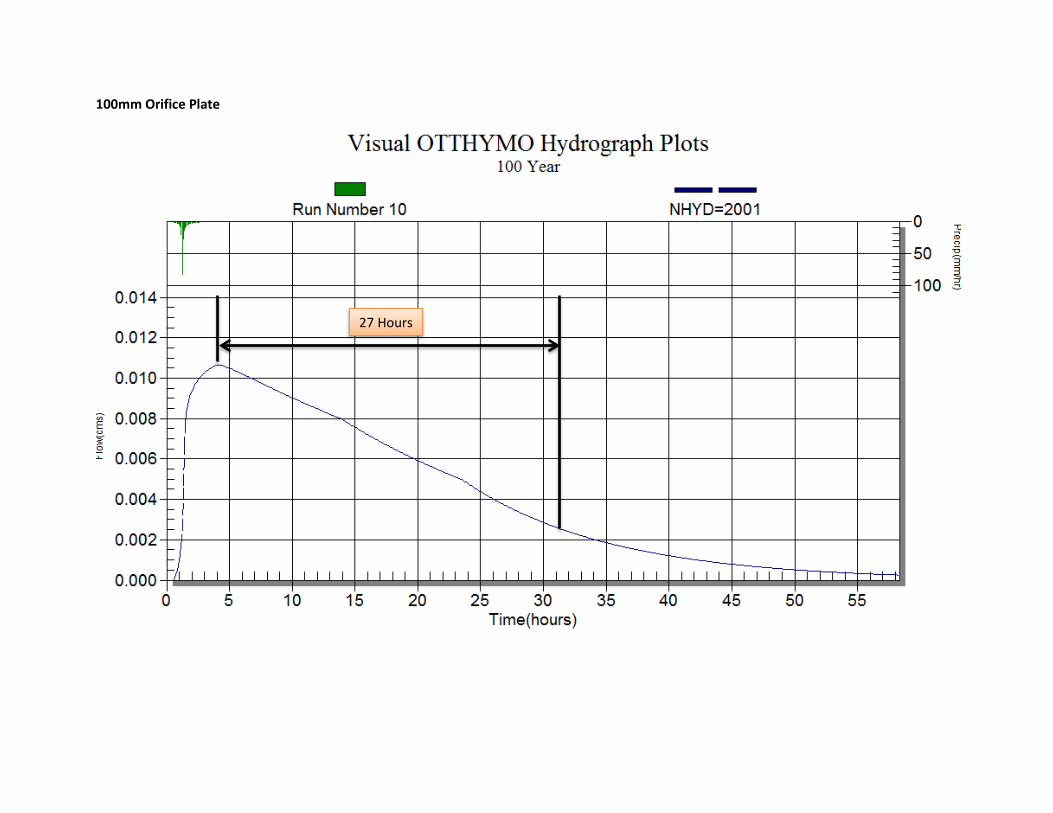
100mm Orifice Plate
27 Hours
Project No: 12-5061
Project Name: Parkway EA
Designed/Checked By: MJH / KS
Date:
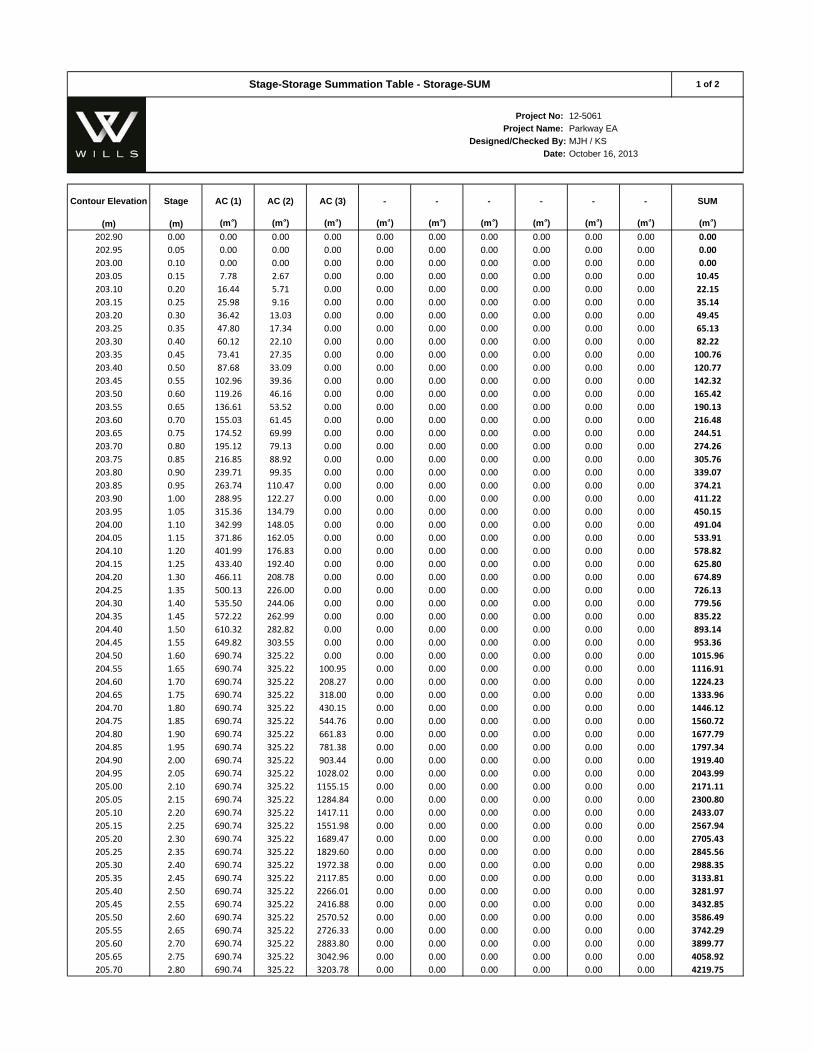
(m) (m) (m3) (m3) (m3) (m3) (m3) (m3) (m3) (m3) (m3) (m3)
202.90 0.00 0.00 0.00 0.00 0.00 0.00 0.00 0.00 0.00 0.00 0.00
202.95 0.05 0.00 0.00 0.00 0.00 0.00 0.00 0.00 0.00 0.00 0.00
203.00 0.10 0.00 0.00 0.00 0.00 0.00 0.00 0.00 0.00 0.00 0.00
203.05 0.15 7.78 2.67 0.00 0.00 0.00 0.00 0.00 0.00 0.00 10.45
203.10 0.20 16.44 5.71 0.00 0.00 0.00 0.00 0.00 0.00 0.00 22.15
203.15 0.25 25.98 9.16 0.00 0.00 0.00 0.00 0.00 0.00 0.00 35.14
203.20 0.30 36.42 13.03 0.00 0.00 0.00 0.00 0.00 0.00 0.00 49.45
203.25 0.35 47.80 17.34 0.00 0.00 0.00 0.00 0.00 0.00 0.00 65.13
203.30 0.40 60.12 22.10 0.00 0.00 0.00 0.00 0.00 0.00 0.00 82.22
203.35 0.45 73.41 27.35 0.00 0.00 0.00 0.00 0.00 0.00 0.00 100.76
203.40 0.50 87.68 33.09 0.00 0.00 0.00 0.00 0.00 0.00 0.00 120.77
203.45 0.55 102.96 39.36 0.00 0.00 0.00 0.00 0.00 0.00 0.00 142.32
203.50 0.60 119.26 46.16 0.00 0.00 0.00 0.00 0.00 0.00 0.00 165.42
203.55 0.65 136.61 53.52 0.00 0.00 0.00 0.00 0.00 0.00 0.00 190.13
203.60 0.70 155.03 61.45 0.00 0.00 0.00 0.00 0.00 0.00 0.00 216.48
203.65 0.75 174.52 69.99 0.00 0.00 0.00 0.00 0.00 0.00 0.00 244.51
203.70 0.80 195.12 79.13 0.00 0.00 0.00 0.00 0.00 0.00 0.00 274.26
203.75 0.85 216.85 88.92 0.00 0.00 0.00 0.00 0.00 0.00 0.00 305.76
203.80 0.90 239.71 99.35 0.00 0.00 0.00 0.00 0.00 0.00 0.00 339.07
203.85 0.95 263.74 110.47 0.00 0.00 0.00 0.00 0.00 0.00 0.00 374.21
203.90 1.00 288.95 122.27 0.00 0.00 0.00 0.00 0.00 0.00 0.00 411.22
203.95 1.05 315.36 134.79 0.00 0.00 0.00 0.00 0.00 0.00 0.00 450.15
204.00 1.10 342.99 148.05 0.00 0.00 0.00 0.00 0.00 0.00 0.00 491.04
204.05 1.15 371.86 162.05 0.00 0.00 0.00 0.00 0.00 0.00 0.00 533.91
204.10 1.20 401.99 176.83 0.00 0.00 0.00 0.00 0.00 0.00 0.00 578.82
204.15 1.25 433.40 192.40 0.00 0.00 0.00 0.00 0.00 0.00 0.00 625.80
204.20 1.30 466.11 208.78 0.00 0.00 0.00 0.00 0.00 0.00 0.00 674.89
204.25 1.35 500.13 226.00 0.00 0.00 0.00 0.00 0.00 0.00 0.00 726.13
204.30 1.40 535.50 244.06 0.00 0.00 0.00 0.00 0.00 0.00 0.00 779.56
204.35 1.45 572.22 262.99 0.00 0.00 0.00 0.00 0.00 0.00 0.00 835.22
204.40 1.50 610.32 282.82 0.00 0.00 0.00 0.00 0.00 0.00 0.00 893.14
204.45 1.55 649.82 303.55 0.00 0.00 0.00 0.00 0.00 0.00 0.00 953.36
204.50 1.60 690.74 325.22 0.00 0.00 0.00 0.00 0.00 0.00 0.00 1015.96
204.55 1.65 690.74 325.22 100.95 0.00 0.00 0.00 0.00 0.00 0.00 1116.91
204.60 1.70 690.74 325.22 208.27 0.00 0.00 0.00 0.00 0.00 0.00 1224.23
204.65 1.75 690.74 325.22 318.00 0.00 0.00 0.00 0.00 0.00 0.00 1333.96
204.70 1.80 690.74 325.22 430.15 0.00 0.00 0.00 0.00 0.00 0.00 1446.12
204.75 1.85 690.74 325.22 544.76 0.00 0.00 0.00 0.00 0.00 0.00 1560.72
204.80 1.90 690.74 325.22 661.83 0.00 0.00 0.00 0.00 0.00 0.00 1677.79
204.85 1.95 690.74 325.22 781.38 0.00 0.00 0.00 0.00 0.00 0.00 1797.34
204.90 2.00 690.74 325.22 903.44 0.00 0.00 0.00 0.00 0.00 0.00 1919.40
204.95 2.05 690.74 325.22 1028.02 0.00 0.00 0.00 0.00 0.00 0.00 2043.99
205.00 2.10 690.74 325.22 1155.15 0.00 0.00 0.00 0.00 0.00 0.00 2171.11
205.05 2.15 690.74 325.22 1284.84 0.00 0.00 0.00 0.00 0.00 0.00 2300.80
205.10 2.20 690.74 325.22 1417.11 0.00 0.00 0.00 0.00 0.00 0.00 2433.07
205.15 2.25 690.74 325.22 1551.98 0.00 0.00 0.00 0.00 0.00 0.00 2567.94
205.20 2.30 690.74 325.22 1689.47 0.00 0.00 0.00 0.00 0.00 0.00 2705.43
205.25 2.35 690.74 325.22 1829.60 0.00 0.00 0.00 0.00 0.00 0.00 2845.56
205.30 2.40 690.74 325.22 1972.38 0.00 0.00 0.00 0.00 0.00 0.00 2988.35
205.35 2.45 690.74 325.22 2117.85 0.00 0.00 0.00 0.00 0.00 0.00 3133.81
205.40 2.50 690.74 325.22 2266.01 0.00 0.00 0.00 0.00 0.00 0.00 3281.97
205.45 2.55 690.74 325.22 2416.88 0.00 0.00 0.00 0.00 0.00 0.00 3432.85
205.50 2.60 690.74 325.22 2570.52 0.00 0.00 0.00 0.00 0.00 0.00 3586.49
205.55 2.65 690.74 325.22 2726.33 0.00 0.00 0.00 0.00 0.00 0.00 3742.29
205.60 2.70 690.74 325.22 2883.80 0.00 0.00 0.00 0.00 0.00 0.00 3899.77
205.65 2.75 690.74 325.22 3042.96 0.00 0.00 0.00 0.00 0.00 0.00 4058.92
205.70 2.80 690.74 325.22 3203.78 0.00 0.00 0.00 0.00 0.00 0.00 4219.75
1 of 2
SUM
October 16, 2013
Contour Elevation AC (1)Stage AC (3) - - - - - -AC (2)
Stage-Storage Summation Table - Storage-SUM
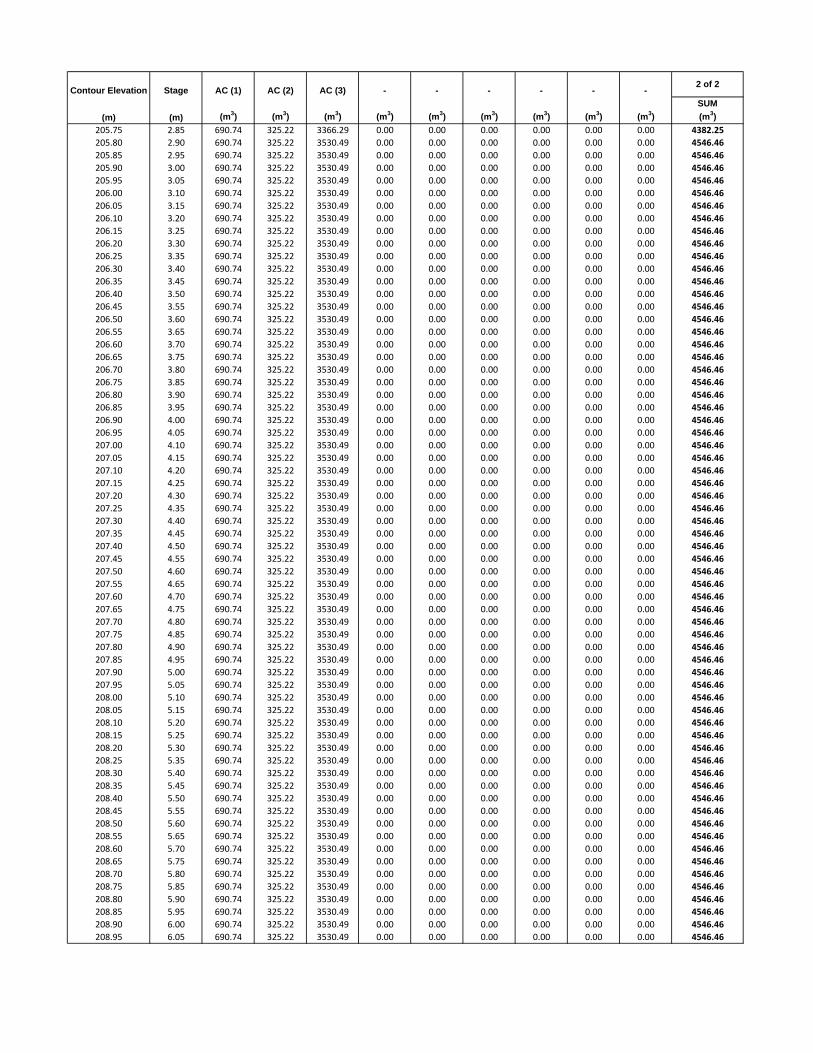
SUM
(m) (m) (m3) (m3) (m3) (m3) (m3) (m3) (m3) (m3) (m3) (m3)
205.75 2.85 690.74 325.22 3366.29 0.00 0.00 0.00 0.00 0.00 0.00 4382.25
205.80 2.90 690.74 325.22 3530.49 0.00 0.00 0.00 0.00 0.00 0.00 4546.46
205.85 2.95 690.74 325.22 3530.49 0.00 0.00 0.00 0.00 0.00 0.00 4546.46
205.90 3.00 690.74 325.22 3530.49 0.00 0.00 0.00 0.00 0.00 0.00 4546.46
205.95 3.05 690.74 325.22 3530.49 0.00 0.00 0.00 0.00 0.00 0.00 4546.46
206.00 3.10 690.74 325.22 3530.49 0.00 0.00 0.00 0.00 0.00 0.00 4546.46
206.05 3.15 690.74 325.22 3530.49 0.00 0.00 0.00 0.00 0.00 0.00 4546.46
206.10 3.20 690.74 325.22 3530.49 0.00 0.00 0.00 0.00 0.00 0.00 4546.46
206.15 3.25 690.74 325.22 3530.49 0.00 0.00 0.00 0.00 0.00 0.00 4546.46
206.20 3.30 690.74 325.22 3530.49 0.00 0.00 0.00 0.00 0.00 0.00 4546.46
206.25 3.35 690.74 325.22 3530.49 0.00 0.00 0.00 0.00 0.00 0.00 4546.46
206.30 3.40 690.74 325.22 3530.49 0.00 0.00 0.00 0.00 0.00 0.00 4546.46
206.35 3.45 690.74 325.22 3530.49 0.00 0.00 0.00 0.00 0.00 0.00 4546.46
206.40 3.50 690.74 325.22 3530.49 0.00 0.00 0.00 0.00 0.00 0.00 4546.46
206.45 3.55 690.74 325.22 3530.49 0.00 0.00 0.00 0.00 0.00 0.00 4546.46
206.50 3.60 690.74 325.22 3530.49 0.00 0.00 0.00 0.00 0.00 0.00 4546.46
206.55 3.65 690.74 325.22 3530.49 0.00 0.00 0.00 0.00 0.00 0.00 4546.46
206.60 3.70 690.74 325.22 3530.49 0.00 0.00 0.00 0.00 0.00 0.00 4546.46
206.65 3.75 690.74 325.22 3530.49 0.00 0.00 0.00 0.00 0.00 0.00 4546.46
206.70 3.80 690.74 325.22 3530.49 0.00 0.00 0.00 0.00 0.00 0.00 4546.46
206.75 3.85 690.74 325.22 3530.49 0.00 0.00 0.00 0.00 0.00 0.00 4546.46
206.80 3.90 690.74 325.22 3530.49 0.00 0.00 0.00 0.00 0.00 0.00 4546.46
206.85 3.95 690.74 325.22 3530.49 0.00 0.00 0.00 0.00 0.00 0.00 4546.46
206.90 4.00 690.74 325.22 3530.49 0.00 0.00 0.00 0.00 0.00 0.00 4546.46
206.95 4.05 690.74 325.22 3530.49 0.00 0.00 0.00 0.00 0.00 0.00 4546.46
207.00 4.10 690.74 325.22 3530.49 0.00 0.00 0.00 0.00 0.00 0.00 4546.46
207.05 4.15 690.74 325.22 3530.49 0.00 0.00 0.00 0.00 0.00 0.00 4546.46
207.10 4.20 690.74 325.22 3530.49 0.00 0.00 0.00 0.00 0.00 0.00 4546.46
207.15 4.25 690.74 325.22 3530.49 0.00 0.00 0.00 0.00 0.00 0.00 4546.46
207.20 4.30 690.74 325.22 3530.49 0.00 0.00 0.00 0.00 0.00 0.00 4546.46
207.25 4.35 690.74 325.22 3530.49 0.00 0.00 0.00 0.00 0.00 0.00 4546.46
207.30 4.40 690.74 325.22 3530.49 0.00 0.00 0.00 0.00 0.00 0.00 4546.46
207.35 4.45 690.74 325.22 3530.49 0.00 0.00 0.00 0.00 0.00 0.00 4546.46
207.40 4.50 690.74 325.22 3530.49 0.00 0.00 0.00 0.00 0.00 0.00 4546.46
207.45 4.55 690.74 325.22 3530.49 0.00 0.00 0.00 0.00 0.00 0.00 4546.46
207.50 4.60 690.74 325.22 3530.49 0.00 0.00 0.00 0.00 0.00 0.00 4546.46
207.55 4.65 690.74 325.22 3530.49 0.00 0.00 0.00 0.00 0.00 0.00 4546.46
207.60 4.70 690.74 325.22 3530.49 0.00 0.00 0.00 0.00 0.00 0.00 4546.46
207.65 4.75 690.74 325.22 3530.49 0.00 0.00 0.00 0.00 0.00 0.00 4546.46
207.70 4.80 690.74 325.22 3530.49 0.00 0.00 0.00 0.00 0.00 0.00 4546.46
207.75 4.85 690.74 325.22 3530.49 0.00 0.00 0.00 0.00 0.00 0.00 4546.46
207.80 4.90 690.74 325.22 3530.49 0.00 0.00 0.00 0.00 0.00 0.00 4546.46
207.85 4.95 690.74 325.22 3530.49 0.00 0.00 0.00 0.00 0.00 0.00 4546.46
207.90 5.00 690.74 325.22 3530.49 0.00 0.00 0.00 0.00 0.00 0.00 4546.46
207.95 5.05 690.74 325.22 3530.49 0.00 0.00 0.00 0.00 0.00 0.00 4546.46
208.00 5.10 690.74 325.22 3530.49 0.00 0.00 0.00 0.00 0.00 0.00 4546.46
208.05 5.15 690.74 325.22 3530.49 0.00 0.00 0.00 0.00 0.00 0.00 4546.46
208.10 5.20 690.74 325.22 3530.49 0.00 0.00 0.00 0.00 0.00 0.00 4546.46
208.15 5.25 690.74 325.22 3530.49 0.00 0.00 0.00 0.00 0.00 0.00 4546.46
208.20 5.30 690.74 325.22 3530.49 0.00 0.00 0.00 0.00 0.00 0.00 4546.46
208.25 5.35 690.74 325.22 3530.49 0.00 0.00 0.00 0.00 0.00 0.00 4546.46
208.30 5.40 690.74 325.22 3530.49 0.00 0.00 0.00 0.00 0.00 0.00 4546.46
208.35 5.45 690.74 325.22 3530.49 0.00 0.00 0.00 0.00 0.00 0.00 4546.46
208.40 5.50 690.74 325.22 3530.49 0.00 0.00 0.00 0.00 0.00 0.00 4546.46
208.45 5.55 690.74 325.22 3530.49 0.00 0.00 0.00 0.00 0.00 0.00 4546.46
208.50 5.60 690.74 325.22 3530.49 0.00 0.00 0.00 0.00 0.00 0.00 4546.46
208.55 5.65 690.74 325.22 3530.49 0.00 0.00 0.00 0.00 0.00 0.00 4546.46
208.60 5.70 690.74 325.22 3530.49 0.00 0.00 0.00 0.00 0.00 0.00 4546.46
208.65 5.75 690.74 325.22 3530.49 0.00 0.00 0.00 0.00 0.00 0.00 4546.46
208.70 5.80 690.74 325.22 3530.49 0.00 0.00 0.00 0.00 0.00 0.00 4546.46
208.75 5.85 690.74 325.22 3530.49 0.00 0.00 0.00 0.00 0.00 0.00 4546.46
208.80 5.90 690.74 325.22 3530.49 0.00 0.00 0.00 0.00 0.00 0.00 4546.46
208.85 5.95 690.74 325.22 3530.49 0.00 0.00 0.00 0.00 0.00 0.00 4546.46
208.90 6.00 690.74 325.22 3530.49 0.00 0.00 0.00 0.00 0.00 0.00 4546.46
208.95 6.05 690.74 325.22 3530.49 0.00 0.00 0.00 0.00 0.00 0.00 4546.46
- - -2 of 2
-- -Contour Elevation Stage AC (1) AC (2) AC (3)

Project No: Parkway EA
Project Name: 12-5061
Designed/Checked By: MJH / KS
Date:
(m) (m) (m3) (ha.m)
202.90 0.00 0.00 0.0000
202.95 0.05 0.00 0.0000
203.00 0.10 0.00 0.0000 << Bottom of Ponding = 203
203.05 0.15 7.78 0.0008
203.10 0.20 16.44 0.0016
203.15 0.25 25.98 0.0026
203.20 0.30 36.42 0.0036
203.25 0.35 47.80 0.0048
203.30 0.40 60.12 0.0060
203.35 0.45 73.41 0.0073
203.40 0.50 87.68 0.0088
203.45 0.55 102.96 0.0103
203.50 0.60 119.26 0.0119
203.55 0.65 136.61 0.0137
203.60 0.70 155.03 0.0155
203.65 0.75 174.52 0.0175
203.70 0.80 195.12 0.0195
203.75 0.85 216.85 0.0217
203.80 0.90 239.71 0.0240
203.85 0.95 263.74 0.0264
203.90 1.00 288.95 0.0289
203.95 1.05 315.36 0.0315
204.00 1.10 342.99 0.0343
204.05 1.15 371.86 0.0372
204.10 1.20 401.99 0.0402
204.15 1.25 433.40 0.0433
204.20 1.30 466.11 0.0466
204.25 1.35 500.13 0.0500
204.30 1.40 535.50 0.0535
204.35 1.45 572.22 0.0572
204.40 1.50 610.32 0.0610
204.45 1.55 649.82 0.0650
204.50 1.60 690.74 0.0691 << Top of Ponding = 204.5
204.55 1.65 690.74 0.0691
204.60 1.70 690.74 0.0691
204.65 1.75 690.74 0.0691
204.70 1.80 690.74 0.0691
204.75 1.85 690.74 0.0691
204.80 1.90 690.74 0.0691
204.85 1.95 690.74 0.0691
204.90 2.00 690.74 0.0691
204.95 2.05 690.74 0.0691
205.00 2.10 690.74 0.0691
205.05 2.15 690.74 0.0691
205.10 2.20 690.74 0.0691
205.15 2.25 690.74 0.0691
205.20 2.30 690.74 0.0691
205.25 2.35 690.74 0.0691
205.30 2.40 690.74 0.0691
205.35 2.45 690.74 0.0691
205.40 2.50 690.74 0.0691
205.45 2.55 690.74 0.0691
205.50 2.60 690.74 0.0691
205.55 2.65 690.74 0.0691
205.60 2.70 690.74 0.0691
205.65 2.75 690.74 0.0691
205.70 2.80 690.74 0.0691
Elevation StageTotal
VolumeTotal
Volume
Wednesday, October 16, 2013
Stage-Storage - AC (1) 1 of 1

Project No: Parkway EA
Project Name: 12-5061
Designed/Checked By: MJH / KS
Date:
(m) (m) (m3) (ha.m)
202.90 0.00 0.00 0.0000
202.95 0.05 0.00 0.0000
203.00 0.10 0.00 0.0000 << Bottom of Ponding = 203
203.05 0.15 2.67 0.0003
203.10 0.20 5.71 0.0006
203.15 0.25 9.16 0.0009
203.20 0.30 13.03 0.0013
203.25 0.35 17.34 0.0017
203.30 0.40 22.10 0.0022
203.35 0.45 27.35 0.0027
203.40 0.50 33.09 0.0033
203.45 0.55 39.36 0.0039
203.50 0.60 46.16 0.0046
203.55 0.65 53.52 0.0054
203.60 0.70 61.45 0.0061
203.65 0.75 69.99 0.0070
203.70 0.80 79.13 0.0079
203.75 0.85 88.92 0.0089
203.80 0.90 99.35 0.0099
203.85 0.95 110.47 0.0110
203.90 1.00 122.27 0.0122
203.95 1.05 134.79 0.0135
204.00 1.10 148.05 0.0148
204.05 1.15 162.05 0.0162
204.10 1.20 176.83 0.0177
204.15 1.25 192.40 0.0192
204.20 1.30 208.78 0.0209
204.25 1.35 226.00 0.0226
204.30 1.40 244.06 0.0244
204.35 1.45 262.99 0.0263
204.40 1.50 282.82 0.0283
204.45 1.55 303.55 0.0304
204.50 1.60 325.22 0.0325 << Top of Ponding = 204.5
204.55 1.65 325.22 0.0325
204.60 1.70 325.22 0.0325
204.65 1.75 325.22 0.0325
204.70 1.80 325.22 0.0325
204.75 1.85 325.22 0.0325
204.80 1.90 325.22 0.0325
204.85 1.95 325.22 0.0325
204.90 2.00 325.22 0.0325
204.95 2.05 325.22 0.0325
205.00 2.10 325.22 0.0325
205.05 2.15 325.22 0.0325
205.10 2.20 325.22 0.0325
205.15 2.25 325.22 0.0325
205.20 2.30 325.22 0.0325
205.25 2.35 325.22 0.0325
205.30 2.40 325.22 0.0325
205.35 2.45 325.22 0.0325
205.40 2.50 325.22 0.0325
205.45 2.55 325.22 0.0325
205.50 2.60 325.22 0.0325
205.55 2.65 325.22 0.0325
205.60 2.70 325.22 0.0325
205.65 2.75 325.22 0.0325
205.70 2.80 325.22 0.0325
Stage-Storage - AC (2) 1 of 1
Elevation StageTotal
Volume
Wednesday, October 16, 2013
Total Volume
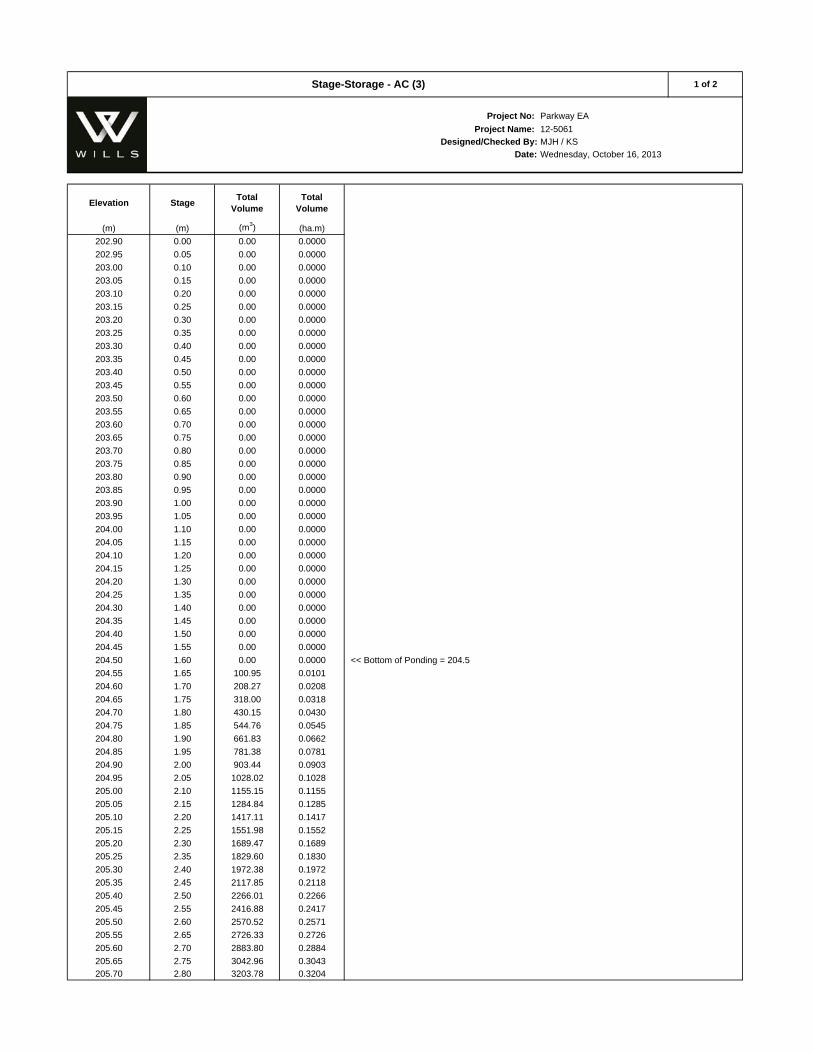
Project No: Parkway EA
Project Name: 12-5061
Designed/Checked By: MJH / KS
Date:
(m) (m) (m3) (ha.m)
202.90 0.00 0.00 0.0000
202.95 0.05 0.00 0.0000
203.00 0.10 0.00 0.0000
203.05 0.15 0.00 0.0000
203.10 0.20 0.00 0.0000
203.15 0.25 0.00 0.0000
203.20 0.30 0.00 0.0000
203.25 0.35 0.00 0.0000
203.30 0.40 0.00 0.0000
203.35 0.45 0.00 0.0000
203.40 0.50 0.00 0.0000
203.45 0.55 0.00 0.0000
203.50 0.60 0.00 0.0000
203.55 0.65 0.00 0.0000
203.60 0.70 0.00 0.0000
203.65 0.75 0.00 0.0000
203.70 0.80 0.00 0.0000
203.75 0.85 0.00 0.0000
203.80 0.90 0.00 0.0000
203.85 0.95 0.00 0.0000
203.90 1.00 0.00 0.0000
203.95 1.05 0.00 0.0000
204.00 1.10 0.00 0.0000
204.05 1.15 0.00 0.0000
204.10 1.20 0.00 0.0000
204.15 1.25 0.00 0.0000
204.20 1.30 0.00 0.0000
204.25 1.35 0.00 0.0000
204.30 1.40 0.00 0.0000
204.35 1.45 0.00 0.0000
204.40 1.50 0.00 0.0000
204.45 1.55 0.00 0.0000
204.50 1.60 0.00 0.0000 << Bottom of Ponding = 204.5
204.55 1.65 100.95 0.0101
204.60 1.70 208.27 0.0208
204.65 1.75 318.00 0.0318
204.70 1.80 430.15 0.0430
204.75 1.85 544.76 0.0545
204.80 1.90 661.83 0.0662
204.85 1.95 781.38 0.0781
204.90 2.00 903.44 0.0903
204.95 2.05 1028.02 0.1028
205.00 2.10 1155.15 0.1155
205.05 2.15 1284.84 0.1285
205.10 2.20 1417.11 0.1417
205.15 2.25 1551.98 0.1552
205.20 2.30 1689.47 0.1689
205.25 2.35 1829.60 0.1830
205.30 2.40 1972.38 0.1972
205.35 2.45 2117.85 0.2118
205.40 2.50 2266.01 0.2266
205.45 2.55 2416.88 0.2417
205.50 2.60 2570.52 0.2571
205.55 2.65 2726.33 0.2726
205.60 2.70 2883.80 0.2884
205.65 2.75 3042.96 0.3043
205.70 2.80 3203.78 0.3204
Stage-Storage - AC (3) 1 of 2
Elevation StageTotal
Volume
Wednesday, October 16, 2013
Total Volume
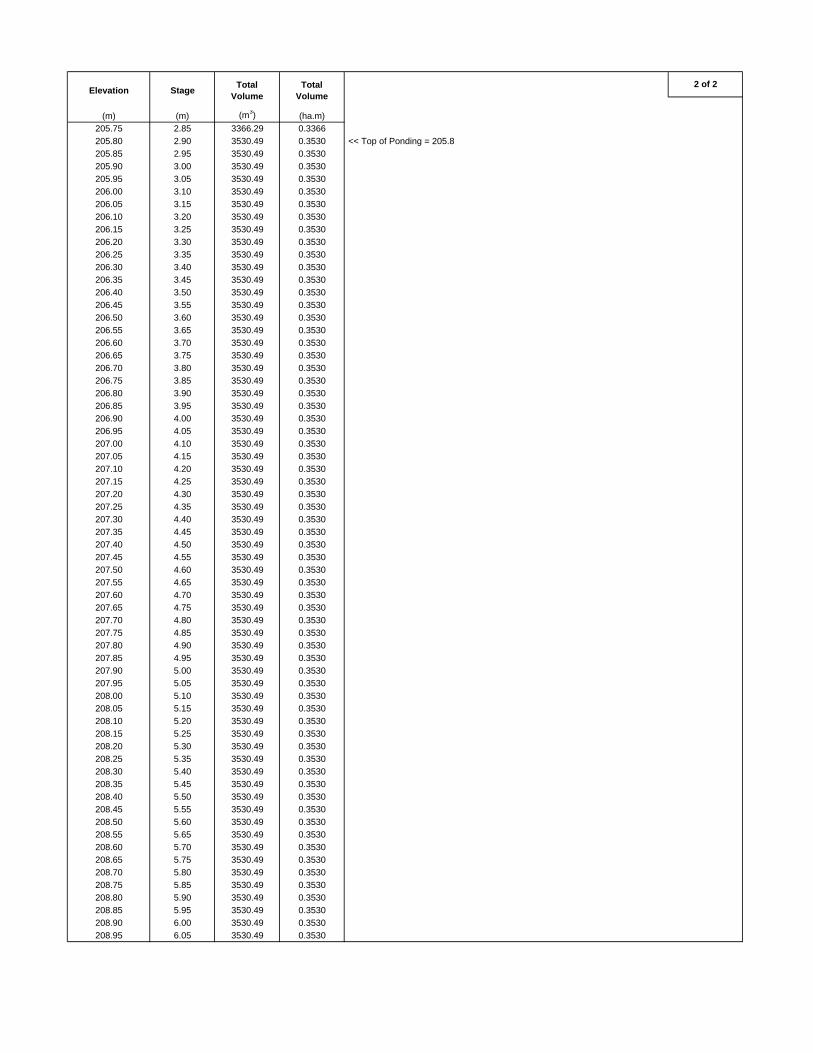
(m) (m) (m3) (ha.m)
205.75 2.85 3366.29 0.3366
205.80 2.90 3530.49 0.3530 << Top of Ponding = 205.8
205.85 2.95 3530.49 0.3530
205.90 3.00 3530.49 0.3530
205.95 3.05 3530.49 0.3530
206.00 3.10 3530.49 0.3530
206.05 3.15 3530.49 0.3530
206.10 3.20 3530.49 0.3530
206.15 3.25 3530.49 0.3530
206.20 3.30 3530.49 0.3530
206.25 3.35 3530.49 0.3530
206.30 3.40 3530.49 0.3530
206.35 3.45 3530.49 0.3530
206.40 3.50 3530.49 0.3530
206.45 3.55 3530.49 0.3530
206.50 3.60 3530.49 0.3530
206.55 3.65 3530.49 0.3530
206.60 3.70 3530.49 0.3530
206.65 3.75 3530.49 0.3530
206.70 3.80 3530.49 0.3530
206.75 3.85 3530.49 0.3530
206.80 3.90 3530.49 0.3530
206.85 3.95 3530.49 0.3530
206.90 4.00 3530.49 0.3530
206.95 4.05 3530.49 0.3530
207.00 4.10 3530.49 0.3530
207.05 4.15 3530.49 0.3530
207.10 4.20 3530.49 0.3530
207.15 4.25 3530.49 0.3530
207.20 4.30 3530.49 0.3530
207.25 4.35 3530.49 0.3530
207.30 4.40 3530.49 0.3530
207.35 4.45 3530.49 0.3530
207.40 4.50 3530.49 0.3530
207.45 4.55 3530.49 0.3530
207.50 4.60 3530.49 0.3530
207.55 4.65 3530.49 0.3530
207.60 4.70 3530.49 0.3530
207.65 4.75 3530.49 0.3530
207.70 4.80 3530.49 0.3530
207.75 4.85 3530.49 0.3530
207.80 4.90 3530.49 0.3530
207.85 4.95 3530.49 0.3530
207.90 5.00 3530.49 0.3530
207.95 5.05 3530.49 0.3530
208.00 5.10 3530.49 0.3530
208.05 5.15 3530.49 0.3530
208.10 5.20 3530.49 0.3530
208.15 5.25 3530.49 0.3530
208.20 5.30 3530.49 0.3530
208.25 5.35 3530.49 0.3530
208.30 5.40 3530.49 0.3530
208.35 5.45 3530.49 0.3530
208.40 5.50 3530.49 0.3530
208.45 5.55 3530.49 0.3530
208.50 5.60 3530.49 0.3530
208.55 5.65 3530.49 0.3530
208.60 5.70 3530.49 0.3530
208.65 5.75 3530.49 0.3530
208.70 5.80 3530.49 0.3530
208.75 5.85 3530.49 0.3530
208.80 5.90 3530.49 0.3530
208.85 5.95 3530.49 0.3530
208.90 6.00 3530.49 0.3530
208.95 6.05 3530.49 0.3530
Total Volume
2 of 2Elevation Stage
Total Volume
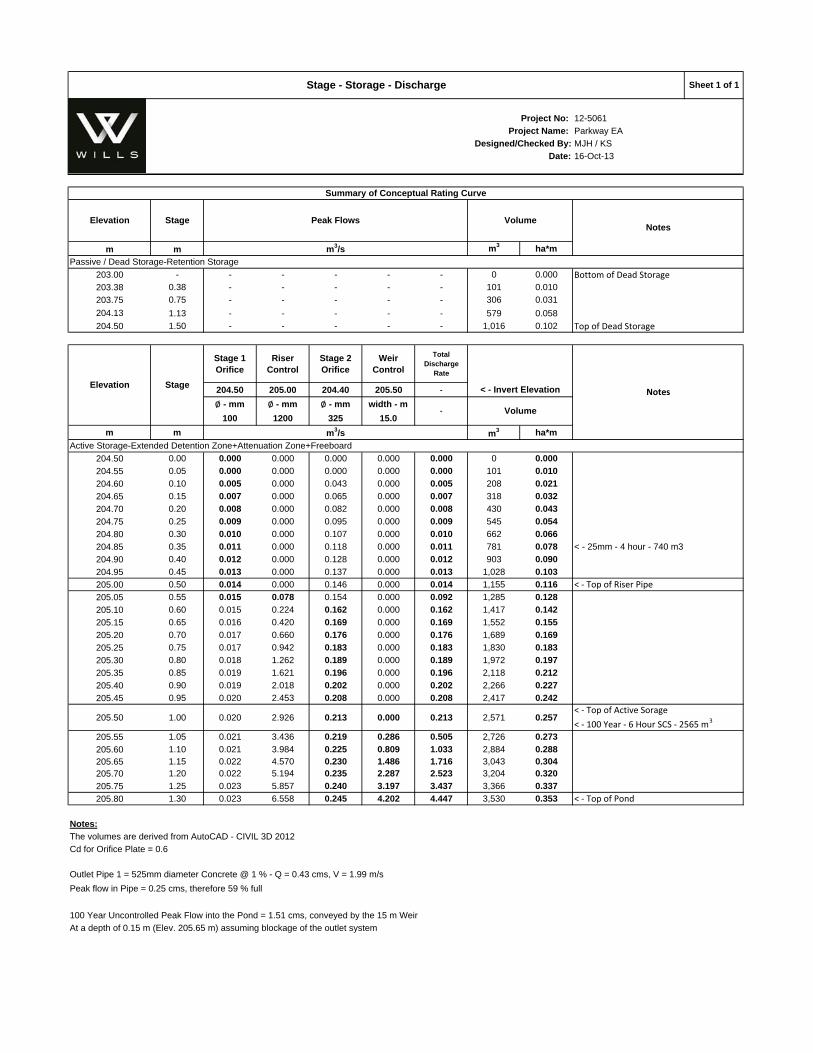
Project No: 12-5061
Project Name: Parkway EA
Designed/Checked By: MJH / KS
Date: 16-Oct-13
m m m3 ha*m
203.00 - - - - - - 0 0.000 Bottom of Dead Storage
203.38 0.38 - - - - - 101 0.010
203.75 0.75 - - - - - 306 0.031
204.13 1.13 - - - - - 579 0.058
204.50 1.50 - - - - - 1,016 0.102 Top of Dead Storage
Stage 1 Orifice
Riser Control
Stage 2 Orifice
Weir Control
Total Discharge
Rate
204.50 205.00 204.40 205.50 -
∅ - mm ∅ - mm ∅ - mm width - m
100 1200 325 15.0
m m m3 ha*m
204.50 0.00 0.000 0.000 0.000 0.000 0.000 0 0.000
204.55 0.05 0.000 0.000 0.000 0.000 0.000 101 0.010
204.60 0.10 0.005 0.000 0.043 0.000 0.005 208 0.021
204.65 0.15 0.007 0.000 0.065 0.000 0.007 318 0.032
204.70 0.20 0.008 0.000 0.082 0.000 0.008 430 0.043
204.75 0.25 0.009 0.000 0.095 0.000 0.009 545 0.054
204.80 0.30 0.010 0.000 0.107 0.000 0.010 662 0.066
204.85 0.35 0.011 0.000 0.118 0.000 0.011 781 0.078 < - 25mm - 4 hour - 740 m3
204.90 0.40 0.012 0.000 0.128 0.000 0.012 903 0.090
204.95 0.45 0.013 0.000 0.137 0.000 0.013 1,028 0.103
205.00 0.50 0.014 0.000 0.146 0.000 0.014 1,155 0.116 < ‐ Top of Riser Pipe
205.05 0.55 0.015 0.078 0.154 0.000 0.092 1,285 0.128
205.10 0.60 0.015 0.224 0.162 0.000 0.162 1,417 0.142
205.15 0.65 0.016 0.420 0.169 0.000 0.169 1,552 0.155
205.20 0.70 0.017 0.660 0.176 0.000 0.176 1,689 0.169
205.25 0.75 0.017 0.942 0.183 0.000 0.183 1,830 0.183
205.30 0.80 0.018 1.262 0.189 0.000 0.189 1,972 0.197
205.35 0.85 0.019 1.621 0.196 0.000 0.196 2,118 0.212
205.40 0.90 0.019 2.018 0.202 0.000 0.202 2,266 0.227
205.45 0.95 0.020 2.453 0.208 0.000 0.208 2,417 0.242
205.50 1.00 0.020 2.926 0.213 0.000 0.213 2,571 0.257
205.55 1.05 0.021 3.436 0.219 0.286 0.505 2,726 0.273
205.60 1.10 0.021 3.984 0.225 0.809 1.033 2,884 0.288205.65 1.15 0.022 4.570 0.230 1.486 1.716 3,043 0.304205.70 1.20 0.022 5.194 0.235 2.287 2.523 3,204 0.320
205.75 1.25 0.023 5.857 0.240 3.197 3.437 3,366 0.337
205.80 1.30 0.023 6.558 0.245 4.202 4.447 3,530 0.353 < ‐ Top of Pond
Notes:
The volumes are derived from AutoCAD - CIVIL 3D 2012
Cd for Orifice Plate = 0.6
Outlet Pipe 1 = 525mm diameter Concrete @ 1 % - Q = 0.43 cms, V = 1.99 m/s
Peak flow in Pipe = 0.25 cms, therefore 59 % full
100 Year Uncontrolled Peak Flow into the Pond = 1.51 cms, conveyed by the 15 m Weir
At a depth of 0.15 m (Elev. 205.65 m) assuming blockage of the outlet system
m3/s
-
Passive / Dead Storage-Retention Storage
Volume
< - Invert Elevation Notes
Stage - Storage - Discharge Sheet 1 of 1
Summary of Conceptual Rating Curve
m3/s
Peak FlowsStageElevationNotes
Volume
< ‐ Top of Active Sorage
< ‐ 100 Year ‐ 6 Hour SCS ‐ 2565 m3
Stage
Active Storage-Extended Detention Zone+Attenuation Zone+Freeboard
Elevation
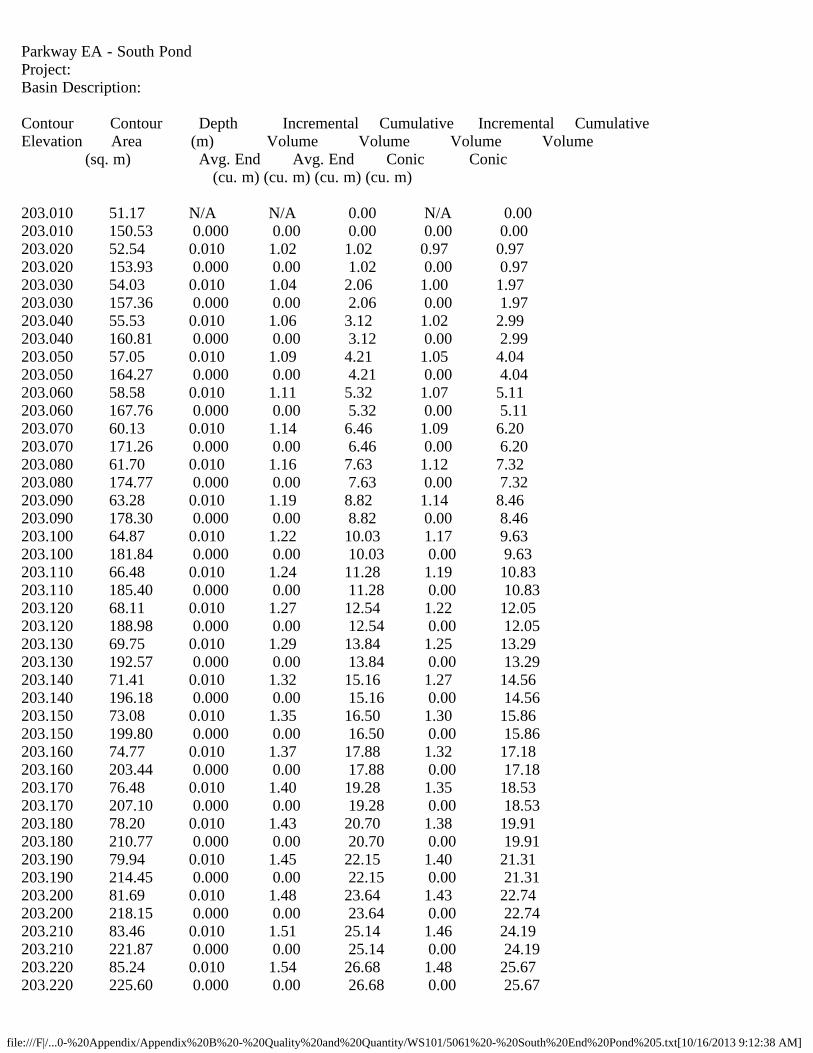
file:///F|/...0-%20Appendix/Appendix%20B%20-%20Quality%20and%20Quantity/WS101/5061%20-%20South%20End%20Pond%205.txt[10/16/2013 9:12:38 AM]
Parkway EA - South PondProject: Basin Description: Contour Contour Depth Incremental Cumulative Incremental CumulativeElevation Area (m) Volume Volume Volume Volume (sq. m) Avg. End Avg. End Conic Conic (cu. m) (cu. m) (cu. m) (cu. m) 203.010 51.17 N/A N/A 0.00 N/A 0.00203.010 150.53 0.000 0.00 0.00 0.00 0.00203.020 52.54 0.010 1.02 1.02 0.97 0.97203.020 153.93 0.000 0.00 1.02 0.00 0.97203.030 54.03 0.010 1.04 2.06 1.00 1.97203.030 157.36 0.000 0.00 2.06 0.00 1.97203.040 55.53 0.010 1.06 3.12 1.02 2.99203.040 160.81 0.000 0.00 3.12 0.00 2.99203.050 57.05 0.010 1.09 4.21 1.05 4.04203.050 164.27 0.000 0.00 4.21 0.00 4.04203.060 58.58 0.010 1.11 5.32 1.07 5.11203.060 167.76 0.000 0.00 5.32 0.00 5.11203.070 60.13 0.010 1.14 6.46 1.09 6.20203.070 171.26 0.000 0.00 6.46 0.00 6.20203.080 61.70 0.010 1.16 7.63 1.12 7.32203.080 174.77 0.000 0.00 7.63 0.00 7.32203.090 63.28 0.010 1.19 8.82 1.14 8.46203.090 178.30 0.000 0.00 8.82 0.00 8.46203.100 64.87 0.010 1.22 10.03 1.17 9.63203.100 181.84 0.000 0.00 10.03 0.00 9.63203.110 66.48 0.010 1.24 11.28 1.19 10.83203.110 185.40 0.000 0.00 11.28 0.00 10.83203.120 68.11 0.010 1.27 12.54 1.22 12.05203.120 188.98 0.000 0.00 12.54 0.00 12.05203.130 69.75 0.010 1.29 13.84 1.25 13.29203.130 192.57 0.000 0.00 13.84 0.00 13.29203.140 71.41 0.010 1.32 15.16 1.27 14.56203.140 196.18 0.000 0.00 15.16 0.00 14.56203.150 73.08 0.010 1.35 16.50 1.30 15.86203.150 199.80 0.000 0.00 16.50 0.00 15.86203.160 74.77 0.010 1.37 17.88 1.32 17.18203.160 203.44 0.000 0.00 17.88 0.00 17.18203.170 76.48 0.010 1.40 19.28 1.35 18.53203.170 207.10 0.000 0.00 19.28 0.00 18.53203.180 78.20 0.010 1.43 20.70 1.38 19.91203.180 210.77 0.000 0.00 20.70 0.00 19.91203.190 79.94 0.010 1.45 22.15 1.40 21.31203.190 214.45 0.000 0.00 22.15 0.00 21.31203.200 81.69 0.010 1.48 23.64 1.43 22.74203.200 218.15 0.000 0.00 23.64 0.00 22.74203.210 83.46 0.010 1.51 25.14 1.46 24.19203.210 221.87 0.000 0.00 25.14 0.00 24.19203.220 85.24 0.010 1.54 26.68 1.48 25.67203.220 225.60 0.000 0.00 26.68 0.00 25.67
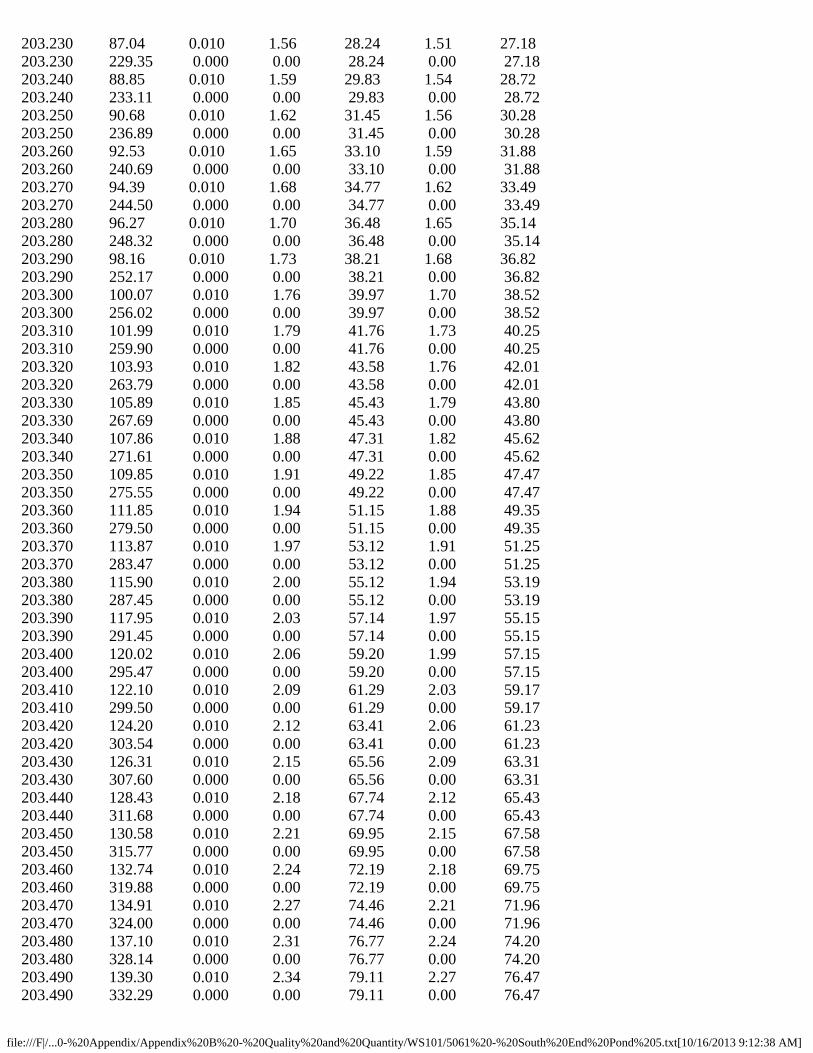
file:///F|/...0-%20Appendix/Appendix%20B%20-%20Quality%20and%20Quantity/WS101/5061%20-%20South%20End%20Pond%205.txt[10/16/2013 9:12:38 AM]
203.230 87.04 0.010 1.56 28.24 1.51 27.18203.230 229.35 0.000 0.00 28.24 0.00 27.18203.240 88.85 0.010 1.59 29.83 1.54 28.72203.240 233.11 0.000 0.00 29.83 0.00 28.72203.250 90.68 0.010 1.62 31.45 1.56 30.28203.250 236.89 0.000 0.00 31.45 0.00 30.28203.260 92.53 0.010 1.65 33.10 1.59 31.88203.260 240.69 0.000 0.00 33.10 0.00 31.88203.270 94.39 0.010 1.68 34.77 1.62 33.49203.270 244.50 0.000 0.00 34.77 0.00 33.49203.280 96.27 0.010 1.70 36.48 1.65 35.14203.280 248.32 0.000 0.00 36.48 0.00 35.14203.290 98.16 0.010 1.73 38.21 1.68 36.82203.290 252.17 0.000 0.00 38.21 0.00 36.82203.300 100.07 0.010 1.76 39.97 1.70 38.52203.300 256.02 0.000 0.00 39.97 0.00 38.52203.310 101.99 0.010 1.79 41.76 1.73 40.25203.310 259.90 0.000 0.00 41.76 0.00 40.25203.320 103.93 0.010 1.82 43.58 1.76 42.01203.320 263.79 0.000 0.00 43.58 0.00 42.01203.330 105.89 0.010 1.85 45.43 1.79 43.80203.330 267.69 0.000 0.00 45.43 0.00 43.80203.340 107.86 0.010 1.88 47.31 1.82 45.62203.340 271.61 0.000 0.00 47.31 0.00 45.62203.350 109.85 0.010 1.91 49.22 1.85 47.47203.350 275.55 0.000 0.00 49.22 0.00 47.47203.360 111.85 0.010 1.94 51.15 1.88 49.35203.360 279.50 0.000 0.00 51.15 0.00 49.35203.370 113.87 0.010 1.97 53.12 1.91 51.25203.370 283.47 0.000 0.00 53.12 0.00 51.25203.380 115.90 0.010 2.00 55.12 1.94 53.19203.380 287.45 0.000 0.00 55.12 0.00 53.19203.390 117.95 0.010 2.03 57.14 1.97 55.15203.390 291.45 0.000 0.00 57.14 0.00 55.15203.400 120.02 0.010 2.06 59.20 1.99 57.15203.400 295.47 0.000 0.00 59.20 0.00 57.15203.410 122.10 0.010 2.09 61.29 2.03 59.17203.410 299.50 0.000 0.00 61.29 0.00 59.17203.420 124.20 0.010 2.12 63.41 2.06 61.23203.420 303.54 0.000 0.00 63.41 0.00 61.23203.430 126.31 0.010 2.15 65.56 2.09 63.31203.430 307.60 0.000 0.00 65.56 0.00 63.31203.440 128.43 0.010 2.18 67.74 2.12 65.43203.440 311.68 0.000 0.00 67.74 0.00 65.43203.450 130.58 0.010 2.21 69.95 2.15 67.58203.450 315.77 0.000 0.00 69.95 0.00 67.58203.460 132.74 0.010 2.24 72.19 2.18 69.75203.460 319.88 0.000 0.00 72.19 0.00 69.75203.470 134.91 0.010 2.27 74.46 2.21 71.96203.470 324.00 0.000 0.00 74.46 0.00 71.96203.480 137.10 0.010 2.31 76.77 2.24 74.20203.480 328.14 0.000 0.00 76.77 0.00 74.20203.490 139.30 0.010 2.34 79.11 2.27 76.47203.490 332.29 0.000 0.00 79.11 0.00 76.47
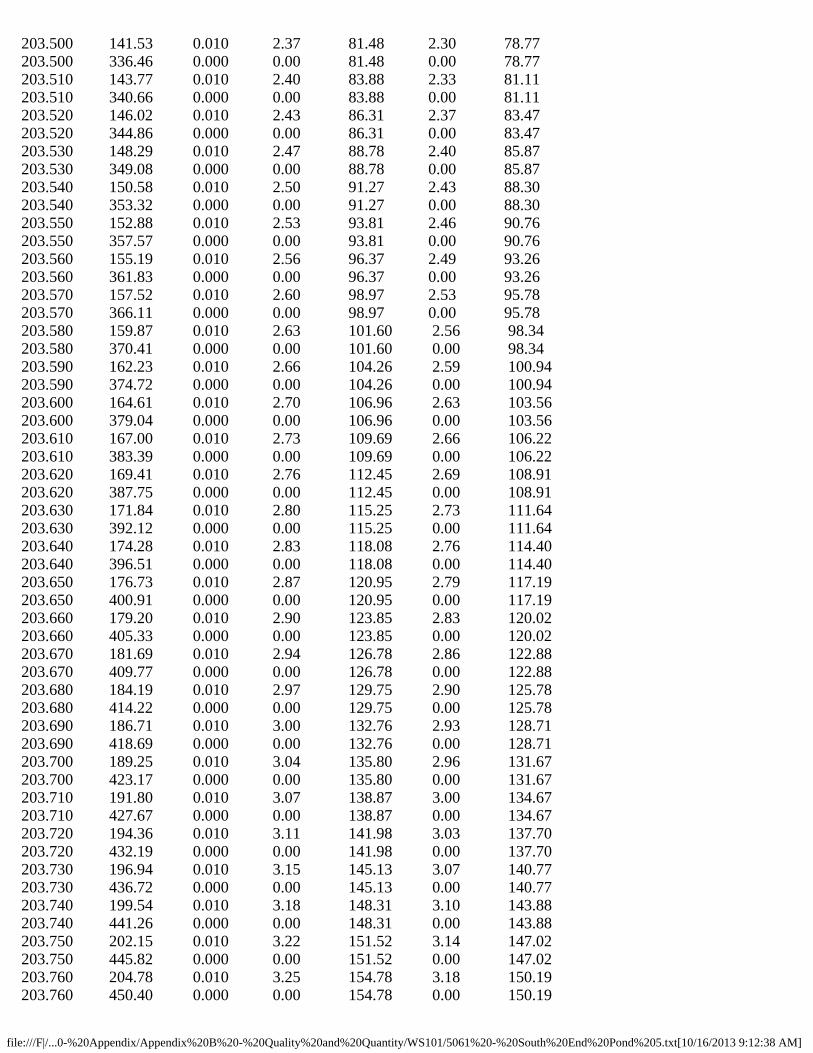
file:///F|/...0-%20Appendix/Appendix%20B%20-%20Quality%20and%20Quantity/WS101/5061%20-%20South%20End%20Pond%205.txt[10/16/2013 9:12:38 AM]
203.500 141.53 0.010 2.37 81.48 2.30 78.77203.500 336.46 0.000 0.00 81.48 0.00 78.77203.510 143.77 0.010 2.40 83.88 2.33 81.11203.510 340.66 0.000 0.00 83.88 0.00 81.11203.520 146.02 0.010 2.43 86.31 2.37 83.47203.520 344.86 0.000 0.00 86.31 0.00 83.47203.530 148.29 0.010 2.47 88.78 2.40 85.87203.530 349.08 0.000 0.00 88.78 0.00 85.87203.540 150.58 0.010 2.50 91.27 2.43 88.30203.540 353.32 0.000 0.00 91.27 0.00 88.30203.550 152.88 0.010 2.53 93.81 2.46 90.76203.550 357.57 0.000 0.00 93.81 0.00 90.76203.560 155.19 0.010 2.56 96.37 2.49 93.26203.560 361.83 0.000 0.00 96.37 0.00 93.26203.570 157.52 0.010 2.60 98.97 2.53 95.78203.570 366.11 0.000 0.00 98.97 0.00 95.78203.580 159.87 0.010 2.63 101.60 2.56 98.34203.580 370.41 0.000 0.00 101.60 0.00 98.34203.590 162.23 0.010 2.66 104.26 2.59 100.94203.590 374.72 0.000 0.00 104.26 0.00 100.94203.600 164.61 0.010 2.70 106.96 2.63 103.56203.600 379.04 0.000 0.00 106.96 0.00 103.56203.610 167.00 0.010 2.73 109.69 2.66 106.22203.610 383.39 0.000 0.00 109.69 0.00 106.22203.620 169.41 0.010 2.76 112.45 2.69 108.91203.620 387.75 0.000 0.00 112.45 0.00 108.91203.630 171.84 0.010 2.80 115.25 2.73 111.64203.630 392.12 0.000 0.00 115.25 0.00 111.64203.640 174.28 0.010 2.83 118.08 2.76 114.40203.640 396.51 0.000 0.00 118.08 0.00 114.40203.650 176.73 0.010 2.87 120.95 2.79 117.19203.650 400.91 0.000 0.00 120.95 0.00 117.19203.660 179.20 0.010 2.90 123.85 2.83 120.02203.660 405.33 0.000 0.00 123.85 0.00 120.02203.670 181.69 0.010 2.94 126.78 2.86 122.88203.670 409.77 0.000 0.00 126.78 0.00 122.88203.680 184.19 0.010 2.97 129.75 2.90 125.78203.680 414.22 0.000 0.00 129.75 0.00 125.78203.690 186.71 0.010 3.00 132.76 2.93 128.71203.690 418.69 0.000 0.00 132.76 0.00 128.71203.700 189.25 0.010 3.04 135.80 2.96 131.67203.700 423.17 0.000 0.00 135.80 0.00 131.67203.710 191.80 0.010 3.07 138.87 3.00 134.67203.710 427.67 0.000 0.00 138.87 0.00 134.67203.720 194.36 0.010 3.11 141.98 3.03 137.70203.720 432.19 0.000 0.00 141.98 0.00 137.70203.730 196.94 0.010 3.15 145.13 3.07 140.77203.730 436.72 0.000 0.00 145.13 0.00 140.77203.740 199.54 0.010 3.18 148.31 3.10 143.88203.740 441.26 0.000 0.00 148.31 0.00 143.88203.750 202.15 0.010 3.22 151.52 3.14 147.02203.750 445.82 0.000 0.00 151.52 0.00 147.02203.760 204.78 0.010 3.25 154.78 3.18 150.19203.760 450.40 0.000 0.00 154.78 0.00 150.19
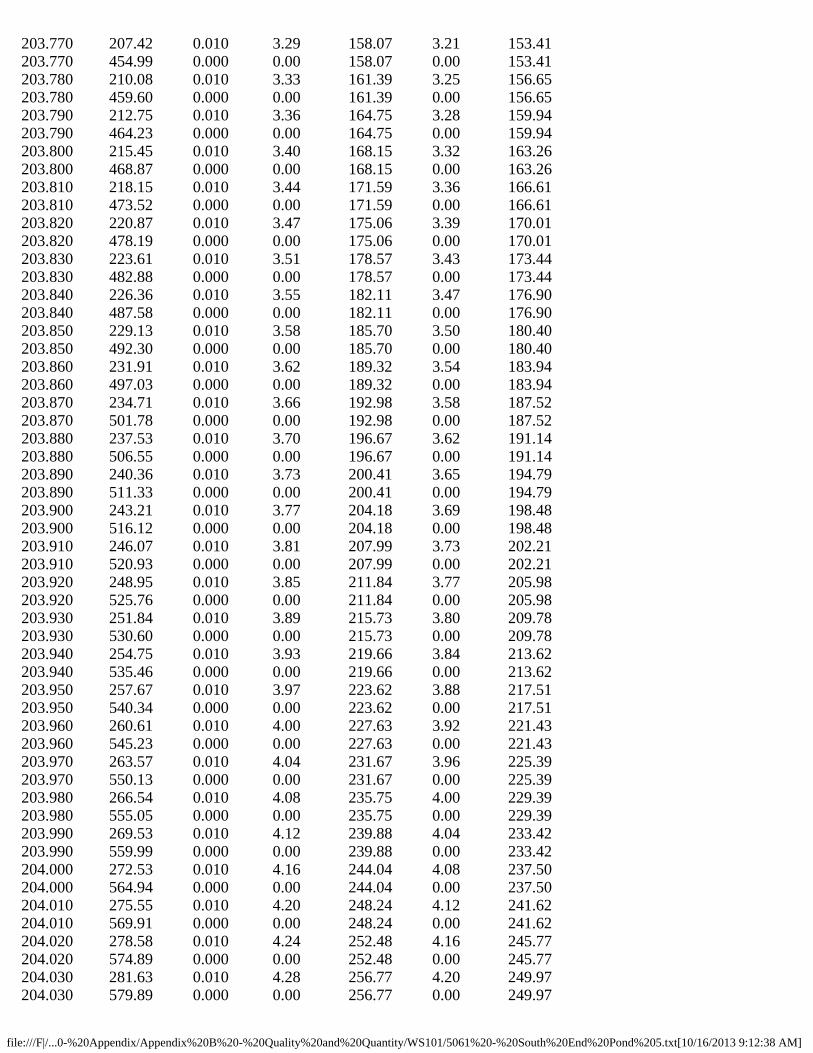
file:///F|/...0-%20Appendix/Appendix%20B%20-%20Quality%20and%20Quantity/WS101/5061%20-%20South%20End%20Pond%205.txt[10/16/2013 9:12:38 AM]
203.770 207.42 0.010 3.29 158.07 3.21 153.41203.770 454.99 0.000 0.00 158.07 0.00 153.41203.780 210.08 0.010 3.33 161.39 3.25 156.65203.780 459.60 0.000 0.00 161.39 0.00 156.65203.790 212.75 0.010 3.36 164.75 3.28 159.94203.790 464.23 0.000 0.00 164.75 0.00 159.94203.800 215.45 0.010 3.40 168.15 3.32 163.26203.800 468.87 0.000 0.00 168.15 0.00 163.26203.810 218.15 0.010 3.44 171.59 3.36 166.61203.810 473.52 0.000 0.00 171.59 0.00 166.61203.820 220.87 0.010 3.47 175.06 3.39 170.01203.820 478.19 0.000 0.00 175.06 0.00 170.01203.830 223.61 0.010 3.51 178.57 3.43 173.44203.830 482.88 0.000 0.00 178.57 0.00 173.44203.840 226.36 0.010 3.55 182.11 3.47 176.90203.840 487.58 0.000 0.00 182.11 0.00 176.90203.850 229.13 0.010 3.58 185.70 3.50 180.40203.850 492.30 0.000 0.00 185.70 0.00 180.40203.860 231.91 0.010 3.62 189.32 3.54 183.94203.860 497.03 0.000 0.00 189.32 0.00 183.94203.870 234.71 0.010 3.66 192.98 3.58 187.52203.870 501.78 0.000 0.00 192.98 0.00 187.52203.880 237.53 0.010 3.70 196.67 3.62 191.14203.880 506.55 0.000 0.00 196.67 0.00 191.14203.890 240.36 0.010 3.73 200.41 3.65 194.79203.890 511.33 0.000 0.00 200.41 0.00 194.79203.900 243.21 0.010 3.77 204.18 3.69 198.48203.900 516.12 0.000 0.00 204.18 0.00 198.48203.910 246.07 0.010 3.81 207.99 3.73 202.21203.910 520.93 0.000 0.00 207.99 0.00 202.21203.920 248.95 0.010 3.85 211.84 3.77 205.98203.920 525.76 0.000 0.00 211.84 0.00 205.98203.930 251.84 0.010 3.89 215.73 3.80 209.78203.930 530.60 0.000 0.00 215.73 0.00 209.78203.940 254.75 0.010 3.93 219.66 3.84 213.62203.940 535.46 0.000 0.00 219.66 0.00 213.62203.950 257.67 0.010 3.97 223.62 3.88 217.51203.950 540.34 0.000 0.00 223.62 0.00 217.51203.960 260.61 0.010 4.00 227.63 3.92 221.43203.960 545.23 0.000 0.00 227.63 0.00 221.43203.970 263.57 0.010 4.04 231.67 3.96 225.39203.970 550.13 0.000 0.00 231.67 0.00 225.39203.980 266.54 0.010 4.08 235.75 4.00 229.39203.980 555.05 0.000 0.00 235.75 0.00 229.39203.990 269.53 0.010 4.12 239.88 4.04 233.42203.990 559.99 0.000 0.00 239.88 0.00 233.42204.000 272.53 0.010 4.16 244.04 4.08 237.50204.000 564.94 0.000 0.00 244.04 0.00 237.50204.010 275.55 0.010 4.20 248.24 4.12 241.62204.010 569.91 0.000 0.00 248.24 0.00 241.62204.020 278.58 0.010 4.24 252.48 4.16 245.77204.020 574.89 0.000 0.00 252.48 0.00 245.77204.030 281.63 0.010 4.28 256.77 4.20 249.97204.030 579.89 0.000 0.00 256.77 0.00 249.97
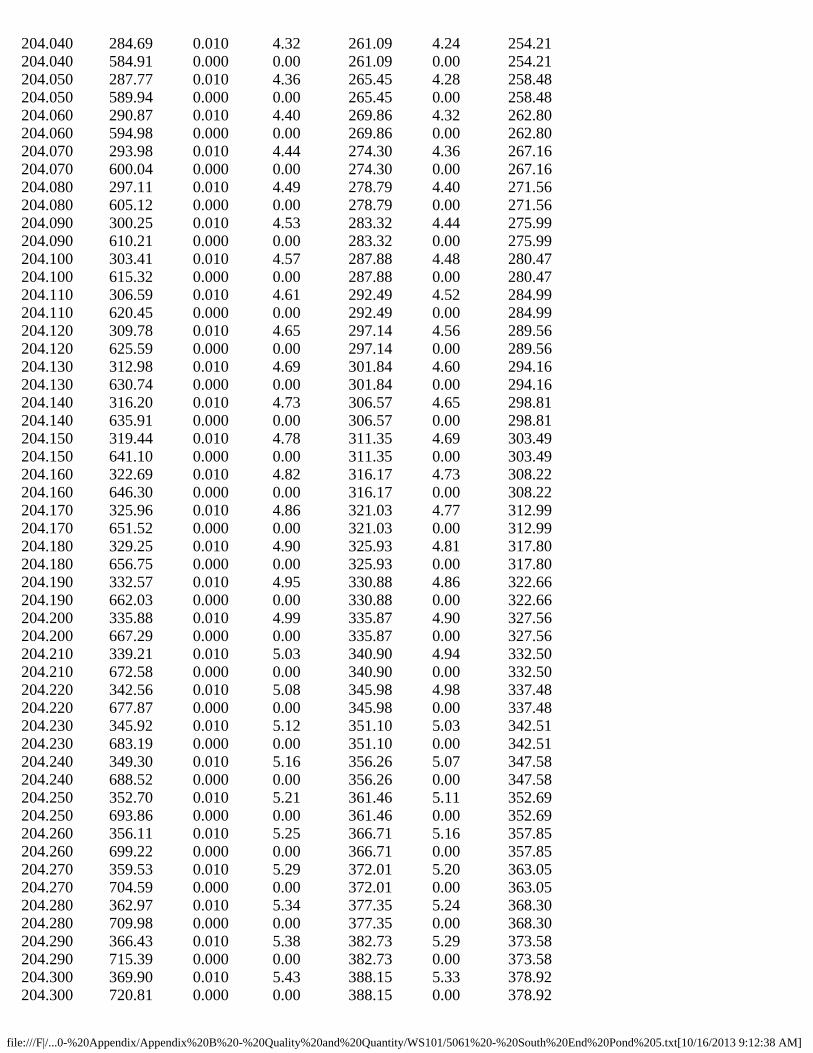
file:///F|/...0-%20Appendix/Appendix%20B%20-%20Quality%20and%20Quantity/WS101/5061%20-%20South%20End%20Pond%205.txt[10/16/2013 9:12:38 AM]
204.040 284.69 0.010 4.32 261.09 4.24 254.21204.040 584.91 0.000 0.00 261.09 0.00 254.21204.050 287.77 0.010 4.36 265.45 4.28 258.48204.050 589.94 0.000 0.00 265.45 0.00 258.48204.060 290.87 0.010 4.40 269.86 4.32 262.80204.060 594.98 0.000 0.00 269.86 0.00 262.80204.070 293.98 0.010 4.44 274.30 4.36 267.16204.070 600.04 0.000 0.00 274.30 0.00 267.16204.080 297.11 0.010 4.49 278.79 4.40 271.56204.080 605.12 0.000 0.00 278.79 0.00 271.56204.090 300.25 0.010 4.53 283.32 4.44 275.99204.090 610.21 0.000 0.00 283.32 0.00 275.99204.100 303.41 0.010 4.57 287.88 4.48 280.47204.100 615.32 0.000 0.00 287.88 0.00 280.47204.110 306.59 0.010 4.61 292.49 4.52 284.99204.110 620.45 0.000 0.00 292.49 0.00 284.99204.120 309.78 0.010 4.65 297.14 4.56 289.56204.120 625.59 0.000 0.00 297.14 0.00 289.56204.130 312.98 0.010 4.69 301.84 4.60 294.16204.130 630.74 0.000 0.00 301.84 0.00 294.16204.140 316.20 0.010 4.73 306.57 4.65 298.81204.140 635.91 0.000 0.00 306.57 0.00 298.81204.150 319.44 0.010 4.78 311.35 4.69 303.49204.150 641.10 0.000 0.00 311.35 0.00 303.49204.160 322.69 0.010 4.82 316.17 4.73 308.22204.160 646.30 0.000 0.00 316.17 0.00 308.22204.170 325.96 0.010 4.86 321.03 4.77 312.99204.170 651.52 0.000 0.00 321.03 0.00 312.99204.180 329.25 0.010 4.90 325.93 4.81 317.80204.180 656.75 0.000 0.00 325.93 0.00 317.80204.190 332.57 0.010 4.95 330.88 4.86 322.66204.190 662.03 0.000 0.00 330.88 0.00 322.66204.200 335.88 0.010 4.99 335.87 4.90 327.56204.200 667.29 0.000 0.00 335.87 0.00 327.56204.210 339.21 0.010 5.03 340.90 4.94 332.50204.210 672.58 0.000 0.00 340.90 0.00 332.50204.220 342.56 0.010 5.08 345.98 4.98 337.48204.220 677.87 0.000 0.00 345.98 0.00 337.48204.230 345.92 0.010 5.12 351.10 5.03 342.51204.230 683.19 0.000 0.00 351.10 0.00 342.51204.240 349.30 0.010 5.16 356.26 5.07 347.58204.240 688.52 0.000 0.00 356.26 0.00 347.58204.250 352.70 0.010 5.21 361.46 5.11 352.69204.250 693.86 0.000 0.00 361.46 0.00 352.69204.260 356.11 0.010 5.25 366.71 5.16 357.85204.260 699.22 0.000 0.00 366.71 0.00 357.85204.270 359.53 0.010 5.29 372.01 5.20 363.05204.270 704.59 0.000 0.00 372.01 0.00 363.05204.280 362.97 0.010 5.34 377.35 5.24 368.30204.280 709.98 0.000 0.00 377.35 0.00 368.30204.290 366.43 0.010 5.38 382.73 5.29 373.58204.290 715.39 0.000 0.00 382.73 0.00 373.58204.300 369.90 0.010 5.43 388.15 5.33 378.92204.300 720.81 0.000 0.00 388.15 0.00 378.92
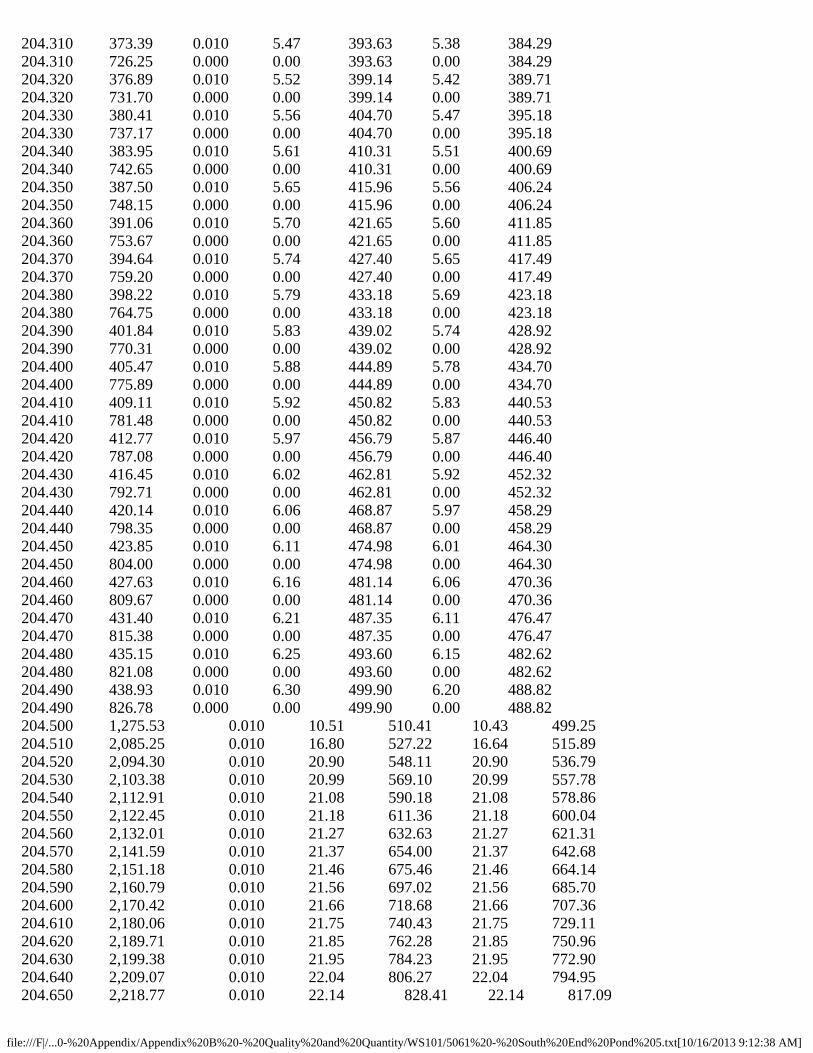
file:///F|/...0-%20Appendix/Appendix%20B%20-%20Quality%20and%20Quantity/WS101/5061%20-%20South%20End%20Pond%205.txt[10/16/2013 9:12:38 AM]
204.310 373.39 0.010 5.47 393.63 5.38 384.29204.310 726.25 0.000 0.00 393.63 0.00 384.29204.320 376.89 0.010 5.52 399.14 5.42 389.71204.320 731.70 0.000 0.00 399.14 0.00 389.71204.330 380.41 0.010 5.56 404.70 5.47 395.18204.330 737.17 0.000 0.00 404.70 0.00 395.18204.340 383.95 0.010 5.61 410.31 5.51 400.69204.340 742.65 0.000 0.00 410.31 0.00 400.69204.350 387.50 0.010 5.65 415.96 5.56 406.24204.350 748.15 0.000 0.00 415.96 0.00 406.24204.360 391.06 0.010 5.70 421.65 5.60 411.85204.360 753.67 0.000 0.00 421.65 0.00 411.85204.370 394.64 0.010 5.74 427.40 5.65 417.49204.370 759.20 0.000 0.00 427.40 0.00 417.49204.380 398.22 0.010 5.79 433.18 5.69 423.18204.380 764.75 0.000 0.00 433.18 0.00 423.18204.390 401.84 0.010 5.83 439.02 5.74 428.92204.390 770.31 0.000 0.00 439.02 0.00 428.92204.400 405.47 0.010 5.88 444.89 5.78 434.70204.400 775.89 0.000 0.00 444.89 0.00 434.70204.410 409.11 0.010 5.92 450.82 5.83 440.53204.410 781.48 0.000 0.00 450.82 0.00 440.53204.420 412.77 0.010 5.97 456.79 5.87 446.40204.420 787.08 0.000 0.00 456.79 0.00 446.40204.430 416.45 0.010 6.02 462.81 5.92 452.32204.430 792.71 0.000 0.00 462.81 0.00 452.32204.440 420.14 0.010 6.06 468.87 5.97 458.29204.440 798.35 0.000 0.00 468.87 0.00 458.29204.450 423.85 0.010 6.11 474.98 6.01 464.30204.450 804.00 0.000 0.00 474.98 0.00 464.30204.460 427.63 0.010 6.16 481.14 6.06 470.36204.460 809.67 0.000 0.00 481.14 0.00 470.36204.470 431.40 0.010 6.21 487.35 6.11 476.47204.470 815.38 0.000 0.00 487.35 0.00 476.47204.480 435.15 0.010 6.25 493.60 6.15 482.62204.480 821.08 0.000 0.00 493.60 0.00 482.62204.490 438.93 0.010 6.30 499.90 6.20 488.82204.490 826.78 0.000 0.00 499.90 0.00 488.82204.500 1,275.53 0.010 10.51 510.41 10.43 499.25204.510 2,085.25 0.010 16.80 527.22 16.64 515.89204.520 2,094.30 0.010 20.90 548.11 20.90 536.79204.530 2,103.38 0.010 20.99 569.10 20.99 557.78204.540 2,112.91 0.010 21.08 590.18 21.08 578.86204.550 2,122.45 0.010 21.18 611.36 21.18 600.04204.560 2,132.01 0.010 21.27 632.63 21.27 621.31204.570 2,141.59 0.010 21.37 654.00 21.37 642.68204.580 2,151.18 0.010 21.46 675.46 21.46 664.14204.590 2,160.79 0.010 21.56 697.02 21.56 685.70204.600 2,170.42 0.010 21.66 718.68 21.66 707.36204.610 2,180.06 0.010 21.75 740.43 21.75 729.11204.620 2,189.71 0.010 21.85 762.28 21.85 750.96204.630 2,199.38 0.010 21.95 784.23 21.95 772.90204.640 2,209.07 0.010 22.04 806.27 22.04 794.95204.650 2,218.77 0.010 22.14 828.41 22.14 817.09
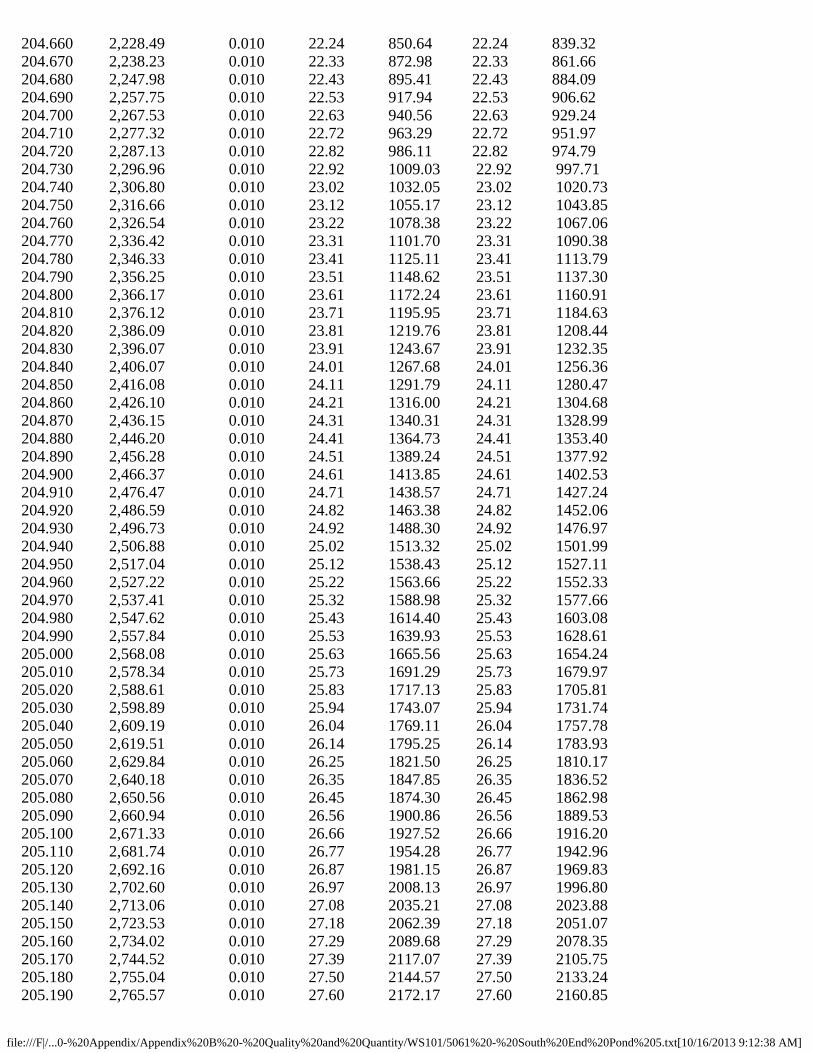
file:///F|/...0-%20Appendix/Appendix%20B%20-%20Quality%20and%20Quantity/WS101/5061%20-%20South%20End%20Pond%205.txt[10/16/2013 9:12:38 AM]
204.660 2,228.49 0.010 22.24 850.64 22.24 839.32204.670 2,238.23 0.010 22.33 872.98 22.33 861.66204.680 2,247.98 0.010 22.43 895.41 22.43 884.09204.690 2,257.75 0.010 22.53 917.94 22.53 906.62204.700 2,267.53 0.010 22.63 940.56 22.63 929.24204.710 2,277.32 0.010 22.72 963.29 22.72 951.97204.720 2,287.13 0.010 22.82 986.11 22.82 974.79204.730 2,296.96 0.010 22.92 1009.03 22.92 997.71204.740 2,306.80 0.010 23.02 1032.05 23.02 1020.73204.750 2,316.66 0.010 23.12 1055.17 23.12 1043.85204.760 2,326.54 0.010 23.22 1078.38 23.22 1067.06204.770 2,336.42 0.010 23.31 1101.70 23.31 1090.38204.780 2,346.33 0.010 23.41 1125.11 23.41 1113.79204.790 2,356.25 0.010 23.51 1148.62 23.51 1137.30204.800 2,366.17 0.010 23.61 1172.24 23.61 1160.91204.810 2,376.12 0.010 23.71 1195.95 23.71 1184.63204.820 2,386.09 0.010 23.81 1219.76 23.81 1208.44204.830 2,396.07 0.010 23.91 1243.67 23.91 1232.35204.840 2,406.07 0.010 24.01 1267.68 24.01 1256.36204.850 2,416.08 0.010 24.11 1291.79 24.11 1280.47204.860 2,426.10 0.010 24.21 1316.00 24.21 1304.68204.870 2,436.15 0.010 24.31 1340.31 24.31 1328.99204.880 2,446.20 0.010 24.41 1364.73 24.41 1353.40204.890 2,456.28 0.010 24.51 1389.24 24.51 1377.92204.900 2,466.37 0.010 24.61 1413.85 24.61 1402.53204.910 2,476.47 0.010 24.71 1438.57 24.71 1427.24204.920 2,486.59 0.010 24.82 1463.38 24.82 1452.06204.930 2,496.73 0.010 24.92 1488.30 24.92 1476.97204.940 2,506.88 0.010 25.02 1513.32 25.02 1501.99204.950 2,517.04 0.010 25.12 1538.43 25.12 1527.11204.960 2,527.22 0.010 25.22 1563.66 25.22 1552.33204.970 2,537.41 0.010 25.32 1588.98 25.32 1577.66204.980 2,547.62 0.010 25.43 1614.40 25.43 1603.08204.990 2,557.84 0.010 25.53 1639.93 25.53 1628.61205.000 2,568.08 0.010 25.63 1665.56 25.63 1654.24205.010 2,578.34 0.010 25.73 1691.29 25.73 1679.97205.020 2,588.61 0.010 25.83 1717.13 25.83 1705.81205.030 2,598.89 0.010 25.94 1743.07 25.94 1731.74205.040 2,609.19 0.010 26.04 1769.11 26.04 1757.78205.050 2,619.51 0.010 26.14 1795.25 26.14 1783.93205.060 2,629.84 0.010 26.25 1821.50 26.25 1810.17205.070 2,640.18 0.010 26.35 1847.85 26.35 1836.52205.080 2,650.56 0.010 26.45 1874.30 26.45 1862.98205.090 2,660.94 0.010 26.56 1900.86 26.56 1889.53205.100 2,671.33 0.010 26.66 1927.52 26.66 1916.20205.110 2,681.74 0.010 26.77 1954.28 26.77 1942.96205.120 2,692.16 0.010 26.87 1981.15 26.87 1969.83205.130 2,702.60 0.010 26.97 2008.13 26.97 1996.80205.140 2,713.06 0.010 27.08 2035.21 27.08 2023.88205.150 2,723.53 0.010 27.18 2062.39 27.18 2051.07205.160 2,734.02 0.010 27.29 2089.68 27.29 2078.35205.170 2,744.52 0.010 27.39 2117.07 27.39 2105.75205.180 2,755.04 0.010 27.50 2144.57 27.50 2133.24205.190 2,765.57 0.010 27.60 2172.17 27.60 2160.85
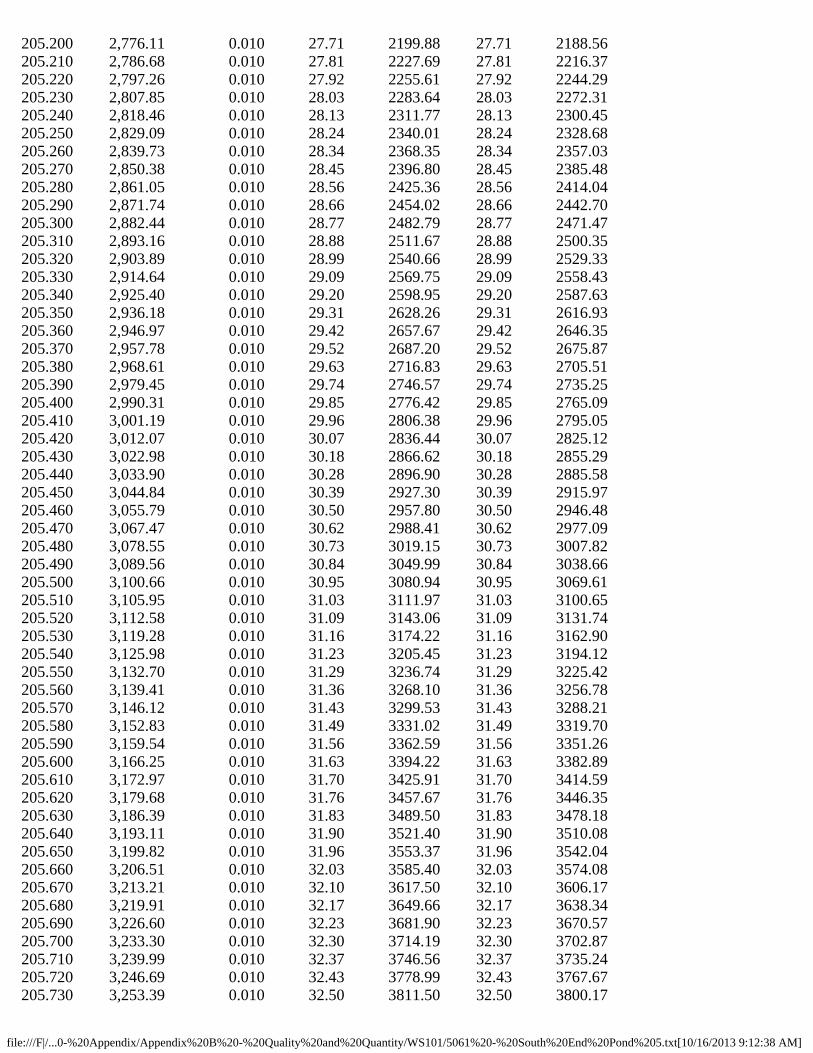
file:///F|/...0-%20Appendix/Appendix%20B%20-%20Quality%20and%20Quantity/WS101/5061%20-%20South%20End%20Pond%205.txt[10/16/2013 9:12:38 AM]
205.200 2,776.11 0.010 27.71 2199.88 27.71 2188.56205.210 2,786.68 0.010 27.81 2227.69 27.81 2216.37205.220 2,797.26 0.010 27.92 2255.61 27.92 2244.29205.230 2,807.85 0.010 28.03 2283.64 28.03 2272.31205.240 2,818.46 0.010 28.13 2311.77 28.13 2300.45205.250 2,829.09 0.010 28.24 2340.01 28.24 2328.68205.260 2,839.73 0.010 28.34 2368.35 28.34 2357.03205.270 2,850.38 0.010 28.45 2396.80 28.45 2385.48205.280 2,861.05 0.010 28.56 2425.36 28.56 2414.04205.290 2,871.74 0.010 28.66 2454.02 28.66 2442.70205.300 2,882.44 0.010 28.77 2482.79 28.77 2471.47205.310 2,893.16 0.010 28.88 2511.67 28.88 2500.35205.320 2,903.89 0.010 28.99 2540.66 28.99 2529.33205.330 2,914.64 0.010 29.09 2569.75 29.09 2558.43205.340 2,925.40 0.010 29.20 2598.95 29.20 2587.63205.350 2,936.18 0.010 29.31 2628.26 29.31 2616.93205.360 2,946.97 0.010 29.42 2657.67 29.42 2646.35205.370 2,957.78 0.010 29.52 2687.20 29.52 2675.87205.380 2,968.61 0.010 29.63 2716.83 29.63 2705.51205.390 2,979.45 0.010 29.74 2746.57 29.74 2735.25205.400 2,990.31 0.010 29.85 2776.42 29.85 2765.09205.410 3,001.19 0.010 29.96 2806.38 29.96 2795.05205.420 3,012.07 0.010 30.07 2836.44 30.07 2825.12205.430 3,022.98 0.010 30.18 2866.62 30.18 2855.29205.440 3,033.90 0.010 30.28 2896.90 30.28 2885.58205.450 3,044.84 0.010 30.39 2927.30 30.39 2915.97205.460 3,055.79 0.010 30.50 2957.80 30.50 2946.48205.470 3,067.47 0.010 30.62 2988.41 30.62 2977.09205.480 3,078.55 0.010 30.73 3019.15 30.73 3007.82205.490 3,089.56 0.010 30.84 3049.99 30.84 3038.66205.500 3,100.66 0.010 30.95 3080.94 30.95 3069.61205.510 3,105.95 0.010 31.03 3111.97 31.03 3100.65205.520 3,112.58 0.010 31.09 3143.06 31.09 3131.74205.530 3,119.28 0.010 31.16 3174.22 31.16 3162.90205.540 3,125.98 0.010 31.23 3205.45 31.23 3194.12205.550 3,132.70 0.010 31.29 3236.74 31.29 3225.42205.560 3,139.41 0.010 31.36 3268.10 31.36 3256.78205.570 3,146.12 0.010 31.43 3299.53 31.43 3288.21205.580 3,152.83 0.010 31.49 3331.02 31.49 3319.70205.590 3,159.54 0.010 31.56 3362.59 31.56 3351.26205.600 3,166.25 0.010 31.63 3394.22 31.63 3382.89205.610 3,172.97 0.010 31.70 3425.91 31.70 3414.59205.620 3,179.68 0.010 31.76 3457.67 31.76 3446.35205.630 3,186.39 0.010 31.83 3489.50 31.83 3478.18205.640 3,193.11 0.010 31.90 3521.40 31.90 3510.08205.650 3,199.82 0.010 31.96 3553.37 31.96 3542.04205.660 3,206.51 0.010 32.03 3585.40 32.03 3574.08205.670 3,213.21 0.010 32.10 3617.50 32.10 3606.17205.680 3,219.91 0.010 32.17 3649.66 32.17 3638.34205.690 3,226.60 0.010 32.23 3681.90 32.23 3670.57205.700 3,233.30 0.010 32.30 3714.19 32.30 3702.87205.710 3,239.99 0.010 32.37 3746.56 32.37 3735.24205.720 3,246.69 0.010 32.43 3778.99 32.43 3767.67205.730 3,253.39 0.010 32.50 3811.50 32.50 3800.17

file:///F|/...0-%20Appendix/Appendix%20B%20-%20Quality%20and%20Quantity/WS101/5061%20-%20South%20End%20Pond%205.txt[10/16/2013 9:12:38 AM]
205.740 3,260.10 0.010 32.57 3844.06 32.57 3832.74205.750 3,266.79 0.010 32.63 3876.70 32.63 3865.37205.760 3,273.48 0.010 32.70 3909.40 32.70 3898.07205.770 3,280.19 0.010 32.77 3942.17 32.77 3930.84205.780 3,286.90 0.010 32.84 3975.00 32.84 3963.68205.790 3,293.63 0.010 32.90 4007.90 32.90 3996.58
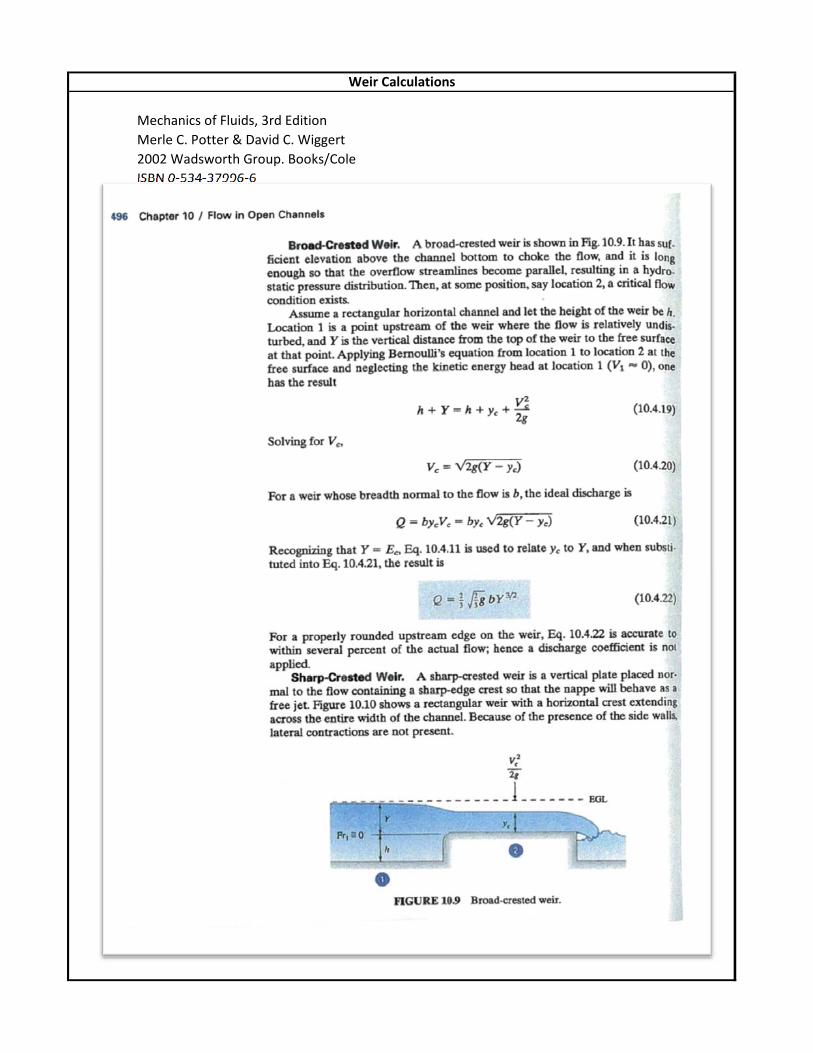
Mechanics of Fluids, 3rd Edition
Merle C. Potter & David C. Wiggert
2002 Wadsworth Group. Books/Cole
ISBN 0‐534‐37996‐6
Weir Calculations
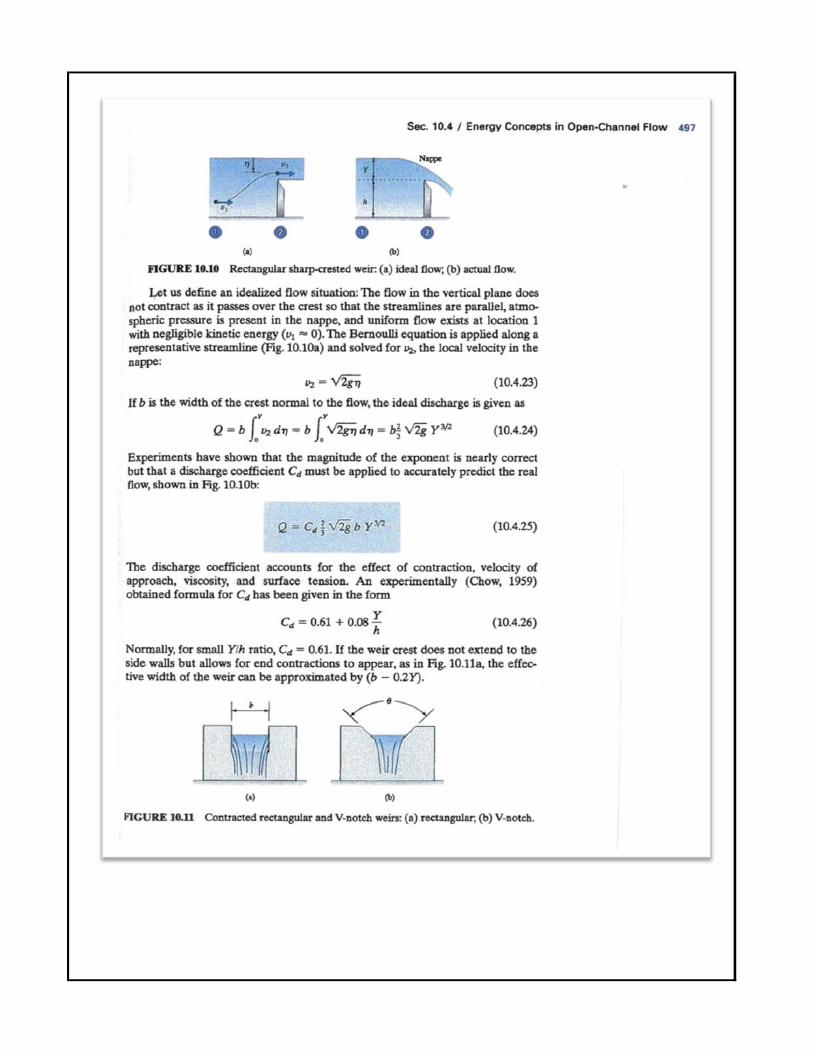
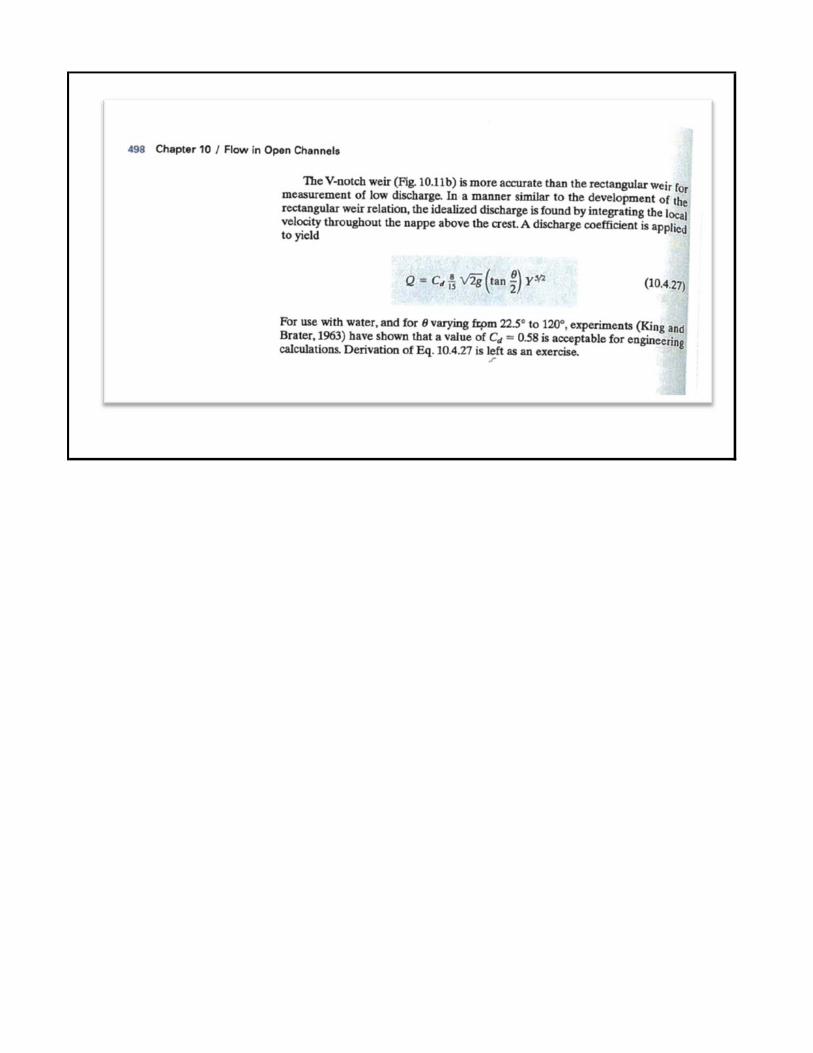

Kinsmen

1
Stormceptor Sizing Detailed ReportPCSWMM for Stormceptor
Project InformationDate 10/1/2013Project Name Parkway EA - South EndProject Number 5061Location Peterborough
Stormwater Quality Objective
This report outlines how Stormceptor System can achieve a defined water quality objective through theremoval of total suspended solids (TSS). Attached to this report is the Stormceptor Sizing Summary.
Stormceptor System Recommendation
The Stormceptor System model STC 2000 achieves the water quality objective removing 83% TSS for aFine (organics, silts and sand) particle size distribution and 96% runoff volume.
The Stormceptor System
The Stormceptor oil and sediment separator is sized to treat stormwater runoff by removing pollutantsthrough gravity separation and flotation. Stormceptor’s patented design generates positive TSS removalfor all rainfall events, including large storms. Significant levels of pollutants such as heavy metals, free oilsand nutrients are prevented from entering natural water resources and the re-suspension of previouslycaptured sediment (scour) does not occur.
Stormceptor provides a high level of TSS removal for small frequent storm events that represent themajority of annual rainfall volume and pollutant load. Positive treatment continues for large infrequentevents, however, such events have little impact on the average annual TSS removal as they represent asmall percentage of the total runoff volume and pollutant load.
Stormceptor is the only oil and sediment separator on the market sized to remove TSS for a wide range ofparticle sizes, including fine sediments (clays and silts), that are often overlooked in the design of otherstormwater treatment devices.

2
Small storms dominate hydrologic activity, US EPA reports
“Early efforts in stormwater management focused on flood events ranging from the 2-yrto the 100-yr storm. Increasingly stormwater professionals have come to realize thatsmall storms (i.e. < 1 in. rainfall) dominate watershed hydrologic parameters typicallyassociated with water quality management issues and BMP design. These small stormsare responsible for most annual urban runoff and groundwater recharge. Likewise, withthe exception of eroded sediment, they are responsible for most pollutant washoff fromurban surfaces. Therefore, the small storms are of most concern for the stormwatermanagement objectives of ground water recharge, water quality resource protection andthermal impacts control.”
“Most rainfall events are much smaller than design storms used for urban drainagemodels. In any given area, most frequently recurrent rainfall events are small (less than 1in. of daily rainfall).”
“Continuous simulation offers possibilities for designing and managing BMPs on anindividual site-by-site basis that are not provided by other widely used simpler analysismethods. Therefore its application and use should be encouraged.”
– US EPA Stormwater Best Management Practice Design Guide, Volume 1 – GeneralConsiderations, 2004
Design Methodology
Each Stormceptor system is sized using PCSWMM for Stormceptor, a continuous simulation model basedon US EPA SWMM. The program calculates hydrology from up-to-date local historical rainfall data andspecified site parameters. With US EPA SWMM’s precision, every Stormceptor unit is designed toachieve a defined water quality objective.
The TSS removal data presented follows US EPA guidelines to reduce the average annual TSS load.Stormceptor’s unit process for TSS removal is settling. The settling model calculates TSS removal byanalyzing (summary of analysis presented in Appendix 2):
Site parameters Continuous historical rainfall, including duration, distribution, peaks (Figure 1)Interevent periodsParticle size distributionParticle settling velocities (Stokes Law, corrected for drag)TSS load (Figure 2)Detention time of the system
The Stormceptor System maintains continuous positive TSS removal for all influent flow rates. Figure 3illustrates the continuous treatment by Stormceptor throughout the full range of storm events analyzed. Itis clear that large events do not significantly impact the average annual TSS removal. There is no declinein cumulative TSS removal, indicating scour does not occur as the flow rate increases.
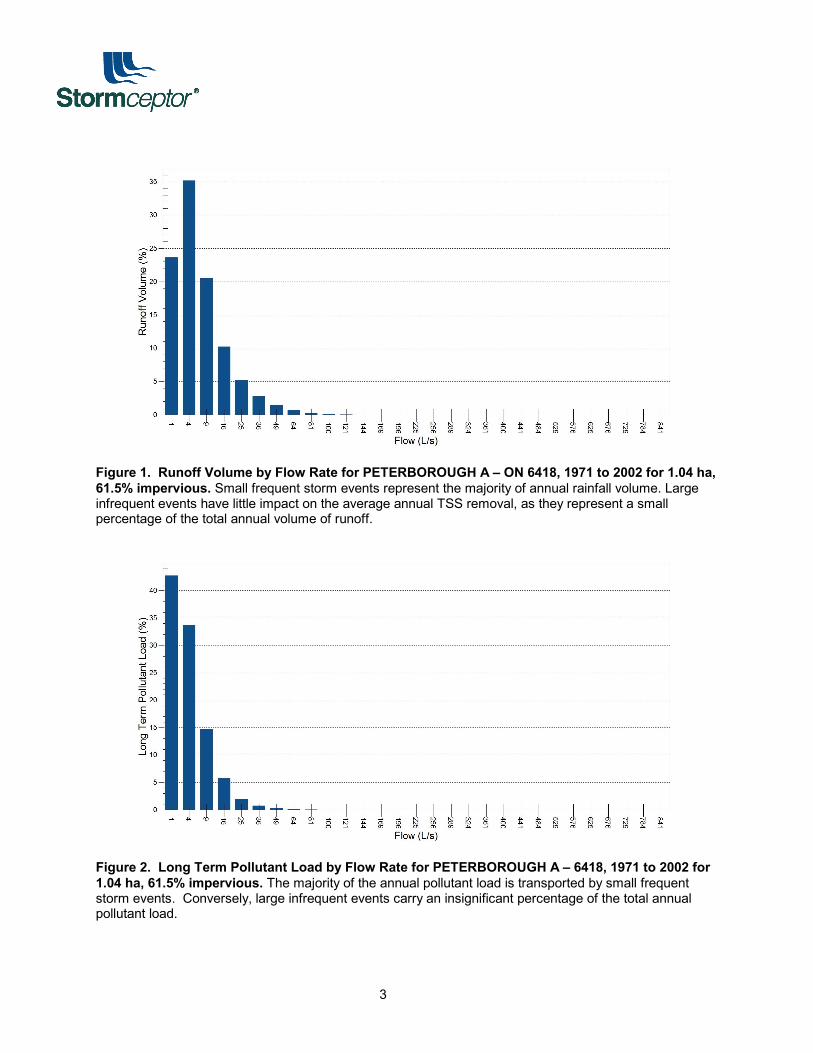
3
Figure 1. Runoff Volume by Flow Rate for PETERBOROUGH A – ON 6418, 1971 to 2002 for 1.04 ha,61.5% impervious. Small frequent storm events represent the majority of annual rainfall volume. Largeinfrequent events have little impact on the average annual TSS removal, as they represent a smallpercentage of the total annual volume of runoff.
Figure 2. Long Term Pollutant Load by Flow Rate for PETERBOROUGH A – 6418, 1971 to 2002 for1.04 ha, 61.5% impervious. The majority of the annual pollutant load is transported by small frequentstorm events. Conversely, large infrequent events carry an insignificant percentage of the total annualpollutant load.
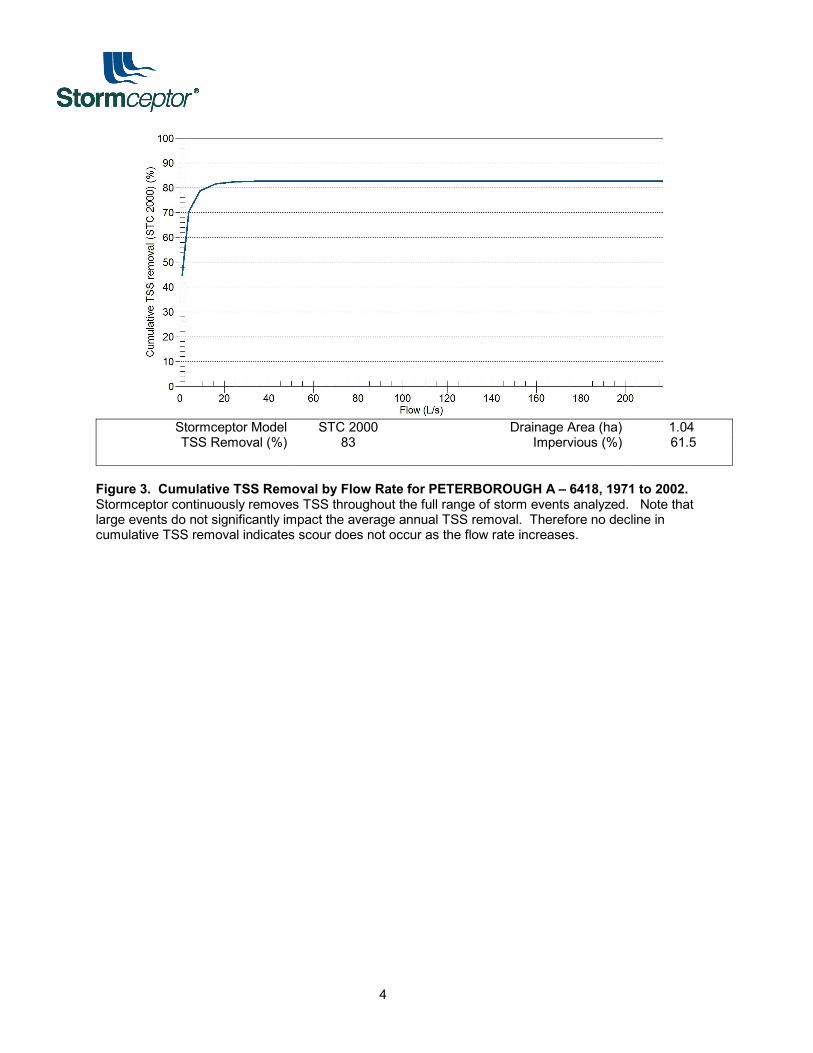
4
Stormceptor ModelTSS Removal (%)
STC 200083
Drainage Area (ha)Impervious (%)
1.0461.5
Figure 3. Cumulative TSS Removal by Flow Rate for PETERBOROUGH A – 6418, 1971 to 2002.Stormceptor continuously removes TSS throughout the full range of storm events analyzed. Note thatlarge events do not significantly impact the average annual TSS removal. Therefore no decline incumulative TSS removal indicates scour does not occur as the flow rate increases.
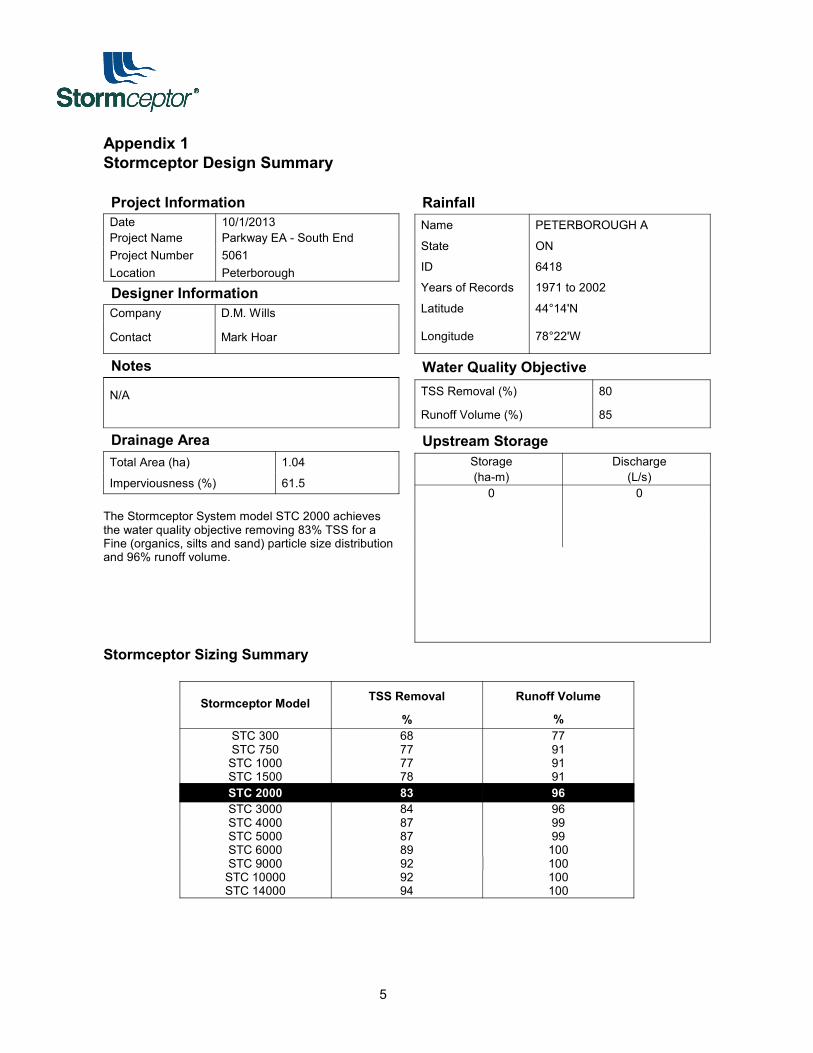
5
Appendix 1Stormceptor Design Summary
Project InformationDate 10/1/2013Project Name Parkway EA - South EndProject Number 5061Location Peterborough
Designer InformationCompany D.M. Wills
Contact Mark Hoar
RainfallName PETERBOROUGH A
State ON
ID 6418
Years of Records 1971 to 2002
Latitude 44°14'N
Longitude 78°22'W
Notes
N/A
Water Quality ObjectiveTSS Removal (%) 80
Runoff Volume (%) 85
Drainage AreaTotal Area (ha) 1.04
Imperviousness (%) 61.5
The Stormceptor System model STC 2000 achievesthe water quality objective removing 83% TSS for aFine (organics, silts and sand) particle size distributionand 96% runoff volume.
Upstream StorageStorage Discharge(ha-m) (L/s)
0 0
Stormceptor Sizing Summary
Stormceptor Model TSS Removal Runoff Volume
% %STC 300 68 77STC 750 77 91STC 1000 77 91STC 1500 78 91STC 2000 83 96STC 3000 84 96STC 4000 87 99STC 5000 87 99STC 6000 89 100STC 9000 92 100STC 10000 92 100STC 14000 94 100

6
Particle Size DistributionRemoving silt particles from runoff ensures that the majority of the pollutants, such as hydrocarbons and heavymetals that adhere to fine particles, are not discharged into our natural water courses. The table below lists theparticle size distribution used to define the annual TSS removal.
Fine (organics, silts and sand)
Particle Size Distribution SpecificGravity
SettlingVelocity Particle Size Distribution Specific
GravitySettlingVelocity
µm % m/s µm % m/s20 20 1.3 0.000460 20 1.8 0.0016150 20 2.2 0.0108400 20 2.65 0.06472000 20 2.65 0.2870
Stormceptor Design NotesStormceptor performance estimates are based on simulations using PCSWMM for Stormceptor version 1.0Design estimates listed are only representative of specific project requirements based on total suspendedsolids (TSS) removal.Only the STC 300 is adaptable to function with a catch basin inlet and/or inline pipes.Only the Stormceptor models STC 750 to STC 6000 may accommodate multiple inlet pipes.Inlet and outlet invert elevation differences are as follows:
Inlet and Outlet Pipe Invert Elevations Differences
Inlet Pipe Configuration STC 300 STC 750 toSTC 6000
STC 9000 toSTC 14000
Single inlet pipe 75 mm 25 mm 75 mm
Multiple inlet pipes 75 mm 75 mm Only one inletpipe.
Design estimates are based on stable site conditions only, after construction is completed.Design estimates assume that the storm drain is not submerged during zero flows. For submergedapplications, please contact your local Stormceptor representative.Design estimates may be modified for specific spills controls. Please contact your local Stormceptorrepresentative for further assistance.For pricing inquiries or assistance, please contact Imbrium Systems Inc., 1-800-565-4801.

7
Appendix 2Summary of Design Assumptions
SITE DETAILS
Site Drainage AreaTotal Area (ha) 1.04 Imperviousness (%) 61.5
Surface CharacteristicsWidth (m) 204Slope (%) 2Impervious Depression Storage (mm) 0.508Pervious Depression Storage (mm) 5.08Impervious Manning’s n 0.015Pervious Manning's n 0.25
Maintenance FrequencySediment build-up reduces the storage volume forsedimentation. Frequency of maintenance isassumed for TSS removal calculations.Maintenance Frequency (months) 12
Infiltration ParametersHorton’s equation is used to estimate infiltrationMax. Infiltration Rate (mm/h) 61.98Min. Infiltration Rate (mm/h) 10.16
Decay Rate (s-1) 0.00055
Regeneration Rate (s-1) 0.01
EvaporationDaily Evaporation Rate (mm/day) 2.54
Dry Weather FlowDry Weather Flow (L/s) No
Upstream AttenuationStage-storage and stage-discharge relationship used to model attenuation upstream of the Stormceptor Systemis identified in the table below.
Storage Dischargeha-m L/s
0 0
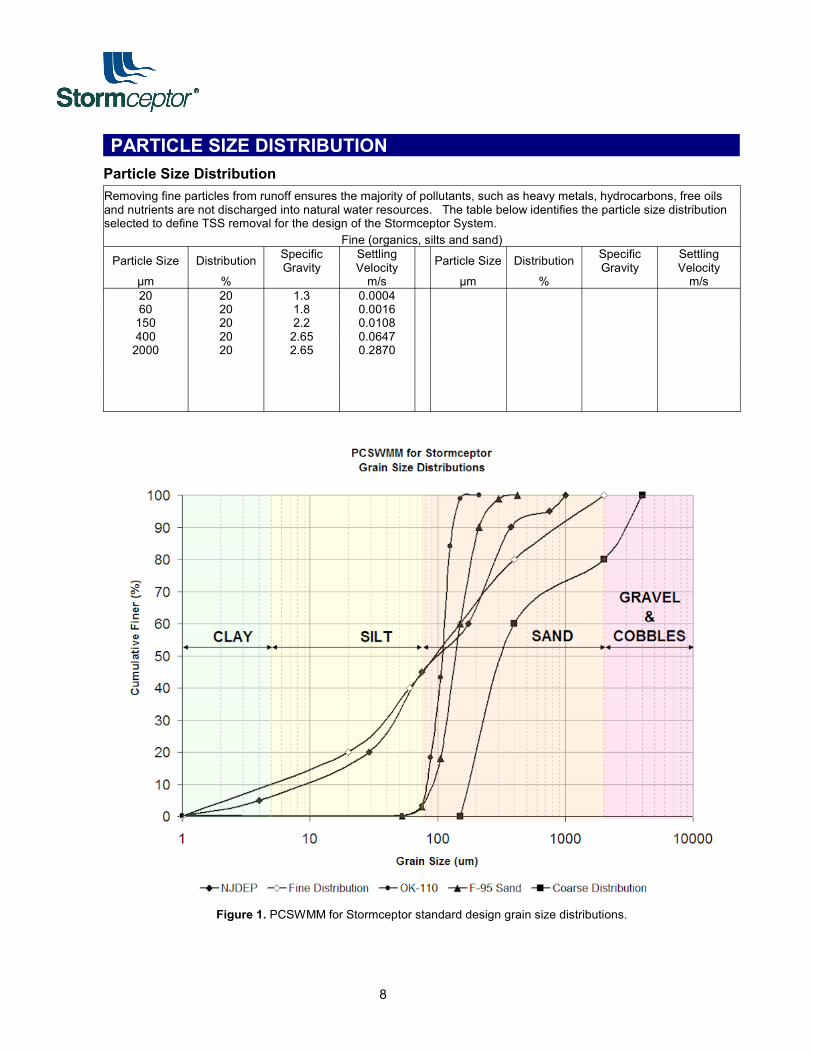
8
PARTICLE SIZE DISTRIBUTIONParticle Size DistributionRemoving fine particles from runoff ensures the majority of pollutants, such as heavy metals, hydrocarbons, free oilsand nutrients are not discharged into natural water resources. The table below identifies the particle size distributionselected to define TSS removal for the design of the Stormceptor System.
Fine (organics, silts and sand)
Particle Size Distribution SpecificGravity
SettlingVelocity Particle Size Distribution Specific
GravitySettlingVelocity
µm % m/s µm % m/s20 20 1.3 0.000460 20 1.8 0.0016150 20 2.2 0.0108400 20 2.65 0.0647
2000 20 2.65 0.2870
Figure 1. PCSWMM for Stormceptor standard design grain size distributions.

9
TSS LOADINGTSS Loading ParametersTSS Loading Function Buildup / Washoff
ParametersTarget Event Mean Concentration(EMC) (mg/L) 125
Exponential Buildup Power 0.4Exponential Washoff Exponential 0.2
HYDROLOGY ANALYSISPCSWMM for Stormceptor calculates annual hydrology with the US EPA SWMM and local continuous historicalrainfall data. Performance calculations of the Stormceptor System are based on the average annual removal ofTSS for the selected site parameters. The Stormceptor System is engineered to capture fine particles (silts andsands) by focusing on average annual runoff volume ensuring positive removal efficiency is maintained during allrainfall events, while preventing the opportunity for negative removal efficiency (scour).
Smaller recurring storms account for the majority of rainfall events and average annual runoff volume, as observedin the historical rainfall data analyses presented in this section.
Rainfall StationRainfall Station PETERBOROUGH A
Rainfall File Name ON6418.NDC Total Number of Events 3172Latitude 44°14'N Total Rainfall (mm) 14411.9Longitude 78°22'W Average Annual Rainfall (mm) 450.4Elevation (m) Total Evaporation (mm) 856.9Rainfall Period of Record (y) 32 Total Infiltration (mm) 5529.1
Total Rainfall Period (y) 32 Percentage of Rainfall that isRunoff (%) 56.1

10
Rainfall Event Analysis
Rainfall Depth No. of Events Percentage ofTotal Events Total Volume Percentage of
Annual Volumemm % mm %6.35 2485 78.3 3975 27.612.70 388 12.2 3618 25.119.05 158 5.0 2494 17.325.40 70 2.2 1539 10.731.75 23 0.7 642 4.538.10 22 0.7 765 5.344.45 7 0.2 291 2.050.80 8 0.3 385 2.757.15 4 0.1 219 1.563.50 3 0.1 186 1.369.85 2 0.1 135 0.976.20 1 0.0 73 0.582.55 0 0.0 0 0.088.90 0 0.0 0 0.095.25 1 0.0 90 0.6
101.60 0 0.0 0 0.0107.95 0 0.0 0 0.0114.30 0 0.0 0 0.0120.65 0 0.0 0 0.0127.00 0 0.0 0 0.0133.35 0 0.0 0 0.0139.70 0 0.0 0 0.0146.05 0 0.0 0 0.0152.40 0 0.0 0 0.0158.75 0 0.0 0 0.0165.10 0 0.0 0 0.0171.45 0 0.0 0 0.0177.80 0 0.0 0 0.0184.15 0 0.0 0 0.0190.50 0 0.0 0 0.0196.85 0 0.0 0 0.0203.20 0 0.0 0 0.0209.55 0 0.0 0 0.0
>209.55 0 0.0 0 0.0
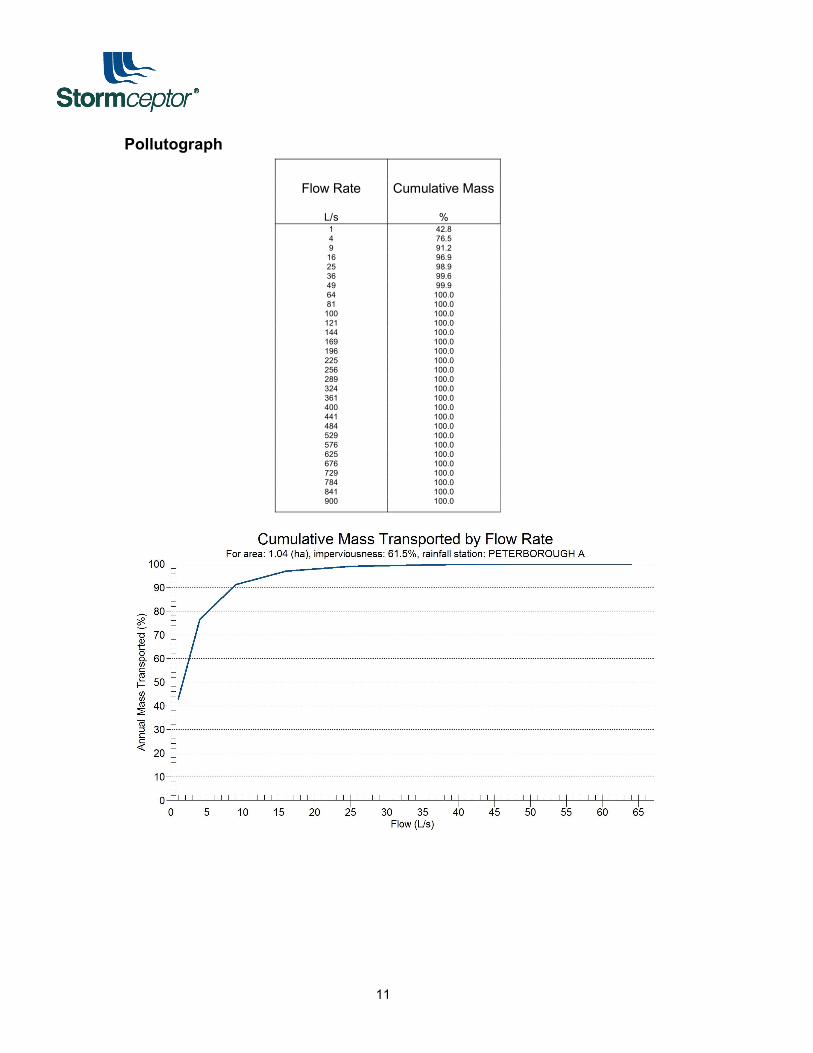
11
Pollutograph
Flow Rate Cumulative Mass
L/s %1 42.84 76.59 91.216 96.925 98.936 99.649 99.964 100.081 100.0
100 100.0121 100.0144 100.0169 100.0196 100.0225 100.0256 100.0289 100.0324 100.0361 100.0400 100.0441 100.0484 100.0529 100.0576 100.0625 100.0676 100.0729 100.0784 100.0841 100.0900 100.0
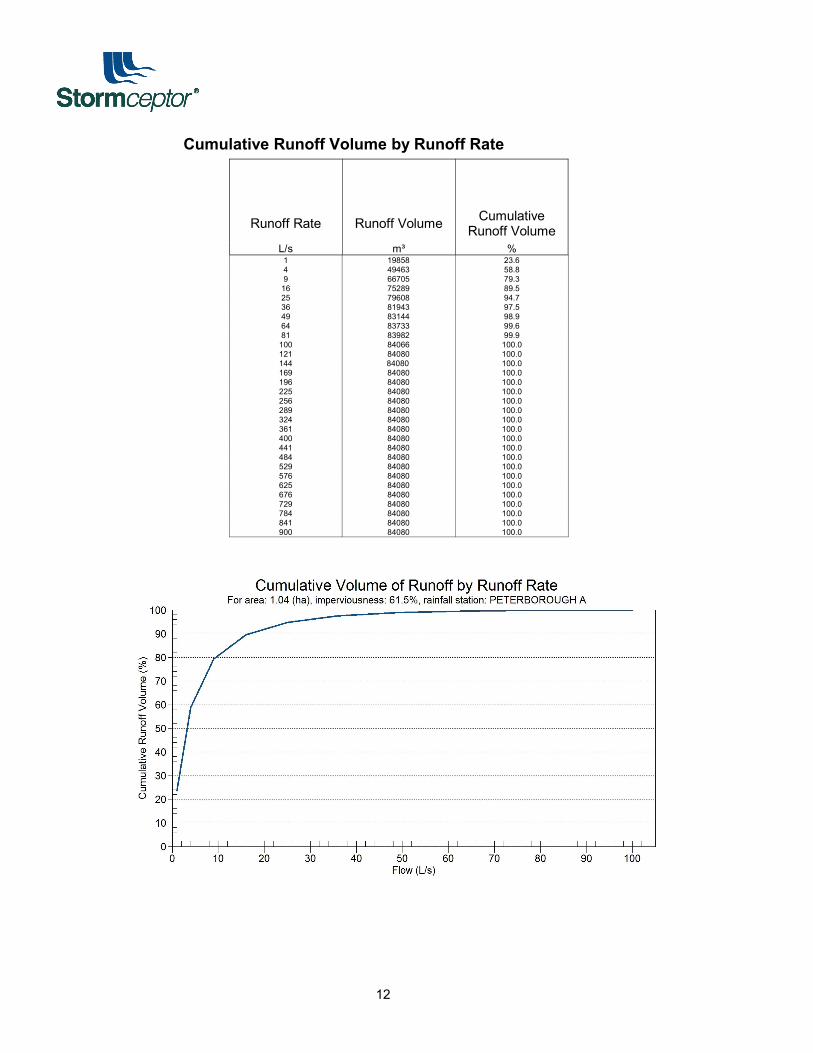
12
Cumulative Runoff Volume by Runoff Rate
Runoff Rate Runoff Volume CumulativeRunoff Volume
L/s m³ %1 19858 23.64 49463 58.89 66705 79.3
16 75289 89.525 79608 94.736 81943 97.549 83144 98.964 83733 99.681 83982 99.9
100 84066 100.0121 84080 100.0144 84080 100.0169 84080 100.0196 84080 100.0225 84080 100.0256 84080 100.0289 84080 100.0324 84080 100.0361 84080 100.0400 84080 100.0441 84080 100.0484 84080 100.0529 84080 100.0576 84080 100.0625 84080 100.0676 84080 100.0729 84080 100.0784 84080 100.0841 84080 100.0900 84080 100.0

1
Stormceptor Sizing Detailed ReportPCSWMM for Stormceptor
Project InformationDate 10/1/2013Project Name Parkway EA - South EndProject Number 5061Location Peterborough
Stormwater Quality Objective
This report outlines how Stormceptor System can achieve a defined water quality objective through theremoval of total suspended solids (TSS). Attached to this report is the Stormceptor Sizing Summary.
Stormceptor System Recommendation
The Stormceptor System model STC 9000 achieves the water quality objective removing 83% TSS for aFine (organics, silts and sand) particle size distribution and 96% runoff volume.
The Stormceptor System
The Stormceptor oil and sediment separator is sized to treat stormwater runoff by removing pollutantsthrough gravity separation and flotation. Stormceptor’s patented design generates positive TSS removalfor all rainfall events, including large storms. Significant levels of pollutants such as heavy metals, free oilsand nutrients are prevented from entering natural water resources and the re-suspension of previouslycaptured sediment (scour) does not occur.
Stormceptor provides a high level of TSS removal for small frequent storm events that represent themajority of annual rainfall volume and pollutant load. Positive treatment continues for large infrequentevents, however, such events have little impact on the average annual TSS removal as they represent asmall percentage of the total runoff volume and pollutant load.
Stormceptor is the only oil and sediment separator on the market sized to remove TSS for a wide range ofparticle sizes, including fine sediments (clays and silts), that are often overlooked in the design of otherstormwater treatment devices.

2
Small storms dominate hydrologic activity, US EPA reports
“Early efforts in stormwater management focused on flood events ranging from the 2-yrto the 100-yr storm. Increasingly stormwater professionals have come to realize thatsmall storms (i.e. < 1 in. rainfall) dominate watershed hydrologic parameters typicallyassociated with water quality management issues and BMP design. These small stormsare responsible for most annual urban runoff and groundwater recharge. Likewise, withthe exception of eroded sediment, they are responsible for most pollutant washoff fromurban surfaces. Therefore, the small storms are of most concern for the stormwatermanagement objectives of ground water recharge, water quality resource protection andthermal impacts control.”
“Most rainfall events are much smaller than design storms used for urban drainagemodels. In any given area, most frequently recurrent rainfall events are small (less than 1in. of daily rainfall).”
“Continuous simulation offers possibilities for designing and managing BMPs on anindividual site-by-site basis that are not provided by other widely used simpler analysismethods. Therefore its application and use should be encouraged.”
– US EPA Stormwater Best Management Practice Design Guide, Volume 1 – GeneralConsiderations, 2004
Design Methodology
Each Stormceptor system is sized using PCSWMM for Stormceptor, a continuous simulation model basedon US EPA SWMM. The program calculates hydrology from up-to-date local historical rainfall data andspecified site parameters. With US EPA SWMM’s precision, every Stormceptor unit is designed toachieve a defined water quality objective.
The TSS removal data presented follows US EPA guidelines to reduce the average annual TSS load.Stormceptor’s unit process for TSS removal is settling. The settling model calculates TSS removal byanalyzing (summary of analysis presented in Appendix 2):
Site parameters Continuous historical rainfall, including duration, distribution, peaks (Figure 1)Interevent periodsParticle size distributionParticle settling velocities (Stokes Law, corrected for drag)TSS load (Figure 2)Detention time of the system
The Stormceptor System maintains continuous positive TSS removal for all influent flow rates. Figure 3illustrates the continuous treatment by Stormceptor throughout the full range of storm events analyzed. Itis clear that large events do not significantly impact the average annual TSS removal. There is no declinein cumulative TSS removal, indicating scour does not occur as the flow rate increases.
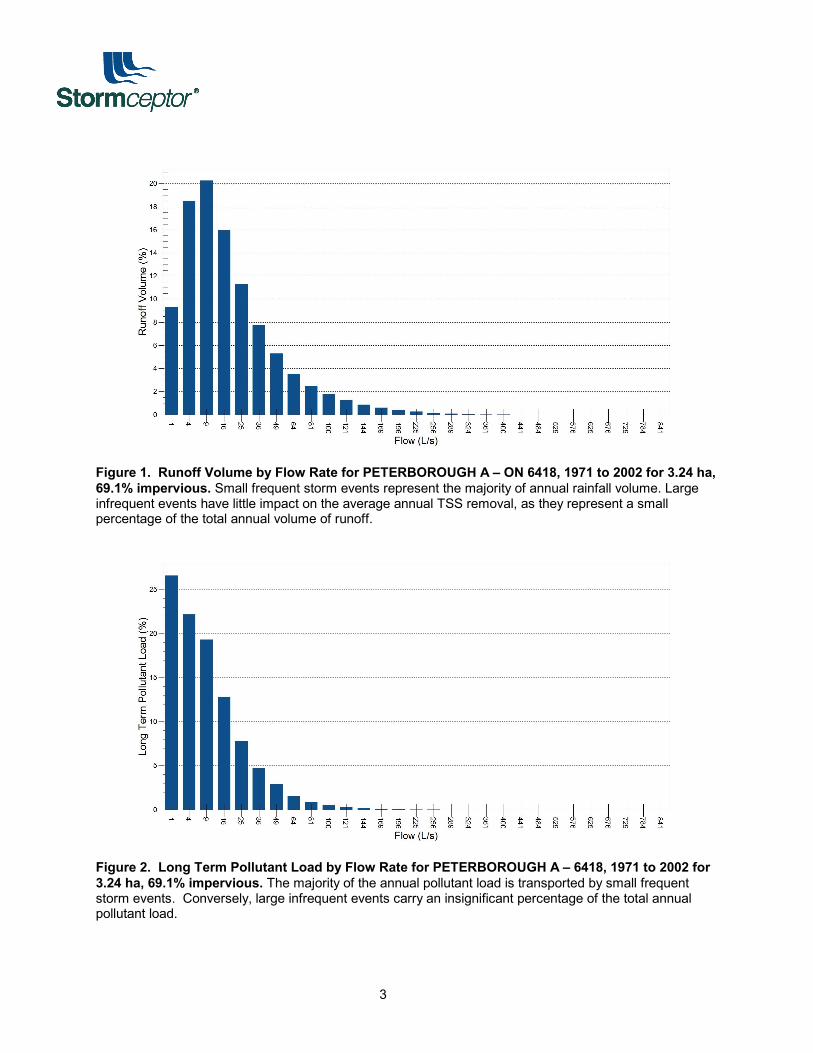
3
Figure 1. Runoff Volume by Flow Rate for PETERBOROUGH A – ON 6418, 1971 to 2002 for 3.24 ha,69.1% impervious. Small frequent storm events represent the majority of annual rainfall volume. Largeinfrequent events have little impact on the average annual TSS removal, as they represent a smallpercentage of the total annual volume of runoff.
Figure 2. Long Term Pollutant Load by Flow Rate for PETERBOROUGH A – 6418, 1971 to 2002 for3.24 ha, 69.1% impervious. The majority of the annual pollutant load is transported by small frequentstorm events. Conversely, large infrequent events carry an insignificant percentage of the total annualpollutant load.

4
Stormceptor ModelTSS Removal (%)
STC 900083
Drainage Area (ha)Impervious (%)
3.2469.1
Figure 3. Cumulative TSS Removal by Flow Rate for PETERBOROUGH A – 6418, 1971 to 2002.Stormceptor continuously removes TSS throughout the full range of storm events analyzed. Note thatlarge events do not significantly impact the average annual TSS removal. Therefore no decline incumulative TSS removal indicates scour does not occur as the flow rate increases.
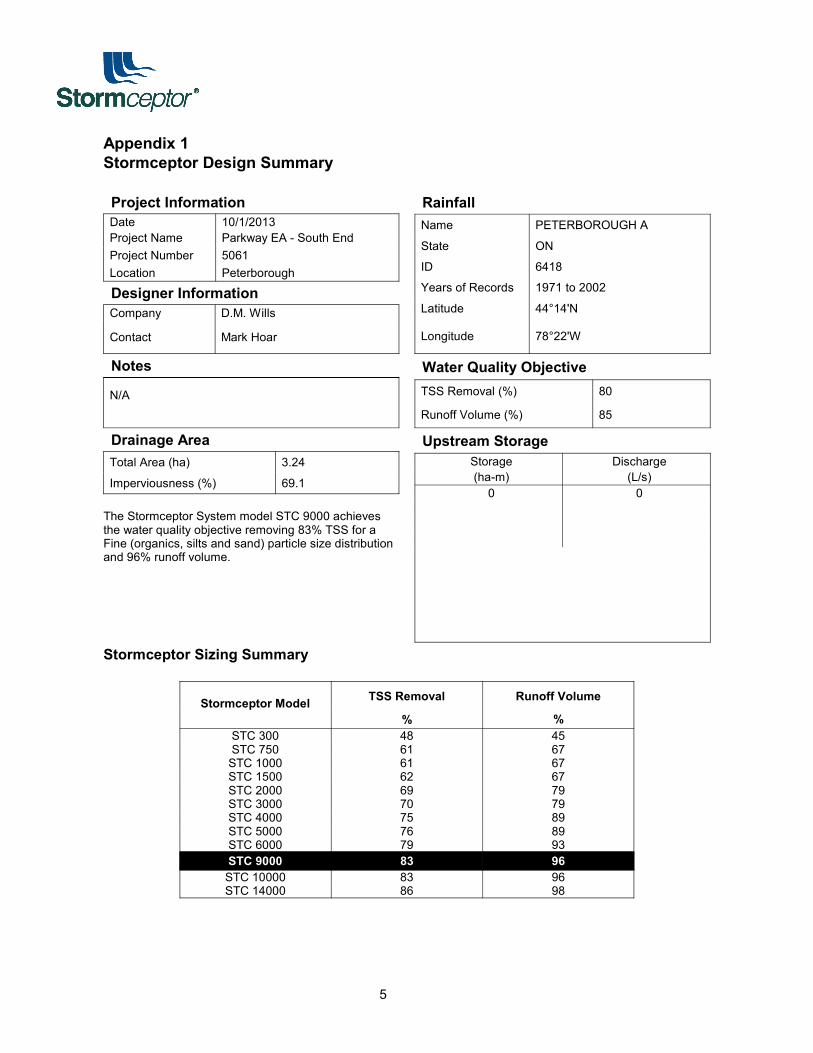
5
Appendix 1Stormceptor Design Summary
Project InformationDate 10/1/2013Project Name Parkway EA - South EndProject Number 5061Location Peterborough
Designer InformationCompany D.M. Wills
Contact Mark Hoar
RainfallName PETERBOROUGH A
State ON
ID 6418
Years of Records 1971 to 2002
Latitude 44°14'N
Longitude 78°22'W
Notes
N/A
Water Quality ObjectiveTSS Removal (%) 80
Runoff Volume (%) 85
Drainage AreaTotal Area (ha) 3.24
Imperviousness (%) 69.1
The Stormceptor System model STC 9000 achievesthe water quality objective removing 83% TSS for aFine (organics, silts and sand) particle size distributionand 96% runoff volume.
Upstream StorageStorage Discharge(ha-m) (L/s)
0 0
Stormceptor Sizing Summary
Stormceptor Model TSS Removal Runoff Volume
% %STC 300 48 45STC 750 61 67STC 1000 61 67STC 1500 62 67STC 2000 69 79STC 3000 70 79STC 4000 75 89STC 5000 76 89STC 6000 79 93STC 9000 83 96STC 10000 83 96STC 14000 86 98

6
Particle Size DistributionRemoving silt particles from runoff ensures that the majority of the pollutants, such as hydrocarbons and heavymetals that adhere to fine particles, are not discharged into our natural water courses. The table below lists theparticle size distribution used to define the annual TSS removal.
Fine (organics, silts and sand)
Particle Size Distribution SpecificGravity
SettlingVelocity Particle Size Distribution Specific
GravitySettlingVelocity
µm % m/s µm % m/s20 20 1.3 0.000460 20 1.8 0.0016150 20 2.2 0.0108400 20 2.65 0.06472000 20 2.65 0.2870
Stormceptor Design NotesStormceptor performance estimates are based on simulations using PCSWMM for Stormceptor version 1.0Design estimates listed are only representative of specific project requirements based on total suspendedsolids (TSS) removal.Only the STC 300 is adaptable to function with a catch basin inlet and/or inline pipes.Only the Stormceptor models STC 750 to STC 6000 may accommodate multiple inlet pipes.Inlet and outlet invert elevation differences are as follows:
Inlet and Outlet Pipe Invert Elevations Differences
Inlet Pipe Configuration STC 300 STC 750 toSTC 6000
STC 9000 toSTC 14000
Single inlet pipe 75 mm 25 mm 75 mm
Multiple inlet pipes 75 mm 75 mm Only one inletpipe.
Design estimates are based on stable site conditions only, after construction is completed.Design estimates assume that the storm drain is not submerged during zero flows. For submergedapplications, please contact your local Stormceptor representative.Design estimates may be modified for specific spills controls. Please contact your local Stormceptorrepresentative for further assistance.For pricing inquiries or assistance, please contact Imbrium Systems Inc., 1-800-565-4801.
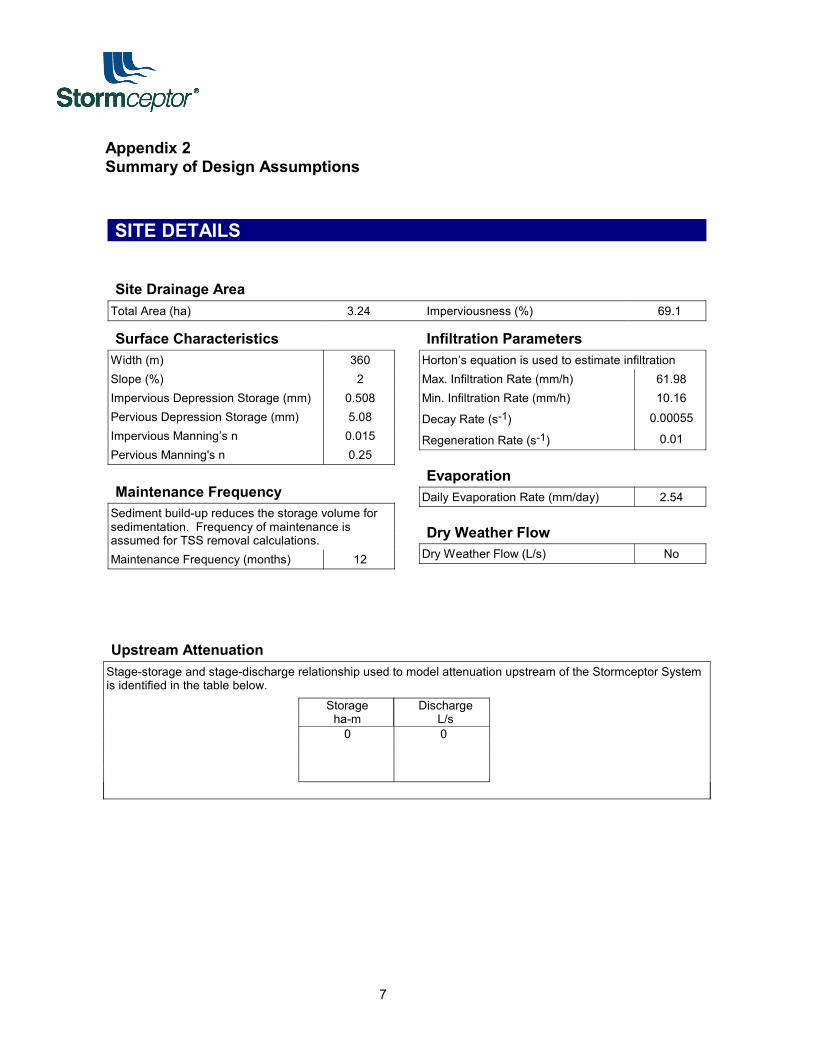
7
Appendix 2Summary of Design Assumptions
SITE DETAILS
Site Drainage AreaTotal Area (ha) 3.24 Imperviousness (%) 69.1
Surface CharacteristicsWidth (m) 360Slope (%) 2Impervious Depression Storage (mm) 0.508Pervious Depression Storage (mm) 5.08Impervious Manning’s n 0.015Pervious Manning's n 0.25
Maintenance FrequencySediment build-up reduces the storage volume forsedimentation. Frequency of maintenance isassumed for TSS removal calculations.Maintenance Frequency (months) 12
Infiltration ParametersHorton’s equation is used to estimate infiltrationMax. Infiltration Rate (mm/h) 61.98Min. Infiltration Rate (mm/h) 10.16
Decay Rate (s-1) 0.00055
Regeneration Rate (s-1) 0.01
EvaporationDaily Evaporation Rate (mm/day) 2.54
Dry Weather FlowDry Weather Flow (L/s) No
Upstream AttenuationStage-storage and stage-discharge relationship used to model attenuation upstream of the Stormceptor Systemis identified in the table below.
Storage Dischargeha-m L/s
0 0

8
PARTICLE SIZE DISTRIBUTIONParticle Size DistributionRemoving fine particles from runoff ensures the majority of pollutants, such as heavy metals, hydrocarbons, free oilsand nutrients are not discharged into natural water resources. The table below identifies the particle size distributionselected to define TSS removal for the design of the Stormceptor System.
Fine (organics, silts and sand)
Particle Size Distribution SpecificGravity
SettlingVelocity Particle Size Distribution Specific
GravitySettlingVelocity
µm % m/s µm % m/s20 20 1.3 0.000460 20 1.8 0.0016150 20 2.2 0.0108400 20 2.65 0.0647
2000 20 2.65 0.2870
Figure 1. PCSWMM for Stormceptor standard design grain size distributions.

9
TSS LOADINGTSS Loading ParametersTSS Loading Function Buildup / Washoff
ParametersTarget Event Mean Concentration(EMC) (mg/L) 125
Exponential Buildup Power 0.4Exponential Washoff Exponential 0.2
HYDROLOGY ANALYSISPCSWMM for Stormceptor calculates annual hydrology with the US EPA SWMM and local continuous historicalrainfall data. Performance calculations of the Stormceptor System are based on the average annual removal ofTSS for the selected site parameters. The Stormceptor System is engineered to capture fine particles (silts andsands) by focusing on average annual runoff volume ensuring positive removal efficiency is maintained during allrainfall events, while preventing the opportunity for negative removal efficiency (scour).
Smaller recurring storms account for the majority of rainfall events and average annual runoff volume, as observedin the historical rainfall data analyses presented in this section.
Rainfall StationRainfall Station PETERBOROUGH A
Rainfall File Name ON6418.NDC Total Number of Events 3172Latitude 44°14'N Total Rainfall (mm) 14411.9Longitude 78°22'W Average Annual Rainfall (mm) 450.4Elevation (m) Total Evaporation (mm) 1029.5Rainfall Period of Record (y) 32 Total Infiltration (mm) 4437.1
Total Rainfall Period (y) 32 Percentage of Rainfall that isRunoff (%) 62.4

10
Rainfall Event Analysis
Rainfall Depth No. of Events Percentage ofTotal Events Total Volume Percentage of
Annual Volumemm % mm %6.35 2485 78.3 3975 27.612.70 388 12.2 3618 25.119.05 158 5.0 2494 17.325.40 70 2.2 1539 10.731.75 23 0.7 642 4.538.10 22 0.7 765 5.344.45 7 0.2 291 2.050.80 8 0.3 385 2.757.15 4 0.1 219 1.563.50 3 0.1 186 1.369.85 2 0.1 135 0.976.20 1 0.0 73 0.582.55 0 0.0 0 0.088.90 0 0.0 0 0.095.25 1 0.0 90 0.6
101.60 0 0.0 0 0.0107.95 0 0.0 0 0.0114.30 0 0.0 0 0.0120.65 0 0.0 0 0.0127.00 0 0.0 0 0.0133.35 0 0.0 0 0.0139.70 0 0.0 0 0.0146.05 0 0.0 0 0.0152.40 0 0.0 0 0.0158.75 0 0.0 0 0.0165.10 0 0.0 0 0.0171.45 0 0.0 0 0.0177.80 0 0.0 0 0.0184.15 0 0.0 0 0.0190.50 0 0.0 0 0.0196.85 0 0.0 0 0.0203.20 0 0.0 0 0.0209.55 0 0.0 0 0.0
>209.55 0 0.0 0 0.0

11
Pollutograph
Flow Rate Cumulative Mass
L/s %1 26.74 48.99 68.216 81.025 88.836 93.549 96.464 97.981 98.8
100 99.3121 99.6144 99.8169 99.9196 100.0225 100.0256 100.0289 100.0324 100.0361 100.0400 100.0441 100.0484 100.0529 100.0576 100.0625 100.0676 100.0729 100.0784 100.0841 100.0900 100.0
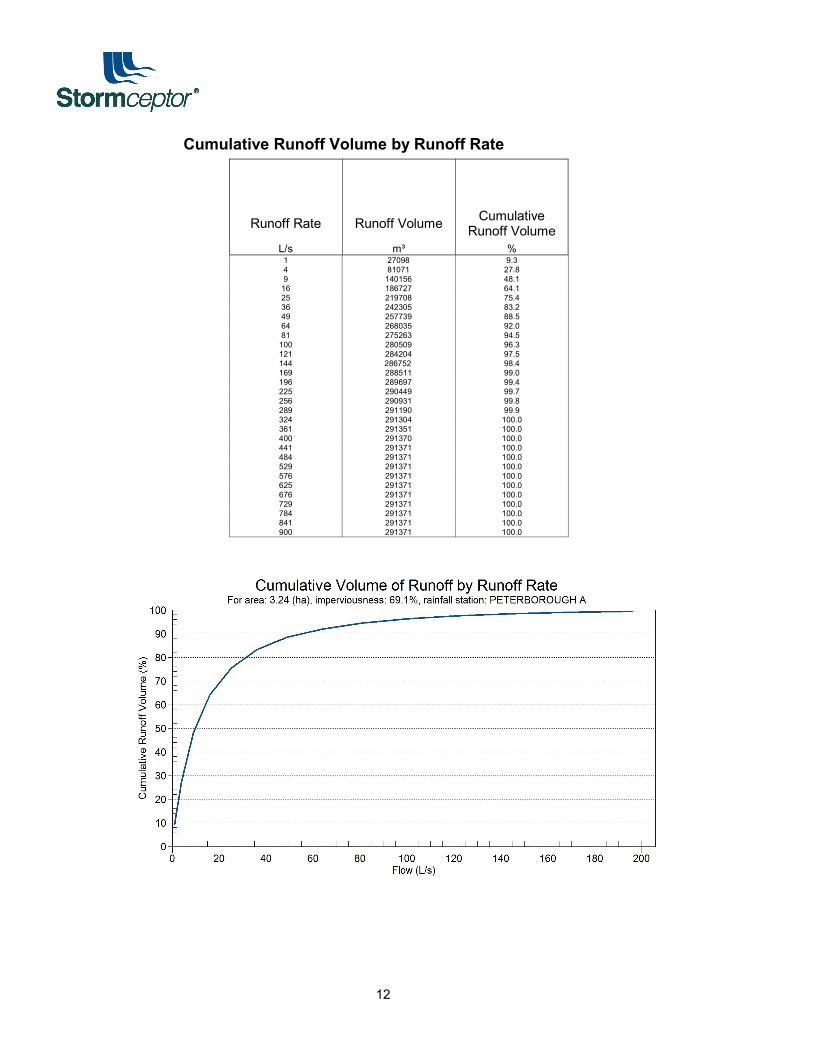
12
Cumulative Runoff Volume by Runoff Rate
Runoff Rate Runoff Volume CumulativeRunoff Volume
L/s m³ %1 27098 9.34 81071 27.89 140156 48.1
16 186727 64.125 219708 75.436 242305 83.249 257739 88.564 268035 92.081 275263 94.5
100 280509 96.3121 284204 97.5144 286752 98.4169 288511 99.0196 289697 99.4225 290449 99.7256 290931 99.8289 291190 99.9324 291304 100.0361 291351 100.0400 291370 100.0441 291371 100.0484 291371 100.0529 291371 100.0576 291371 100.0625 291371 100.0676 291371 100.0729 291371 100.0784 291371 100.0841 291371 100.0900 291371 100.0

1
Stormceptor Sizing Detailed ReportPCSWMM for Stormceptor
Project InformationDate 10/1/2013Project Name Parkway EA - South EndProject Number 5061Location Peterborough
Stormwater Quality Objective
This report outlines how Stormceptor System can achieve a defined water quality objective through theremoval of total suspended solids (TSS). Attached to this report is the Stormceptor Sizing Summary.
Stormceptor System Recommendation
The Stormceptor System model STC 14000 achieves the water quality objective removing 82% TSS for aFine (organics, silts and sand) particle size distribution and 95% runoff volume.
The Stormceptor System
The Stormceptor oil and sediment separator is sized to treat stormwater runoff by removing pollutantsthrough gravity separation and flotation. Stormceptor’s patented design generates positive TSS removalfor all rainfall events, including large storms. Significant levels of pollutants such as heavy metals, free oilsand nutrients are prevented from entering natural water resources and the re-suspension of previouslycaptured sediment (scour) does not occur.
Stormceptor provides a high level of TSS removal for small frequent storm events that represent themajority of annual rainfall volume and pollutant load. Positive treatment continues for large infrequentevents, however, such events have little impact on the average annual TSS removal as they represent asmall percentage of the total runoff volume and pollutant load.
Stormceptor is the only oil and sediment separator on the market sized to remove TSS for a wide range ofparticle sizes, including fine sediments (clays and silts), that are often overlooked in the design of otherstormwater treatment devices.

2
Small storms dominate hydrologic activity, US EPA reports
“Early efforts in stormwater management focused on flood events ranging from the 2-yrto the 100-yr storm. Increasingly stormwater professionals have come to realize thatsmall storms (i.e. < 1 in. rainfall) dominate watershed hydrologic parameters typicallyassociated with water quality management issues and BMP design. These small stormsare responsible for most annual urban runoff and groundwater recharge. Likewise, withthe exception of eroded sediment, they are responsible for most pollutant washoff fromurban surfaces. Therefore, the small storms are of most concern for the stormwatermanagement objectives of ground water recharge, water quality resource protection andthermal impacts control.”
“Most rainfall events are much smaller than design storms used for urban drainagemodels. In any given area, most frequently recurrent rainfall events are small (less than 1in. of daily rainfall).”
“Continuous simulation offers possibilities for designing and managing BMPs on anindividual site-by-site basis that are not provided by other widely used simpler analysismethods. Therefore its application and use should be encouraged.”
– US EPA Stormwater Best Management Practice Design Guide, Volume 1 – GeneralConsiderations, 2004
Design Methodology
Each Stormceptor system is sized using PCSWMM for Stormceptor, a continuous simulation model basedon US EPA SWMM. The program calculates hydrology from up-to-date local historical rainfall data andspecified site parameters. With US EPA SWMM’s precision, every Stormceptor unit is designed toachieve a defined water quality objective.
The TSS removal data presented follows US EPA guidelines to reduce the average annual TSS load.Stormceptor’s unit process for TSS removal is settling. The settling model calculates TSS removal byanalyzing (summary of analysis presented in Appendix 2):
Site parameters Continuous historical rainfall, including duration, distribution, peaks (Figure 1)Interevent periodsParticle size distributionParticle settling velocities (Stokes Law, corrected for drag)TSS load (Figure 2)Detention time of the system
The Stormceptor System maintains continuous positive TSS removal for all influent flow rates. Figure 3illustrates the continuous treatment by Stormceptor throughout the full range of storm events analyzed. Itis clear that large events do not significantly impact the average annual TSS removal. There is no declinein cumulative TSS removal, indicating scour does not occur as the flow rate increases.
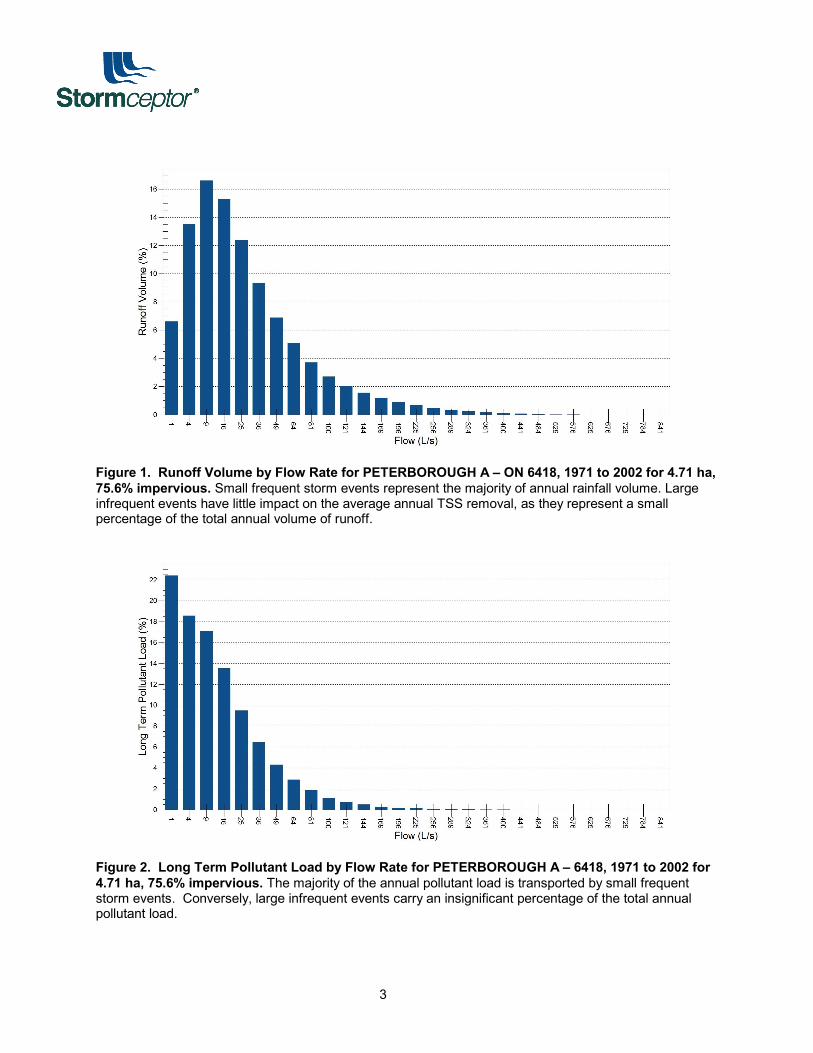
3
Figure 1. Runoff Volume by Flow Rate for PETERBOROUGH A – ON 6418, 1971 to 2002 for 4.71 ha,75.6% impervious. Small frequent storm events represent the majority of annual rainfall volume. Largeinfrequent events have little impact on the average annual TSS removal, as they represent a smallpercentage of the total annual volume of runoff.
Figure 2. Long Term Pollutant Load by Flow Rate for PETERBOROUGH A – 6418, 1971 to 2002 for4.71 ha, 75.6% impervious. The majority of the annual pollutant load is transported by small frequentstorm events. Conversely, large infrequent events carry an insignificant percentage of the total annualpollutant load.
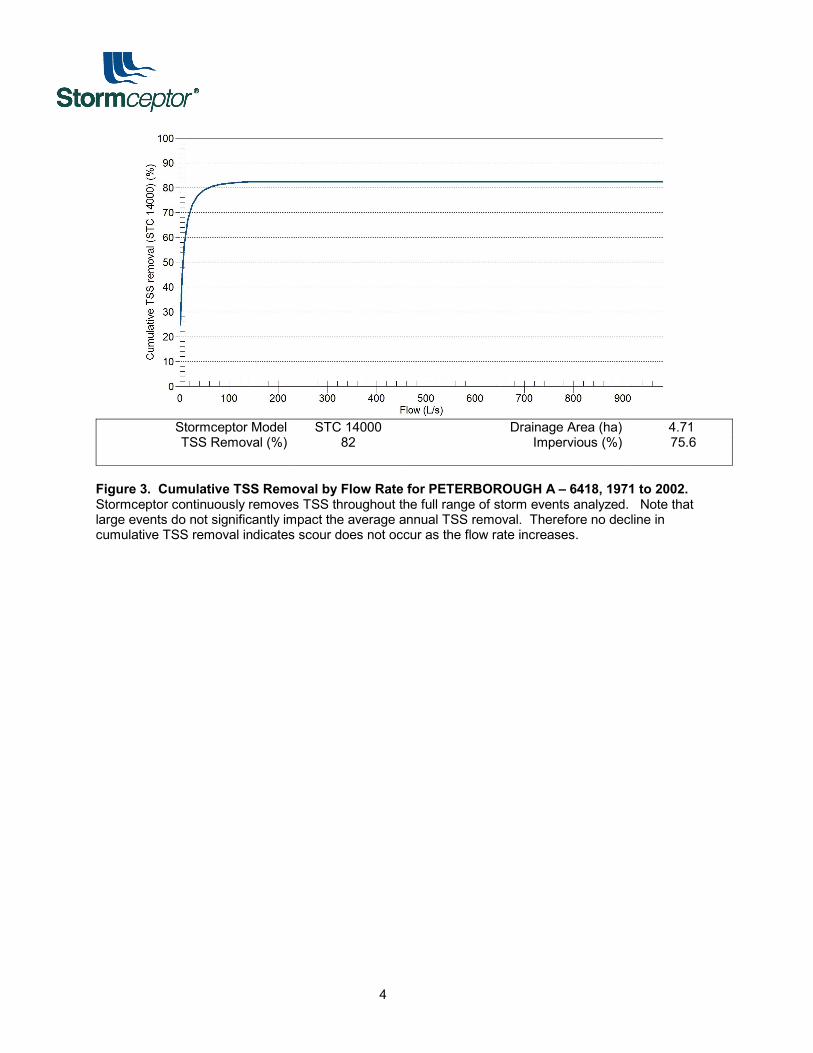
4
Stormceptor ModelTSS Removal (%)
STC 1400082
Drainage Area (ha)Impervious (%)
4.7175.6
Figure 3. Cumulative TSS Removal by Flow Rate for PETERBOROUGH A – 6418, 1971 to 2002.Stormceptor continuously removes TSS throughout the full range of storm events analyzed. Note thatlarge events do not significantly impact the average annual TSS removal. Therefore no decline incumulative TSS removal indicates scour does not occur as the flow rate increases.
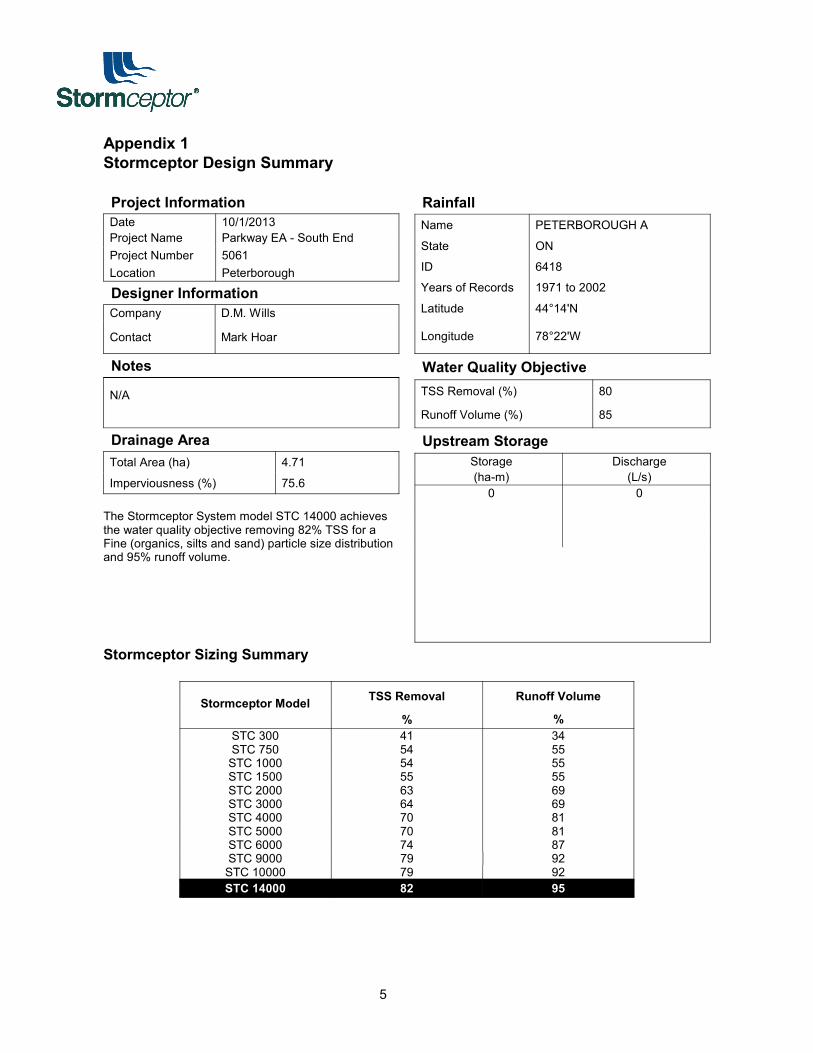
5
Appendix 1Stormceptor Design Summary
Project InformationDate 10/1/2013Project Name Parkway EA - South EndProject Number 5061Location Peterborough
Designer InformationCompany D.M. Wills
Contact Mark Hoar
RainfallName PETERBOROUGH A
State ON
ID 6418
Years of Records 1971 to 2002
Latitude 44°14'N
Longitude 78°22'W
Notes
N/A
Water Quality ObjectiveTSS Removal (%) 80
Runoff Volume (%) 85
Drainage AreaTotal Area (ha) 4.71
Imperviousness (%) 75.6
The Stormceptor System model STC 14000 achievesthe water quality objective removing 82% TSS for aFine (organics, silts and sand) particle size distributionand 95% runoff volume.
Upstream StorageStorage Discharge(ha-m) (L/s)
0 0
Stormceptor Sizing Summary
Stormceptor Model TSS Removal Runoff Volume
% %STC 300 41 34STC 750 54 55STC 1000 54 55STC 1500 55 55STC 2000 63 69STC 3000 64 69STC 4000 70 81STC 5000 70 81STC 6000 74 87STC 9000 79 92STC 10000 79 92STC 14000 82 95

6
Particle Size DistributionRemoving silt particles from runoff ensures that the majority of the pollutants, such as hydrocarbons and heavymetals that adhere to fine particles, are not discharged into our natural water courses. The table below lists theparticle size distribution used to define the annual TSS removal.
Fine (organics, silts and sand)
Particle Size Distribution SpecificGravity
SettlingVelocity Particle Size Distribution Specific
GravitySettlingVelocity
µm % m/s µm % m/s20 20 1.3 0.000460 20 1.8 0.0016150 20 2.2 0.0108400 20 2.65 0.06472000 20 2.65 0.2870
Stormceptor Design NotesStormceptor performance estimates are based on simulations using PCSWMM for Stormceptor version 1.0Design estimates listed are only representative of specific project requirements based on total suspendedsolids (TSS) removal.Only the STC 300 is adaptable to function with a catch basin inlet and/or inline pipes.Only the Stormceptor models STC 750 to STC 6000 may accommodate multiple inlet pipes.Inlet and outlet invert elevation differences are as follows:
Inlet and Outlet Pipe Invert Elevations Differences
Inlet Pipe Configuration STC 300 STC 750 toSTC 6000
STC 9000 toSTC 14000
Single inlet pipe 75 mm 25 mm 75 mm
Multiple inlet pipes 75 mm 75 mm Only one inletpipe.
Design estimates are based on stable site conditions only, after construction is completed.Design estimates assume that the storm drain is not submerged during zero flows. For submergedapplications, please contact your local Stormceptor representative.Design estimates may be modified for specific spills controls. Please contact your local Stormceptorrepresentative for further assistance.For pricing inquiries or assistance, please contact Imbrium Systems Inc., 1-800-565-4801.

7
Appendix 2Summary of Design Assumptions
SITE DETAILS
Site Drainage AreaTotal Area (ha) 4.71 Imperviousness (%) 75.6
Surface CharacteristicsWidth (m) 434Slope (%) 2Impervious Depression Storage (mm) 0.508Pervious Depression Storage (mm) 5.08Impervious Manning’s n 0.015Pervious Manning's n 0.25
Maintenance FrequencySediment build-up reduces the storage volume forsedimentation. Frequency of maintenance isassumed for TSS removal calculations.Maintenance Frequency (months) 12
Infiltration ParametersHorton’s equation is used to estimate infiltrationMax. Infiltration Rate (mm/h) 61.98Min. Infiltration Rate (mm/h) 10.16
Decay Rate (s-1) 0.00055
Regeneration Rate (s-1) 0.01
EvaporationDaily Evaporation Rate (mm/day) 2.54
Dry Weather FlowDry Weather Flow (L/s) No
Upstream AttenuationStage-storage and stage-discharge relationship used to model attenuation upstream of the Stormceptor Systemis identified in the table below.
Storage Dischargeha-m L/s
0 0

8
PARTICLE SIZE DISTRIBUTIONParticle Size DistributionRemoving fine particles from runoff ensures the majority of pollutants, such as heavy metals, hydrocarbons, free oilsand nutrients are not discharged into natural water resources. The table below identifies the particle size distributionselected to define TSS removal for the design of the Stormceptor System.
Fine (organics, silts and sand)
Particle Size Distribution SpecificGravity
SettlingVelocity Particle Size Distribution Specific
GravitySettlingVelocity
µm % m/s µm % m/s20 20 1.3 0.000460 20 1.8 0.0016150 20 2.2 0.0108400 20 2.65 0.0647
2000 20 2.65 0.2870
Figure 1. PCSWMM for Stormceptor standard design grain size distributions.

9
TSS LOADINGTSS Loading ParametersTSS Loading Function Buildup / Washoff
ParametersTarget Event Mean Concentration(EMC) (mg/L) 125
Exponential Buildup Power 0.4Exponential Washoff Exponential 0.2
HYDROLOGY ANALYSISPCSWMM for Stormceptor calculates annual hydrology with the US EPA SWMM and local continuous historicalrainfall data. Performance calculations of the Stormceptor System are based on the average annual removal ofTSS for the selected site parameters. The Stormceptor System is engineered to capture fine particles (silts andsands) by focusing on average annual runoff volume ensuring positive removal efficiency is maintained during allrainfall events, while preventing the opportunity for negative removal efficiency (scour).
Smaller recurring storms account for the majority of rainfall events and average annual runoff volume, as observedin the historical rainfall data analyses presented in this section.
Rainfall StationRainfall Station PETERBOROUGH A
Rainfall File Name ON6418.NDC Total Number of Events 3171Latitude 44°14'N Total Rainfall (mm) 14411.4Longitude 78°22'W Average Annual Rainfall (mm) 450.4Elevation (m) Total Evaporation (mm) 1163.3Rainfall Period of Record (y) 32 Total Infiltration (mm) 3502.9
Total Rainfall Period (y) 32 Percentage of Rainfall that isRunoff (%) 67.9
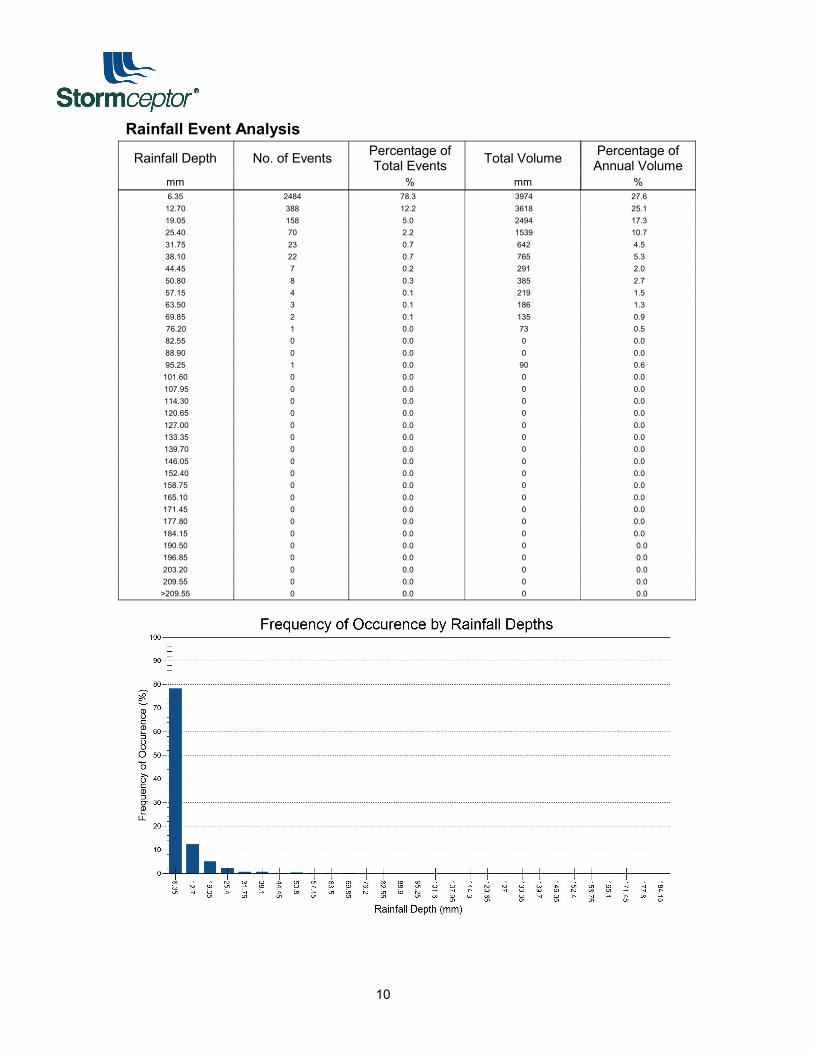
10
Rainfall Event Analysis
Rainfall Depth No. of Events Percentage ofTotal Events Total Volume Percentage of
Annual Volumemm % mm %6.35 2484 78.3 3974 27.612.70 388 12.2 3618 25.119.05 158 5.0 2494 17.325.40 70 2.2 1539 10.731.75 23 0.7 642 4.538.10 22 0.7 765 5.344.45 7 0.2 291 2.050.80 8 0.3 385 2.757.15 4 0.1 219 1.563.50 3 0.1 186 1.369.85 2 0.1 135 0.976.20 1 0.0 73 0.582.55 0 0.0 0 0.088.90 0 0.0 0 0.095.25 1 0.0 90 0.6
101.60 0 0.0 0 0.0107.95 0 0.0 0 0.0114.30 0 0.0 0 0.0120.65 0 0.0 0 0.0127.00 0 0.0 0 0.0133.35 0 0.0 0 0.0139.70 0 0.0 0 0.0146.05 0 0.0 0 0.0152.40 0 0.0 0 0.0158.75 0 0.0 0 0.0165.10 0 0.0 0 0.0171.45 0 0.0 0 0.0177.80 0 0.0 0 0.0184.15 0 0.0 0 0.0190.50 0 0.0 0 0.0196.85 0 0.0 0 0.0203.20 0 0.0 0 0.0209.55 0 0.0 0 0.0
>209.55 0 0.0 0 0.0
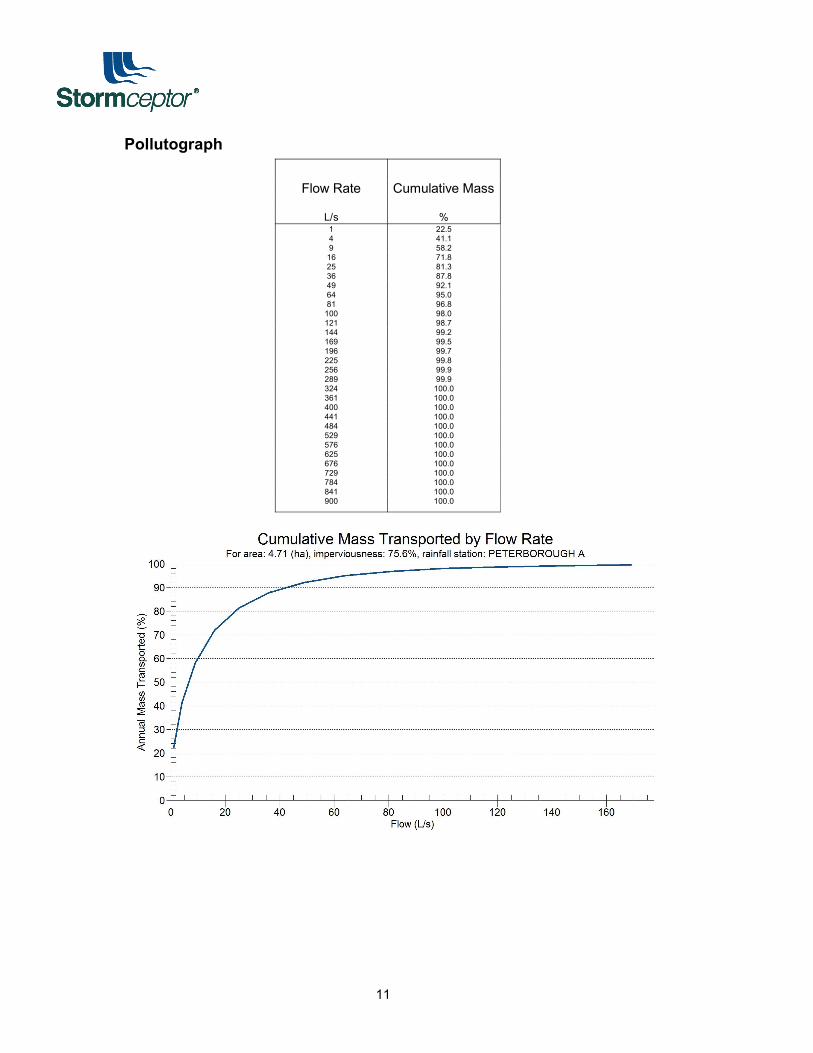
11
Pollutograph
Flow Rate Cumulative Mass
L/s %1 22.54 41.19 58.216 71.825 81.336 87.849 92.164 95.081 96.8
100 98.0121 98.7144 99.2169 99.5196 99.7225 99.8256 99.9289 99.9324 100.0361 100.0400 100.0441 100.0484 100.0529 100.0576 100.0625 100.0676 100.0729 100.0784 100.0841 100.0900 100.0
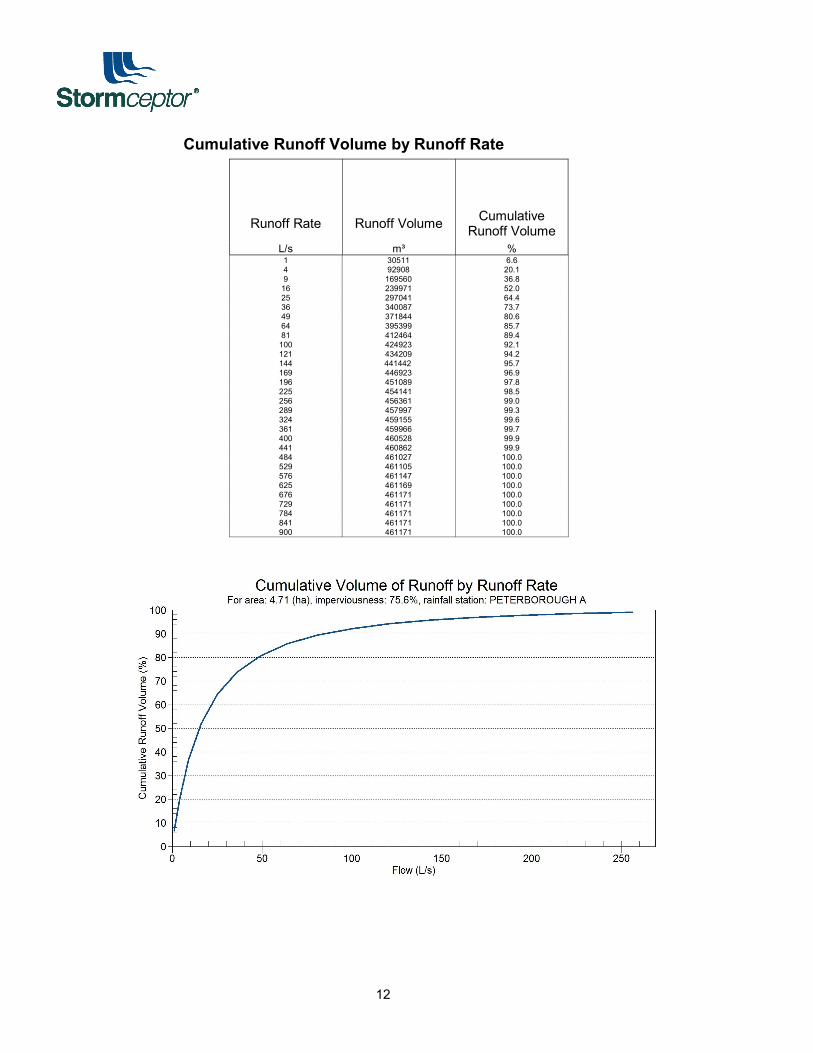
12
Cumulative Runoff Volume by Runoff Rate
Runoff Rate Runoff Volume CumulativeRunoff Volume
L/s m³ %1 30511 6.64 92908 20.19 169560 36.8
16 239971 52.025 297041 64.436 340087 73.749 371844 80.664 395399 85.781 412464 89.4
100 424923 92.1121 434209 94.2144 441442 95.7169 446923 96.9196 451089 97.8225 454141 98.5256 456361 99.0289 457997 99.3324 459155 99.6361 459966 99.7400 460528 99.9441 460862 99.9484 461027 100.0529 461105 100.0576 461147 100.0625 461169 100.0676 461171 100.0729 461171 100.0784 461171 100.0841 461171 100.0900 461171 100.0


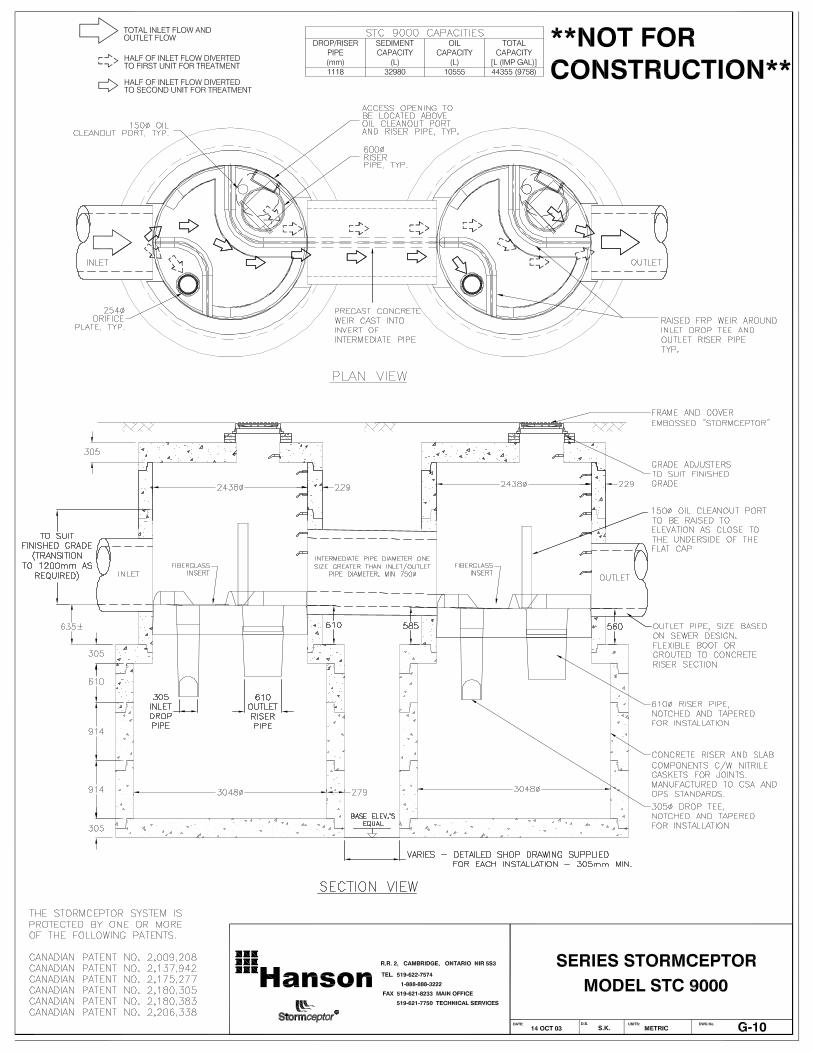
Appendix C VO2 Model
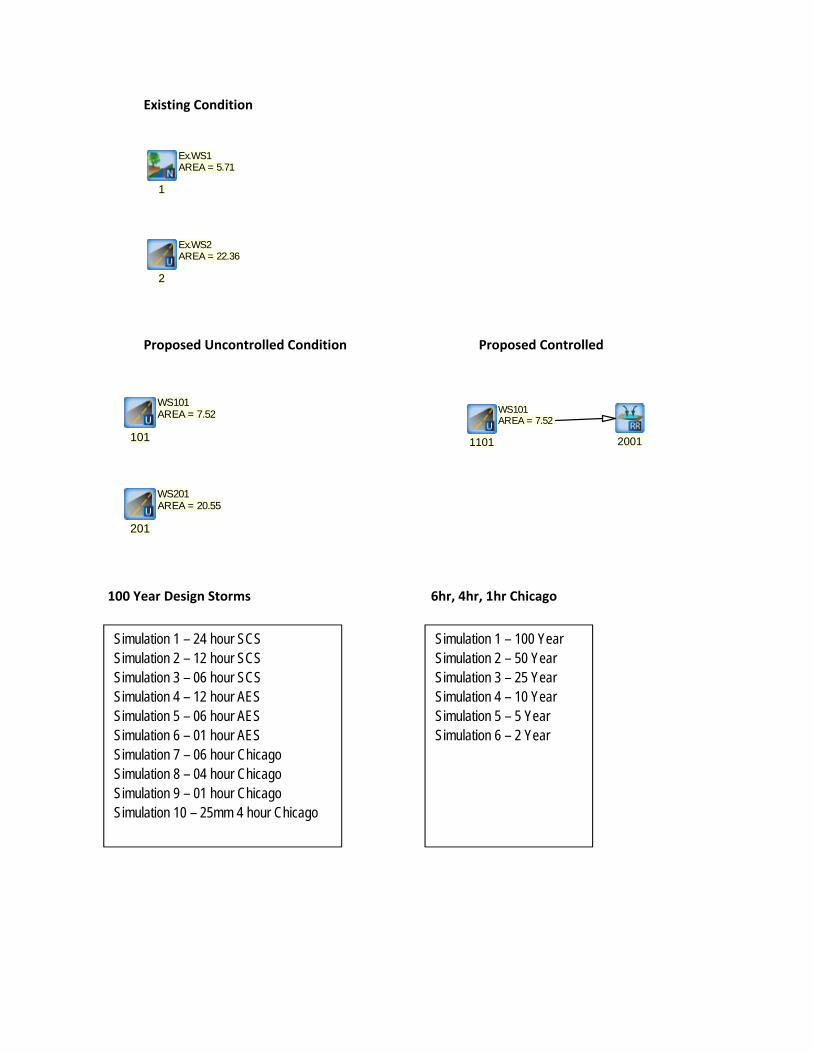
Existing Condition
Proposed Uncontrolled Condition Proposed Controlled
100 Year Design Storms 6hr, 4hr, 1hr Chicago
1
Ex.WS1AREA = 5.71
2
Ex.WS2AREA = 22.36
101
WS101AREA = 7.52
201
WS201AREA = 20.55
20011101
WS101AREA = 7.52
Simulation 1 – 24 hour SCS Simulation 2 – 12 hour SCS Simulation 3 – 06 hour SCS Simulation 4 – 12 hour AES Simulation 5 – 06 hour AES Simulation 6 – 01 hour AES Simulation 7 – 06 hour Chicago Simulation 8 – 04 hour Chicago Simulation 9 – 01 hour Chicago Simulation 10 – 25mm 4 hour Chicago
Simulation 1 – 100 Year Simulation 2 – 50 Year Simulation 3 – 25 Year Simulation 4 – 10 Year Simulation 5 – 5 Year Simulation 6 – 2 Year

100 Year.txt=========================================================================================================== V V I SSSSS U U A L V V I SS U U A A L V V I SS U U AAAAA L V V I SS U U A A L VV I SSSSS UUUUU A A LLLLL OOO TTTTT TTTTT H H Y Y M M OOO TM O O T T H H Y Y MM MM O O O O T T H H Y M M O O OOO T T H H Y M M OOO
Developed and Distributed by Clarifica Inc. Copyright 1996, 2007 Clarifica Inc.All rights reserved. ***** D E T A I L E D O U T P U T *****
Input filename: C:\Program Files (x86)\Visual OTTHYMO 2.2.4\voin.dat Output filename: F:\5000\50QDSS~P\0GBGVB~C\W5V6R6~P\056EVL~F\0FXFY8~T\02VKUS~U\0KZGT7~E\5QEKRL~H\100 Year.out Summary filename: F:\5000\50QDSS~P\0GBGVB~C\W5V6R6~P\056EVL~F\0FXFY8~T\02VKUS~U\0KZGT7~E\5QEKRL~H\100 Year.sum
DATE: 10/2/2013 TIME: 10:47:40 AM
USER:
COMMENTS: ____________________________________________________________
----------------------------------------------------------------------------------------------------------- **************************** ** SIMULATION NUMBER: 1 ** **************************** --------------------| READ STORM | Filename: F:\5000\5061 - Parkway Corridor Class EA\ | | 04 Disciplines\Water Resources\ | | 06 - Preliminary Detailed Design for Ponds\Ap| Ptotal= 99.11 mm | Comments: 100 Year, 24-hour SCS Type II Distributi-------------------- TIME RAIN | TIME RAIN | TIME RAIN | TIME RAIN hrs mm/hr | hrs mm/hr | hrs mm/hr | hrs mm/hr 1.00 .99 | 7.00 1.98 | 13.00 8.92 | 19.00 1.98 2.00 .99 | 8.00 1.98 | 14.00 3.96 | 20.00 .99 3.00 .99 | 9.00 2.97 | 15.00 2.97 | 21.00 .99 4.00 .99 | 10.00 3.96 | 16.00 2.97 | 22.00 .99 5.00 1.98 | 11.00 5.95 | 17.00 1.98 | 23.00 .99 6.00 1.98 | 12.00 44.60 | 18.00 1.98 | 24.00 .99 -------------------------------------------------------------------------------
--------------------| CALIB || NASHYD (0001) | Area (ha)= 5.71 Curve Number (CN)= 72.0|ID= 1 DT= 5.0 min | Ia (mm)= 7.30 # of Linear Res.(N)= 3.00-------------------- U.H. Tp(hrs)= .40 NOTE: RAINFALL WAS TRANSFORMED TO 5.0 MIN. TIME STEP.
---- TRANSFORMED HYETOGRAPH ---- TIME RAIN | TIME RAIN | TIME RAIN | TIME RAIN hrs mm/hr | hrs mm/hr | hrs mm/hr | hrs mm/hr .083 .99 | 6.083 1.98 |12.083 8.92 | 18.08 1.98 .167 .99 | 6.167 1.98 |12.167 8.92 | 18.17 1.98 .250 .99 | 6.250 1.98 |12.250 8.92 | 18.25 1.98 .333 .99 | 6.333 1.98 |12.333 8.92 | 18.33 1.98 .417 .99 | 6.417 1.98 |12.417 8.92 | 18.42 1.98 .500 .99 | 6.500 1.98 |12.500 8.92 | 18.50 1.98 .583 .99 | 6.583 1.98 |12.583 8.92 | 18.58 1.98 .667 .99 | 6.667 1.98 |12.667 8.92 | 18.67 1.98 .750 .99 | 6.750 1.98 |12.750 8.92 | 18.75 1.98 .833 .99 | 6.833 1.98 |12.833 8.92 | 18.83 1.98 .917 .99 | 6.917 1.98 |12.917 8.92 | 18.92 1.98 1.000 .99 | 7.000 1.98 |13.000 8.92 | 19.00 1.98 1.083 .99 | 7.083 1.98 |13.083 3.97 | 19.08 .99 1.167 .99 | 7.167 1.98 |13.167 3.96 | 19.17 .99 1.250 .99 | 7.250 1.98 |13.250 3.96 | 19.25 .99
Page 1
100 Year.txt 1.333 .99 | 7.333 1.98 |13.333 3.96 | 19.33 .99 1.417 .99 | 7.417 1.98 |13.417 3.96 | 19.42 .99 1.500 .99 | 7.500 1.98 |13.500 3.96 | 19.50 .99 1.583 .99 | 7.583 1.98 |13.583 3.96 | 19.58 .99 1.667 .99 | 7.667 1.98 |13.667 3.96 | 19.67 .99 1.750 .99 | 7.750 1.98 |13.750 3.96 | 19.75 .99 1.833 .99 | 7.833 1.98 |13.833 3.96 | 19.83 .99 1.917 .99 | 7.917 1.98 |13.917 3.96 | 19.92 .99 2.000 .99 | 8.000 1.98 |14.000 3.96 | 20.00 .99 2.083 .99 | 8.083 2.97 |14.083 2.97 | 20.08 .99 2.167 .99 | 8.167 2.97 |14.167 2.97 | 20.17 .99 2.250 .99 | 8.250 2.97 |14.250 2.97 | 20.25 .99 2.333 .99 | 8.333 2.97 |14.333 2.97 | 20.33 .99 2.417 .99 | 8.417 2.97 |14.417 2.97 | 20.42 .99 2.500 .99 | 8.500 2.97 |14.500 2.97 | 20.50 .99 2.583 .99 | 8.583 2.97 |14.583 2.97 | 20.58 .99 2.667 .99 | 8.667 2.97 |14.667 2.97 | 20.67 .99 2.750 .99 | 8.750 2.97 |14.750 2.97 | 20.75 .99 2.833 .99 | 8.833 2.97 |14.833 2.97 | 20.83 .99 2.917 .99 | 8.917 2.97 |14.917 2.97 | 20.92 .99 3.000 .99 | 9.000 2.97 |15.000 2.97 | 21.00 .99 3.083 .99 | 9.083 3.96 |15.083 2.97 | 21.08 .99 3.167 .99 | 9.167 3.96 |15.167 2.97 | 21.17 .99 3.250 .99 | 9.250 3.96 |15.250 2.97 | 21.25 .99 3.333 .99 | 9.333 3.96 |15.333 2.97 | 21.33 .99 3.417 .99 | 9.417 3.96 |15.417 2.97 | 21.42 .99 3.500 .99 | 9.500 3.96 |15.500 2.97 | 21.50 .99 3.583 .99 | 9.583 3.96 |15.583 2.97 | 21.58 .99 3.667 .99 | 9.667 3.96 |15.667 2.97 | 21.67 .99 3.750 .99 | 9.750 3.96 |15.750 2.97 | 21.75 .99 3.833 .99 | 9.833 3.96 |15.833 2.97 | 21.83 .99 3.917 .99 | 9.917 3.96 |15.917 2.97 | 21.92 .99 4.000 .99 |10.000 3.96 |16.000 2.97 | 22.00 .99 4.083 1.98 |10.083 5.95 |16.083 1.98 | 22.08 .99 4.167 1.98 |10.167 5.95 |16.167 1.98 | 22.17 .99 4.250 1.98 |10.250 5.95 |16.250 1.98 | 22.25 .99 4.333 1.98 |10.333 5.95 |16.333 1.98 | 22.33 .99 4.417 1.98 |10.417 5.95 |16.417 1.98 | 22.42 .99 4.500 1.98 |10.500 5.95 |16.500 1.98 | 22.50 .99 4.583 1.98 |10.583 5.95 |16.583 1.98 | 22.58 .99 4.667 1.98 |10.667 5.95 |16.667 1.98 | 22.67 .99 4.750 1.98 |10.750 5.95 |16.750 1.98 | 22.75 .99 4.833 1.98 |10.833 5.95 |16.833 1.98 | 22.83 .99 4.917 1.98 |10.917 5.95 |16.917 1.98 | 22.92 .99 5.000 1.98 |11.000 5.95 |17.000 1.98 | 23.00 .99 5.083 1.98 |11.083 44.59 |17.083 1.98 | 23.08 .99 5.167 1.98 |11.167 44.60 |17.167 1.98 | 23.17 .99 5.250 1.98 |11.250 44.60 |17.250 1.98 | 23.25 .99 5.333 1.98 |11.333 44.60 |17.333 1.98 | 23.33 .99 5.417 1.98 |11.417 44.60 |17.417 1.98 | 23.42 .99 5.500 1.98 |11.500 44.60 |17.500 1.98 | 23.50 .99 5.583 1.98 |11.583 44.60 |17.583 1.98 | 23.58 .99 5.667 1.98 |11.667 44.60 |17.667 1.98 | 23.67 .99 5.750 1.98 |11.750 44.60 |17.750 1.98 | 23.75 .99 5.833 1.98 |11.833 44.60 |17.833 1.98 | 23.83 .99 5.917 1.98 |11.917 44.60 |17.917 1.98 | 23.92 .99 6.000 1.98 |12.000 44.60 |18.000 1.98 | 24.00 .99 Unit Hyd Qpeak (cms)= .545 PEAK FLOW (cms)= .326 (i) TIME TO PEAK (hrs)= 12.083 RUNOFF VOLUME (mm)= 44.218 TOTAL RAINFALL (mm)= 99.106 RUNOFF COEFFICIENT = .446 (i) PEAK FLOW DOES NOT INCLUDE BASEFLOW IF ANY. ---------------------------------------------------------------------------------------------------| CALIB || STANDHYD (0101) | Area (ha)= 7.52|ID= 1 DT= 5.0 min | Total Imp(%)= 43.00 Dir. Conn.(%)= 43.00-------------------- IMPERVIOUS PERVIOUS (i) Surface Area (ha)= 3.23 4.29 Dep. Storage (mm)= 1.00 6.20 Average Slope (%)= 1.90 2.00 Length (m)= 480.00 40.00 Mannings n = .013 .250 Max.Eff.Inten.(mm/hr)= 44.60 20.82 over (min) 5.00 25.00 Storage Coeff. (min)= 7.46 (ii) 20.68 (ii) Unit Hyd. Tpeak (min)= 5.00 25.00 Unit Hyd. peak (cms)= .17 .05 *TOTALS* PEAK FLOW (cms)= .40 .19 .584 (iii)
Page 2
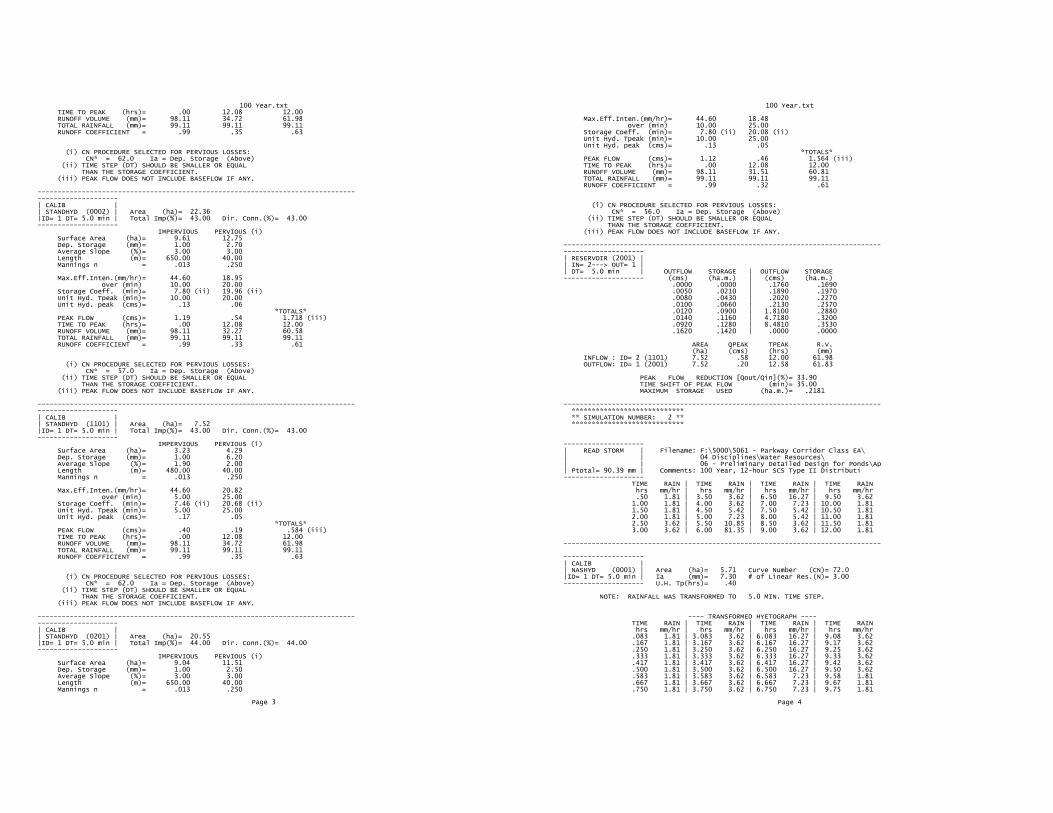
100 Year.txt TIME TO PEAK (hrs)= .00 12.08 12.00 RUNOFF VOLUME (mm)= 98.11 34.72 61.98 TOTAL RAINFALL (mm)= 99.11 99.11 99.11 RUNOFF COEFFICIENT = .99 .35 .63 (i) CN PROCEDURE SELECTED FOR PERVIOUS LOSSES: CN* = 62.0 Ia = Dep. Storage (Above) (ii) TIME STEP (DT) SHOULD BE SMALLER OR EQUAL THAN THE STORAGE COEFFICIENT. (iii) PEAK FLOW DOES NOT INCLUDE BASEFLOW IF ANY. ---------------------------------------------------------------------------------------------------| CALIB || STANDHYD (0002) | Area (ha)= 22.36|ID= 1 DT= 5.0 min | Total Imp(%)= 43.00 Dir. Conn.(%)= 43.00-------------------- IMPERVIOUS PERVIOUS (i) Surface Area (ha)= 9.61 12.75 Dep. Storage (mm)= 1.00 2.70 Average Slope (%)= 3.00 3.00 Length (m)= 650.00 40.00 Mannings n = .013 .250 Max.Eff.Inten.(mm/hr)= 44.60 18.95 over (min) 10.00 20.00 Storage Coeff. (min)= 7.80 (ii) 19.96 (ii) Unit Hyd. Tpeak (min)= 10.00 20.00 Unit Hyd. peak (cms)= .13 .06 *TOTALS* PEAK FLOW (cms)= 1.19 .54 1.718 (iii) TIME TO PEAK (hrs)= .00 12.08 12.00 RUNOFF VOLUME (mm)= 98.11 32.27 60.58 TOTAL RAINFALL (mm)= 99.11 99.11 99.11 RUNOFF COEFFICIENT = .99 .33 .61 (i) CN PROCEDURE SELECTED FOR PERVIOUS LOSSES: CN* = 57.0 Ia = Dep. Storage (Above) (ii) TIME STEP (DT) SHOULD BE SMALLER OR EQUAL THAN THE STORAGE COEFFICIENT. (iii) PEAK FLOW DOES NOT INCLUDE BASEFLOW IF ANY. ---------------------------------------------------------------------------------------------------| CALIB || STANDHYD (1101) | Area (ha)= 7.52|ID= 1 DT= 5.0 min | Total Imp(%)= 43.00 Dir. Conn.(%)= 43.00-------------------- IMPERVIOUS PERVIOUS (i) Surface Area (ha)= 3.23 4.29 Dep. Storage (mm)= 1.00 6.20 Average Slope (%)= 1.90 2.00 Length (m)= 480.00 40.00 Mannings n = .013 .250 Max.Eff.Inten.(mm/hr)= 44.60 20.82 over (min) 5.00 25.00 Storage Coeff. (min)= 7.46 (ii) 20.68 (ii) Unit Hyd. Tpeak (min)= 5.00 25.00 Unit Hyd. peak (cms)= .17 .05 *TOTALS* PEAK FLOW (cms)= .40 .19 .584 (iii) TIME TO PEAK (hrs)= .00 12.08 12.00 RUNOFF VOLUME (mm)= 98.11 34.72 61.98 TOTAL RAINFALL (mm)= 99.11 99.11 99.11 RUNOFF COEFFICIENT = .99 .35 .63 (i) CN PROCEDURE SELECTED FOR PERVIOUS LOSSES: CN* = 62.0 Ia = Dep. Storage (Above) (ii) TIME STEP (DT) SHOULD BE SMALLER OR EQUAL THAN THE STORAGE COEFFICIENT. (iii) PEAK FLOW DOES NOT INCLUDE BASEFLOW IF ANY. ---------------------------------------------------------------------------------------------------| CALIB || STANDHYD (0201) | Area (ha)= 20.55|ID= 1 DT= 5.0 min | Total Imp(%)= 44.00 Dir. Conn.(%)= 44.00-------------------- IMPERVIOUS PERVIOUS (i) Surface Area (ha)= 9.04 11.51 Dep. Storage (mm)= 1.00 2.50 Average Slope (%)= 3.00 3.00 Length (m)= 650.00 40.00 Mannings n = .013 .250
Page 3
100 Year.txt Max.Eff.Inten.(mm/hr)= 44.60 18.48 over (min) 10.00 25.00 Storage Coeff. (min)= 7.80 (ii) 20.08 (ii) Unit Hyd. Tpeak (min)= 10.00 25.00 Unit Hyd. peak (cms)= .13 .05 *TOTALS* PEAK FLOW (cms)= 1.12 .46 1.564 (iii) TIME TO PEAK (hrs)= .00 12.08 12.00 RUNOFF VOLUME (mm)= 98.11 31.51 60.81 TOTAL RAINFALL (mm)= 99.11 99.11 99.11 RUNOFF COEFFICIENT = .99 .32 .61 (i) CN PROCEDURE SELECTED FOR PERVIOUS LOSSES: CN* = 56.0 Ia = Dep. Storage (Above) (ii) TIME STEP (DT) SHOULD BE SMALLER OR EQUAL THAN THE STORAGE COEFFICIENT. (iii) PEAK FLOW DOES NOT INCLUDE BASEFLOW IF ANY. ---------------------------------------------------------------------------------------------------| RESERVOIR (2001) || IN= 2---> OUT= 1 || DT= 5.0 min | OUTFLOW STORAGE | OUTFLOW STORAGE-------------------- (cms) (ha.m.) | (cms) (ha.m.) .0000 .0000 | .1760 .1690 .0050 .0210 | .1890 .1970 .0080 .0430 | .2020 .2270 .0100 .0660 | .2130 .2570 .0120 .0900 | 1.8100 .2880 .0140 .1160 | 4.7180 .3200 .0920 .1280 | 8.4810 .3530 .1620 .1420 | .0000 .0000 AREA QPEAK TPEAK R.V. (ha) (cms) (hrs) (mm) INFLOW : ID= 2 (1101) 7.52 .58 12.00 61.98 OUTFLOW: ID= 1 (2001) 7.52 .20 12.58 61.83 PEAK FLOW REDUCTION [Qout/Qin](%)= 33.90 TIME SHIFT OF PEAK FLOW (min)= 35.00 MAXIMUM STORAGE USED (ha.m.)= .2181 ------------------------------------------------------------------------------- **************************** ** SIMULATION NUMBER: 2 ** **************************** --------------------| READ STORM | Filename: F:\5000\5061 - Parkway Corridor Class EA\ | | 04 Disciplines\Water Resources\ | | 06 - Preliminary Detailed Design for Ponds\Ap| Ptotal= 90.39 mm | Comments: 100 Year, 12-hour SCS Type II Distributi-------------------- TIME RAIN | TIME RAIN | TIME RAIN | TIME RAIN hrs mm/hr | hrs mm/hr | hrs mm/hr | hrs mm/hr .50 1.81 | 3.50 3.62 | 6.50 16.27 | 9.50 3.62 1.00 1.81 | 4.00 3.62 | 7.00 7.23 | 10.00 1.81 1.50 1.81 | 4.50 5.42 | 7.50 5.42 | 10.50 1.81 2.00 1.81 | 5.00 7.23 | 8.00 5.42 | 11.00 1.81 2.50 3.62 | 5.50 10.85 | 8.50 3.62 | 11.50 1.81 3.00 3.62 | 6.00 81.35 | 9.00 3.62 | 12.00 1.81 -------------------------------------------------------------------------------
--------------------| CALIB || NASHYD (0001) | Area (ha)= 5.71 Curve Number (CN)= 72.0|ID= 1 DT= 5.0 min | Ia (mm)= 7.30 # of Linear Res.(N)= 3.00-------------------- U.H. Tp(hrs)= .40 NOTE: RAINFALL WAS TRANSFORMED TO 5.0 MIN. TIME STEP.
---- TRANSFORMED HYETOGRAPH ---- TIME RAIN | TIME RAIN | TIME RAIN | TIME RAIN hrs mm/hr | hrs mm/hr | hrs mm/hr | hrs mm/hr .083 1.81 | 3.083 3.62 | 6.083 16.27 | 9.08 3.62 .167 1.81 | 3.167 3.62 | 6.167 16.27 | 9.17 3.62 .250 1.81 | 3.250 3.62 | 6.250 16.27 | 9.25 3.62 .333 1.81 | 3.333 3.62 | 6.333 16.27 | 9.33 3.62 .417 1.81 | 3.417 3.62 | 6.417 16.27 | 9.42 3.62 .500 1.81 | 3.500 3.62 | 6.500 16.27 | 9.50 3.62 .583 1.81 | 3.583 3.62 | 6.583 7.23 | 9.58 1.81 .667 1.81 | 3.667 3.62 | 6.667 7.23 | 9.67 1.81 .750 1.81 | 3.750 3.62 | 6.750 7.23 | 9.75 1.81
Page 4
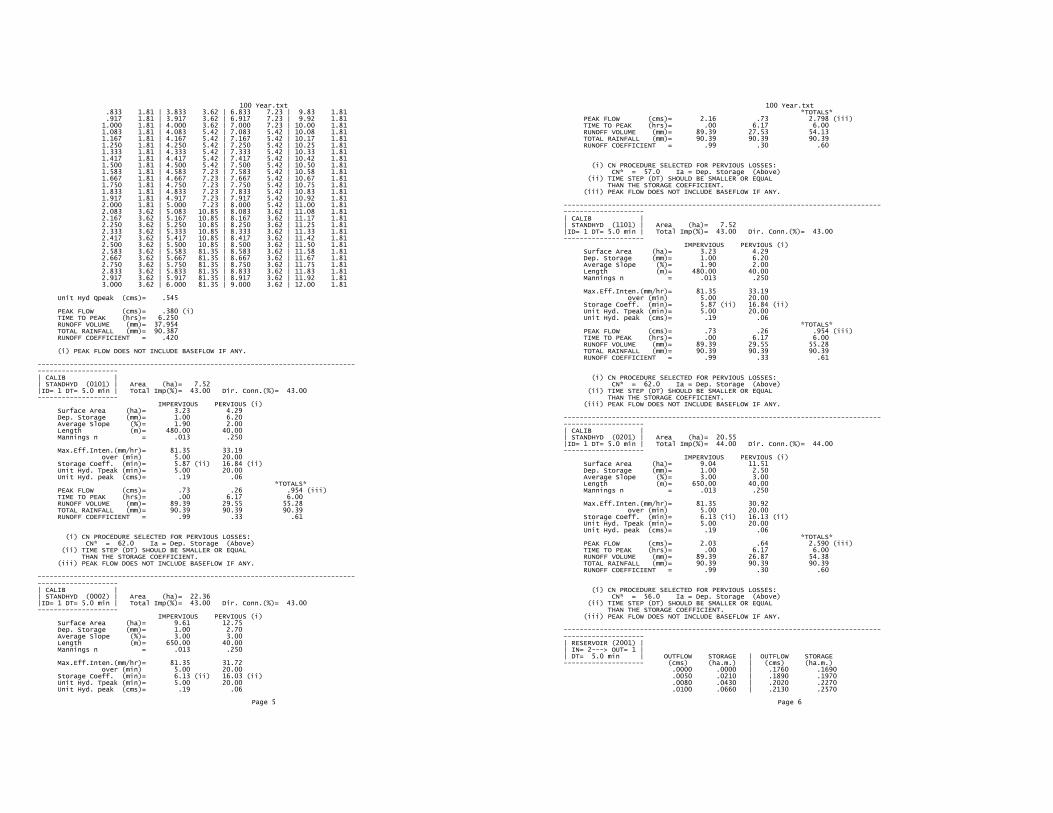
100 Year.txt .833 1.81 | 3.833 3.62 | 6.833 7.23 | 9.83 1.81 .917 1.81 | 3.917 3.62 | 6.917 7.23 | 9.92 1.81 1.000 1.81 | 4.000 3.62 | 7.000 7.23 | 10.00 1.81 1.083 1.81 | 4.083 5.42 | 7.083 5.42 | 10.08 1.81 1.167 1.81 | 4.167 5.42 | 7.167 5.42 | 10.17 1.81 1.250 1.81 | 4.250 5.42 | 7.250 5.42 | 10.25 1.81 1.333 1.81 | 4.333 5.42 | 7.333 5.42 | 10.33 1.81 1.417 1.81 | 4.417 5.42 | 7.417 5.42 | 10.42 1.81 1.500 1.81 | 4.500 5.42 | 7.500 5.42 | 10.50 1.81 1.583 1.81 | 4.583 7.23 | 7.583 5.42 | 10.58 1.81 1.667 1.81 | 4.667 7.23 | 7.667 5.42 | 10.67 1.81 1.750 1.81 | 4.750 7.23 | 7.750 5.42 | 10.75 1.81 1.833 1.81 | 4.833 7.23 | 7.833 5.42 | 10.83 1.81 1.917 1.81 | 4.917 7.23 | 7.917 5.42 | 10.92 1.81 2.000 1.81 | 5.000 7.23 | 8.000 5.42 | 11.00 1.81 2.083 3.62 | 5.083 10.85 | 8.083 3.62 | 11.08 1.81 2.167 3.62 | 5.167 10.85 | 8.167 3.62 | 11.17 1.81 2.250 3.62 | 5.250 10.85 | 8.250 3.62 | 11.25 1.81 2.333 3.62 | 5.333 10.85 | 8.333 3.62 | 11.33 1.81 2.417 3.62 | 5.417 10.85 | 8.417 3.62 | 11.42 1.81 2.500 3.62 | 5.500 10.85 | 8.500 3.62 | 11.50 1.81 2.583 3.62 | 5.583 81.35 | 8.583 3.62 | 11.58 1.81 2.667 3.62 | 5.667 81.35 | 8.667 3.62 | 11.67 1.81 2.750 3.62 | 5.750 81.35 | 8.750 3.62 | 11.75 1.81 2.833 3.62 | 5.833 81.35 | 8.833 3.62 | 11.83 1.81 2.917 3.62 | 5.917 81.35 | 8.917 3.62 | 11.92 1.81 3.000 3.62 | 6.000 81.35 | 9.000 3.62 | 12.00 1.81 Unit Hyd Qpeak (cms)= .545 PEAK FLOW (cms)= .380 (i) TIME TO PEAK (hrs)= 6.250 RUNOFF VOLUME (mm)= 37.954 TOTAL RAINFALL (mm)= 90.387 RUNOFF COEFFICIENT = .420 (i) PEAK FLOW DOES NOT INCLUDE BASEFLOW IF ANY. ---------------------------------------------------------------------------------------------------| CALIB || STANDHYD (0101) | Area (ha)= 7.52|ID= 1 DT= 5.0 min | Total Imp(%)= 43.00 Dir. Conn.(%)= 43.00-------------------- IMPERVIOUS PERVIOUS (i) Surface Area (ha)= 3.23 4.29 Dep. Storage (mm)= 1.00 6.20 Average Slope (%)= 1.90 2.00 Length (m)= 480.00 40.00 Mannings n = .013 .250 Max.Eff.Inten.(mm/hr)= 81.35 33.19 over (min) 5.00 20.00 Storage Coeff. (min)= 5.87 (ii) 16.84 (ii) Unit Hyd. Tpeak (min)= 5.00 20.00 Unit Hyd. peak (cms)= .19 .06 *TOTALS* PEAK FLOW (cms)= .73 .26 .954 (iii) TIME TO PEAK (hrs)= .00 6.17 6.00 RUNOFF VOLUME (mm)= 89.39 29.55 55.28 TOTAL RAINFALL (mm)= 90.39 90.39 90.39 RUNOFF COEFFICIENT = .99 .33 .61 (i) CN PROCEDURE SELECTED FOR PERVIOUS LOSSES: CN* = 62.0 Ia = Dep. Storage (Above) (ii) TIME STEP (DT) SHOULD BE SMALLER OR EQUAL THAN THE STORAGE COEFFICIENT. (iii) PEAK FLOW DOES NOT INCLUDE BASEFLOW IF ANY. ---------------------------------------------------------------------------------------------------| CALIB || STANDHYD (0002) | Area (ha)= 22.36|ID= 1 DT= 5.0 min | Total Imp(%)= 43.00 Dir. Conn.(%)= 43.00-------------------- IMPERVIOUS PERVIOUS (i) Surface Area (ha)= 9.61 12.75 Dep. Storage (mm)= 1.00 2.70 Average Slope (%)= 3.00 3.00 Length (m)= 650.00 40.00 Mannings n = .013 .250 Max.Eff.Inten.(mm/hr)= 81.35 31.72 over (min) 5.00 20.00 Storage Coeff. (min)= 6.13 (ii) 16.03 (ii) Unit Hyd. Tpeak (min)= 5.00 20.00 Unit Hyd. peak (cms)= .19 .06
Page 5
100 Year.txt *TOTALS* PEAK FLOW (cms)= 2.16 .73 2.798 (iii) TIME TO PEAK (hrs)= .00 6.17 6.00 RUNOFF VOLUME (mm)= 89.39 27.53 54.13 TOTAL RAINFALL (mm)= 90.39 90.39 90.39 RUNOFF COEFFICIENT = .99 .30 .60 (i) CN PROCEDURE SELECTED FOR PERVIOUS LOSSES: CN* = 57.0 Ia = Dep. Storage (Above) (ii) TIME STEP (DT) SHOULD BE SMALLER OR EQUAL THAN THE STORAGE COEFFICIENT. (iii) PEAK FLOW DOES NOT INCLUDE BASEFLOW IF ANY. ---------------------------------------------------------------------------------------------------| CALIB || STANDHYD (1101) | Area (ha)= 7.52|ID= 1 DT= 5.0 min | Total Imp(%)= 43.00 Dir. Conn.(%)= 43.00-------------------- IMPERVIOUS PERVIOUS (i) Surface Area (ha)= 3.23 4.29 Dep. Storage (mm)= 1.00 6.20 Average Slope (%)= 1.90 2.00 Length (m)= 480.00 40.00 Mannings n = .013 .250 Max.Eff.Inten.(mm/hr)= 81.35 33.19 over (min) 5.00 20.00 Storage Coeff. (min)= 5.87 (ii) 16.84 (ii) Unit Hyd. Tpeak (min)= 5.00 20.00 Unit Hyd. peak (cms)= .19 .06 *TOTALS* PEAK FLOW (cms)= .73 .26 .954 (iii) TIME TO PEAK (hrs)= .00 6.17 6.00 RUNOFF VOLUME (mm)= 89.39 29.55 55.28 TOTAL RAINFALL (mm)= 90.39 90.39 90.39 RUNOFF COEFFICIENT = .99 .33 .61 (i) CN PROCEDURE SELECTED FOR PERVIOUS LOSSES: CN* = 62.0 Ia = Dep. Storage (Above) (ii) TIME STEP (DT) SHOULD BE SMALLER OR EQUAL THAN THE STORAGE COEFFICIENT. (iii) PEAK FLOW DOES NOT INCLUDE BASEFLOW IF ANY. ---------------------------------------------------------------------------------------------------| CALIB || STANDHYD (0201) | Area (ha)= 20.55|ID= 1 DT= 5.0 min | Total Imp(%)= 44.00 Dir. Conn.(%)= 44.00-------------------- IMPERVIOUS PERVIOUS (i) Surface Area (ha)= 9.04 11.51 Dep. Storage (mm)= 1.00 2.50 Average Slope (%)= 3.00 3.00 Length (m)= 650.00 40.00 Mannings n = .013 .250 Max.Eff.Inten.(mm/hr)= 81.35 30.92 over (min) 5.00 20.00 Storage Coeff. (min)= 6.13 (ii) 16.13 (ii) Unit Hyd. Tpeak (min)= 5.00 20.00 Unit Hyd. peak (cms)= .19 .06 *TOTALS* PEAK FLOW (cms)= 2.03 .64 2.590 (iii) TIME TO PEAK (hrs)= .00 6.17 6.00 RUNOFF VOLUME (mm)= 89.39 26.87 54.38 TOTAL RAINFALL (mm)= 90.39 90.39 90.39 RUNOFF COEFFICIENT = .99 .30 .60 (i) CN PROCEDURE SELECTED FOR PERVIOUS LOSSES: CN* = 56.0 Ia = Dep. Storage (Above) (ii) TIME STEP (DT) SHOULD BE SMALLER OR EQUAL THAN THE STORAGE COEFFICIENT. (iii) PEAK FLOW DOES NOT INCLUDE BASEFLOW IF ANY. ---------------------------------------------------------------------------------------------------| RESERVOIR (2001) || IN= 2---> OUT= 1 || DT= 5.0 min | OUTFLOW STORAGE | OUTFLOW STORAGE-------------------- (cms) (ha.m.) | (cms) (ha.m.) .0000 .0000 | .1760 .1690 .0050 .0210 | .1890 .1970 .0080 .0430 | .2020 .2270 .0100 .0660 | .2130 .2570
Page 6
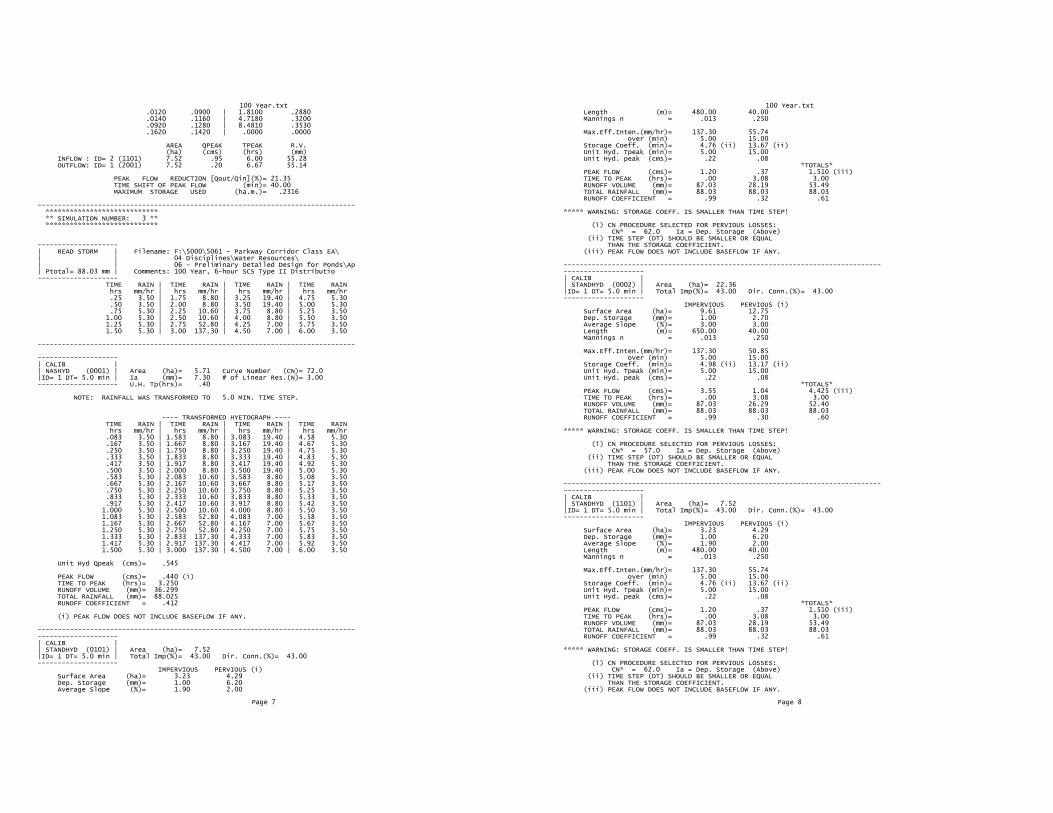
100 Year.txt .0120 .0900 | 1.8100 .2880 .0140 .1160 | 4.7180 .3200 .0920 .1280 | 8.4810 .3530 .1620 .1420 | .0000 .0000 AREA QPEAK TPEAK R.V. (ha) (cms) (hrs) (mm) INFLOW : ID= 2 (1101) 7.52 .95 6.00 55.28 OUTFLOW: ID= 1 (2001) 7.52 .20 6.67 55.14 PEAK FLOW REDUCTION [Qout/Qin](%)= 21.35 TIME SHIFT OF PEAK FLOW (min)= 40.00 MAXIMUM STORAGE USED (ha.m.)= .2316 ------------------------------------------------------------------------------- **************************** ** SIMULATION NUMBER: 3 ** **************************** --------------------| READ STORM | Filename: F:\5000\5061 - Parkway Corridor Class EA\ | | 04 Disciplines\Water Resources\ | | 06 - Preliminary Detailed Design for Ponds\Ap| Ptotal= 88.03 mm | Comments: 100 Year, 6-hour SCS Type II Distributio-------------------- TIME RAIN | TIME RAIN | TIME RAIN | TIME RAIN hrs mm/hr | hrs mm/hr | hrs mm/hr | hrs mm/hr .25 3.50 | 1.75 8.80 | 3.25 19.40 | 4.75 5.30 .50 3.50 | 2.00 8.80 | 3.50 19.40 | 5.00 5.30 .75 5.30 | 2.25 10.60 | 3.75 8.80 | 5.25 3.50 1.00 5.30 | 2.50 10.60 | 4.00 8.80 | 5.50 3.50 1.25 5.30 | 2.75 52.80 | 4.25 7.00 | 5.75 3.50 1.50 5.30 | 3.00 137.30 | 4.50 7.00 | 6.00 3.50 -------------------------------------------------------------------------------
--------------------| CALIB || NASHYD (0001) | Area (ha)= 5.71 Curve Number (CN)= 72.0|ID= 1 DT= 5.0 min | Ia (mm)= 7.30 # of Linear Res.(N)= 3.00-------------------- U.H. Tp(hrs)= .40 NOTE: RAINFALL WAS TRANSFORMED TO 5.0 MIN. TIME STEP.
---- TRANSFORMED HYETOGRAPH ---- TIME RAIN | TIME RAIN | TIME RAIN | TIME RAIN hrs mm/hr | hrs mm/hr | hrs mm/hr | hrs mm/hr .083 3.50 | 1.583 8.80 | 3.083 19.40 | 4.58 5.30 .167 3.50 | 1.667 8.80 | 3.167 19.40 | 4.67 5.30 .250 3.50 | 1.750 8.80 | 3.250 19.40 | 4.75 5.30 .333 3.50 | 1.833 8.80 | 3.333 19.40 | 4.83 5.30 .417 3.50 | 1.917 8.80 | 3.417 19.40 | 4.92 5.30 .500 3.50 | 2.000 8.80 | 3.500 19.40 | 5.00 5.30 .583 5.30 | 2.083 10.60 | 3.583 8.80 | 5.08 3.50 .667 5.30 | 2.167 10.60 | 3.667 8.80 | 5.17 3.50 .750 5.30 | 2.250 10.60 | 3.750 8.80 | 5.25 3.50 .833 5.30 | 2.333 10.60 | 3.833 8.80 | 5.33 3.50 .917 5.30 | 2.417 10.60 | 3.917 8.80 | 5.42 3.50 1.000 5.30 | 2.500 10.60 | 4.000 8.80 | 5.50 3.50 1.083 5.30 | 2.583 52.80 | 4.083 7.00 | 5.58 3.50 1.167 5.30 | 2.667 52.80 | 4.167 7.00 | 5.67 3.50 1.250 5.30 | 2.750 52.80 | 4.250 7.00 | 5.75 3.50 1.333 5.30 | 2.833 137.30 | 4.333 7.00 | 5.83 3.50 1.417 5.30 | 2.917 137.30 | 4.417 7.00 | 5.92 3.50 1.500 5.30 | 3.000 137.30 | 4.500 7.00 | 6.00 3.50 Unit Hyd Qpeak (cms)= .545 PEAK FLOW (cms)= .440 (i) TIME TO PEAK (hrs)= 3.250 RUNOFF VOLUME (mm)= 36.299 TOTAL RAINFALL (mm)= 88.025 RUNOFF COEFFICIENT = .412 (i) PEAK FLOW DOES NOT INCLUDE BASEFLOW IF ANY. ---------------------------------------------------------------------------------------------------| CALIB || STANDHYD (0101) | Area (ha)= 7.52|ID= 1 DT= 5.0 min | Total Imp(%)= 43.00 Dir. Conn.(%)= 43.00-------------------- IMPERVIOUS PERVIOUS (i) Surface Area (ha)= 3.23 4.29 Dep. Storage (mm)= 1.00 6.20 Average Slope (%)= 1.90 2.00
Page 7
100 Year.txt Length (m)= 480.00 40.00 Mannings n = .013 .250 Max.Eff.Inten.(mm/hr)= 137.30 55.74 over (min) 5.00 15.00 Storage Coeff. (min)= 4.76 (ii) 13.67 (ii) Unit Hyd. Tpeak (min)= 5.00 15.00 Unit Hyd. peak (cms)= .22 .08 *TOTALS* PEAK FLOW (cms)= 1.20 .37 1.510 (iii) TIME TO PEAK (hrs)= .00 3.08 3.00 RUNOFF VOLUME (mm)= 87.03 28.19 53.49 TOTAL RAINFALL (mm)= 88.03 88.03 88.03 RUNOFF COEFFICIENT = .99 .32 .61 ***** WARNING: STORAGE COEFF. IS SMALLER THAN TIME STEP! (i) CN PROCEDURE SELECTED FOR PERVIOUS LOSSES: CN* = 62.0 Ia = Dep. Storage (Above) (ii) TIME STEP (DT) SHOULD BE SMALLER OR EQUAL THAN THE STORAGE COEFFICIENT. (iii) PEAK FLOW DOES NOT INCLUDE BASEFLOW IF ANY. ---------------------------------------------------------------------------------------------------| CALIB || STANDHYD (0002) | Area (ha)= 22.36|ID= 1 DT= 5.0 min | Total Imp(%)= 43.00 Dir. Conn.(%)= 43.00-------------------- IMPERVIOUS PERVIOUS (i) Surface Area (ha)= 9.61 12.75 Dep. Storage (mm)= 1.00 2.70 Average Slope (%)= 3.00 3.00 Length (m)= 650.00 40.00 Mannings n = .013 .250 Max.Eff.Inten.(mm/hr)= 137.30 50.85 over (min) 5.00 15.00 Storage Coeff. (min)= 4.98 (ii) 13.17 (ii) Unit Hyd. Tpeak (min)= 5.00 15.00 Unit Hyd. peak (cms)= .22 .08 *TOTALS* PEAK FLOW (cms)= 3.55 1.04 4.425 (iii) TIME TO PEAK (hrs)= .00 3.08 3.00 RUNOFF VOLUME (mm)= 87.03 26.29 52.40 TOTAL RAINFALL (mm)= 88.03 88.03 88.03 RUNOFF COEFFICIENT = .99 .30 .60 ***** WARNING: STORAGE COEFF. IS SMALLER THAN TIME STEP! (i) CN PROCEDURE SELECTED FOR PERVIOUS LOSSES: CN* = 57.0 Ia = Dep. Storage (Above) (ii) TIME STEP (DT) SHOULD BE SMALLER OR EQUAL THAN THE STORAGE COEFFICIENT. (iii) PEAK FLOW DOES NOT INCLUDE BASEFLOW IF ANY. ---------------------------------------------------------------------------------------------------| CALIB || STANDHYD (1101) | Area (ha)= 7.52|ID= 1 DT= 5.0 min | Total Imp(%)= 43.00 Dir. Conn.(%)= 43.00-------------------- IMPERVIOUS PERVIOUS (i) Surface Area (ha)= 3.23 4.29 Dep. Storage (mm)= 1.00 6.20 Average Slope (%)= 1.90 2.00 Length (m)= 480.00 40.00 Mannings n = .013 .250 Max.Eff.Inten.(mm/hr)= 137.30 55.74 over (min) 5.00 15.00 Storage Coeff. (min)= 4.76 (ii) 13.67 (ii) Unit Hyd. Tpeak (min)= 5.00 15.00 Unit Hyd. peak (cms)= .22 .08 *TOTALS* PEAK FLOW (cms)= 1.20 .37 1.510 (iii) TIME TO PEAK (hrs)= .00 3.08 3.00 RUNOFF VOLUME (mm)= 87.03 28.19 53.49 TOTAL RAINFALL (mm)= 88.03 88.03 88.03 RUNOFF COEFFICIENT = .99 .32 .61 ***** WARNING: STORAGE COEFF. IS SMALLER THAN TIME STEP! (i) CN PROCEDURE SELECTED FOR PERVIOUS LOSSES: CN* = 62.0 Ia = Dep. Storage (Above) (ii) TIME STEP (DT) SHOULD BE SMALLER OR EQUAL THAN THE STORAGE COEFFICIENT. (iii) PEAK FLOW DOES NOT INCLUDE BASEFLOW IF ANY.
Page 8
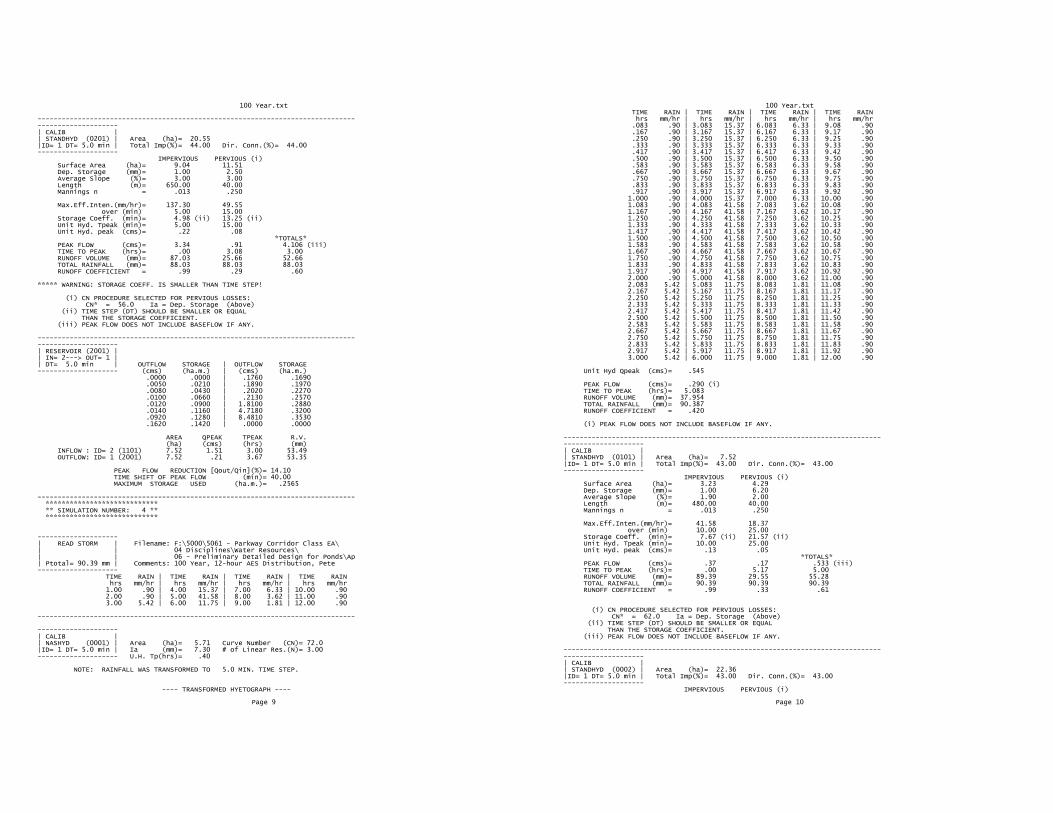
100 Year.txt ---------------------------------------------------------------------------------------------------| CALIB || STANDHYD (0201) | Area (ha)= 20.55|ID= 1 DT= 5.0 min | Total Imp(%)= 44.00 Dir. Conn.(%)= 44.00-------------------- IMPERVIOUS PERVIOUS (i) Surface Area (ha)= 9.04 11.51 Dep. Storage (mm)= 1.00 2.50 Average Slope (%)= 3.00 3.00 Length (m)= 650.00 40.00 Mannings n = .013 .250 Max.Eff.Inten.(mm/hr)= 137.30 49.55 over (min) 5.00 15.00 Storage Coeff. (min)= 4.98 (ii) 13.25 (ii) Unit Hyd. Tpeak (min)= 5.00 15.00 Unit Hyd. peak (cms)= .22 .08 *TOTALS* PEAK FLOW (cms)= 3.34 .91 4.106 (iii) TIME TO PEAK (hrs)= .00 3.08 3.00 RUNOFF VOLUME (mm)= 87.03 25.66 52.66 TOTAL RAINFALL (mm)= 88.03 88.03 88.03 RUNOFF COEFFICIENT = .99 .29 .60 ***** WARNING: STORAGE COEFF. IS SMALLER THAN TIME STEP! (i) CN PROCEDURE SELECTED FOR PERVIOUS LOSSES: CN* = 56.0 Ia = Dep. Storage (Above) (ii) TIME STEP (DT) SHOULD BE SMALLER OR EQUAL THAN THE STORAGE COEFFICIENT. (iii) PEAK FLOW DOES NOT INCLUDE BASEFLOW IF ANY. ---------------------------------------------------------------------------------------------------| RESERVOIR (2001) || IN= 2---> OUT= 1 || DT= 5.0 min | OUTFLOW STORAGE | OUTFLOW STORAGE-------------------- (cms) (ha.m.) | (cms) (ha.m.) .0000 .0000 | .1760 .1690 .0050 .0210 | .1890 .1970 .0080 .0430 | .2020 .2270 .0100 .0660 | .2130 .2570 .0120 .0900 | 1.8100 .2880 .0140 .1160 | 4.7180 .3200 .0920 .1280 | 8.4810 .3530 .1620 .1420 | .0000 .0000 AREA QPEAK TPEAK R.V. (ha) (cms) (hrs) (mm) INFLOW : ID= 2 (1101) 7.52 1.51 3.00 53.49 OUTFLOW: ID= 1 (2001) 7.52 .21 3.67 53.35 PEAK FLOW REDUCTION [Qout/Qin](%)= 14.10 TIME SHIFT OF PEAK FLOW (min)= 40.00 MAXIMUM STORAGE USED (ha.m.)= .2565 ------------------------------------------------------------------------------- **************************** ** SIMULATION NUMBER: 4 ** **************************** --------------------| READ STORM | Filename: F:\5000\5061 - Parkway Corridor Class EA\ | | 04 Disciplines\Water Resources\ | | 06 - Preliminary Detailed Design for Ponds\Ap| Ptotal= 90.39 mm | Comments: 100 Year, 12-hour AES Distribution, Pete-------------------- TIME RAIN | TIME RAIN | TIME RAIN | TIME RAIN hrs mm/hr | hrs mm/hr | hrs mm/hr | hrs mm/hr 1.00 .90 | 4.00 15.37 | 7.00 6.33 | 10.00 .90 2.00 .90 | 5.00 41.58 | 8.00 3.62 | 11.00 .90 3.00 5.42 | 6.00 11.75 | 9.00 1.81 | 12.00 .90 -------------------------------------------------------------------------------
--------------------| CALIB || NASHYD (0001) | Area (ha)= 5.71 Curve Number (CN)= 72.0|ID= 1 DT= 5.0 min | Ia (mm)= 7.30 # of Linear Res.(N)= 3.00-------------------- U.H. Tp(hrs)= .40 NOTE: RAINFALL WAS TRANSFORMED TO 5.0 MIN. TIME STEP.
---- TRANSFORMED HYETOGRAPH ----
Page 9
100 Year.txt TIME RAIN | TIME RAIN | TIME RAIN | TIME RAIN hrs mm/hr | hrs mm/hr | hrs mm/hr | hrs mm/hr .083 .90 | 3.083 15.37 | 6.083 6.33 | 9.08 .90 .167 .90 | 3.167 15.37 | 6.167 6.33 | 9.17 .90 .250 .90 | 3.250 15.37 | 6.250 6.33 | 9.25 .90 .333 .90 | 3.333 15.37 | 6.333 6.33 | 9.33 .90 .417 .90 | 3.417 15.37 | 6.417 6.33 | 9.42 .90 .500 .90 | 3.500 15.37 | 6.500 6.33 | 9.50 .90 .583 .90 | 3.583 15.37 | 6.583 6.33 | 9.58 .90 .667 .90 | 3.667 15.37 | 6.667 6.33 | 9.67 .90 .750 .90 | 3.750 15.37 | 6.750 6.33 | 9.75 .90 .833 .90 | 3.833 15.37 | 6.833 6.33 | 9.83 .90 .917 .90 | 3.917 15.37 | 6.917 6.33 | 9.92 .90 1.000 .90 | 4.000 15.37 | 7.000 6.33 | 10.00 .90 1.083 .90 | 4.083 41.58 | 7.083 3.62 | 10.08 .90 1.167 .90 | 4.167 41.58 | 7.167 3.62 | 10.17 .90 1.250 .90 | 4.250 41.58 | 7.250 3.62 | 10.25 .90 1.333 .90 | 4.333 41.58 | 7.333 3.62 | 10.33 .90 1.417 .90 | 4.417 41.58 | 7.417 3.62 | 10.42 .90 1.500 .90 | 4.500 41.58 | 7.500 3.62 | 10.50 .90 1.583 .90 | 4.583 41.58 | 7.583 3.62 | 10.58 .90 1.667 .90 | 4.667 41.58 | 7.667 3.62 | 10.67 .90 1.750 .90 | 4.750 41.58 | 7.750 3.62 | 10.75 .90 1.833 .90 | 4.833 41.58 | 7.833 3.62 | 10.83 .90 1.917 .90 | 4.917 41.58 | 7.917 3.62 | 10.92 .90 2.000 .90 | 5.000 41.58 | 8.000 3.62 | 11.00 .90 2.083 5.42 | 5.083 11.75 | 8.083 1.81 | 11.08 .90 2.167 5.42 | 5.167 11.75 | 8.167 1.81 | 11.17 .90 2.250 5.42 | 5.250 11.75 | 8.250 1.81 | 11.25 .90 2.333 5.42 | 5.333 11.75 | 8.333 1.81 | 11.33 .90 2.417 5.42 | 5.417 11.75 | 8.417 1.81 | 11.42 .90 2.500 5.42 | 5.500 11.75 | 8.500 1.81 | 11.50 .90 2.583 5.42 | 5.583 11.75 | 8.583 1.81 | 11.58 .90 2.667 5.42 | 5.667 11.75 | 8.667 1.81 | 11.67 .90 2.750 5.42 | 5.750 11.75 | 8.750 1.81 | 11.75 .90 2.833 5.42 | 5.833 11.75 | 8.833 1.81 | 11.83 .90 2.917 5.42 | 5.917 11.75 | 8.917 1.81 | 11.92 .90 3.000 5.42 | 6.000 11.75 | 9.000 1.81 | 12.00 .90 Unit Hyd Qpeak (cms)= .545 PEAK FLOW (cms)= .290 (i) TIME TO PEAK (hrs)= 5.083 RUNOFF VOLUME (mm)= 37.954 TOTAL RAINFALL (mm)= 90.387 RUNOFF COEFFICIENT = .420 (i) PEAK FLOW DOES NOT INCLUDE BASEFLOW IF ANY. ---------------------------------------------------------------------------------------------------| CALIB || STANDHYD (0101) | Area (ha)= 7.52|ID= 1 DT= 5.0 min | Total Imp(%)= 43.00 Dir. Conn.(%)= 43.00-------------------- IMPERVIOUS PERVIOUS (i) Surface Area (ha)= 3.23 4.29 Dep. Storage (mm)= 1.00 6.20 Average Slope (%)= 1.90 2.00 Length (m)= 480.00 40.00 Mannings n = .013 .250 Max.Eff.Inten.(mm/hr)= 41.58 18.37 over (min) 10.00 25.00 Storage Coeff. (min)= 7.67 (ii) 21.57 (ii) Unit Hyd. Tpeak (min)= 10.00 25.00 Unit Hyd. peak (cms)= .13 .05 *TOTALS* PEAK FLOW (cms)= .37 .17 .533 (iii) TIME TO PEAK (hrs)= .00 5.17 5.00 RUNOFF VOLUME (mm)= 89.39 29.55 55.28 TOTAL RAINFALL (mm)= 90.39 90.39 90.39 RUNOFF COEFFICIENT = .99 .33 .61 (i) CN PROCEDURE SELECTED FOR PERVIOUS LOSSES: CN* = 62.0 Ia = Dep. Storage (Above) (ii) TIME STEP (DT) SHOULD BE SMALLER OR EQUAL THAN THE STORAGE COEFFICIENT. (iii) PEAK FLOW DOES NOT INCLUDE BASEFLOW IF ANY. ---------------------------------------------------------------------------------------------------| CALIB || STANDHYD (0002) | Area (ha)= 22.36|ID= 1 DT= 5.0 min | Total Imp(%)= 43.00 Dir. Conn.(%)= 43.00-------------------- IMPERVIOUS PERVIOUS (i)
Page 10
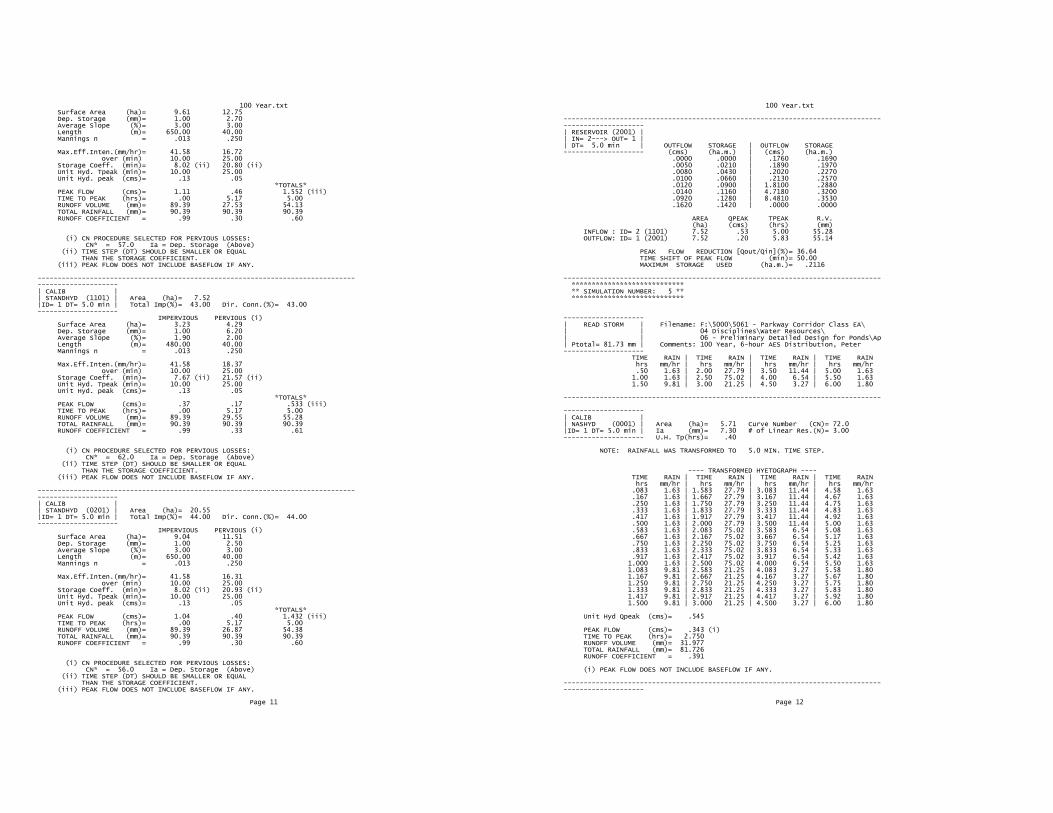
100 Year.txt Surface Area (ha)= 9.61 12.75 Dep. Storage (mm)= 1.00 2.70 Average Slope (%)= 3.00 3.00 Length (m)= 650.00 40.00 Mannings n = .013 .250 Max.Eff.Inten.(mm/hr)= 41.58 16.72 over (min) 10.00 25.00 Storage Coeff. (min)= 8.02 (ii) 20.80 (ii) Unit Hyd. Tpeak (min)= 10.00 25.00 Unit Hyd. peak (cms)= .13 .05 *TOTALS* PEAK FLOW (cms)= 1.11 .46 1.552 (iii) TIME TO PEAK (hrs)= .00 5.17 5.00 RUNOFF VOLUME (mm)= 89.39 27.53 54.13 TOTAL RAINFALL (mm)= 90.39 90.39 90.39 RUNOFF COEFFICIENT = .99 .30 .60 (i) CN PROCEDURE SELECTED FOR PERVIOUS LOSSES: CN* = 57.0 Ia = Dep. Storage (Above) (ii) TIME STEP (DT) SHOULD BE SMALLER OR EQUAL THAN THE STORAGE COEFFICIENT. (iii) PEAK FLOW DOES NOT INCLUDE BASEFLOW IF ANY. ---------------------------------------------------------------------------------------------------| CALIB || STANDHYD (1101) | Area (ha)= 7.52|ID= 1 DT= 5.0 min | Total Imp(%)= 43.00 Dir. Conn.(%)= 43.00-------------------- IMPERVIOUS PERVIOUS (i) Surface Area (ha)= 3.23 4.29 Dep. Storage (mm)= 1.00 6.20 Average Slope (%)= 1.90 2.00 Length (m)= 480.00 40.00 Mannings n = .013 .250 Max.Eff.Inten.(mm/hr)= 41.58 18.37 over (min) 10.00 25.00 Storage Coeff. (min)= 7.67 (ii) 21.57 (ii) Unit Hyd. Tpeak (min)= 10.00 25.00 Unit Hyd. peak (cms)= .13 .05 *TOTALS* PEAK FLOW (cms)= .37 .17 .533 (iii) TIME TO PEAK (hrs)= .00 5.17 5.00 RUNOFF VOLUME (mm)= 89.39 29.55 55.28 TOTAL RAINFALL (mm)= 90.39 90.39 90.39 RUNOFF COEFFICIENT = .99 .33 .61 (i) CN PROCEDURE SELECTED FOR PERVIOUS LOSSES: CN* = 62.0 Ia = Dep. Storage (Above) (ii) TIME STEP (DT) SHOULD BE SMALLER OR EQUAL THAN THE STORAGE COEFFICIENT. (iii) PEAK FLOW DOES NOT INCLUDE BASEFLOW IF ANY. ---------------------------------------------------------------------------------------------------| CALIB || STANDHYD (0201) | Area (ha)= 20.55|ID= 1 DT= 5.0 min | Total Imp(%)= 44.00 Dir. Conn.(%)= 44.00-------------------- IMPERVIOUS PERVIOUS (i) Surface Area (ha)= 9.04 11.51 Dep. Storage (mm)= 1.00 2.50 Average Slope (%)= 3.00 3.00 Length (m)= 650.00 40.00 Mannings n = .013 .250 Max.Eff.Inten.(mm/hr)= 41.58 16.31 over (min) 10.00 25.00 Storage Coeff. (min)= 8.02 (ii) 20.93 (ii) Unit Hyd. Tpeak (min)= 10.00 25.00 Unit Hyd. peak (cms)= .13 .05 *TOTALS* PEAK FLOW (cms)= 1.04 .40 1.432 (iii) TIME TO PEAK (hrs)= .00 5.17 5.00 RUNOFF VOLUME (mm)= 89.39 26.87 54.38 TOTAL RAINFALL (mm)= 90.39 90.39 90.39 RUNOFF COEFFICIENT = .99 .30 .60 (i) CN PROCEDURE SELECTED FOR PERVIOUS LOSSES: CN* = 56.0 Ia = Dep. Storage (Above) (ii) TIME STEP (DT) SHOULD BE SMALLER OR EQUAL THAN THE STORAGE COEFFICIENT. (iii) PEAK FLOW DOES NOT INCLUDE BASEFLOW IF ANY.
Page 11
100 Year.txt ---------------------------------------------------------------------------------------------------| RESERVOIR (2001) || IN= 2---> OUT= 1 || DT= 5.0 min | OUTFLOW STORAGE | OUTFLOW STORAGE-------------------- (cms) (ha.m.) | (cms) (ha.m.) .0000 .0000 | .1760 .1690 .0050 .0210 | .1890 .1970 .0080 .0430 | .2020 .2270 .0100 .0660 | .2130 .2570 .0120 .0900 | 1.8100 .2880 .0140 .1160 | 4.7180 .3200 .0920 .1280 | 8.4810 .3530 .1620 .1420 | .0000 .0000 AREA QPEAK TPEAK R.V. (ha) (cms) (hrs) (mm) INFLOW : ID= 2 (1101) 7.52 .53 5.00 55.28 OUTFLOW: ID= 1 (2001) 7.52 .20 5.83 55.14 PEAK FLOW REDUCTION [Qout/Qin](%)= 36.64 TIME SHIFT OF PEAK FLOW (min)= 50.00 MAXIMUM STORAGE USED (ha.m.)= .2116 ------------------------------------------------------------------------------- **************************** ** SIMULATION NUMBER: 5 ** **************************** --------------------| READ STORM | Filename: F:\5000\5061 - Parkway Corridor Class EA\ | | 04 Disciplines\Water Resources\ | | 06 - Preliminary Detailed Design for Ponds\Ap| Ptotal= 81.73 mm | Comments: 100 Year, 6-hour AES Distribution, Peter-------------------- TIME RAIN | TIME RAIN | TIME RAIN | TIME RAIN hrs mm/hr | hrs mm/hr | hrs mm/hr | hrs mm/hr .50 1.63 | 2.00 27.79 | 3.50 11.44 | 5.00 1.63 1.00 1.63 | 2.50 75.02 | 4.00 6.54 | 5.50 1.63 1.50 9.81 | 3.00 21.25 | 4.50 3.27 | 6.00 1.80 -------------------------------------------------------------------------------
--------------------| CALIB || NASHYD (0001) | Area (ha)= 5.71 Curve Number (CN)= 72.0|ID= 1 DT= 5.0 min | Ia (mm)= 7.30 # of Linear Res.(N)= 3.00-------------------- U.H. Tp(hrs)= .40 NOTE: RAINFALL WAS TRANSFORMED TO 5.0 MIN. TIME STEP.
---- TRANSFORMED HYETOGRAPH ---- TIME RAIN | TIME RAIN | TIME RAIN | TIME RAIN hrs mm/hr | hrs mm/hr | hrs mm/hr | hrs mm/hr .083 1.63 | 1.583 27.79 | 3.083 11.44 | 4.58 1.63 .167 1.63 | 1.667 27.79 | 3.167 11.44 | 4.67 1.63 .250 1.63 | 1.750 27.79 | 3.250 11.44 | 4.75 1.63 .333 1.63 | 1.833 27.79 | 3.333 11.44 | 4.83 1.63 .417 1.63 | 1.917 27.79 | 3.417 11.44 | 4.92 1.63 .500 1.63 | 2.000 27.79 | 3.500 11.44 | 5.00 1.63 .583 1.63 | 2.083 75.02 | 3.583 6.54 | 5.08 1.63 .667 1.63 | 2.167 75.02 | 3.667 6.54 | 5.17 1.63 .750 1.63 | 2.250 75.02 | 3.750 6.54 | 5.25 1.63 .833 1.63 | 2.333 75.02 | 3.833 6.54 | 5.33 1.63 .917 1.63 | 2.417 75.02 | 3.917 6.54 | 5.42 1.63 1.000 1.63 | 2.500 75.02 | 4.000 6.54 | 5.50 1.63 1.083 9.81 | 2.583 21.25 | 4.083 3.27 | 5.58 1.80 1.167 9.81 | 2.667 21.25 | 4.167 3.27 | 5.67 1.80 1.250 9.81 | 2.750 21.25 | 4.250 3.27 | 5.75 1.80 1.333 9.81 | 2.833 21.25 | 4.333 3.27 | 5.83 1.80 1.417 9.81 | 2.917 21.25 | 4.417 3.27 | 5.92 1.80 1.500 9.81 | 3.000 21.25 | 4.500 3.27 | 6.00 1.80 Unit Hyd Qpeak (cms)= .545 PEAK FLOW (cms)= .343 (i) TIME TO PEAK (hrs)= 2.750 RUNOFF VOLUME (mm)= 31.977 TOTAL RAINFALL (mm)= 81.726 RUNOFF COEFFICIENT = .391 (i) PEAK FLOW DOES NOT INCLUDE BASEFLOW IF ANY. ---------------------------------------------------------------------------------------------------
Page 12
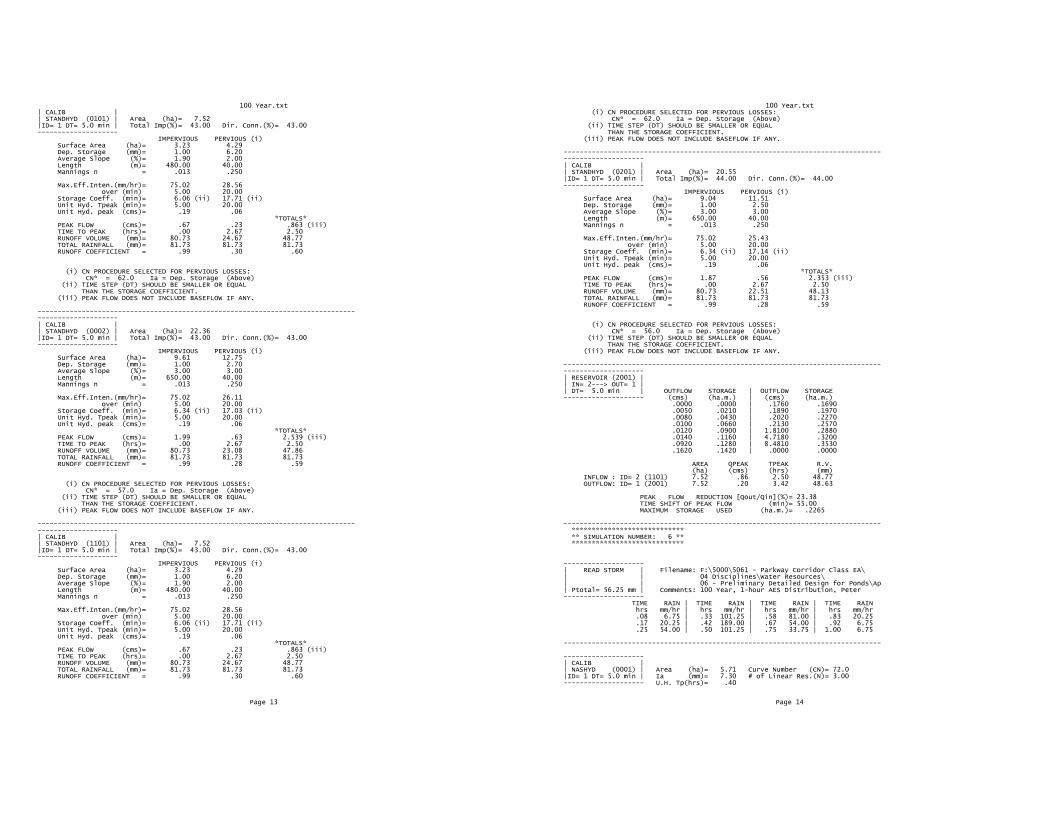
100 Year.txt| CALIB || STANDHYD (0101) | Area (ha)= 7.52|ID= 1 DT= 5.0 min | Total Imp(%)= 43.00 Dir. Conn.(%)= 43.00-------------------- IMPERVIOUS PERVIOUS (i) Surface Area (ha)= 3.23 4.29 Dep. Storage (mm)= 1.00 6.20 Average Slope (%)= 1.90 2.00 Length (m)= 480.00 40.00 Mannings n = .013 .250 Max.Eff.Inten.(mm/hr)= 75.02 28.56 over (min) 5.00 20.00 Storage Coeff. (min)= 6.06 (ii) 17.71 (ii) Unit Hyd. Tpeak (min)= 5.00 20.00 Unit Hyd. peak (cms)= .19 .06 *TOTALS* PEAK FLOW (cms)= .67 .23 .863 (iii) TIME TO PEAK (hrs)= .00 2.67 2.50 RUNOFF VOLUME (mm)= 80.73 24.67 48.77 TOTAL RAINFALL (mm)= 81.73 81.73 81.73 RUNOFF COEFFICIENT = .99 .30 .60 (i) CN PROCEDURE SELECTED FOR PERVIOUS LOSSES: CN* = 62.0 Ia = Dep. Storage (Above) (ii) TIME STEP (DT) SHOULD BE SMALLER OR EQUAL THAN THE STORAGE COEFFICIENT. (iii) PEAK FLOW DOES NOT INCLUDE BASEFLOW IF ANY. ---------------------------------------------------------------------------------------------------| CALIB || STANDHYD (0002) | Area (ha)= 22.36|ID= 1 DT= 5.0 min | Total Imp(%)= 43.00 Dir. Conn.(%)= 43.00-------------------- IMPERVIOUS PERVIOUS (i) Surface Area (ha)= 9.61 12.75 Dep. Storage (mm)= 1.00 2.70 Average Slope (%)= 3.00 3.00 Length (m)= 650.00 40.00 Mannings n = .013 .250 Max.Eff.Inten.(mm/hr)= 75.02 26.11 over (min) 5.00 20.00 Storage Coeff. (min)= 6.34 (ii) 17.03 (ii) Unit Hyd. Tpeak (min)= 5.00 20.00 Unit Hyd. peak (cms)= .19 .06 *TOTALS* PEAK FLOW (cms)= 1.99 .63 2.539 (iii) TIME TO PEAK (hrs)= .00 2.67 2.50 RUNOFF VOLUME (mm)= 80.73 23.08 47.86 TOTAL RAINFALL (mm)= 81.73 81.73 81.73 RUNOFF COEFFICIENT = .99 .28 .59 (i) CN PROCEDURE SELECTED FOR PERVIOUS LOSSES: CN* = 57.0 Ia = Dep. Storage (Above) (ii) TIME STEP (DT) SHOULD BE SMALLER OR EQUAL THAN THE STORAGE COEFFICIENT. (iii) PEAK FLOW DOES NOT INCLUDE BASEFLOW IF ANY. ---------------------------------------------------------------------------------------------------| CALIB || STANDHYD (1101) | Area (ha)= 7.52|ID= 1 DT= 5.0 min | Total Imp(%)= 43.00 Dir. Conn.(%)= 43.00-------------------- IMPERVIOUS PERVIOUS (i) Surface Area (ha)= 3.23 4.29 Dep. Storage (mm)= 1.00 6.20 Average Slope (%)= 1.90 2.00 Length (m)= 480.00 40.00 Mannings n = .013 .250 Max.Eff.Inten.(mm/hr)= 75.02 28.56 over (min) 5.00 20.00 Storage Coeff. (min)= 6.06 (ii) 17.71 (ii) Unit Hyd. Tpeak (min)= 5.00 20.00 Unit Hyd. peak (cms)= .19 .06 *TOTALS* PEAK FLOW (cms)= .67 .23 .863 (iii) TIME TO PEAK (hrs)= .00 2.67 2.50 RUNOFF VOLUME (mm)= 80.73 24.67 48.77 TOTAL RAINFALL (mm)= 81.73 81.73 81.73 RUNOFF COEFFICIENT = .99 .30 .60
Page 13
100 Year.txt (i) CN PROCEDURE SELECTED FOR PERVIOUS LOSSES: CN* = 62.0 Ia = Dep. Storage (Above) (ii) TIME STEP (DT) SHOULD BE SMALLER OR EQUAL THAN THE STORAGE COEFFICIENT. (iii) PEAK FLOW DOES NOT INCLUDE BASEFLOW IF ANY. ---------------------------------------------------------------------------------------------------| CALIB || STANDHYD (0201) | Area (ha)= 20.55|ID= 1 DT= 5.0 min | Total Imp(%)= 44.00 Dir. Conn.(%)= 44.00-------------------- IMPERVIOUS PERVIOUS (i) Surface Area (ha)= 9.04 11.51 Dep. Storage (mm)= 1.00 2.50 Average Slope (%)= 3.00 3.00 Length (m)= 650.00 40.00 Mannings n = .013 .250 Max.Eff.Inten.(mm/hr)= 75.02 25.43 over (min) 5.00 20.00 Storage Coeff. (min)= 6.34 (ii) 17.14 (ii) Unit Hyd. Tpeak (min)= 5.00 20.00 Unit Hyd. peak (cms)= .19 .06 *TOTALS* PEAK FLOW (cms)= 1.87 .56 2.353 (iii) TIME TO PEAK (hrs)= .00 2.67 2.50 RUNOFF VOLUME (mm)= 80.73 22.51 48.13 TOTAL RAINFALL (mm)= 81.73 81.73 81.73 RUNOFF COEFFICIENT = .99 .28 .59 (i) CN PROCEDURE SELECTED FOR PERVIOUS LOSSES: CN* = 56.0 Ia = Dep. Storage (Above) (ii) TIME STEP (DT) SHOULD BE SMALLER OR EQUAL THAN THE STORAGE COEFFICIENT. (iii) PEAK FLOW DOES NOT INCLUDE BASEFLOW IF ANY. ---------------------------------------------------------------------------------------------------| RESERVOIR (2001) || IN= 2---> OUT= 1 || DT= 5.0 min | OUTFLOW STORAGE | OUTFLOW STORAGE-------------------- (cms) (ha.m.) | (cms) (ha.m.) .0000 .0000 | .1760 .1690 .0050 .0210 | .1890 .1970 .0080 .0430 | .2020 .2270 .0100 .0660 | .2130 .2570 .0120 .0900 | 1.8100 .2880 .0140 .1160 | 4.7180 .3200 .0920 .1280 | 8.4810 .3530 .1620 .1420 | .0000 .0000 AREA QPEAK TPEAK R.V. (ha) (cms) (hrs) (mm) INFLOW : ID= 2 (1101) 7.52 .86 2.50 48.77 OUTFLOW: ID= 1 (2001) 7.52 .20 3.42 48.63 PEAK FLOW REDUCTION [Qout/Qin](%)= 23.38 TIME SHIFT OF PEAK FLOW (min)= 55.00 MAXIMUM STORAGE USED (ha.m.)= .2265 ------------------------------------------------------------------------------- **************************** ** SIMULATION NUMBER: 6 ** **************************** --------------------| READ STORM | Filename: F:\5000\5061 - Parkway Corridor Class EA\ | | 04 Disciplines\Water Resources\ | | 06 - Preliminary Detailed Design for Ponds\Ap| Ptotal= 56.25 mm | Comments: 100 Year, 1-hour AES Distribution, Peter-------------------- TIME RAIN | TIME RAIN | TIME RAIN | TIME RAIN hrs mm/hr | hrs mm/hr | hrs mm/hr | hrs mm/hr .08 6.75 | .33 101.25 | .58 81.00 | .83 20.25 .17 20.25 | .42 189.00 | .67 54.00 | .92 6.75 .25 54.00 | .50 101.25 | .75 33.75 | 1.00 6.75 -------------------------------------------------------------------------------
--------------------| CALIB || NASHYD (0001) | Area (ha)= 5.71 Curve Number (CN)= 72.0|ID= 1 DT= 5.0 min | Ia (mm)= 7.30 # of Linear Res.(N)= 3.00-------------------- U.H. Tp(hrs)= .40
Page 14
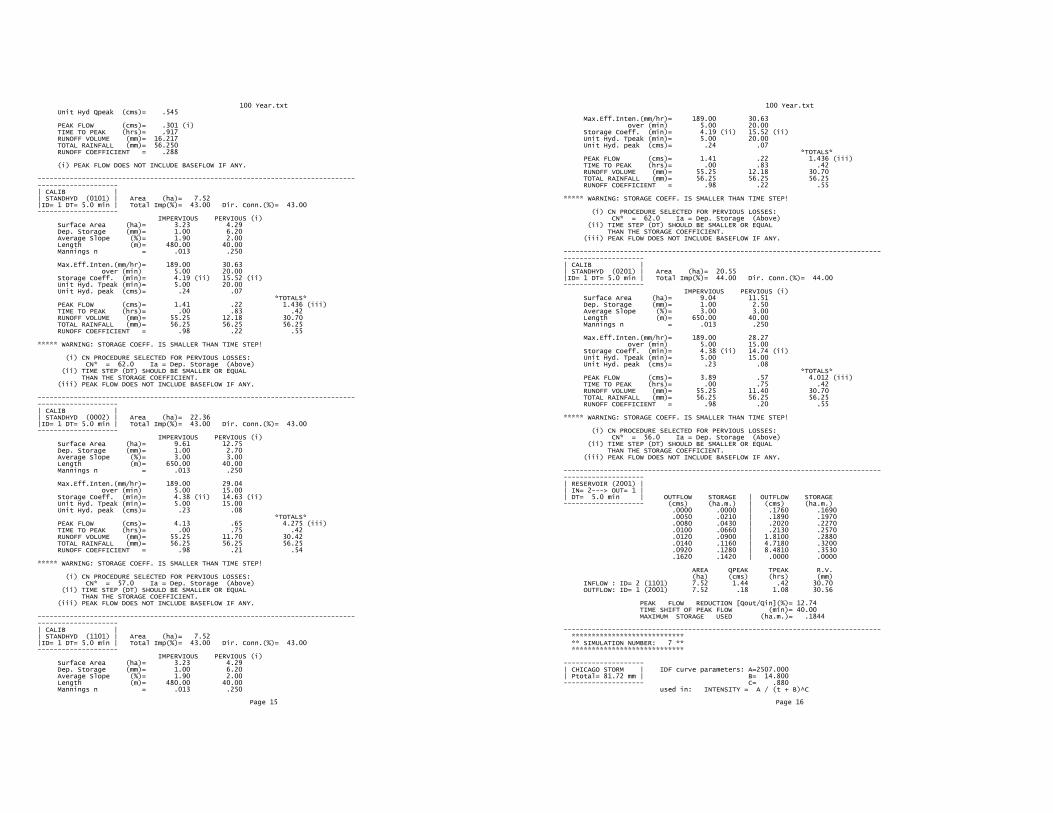
100 Year.txt Unit Hyd Qpeak (cms)= .545 PEAK FLOW (cms)= .301 (i) TIME TO PEAK (hrs)= .917 RUNOFF VOLUME (mm)= 16.217 TOTAL RAINFALL (mm)= 56.250 RUNOFF COEFFICIENT = .288 (i) PEAK FLOW DOES NOT INCLUDE BASEFLOW IF ANY. ---------------------------------------------------------------------------------------------------| CALIB || STANDHYD (0101) | Area (ha)= 7.52|ID= 1 DT= 5.0 min | Total Imp(%)= 43.00 Dir. Conn.(%)= 43.00-------------------- IMPERVIOUS PERVIOUS (i) Surface Area (ha)= 3.23 4.29 Dep. Storage (mm)= 1.00 6.20 Average Slope (%)= 1.90 2.00 Length (m)= 480.00 40.00 Mannings n = .013 .250 Max.Eff.Inten.(mm/hr)= 189.00 30.63 over (min) 5.00 20.00 Storage Coeff. (min)= 4.19 (ii) 15.52 (ii) Unit Hyd. Tpeak (min)= 5.00 20.00 Unit Hyd. peak (cms)= .24 .07 *TOTALS* PEAK FLOW (cms)= 1.41 .22 1.436 (iii) TIME TO PEAK (hrs)= .00 .83 .42 RUNOFF VOLUME (mm)= 55.25 12.18 30.70 TOTAL RAINFALL (mm)= 56.25 56.25 56.25 RUNOFF COEFFICIENT = .98 .22 .55 ***** WARNING: STORAGE COEFF. IS SMALLER THAN TIME STEP! (i) CN PROCEDURE SELECTED FOR PERVIOUS LOSSES: CN* = 62.0 Ia = Dep. Storage (Above) (ii) TIME STEP (DT) SHOULD BE SMALLER OR EQUAL THAN THE STORAGE COEFFICIENT. (iii) PEAK FLOW DOES NOT INCLUDE BASEFLOW IF ANY. ---------------------------------------------------------------------------------------------------| CALIB || STANDHYD (0002) | Area (ha)= 22.36|ID= 1 DT= 5.0 min | Total Imp(%)= 43.00 Dir. Conn.(%)= 43.00-------------------- IMPERVIOUS PERVIOUS (i) Surface Area (ha)= 9.61 12.75 Dep. Storage (mm)= 1.00 2.70 Average Slope (%)= 3.00 3.00 Length (m)= 650.00 40.00 Mannings n = .013 .250 Max.Eff.Inten.(mm/hr)= 189.00 29.04 over (min) 5.00 15.00 Storage Coeff. (min)= 4.38 (ii) 14.63 (ii) Unit Hyd. Tpeak (min)= 5.00 15.00 Unit Hyd. peak (cms)= .23 .08 *TOTALS* PEAK FLOW (cms)= 4.13 .65 4.275 (iii) TIME TO PEAK (hrs)= .00 .75 .42 RUNOFF VOLUME (mm)= 55.25 11.70 30.42 TOTAL RAINFALL (mm)= 56.25 56.25 56.25 RUNOFF COEFFICIENT = .98 .21 .54 ***** WARNING: STORAGE COEFF. IS SMALLER THAN TIME STEP! (i) CN PROCEDURE SELECTED FOR PERVIOUS LOSSES: CN* = 57.0 Ia = Dep. Storage (Above) (ii) TIME STEP (DT) SHOULD BE SMALLER OR EQUAL THAN THE STORAGE COEFFICIENT. (iii) PEAK FLOW DOES NOT INCLUDE BASEFLOW IF ANY. ---------------------------------------------------------------------------------------------------| CALIB || STANDHYD (1101) | Area (ha)= 7.52|ID= 1 DT= 5.0 min | Total Imp(%)= 43.00 Dir. Conn.(%)= 43.00-------------------- IMPERVIOUS PERVIOUS (i) Surface Area (ha)= 3.23 4.29 Dep. Storage (mm)= 1.00 6.20 Average Slope (%)= 1.90 2.00 Length (m)= 480.00 40.00 Mannings n = .013 .250
Page 15
100 Year.txt Max.Eff.Inten.(mm/hr)= 189.00 30.63 over (min) 5.00 20.00 Storage Coeff. (min)= 4.19 (ii) 15.52 (ii) Unit Hyd. Tpeak (min)= 5.00 20.00 Unit Hyd. peak (cms)= .24 .07 *TOTALS* PEAK FLOW (cms)= 1.41 .22 1.436 (iii) TIME TO PEAK (hrs)= .00 .83 .42 RUNOFF VOLUME (mm)= 55.25 12.18 30.70 TOTAL RAINFALL (mm)= 56.25 56.25 56.25 RUNOFF COEFFICIENT = .98 .22 .55 ***** WARNING: STORAGE COEFF. IS SMALLER THAN TIME STEP! (i) CN PROCEDURE SELECTED FOR PERVIOUS LOSSES: CN* = 62.0 Ia = Dep. Storage (Above) (ii) TIME STEP (DT) SHOULD BE SMALLER OR EQUAL THAN THE STORAGE COEFFICIENT. (iii) PEAK FLOW DOES NOT INCLUDE BASEFLOW IF ANY. ---------------------------------------------------------------------------------------------------| CALIB || STANDHYD (0201) | Area (ha)= 20.55|ID= 1 DT= 5.0 min | Total Imp(%)= 44.00 Dir. Conn.(%)= 44.00-------------------- IMPERVIOUS PERVIOUS (i) Surface Area (ha)= 9.04 11.51 Dep. Storage (mm)= 1.00 2.50 Average Slope (%)= 3.00 3.00 Length (m)= 650.00 40.00 Mannings n = .013 .250 Max.Eff.Inten.(mm/hr)= 189.00 28.27 over (min) 5.00 15.00 Storage Coeff. (min)= 4.38 (ii) 14.74 (ii) Unit Hyd. Tpeak (min)= 5.00 15.00 Unit Hyd. peak (cms)= .23 .08 *TOTALS* PEAK FLOW (cms)= 3.89 .57 4.012 (iii) TIME TO PEAK (hrs)= .00 .75 .42 RUNOFF VOLUME (mm)= 55.25 11.40 30.70 TOTAL RAINFALL (mm)= 56.25 56.25 56.25 RUNOFF COEFFICIENT = .98 .20 .55 ***** WARNING: STORAGE COEFF. IS SMALLER THAN TIME STEP! (i) CN PROCEDURE SELECTED FOR PERVIOUS LOSSES: CN* = 56.0 Ia = Dep. Storage (Above) (ii) TIME STEP (DT) SHOULD BE SMALLER OR EQUAL THAN THE STORAGE COEFFICIENT. (iii) PEAK FLOW DOES NOT INCLUDE BASEFLOW IF ANY. ---------------------------------------------------------------------------------------------------| RESERVOIR (2001) || IN= 2---> OUT= 1 || DT= 5.0 min | OUTFLOW STORAGE | OUTFLOW STORAGE-------------------- (cms) (ha.m.) | (cms) (ha.m.) .0000 .0000 | .1760 .1690 .0050 .0210 | .1890 .1970 .0080 .0430 | .2020 .2270 .0100 .0660 | .2130 .2570 .0120 .0900 | 1.8100 .2880 .0140 .1160 | 4.7180 .3200 .0920 .1280 | 8.4810 .3530 .1620 .1420 | .0000 .0000 AREA QPEAK TPEAK R.V. (ha) (cms) (hrs) (mm) INFLOW : ID= 2 (1101) 7.52 1.44 .42 30.70 OUTFLOW: ID= 1 (2001) 7.52 .18 1.08 30.56 PEAK FLOW REDUCTION [Qout/Qin](%)= 12.74 TIME SHIFT OF PEAK FLOW (min)= 40.00 MAXIMUM STORAGE USED (ha.m.)= .1844 ------------------------------------------------------------------------------- **************************** ** SIMULATION NUMBER: 7 ** **************************** --------------------| CHICAGO STORM | IDF curve parameters: A=2507.000| Ptotal= 81.72 mm | B= 14.800-------------------- C= .880 used in: INTENSITY = A / (t + B)^C
Page 16
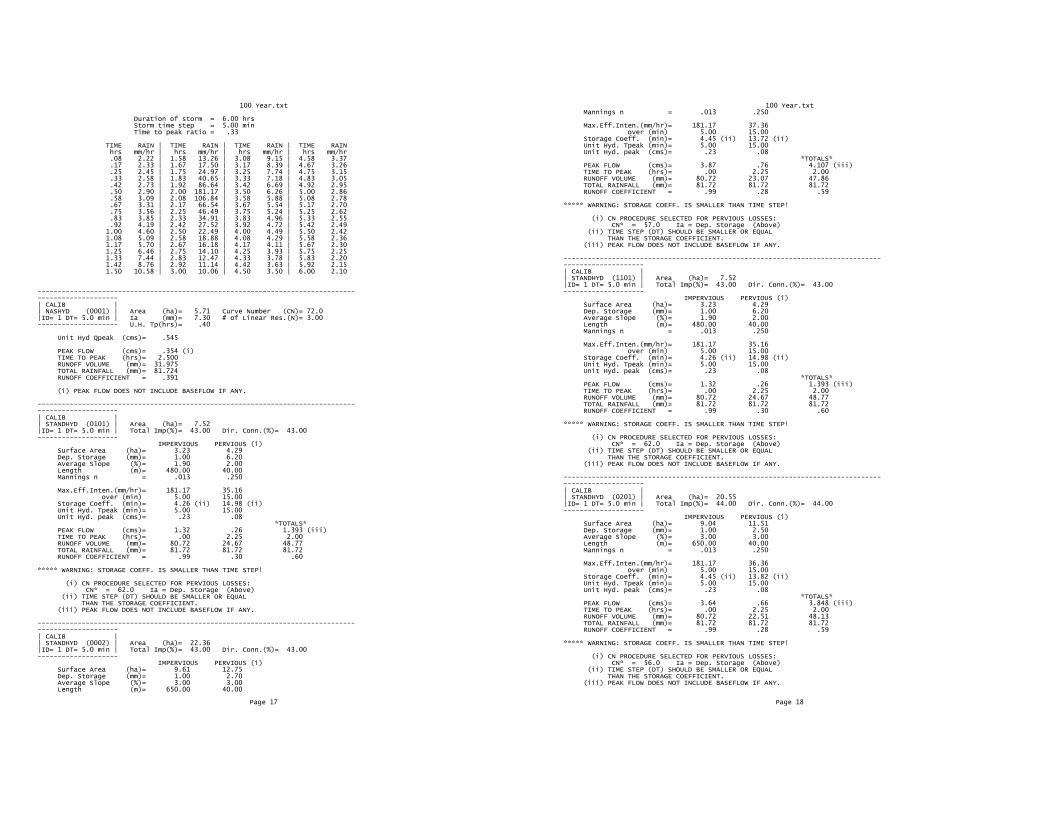
100 Year.txt
Duration of storm = 6.00 hrs Storm time step = 5.00 min Time to peak ratio = .33 TIME RAIN | TIME RAIN | TIME RAIN | TIME RAIN hrs mm/hr | hrs mm/hr | hrs mm/hr | hrs mm/hr .08 2.22 | 1.58 13.26 | 3.08 9.15 | 4.58 3.37 .17 2.33 | 1.67 17.50 | 3.17 8.39 | 4.67 3.26 .25 2.45 | 1.75 24.97 | 3.25 7.74 | 4.75 3.15 .33 2.58 | 1.83 40.65 | 3.33 7.18 | 4.83 3.05 .42 2.73 | 1.92 86.64 | 3.42 6.69 | 4.92 2.95 .50 2.90 | 2.00 181.17 | 3.50 6.26 | 5.00 2.86 .58 3.09 | 2.08 106.84 | 3.58 5.88 | 5.08 2.78 .67 3.31 | 2.17 66.54 | 3.67 5.54 | 5.17 2.70 .75 3.56 | 2.25 46.49 | 3.75 5.24 | 5.25 2.62 .83 3.85 | 2.33 34.91 | 3.83 4.96 | 5.33 2.55 .92 4.19 | 2.42 27.52 | 3.92 4.72 | 5.42 2.49 1.00 4.60 | 2.50 22.49 | 4.00 4.49 | 5.50 2.42 1.08 5.09 | 2.58 18.88 | 4.08 4.29 | 5.58 2.36 1.17 5.70 | 2.67 16.18 | 4.17 4.11 | 5.67 2.30 1.25 6.46 | 2.75 14.10 | 4.25 3.93 | 5.75 2.25 1.33 7.44 | 2.83 12.47 | 4.33 3.78 | 5.83 2.20 1.42 8.76 | 2.92 11.14 | 4.42 3.63 | 5.92 2.15 1.50 10.58 | 3.00 10.06 | 4.50 3.50 | 6.00 2.10 ---------------------------------------------------------------------------------------------------| CALIB || NASHYD (0001) | Area (ha)= 5.71 Curve Number (CN)= 72.0|ID= 1 DT= 5.0 min | Ia (mm)= 7.30 # of Linear Res.(N)= 3.00-------------------- U.H. Tp(hrs)= .40 Unit Hyd Qpeak (cms)= .545 PEAK FLOW (cms)= .354 (i) TIME TO PEAK (hrs)= 2.500 RUNOFF VOLUME (mm)= 31.975 TOTAL RAINFALL (mm)= 81.724 RUNOFF COEFFICIENT = .391 (i) PEAK FLOW DOES NOT INCLUDE BASEFLOW IF ANY. ---------------------------------------------------------------------------------------------------| CALIB || STANDHYD (0101) | Area (ha)= 7.52|ID= 1 DT= 5.0 min | Total Imp(%)= 43.00 Dir. Conn.(%)= 43.00-------------------- IMPERVIOUS PERVIOUS (i) Surface Area (ha)= 3.23 4.29 Dep. Storage (mm)= 1.00 6.20 Average Slope (%)= 1.90 2.00 Length (m)= 480.00 40.00 Mannings n = .013 .250 Max.Eff.Inten.(mm/hr)= 181.17 35.16 over (min) 5.00 15.00 Storage Coeff. (min)= 4.26 (ii) 14.98 (ii) Unit Hyd. Tpeak (min)= 5.00 15.00 Unit Hyd. peak (cms)= .23 .08 *TOTALS* PEAK FLOW (cms)= 1.32 .26 1.393 (iii) TIME TO PEAK (hrs)= .00 2.25 2.00 RUNOFF VOLUME (mm)= 80.72 24.67 48.77 TOTAL RAINFALL (mm)= 81.72 81.72 81.72 RUNOFF COEFFICIENT = .99 .30 .60 ***** WARNING: STORAGE COEFF. IS SMALLER THAN TIME STEP! (i) CN PROCEDURE SELECTED FOR PERVIOUS LOSSES: CN* = 62.0 Ia = Dep. Storage (Above) (ii) TIME STEP (DT) SHOULD BE SMALLER OR EQUAL THAN THE STORAGE COEFFICIENT. (iii) PEAK FLOW DOES NOT INCLUDE BASEFLOW IF ANY. ---------------------------------------------------------------------------------------------------| CALIB || STANDHYD (0002) | Area (ha)= 22.36|ID= 1 DT= 5.0 min | Total Imp(%)= 43.00 Dir. Conn.(%)= 43.00-------------------- IMPERVIOUS PERVIOUS (i) Surface Area (ha)= 9.61 12.75 Dep. Storage (mm)= 1.00 2.70 Average Slope (%)= 3.00 3.00 Length (m)= 650.00 40.00
Page 17
100 Year.txt Mannings n = .013 .250 Max.Eff.Inten.(mm/hr)= 181.17 37.36 over (min) 5.00 15.00 Storage Coeff. (min)= 4.45 (ii) 13.72 (ii) Unit Hyd. Tpeak (min)= 5.00 15.00 Unit Hyd. peak (cms)= .23 .08 *TOTALS* PEAK FLOW (cms)= 3.87 .76 4.107 (iii) TIME TO PEAK (hrs)= .00 2.25 2.00 RUNOFF VOLUME (mm)= 80.72 23.07 47.86 TOTAL RAINFALL (mm)= 81.72 81.72 81.72 RUNOFF COEFFICIENT = .99 .28 .59 ***** WARNING: STORAGE COEFF. IS SMALLER THAN TIME STEP! (i) CN PROCEDURE SELECTED FOR PERVIOUS LOSSES: CN* = 57.0 Ia = Dep. Storage (Above) (ii) TIME STEP (DT) SHOULD BE SMALLER OR EQUAL THAN THE STORAGE COEFFICIENT. (iii) PEAK FLOW DOES NOT INCLUDE BASEFLOW IF ANY. ---------------------------------------------------------------------------------------------------| CALIB || STANDHYD (1101) | Area (ha)= 7.52|ID= 1 DT= 5.0 min | Total Imp(%)= 43.00 Dir. Conn.(%)= 43.00-------------------- IMPERVIOUS PERVIOUS (i) Surface Area (ha)= 3.23 4.29 Dep. Storage (mm)= 1.00 6.20 Average Slope (%)= 1.90 2.00 Length (m)= 480.00 40.00 Mannings n = .013 .250 Max.Eff.Inten.(mm/hr)= 181.17 35.16 over (min) 5.00 15.00 Storage Coeff. (min)= 4.26 (ii) 14.98 (ii) Unit Hyd. Tpeak (min)= 5.00 15.00 Unit Hyd. peak (cms)= .23 .08 *TOTALS* PEAK FLOW (cms)= 1.32 .26 1.393 (iii) TIME TO PEAK (hrs)= .00 2.25 2.00 RUNOFF VOLUME (mm)= 80.72 24.67 48.77 TOTAL RAINFALL (mm)= 81.72 81.72 81.72 RUNOFF COEFFICIENT = .99 .30 .60 ***** WARNING: STORAGE COEFF. IS SMALLER THAN TIME STEP! (i) CN PROCEDURE SELECTED FOR PERVIOUS LOSSES: CN* = 62.0 Ia = Dep. Storage (Above) (ii) TIME STEP (DT) SHOULD BE SMALLER OR EQUAL THAN THE STORAGE COEFFICIENT. (iii) PEAK FLOW DOES NOT INCLUDE BASEFLOW IF ANY. ---------------------------------------------------------------------------------------------------| CALIB || STANDHYD (0201) | Area (ha)= 20.55|ID= 1 DT= 5.0 min | Total Imp(%)= 44.00 Dir. Conn.(%)= 44.00-------------------- IMPERVIOUS PERVIOUS (i) Surface Area (ha)= 9.04 11.51 Dep. Storage (mm)= 1.00 2.50 Average Slope (%)= 3.00 3.00 Length (m)= 650.00 40.00 Mannings n = .013 .250 Max.Eff.Inten.(mm/hr)= 181.17 36.36 over (min) 5.00 15.00 Storage Coeff. (min)= 4.45 (ii) 13.82 (ii) Unit Hyd. Tpeak (min)= 5.00 15.00 Unit Hyd. peak (cms)= .23 .08 *TOTALS* PEAK FLOW (cms)= 3.64 .66 3.848 (iii) TIME TO PEAK (hrs)= .00 2.25 2.00 RUNOFF VOLUME (mm)= 80.72 22.51 48.13 TOTAL RAINFALL (mm)= 81.72 81.72 81.72 RUNOFF COEFFICIENT = .99 .28 .59 ***** WARNING: STORAGE COEFF. IS SMALLER THAN TIME STEP! (i) CN PROCEDURE SELECTED FOR PERVIOUS LOSSES: CN* = 56.0 Ia = Dep. Storage (Above) (ii) TIME STEP (DT) SHOULD BE SMALLER OR EQUAL THAN THE STORAGE COEFFICIENT. (iii) PEAK FLOW DOES NOT INCLUDE BASEFLOW IF ANY.
Page 18
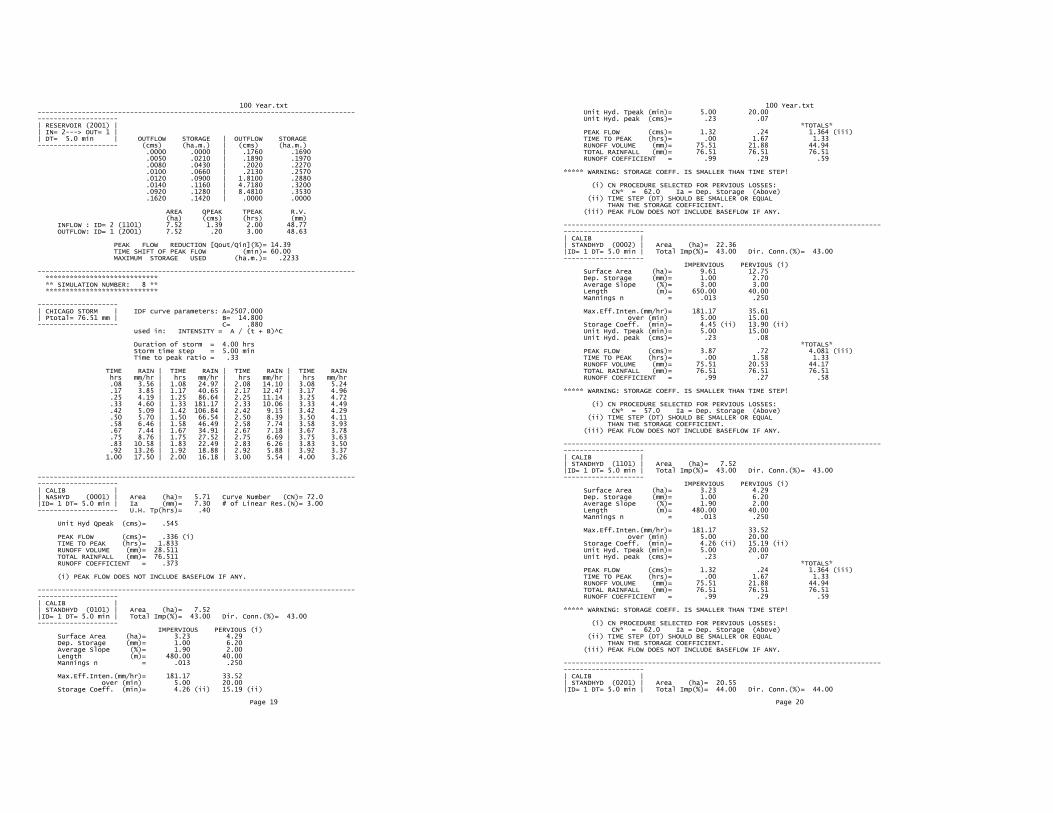
100 Year.txt---------------------------------------------------------------------------------------------------| RESERVOIR (2001) || IN= 2---> OUT= 1 || DT= 5.0 min | OUTFLOW STORAGE | OUTFLOW STORAGE-------------------- (cms) (ha.m.) | (cms) (ha.m.) .0000 .0000 | .1760 .1690 .0050 .0210 | .1890 .1970 .0080 .0430 | .2020 .2270 .0100 .0660 | .2130 .2570 .0120 .0900 | 1.8100 .2880 .0140 .1160 | 4.7180 .3200 .0920 .1280 | 8.4810 .3530 .1620 .1420 | .0000 .0000 AREA QPEAK TPEAK R.V. (ha) (cms) (hrs) (mm) INFLOW : ID= 2 (1101) 7.52 1.39 2.00 48.77 OUTFLOW: ID= 1 (2001) 7.52 .20 3.00 48.63 PEAK FLOW REDUCTION [Qout/Qin](%)= 14.39 TIME SHIFT OF PEAK FLOW (min)= 60.00 MAXIMUM STORAGE USED (ha.m.)= .2233 ------------------------------------------------------------------------------- **************************** ** SIMULATION NUMBER: 8 ** **************************** --------------------| CHICAGO STORM | IDF curve parameters: A=2507.000| Ptotal= 76.51 mm | B= 14.800-------------------- C= .880 used in: INTENSITY = A / (t + B)^C
Duration of storm = 4.00 hrs Storm time step = 5.00 min Time to peak ratio = .33 TIME RAIN | TIME RAIN | TIME RAIN | TIME RAIN hrs mm/hr | hrs mm/hr | hrs mm/hr | hrs mm/hr .08 3.56 | 1.08 24.97 | 2.08 14.10 | 3.08 5.24 .17 3.85 | 1.17 40.65 | 2.17 12.47 | 3.17 4.96 .25 4.19 | 1.25 86.64 | 2.25 11.14 | 3.25 4.72 .33 4.60 | 1.33 181.17 | 2.33 10.06 | 3.33 4.49 .42 5.09 | 1.42 106.84 | 2.42 9.15 | 3.42 4.29 .50 5.70 | 1.50 66.54 | 2.50 8.39 | 3.50 4.11 .58 6.46 | 1.58 46.49 | 2.58 7.74 | 3.58 3.93 .67 7.44 | 1.67 34.91 | 2.67 7.18 | 3.67 3.78 .75 8.76 | 1.75 27.52 | 2.75 6.69 | 3.75 3.63 .83 10.58 | 1.83 22.49 | 2.83 6.26 | 3.83 3.50 .92 13.26 | 1.92 18.88 | 2.92 5.88 | 3.92 3.37 1.00 17.50 | 2.00 16.18 | 3.00 5.54 | 4.00 3.26 ---------------------------------------------------------------------------------------------------| CALIB || NASHYD (0001) | Area (ha)= 5.71 Curve Number (CN)= 72.0|ID= 1 DT= 5.0 min | Ia (mm)= 7.30 # of Linear Res.(N)= 3.00-------------------- U.H. Tp(hrs)= .40 Unit Hyd Qpeak (cms)= .545 PEAK FLOW (cms)= .336 (i) TIME TO PEAK (hrs)= 1.833 RUNOFF VOLUME (mm)= 28.511 TOTAL RAINFALL (mm)= 76.511 RUNOFF COEFFICIENT = .373 (i) PEAK FLOW DOES NOT INCLUDE BASEFLOW IF ANY. ---------------------------------------------------------------------------------------------------| CALIB || STANDHYD (0101) | Area (ha)= 7.52|ID= 1 DT= 5.0 min | Total Imp(%)= 43.00 Dir. Conn.(%)= 43.00-------------------- IMPERVIOUS PERVIOUS (i) Surface Area (ha)= 3.23 4.29 Dep. Storage (mm)= 1.00 6.20 Average Slope (%)= 1.90 2.00 Length (m)= 480.00 40.00 Mannings n = .013 .250 Max.Eff.Inten.(mm/hr)= 181.17 33.52 over (min) 5.00 20.00 Storage Coeff. (min)= 4.26 (ii) 15.19 (ii)
Page 19
100 Year.txt Unit Hyd. Tpeak (min)= 5.00 20.00 Unit Hyd. peak (cms)= .23 .07 *TOTALS* PEAK FLOW (cms)= 1.32 .24 1.364 (iii) TIME TO PEAK (hrs)= .00 1.67 1.33 RUNOFF VOLUME (mm)= 75.51 21.88 44.94 TOTAL RAINFALL (mm)= 76.51 76.51 76.51 RUNOFF COEFFICIENT = .99 .29 .59 ***** WARNING: STORAGE COEFF. IS SMALLER THAN TIME STEP! (i) CN PROCEDURE SELECTED FOR PERVIOUS LOSSES: CN* = 62.0 Ia = Dep. Storage (Above) (ii) TIME STEP (DT) SHOULD BE SMALLER OR EQUAL THAN THE STORAGE COEFFICIENT. (iii) PEAK FLOW DOES NOT INCLUDE BASEFLOW IF ANY. ---------------------------------------------------------------------------------------------------| CALIB || STANDHYD (0002) | Area (ha)= 22.36|ID= 1 DT= 5.0 min | Total Imp(%)= 43.00 Dir. Conn.(%)= 43.00-------------------- IMPERVIOUS PERVIOUS (i) Surface Area (ha)= 9.61 12.75 Dep. Storage (mm)= 1.00 2.70 Average Slope (%)= 3.00 3.00 Length (m)= 650.00 40.00 Mannings n = .013 .250 Max.Eff.Inten.(mm/hr)= 181.17 35.61 over (min) 5.00 15.00 Storage Coeff. (min)= 4.45 (ii) 13.90 (ii) Unit Hyd. Tpeak (min)= 5.00 15.00 Unit Hyd. peak (cms)= .23 .08 *TOTALS* PEAK FLOW (cms)= 3.87 .72 4.081 (iii) TIME TO PEAK (hrs)= .00 1.58 1.33 RUNOFF VOLUME (mm)= 75.51 20.53 44.17 TOTAL RAINFALL (mm)= 76.51 76.51 76.51 RUNOFF COEFFICIENT = .99 .27 .58 ***** WARNING: STORAGE COEFF. IS SMALLER THAN TIME STEP! (i) CN PROCEDURE SELECTED FOR PERVIOUS LOSSES: CN* = 57.0 Ia = Dep. Storage (Above) (ii) TIME STEP (DT) SHOULD BE SMALLER OR EQUAL THAN THE STORAGE COEFFICIENT. (iii) PEAK FLOW DOES NOT INCLUDE BASEFLOW IF ANY. ---------------------------------------------------------------------------------------------------| CALIB || STANDHYD (1101) | Area (ha)= 7.52|ID= 1 DT= 5.0 min | Total Imp(%)= 43.00 Dir. Conn.(%)= 43.00-------------------- IMPERVIOUS PERVIOUS (i) Surface Area (ha)= 3.23 4.29 Dep. Storage (mm)= 1.00 6.20 Average Slope (%)= 1.90 2.00 Length (m)= 480.00 40.00 Mannings n = .013 .250 Max.Eff.Inten.(mm/hr)= 181.17 33.52 over (min) 5.00 20.00 Storage Coeff. (min)= 4.26 (ii) 15.19 (ii) Unit Hyd. Tpeak (min)= 5.00 20.00 Unit Hyd. peak (cms)= .23 .07 *TOTALS* PEAK FLOW (cms)= 1.32 .24 1.364 (iii) TIME TO PEAK (hrs)= .00 1.67 1.33 RUNOFF VOLUME (mm)= 75.51 21.88 44.94 TOTAL RAINFALL (mm)= 76.51 76.51 76.51 RUNOFF COEFFICIENT = .99 .29 .59 ***** WARNING: STORAGE COEFF. IS SMALLER THAN TIME STEP! (i) CN PROCEDURE SELECTED FOR PERVIOUS LOSSES: CN* = 62.0 Ia = Dep. Storage (Above) (ii) TIME STEP (DT) SHOULD BE SMALLER OR EQUAL THAN THE STORAGE COEFFICIENT. (iii) PEAK FLOW DOES NOT INCLUDE BASEFLOW IF ANY. ---------------------------------------------------------------------------------------------------| CALIB || STANDHYD (0201) | Area (ha)= 20.55|ID= 1 DT= 5.0 min | Total Imp(%)= 44.00 Dir. Conn.(%)= 44.00
Page 20
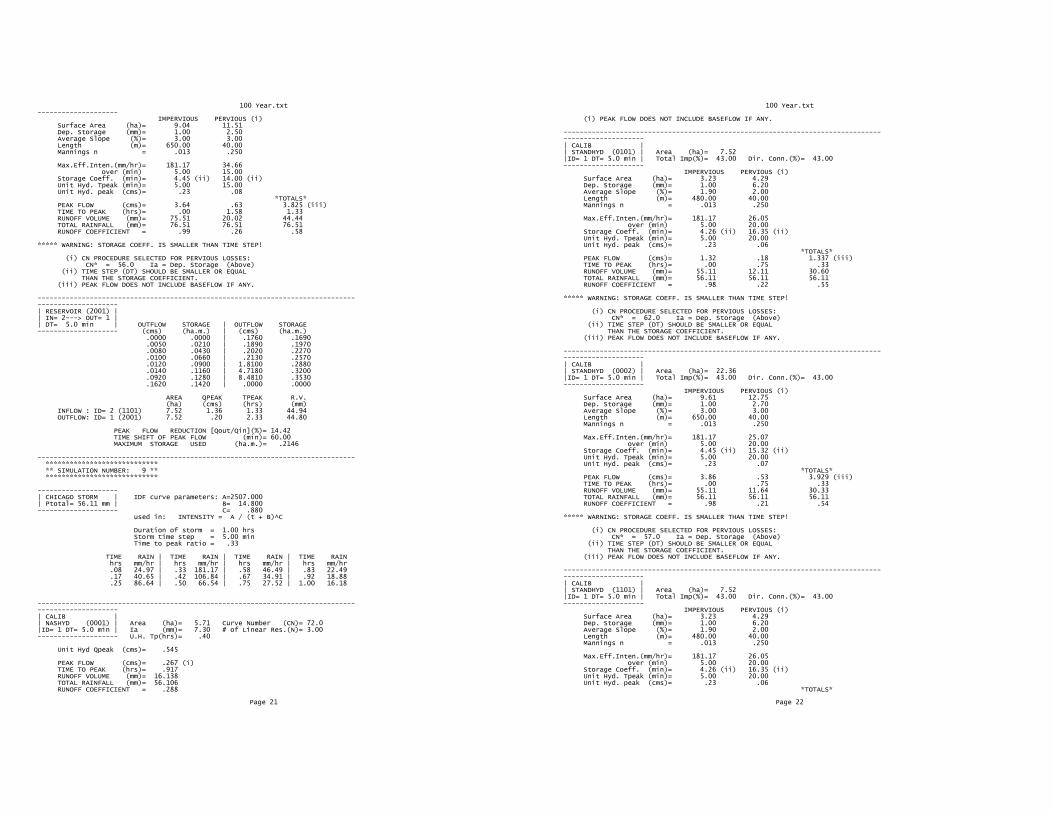
100 Year.txt-------------------- IMPERVIOUS PERVIOUS (i) Surface Area (ha)= 9.04 11.51 Dep. Storage (mm)= 1.00 2.50 Average Slope (%)= 3.00 3.00 Length (m)= 650.00 40.00 Mannings n = .013 .250 Max.Eff.Inten.(mm/hr)= 181.17 34.66 over (min) 5.00 15.00 Storage Coeff. (min)= 4.45 (ii) 14.00 (ii) Unit Hyd. Tpeak (min)= 5.00 15.00 Unit Hyd. peak (cms)= .23 .08 *TOTALS* PEAK FLOW (cms)= 3.64 .63 3.825 (iii) TIME TO PEAK (hrs)= .00 1.58 1.33 RUNOFF VOLUME (mm)= 75.51 20.02 44.44 TOTAL RAINFALL (mm)= 76.51 76.51 76.51 RUNOFF COEFFICIENT = .99 .26 .58 ***** WARNING: STORAGE COEFF. IS SMALLER THAN TIME STEP! (i) CN PROCEDURE SELECTED FOR PERVIOUS LOSSES: CN* = 56.0 Ia = Dep. Storage (Above) (ii) TIME STEP (DT) SHOULD BE SMALLER OR EQUAL THAN THE STORAGE COEFFICIENT. (iii) PEAK FLOW DOES NOT INCLUDE BASEFLOW IF ANY. ---------------------------------------------------------------------------------------------------| RESERVOIR (2001) || IN= 2---> OUT= 1 || DT= 5.0 min | OUTFLOW STORAGE | OUTFLOW STORAGE-------------------- (cms) (ha.m.) | (cms) (ha.m.) .0000 .0000 | .1760 .1690 .0050 .0210 | .1890 .1970 .0080 .0430 | .2020 .2270 .0100 .0660 | .2130 .2570 .0120 .0900 | 1.8100 .2880 .0140 .1160 | 4.7180 .3200 .0920 .1280 | 8.4810 .3530 .1620 .1420 | .0000 .0000 AREA QPEAK TPEAK R.V. (ha) (cms) (hrs) (mm) INFLOW : ID= 2 (1101) 7.52 1.36 1.33 44.94 OUTFLOW: ID= 1 (2001) 7.52 .20 2.33 44.80 PEAK FLOW REDUCTION [Qout/Qin](%)= 14.42 TIME SHIFT OF PEAK FLOW (min)= 60.00 MAXIMUM STORAGE USED (ha.m.)= .2146 ------------------------------------------------------------------------------- **************************** ** SIMULATION NUMBER: 9 ** **************************** --------------------| CHICAGO STORM | IDF curve parameters: A=2507.000| Ptotal= 56.11 mm | B= 14.800-------------------- C= .880 used in: INTENSITY = A / (t + B)^C
Duration of storm = 1.00 hrs Storm time step = 5.00 min Time to peak ratio = .33 TIME RAIN | TIME RAIN | TIME RAIN | TIME RAIN hrs mm/hr | hrs mm/hr | hrs mm/hr | hrs mm/hr .08 24.97 | .33 181.17 | .58 46.49 | .83 22.49 .17 40.65 | .42 106.84 | .67 34.91 | .92 18.88 .25 86.64 | .50 66.54 | .75 27.52 | 1.00 16.18 ---------------------------------------------------------------------------------------------------| CALIB || NASHYD (0001) | Area (ha)= 5.71 Curve Number (CN)= 72.0|ID= 1 DT= 5.0 min | Ia (mm)= 7.30 # of Linear Res.(N)= 3.00-------------------- U.H. Tp(hrs)= .40 Unit Hyd Qpeak (cms)= .545 PEAK FLOW (cms)= .267 (i) TIME TO PEAK (hrs)= .917 RUNOFF VOLUME (mm)= 16.138 TOTAL RAINFALL (mm)= 56.106 RUNOFF COEFFICIENT = .288
Page 21
100 Year.txt (i) PEAK FLOW DOES NOT INCLUDE BASEFLOW IF ANY. ---------------------------------------------------------------------------------------------------| CALIB || STANDHYD (0101) | Area (ha)= 7.52|ID= 1 DT= 5.0 min | Total Imp(%)= 43.00 Dir. Conn.(%)= 43.00-------------------- IMPERVIOUS PERVIOUS (i) Surface Area (ha)= 3.23 4.29 Dep. Storage (mm)= 1.00 6.20 Average Slope (%)= 1.90 2.00 Length (m)= 480.00 40.00 Mannings n = .013 .250 Max.Eff.Inten.(mm/hr)= 181.17 26.05 over (min) 5.00 20.00 Storage Coeff. (min)= 4.26 (ii) 16.35 (ii) Unit Hyd. Tpeak (min)= 5.00 20.00 Unit Hyd. peak (cms)= .23 .06 *TOTALS* PEAK FLOW (cms)= 1.32 .18 1.337 (iii) TIME TO PEAK (hrs)= .00 .75 .33 RUNOFF VOLUME (mm)= 55.11 12.11 30.60 TOTAL RAINFALL (mm)= 56.11 56.11 56.11 RUNOFF COEFFICIENT = .98 .22 .55 ***** WARNING: STORAGE COEFF. IS SMALLER THAN TIME STEP! (i) CN PROCEDURE SELECTED FOR PERVIOUS LOSSES: CN* = 62.0 Ia = Dep. Storage (Above) (ii) TIME STEP (DT) SHOULD BE SMALLER OR EQUAL THAN THE STORAGE COEFFICIENT. (iii) PEAK FLOW DOES NOT INCLUDE BASEFLOW IF ANY. ---------------------------------------------------------------------------------------------------| CALIB || STANDHYD (0002) | Area (ha)= 22.36|ID= 1 DT= 5.0 min | Total Imp(%)= 43.00 Dir. Conn.(%)= 43.00-------------------- IMPERVIOUS PERVIOUS (i) Surface Area (ha)= 9.61 12.75 Dep. Storage (mm)= 1.00 2.70 Average Slope (%)= 3.00 3.00 Length (m)= 650.00 40.00 Mannings n = .013 .250 Max.Eff.Inten.(mm/hr)= 181.17 25.07 over (min) 5.00 20.00 Storage Coeff. (min)= 4.45 (ii) 15.32 (ii) Unit Hyd. Tpeak (min)= 5.00 20.00 Unit Hyd. peak (cms)= .23 .07 *TOTALS* PEAK FLOW (cms)= 3.86 .53 3.929 (iii) TIME TO PEAK (hrs)= .00 .75 .33 RUNOFF VOLUME (mm)= 55.11 11.64 30.33 TOTAL RAINFALL (mm)= 56.11 56.11 56.11 RUNOFF COEFFICIENT = .98 .21 .54 ***** WARNING: STORAGE COEFF. IS SMALLER THAN TIME STEP! (i) CN PROCEDURE SELECTED FOR PERVIOUS LOSSES: CN* = 57.0 Ia = Dep. Storage (Above) (ii) TIME STEP (DT) SHOULD BE SMALLER OR EQUAL THAN THE STORAGE COEFFICIENT. (iii) PEAK FLOW DOES NOT INCLUDE BASEFLOW IF ANY. ---------------------------------------------------------------------------------------------------| CALIB || STANDHYD (1101) | Area (ha)= 7.52|ID= 1 DT= 5.0 min | Total Imp(%)= 43.00 Dir. Conn.(%)= 43.00-------------------- IMPERVIOUS PERVIOUS (i) Surface Area (ha)= 3.23 4.29 Dep. Storage (mm)= 1.00 6.20 Average Slope (%)= 1.90 2.00 Length (m)= 480.00 40.00 Mannings n = .013 .250 Max.Eff.Inten.(mm/hr)= 181.17 26.05 over (min) 5.00 20.00 Storage Coeff. (min)= 4.26 (ii) 16.35 (ii) Unit Hyd. Tpeak (min)= 5.00 20.00 Unit Hyd. peak (cms)= .23 .06 *TOTALS*
Page 22
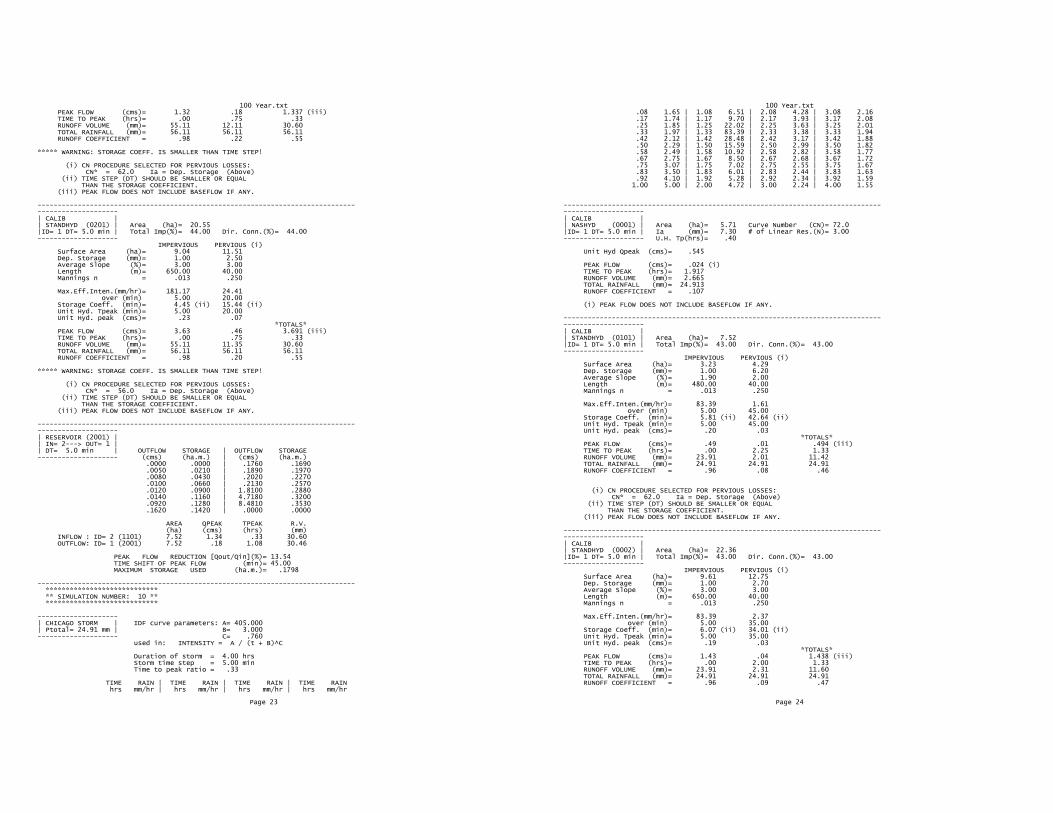
100 Year.txt PEAK FLOW (cms)= 1.32 .18 1.337 (iii) TIME TO PEAK (hrs)= .00 .75 .33 RUNOFF VOLUME (mm)= 55.11 12.11 30.60 TOTAL RAINFALL (mm)= 56.11 56.11 56.11 RUNOFF COEFFICIENT = .98 .22 .55 ***** WARNING: STORAGE COEFF. IS SMALLER THAN TIME STEP! (i) CN PROCEDURE SELECTED FOR PERVIOUS LOSSES: CN* = 62.0 Ia = Dep. Storage (Above) (ii) TIME STEP (DT) SHOULD BE SMALLER OR EQUAL THAN THE STORAGE COEFFICIENT. (iii) PEAK FLOW DOES NOT INCLUDE BASEFLOW IF ANY. ---------------------------------------------------------------------------------------------------| CALIB || STANDHYD (0201) | Area (ha)= 20.55|ID= 1 DT= 5.0 min | Total Imp(%)= 44.00 Dir. Conn.(%)= 44.00-------------------- IMPERVIOUS PERVIOUS (i) Surface Area (ha)= 9.04 11.51 Dep. Storage (mm)= 1.00 2.50 Average Slope (%)= 3.00 3.00 Length (m)= 650.00 40.00 Mannings n = .013 .250 Max.Eff.Inten.(mm/hr)= 181.17 24.41 over (min) 5.00 20.00 Storage Coeff. (min)= 4.45 (ii) 15.44 (ii) Unit Hyd. Tpeak (min)= 5.00 20.00 Unit Hyd. peak (cms)= .23 .07 *TOTALS* PEAK FLOW (cms)= 3.63 .46 3.691 (iii) TIME TO PEAK (hrs)= .00 .75 .33 RUNOFF VOLUME (mm)= 55.11 11.35 30.60 TOTAL RAINFALL (mm)= 56.11 56.11 56.11 RUNOFF COEFFICIENT = .98 .20 .55 ***** WARNING: STORAGE COEFF. IS SMALLER THAN TIME STEP! (i) CN PROCEDURE SELECTED FOR PERVIOUS LOSSES: CN* = 56.0 Ia = Dep. Storage (Above) (ii) TIME STEP (DT) SHOULD BE SMALLER OR EQUAL THAN THE STORAGE COEFFICIENT. (iii) PEAK FLOW DOES NOT INCLUDE BASEFLOW IF ANY. ---------------------------------------------------------------------------------------------------| RESERVOIR (2001) || IN= 2---> OUT= 1 || DT= 5.0 min | OUTFLOW STORAGE | OUTFLOW STORAGE-------------------- (cms) (ha.m.) | (cms) (ha.m.) .0000 .0000 | .1760 .1690 .0050 .0210 | .1890 .1970 .0080 .0430 | .2020 .2270 .0100 .0660 | .2130 .2570 .0120 .0900 | 1.8100 .2880 .0140 .1160 | 4.7180 .3200 .0920 .1280 | 8.4810 .3530 .1620 .1420 | .0000 .0000 AREA QPEAK TPEAK R.V. (ha) (cms) (hrs) (mm) INFLOW : ID= 2 (1101) 7.52 1.34 .33 30.60 OUTFLOW: ID= 1 (2001) 7.52 .18 1.08 30.46 PEAK FLOW REDUCTION [Qout/Qin](%)= 13.54 TIME SHIFT OF PEAK FLOW (min)= 45.00 MAXIMUM STORAGE USED (ha.m.)= .1798 ------------------------------------------------------------------------------- **************************** ** SIMULATION NUMBER: 10 ** **************************** --------------------| CHICAGO STORM | IDF curve parameters: A= 405.000| Ptotal= 24.91 mm | B= 3.000-------------------- C= .760 used in: INTENSITY = A / (t + B)^C
Duration of storm = 4.00 hrs Storm time step = 5.00 min Time to peak ratio = .33 TIME RAIN | TIME RAIN | TIME RAIN | TIME RAIN hrs mm/hr | hrs mm/hr | hrs mm/hr | hrs mm/hr
Page 23
100 Year.txt .08 1.65 | 1.08 6.51 | 2.08 4.28 | 3.08 2.16 .17 1.74 | 1.17 9.70 | 2.17 3.93 | 3.17 2.08 .25 1.85 | 1.25 22.02 | 2.25 3.63 | 3.25 2.01 .33 1.97 | 1.33 83.39 | 2.33 3.38 | 3.33 1.94 .42 2.12 | 1.42 28.48 | 2.42 3.17 | 3.42 1.88 .50 2.29 | 1.50 15.59 | 2.50 2.99 | 3.50 1.82 .58 2.49 | 1.58 10.92 | 2.58 2.82 | 3.58 1.77 .67 2.75 | 1.67 8.50 | 2.67 2.68 | 3.67 1.72 .75 3.07 | 1.75 7.02 | 2.75 2.55 | 3.75 1.67 .83 3.50 | 1.83 6.01 | 2.83 2.44 | 3.83 1.63 .92 4.10 | 1.92 5.28 | 2.92 2.34 | 3.92 1.59 1.00 5.00 | 2.00 4.72 | 3.00 2.24 | 4.00 1.55 ---------------------------------------------------------------------------------------------------| CALIB || NASHYD (0001) | Area (ha)= 5.71 Curve Number (CN)= 72.0|ID= 1 DT= 5.0 min | Ia (mm)= 7.30 # of Linear Res.(N)= 3.00-------------------- U.H. Tp(hrs)= .40 Unit Hyd Qpeak (cms)= .545 PEAK FLOW (cms)= .024 (i) TIME TO PEAK (hrs)= 1.917 RUNOFF VOLUME (mm)= 2.665 TOTAL RAINFALL (mm)= 24.913 RUNOFF COEFFICIENT = .107 (i) PEAK FLOW DOES NOT INCLUDE BASEFLOW IF ANY. ---------------------------------------------------------------------------------------------------| CALIB || STANDHYD (0101) | Area (ha)= 7.52|ID= 1 DT= 5.0 min | Total Imp(%)= 43.00 Dir. Conn.(%)= 43.00-------------------- IMPERVIOUS PERVIOUS (i) Surface Area (ha)= 3.23 4.29 Dep. Storage (mm)= 1.00 6.20 Average Slope (%)= 1.90 2.00 Length (m)= 480.00 40.00 Mannings n = .013 .250 Max.Eff.Inten.(mm/hr)= 83.39 1.61 over (min) 5.00 45.00 Storage Coeff. (min)= 5.81 (ii) 42.64 (ii) Unit Hyd. Tpeak (min)= 5.00 45.00 Unit Hyd. peak (cms)= .20 .03 *TOTALS* PEAK FLOW (cms)= .49 .01 .494 (iii) TIME TO PEAK (hrs)= .00 2.25 1.33 RUNOFF VOLUME (mm)= 23.91 2.01 11.42 TOTAL RAINFALL (mm)= 24.91 24.91 24.91 RUNOFF COEFFICIENT = .96 .08 .46 (i) CN PROCEDURE SELECTED FOR PERVIOUS LOSSES: CN* = 62.0 Ia = Dep. Storage (Above) (ii) TIME STEP (DT) SHOULD BE SMALLER OR EQUAL THAN THE STORAGE COEFFICIENT. (iii) PEAK FLOW DOES NOT INCLUDE BASEFLOW IF ANY. ---------------------------------------------------------------------------------------------------| CALIB || STANDHYD (0002) | Area (ha)= 22.36|ID= 1 DT= 5.0 min | Total Imp(%)= 43.00 Dir. Conn.(%)= 43.00-------------------- IMPERVIOUS PERVIOUS (i) Surface Area (ha)= 9.61 12.75 Dep. Storage (mm)= 1.00 2.70 Average Slope (%)= 3.00 3.00 Length (m)= 650.00 40.00 Mannings n = .013 .250 Max.Eff.Inten.(mm/hr)= 83.39 2.37 over (min) 5.00 35.00 Storage Coeff. (min)= 6.07 (ii) 34.01 (ii) Unit Hyd. Tpeak (min)= 5.00 35.00 Unit Hyd. peak (cms)= .19 .03 *TOTALS* PEAK FLOW (cms)= 1.43 .04 1.438 (iii) TIME TO PEAK (hrs)= .00 2.00 1.33 RUNOFF VOLUME (mm)= 23.91 2.31 11.60 TOTAL RAINFALL (mm)= 24.91 24.91 24.91 RUNOFF COEFFICIENT = .96 .09 .47
Page 24
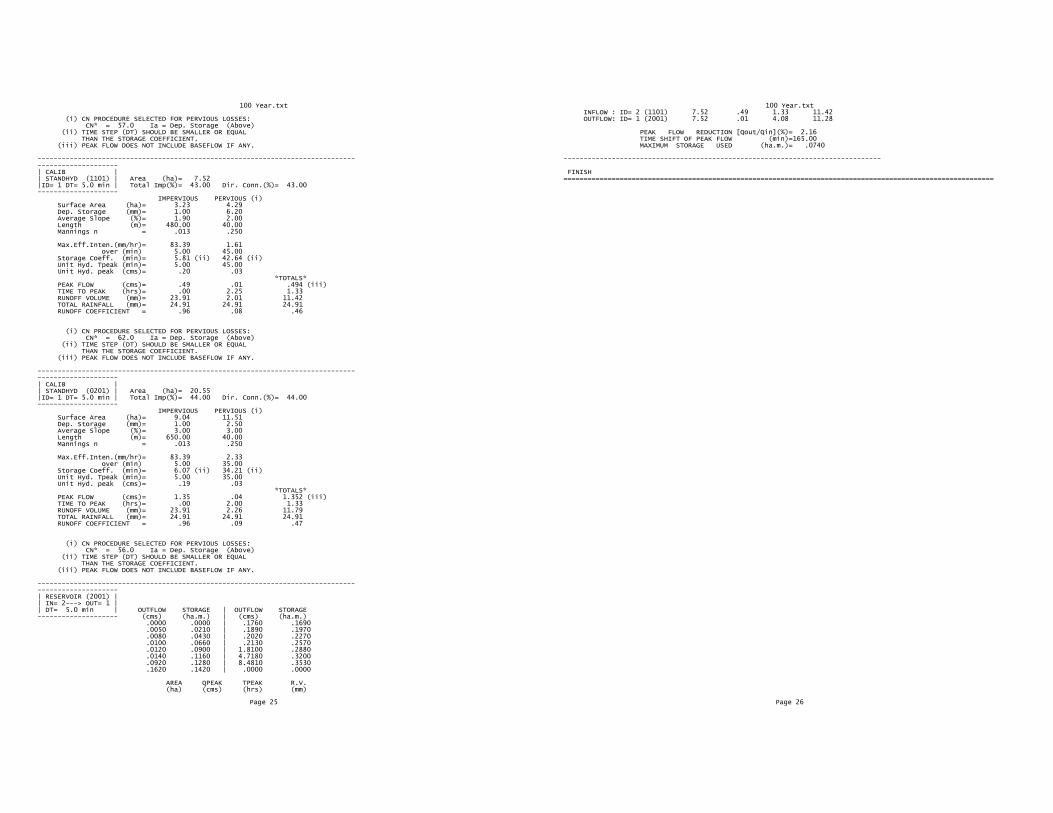
100 Year.txt (i) CN PROCEDURE SELECTED FOR PERVIOUS LOSSES: CN* = 57.0 Ia = Dep. Storage (Above) (ii) TIME STEP (DT) SHOULD BE SMALLER OR EQUAL THAN THE STORAGE COEFFICIENT. (iii) PEAK FLOW DOES NOT INCLUDE BASEFLOW IF ANY. ---------------------------------------------------------------------------------------------------| CALIB || STANDHYD (1101) | Area (ha)= 7.52|ID= 1 DT= 5.0 min | Total Imp(%)= 43.00 Dir. Conn.(%)= 43.00-------------------- IMPERVIOUS PERVIOUS (i) Surface Area (ha)= 3.23 4.29 Dep. Storage (mm)= 1.00 6.20 Average Slope (%)= 1.90 2.00 Length (m)= 480.00 40.00 Mannings n = .013 .250 Max.Eff.Inten.(mm/hr)= 83.39 1.61 over (min) 5.00 45.00 Storage Coeff. (min)= 5.81 (ii) 42.64 (ii) Unit Hyd. Tpeak (min)= 5.00 45.00 Unit Hyd. peak (cms)= .20 .03 *TOTALS* PEAK FLOW (cms)= .49 .01 .494 (iii) TIME TO PEAK (hrs)= .00 2.25 1.33 RUNOFF VOLUME (mm)= 23.91 2.01 11.42 TOTAL RAINFALL (mm)= 24.91 24.91 24.91 RUNOFF COEFFICIENT = .96 .08 .46 (i) CN PROCEDURE SELECTED FOR PERVIOUS LOSSES: CN* = 62.0 Ia = Dep. Storage (Above) (ii) TIME STEP (DT) SHOULD BE SMALLER OR EQUAL THAN THE STORAGE COEFFICIENT. (iii) PEAK FLOW DOES NOT INCLUDE BASEFLOW IF ANY. ---------------------------------------------------------------------------------------------------| CALIB || STANDHYD (0201) | Area (ha)= 20.55|ID= 1 DT= 5.0 min | Total Imp(%)= 44.00 Dir. Conn.(%)= 44.00-------------------- IMPERVIOUS PERVIOUS (i) Surface Area (ha)= 9.04 11.51 Dep. Storage (mm)= 1.00 2.50 Average Slope (%)= 3.00 3.00 Length (m)= 650.00 40.00 Mannings n = .013 .250 Max.Eff.Inten.(mm/hr)= 83.39 2.33 over (min) 5.00 35.00 Storage Coeff. (min)= 6.07 (ii) 34.21 (ii) Unit Hyd. Tpeak (min)= 5.00 35.00 Unit Hyd. peak (cms)= .19 .03 *TOTALS* PEAK FLOW (cms)= 1.35 .04 1.352 (iii) TIME TO PEAK (hrs)= .00 2.00 1.33 RUNOFF VOLUME (mm)= 23.91 2.26 11.79 TOTAL RAINFALL (mm)= 24.91 24.91 24.91 RUNOFF COEFFICIENT = .96 .09 .47 (i) CN PROCEDURE SELECTED FOR PERVIOUS LOSSES: CN* = 56.0 Ia = Dep. Storage (Above) (ii) TIME STEP (DT) SHOULD BE SMALLER OR EQUAL THAN THE STORAGE COEFFICIENT. (iii) PEAK FLOW DOES NOT INCLUDE BASEFLOW IF ANY. ---------------------------------------------------------------------------------------------------| RESERVOIR (2001) || IN= 2---> OUT= 1 || DT= 5.0 min | OUTFLOW STORAGE | OUTFLOW STORAGE-------------------- (cms) (ha.m.) | (cms) (ha.m.) .0000 .0000 | .1760 .1690 .0050 .0210 | .1890 .1970 .0080 .0430 | .2020 .2270 .0100 .0660 | .2130 .2570 .0120 .0900 | 1.8100 .2880 .0140 .1160 | 4.7180 .3200 .0920 .1280 | 8.4810 .3530 .1620 .1420 | .0000 .0000 AREA QPEAK TPEAK R.V. (ha) (cms) (hrs) (mm)
Page 25
100 Year.txt INFLOW : ID= 2 (1101) 7.52 .49 1.33 11.42 OUTFLOW: ID= 1 (2001) 7.52 .01 4.08 11.28 PEAK FLOW REDUCTION [Qout/Qin](%)= 2.16 TIME SHIFT OF PEAK FLOW (min)=165.00 MAXIMUM STORAGE USED (ha.m.)= .0740 ------------------------------------------------------------------------------- FINISH===========================================================================================================
Page 26
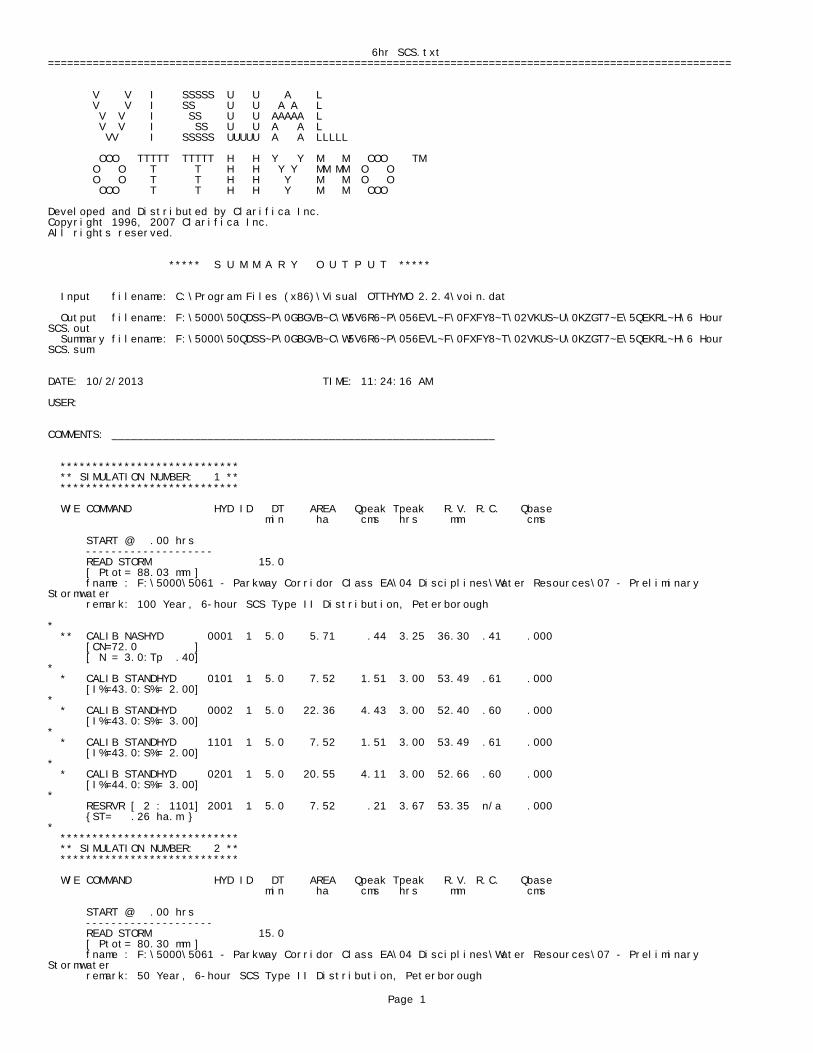
6hr SCS.txt===========================================================================================================
V V I SSSSS U U A L V V I SS U U A A L V V I SS U U AAAAA L V V I SS U U A A L VV I SSSSS UUUUU A A LLLLL OOO TTTTT TTTTT H H Y Y M M OOO TM O O T T H H Y Y MM MM O O O O T T H H Y M M O O OOO T T H H Y M M OOO
Developed and Distributed by Clarifica Inc. Copyright 1996, 2007 Clarifica Inc.All rights reserved. ***** S U M M A R Y O U T P U T *****
Input filename: C:\Program Files (x86)\Visual OTTHYMO 2.2.4\voin.dat Output filename: F:\5000\50QDSS~P\0GBGVB~C\W5V6R6~P\056EVL~F\0FXFY8~T\02VKUS~U\0KZGT7~E\5QEKRL~H\6 Hour SCS.out Summary filename: F:\5000\50QDSS~P\0GBGVB~C\W5V6R6~P\056EVL~F\0FXFY8~T\02VKUS~U\0KZGT7~E\5QEKRL~H\6 Hour SCS.sum
DATE: 10/2/2013 TIME: 11:24:16 AM
USER:
COMMENTS: ____________________________________________________________
**************************** ** SIMULATION NUMBER: 1 ** **************************** W/E COMMAND HYD ID DT AREA Qpeak Tpeak R.V. R.C. Qbase min ha cms hrs mm cms
START @ .00 hrs -------------------- READ STORM 15.0 [ Ptot= 88.03 mm ] fname : F:\5000\5061 - Parkway Corridor Class EA\04 Disciplines\Water Resources\07 - Preliminary Stormwater remark: 100 Year, 6-hour SCS Type II Distribution, Peterborough * ** CALIB NASHYD 0001 1 5.0 5.71 .44 3.25 36.30 .41 .000 [CN=72.0 ] [ N = 3.0:Tp .40]* * CALIB STANDHYD 0101 1 5.0 7.52 1.51 3.00 53.49 .61 .000 [I%=43.0:S%= 2.00]* * CALIB STANDHYD 0002 1 5.0 22.36 4.43 3.00 52.40 .60 .000 [I%=43.0:S%= 3.00]* * CALIB STANDHYD 1101 1 5.0 7.52 1.51 3.00 53.49 .61 .000 [I%=43.0:S%= 2.00]* * CALIB STANDHYD 0201 1 5.0 20.55 4.11 3.00 52.66 .60 .000 [I%=44.0:S%= 3.00]* RESRVR [ 2 : 1101] 2001 1 5.0 7.52 .21 3.67 53.35 n/a .000 {ST= .26 ha.m }* **************************** ** SIMULATION NUMBER: 2 ** **************************** W/E COMMAND HYD ID DT AREA Qpeak Tpeak R.V. R.C. Qbase min ha cms hrs mm cms
START @ .00 hrs -------------------- READ STORM 15.0 [ Ptot= 80.30 mm ] fname : F:\5000\5061 - Parkway Corridor Class EA\04 Disciplines\Water Resources\07 - Preliminary Stormwater remark: 50 Year, 6-hour SCS Type II Distribution, Peterborough
Page 1
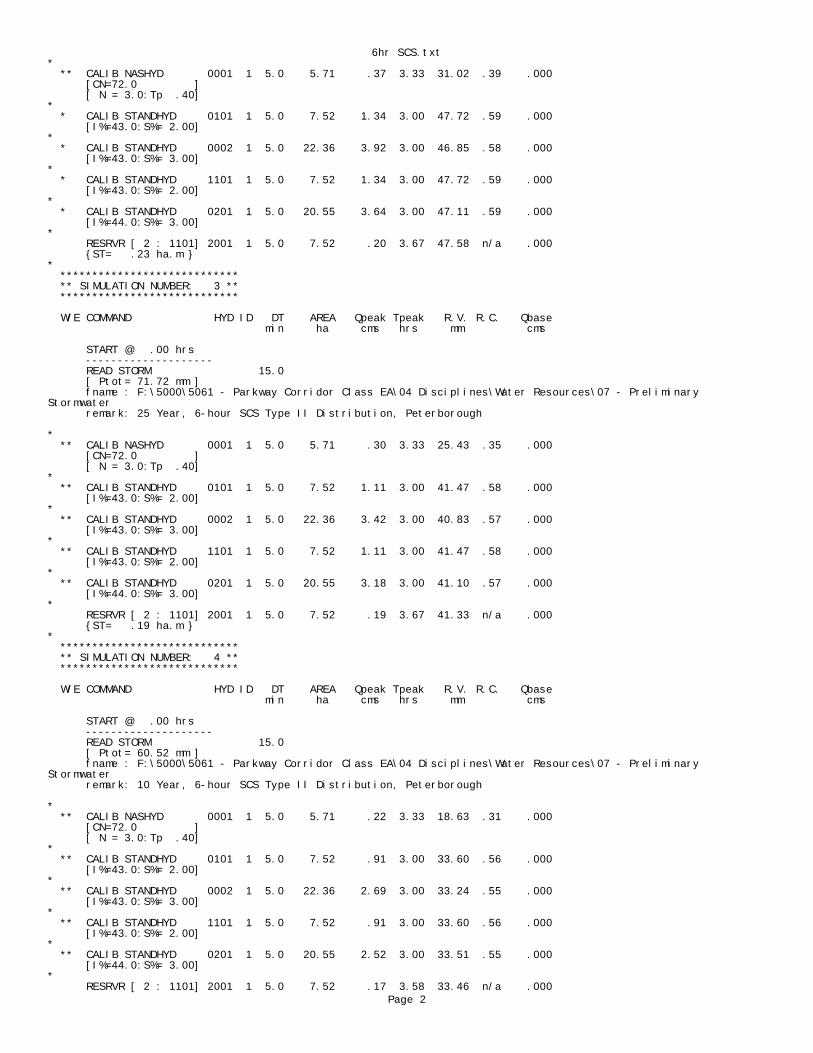
6hr SCS.txt* ** CALIB NASHYD 0001 1 5.0 5.71 .37 3.33 31.02 .39 .000 [CN=72.0 ] [ N = 3.0:Tp .40]* * CALIB STANDHYD 0101 1 5.0 7.52 1.34 3.00 47.72 .59 .000 [I%=43.0:S%= 2.00]* * CALIB STANDHYD 0002 1 5.0 22.36 3.92 3.00 46.85 .58 .000 [I%=43.0:S%= 3.00]* * CALIB STANDHYD 1101 1 5.0 7.52 1.34 3.00 47.72 .59 .000 [I%=43.0:S%= 2.00]* * CALIB STANDHYD 0201 1 5.0 20.55 3.64 3.00 47.11 .59 .000 [I%=44.0:S%= 3.00]* RESRVR [ 2 : 1101] 2001 1 5.0 7.52 .20 3.67 47.58 n/a .000 {ST= .23 ha.m }* **************************** ** SIMULATION NUMBER: 3 ** **************************** W/E COMMAND HYD ID DT AREA Qpeak Tpeak R.V. R.C. Qbase min ha cms hrs mm cms
START @ .00 hrs -------------------- READ STORM 15.0 [ Ptot= 71.72 mm ] fname : F:\5000\5061 - Parkway Corridor Class EA\04 Disciplines\Water Resources\07 - Preliminary Stormwater remark: 25 Year, 6-hour SCS Type II Distribution, Peterborough * ** CALIB NASHYD 0001 1 5.0 5.71 .30 3.33 25.43 .35 .000 [CN=72.0 ] [ N = 3.0:Tp .40]* ** CALIB STANDHYD 0101 1 5.0 7.52 1.11 3.00 41.47 .58 .000 [I%=43.0:S%= 2.00]* ** CALIB STANDHYD 0002 1 5.0 22.36 3.42 3.00 40.83 .57 .000 [I%=43.0:S%= 3.00]* ** CALIB STANDHYD 1101 1 5.0 7.52 1.11 3.00 41.47 .58 .000 [I%=43.0:S%= 2.00]* ** CALIB STANDHYD 0201 1 5.0 20.55 3.18 3.00 41.10 .57 .000 [I%=44.0:S%= 3.00]* RESRVR [ 2 : 1101] 2001 1 5.0 7.52 .19 3.67 41.33 n/a .000 {ST= .19 ha.m }* **************************** ** SIMULATION NUMBER: 4 ** **************************** W/E COMMAND HYD ID DT AREA Qpeak Tpeak R.V. R.C. Qbase min ha cms hrs mm cms
START @ .00 hrs -------------------- READ STORM 15.0 [ Ptot= 60.52 mm ] fname : F:\5000\5061 - Parkway Corridor Class EA\04 Disciplines\Water Resources\07 - Preliminary Stormwater remark: 10 Year, 6-hour SCS Type II Distribution, Peterborough * ** CALIB NASHYD 0001 1 5.0 5.71 .22 3.33 18.63 .31 .000 [CN=72.0 ] [ N = 3.0:Tp .40]* ** CALIB STANDHYD 0101 1 5.0 7.52 .91 3.00 33.60 .56 .000 [I%=43.0:S%= 2.00]* ** CALIB STANDHYD 0002 1 5.0 22.36 2.69 3.00 33.24 .55 .000 [I%=43.0:S%= 3.00]* ** CALIB STANDHYD 1101 1 5.0 7.52 .91 3.00 33.60 .56 .000 [I%=43.0:S%= 2.00]* ** CALIB STANDHYD 0201 1 5.0 20.55 2.52 3.00 33.51 .55 .000 [I%=44.0:S%= 3.00]* RESRVR [ 2 : 1101] 2001 1 5.0 7.52 .17 3.58 33.46 n/a .000
Page 2
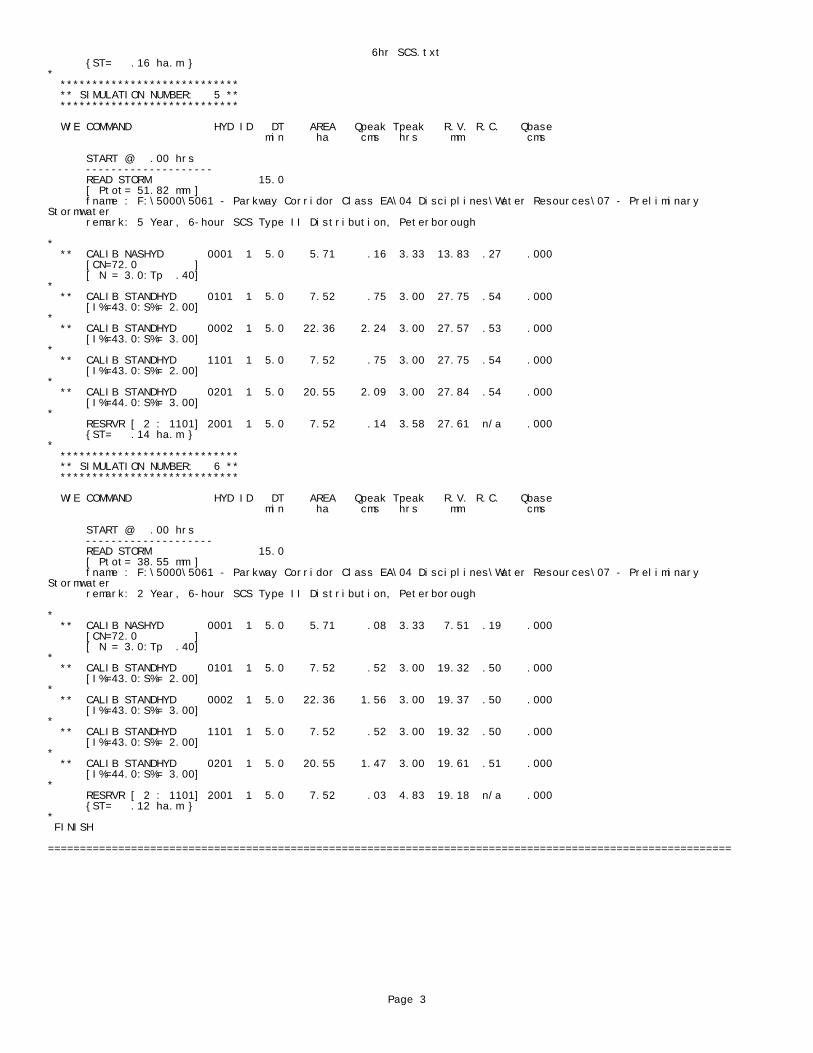
6hr SCS.txt {ST= .16 ha.m }* **************************** ** SIMULATION NUMBER: 5 ** **************************** W/E COMMAND HYD ID DT AREA Qpeak Tpeak R.V. R.C. Qbase min ha cms hrs mm cms
START @ .00 hrs -------------------- READ STORM 15.0 [ Ptot= 51.82 mm ] fname : F:\5000\5061 - Parkway Corridor Class EA\04 Disciplines\Water Resources\07 - Preliminary Stormwater remark: 5 Year, 6-hour SCS Type II Distribution, Peterborough * ** CALIB NASHYD 0001 1 5.0 5.71 .16 3.33 13.83 .27 .000 [CN=72.0 ] [ N = 3.0:Tp .40]* ** CALIB STANDHYD 0101 1 5.0 7.52 .75 3.00 27.75 .54 .000 [I%=43.0:S%= 2.00]* ** CALIB STANDHYD 0002 1 5.0 22.36 2.24 3.00 27.57 .53 .000 [I%=43.0:S%= 3.00]* ** CALIB STANDHYD 1101 1 5.0 7.52 .75 3.00 27.75 .54 .000 [I%=43.0:S%= 2.00]* ** CALIB STANDHYD 0201 1 5.0 20.55 2.09 3.00 27.84 .54 .000 [I%=44.0:S%= 3.00]* RESRVR [ 2 : 1101] 2001 1 5.0 7.52 .14 3.58 27.61 n/a .000 {ST= .14 ha.m }* **************************** ** SIMULATION NUMBER: 6 ** **************************** W/E COMMAND HYD ID DT AREA Qpeak Tpeak R.V. R.C. Qbase min ha cms hrs mm cms
START @ .00 hrs -------------------- READ STORM 15.0 [ Ptot= 38.55 mm ] fname : F:\5000\5061 - Parkway Corridor Class EA\04 Disciplines\Water Resources\07 - Preliminary Stormwater remark: 2 Year, 6-hour SCS Type II Distribution, Peterborough * ** CALIB NASHYD 0001 1 5.0 5.71 .08 3.33 7.51 .19 .000 [CN=72.0 ] [ N = 3.0:Tp .40]* ** CALIB STANDHYD 0101 1 5.0 7.52 .52 3.00 19.32 .50 .000 [I%=43.0:S%= 2.00]* ** CALIB STANDHYD 0002 1 5.0 22.36 1.56 3.00 19.37 .50 .000 [I%=43.0:S%= 3.00]* ** CALIB STANDHYD 1101 1 5.0 7.52 .52 3.00 19.32 .50 .000 [I%=43.0:S%= 2.00]* ** CALIB STANDHYD 0201 1 5.0 20.55 1.47 3.00 19.61 .51 .000 [I%=44.0:S%= 3.00]* RESRVR [ 2 : 1101] 2001 1 5.0 7.52 .03 4.83 19.18 n/a .000 {ST= .12 ha.m }* FINISH ===========================================================================================================
Page 3
6hr Chi.txt===========================================================================================================
V V I SSSSS U U A L V V I SS U U A A L V V I SS U U AAAAA L V V I SS U U A A L VV I SSSSS UUUUU A A LLLLL OOO TTTTT TTTTT H H Y Y M M OOO TM O O T T H H Y Y MM MM O O O O T T H H Y M M O O OOO T T H H Y M M OOO
Developed and Distributed by Clarifica Inc. Copyright 1996, 2007 Clarifica Inc.All rights reserved. ***** S U M M A R Y O U T P U T *****
Input filename: C:\Program Files (x86)\Visual OTTHYMO 2.2.4\voin.dat Output filename: F:\5000\50QDSS~P\0GBGVB~C\W5V6R6~P\056EVL~F\0FXFY8~T\02VKUS~U\0KZGT7~E\5QEKRL~H\6 Hour Chicago.out Summary filename: F:\5000\50QDSS~P\0GBGVB~C\W5V6R6~P\056EVL~F\0FXFY8~T\02VKUS~U\0KZGT7~E\5QEKRL~H\6 Hour Chicago.sum
DATE: 10/2/2013 TIME: 11:24:54 AM
USER:
COMMENTS: ____________________________________________________________
**************************** ** SIMULATION NUMBER: 1 ** **************************** W/E COMMAND HYD ID DT AREA Qpeak Tpeak R.V. R.C. Qbase min ha cms hrs mm cms
START @ .00 hrs -------------------- CHIC STORM 5.0 [ Ptot= 81.88 mm ]* ** CALIB NASHYD 0001 1 5.0 5.71 .36 2.50 32.08 .39 .000 [CN=72.0 ] [ N = 3.0:Tp .40]* * CALIB STANDHYD 0101 1 5.0 7.52 1.44 2.00 48.89 .60 .000 [I%=43.0:S%= 2.00]* * CALIB STANDHYD 0002 1 5.0 22.36 4.26 2.00 47.97 .59 .000 [I%=43.0:S%= 3.00]* * CALIB STANDHYD 1101 1 5.0 7.52 1.44 2.00 48.89 .60 .000 [I%=43.0:S%= 2.00]* * CALIB STANDHYD 0201 1 5.0 20.55 3.99 2.00 48.23 .59 .000 [I%=44.0:S%= 3.00]* RESRVR [ 2 : 1101] 2001 1 5.0 7.52 .20 3.00 48.74 n/a .000 {ST= .22 ha.m }* **************************** ** SIMULATION NUMBER: 2 ** **************************** W/E COMMAND HYD ID DT AREA Qpeak Tpeak R.V. R.C. Qbase min ha cms hrs mm cms
START @ .00 hrs -------------------- CHIC STORM 5.0 [ Ptot= 76.24 mm ]* ** CALIB NASHYD 0001 1 5.0 5.71 .31 2.50 28.33 .37 .000 [CN=72.0 ] [ N = 3.0:Tp .40]* * CALIB STANDHYD 0101 1 5.0 7.52 1.27 2.00 44.74 .59 .000 [I%=43.0:S%= 2.00]*
Page 1
6hr Chi.txt * CALIB STANDHYD 0002 1 5.0 22.36 3.79 2.00 43.98 .58 .000 [I%=43.0:S%= 3.00]* * CALIB STANDHYD 1101 1 5.0 7.52 1.27 2.00 44.74 .59 .000 [I%=43.0:S%= 2.00]* * CALIB STANDHYD 0201 1 5.0 20.55 3.55 2.00 44.24 .58 .000 [I%=44.0:S%= 3.00]* RESRVR [ 2 : 1101] 2001 1 5.0 7.52 .19 3.00 44.60 n/a .000 {ST= .20 ha.m }* **************************** ** SIMULATION NUMBER: 3 ** **************************** W/E COMMAND HYD ID DT AREA Qpeak Tpeak R.V. R.C. Qbase min ha cms hrs mm cms
START @ .00 hrs -------------------- CHIC STORM 5.0 [ Ptot= 65.65 mm ]* ** CALIB NASHYD 0001 1 5.0 5.71 .24 2.50 21.66 .33 .000 [CN=72.0 ] [ N = 3.0:Tp .40]* * CALIB STANDHYD 0101 1 5.0 7.52 1.09 2.00 37.16 .57 .000 [I%=43.0:S%= 2.00]* * CALIB STANDHYD 0002 1 5.0 22.36 3.22 2.00 36.67 .56 .000 [I%=43.0:S%= 3.00]* * CALIB STANDHYD 1101 1 5.0 7.52 1.09 2.00 37.16 .57 .000 [I%=43.0:S%= 2.00]* * CALIB STANDHYD 0201 1 5.0 20.55 3.02 2.00 36.94 .56 .000 [I%=44.0:S%= 3.00]* RESRVR [ 2 : 1101] 2001 1 5.0 7.52 .18 2.92 37.02 n/a .000 {ST= .17 ha.m }* **************************** ** SIMULATION NUMBER: 4 ** **************************** W/E COMMAND HYD ID DT AREA Qpeak Tpeak R.V. R.C. Qbase min ha cms hrs mm cms
START @ .00 hrs -------------------- CHIC STORM 5.0 [ Ptot= 57.49 mm ]* ** CALIB NASHYD 0001 1 5.0 5.71 .18 2.58 16.91 .29 .000 [CN=72.0 ] [ N = 3.0:Tp .40]* * CALIB STANDHYD 0101 1 5.0 7.52 .92 2.00 31.53 .55 .000 [I%=43.0:S%= 2.00]* * CALIB STANDHYD 0002 1 5.0 22.36 2.70 2.00 31.23 .54 .000 [I%=43.0:S%= 3.00]* * CALIB STANDHYD 1101 1 5.0 7.52 .92 2.00 31.53 .55 .000 [I%=43.0:S%= 2.00]* * CALIB STANDHYD 0201 1 5.0 20.55 2.53 2.00 31.51 .55 .000 [I%=44.0:S%= 3.00]* RESRVR [ 2 : 1101] 2001 1 5.0 7.52 .16 2.83 31.39 n/a .000 {ST= .14 ha.m }* **************************** ** SIMULATION NUMBER: 5 ** **************************** W/E COMMAND HYD ID DT AREA Qpeak Tpeak R.V. R.C. Qbase min ha cms hrs mm cms
START @ .00 hrs -------------------- CHIC STORM 5.0 [ Ptot= 48.64 mm ]* ** CALIB NASHYD 0001 1 5.0 5.71 .12 2.58 12.20 .25 .000 [CN=72.0 ]
Page 2
6hr Chi.txt [ N = 3.0:Tp .40]* ** CALIB STANDHYD 0101 1 5.0 7.52 .78 2.00 25.67 .53 .000 [I%=43.0:S%= 2.00]* ** CALIB STANDHYD 0002 1 5.0 22.36 2.30 2.00 25.55 .53 .000 [I%=43.0:S%= 3.00]* ** CALIB STANDHYD 1101 1 5.0 7.52 .78 2.00 25.67 .53 .000 [I%=43.0:S%= 2.00]* ** CALIB STANDHYD 0201 1 5.0 20.55 2.15 2.00 25.82 .53 .000 [I%=44.0:S%= 3.00]* RESRVR [ 2 : 1101] 2001 1 5.0 7.52 .10 3.08 25.53 n/a .000 {ST= .13 ha.m }* **************************** ** SIMULATION NUMBER: 6 ** **************************** W/E COMMAND HYD ID DT AREA Qpeak Tpeak R.V. R.C. Qbase min ha cms hrs mm cms
START @ .00 hrs -------------------- CHIC STORM 5.0 [ Ptot= 37.36 mm ]* ** CALIB NASHYD 0001 1 5.0 5.71 .06 2.58 7.01 .19 .000 [CN=72.0 ] [ N = 3.0:Tp .40]* ** CALIB STANDHYD 0101 1 5.0 7.52 .57 2.00 18.60 .50 .000 [I%=43.0:S%= 2.00]* ** CALIB STANDHYD 0002 1 5.0 22.36 1.67 2.00 18.66 .50 .000 [I%=43.0:S%= 3.00]* ** CALIB STANDHYD 1101 1 5.0 7.52 .57 2.00 18.60 .50 .000 [I%=43.0:S%= 2.00]* ** CALIB STANDHYD 0201 1 5.0 20.55 1.57 2.00 18.90 .51 .000 [I%=44.0:S%= 3.00]* RESRVR [ 2 : 1101] 2001 1 5.0 7.52 .02 5.75 18.45 n/a .000 {ST= .12 ha.m }* FINISH ===========================================================================================================
Page 3
4hr Chi.txt===========================================================================================================
V V I SSSSS U U A L V V I SS U U A A L V V I SS U U AAAAA L V V I SS U U A A L VV I SSSSS UUUUU A A LLLLL OOO TTTTT TTTTT H H Y Y M M OOO TM O O T T H H Y Y MM MM O O O O T T H H Y M M O O OOO T T H H Y M M OOO
Developed and Distributed by Clarifica Inc. Copyright 1996, 2007 Clarifica Inc.All rights reserved. ***** S U M M A R Y O U T P U T *****
Input filename: C:\Program Files (x86)\Visual OTTHYMO 2.2.4\voin.dat Output filename: F:\5000\50QDSS~P\0GBGVB~C\W5V6R6~P\056EVL~F\0FXFY8~T\02VKUS~U\0KZGT7~E\5QEKRL~H\4 Hour Chicago.out Summary filename: F:\5000\50QDSS~P\0GBGVB~C\W5V6R6~P\056EVL~F\0FXFY8~T\02VKUS~U\0KZGT7~E\5QEKRL~H\4 Hour Chicago.sum
DATE: 10/2/2013 TIME: 11:25:57 AM
USER:
COMMENTS: ____________________________________________________________
**************************** ** SIMULATION NUMBER: 1 ** **************************** W/E COMMAND HYD ID DT AREA Qpeak Tpeak R.V. R.C. Qbase min ha cms hrs mm cms
START @ .00 hrs -------------------- CHIC STORM 5.0 [ Ptot= 76.72 mm ]* ** CALIB NASHYD 0001 1 5.0 5.71 .34 1.83 28.65 .37 .000 [CN=72.0 ] [ N = 3.0:Tp .40]* * CALIB STANDHYD 0101 1 5.0 7.52 1.43 1.33 45.09 .59 .000 [I%=43.0:S%= 2.00]* * CALIB STANDHYD 0002 1 5.0 22.36 4.23 1.33 44.32 .58 .000 [I%=43.0:S%= 3.00]* * CALIB STANDHYD 1101 1 5.0 7.52 1.43 1.33 45.09 .59 .000 [I%=43.0:S%= 2.00]* * CALIB STANDHYD 0201 1 5.0 20.55 3.96 1.33 44.59 .58 .000 [I%=44.0:S%= 3.00]* RESRVR [ 2 : 1101] 2001 1 5.0 7.52 .20 2.33 44.95 n/a .000 {ST= .22 ha.m }* **************************** ** SIMULATION NUMBER: 2 ** **************************** W/E COMMAND HYD ID DT AREA Qpeak Tpeak R.V. R.C. Qbase min ha cms hrs mm cms
START @ .00 hrs -------------------- CHIC STORM 5.0 [ Ptot= 71.16 mm ]* ** CALIB NASHYD 0001 1 5.0 5.71 .29 1.83 25.07 .35 .000 [CN=72.0 ] [ N = 3.0:Tp .40]* * CALIB STANDHYD 0101 1 5.0 7.52 1.26 1.33 41.07 .58 .000 [I%=43.0:S%= 2.00]*
Page 1

4hr Chi.txt * CALIB STANDHYD 0002 1 5.0 22.36 3.76 1.33 40.44 .57 .000 [I%=43.0:S%= 3.00]* * CALIB STANDHYD 1101 1 5.0 7.52 1.26 1.33 41.07 .58 .000 [I%=43.0:S%= 2.00]* * CALIB STANDHYD 0201 1 5.0 20.55 3.48 1.33 40.71 .57 .000 [I%=44.0:S%= 3.00]* RESRVR [ 2 : 1101] 2001 1 5.0 7.52 .19 2.33 40.93 n/a .000 {ST= .19 ha.m }* **************************** ** SIMULATION NUMBER: 3 ** **************************** W/E COMMAND HYD ID DT AREA Qpeak Tpeak R.V. R.C. Qbase min ha cms hrs mm cms
START @ .00 hrs -------------------- CHIC STORM 5.0 [ Ptot= 61.51 mm ]* ** CALIB NASHYD 0001 1 5.0 5.71 .22 1.92 19.21 .31 .000 [CN=72.0 ] [ N = 3.0:Tp .40]* * CALIB STANDHYD 0101 1 5.0 7.52 1.09 1.33 34.28 .56 .000 [I%=43.0:S%= 2.00]* * CALIB STANDHYD 0002 1 5.0 22.36 3.21 1.33 33.89 .55 .000 [I%=43.0:S%= 3.00]* * CALIB STANDHYD 1101 1 5.0 7.52 1.09 1.33 34.28 .56 .000 [I%=43.0:S%= 2.00]* * CALIB STANDHYD 0201 1 5.0 20.55 3.01 1.33 34.17 .56 .000 [I%=44.0:S%= 3.00]* RESRVR [ 2 : 1101] 2001 1 5.0 7.52 .17 2.25 34.14 n/a .000 {ST= .16 ha.m }* **************************** ** SIMULATION NUMBER: 4 ** **************************** W/E COMMAND HYD ID DT AREA Qpeak Tpeak R.V. R.C. Qbase min ha cms hrs mm cms
START @ .00 hrs -------------------- CHIC STORM 5.0 [ Ptot= 53.51 mm ]* ** CALIB NASHYD 0001 1 5.0 5.71 .17 1.92 14.73 .28 .000 [CN=72.0 ] [ N = 3.0:Tp .40]* * CALIB STANDHYD 0101 1 5.0 7.52 .91 1.33 28.87 .54 .000 [I%=43.0:S%= 2.00]* * CALIB STANDHYD 0002 1 5.0 22.36 2.69 1.33 28.65 .54 .000 [I%=43.0:S%= 3.00]* * CALIB STANDHYD 1101 1 5.0 7.52 .91 1.33 28.87 .54 .000 [I%=43.0:S%= 2.00]* * CALIB STANDHYD 0201 1 5.0 20.55 2.52 1.33 28.92 .54 .000 [I%=44.0:S%= 3.00]* RESRVR [ 2 : 1101] 2001 1 5.0 7.52 .16 2.17 28.72 n/a .000 {ST= .14 ha.m }* **************************** ** SIMULATION NUMBER: 5 ** **************************** W/E COMMAND HYD ID DT AREA Qpeak Tpeak R.V. R.C. Qbase min ha cms hrs mm cms
START @ .00 hrs -------------------- CHIC STORM 5.0 [ Ptot= 44.89 mm ]* ** CALIB NASHYD 0001 1 5.0 5.71 .11 1.92 10.36 .23 .000 [CN=72.0 ]
Page 2

4hr Chi.txt [ N = 3.0:Tp .40]* ** CALIB STANDHYD 0101 1 5.0 7.52 .78 1.33 23.26 .52 .000 [I%=43.0:S%= 2.00]* ** CALIB STANDHYD 0002 1 5.0 22.36 2.28 1.33 23.21 .52 .000 [I%=43.0:S%= 3.00]* ** CALIB STANDHYD 1101 1 5.0 7.52 .78 1.33 23.26 .52 .000 [I%=43.0:S%= 2.00]* ** CALIB STANDHYD 0201 1 5.0 20.55 2.15 1.33 23.47 .52 .000 [I%=44.0:S%= 3.00]* RESRVR [ 2 : 1101] 2001 1 5.0 7.52 .09 2.50 23.12 n/a .000 {ST= .13 ha.m }* **************************** ** SIMULATION NUMBER: 6 ** **************************** W/E COMMAND HYD ID DT AREA Qpeak Tpeak R.V. R.C. Qbase min ha cms hrs mm cms
START @ .00 hrs -------------------- CHIC STORM 5.0 [ Ptot= 34.04 mm ]* ** CALIB NASHYD 0001 1 5.0 5.71 .06 1.92 5.69 .17 .000 [CN=72.0 ] [ N = 3.0:Tp .40]* ** CALIB STANDHYD 0101 1 5.0 7.52 .57 1.33 16.61 .49 .000 [I%=43.0:S%= 2.00]* ** CALIB STANDHYD 0002 1 5.0 22.36 1.67 1.33 16.72 .49 .000 [I%=43.0:S%= 3.00]* ** CALIB STANDHYD 1101 1 5.0 7.52 .57 1.33 16.61 .49 .000 [I%=43.0:S%= 2.00]* ** CALIB STANDHYD 0201 1 5.0 20.55 1.57 1.33 16.95 .50 .000 [I%=44.0:S%= 3.00]* RESRVR [ 2 : 1101] 2001 1 5.0 7.52 .01 4.08 16.47 n/a .000 {ST= .11 ha.m }* FINISH ===========================================================================================================
Page 3
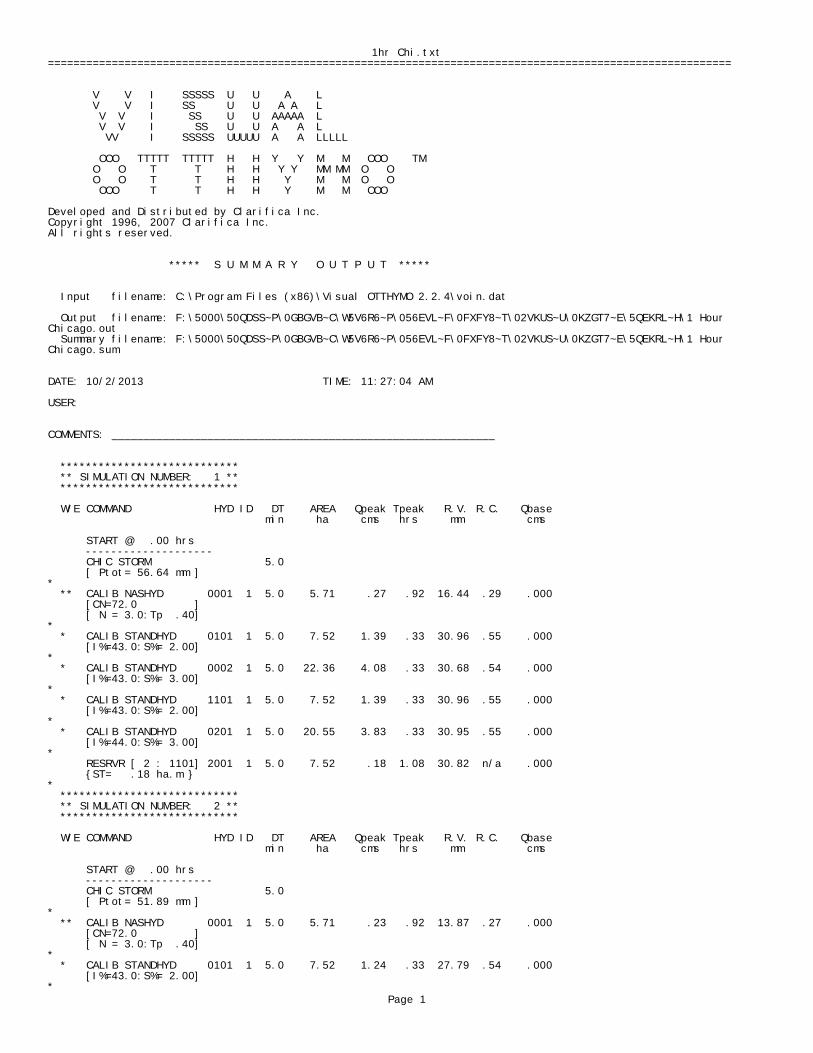
1hr Chi.txt===========================================================================================================
V V I SSSSS U U A L V V I SS U U A A L V V I SS U U AAAAA L V V I SS U U A A L VV I SSSSS UUUUU A A LLLLL OOO TTTTT TTTTT H H Y Y M M OOO TM O O T T H H Y Y MM MM O O O O T T H H Y M M O O OOO T T H H Y M M OOO
Developed and Distributed by Clarifica Inc. Copyright 1996, 2007 Clarifica Inc.All rights reserved. ***** S U M M A R Y O U T P U T *****
Input filename: C:\Program Files (x86)\Visual OTTHYMO 2.2.4\voin.dat Output filename: F:\5000\50QDSS~P\0GBGVB~C\W5V6R6~P\056EVL~F\0FXFY8~T\02VKUS~U\0KZGT7~E\5QEKRL~H\1 Hour Chicago.out Summary filename: F:\5000\50QDSS~P\0GBGVB~C\W5V6R6~P\056EVL~F\0FXFY8~T\02VKUS~U\0KZGT7~E\5QEKRL~H\1 Hour Chicago.sum
DATE: 10/2/2013 TIME: 11:27:04 AM
USER:
COMMENTS: ____________________________________________________________
**************************** ** SIMULATION NUMBER: 1 ** **************************** W/E COMMAND HYD ID DT AREA Qpeak Tpeak R.V. R.C. Qbase min ha cms hrs mm cms
START @ .00 hrs -------------------- CHIC STORM 5.0 [ Ptot= 56.64 mm ]* ** CALIB NASHYD 0001 1 5.0 5.71 .27 .92 16.44 .29 .000 [CN=72.0 ] [ N = 3.0:Tp .40]* * CALIB STANDHYD 0101 1 5.0 7.52 1.39 .33 30.96 .55 .000 [I%=43.0:S%= 2.00]* * CALIB STANDHYD 0002 1 5.0 22.36 4.08 .33 30.68 .54 .000 [I%=43.0:S%= 3.00]* * CALIB STANDHYD 1101 1 5.0 7.52 1.39 .33 30.96 .55 .000 [I%=43.0:S%= 2.00]* * CALIB STANDHYD 0201 1 5.0 20.55 3.83 .33 30.95 .55 .000 [I%=44.0:S%= 3.00]* RESRVR [ 2 : 1101] 2001 1 5.0 7.52 .18 1.08 30.82 n/a .000 {ST= .18 ha.m }* **************************** ** SIMULATION NUMBER: 2 ** **************************** W/E COMMAND HYD ID DT AREA Qpeak Tpeak R.V. R.C. Qbase min ha cms hrs mm cms
START @ .00 hrs -------------------- CHIC STORM 5.0 [ Ptot= 51.89 mm ]* ** CALIB NASHYD 0001 1 5.0 5.71 .23 .92 13.87 .27 .000 [CN=72.0 ] [ N = 3.0:Tp .40]* * CALIB STANDHYD 0101 1 5.0 7.52 1.24 .33 27.79 .54 .000 [I%=43.0:S%= 2.00]*
Page 1

1hr Chi.txt * CALIB STANDHYD 0002 1 5.0 22.36 3.63 .33 27.61 .53 .000 [I%=43.0:S%= 3.00]* * CALIB STANDHYD 1101 1 5.0 7.52 1.24 .33 27.79 .54 .000 [I%=43.0:S%= 2.00]* * CALIB STANDHYD 0201 1 5.0 20.55 3.41 .33 27.88 .54 .000 [I%=44.0:S%= 3.00]* RESRVR [ 2 : 1101] 2001 1 5.0 7.52 .17 1.08 27.65 n/a .000 {ST= .16 ha.m }* **************************** ** SIMULATION NUMBER: 3 ** **************************** W/E COMMAND HYD ID DT AREA Qpeak Tpeak R.V. R.C. Qbase min ha cms hrs mm cms
START @ .00 hrs -------------------- CHIC STORM 5.0 [ Ptot= 45.41 mm ]* ** CALIB NASHYD 0001 1 5.0 5.71 .18 .92 10.61 .23 .000 [CN=72.0 ] [ N = 3.0:Tp .40]* * CALIB STANDHYD 0101 1 5.0 7.52 1.07 .33 23.59 .52 .000 [I%=43.0:S%= 2.00]* * CALIB STANDHYD 0002 1 5.0 22.36 3.15 .33 23.54 .52 .000 [I%=43.0:S%= 3.00]* * CALIB STANDHYD 1101 1 5.0 7.52 1.07 .33 23.59 .52 .000 [I%=43.0:S%= 2.00]* * CALIB STANDHYD 0201 1 5.0 20.55 2.96 .33 23.79 .52 .000 [I%=44.0:S%= 3.00]* RESRVR [ 2 : 1101] 2001 1 5.0 7.52 .16 1.08 23.45 n/a .000 {ST= .14 ha.m }* **************************** ** SIMULATION NUMBER: 4 ** **************************** W/E COMMAND HYD ID DT AREA Qpeak Tpeak R.V. R.C. Qbase min ha cms hrs mm cms
START @ .00 hrs -------------------- CHIC STORM 5.0 [ Ptot= 38.87 mm ]* ** CALIB NASHYD 0001 1 5.0 5.71 .13 .92 7.64 .20 .000 [CN=72.0 ] [ N = 3.0:Tp .40]* * CALIB STANDHYD 0101 1 5.0 7.52 .90 .33 19.51 .50 .000 [I%=43.0:S%= 2.00]* * CALIB STANDHYD 0002 1 5.0 22.36 2.64 .33 19.56 .50 .000 [I%=43.0:S%= 3.00]* * CALIB STANDHYD 1101 1 5.0 7.52 .90 .33 19.51 .50 .000 [I%=43.0:S%= 2.00]* * CALIB STANDHYD 0201 1 5.0 20.55 2.48 .33 19.80 .51 .000 [I%=44.0:S%= 3.00]* RESRVR [ 2 : 1101] 2001 1 5.0 7.52 .09 1.17 19.37 n/a .000 {ST= .13 ha.m }* **************************** ** SIMULATION NUMBER: 5 ** **************************** W/E COMMAND HYD ID DT AREA Qpeak Tpeak R.V. R.C. Qbase min ha cms hrs mm cms
START @ .00 hrs -------------------- CHIC STORM 5.0 [ Ptot= 32.19 mm ]* ** CALIB NASHYD 0001 1 5.0 5.71 .08 1.00 5.01 .16 .000 [CN=72.0 ]
Page 2
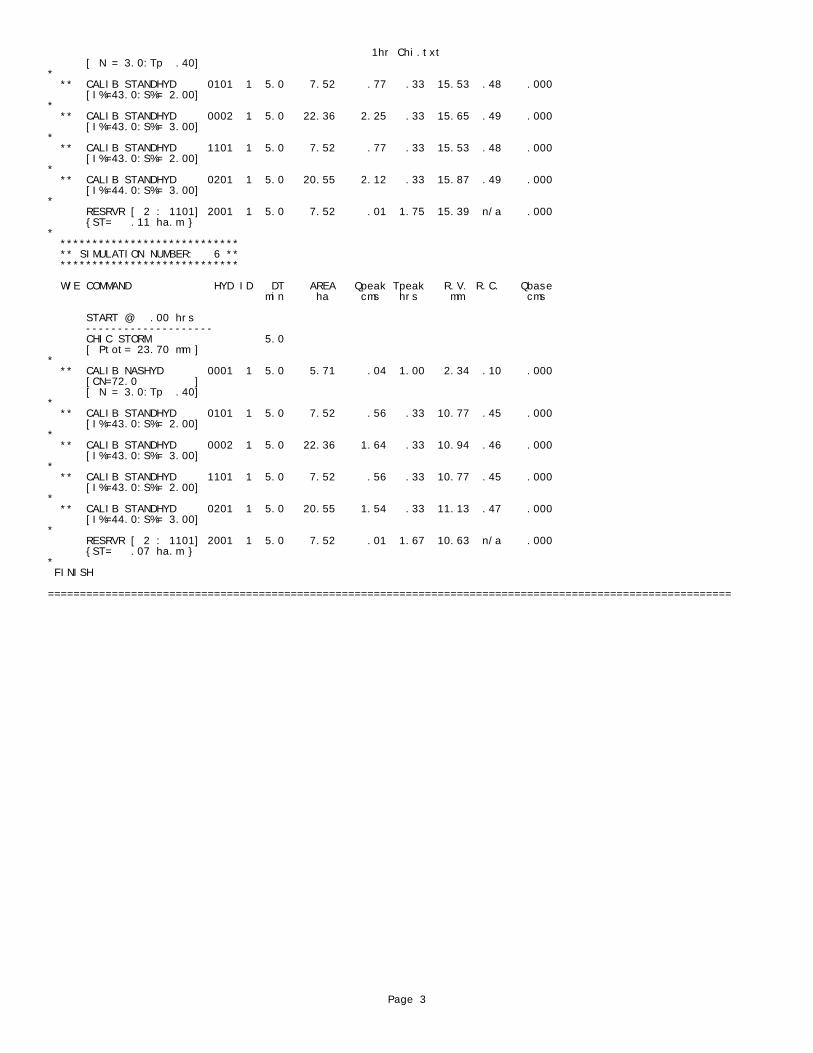
1hr Chi.txt [ N = 3.0:Tp .40]* ** CALIB STANDHYD 0101 1 5.0 7.52 .77 .33 15.53 .48 .000 [I%=43.0:S%= 2.00]* ** CALIB STANDHYD 0002 1 5.0 22.36 2.25 .33 15.65 .49 .000 [I%=43.0:S%= 3.00]* ** CALIB STANDHYD 1101 1 5.0 7.52 .77 .33 15.53 .48 .000 [I%=43.0:S%= 2.00]* ** CALIB STANDHYD 0201 1 5.0 20.55 2.12 .33 15.87 .49 .000 [I%=44.0:S%= 3.00]* RESRVR [ 2 : 1101] 2001 1 5.0 7.52 .01 1.75 15.39 n/a .000 {ST= .11 ha.m }* **************************** ** SIMULATION NUMBER: 6 ** **************************** W/E COMMAND HYD ID DT AREA Qpeak Tpeak R.V. R.C. Qbase min ha cms hrs mm cms
START @ .00 hrs -------------------- CHIC STORM 5.0 [ Ptot= 23.70 mm ]* ** CALIB NASHYD 0001 1 5.0 5.71 .04 1.00 2.34 .10 .000 [CN=72.0 ] [ N = 3.0:Tp .40]* ** CALIB STANDHYD 0101 1 5.0 7.52 .56 .33 10.77 .45 .000 [I%=43.0:S%= 2.00]* ** CALIB STANDHYD 0002 1 5.0 22.36 1.64 .33 10.94 .46 .000 [I%=43.0:S%= 3.00]* ** CALIB STANDHYD 1101 1 5.0 7.52 .56 .33 10.77 .45 .000 [I%=43.0:S%= 2.00]* ** CALIB STANDHYD 0201 1 5.0 20.55 1.54 .33 11.13 .47 .000 [I%=44.0:S%= 3.00]* RESRVR [ 2 : 1101] 2001 1 5.0 7.52 .01 1.67 10.63 n/a .000 {ST= .07 ha.m }* FINISH ===========================================================================================================
Page 3
Appendix D Hydraulic Elements
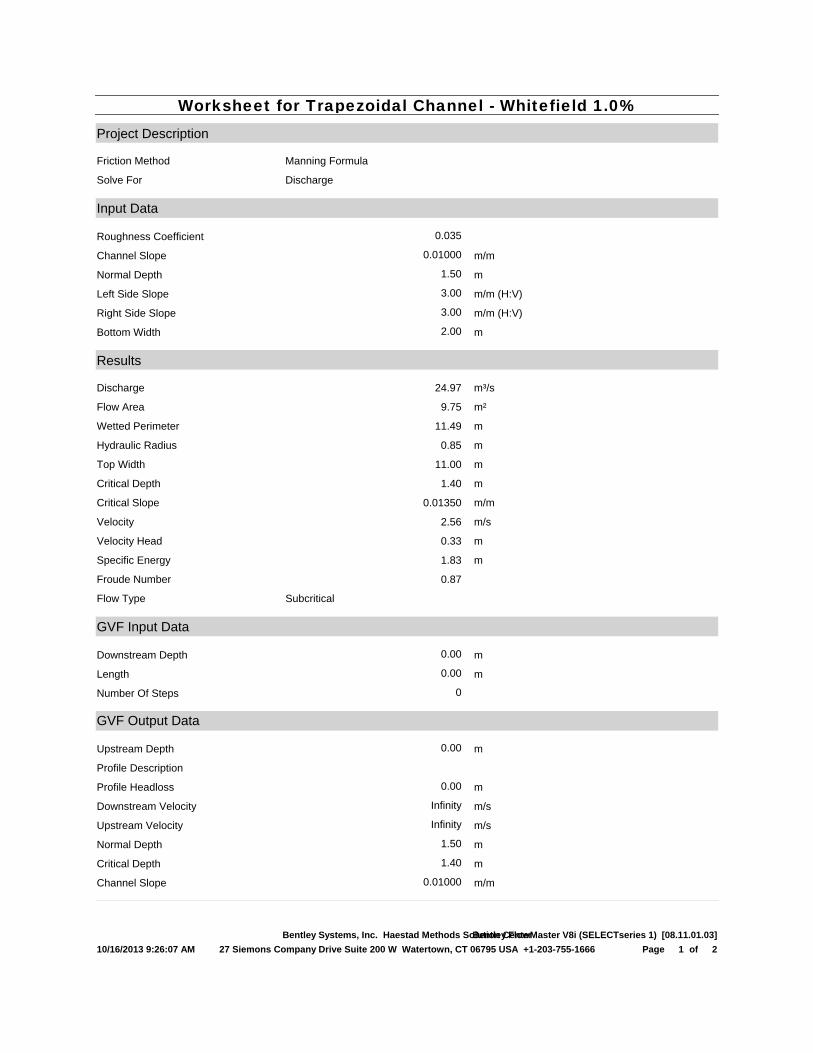
Project Description
Friction Method Manning Formula
Solve For Discharge
Input Data
Roughness Coefficient 0.035
Channel Slope 0.01000 m/m
Normal Depth 1.50 m
Left Side Slope 3.00 m/m (H:V)
Right Side Slope 3.00 m/m (H:V)
Bottom Width 2.00 m
Results
Discharge 24.97 m³/s
Flow Area 9.75 m²
Wetted Perimeter 11.49 m
Hydraulic Radius 0.85 m
Top Width 11.00 m
Critical Depth 1.40 m
Critical Slope 0.01350 m/m
Velocity 2.56 m/s
Velocity Head 0.33 m
Specific Energy 1.83 m
Froude Number 0.87
Flow Type Subcritical
GVF Input Data
Downstream Depth 0.00 m
Length 0.00 m
Number Of Steps 0
GVF Output Data
Upstream Depth 0.00 m
Profile Description
Profile Headloss 0.00 m
Downstream Velocity Infinity m/s
Upstream Velocity Infinity m/s
Normal Depth 1.50 m
Critical Depth 1.40 m
Channel Slope 0.01000 m/m
Worksheet for Trapezoidal Channel - Whitefield 1.0%
10/16/2013 9:26:07 AM
Bentley Systems, Inc. Haestad Methods Solution CenterBentley FlowMaster V8i (SELECTseries 1) [08.11.01.03]
27 Siemons Company Drive Suite 200 W Watertown, CT 06795 USA +1-203-755-1666 2of1Page

Worksheet for Trapezoidal Channel - Whitefield 1.0%GVF Output Data
Critical Slope 0.01350 m/m
10/16/2013 9:26:07 AM
Bentley Systems, Inc. Haestad Methods Solution CenterBentley FlowMaster V8i (SELECTseries 1) [08.11.01.03]
27 Siemons Company Drive Suite 200 W Watertown, CT 06795 USA +1-203-755-1666 2of2Page
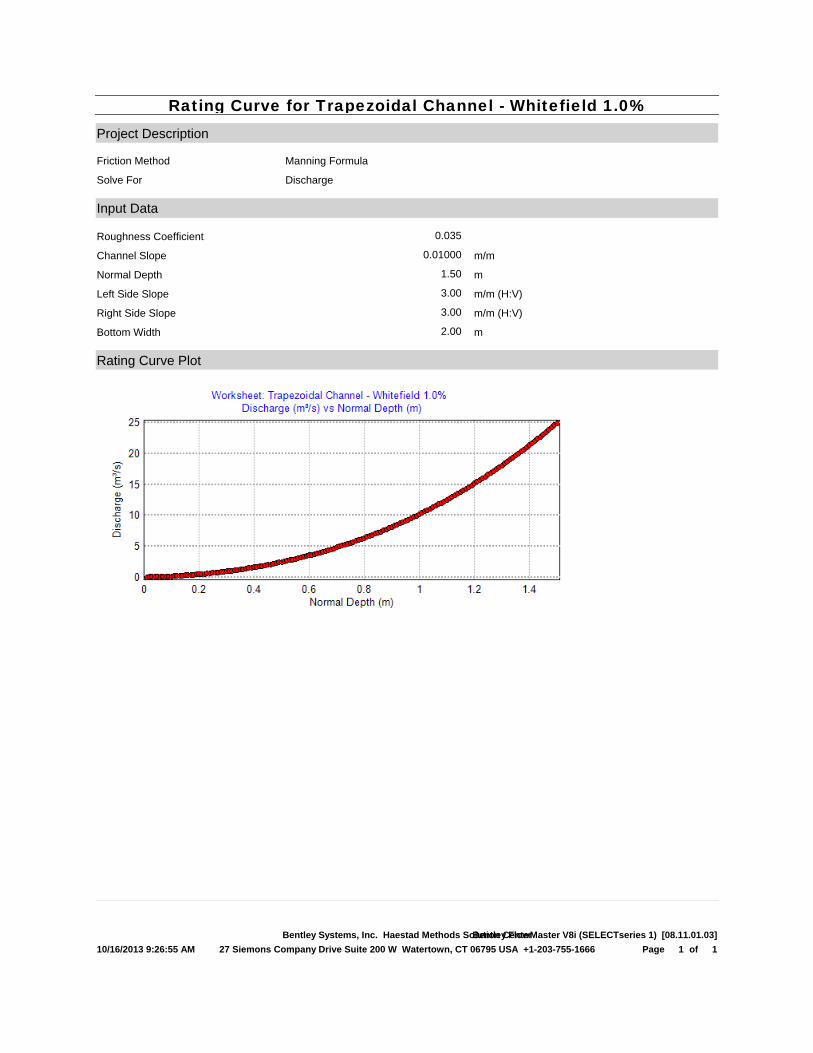
Project Description
Friction Method Manning Formula
Solve For Discharge
Input Data
Roughness Coefficient 0.035
Channel Slope 0.01000 m/m
Normal Depth 1.50 m
Left Side Slope 3.00 m/m (H:V)
Right Side Slope 3.00 m/m (H:V)
Bottom Width 2.00 m
Rating Curve Plot
Rating Curve for Trapezoidal Channel - Whitefield 1.0%
10/16/2013 9:26:55 AM
Bentley Systems, Inc. Haestad Methods Solution CenterBentley FlowMaster V8i (SELECTseries 1) [08.11.01.03]
27 Siemons Company Drive Suite 200 W Watertown, CT 06795 USA +1-203-755-1666 1of1Page

Project Description
Friction Method Manning Formula
Solve For Discharge
Input Data
Roughness Coefficient 0.035
Channel Slope 0.00500 m/m
Normal Depth 1.50 m
Left Side Slope 3.00 m/m (H:V)
Right Side Slope 3.00 m/m (H:V)
Bottom Width 3.00 m
Results
Discharge 21.20 m³/s
Flow Area 11.25 m²
Wetted Perimeter 12.49 m
Hydraulic Radius 0.90 m
Top Width 12.00 m
Critical Depth 1.18 m
Critical Slope 0.01380 m/m
Velocity 1.88 m/s
Velocity Head 0.18 m
Specific Energy 1.68 m
Froude Number 0.62
Flow Type Subcritical
GVF Input Data
Downstream Depth 0.00 m
Length 0.00 m
Number Of Steps 0
GVF Output Data
Upstream Depth 0.00 m
Profile Description
Profile Headloss 0.00 m
Downstream Velocity Infinity m/s
Upstream Velocity Infinity m/s
Normal Depth 1.50 m
Critical Depth 1.18 m
Channel Slope 0.00500 m/m
Worksheet for Trapezoidal Channel - Whitefield 0.5%
10/16/2013 9:27:22 AM
Bentley Systems, Inc. Haestad Methods Solution CenterBentley FlowMaster V8i (SELECTseries 1) [08.11.01.03]
27 Siemons Company Drive Suite 200 W Watertown, CT 06795 USA +1-203-755-1666 2of1Page

Worksheet for Trapezoidal Channel - Whitefield 0.5%GVF Output Data
Critical Slope 0.01380 m/m
10/16/2013 9:27:22 AM
Bentley Systems, Inc. Haestad Methods Solution CenterBentley FlowMaster V8i (SELECTseries 1) [08.11.01.03]
27 Siemons Company Drive Suite 200 W Watertown, CT 06795 USA +1-203-755-1666 2of2Page
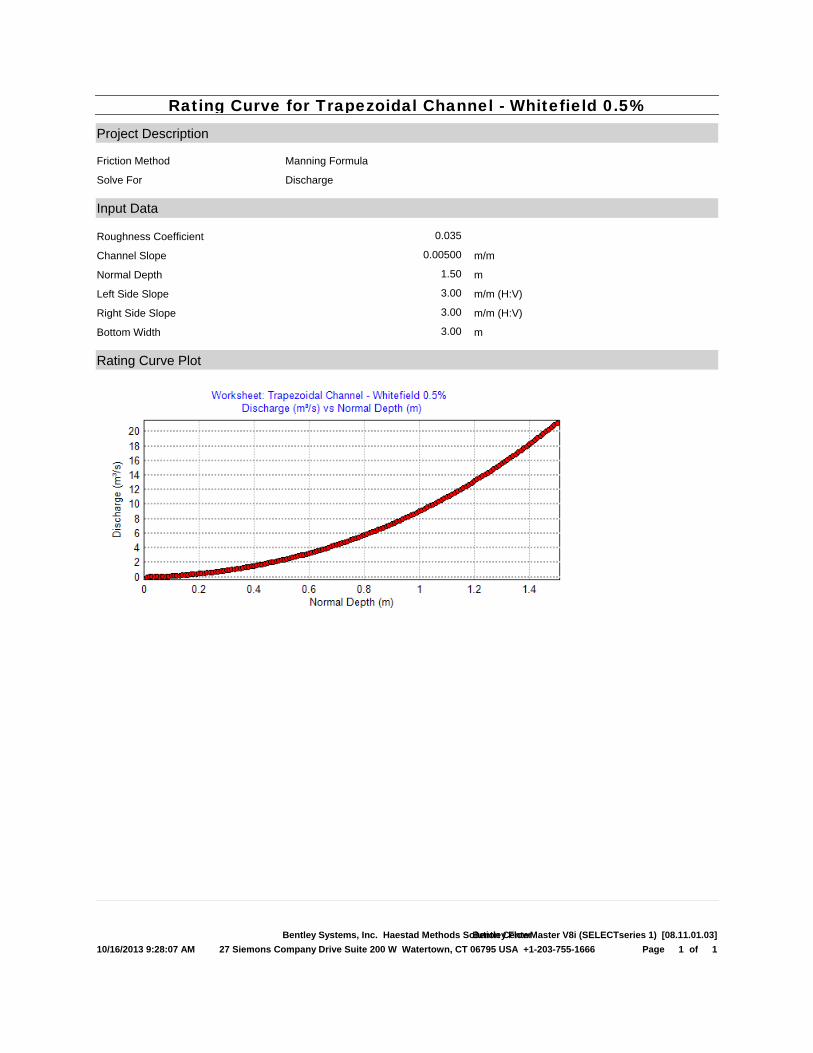
Project Description
Friction Method Manning Formula
Solve For Discharge
Input Data
Roughness Coefficient 0.035
Channel Slope 0.00500 m/m
Normal Depth 1.50 m
Left Side Slope 3.00 m/m (H:V)
Right Side Slope 3.00 m/m (H:V)
Bottom Width 3.00 m
Rating Curve Plot
Rating Curve for Trapezoidal Channel - Whitefield 0.5%
10/16/2013 9:28:07 AM
Bentley Systems, Inc. Haestad Methods Solution CenterBentley FlowMaster V8i (SELECTseries 1) [08.11.01.03]
27 Siemons Company Drive Suite 200 W Watertown, CT 06795 USA +1-203-755-1666 1of1Page