Embed Size (px)
Citation preview
8/8/2019 DM Using and Collecting Data
http://slidepdf.com/reader/full/dm-using-and-collecting-data 1/21
Discovering Math: Using and Collecting Data
Teacher’s Guide Grade Level: 3-5 Curriculum Focus: Mathematics Lesson Duration: Four class periods
Program Description
Discovering Math: Using and Collecting Data — From data points and determining spread to creatingand reading graphs and charts, introduce elementary students to more advanced concepts of statisticsand data analysis.
Lesson Plan
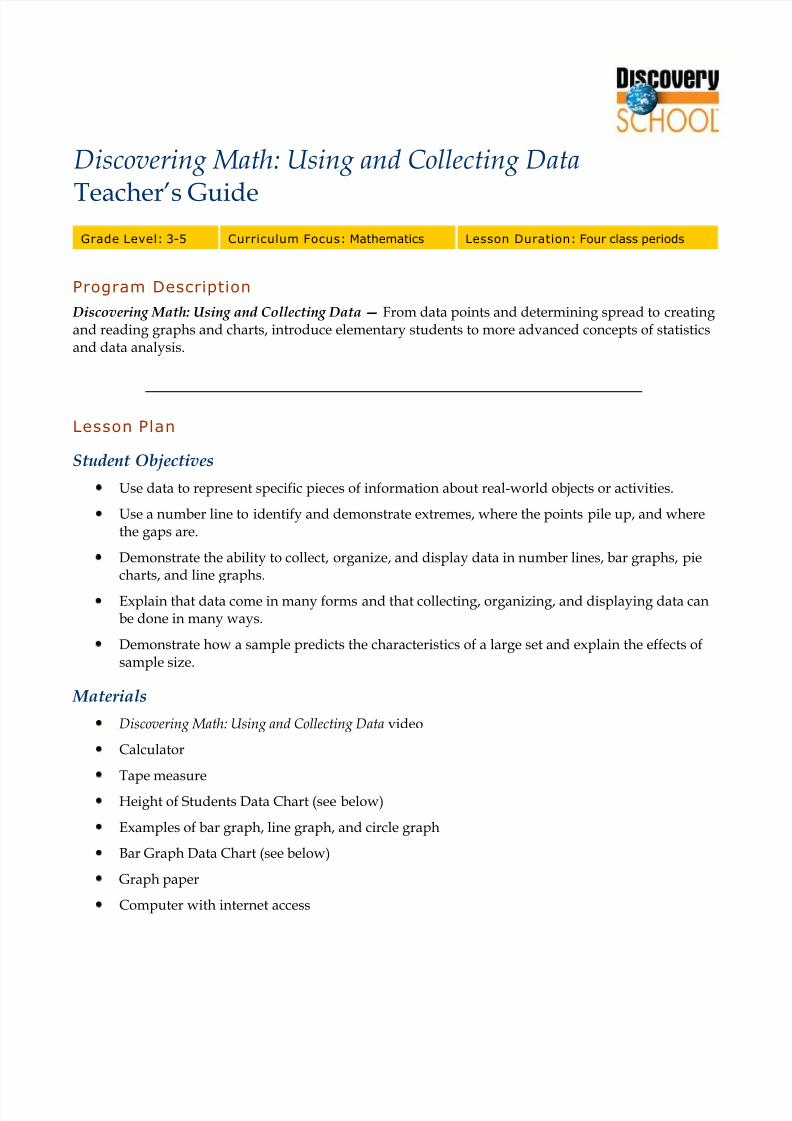
Student Objectives
• Use data to represent specific pieces of information about real-world objects or activities.
• Use a number line to identify and demonstrate extremes, where the points pile up, and wherethe gaps are.
• Demonstrate the ability to collect, organize, and display data in number lines, bar graphs, piecharts, and line graphs.
• Explain that data come in many forms and that collecting, organizing, and displaying data canbe done in many ways.
• Demonstrate how a sample predicts the characteristics of a large set and explain the effects ofsample size.
Materials
• Discovering Math: Using and Collecting Data video
• Calculator
• Tape measure
• Height of Students Data Chart (see below)
• Examples of bar graph, line graph, and circle graph
• Bar Graph Data Chart (see below)
• Graph paper
• Computer with internet access
8/8/2019 DM Using and Collecting Data
http://slidepdf.com/reader/full/dm-using-and-collecting-data 2/21
Discovering Math: Using and Collecting DataTeacher’s Guide 2
• Line Graph Data Chart (see below)
• Circle Graph Data Chart (see below)
• Circle Graph Template (see below)
Procedures
1. Discuss how data was displayed on number lines in the video segment about horse heights.Recall that wider intervals yield less precise graphic representations, but make it easier toidentify larger patterns within the data. Tell students they will be collecting data and displayingit on a number line plot.
Note: This activity works best with at least 20 or more students. If the class is smaller than that,try combining data from two classes.
• Distribute a copy of Height of Students Data Chart to each student. Have students workwith a partner to find their height in inches using a tape measure. When all studentshave measured and recorded their height, ask each to share their height with the class.Students should record the height data on their charts.
• Once data is collected, have students set up number line on paper using a ruler. Use thefollowing intervals.
40”–42”
43”–45”
46”–48”
49”–51”
52”–54”55”–57”
58”–60”
61”–63”
• Have students record each height over the correct interval on the number line.
• When number line plot is complete ask students to write three factual statements aboutthe pattern on data on the plot. They should share and explain their statements,referring to the number line plot in their explanations.
o Extension: Have students increase interval spans and re-plot the data. Askthem to explain the benefits of altering the intervals.
2. Display the words mean, median, range, and mode. Discuss the meaning of each word, havingstudents share their thoughts and ideas.
mean: the average value of a data set
median: the middle number in a data set
Published by Discovery Education. © 2006. All rights reserved.
8/8/2019 DM Using and Collecting Data
http://slidepdf.com/reader/full/dm-using-and-collecting-data 3/21
Discovering Math: Using and Collecting DataTeacher’s Guide 3
range: the difference between the greatest number and the least number in a set of data
mode: the number found most often in a set of data
Display a sample set of numbers and model how to calculate the mean, median, range, and
mode of the data set.• Have students list the data from their Height of Student Data Chart from least to
greatest. Then calculate the mean, median, range, and mode of the data set.
• Discuss the process they used to find the mean, median, range, and mode of the data set.Have them share their thoughts and ideas on why the information is important and howit can be used to summarize the number line plot.
• Have students summarize the number line plot in writing. They should include astatement about the mean, median, range, and mode of the data set in their summary.
3. Display examples of a bar graph, line graph, and circle graph. Ask students to compare thegraphs and share their thoughts on the use of each type.
Bar graphs are used to compare data.
Line graphs are used to show change over time.
Circle graphs are used to show parts of a whole.
Tell students they will be collecting, organizing, and displaying data in bar graphs, line graphs,and circle graphs.
• Distribute a copy of the Bar Graph Data Chart to each student. Survey the class and havestudents share and record their favorite type of book.
• Review the important parts of a bar graph: title, labels on each axis, and an appropriate
scale.• Have students set up bar graph to display the data they collected on their Bar Graph
Data Chart. They should use graph paper to create their bar graph.
• Ask students to write three summary statements about the data in the bar graph. Theycan write statements comparing pieces of the data, identifying the least liked and mostliked type of book, etc.
• Have students share and explain their summary statements with the class.
4. Display a sample line graph and review its format and uses. Tell students they will create a linegraph to display and compare the average monthly temperatures in their city or town (oranother area determined by the teacher if their town is not listed). Assign each student apartner. Have each pair go to www.weatherbase.com and following the links to their city ortown.
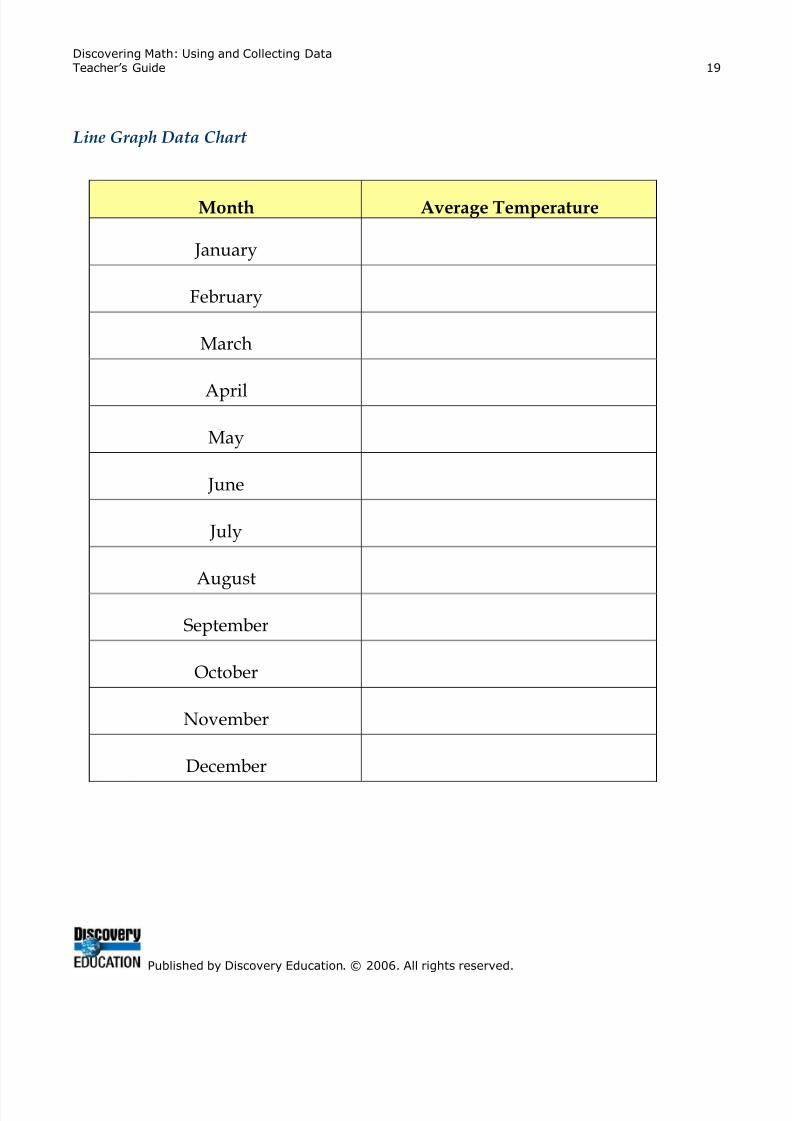
• Distribute a copy of the Line Graph Data Chart to each pair. Have them record theaverage monthly temperature for their chosen area on the chart.
• Review the important parts of a line graph: title, labels on each axis, and an appropriatescale.
Published by Discovery Education. © 2006. All rights reserved.
8/8/2019 DM Using and Collecting Data
http://slidepdf.com/reader/full/dm-using-and-collecting-data 4/21
Discovering Math: Using and Collecting DataTeacher’s Guide 4
• Have each student graph the average monthly temperature data in a line graph.
• Ask each student to write three summary statements about the data in the line graph.They can write statements comparing pieces of data, identifying the lowest or highestmonthly temperature, etc.
• Have students share and explain their summary statements with the class.
5. Display a sample circle graph and review its format and uses. Remind students that each part ofthe circle graph represents part of the whole. Tell students they will create a circle graph todisplay a given data set. Distribute a copy of the Circle Graph Data Chart to each student andexplain the scenario:
A class raised $100 in various fundraisers.
The data chart represents how much money was raised by each fundraising activity.
The students will display the data in a circle graph.
•Discuss the data and ask questions about the whole or parts of the whole.
o How much money did the students raise in all?
o What part of the whole did they raise selling cookies?
o What part of the whole did they raise selling candles?
• Distribute a copy of the Circle Graph Template each student. Ask them to create a circlegraph to display the fundraiser data. Remind students that the circle should be dividedto represent the appropriate part of the whole for each activity.
• Have students write three summary statements about the data in the circle graph. Theycan write statements comparing pieces of data, identifying the activity that raised the
most or least amount of money, etc.• Have student share and explain their summary statements with the class.
6. Ask students to look at the data they collected about favorite book types on the Bar Graph DataChart. Based on their data, ask them to predict the favorite book types of all third, fourth, orfifth grade students. Ask how they made their predictions. Discuss the affects of sample size ondata.
If possible, allow students to survey other classes and organize and display the new data in abar graph.
• Have students compare the class data to the larger sample size data. Ask them how thenew data can help give a more complete picture of favorite book types of third, fourth,or fifth grade students.
• Emphasize the importance of sample size and how it affects the data. When collectingdata on a large population a larger sample size is needed to get more reliableinformation.
Published by Discovery Education. © 2006. All rights reserved.
8/8/2019 DM Using and Collecting Data
http://slidepdf.com/reader/full/dm-using-and-collecting-data 5/21
Discovering Math: Using and Collecting DataTeacher’s Guide 5
Assessment
Use the following three-point rubric to evaluate students’ work during this lesson.
•3 points: Students were highly engaged in class discussions; produced complete charts,graphs, and summaries, including all the requested information; clearly demonstrated theability to collect, organize, and display data in number line plots, bar graphs, line graphs,and circle graphs; and clearly demonstrated an understanding of the effects of sample size.
• 2 points: Students participated in class discussions; produced adequate charts, graphs, andsummaries, including most of the requested information; satisfactorily demonstrated theability to collect, organize, and display data in number line plots, bar graphs, line graphs,and circle graphs; and satisfactorily demonstrated an understanding of the effects of samplesize.
• 1 point: Students participated minimally in class discussions; created incomplete charts,graphs, and summaries, including little or none of the requested information; did notdemonstrate the ability to collect, organize, and display data in number line plots, bargraphs, line graphs, and circle graphs; and did not demonstrate an understanding of theeffects of sample size.
Vocabulary
bar graph
Definition: a graph that uses bars to show and compare data
Context: The students created a bar graph to display and compare the data collected on thenumber of books each person read over the summer.
circle graph
Definition: a graph in the shape of a circle that is divided into areas proportional to percentagesof the whole
Context: Each section of the circle graph represents the part of the class that has brown, blonde,black or red hair.
line graph
Definition: a graph that uses a line to show how data changes over time
Context: Each point on the line graph represents the average monthly temperature so the datacan be easily displayed and compared.
mean
Definition: the average of a data set
Context: The students found the mean of the data set 3, 6, 1, 3, 2 by finding the sum of thenumbers and dividing by 5. The mean of the data set is 3.
Published by Discovery Education. © 2006. All rights reserved.
8/8/2019 DM Using and Collecting Data
http://slidepdf.com/reader/full/dm-using-and-collecting-data 6/21
Discovering Math: Using and Collecting DataTeacher’s Guide 6
median
Definition: the middle number in a data set
Context: The students found the median of the data set 3, 6, 1, 3, 2 by listing the numbers fromleast to greatest and identifying the middle number. The median of the data is 3.
mode
Definition: the number found most often in a data setContext: The students found the mode of the data set 3, 6, 1, 3, 2 by identifying the numberfound most often in the data set. The mode of the data set is 3.
number line plot
Definition: a tool used to organize and display data; a number line labeled in intervals withmarks above each interval to represent a set of data
Context: The students created a number line plot to display the data they collected on the heightof the students in the class.
range
Definition: the difference between the greatest and the least number in a data set
Context: The students found the range of the data set 3, 6, 1, 3, 2 by finding the differencebetween the greatest and least number in the data set. The range of the data set is 5.
sample
Definition: a sub-group of a population used to collect data on the whole population
Context: The researchers used a sample of 100 third grade students to learn about how thirdgraders spend their time after school.
Academic Standards
Mid-continent Research for Education and Learning (McREL)McREL’s Content Knowledge: A Compendium of Standards and Benchmarks for K–12 Educationaddresses 14 content areas. To view the standards and benchmarks, visithttp://www.mcrel.org/compendium/browse.asp.
This lesson plan addresses the following benchmarks:
• Understands that data represent specific pieces of information• Understands that spreading data out on a number line helps to see what the extremes are,
where the data points pile up, and where the gaps are•
Understands that a summary of data should include where the middle is and how muchspread there is around it• Organizes and displays data in simple bar graphs, pie charts, and line graphs• Reads and interprets simple bar graphs, pie charts, and line graphs• Understands that data come in many different forms and that collecting, organizing, and
displaying data can be done in many ways• Understands the basic concept of a sample
Published by Discovery Education. © 2006. All rights reserved.
8/8/2019 DM Using and Collecting Data
http://slidepdf.com/reader/full/dm-using-and-collecting-data 7/21
Discovering Math: Using and Collecting DataTeacher’s Guide 7
National Council of Teachers of Mathematics (NCTM)The National Council of Teachers of Mathematics (NCTM) has developed national standardsto provide guidelines for teaching mathematics. To view the standards online, go tohttp://standards.nctm.org.
This lesson plan addresses the following standards:• Represent data using tables and graphs such as line plots, bar graphs, and line graphs• Describe the shape and important features of a set of data and compare related data sets,
with an emphasis on how the data are distributed• Use measures of center, focusing on the median, and understand what each does and does
not indicate about the data set
• Compare different representations of the same data and evaluate how well eachrepresentation shows important aspects of the data
• Design investigations to address a question and consider how data-collection methods affectthe nature of the data set
Support Materials
Develop custom worksheets, educational puzzles, online quizzes, and more with the free teaching toolsoffered on the Discoveryschool.com Web site. Create and print support materials, or save them to aCustom Classroom account for future use. To learn more, visit
• http://school.discovery.com/teachingtools/teachingtools.html
DVD Content
This program is available in an interactive DVD format. The following information and activities arespecific to the DVD version.
How to Use the DVD
The DVD starting screen has the following options:
Play Video—This plays the video from start to finish. There are no programmed stops, except byusing a remote control. With a computer, depending on the particular software player, a pausebutton is included with the other video controls.
Video Index—Here the video is divided into chapters indicated by title. Each chapter is thendivided into four sections indicated by video thumbnail icons; brief descriptions are noted for eachsection. To play a particular segment, press Enter on the remote for TV playback; on a computer,click once to highlight a thumbnail and read the accompanying text description and click again tostart the video.
Published by Discovery Education. © 2006. All rights reserved.
8/8/2019 DM Using and Collecting Data
http://slidepdf.com/reader/full/dm-using-and-collecting-data 8/21
Discovering Math: Using and Collecting DataTeacher’s Guide 8
Quiz—Each chapter has four interactive quiz questions correlated to each of the chapter’sfour sections.
Standards Link—Selecting this option displays a single screen that lists the national academic
standards the video addresses.Teacher Resources—This screen gives the technical support number and Web site address.
Video Index
I. Data as Information (7 min.)
Data as Information: Introduction
Data is defined as information gathered for a purpose ⎯ to aid decision-making andproblem solving. Data can be qualitative or quantitative.
Example 1: Qualitative Data
Qualitative data gives information about qualities ⎯ color, size, or shape. It can be usedright away to make decisions. Examples of qualitative data are explained.
Example 2: Qualitative and Quantitative DataFarmers gather qualitative and quantitative data on crops. Qualitative data pertains tosoil type and nutrients. Quantitative data pertains to the number of sunny or rainy daysand the crops’ weight.
Example 3: Automated Data Recording Weather forecasters use land stations, ocean stations, and satellites to gather data aboutthe weather. They use the quantitative data to predict weather and upcoming storms.
II. Data Distribution (7 min.)Data Distribution: IntroductionPlotting data is a useful way to organize and understand information. It is important tounderstand the data when making decisions.
Example 1: Number Line PlotsData can be represented on a number line. Placing one dot for each piece of data on thenumber line provides a useful visual representation. A number line is modeled.
Example 2: Stacking Data in Line PlotsStacking data on a number line is a useful way to organize and represent information.By stacking data, more can be plotted, extremes can be identified, and substantial gaps
can be found.Example 3: Line Plots with Wider BinsIncreasing the intervals on the line plot makes data more usable. Although the data isn’tas exact, it is easy to identify patterns and broader groups of information. Broadeningthe intervals is modeled.
Published by Discovery Education. © 2006. All rights reserved.
8/8/2019 DM Using and Collecting Data
http://slidepdf.com/reader/full/dm-using-and-collecting-data 9/21
Discovering Math: Using and Collecting DataTeacher’s Guide 9
III. Summarizing Data (8 min.)
Summarizing Data: IntroductionSummarizing and comparing data is important. Median is the middle number in a dataset, mode is the number occurring most often, and range is the difference between the
greatest and least number in the data.
Example 1: Center and SpreadSummarizing and comparing data by finding the median, mode, and range is modeledand explained. The importance of summarizing data is reiterated.
Example 2: Calculating the MeanCalculating the mean is explained and modeled. The mean is the average value of a dataset. In swimming, the mean is calculated by dividing the total score by the number ofscores.
Example 3: Mean, Median, Range and Overall DistributionA rider’s scores are used to find the mean, median, and range. Normal distribution is
described; in large sets of data, there are fewer low and high numbers as you moveaway from the center value.
IV. Graphing Data (8 min.)
Graphing Data: IntroductionGraphing finance data helps achieve a saving’s goal.
Example 1: Bar GraphsA bar graph compares the different amounts of money earned in three jobs. Creating abar graph is explained and modeled.
Example 2: Circle Graphs
Circle graphs show the parts of a whole and the relationship between each part.Creating a circle graph to show how much time was spent on three jobs is explained andmodeled.
Example 3: Line GraphsA line graph shows change over time. Creating a line graph to show how much moneywas earned over three weeks is explained and modeled.
V. Reading Graphs (8 min.)
Reading Graphs: IntroductionGraphs can be used to see trends and patterns in data. Line graphs, bar graphs, and
circle graphs are used for different purposes.Example 1: Bar GraphsBar graphs compare amounts in different situations. A bar graph is used to compare thetypes of pets that live in U.S. households.
Published by Discovery Education. © 2006. All rights reserved.

8/8/2019 DM Using and Collecting Data
http://slidepdf.com/reader/full/dm-using-and-collecting-data 10/21
Discovering Math: Using and Collecting DataTeacher’s Guide 10
Example 2: Line GraphsLine graphs show change over time by charting one quantity in relation to anotherquantity. The quantities are called variables. A line graph is used to track the number ofpeople who exercise regularly.
Example 3: Circle GraphsCircle graphs show parts of a whole and how the proportions of something make up thewhole. A circle graph is used to show how many collectors in a group collect specificitems.
VI. Collecting and Handling Data (9 min.)
Collecting and Handling Data: IntroductionData is information collected for a purpose. The way data is collected, organized, anddisplayed depends upon the purpose. Data can be used to solve problems and makedecisions.
Example 1: Gathering Numerical DataThe purpose for collecting data will govern the data collected, the way it is collected,how it is analyzed, and the results of the collection.
Example 2: Organizing DataData can be organized by writing a list, making a graph, creating a chart, or in any otherway that makes the data useful and meets the purpose for which it was collected.
Example 3: Displaying DataThe purpose for collecting data determines the way it is displayed. Use a bar graph tocompare, a line graph to show change over time, or a circle graph to show parts of awhole.
VII. Sample Size (8 min.)
Sample Size: IntroductionSamples are used to collect data on populations. A sample is a sub-group of apopulation. The larger the sample size, the more data that can be collected.
Example 1: Sample Size from a Limited PopulationLooking at one member of a population will not give enough information about thewhole population. A larger sample size is more effective for collecting data on a wholepopulation
Example 2: Sample Size from a Larger Population
When collecting data on a population, the larger the sample size, the more likely it willrepresent the whole group and the proportions and distribution of characteristics withinthe group.
Example 3: Reliability Based on Sample SizeWhen collecting data on a very large population, a large sample size is necessary to getreliable information on the specific characteristics and composition of the population.
Published by Discovery Education. © 2006. All rights reserved.
8/8/2019 DM Using and Collecting Data
http://slidepdf.com/reader/full/dm-using-and-collecting-data 11/21
Discovering Math: Using and Collecting DataTeacher’s Guide 11
Quiz
I. Data as Information
1. Sal is gathering information to learn about average temperatures in his town. The
information he is gathering is called _____.A. dataB. qualityC. quantityD. weather
Answer: A
2. Farmer Jones is gathering data on his crops. Which data should he collect if he wantsqualitative data?A. the weight of the crops
B. the inches of rain the crops receivedC. the number of sunny days in the summerD. the type of nutrients added to the soil
Answer: D
3. Farmer Smith is gathering data on his crops. Which data should he collect if he wantsquantitative data?A. the type of soil used on the farmB. the different colors on the leavesC. the amount of rain the crops receivedD. the type of nutrients added to the soil
Answer: C
4. Which data would not be useful to weather forecasters when predicting the weather?A. rainfallB. wind speedC. air temperatureD. day of the week
Answer: D
Published by Discovery Education. © 2006. All rights reserved.
8/8/2019 DM Using and Collecting Data
http://slidepdf.com/reader/full/dm-using-and-collecting-data 12/21
Discovering Math: Using and Collecting DataTeacher’s Guide 12
II. Data Distribution
xx
x xx x x xx x x x x x
x x x x x x x xx x x x x x x x x
1 2 3 4 5 6 7 8 9 10
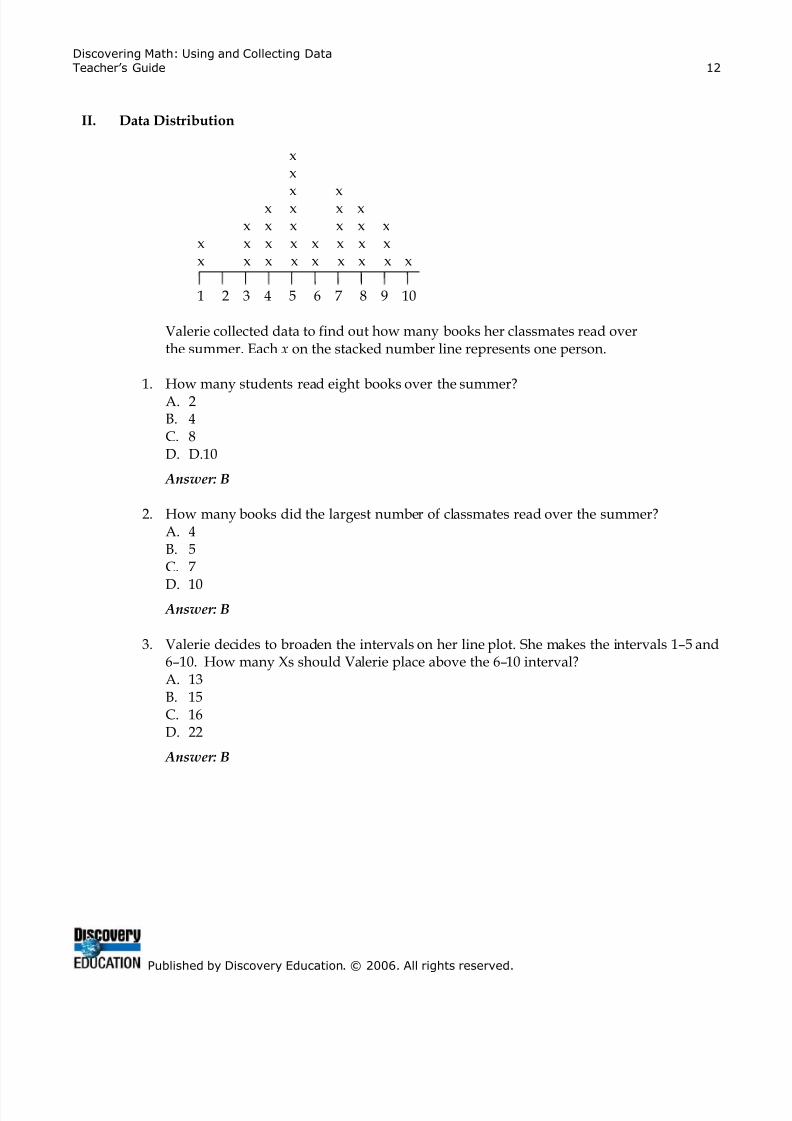
Valerie collected data to find out how many books her classmates read overthe summer. Each x on the stacked number line represents one person.
1. How many students read eight books over the summer?A. 2B. 4C. 8D. D.10
Answer: B
2. How many books did the largest number of classmates read over the summer?A. 4B. 5C. 7
D. 10 Answer: B
3. Valerie decides to broaden the intervals on her line plot. She makes the intervals 1–5 and6–10. How many Xs should Valerie place above the 6–10 interval?A. 13B. 15C. 16D. 22
Answer: B
Published by Discovery Education. © 2006. All rights reserved.
8/8/2019 DM Using and Collecting Data
http://slidepdf.com/reader/full/dm-using-and-collecting-data 13/21
Discovering Math: Using and Collecting DataTeacher’s Guide 13
III. Summarizing Data
1. What is the mode of the data? 5, 5, 6, 6, 6, 7, 9, 10, 11, 11, 13A. 5B. 6C. 11D. 13
Answer: B
2. What is the range of the data? 5, 5, 6, 6, 6, 7, 9, 10, 11, 11, 13A. 5B. 7C. 8
D. 13 Answer: C
3. Jack was in a diving competition. His scores were 7, 8, 7, 9, 6, and 5. What is the mean of Jack’s scores?A. 5B. 6C. 7D. 9
Answer: C
4. Julie recorded how long a rider could stay on a bucking bronco. The rider’s scores were3, 4, 5, 7, 8, and 8. What is the median of the data?A. 5B. 6C. 7D. 8
Answer: B
Published by Discovery Education. © 2006. All rights reserved.

8/8/2019 DM Using and Collecting Data
http://slidepdf.com/reader/full/dm-using-and-collecting-data 14/21
Discovering Math: Using and Collecting DataTeacher’s Guide 14
IV. Graphing Data
1. Which activity takes up the greatest amount of Tara’s time?A. sportsB. readingC. computerD. homework
Answer: A
Tara's Week
0
2
4
6
8
10
12
reading c omputer homework s ports
activity
h o u r s
2. Bruce created a circle graph to compare the amount of time he spends doing chores eachmonth. According to the circle graph, which chore takes the least amount of Bruce’s timeeach month?A. washing dishesB. taking out trashC. washing windowsD. cleaning bedroom
Answer: B
Bruce's Chores
cleaning bedroom
taking out trash
washing dishes
washing windows
3. Margaret created a line graph to show how much money she made each week inFebruary. How much money did she make in Week 3?A. $20B. $35C. $50D. $55
Answer: A
Money Earned in February
$0
$10
$20
$30
$40
$50
$60
Week 1 Week 2 Week 3 Week 4
Week
A m o u n t E a r n e d
Published by Discovery Education. © 2006. All rights reserved.

8/8/2019 DM Using and Collecting Data
http://slidepdf.com/reader/full/dm-using-and-collecting-data 15/21
Discovering Math: Using and Collecting DataTeacher’s Guide 15
V. Reading Graphs
1. Which type of graph is best for comparing different amounts?A. bar graphB. line graphC. circle graphD. number graph
Answer: A
2. Which type of graph is best for showing change over time?A. bar graphB. line graphC. circle graphD. number graph
Answer: B
3. Which type of graph is best for showing parts of a whole and how the proportions ofsomething make up the whole?A. bar graphB. line graphC. circle graphD. number graph
Answer: C
VI. Collecting and Handling Data
1. John wants to collect data to determine the fastest route from his house to Paula’s house.He travels several routes on his bike. What data does he need to determine the fastestroute?A. the names of the roads he tookB. what kind of bike he was ridingC. the time it took to travel each routeD. the distance from his house to Paula’s house
Answer: C
2. Sally collected data on the time it took five people to clean their rooms.Gail……….3 minutes 25 secondsKim……...9 minutes 42 secondsRon……...7 minutes 32 secondsDavid……4 minutes 35 secondsLena….8 minutes 48 seconds
Published by Discovery Education. © 2006. All rights reserved.
8/8/2019 DM Using and Collecting Data
http://slidepdf.com/reader/full/dm-using-and-collecting-data 16/21
Discovering Math: Using and Collecting DataTeacher’s Guide 16
Sally wants to organize the data in a list. She wants to put the name of the person whotook the longest amount of time to clean a room first on the list. Which name shouldSally put first on the list?A. Ron
B. KimC. GailD. Lena
Answer: B
3. Addison wanted to understand how he spends his time every day. He records how longhe spends doing different activities throughout the day. If Addison wants to representhow long he spent doing each activity in relation to the whole day and the otheractivities, how should he display the data?A. in a bar graphB. in a line graph
C. in a circle graphD. on a number line
Answer: C
VII. Sample Size
1. A subgroup of a population that is used to study the characteristics and proportionsamong the whole population is called a _____.A. sampleB. subpopulationC. small population
D. population group Answer: A
2. Which statement about collecting data on a population is correct?A. The larger the sample size, the less data can be gathered.B. The larger the sample size, the more data can be gathered.C. The smaller the sample size, the more data can be gathered.D. The amount of data gathered does not depend upon the sample size.
Answer: B
3. A scientist is studying the range in lengths of earthworms. There are a thousand wormsin the population being studied. What sample size should the scientist use?A. 10 wormsB. 25 wormsC. 50 wormsD. 100 worms
Answer: D
Published by Discovery Education. © 2006. All rights reserved.

8/8/2019 DM Using and Collecting Data
http://slidepdf.com/reader/full/dm-using-and-collecting-data 17/21
Discovering Math: Using and Collecting DataTeacher’s Guide 17
Height of Students Data Chart
Name Height Name Height
Published by Discovery Education. © 2006. All rights reserved.

8/8/2019 DM Using and Collecting Data
http://slidepdf.com/reader/full/dm-using-and-collecting-data 18/21
Discovering Math: Using and Collecting DataTeacher’s Guide 18
Bar Graph Data Chart
Type of Book Number of Students
Mystery
Comedy
Adventure
Nonfiction
Sports
Published by Discovery Education. © 2006. All rights reserved.
8/8/2019 DM Using and Collecting Data
http://slidepdf.com/reader/full/dm-using-and-collecting-data 19/21
Discovering Math: Using and Collecting DataTeacher’s Guide 19
Line Graph Data Chart
Month Average Temperature
January
February
March
April
May
June
July
August
September
October
November
December
Published by Discovery Education. © 2006. All rights reserved.

8/8/2019 DM Using and Collecting Data
http://slidepdf.com/reader/full/dm-using-and-collecting-data 20/21
Discovering Math: Using and Collecting DataTeacher’s Guide 20
Circle Graph Data Chart
Money Raised for Ms. Smith’s Class
Activity Amount Raised
Cookie Sale $25
Penny Collection $10
Car Wash $40
Donations $5
Candle Sale $20
Published by Discovery Education. © 2006. All rights reserved.
8/8/2019 DM Using and Collecting Data
http://slidepdf.com/reader/full/dm-using-and-collecting-data 21/21
Discovering Math: Using and Collecting DataTeacher’s Guide 21
Circle Graph Template