Embed Size (px)
Citation preview

NASA- TRW Document No. 22914010-RU-00
D m Study oJ the
Append-ices to V-me- t Section 7 (Part 2 of 3)
SYSTEPIS DESIGN STUDY OF SPACEC2A?T. APPEHDICES
TO VOLUNZ 1, SLCTION 7 ( P 3 3 T 2 01" 3 ) Final S r n d y B e p o r t (TR!J S y s t l m s Group)
CSCL 22B Unclas I
47C86 - - 1
29 July 1973 e
Contract No. NAS2-7249
Prepared for
AMES RESEARCH CENTER NATIONAL AERONAUTICS AND SPACE ABWItNiSTRATION


LIST OF VOLUMES
VOLUME I. TECHNICAL ANALYSES AND TRADEOFFS
SECTIONS 1-4 (PART 1 OF 4) 1 . Introduction 2. Summary 3. Science Analysis and Evaluation 4. Mission Analysis and Design
VOLUME I. TECHNICAL ANALYSES AND TRADEOFFS
SECTIONS 5-6 (PART 2 OF 4)
5. System Configuration Concepts and Tmdeoffs 6. Spacecraft System Definition
VOLUME I. TECHNICAL ANALYSES AND TRADEOFFS
SECTION 7 (PART 3 OF 4)
7. Probe Subsystem Definition
VOLUME I. TECHNICAL ANALYSES AND TRADEOFFS
SECTIONS 8-12 (PART 4 OF 4)
8. Probe Bus and Orbiter Subsystem Definition and Tmdeoffs 9. NASUESRO Orbiter Interface
10. Mission Operations and Flight Support 11. Launch Vehicle-Related Cost Reductions 12. LongLeadltemsandCriticalAreas
VOLUME I APPENDICES
SECTIONS 3-6 (PART 1 OF 3)
VOLUME I APPENDICES
SECTION 7 (PART 2 OF 3)
VOLUME I APPENDICES
SECTIONS 8-1 1 (PART 3 OF 3)
VOLUME I I. PRELIM1 NARY PROGRAM DEVELOPMENT PLAN
VOLUME Ill. SPECIFICATIONS

NASA TRW Document No. 2291-6010-RU-00
Systems Design Study oJ the Pioneer V e n ~ Spacecran Final Study Report
Appendices to Volume I Section 7 (part 2 of 3)
29 July 1973
Contract No. NAS2-7249
Prepared for
AMES RESEARCH CENTER NATIONAL AERONAUTICS AND SPACE ADMINISTRATION
TRW S ' s r E U s CI1O"P

CONTENTS
SECTION 7 APPENDICES
Appendix 7. i A . Aeroheating of Sphere Cones and Spherical Segment P robes During Venus Ent ry
Appendix 7. iB. Effect of Aerodynamic Coefficients, Iner t ia l Proper t ies , and Roll Rate on the Dynamic Stability of Conical Probes
Appendix 7. iC. Wind Tunnel Tes t Results
Appendix 7.2A. P re l imina ry Evaluation of Teflon a s a Reflecting Heat Shield for Venus Ent ry
Appendix 7.4A. P r e s s u r e Shell Tempera ture Gradients with Concentrated Insulation Penetrations
Appendix 7. 5A. Parachute Sizing Analysis Summaries
Appendix 7.6A. Communications and Tracking Using Lognormal C a r r i e r s
Appendix 7.6B. Discussion on Communications Channel Models
Appendix 7. 6C. Uncoded E r r o r Probabili ty Per formance Comparisons for Lognormal and Rician Channel Models
Appendix 7. 60. Per formance and Selection of a Coding Method f o r Pioneer Venus Ent ry Probes Using PSK/PM Modulation
Appendix 7. 6E. Multiple Frequency Shift Keying (MFSK) with Convolutional E r r o r Correcting Coding
Appendix 7. 6F. Radio Absorption and Defocusing Losses in the Venus Atmosphere
Appendix 7. 6G. Planet Backscat ter Multipath Analysis
Appendix 7. 6H. Telecommunications Design Control Tables for a ThorlDelta Mission
Appendix 7. 61. (This Appendix was Deleted)
Appendix 7.65. Antennas Per formance Tes t s with Antenna Mounted on Large Probe Mockup

CONTENTS (CONTINUED)
Appendix 7. 6K. (This Appendix was Deleted)
Appendix 7. 6L. Tradeoff Analysis of One-Way Versus Two-Way Doppler Tracing Hardware Implementation
Appendix 7. 6M. Probe Telecommunications Design Control Tables, Atlas/Centaur Mission 1978 Arr iva l
Appendix 7. 8A. Probe Bat te ry Analysis and Selection
Appendix 7. 8B. Regulated Versus Unregulated Power Bus

ACRONYMS AND ABBREVIATIONS
abA
AC
AfC
ADA
ADCS
ADPE
AEHS
AEO
AEDC
AF
AGC
AgCd
Ago AgZn
ALU
AM
a.m.
AMP
APM
ARC
ARO
ASK . .
at. wt
ATM
ATRS
AU
AWG
AWGN
B
B
BED
ampere analog
abampere
alternating current
Atlas/ Centaur
avalanche diode amplifier
attitude determination and control subsystem
automatic data processing equipment
advanced entry heating simulator
aureolefextinction detector
Arnold Engineering Development Corporation
audio frequency
automatic gain control
silver-cadmium
silver oxide
silver zinc
authorized limited usage
amplitude modulation
ante meridian
amplifier
assistant project manager
Ames Research Center
after receipt of order
amplitude shift key
atomic weight
atmosphere
attenuated total refractance spectrometer
astronomical unit
American wire gauge
additive white gaussian noise
bilevel
bus (probe bus)
bus entry degradation

BER
BLIMP
BPIS
BPL
BPN
bps BTU
C
CADM
C&CO
CCU
CDU
CEA
CFA
c. g c.g.
CIA
CKAFS
c m
c.m.
C/M
CMD
CMO
C -MOS
C MS
COSMOS
C.P.
C PSA
CPSS
bit e r r o r rate
boundary layer integral matrix procedure
bus-probe interface simulator
bandpass limiter
boron potassium nitrate
bits per second
British thermal unit
Canberra tracking station - NASA DSN
configuration administration and data management
calibration and checkout
central control unit
command distribution unit
control electronics assembly
crossed field amplifier
centigram
center of gravity
counting/integration assembly
Cape Kennedy Air Force Station
centimeter
center of mass
current monitor
command
configuration management office
complementary metal oxide silicon
configuration management system
constant construction
complementary metal oxide silicon
center of pressure
cloud particle size analyzer
cloud particle size spectrometer
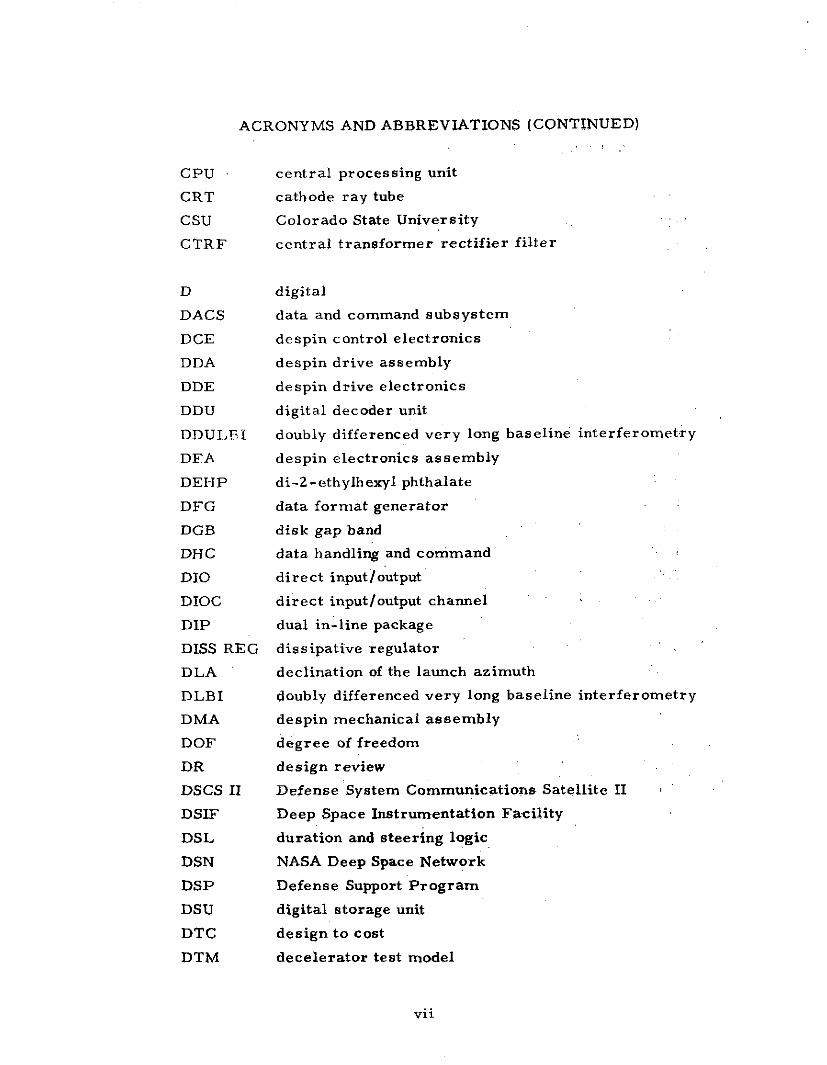
ACRONYMS AND ABBREVIATIONS (CONTINUED)
CPU cen t r a l processing unit
CRT cathode r ay tube
CSU Colorado State University
CTRF cent ra l t ransformer rec t i f ie r f i l t e r
D
DACS
D CE
DDA
DDE
DDU
DDULF i
DFA
DEHP
DFG
DGB
DHC
D l 0
DIOC
DIP
DISS REG
DLA
DLBI
DMA
DOF
DR
DSCS I1
DSIF
DSL
DSN
DSP
DSU
DTC
DTM
digital
data and command subsys tem
despin control e lectronics
despin dr ive assembly
despin dr ive electronics
digital decoder unit
doubly differenced ve ry long baseline in te r fe romet ry
despin electronics assembly
di-2-ethylhexyl phthalate
data fo rma t generator
disk gap band
data handling and command . . , .
d i r ec t input/output
d i r ec t input/output channel
dual in-line package
dissipative regulator
declination of the launch azimuth , .
doubly differenced ve ry long baseline interferometry
despin mechanical assembly
deg ree of freedom
design review
Defense Sys tem Communications Satell i te I1 '
Deep Space Instrumentation Faci l i ty
duration and steering logic . .
NASA Deep Space Network
Defense Support P r o g r a m
digital storage unit
design t o cost
dece le ra tor test model

ACRONYMS AND ABBREVIATIONS (CONTINUED)
DTP
DTU
DVU
EDA
EGSE
EIRP
E MC
EM1
EO
E OF
EOM
E P
E SA
ESLE
E SRO
E TM
E TR
EXP
F F T
FIPP
FMEA
F OV
F P
FS
FSK
FTA
descent timer/programmer
digital telemetry unit
design verification unit
encounter entry
electronically despun antenna
electrical ground support equipment
effective isotropic radiated power
electromagnetic compatibility
electromagnetic interference
engineering order
end of f rame
end of mission
earth pointer
elastomeric silicone ablator
equivalent station e r ro r level
European Space Research Organization
electrical test model
Eastern Test Range
experiment
fast Fourier transform
fabricationlinspection process procedure
failure mode and effects analysis
field of view
fixed price frame pulse (telemetry)
federal stock
frequency shift keying
fixed time of arr ival

ACRONYMS AND ABBREVIATIONS (CONTINUED)
g G&A
GCC
GFE
GHE
GMT
GSE
GSFC
H
HFFB
HPBW
htr
HTT
I
LA
IC
ICD
IEEE
IFC
IFJ
I M P
110 IOP
IR
IRAD
IRE
IS T
I&T
I-v
Goldstone Tracking Station - NASA DSN gravitational acceleration
gravity
general and administrative
ground control console
government furnished equipment
ground handling equipment
Greenwich mean time
ground support equipment
Goddard Space Flight Center
Haystack Tracking Station - NASA DSN
Ames Hypersonic Free Flight Ballistic Range
half-power beamwidth
heater
heat transfer tunnel
current
inverter assembly
integrated circuit
interface control document
Institute of Electrical and Electronics Engineering
interface control document
in-flight jumper
interplanetary moniloring platform
input / output
input/output processor
infrared
independent research and development
infrared interferometer spectrometer
integrated system test
integration and test
current-voltage

ACRONYMS AND ABBREVIATIONS (CONTINUED)
J P L
KSC
L
LD/AD
L P
LPM
LPTTL MSI
LRC
M
MAG
m ax
MEOP
MFSK
MGSE
MM
MIC
min
MJS
MMBPS
MMC
MN
mod
MOI
MOS LSI
MP
MSFC
MPSK
M SI
MUX
MVM
Jet Propulsion Laboratory
Kennedy Space Center
launch
launch date /arr ival date
large probe
lines per minute
low power transistor-transistor logic medium scale integration
Langley Research Center
Madrid tracking station - NASA DSN
magnetometer
maximum
maximum expected operating pressure
M'ary frequency shift keying
mechanical ground support equipment
mechanical handling
microwave integrated circuit
minimum
Mariner Jupiter-Saturn
multimission bipropellant propulsion subsystem
Martin Marietta Corporation
Mach number
modulation
moment of inertia
metal over silicone large scale integration
maximum power
Marshall Space Flight Center
M'ary phase shift keying
medium scale integration
multiplexer
Mariner Venus-Mars

ACRONYMS AND ABBREVIATIONS (CONTINUED)
NAD Naval Ammunition Depot, Crane, Indiana
N/A not available
NiCd nickel cadmium
NM/IM neutral mass spectrometer and ion mass spectrometer
NRZ non-return to zero
NVOP normal to Venus orbital plane
OEM other equipment manufacturers
OGO Orbiting Geophysical Observatory
OIM orbit insertion motor
P
PAM
PC
PCM
PCM- PSK -PM
PCU
PDA
PDM
PI
PJU
PLL
PM
p.m.
P -MOS
PMP
PMS
PMT
PPM
PR
PROM
PSE
power
pulse amplitude modulation
printed circuit
pulse code modulation
pulse code modulation-phase shift keying- phase modulation
power control unit
platform drive assembly
pulse duration modulation
principal investigator proposed instrument
Pioneer Jupiter-Uranus
phas'e -locked loop
phase modulation
post meridian
positive channel metal oxide silicon
parts, materials, processes
probe mission spacecraft
photomultiplier tube
parts per million pulse position modulation
process requirements
programmable read-only memory
program storage and execution assembly

ACRONYMS AND ABBREVIATIONS (CONTINUED)
PSIA
PSK
PSU
PTE
QOI
QTM
RCS
REF
R F
RHCP
RHS
RMP-B
RMS
RMU
ROM
RSS
R T
RTU
S
SBASI
SCP
SCR
SCT
SEA
SFOF
SCLS
SHIV
SLR
SLRC
pounds per square inch absolute
phase shift key
Pioneer Saturn-Uranus
probe test equipment
quality operation instructions
qualification test model
reaction control subsystem
reference
radio frequency
right hand circularly polarized
reflecting heat shield
Reentry Measurements Program, Phase B
root mean square
remote multiplexer unit
read only memory rough order of magnitude
root sum square
retargeting
remote terminal unit
separation
single bridgewire Apollo standard initiator
stored command programmer
silicon controlled rectifier
spin control thrusters
shunt electronics assembly
Space Flight Operations Facility
space ground link subsystem
shock induced vorticity
shock layer radiometer
shock layer radiometer calibration

ACRONYMS AND ABBREVIATIONS (CONTINUED)
SMAA
SMIA
SNR
SP
SPC
SPSG
SR
SRM
SSG
SSI
STM
STM/TTM
STS
sync
TBD
TCC
T/D
TDC
TEMP
TS
TTL MSI
TLM
TOF
TRF
TTM
T/V
TWT
TWTA
semimajor axis
semiminor axis
signal to noise ratio
small probe
sensor and power control
spin sector generator
shunt radiator
solid rocket motor
Science Steering Group
small scale integration
structural test model
structural test modeltthermal test model
system test set
synchronous
to be determined
test conductor's console
Thor/Delta
telemetry data console
t emperahre
test set
transistor-transistor logic medium scale integration
telemetry
time of flight
tuned radio frequency
thermal test model
thermo vacuum
travelling wave tube
travelling wave tube amplifier
UHF ultrahigh frequency
UV ultraviolet

VAC
VCM
VCO
VDC
VLBI
VOI
VOP
VSI
VTA
XDS
ACRONYMS AND ABBREVIATIONS (CONTINUED)
volts alternating current
vacuum condensable matter
voltage controlled oscillator
volts direct current
very long baseline interferometry
Venus orbit insertion
Venus orbital plane
Viking standard initiator
variable time of arrival
Xerox Data Systems

SECTION 7 APPENDICES
Appendix 7. iA. A e r o h e a t i n g of S p h e r e C o n e s a n d S p h e r i c a l S e g m e n t P r o b e s Dur ing V e n u s E n t r y
Appendix 7. 1B. E f f e c t of A e r o d y n a m i c Coef f i c ien t s , I n e r t i a l P r o p e r t i e s , a n d R o l l R a t e on t h e Dynamic Stabi l i ty of C o n i c a l P r o b e s
Appendix 7. IC. Wind Tunne l T e s t R e s u l t s
Appendix 7. 2A. P r e l i m i n a r y Eva lua t ion of Tef lon a s a Ref lec t ing H e a t Sh ie ld f o r Vcnus E n t r y
Appendix 7. 4A. P r e s s u r e S h e l l T e m p e r a t u r e G r a d i e n t s w i t h C o n c e n t r a t e d Insu la t ion P e n e t r a t i o n s
Appendix 7. 5A. P a r a c h u t e S iz ing A n a l y s i s S u m m a r i e s
Appendix 7. 6A. C o m m u n i c a t i o n s a n d T r a c k i n g Using L o g n o r m a l C a r r i e r s
Appendix 7. 6B. D i s c u s s i o n on C o m m u n i c a t i o n s Channe l M o d e l s
Appendix 7. 6C. Uncoded E r r o r P r o b a b i l i t y P e r f o r m a n c e C o m p a r i s o n s f o r L o g n o r m a l a n d R i c i a n Channe l M o d e l s
Appendix 7. 6D. P e r f o r m a n c e and Se lec t ion of a Coding Method f o r P i o n e e r Venus E n t r y P r o b e s Using P S K I P M Modula t ion
Appendix 7. 6E. Mul t ip le F r e q u e n c y Shift Keying (MFSK) with Convolut ional E r r o r C o r r e c t i n g Coding
Appendix 7. 6F. R a d i o A b s o r p t i o n and Defocusing L o s s e s in t h e Venus A t m o s p h e r e
Appendix 7. 6G. P l a n e t B a c k s c a t t e r Mul t ipa th A n a l y s i s
Appendix 7. 6H.
Appendix 7. 61.
Appendix 7. 6J.
Appendix 7. 6K.
Appendix 7. 6L.
Appendix 7. 6M.
Appendix 7. 8A.
Appendix 7. 8B.
T e l e c o m m u n i c a t i o n s Design C o n t r o l T a b l e s f o r a T h o r I D e l t a M i s s i o n
( T h i s Appendix w a s Deleted)
Antennas P e r f o r m a n c e T e s t s wi th Antenna Mounted on L a r g e P r o b e Mockup
( T h i s Appendix w a s De le ted)
Tradeof f A n a l y s i s of One-Way V e r s u s Two-Way Dopple r T r a c i n g H a r d w a r e I m p l e m e n t a t i o n
P r o b e T e l e c o m m u n i c a t i o n s Des ign C o n t r o l T a b l e s , A t l a s I C e n t a u r M i s s i o n 1978 A r r i v a l
P r o b e B a t t e r y Ana lys i s a n d S e l e c t i o n
R e g u l a t e d V e r s u s U n r e g u l a t e d P o w e r Bus

APPENDIX 7. 1A
AEROHEATING O F S P H E R E CONES AND SPHERICAL
SEGMENT PROBES DURING VENUS ENTRY
1. S u m m a r y
2. Analys i s
3. L R C C o m p a r i s o n
4. Nomenc la tu re
5. R e f e r e n c e s

APPENDIX 7. 1A
AEROHEATING OF SPHERE CONES AND SPHERICAL SEGMENT PROBES DURING VENUS ENTRY
1. SUMMARY
'The procedures for predicting the aeroheating environment of Venus
entry probes a r e outlined herein. After some consideration, a number of
assumptions were adopted in order to make the prediction techniques t r a c -
table. Among these assumptions a r e thermochemical equilibrium, un-
coupled radiative and convective p rocesses , and uncoupled ablation products
effects. The single s t r ip method of integral relations, appropriately con-
strained, i s shown to provide adequate inviscid resu l t s a s a bas is for heat-
ing calculations on blunt configurations. Techniques fo r prediction of the
laminar , transit ional, and turbulent convective environment a r e outlined
and shown to ag ree with data. The prediction of radiative heating in C , N,
and 0 gas mixtures i s discussed and a prac t ica l scheme adopted. A com-
parison with LRC calculations i s made. >
2 . ANALYSIS
Science measurement requirements dictate high drag shapes f o r many
planetary entry probe missions. A family of forebody configurations that
has been extensively studied for this purpose i s the l a rge ang lesphere
cones, including spherical segments ( ze ro length cone) a s members of the
family. The present discussion will be l imited to these geometries. A
schematic of a p r o b e and i t s associated flow field i s shown in Figure 7. 1A-1.
Although most of the computer p rograms developed for the aerothermochem-
ical analysis a r e for gases of a r b i t r a r y elemental composition, resu l t s will
be confined to C02-NZ mixtures with CO the p r imary component (90 -100%). 2 This corresponds to the composition range present ly proposed for the Venus
, .
atmosphere (Reference 1). The gases a r e considered to be in thermochem- . ,
i ca l equilibrium. At the velocities and f r e e s t r e a m densities encountered , I
in Venus entry near peak heating t imes,. shock layer gas par t ic le collision
frequencies a r e sufficiently high to ensure chemical equilibrium. Although . . . . . . the proper chemical sys tem and react ion model for nonequilibrium Vellus
entry analysis i s not c l ea r and react ion ra te data a r e uncertain, a recent
study (Reference 2) has indicated that the assumption of equilibrium

Figure 7.1A-1. Assumed Flow Field Model
chemis t ry during the maximum heating period i s valid. F r o m a convective
heating standpoint, this assumption is probably conservative, depending on
the wall catalicity used in the boundary layer analysis. Nonequilibrium
conditions resul t in higher tempera tures i n portions of the shock layer and
possible attendant local i nc reases in radiative intensity. As with super-
orbi ta l entry into ea r th (Reference 3 ) , nonequilibrium effects a r e a l so
a s sumed unimportant for engineering predictions of Venus entry radiative
heating. An efficient chemical equilibrium procedure for a rb i t r a ry gas
mix tu res (Reference 4) has been used in most instances to provide the neces-
sa ry thermochemical data and species population resul ts . The t ransport
proper t ies a r e evaluated simultaneously with the techniques of Bartlett ,
e t a l . , (Reference 5) used extensively i n complex viscous calculations - - (Reference 6).
The necessary heating environment resu l t s f o r heat shield design
a r e cold wall, no-blowing convective and radiative heating ra te histories.
Convection and radiation a r e computed in a n uncoupled manner in the p r e - sent analysis. The reduction i n convective heating due to nonadiabatic
shock l aye r effects i s assumed negligible. The radiative calculations,
however, a r e modified to approximately account for these effects. The
reduction in incident radiation due to the presence of ablation products i s
a l so ignored. Recent studies (Reference 7) show that the modest m a s s
l o s s r a t e s of a typical carbonaceous ma te r i a l during Venus entry reduce
radiative heating by l e s s than 1070 for the t r a j ec to r i e s of interest .

2. 1 Inviscid Calculations
Consider the family of large angle sphere cones. For a sufficiently
slender sphere cone, the sonic point on the body occurs on the spherical
section and the cone region i s entirely supersonic. A number of analytical
techniques a r e available to analyze this situation. Among those for the sub-
sonic regime a r e the inverse methods (References 8 and 9) where a body
shape i s determined f rom a given shock shape. Results f rom this a r e
coupled with the method of characteristics (Reference 10) for the supersonic
portion of the flow. The direct methods, i. e . , a given body shape, a r e
represented in part by the method of integral relations (References 11, 12
and 13) and time dependent techniques (References 14 and 15). This last
method has perhaps the most promise for analyzing complex shapes and
including all the physical processes possibly important in planetary entry
such a s radiative transport, nonequilibrium chemistry, etc. When the cone
angle becomes sufficiently large, the sonic point moves off the sphere and
the transition f rom sub- to supersonic flow occurs in a singular manner a t
the aft corner. In this case a rapid drop in pressure to the sonic value
occurs near the corner. Simple Newtonian results will not predict this
drop which can be important both ae ro - and thermodynamically. In addition,
the shock layer may be thicker than approximate calculations based on a
supersonic forebody would indicate, with the result that radiative heating
to the body might be underestimated. Inverse methods a r e not easily adapted
to the problem because of the corner singularity.
The time dependent procedure i s well suited to the problem; however,
it i s expensive in t e rms of computing time and no program i s presently
available that includes the rea l gas effects currently sought. The method
of integral relations is particularly well suited to the present problem, i. e . ,
blunt bodies with sharp sonic corners at zero angle of attack. A number of
investigators have addressed this particular problem (References 16, 17
and 18) in each case for an ideal gas. Extension of the technique to an
equilibrium gas mixture i s straightforward requiring only a sufficiently
efficient chemical equilibrium procedure for arbi t rary gas mixtures (Ref-
erence 4). The basic method (Reference 19), in theory, can be extended to
any order of accuracy by dividing the shock layer into enough strips. For a
parametric study of planetary entry, the primary shock properties required

a r e a good representat ion of the surface p r e s s u r e distribution for convective
heat t ransfer studies and aerodynamics, and accura te shock layer thickness
calculations for radiative heat t r ans fe r predictions. Application of the
method of integral relations has shown that these two quantities a r e quite
accurately given by the single s t r i p o r f i r s t approximation to the method of
integral relations provided c a r e i s taken in the stagnation region. A com-
puter program, SSMIR (Single Str ip Method of Integral Relations), has been
developed for solution of the appropriate equations for axisymmetr ic bodies
with sharp sonic corners in an equilibrium flow of an a r b i t r a r y elemental
composition. If the cone angle i s low enough so that the body sonic point
occurs on the spherical sec tor , an inverse solution coupled with the method
of charac ter i s t ics in pure GO2 a t chemical equilibrium provides this i n -
viscid flow field resu l t s required.
The present p rograms and resul ts a r e for axisymmetr ic bodies a t
z e r o angle of attack. Es t imates of angle of attack during periods of signifi-
cant heating during Venus entry indicate that they will be smal l ( l e s s than 5
degrees) . Windward and leeward p res su re and shock standoff distributions
have been approximated with the equivalent cone assumption ( e C
= e c L a ) using the programs just descr ibed. eff
The SSMIR program provides resu l t s only to the body sonic point.
In order to study the effect of co rne r radius on the convective environment,
a p r e s s u r e distribution around the corner i s required. A procedure was
devised for predicting this distribution that involves a matching between the
SSMIR resul t s and a Newtonian-like variation to a calculated minimum
value. F igure 7. 1A-2 compares this prediction procedure with experi-
mental data (Reference 21) for the Apollo shape. The agreement i s seen
to be quite good, giving confidence that the same matching procedure can
be applied to other configurations of interest . Also shown a r e resu l t s
f r o m a Prandt l-Meyer expansion analysis. This prediction procedure
was not a s successful.

'8-0.417 0.6
Cc = 0.M2
- MMC 0 MSFC a
~ a a ~ o n - m t r r a M--o
0 0 0.1 0.2 0.3 b, 0.4 0.5
SLMFACE LOCATION. s ,
Figure 7.lA-2 A Comparison of Analytical and Experimental Pressure Dislribution Results for tk Apollo Conligurdfon
2 .2 Convective Processes
A common assumption made in calculating convective loads to entry
bodies i s that the body streamline in an inviscid flow field calculation can
be used a s a boundary layer edge streamline for predicting the viscous
flow field. If the body i s sufficiently blunt, the assumption i s good; i. e . ,
boundary layer edge properties a r e properly based on flow that has passed
through the normal or near-normal portion of the bow shock. As the
boundary layer grows along the body; however, mass i s entrained until
finally flow lhat has passed through more oblique sections of the shock
enters the boundary layer. In passing through a weaker shock, l e ss energy
i s lost, and boundary layer edge velocities will be higher. This condition
leads to increased boundary layer gradients, and consequently, higher con-
vective heating and shear s tress. Ear l ier studies (References 22 and 23)
have indicated the importance of including the effects of this boundary layer
swallowing on the convective heating and shear levels during Venus entry.
Basic to the present procedure for estimating the vorticity effect i s
that the boundary layer equations apply; i. e . , the Reynolds number i s suf-
ficiently high that the shock layer can be conceptually divided into an in -
viscid and a viscous layer. The solution of the inviscid flow field provides
the edge boundary conditions which (along with the wall conditions) a r e >
necessary for solution of the boundary layer equations. No perturbations
of the inviscid flow due to boundary layer growth a r e considered. The ef-
fect of bow shock induced vorticity in this case can be accounted for by
determining a t any body location the boundary layer edge streamline shock

entry point (Figure 7. 1A-1) by mass balance considerations. Equating the
mass flow rates through the shock and in the boundary layer yields r S '
the edge streamline shock entry radius. With the shock shape and body
pressure known from a n inviscid solution, conditions behind the shock
a r e found with the shock equations, and a subsequent isentropic expansion
to the body pressure leads to the boundary layer edge conditions. This
procedure i s of course only a f i rs t order analysis of viscous-inviscid
interaction. However, i t s application to predictions of convective loads
has been extremely useful and has led to quite good results.
For present purposes, locally similar boundary layer solutions a r e
applicable thus simplifying the total problem solution. Considering f i rs t
laminar flow, the following similarity variables a r e introduced.
where, a s noted in the Nomenclature, a l l distances a r e normalized by the
nose radius. F rom the mass balance equations
where the definition of the momentum thickness Reynolds number i s
and the modified Blasius value for the integral i s used.

In evaluating the heat t ransfer and shear s t r e s s a t the wall t he re i s
qC = hc (Hr - Hw)
where the modified Reynolds analogy has been used. For laminar flow,
the heat t ransfer distribution of Lees (Reference 24) i s applied, i. e
Any of the well known correlations (e. g.. References 25. 26, 27 and 28),
may be user! t o evaluate the stagnation point heat t ransfer coefficient hLo.
The correlation of Hoshizaki (Reference 25) i s used in the present work.
It i s a careful study of stagnation point heat t ransfer in pure CO a t hyper- 2 sonic velocities and i s given by
For present purposes the value of f in the shock radius equation i s W
assumed zero, i. e . , t he re i s no m a s s t ransfer through the wall. Note that,
because of the negative sign in the wall s t r e a m function equation, the effect
of blowing m a s s t ransfer is to increase the vorticity effect by thickening
the boundary layer.
The locally s imilar solution of Bromberg -- et a l . , (Reference 29) a s
modified by Hearne (Reference 30) i s used for the turbulent calculation.
F r o m these analyses, using the modified Reynolds analogy and the integral
energy equation, there i s

and
with
The distribution of turbulent heat t ransfer coefficient over the body is
The reference value of turbulent heat t ransfer coefficient h is given by T o
with
Determination of the beginning of boundary layer t ransi t ion i s a dif-
ficult problem. No reasonable transit ion cr i te r ion can possibly include a l l
of the pertinent var iables that effect the transit ion process . A common
cr i te r ion for the beginning of transit ion i s a cr i t ical value of laminar
momentum thickness Reynolds number. A cr i te r ion especially for blunt
body, low Mach number flow fields has been developed (Reference 31) in
which the c r i t ica l Re has been cor re la ted f rom ground and flight tes t data 8
a s a function of edge Mach number M and a shock induced vorticity pa ram- e
e t e r NvL defined herein a s

This parameter , an inverse Reynolds number, decreases during entry.
The cri ter ia i s depicted in Figure 7. 1A-3. The increased boundary layer
stability with increasing Mach number for all NvL i s noted. The effect of
shock induced vorticity i s seen to be destabilizing a s the critical Reynolds
number increases with decreasing NvL. A constant value of Re independent e of other parameters has also been used a s a transition criterion.
Figure 7.1A-3. Blunt Body Boundary Layer Tramllkon Crlerion
The convective heating in the transition regime i s determined by the
extension of Emmons spot theory (Reference 32) a s outlined by Chen and
Thyson (Reference 33) . In this procedure an intermittancy factor i s
defined a s

where the subscript t denotes the start of transition and G i s the spot for- t mation rate parameter. Following the development of Reference 33, this
parameter can be represented by
where 1.92
A = 60 t 4.68 Me t
The heat transfer rate i s then determined from the relation
The intermittancy i s also used to calculate r S pTW
and Re in the transition e
regime.
The procedure i s then straightforward. An initial value of r i s s obtained from a stagnation point limiting analysis. Starting a t the stagna-
tion point, 5 and < a r e obtained by integration along the body and r the s ' edge streamline shock entry radius, i s found from the appropriate relation.
With this value of r s , the shock angle Bis determined, a shock solution per -
formed, and an isentropic expansion made to the known body pressure thus
establishing the boundary layer edge conditions. The procedure i s continued
down the body using the shock radius extrapolated from the previous point
to evaluate edge properties. A computer program SHIV (Shock Induced
Vorticity) has been developed to perform these operations for a gas of
arbitrary elemental composition in equilibrium.
The axisymmetric analog (Reference 34) has been used for a number
of years to obtain approximate solutions to the three -dimensional boundary
layer equations. To apply the procedure, the metric h describing the
streamline divergence must be determined and used to replace r , the radial
coordinate i n the appropriate flow equations. The difficulty lies in that h i s
a function of the inviscid flow and not geometry alone. In flows for which
there i s a plane of symmetry. e. g. , the windward or leeward generators of
the present probes, considerable simplification occurs and a complete three-
dimensional inviscid solution i s not required. Techniques for determination

of h a r e well developed (Reference 35) including the effects of boundary
layer swallowing (References 30 and 31). Design angle of attack calcula-
tions will include these procedures. Sensitivity studies, however, have
been conducted with equivalent cone procedures (Reference 36), that i s ,
without including the crossflow terms. The correct trends, i f not exact
values, can be predicted. The most notable result of the study was the
effect on boundary layer transition, delaying i t on the windward and pro-
moting it on the leeward side.
Application of the foregoing procedure using the SHIV program to
recent ground test data (Reference 37) i s demonstrated in Figure 7. 1A-4.
Shown a r e nondimensional cold wall heat transfer distributions on the
spherical section of a slender sphere cone configuration. The basic study
reported on in the reference was one of transitional and turbulent heat
transfer measurements on a yawed blunt conical nosetip. At the highest 6
freestream Reynolds number based on nose radius [(IO. 1 (10 )], data from
the entire angle of attack range (0 - 21 degrees) a r e included in the data band
as measured from the most forward body point. The data on the spherical
section should be self similar in this coordinate system. Transition in the
SHIV program was forced at the point determined from the data. It i s noted
in the reference that premature transition, evidently caused by surface 6
roughness, occurred at the lowest Reynolds number [2.42 (10 ) ] shown.
It i s felt that the SHIV results provide a reasonable, slightly conservative,
representation of the data. Although entropy swallowing was included, i t s
effect was small, less than a 5% increase in heating at the farthest aft posi-
tion shown. The transitional heating procedure gives an adequate prediction
of the distribution. The artificially tripped data a r e matched most success-
fully.
Results from the SHIV program when applied to a contemplated Pioneer
Venus large probe configuration a r e given in Figure 7. 1A-5. Both cold wall
no-blowing heating rate and shear s t ress distributions a r e depicted. The
freestream conditions provide a more severe environment than present launch
dates would support but were chosen to demonstrate the convective environ-
ment prediction procedure. The basic analysis i s denoted by the most
prominent solid line. Comparing this result with those of an isentropic
boundary layer edge shows the large effect of shock induced vorticity.

&=5 .0
?, 'b.35CM
- snlv S DATA BAND (REFERENCE 3 I )
I 0
J 0.2 0.4 0.6 0.8
WFACE LOCATION, . figure 7. 1A-4. Comparison of Analytical and Exprimentdl
Convedive Ireding Distributions on a Spherical Salment
- BASIC SHIV
ISENlIOPIC EDGE b = 2 m
----- NO lQANSlllON REGION
0 0.4 0.1 1 .O I .b 2.0
SWACE LOCATION,
Figure 1.111-5. Dirlributionof Cold Wall tb-Bbwing Convective
Hslting R l e m d Shur Strerr

While the laminar nose i s affected l i t t le a t these f r e e s t r e a m condi-
tions by boundary layer swallowing, the much l a r g e r growth ra te of the
turbulent boundary layer leads to a l a rge vortici ty effect. Peak heating
r a t e s aft on the body a r e m o r e than twice a s l a rge and shear s t r e s s (even
m o r e sensit ive to edge velocity) nearly five ' t imes a s l a rge a s those values
computed with a n isentropic edge. A ze ro length t ransi t ion region s e r v e s
only to a l t e r the distribution until fully dev,eloped turbulent heating i s
established. A t ransi t ion cr i ter ion of Re = 250 independent of edge Mach 8
number leads to l a t e r t ransi t ion in this case . Peak heating on the body i s
s t i l l unaffected.. Note that while the isentropic edge r e su l t s show the ex -
pected inc rease i n both heating and s h e a r a s the p r e s s u r e drops near the
body base to the sonic point, the values including boundary layer swallow-
ing do not exhibit a r i s e but instead follow the p r e s s u r e distribution. The
l a r g e edge vet-ocity in the la t te r case leads to a lower potential for high
edge velocity gradients in the corner region. The higher convective environ-
ment expected a t the co rne r may not exist. Initial corner resu l t s have
been obtained for the Apollo configuration a t the t ime of p e a k stagnation
point heating. This geometry was chosen for the initial study because of
the experimental resu l t s for both p r e s s u r e and heating distribution that
were available (Reference 21). The p r e s s u r e prediction was a l ready
shown to be i n good agreement with the data (F igu re 7. 1A-2). 'Two different
analytical p rocedures were-used to predict the heating distribution. The
f i r s t is the SHIV program and the second technique is the BLIMP computer
code (Reference 6). a detailed solution of the nonsimilar boundary layer
equations. The second procedure should be m o r e accura te , par t icular ly
in regions of l a rge p r e s s u r e gradient such a s those that occur a t the af t
corner . The resu l t s f rom ' the two calculations a r e compared with the exper i -
mental data i n F igure 7. 1A-6. Within the data sca t te r e i ther technique
provides a reasonable comparison. The grea tes t discrepancy'between the
two calculations i s i n the corner region where the BLIMP code pred ic t s .
higher va lues . , With this configuration the flow remained laminar on the
body and vortici ty effects were small .

-
MMC
0 '1 011 012 01, 011 015 SURFACE LOCATION. r
Figure 7 . IA-6. Comparison of Analytical and Experimenlal Convstive Heding Distributions lor the ~ p l l o Canfigurnion
The effect of a change in co rne r radius on the convective environ-
ment for the same configuration was calculated with the BLIMP program.
The resu l t s for a co rne r radius one half of the nominal value a r e a l so
shown in Figure 7 . 1A-6. As expected, the smaller corner radius with i t s
attendant higher pressure ,gradients experiences a m o r e severe environ-
ment.
2. 3 Radiative Heating
The ult imate in predicting the heating environment experienced by
an entry vehicle would be a computer code for solving the coupled viscous
three-dimensional shock layer conservation equations of m a s s , momentum,
energy, and non-gray radiative t ranspor t for an a rb i t r a ry reacting gas
mixture. Such a code does not present ly exist and would be prohibitively
expensive to run in a design effort if i t did. A presently accepted method
of predicting the environment for a Venus entry probe i s t o uncouple the
radiation and fluid mechanics and calculate the radiative heating f rom a
slab of gas of thickness equal to the adiabatic shock stand-off distance and
with constant equilibrium thermochemical properties. Subsequently, this
radiative heat flux i s modified by a cooling factor which accounts in par t
for the actual decay in tempera ture a c r o s s the shock layer and the thinning
of the layer i tself . A computer code i s now available to calculate in grea t
detail the radiative heating fo r a s lab of a rb i t r a ry p res su re , temperature
and elemental composition i n chemical equilibrium. The calculation i n -
cludes emission and absorption for a l l the known important radiating

processes in gas mixtures of C, N, and 0 and their molecules and ions
(Reference 38). This computer code i s used to provide the required i s o -
thermal slab radiation. Recently, a computer program was developed by
W. A. Page of NASA Ames for calculating the stagnation point coupled
conservation equations and has been applied to Venus entry problems
(Reference 39). The code i s restr ic ted by the radiative t ranspor t data
available to a 90% GO2 - 10% N2 atmospheric mixture and two postshock
p res su res , 1 .0 and 10 atm. The non-gray radiative t ranspor t model i s a
multiband t reatment modeled af ter those used for a i r calculations (Ref-
e rence 40) with additional bands to account for the important processes
resulting f rom the addition of carbon. This model i s well suited to i t e r a -
tive numerical calculations and s ix bands a r e presently included. The
selection of the hands and calculation of the appropriate absorption coef-
ficients i s a formidable task.
At the request of MMC, Page (References 41 and 42) provided the
coupled radiative heating resul ts obtained f rom the Ames program, making
additional runs where necessary so that a complete ma t r ix of cases of
interest to Venus entry was obtained. This mat r ix included for each p r e s -
su re possible (1.0 and 10 a tm) f r ees t r eam velocities f r o m 7 to 12 k m l s e c
and adiabatic shock stand-off distances of 0. 3, 1.0, 3. 0, and 10 cm. With
the band model resul ts a s provided by Page, the corresponding isothermal
slab heating was calculated. The rat io of the coupled resu l t s and the i so -
thermal slab resul ts f rom Page 's model i s the radiative cooling factor
necessary for design calculations. The radiative cooling parameter is de-
fined a s
the ratio of the i so thermal radiative heat flux in al l directions to the total
flow energy. This parameter has been used i n previous at tempts at c o r -
relation of the cooling factor a s it appears a s the coefficient of the flux
divergence t e r m in the normalized energy equation.

The cooling factor i s plotted against the radiation cooling param-
eter in Figure 7. 1A-7. The solid line i s the suggested correlation of
these numerical data. The dashed line i s a correlation for air . At values
of the cooling parameter ' usually obtained in the predictions (0.004 - 0.040),
the present correlation provides further relief of from 6 to 14% over the a i r
correlation. This difference i s primarily due to the optically thin-optically
thick aspects of the present emission spectrum a s compared to those of a i r .
Although the present correlation was developed for a cold gas mixture of
9070 C02-107~ N2, i t s use with mixtures containing even less N2 can be.
made with confidence since the radiation i s dominated by processes in-
volving the C and 0 species in a l l these cases. It i s emphasized that the . . six-band model has been used only for the development of the cooling
factor correlation.
1.0- $ d m co2 ---- w ImN2
d --. \ 61 "-6 I 4 K W
0.8 - 2" $ 0.b-
2 0 I d (<MI P* (ATMI z -
0.4 - 0.3 FLAGGED 1.0
8 1.0 UNR*GGED 10.
z 4 - 4 0, ' 0.2 - - 5 t ~ 3 r 0 . 8 4 o
I I I 1 1 1 1 1 1 I I 1 1 1 1 1 1 1 I I I I I I I U ro-' 10'
MDIATION COOL~NG PA-TEL, r
Fqure 7.1A-7. Rldidive Cooling Factor lor Venus Entry
The following procedure i s applied to determination of the radiative
distribution along the probe. The adiabatic standoff distance i s determined
from the inviscid calculations outlined previously. The slab pressure i s
assumed to be the local body pressure and the cold gas composition that of
the freestream. Choice of the appropriate temperature for the isothermal
slab calculation i s difficult, particularly away from the stagnation region.
With the strong dependence of radiation on the temperature, use of the
postshock value i s not appropriate because of the entropy layer influence on

the short blunt bodies. F o r design purposes, the i so thermal 'slab. calcula - '
tion i s performed a t the boundary layer edge tempera ture a s calculated in
the convective analysis and including boundary layer swallowing. This , ,
i s a conservative appro,ach but l e s s so a s the local body angle increases . . .
The isothermal slab radiative flux to the body i s calculated with the de-. ' .
tailed procedureof Reference 38.
In determining the radiation cooling factor to be applied, the radiation
cooling pa ramete r i s assumed to be
which reduces to the previous value a t the stagnation point. The angle
modification leads to a relatively g rea te r cooling effect aft on the body..
An equivalent cone procedure has been used to determine the sensit iv-
i ty of cone radiative heating to angle of a t tack (Reference 37).; Two effe=ts " '
a r e seen to be important. F i r s t , a s previously seen, the shock layer tends
t o thicken a s the cone angle inc reases with the radiation increasing near ly
proportionately. More important, however, i s t he strong dependence of
radiative heating on temperature and the increase i n the appropriate t empera -
t u r e with effective cone angle.
2.4 Base Region Heating
A conservative approach has been adopted in studies of base heating.
Because of the strong influence of boundary layer turbulence on the base . . .
region convective environment (Reference 43), the base heating i s es t imated
a s some fract ion of the aft corner environment. F o r probes with a relat&ely
flat base , this fraction i s assumed to be 0.03 a f t e r study of tes t data f r o m
other planetary probe studies (Reference 44). F o r probe shapes i n which
the slope of the afterbody f r o m the corner is l e s s than 70 degrees, the f r ac -
tion is assumed to be 0.05 (Reference 45). In each case the heating is a s -
sumed constant over the afterbody and the s a m e fract ion i s applied to both
the convective and radiative heating rates .

3. LRC COMPARISON
Some resu l t s f r o m the studies underway a t LRC in support of the
Pioneer Venus Project have recently been received. The initial re lease
(Reference 46) contained the resu l t s f rom a computer code for calculation
of the radiative inviscid flow about blunt bodies using a t ime asymptotic
technique. Subsequently, resu l t s f rom an analysis coupling the inviscid
outer layer with an inner viscous layer including steady -state ablation of
a carbon phenolic ma te r i a l were obtained (Reference 47). The chemical
equilibrium and radiative t r anspor t subroutines used i n the LRC analyses
a r e the same a s those discussed previously. A comparison of the LRC
and MMC resu l t s then should provide a n est imate of the e r r o r involved in
uncoupling the various p rocesses and ignoring the ablation m a s s loss effect
on radiative heating.
In F igure 7. 1A-8 , resul ts f r o m the LRC inviscid study a r e compared
with those obtained in the present work for the 60 degree-sphere-cone. The
p r e s s u r e distributions compare favorably with the exception of the aft
co rne r region. Details of the LRC procedure a r e lacking, but it s eems no
special consideration i s given t o the sonic point occurr ing a t the maximum
body radius. This i s a par t icular ly difficult region to handle in t ime-
dependent procedures (Reference 15) such a s those used by LRC. To
properly pe r fo rm convective calculations, the co r rec t p r e s s u r e distribution
mus t be used. The MMC resul t s do include the rapid drop in p r e s s u r e a s
the sonic co rne r i s approached. The agreement between the shock standoff
distance a l so worsens fur ther back on the body. This could be due to the
incorrec t ly predicted p r e s s u r e distribution in the co rne r region by LRC
and the thinning of the shock layer by radiation a s included by LRC. For
the 45 degree-sphere-cone, the body sonic point occurs on the sphere and no
special consideration i s required a t the body maximum radius. As seen
i n Figure 7.1A-9, both the p r e s s u r e and shock layer thickness compare
v e r y well. Calculation m e s h s izes with time-dependent techniques a r e
generally much c o a r s e r than those uscd f o r the present MMC results.
Thus, the LRC resul t s may not accurately descr ibe the overexpansion and
subsequent recompression occurr ing nea r the sphere cone junction, the
region of grea tes t disagreement.

0
"7 0 0.4 0.11 I . I 2.0 2.4
S W 4 E LOCATION 6)
- 0. lb i;
Z 0.m 0.m
P 5 "7
0.04 I 0.M
", 0 0.4 0.0 1.1 -4
1 0 0.4 0.8 1.1 1.b 1.0 2.4
SVLrACt LOCATION. I SULTACC LOUBON. s
Figure 7. IA-8. I iscid Analysis Results lor lhe F iurs 1. LA-% I iscid Analyris R ~ u l t s for the 6a)l Sphere-Cone Confipurtion 4y Sphere-Cone Conligurllion
In Figure 7. 1A-10, the radiative heating distributions a s obtained by
LRC for both the large and small probes a r e compared with those found with
the MMC techniques previously described. Two LRC results a r e noted for
each probe; an inviscid radiative solution, and a fully-coupled solution with
steady-state ablation of carbon phenolic. The MMC solution should fall
somewhere between these two since an approximation i s made for viscous
effects but not for the absorption by ablation products. An examination of
Figures 7. 1A-8 and 7. 1A-9 in conjunction with Figure 7. 1A- 10 explains
the differences in final results. F i r s t , in regions where the pressure and
shock layer thickness from each analysis agree closely, e. g. , the spherical
section of the small probe, the LRC results do bracket the MMC calculation.
On the large probe spherical section, the MMC shock layer thickness i s
smaller than that predicted by LRC and the radiation heating results a r e
consistent with that fact, i. e . , the MMC results fall along the lower limits
of the LRC study. On the conical sections of the probe the MMC results

0' = aoo -.-MMC u--8.80P KM/S A I R C INVI5CID P - = S . n ~ ~ ~ h t / t . $ ~ +LLCfULLI-CWPLLD
' T-- 180.P'~ X MNC V i l l l l LUC I l A N I > C > I F
0 0 0.4 0.8 I.? 1.6 2.0
SURFACE LOCAIION.,
Figure 7. IA-10. A Comparisonof Rddidive Healing Results
a r e seen to be strongly dependent on the pressure level which, of course,
determines the total population of the radiating species. The minimum
cone radiative heating values for each probe occur at the minimum pres -
sure locations; the aft sonic corner for the large probe and the sphere cone
junction for the small probe. Since the LRC results do not exhibit these
minimum values, the strong dependence of the radiation on the pressure i s
not a s obvious. A conservative procedure has been adopted by MMC in
predictions of the cone radiative heat'ing in the choice of the isothermal
slab temperature. However, also contributilig to the apparent MMC over-
prediction of the large probe cone radiation i s the significant difference
in shock standoff distance prediction. To demonstrate this, a calculation
was made a t two body locations using the MMC procedure and thermo-
chemical data, butusing the LRC shock standoff distance (Figure 7. 1A-8).
The results a r e shown in Figure 7.1A-10 and a r e seen to be much nearer
those from the LRC analysis. Since the MMC inviscid procedure cor -
rectly handles the aft corner sonic point while no special provision i s made

for i t i n the LRC calculation, i t i s felt that the LRC shock standoff distance
i s underpredicted on the cone leading to a n underestimation of the cone
radiative heating.
Another point of comparison is the stagnation point!cold wall', n o ' -
blowing convective heating rates . The MMC resul ts a r e 17.9 and . ,
2 43. 3 MW/m for the l a r g e and small probes respectively, while the c o r -
" 2 , . . . ' . "
responding LRC resul t s a r e 17.8 and 3 9 . 4 MW/m . In general, a f t e r
consideration of the detailed calculation differences, the agreement between
the LRC and MMC resul t s i s considered good.
4. NOMENCLATURE
A Transition extent Reynolds number parameter
Convective load distribution functions
Dimensionless s t r e a m function
Boundary layer velocity rat io
Turbulent spot formation rate pa ramete r (1 /m. s )
Total enthalpy (Jfkg)
2 Static enthalpy (J /kg) convective coefficient, (kg /m s) o r s t reamline divergence me t r i c
Flow index; 0 -two dimensional, l -axisymmetric
Mach number
Vorticity pa ramete r
Prandtl number
2 Pressu re , ( a tm o r N / m )
2 Heating r a t e (W /m )
Base radius (m)
Nose radius (m)
Momentum thickness Reynolds number

Radial coordinate normalized by the nose radius (F igure 7. 1A - 1)
Body surface coordinate normalized by the nose radius (Figure 7.1A-1)
Tempera ture (OK) . Time (s)
s -component of velocity ( m l s )
F r e e s t r e a m velocity ( k m l s )
Entry velocity (km/s )
Axial coordinate normalized by the nose radius (F igure 7. 1A-1)
Coordinate perpendicular to s normalized by the nose radius (Figure 7. 1A-1)
Shock angle (F igure 7.1A-I) (degree)
Turbulent intermittancy
Ent ry angle (degree)
Shock standoff distance normalized by the nose radius (Figure 7. 1A
Turbulent t ransformed s-coordinate [(kg/rn2 s l 5 l 4 m] 114
Laminar t ransformed y -coordinate
Body angle (Figure 7.1A-1) (degree)
Radiative cooling pa ramete r
Dynamic viscosity (kg/rn. s)
2 Laminar t ransformed s-coordinate, [(kg/rn2 s ) m]
3 Gas density ( k g / m )
2 Shear s t r e s s (N/m )
SUBSCRIPTS
Adiabatic
Base
Body
Boundary layer

Cone o r corner
Boundary layer edge
Laminar
Recovery
Shock
Turbulent
Transit ion
Wall
Conditions a t s = o
F r e e s t r e a m
SUPERSCRIPTS
Convective
Radiative
5. REFERENCES
1. Anonymous, "Models of the Venus Atmosphere," NASA S P 8011, Review Copy (September 1972).
2. C. Mir-Hosseini, "Venus Entry Nonequilibrium Boundary Layer Analysis, " MMC Memorandum (February 1973). '
3. J. D. Anderson, Jr. , "An Engineering Survey of Radiating Shock Layers , AIAA Journal, Volume 7, No. 9 (September 1969).
4. R. M. Kendall, "A General Approach to the Thermochemical Solution of Mixed Equilibrium - Nonequilibrium, Homogeneous o r Heterogeneous Systems," NASA CR-1064 (June 1968).

E. P. Bartlett , R. M. Kendall, and R. A. Rindal, "A Unified Approximation for Mixture Transpor t Proper t ies for Multicomponent Boundary Layer Applications. " NASA CR-1063 (June 1968).
Anonymous, "Users ' Manual-Boundary Layer Integral Matr ix Procedure , Version C (BLIMPC)," Aerotherm Report UM-70-20 (June 1970).
K. Sutton and R. A. Falanga, "Stagnation Region Radiative Heating with Steady State Ablation during Venus Ent ry ," Paper presented a t Symposium on Hypervelocity Radiating Flow Fields for Planetary Ent r ies (January 1972).
H. Lomax and M. Inouye, "Numerical Analysis of Flow Proper t ies about Blunt Bodies Moving a t Supersonic Speeds in an Equilibrium Gas," NASA TR R-204 (July 1964).
M. D. Van Dyke, "The Supersonic Blunt-Body Problem-Review and Extension," - JAS, Volume 25, No. 8 (August 1958).
M. Inouye, J. V. Rakich, a n d H . Lomax, "A Description of Numerical Methods and Computer P rograms for Two-Dimensional and Axisymmetric Super sonic Flow Over Blunt -Nosed and Flared Bodies," NASA TN D-2970 (August 1965).
0. M. Belotserkovskii, "Flow with a Detached Shock Wave about a Symmetr ical Prof i le , " JAMM, Volume 22, No. 2 (1958).
S. C. Traugott , "An Approxi~nate Solution of the Supersonic Blunt Body Problem for P resc r ibed Arbi t ra ry Axisymmetric Shapes, " MMC RR-13 (August 1958).
J. Xerikos and W. A. Anderson, "Blunt Body Integral Method for Air in Thermodynamic Equilibrium, " AIAA Journal, Volume 3, No. 8 (August 1965).
G. Moretti, and G. Bleich, "Three Dimensional Flow Around Blunt Bodies," AIAA Journal, Volume 5, No. 9 (September 1967).
R. W. Barnwell, "Three -Dimensional Flow Around Blunt Bodies with Sharp Shoulders, ' I AIAA Paper 71 -56 (January 1971).
J. C. South, J r . , "Calculation of Axisymmetric Supersonic Flow Pas t Blunt Bodies with Sonic Corners , Including a P r o g r a m Description and Listing, I ' NASA TN D-4563 (May 1968).
R. Gold and M. Holt, "Calculation of Supersonic Flow Pas t a F la t - Headed Cylinder by Belotserkovskii 's Method, " AFOSR TN-59 - 199 (March 1959).

M. Holt, "Direct Calculation of P r e s s u r e Distribution on Blunt Hypersonic Nose Shapes with Sharp Corne r s , " JAS, 28, 11 (November 1961).
A. A. Dorodnitsvn. "A Contribution to the Solution of Mixed Problems , . of Transonic Aerodynamics," Advances in Aeronautical Sciences, Volume 2, Pergamon P r e s s (1959).
C. T . Edquist, "The Method of Integral Relations for Spherically Blunted Bodies with Sharp Sonic Corne r s i n an Equilibrium Gas Mixture, " MMA R72-48671-001 (July 1972).
J. J. Bertin, "The Effect of Protuberances, Cavities and Angle of Attack on the Wind-Tunnel P r e s s u r e and Heat-Transfer Distribution for the Apollo Command Module," NASA TM X-1243 (October 1966).
C. T. Edquist, "Vorticity Effects in Venus Ent ry ," MMC R-70-48671- 003 (7 July 1970).
C. T. Edquist, "A Technique for Predicting Shock Induced Vorticity Effects During Venus Entry, I t MMC R-70-48671-006 (August 1970).
L. Lees. "Laminar Heat Trans fe r Over Blunt-Nosed Bodies a t ~ ~ ~ e r s o n i c Flight Speeds," Je t Propulsion, Volume 26, No. 4 (April 1956).
H. Hoshizaki, "Heat Trans fe r in Planetary Atmospheres a t Super- Satellite Speeds," ARS Journal, Volume 130, No. 10 (October 1962).
K. Sutton, and R. A. Graves J r . , "A General Stagnation-Point Con- vective-Heating Equation for Arbi t ra ry Gas Mixtures ," NASA TR R-376 (November 197 1).
J. A. Fay, and F. L. Riddell. "Theory of Stagnation Point Heat Transfer i n Dissociated Air , " JAS, Volume 25, NO. 2 (February 1958). - J. G. Marvin, and G. S. Deiwert, "Convective Heat Transfer in Planetary Gases ," NASA TR R-224 (July 1965).
R. Bromberg, J. L. Fox, and W. 0. Ackermann, "A Method of Predicting Convective Heat Input to the Ent ry Body of a Ballistic Missi le , ' I Ramo -Wooldridge Corporation.
L. F. Hearne, J. H. Chin, and L. W. Woodruff, "Study of Aero - thermodynamic Phenomena Associated with Reentry of Manned Spacecraft ," LMSC Y -78-66-1 (May 1966).
Anonymous, "Nosetip Design Analysis and Tes t P r o g r a m (NDAT), Final Report, " Volume 1, P a r t 1, LMSC -B133378 (October 1970).

32. H. W. Emmons, "The Laminar-Turbulent Transi t ion in a Boundary Layer - P a r t I;" - JAS Volume 18, No. 7 (July 1951).
33. K. K. Chen, and N. A. Thyson, "Extension of Emmons ' Spot Theory to Flows on Blunt Bodies, " AIAA Journal , Volume 9, No. 5 (July 1971).
J. C. Cooke, "An Axially Symmetric Analogue for General Three - Dimensional Boundary Layers , " Bri t ish Aeronautical Research Council R&M 3200 (1961).
J. V. Rakich, and G. G. Mateer , "Calculation of Metr ic Coefficients for Streamline Coordinates, " AIAA Journal, Volume 10, No. 11 (November 1972).
C. T . Edquist, "Initial Es t imates of the Effect of Angle of Attack on Probe Entry Analysis, " MMC P71-44487-272 (October 1971).
G. F. Widhopf and R. Hall, "Transit ional and Turbulent Heat Transfer Measurements on a Yawed Blunt Conical Nosetip," AIAA Journal, Volume 10 (October 1972).
W. E. Nicolet. "Users Manual for the Generalized Radiation Transfer Code (RADIEQUIL), " Aerotherm Report UM-69-9 (October 1969).
W. A. Page and H. T . Woodward, "Radiative and Convective Heating During Venus Entry, I t AIAA Journal, Volume 10, No. 10 (October 1972).
W. A. Page, -- et a l . , "Radiative Transpor t in Inviscid Nonadiabatic Stagnation - Region Shock Layers , " AlAA Paper 68 -784 (June 1968).
Pe r sona l communication, W. A. Page to J.-M. Lefferdo (July 1971).
Personal communication, W. A. Page to C. T. Edquist (October 1971).
B. M. Bulmer, "Flight T e s t Correlation Technique for Turbulent Base Heat Transfer with Low Ablation, " - JSR, Volume 10, No. 3 (March 1973).
44. Anonymous, "Viking Aerophysics Data Book. Revision G, " MMC TR-372003 (January 1973).
45. N. S. Vojvodich, "PAET Entry Heating and Heat Protection Exper i - ment , " JSR, Volume 10, No. 3 (March 1973). -
46. K. Sutton, "Radiative Heating Analysis for Pioneer Venus, Report No. 1," NASA LRC (October 1972).
47. K. Sutton, "Radiative Heating Analysis for Pioneer Venus, Report No. 2," NASA LRC (December 1972). -

APPENDIX 7. i B
E F F E C T O F AERODYNAMIC COEFFICIENTS,
INERTIAL PROPERTIES, AND ROLL RATE
ON THE DYNAMIC STABILITY O F CONICAL PROBES
i. La rge P robe Descent Capsule
2. Small P robe
3 . Large P robe
4. Conclusions

APPENDIX 7.1B
EFFECT OF AERODYNAMIC COEFFICIENTS, INERTIAL PROPERTIES AND ROLL RATE ON THE DYNAMIC STABILITY OF CONICAL PROBES
Coakley's dynamic stabili ty cr i ter ion (Reference 1) for a vehicle in
six-degree-of-freedom flight i s expressed a s follows:
a + J ( 1 - x2 ) - bx > 0 f o r stability (convergence of a )
where:
The t e r m c i s unity fo r constant ro l l r a t e and z e r o f o r ro l l r a t e pro-
portional to the velocity, such a s would occur f o r a vehicle with canted fins. - 1 F o r the present analysis, the fin angles a r e given by tan pd/V, dC
d M = O , C = 0 ; and the Venus atmosphere Model I of Reference 2 was m m D
a used.
1. LARGE PROBE DESCENT CAPSULE
The l a rge probe s tages f r o m the parachute a t 48 k m and requi res , fo r
science measurement , a controlled rol l rate. Terminal velocities ve r sus
altitude for ball ist ic coefficients of 2 .75 and 3. 50 a r e shown in F igure 7.1B-1.

Figure 7.1B-2 presents the Coakley criterion for the descent capsule
a s a function of altitude for various roll rates, fin deflection angles, and
ballistic coefficients. Descent capsule aerodynamic coefficients and mass
properties for this analysis a r e given in Table 7.1B-1. The CD, C , L,
and C values shown in Table7.1B-1 were obtained f rom tests in the ma -
Martin Marietta subsonic wind tunnel. As shown in Figure 7.1B-3, results
for the large probe descent capsule are :
1) The criterion indicates stability.
2) Changing the ballistic coefficient does not significantly influence the stability.
2. SMALL PROBE
The blunted, 45-degree cone with afterbody small probe enters the
Venus atmosphere with an initial roll rate of 4. 8 rpm, flight path angle, and
ballistic coefficient a s shown in Figure 7.1B-3, and reaches terminal ve-
locity a t about 60 km. The small probe nominal mass properties and aero-
dynamic coefficients a r e shown in Table 7.1B-2. Figure 7.1B-4 presents
the Coakley parameter versus Mach number for roll rates, p = 0 and 4
rad l s.

3.4 FIN A N U E P (UD/S) C-----------------------a
U 2.81 0 10 10 30 40 YI
ALTITUDE IW) (A) a = 2 . n
3.4 FIN ANGLE P (P*D/S) L----------------------- a
- 2.81 I
0 10 20 30 40 YI ALTITUDE IKM)
a1 s - 3 . m Figure 7.18-2. Variation a1 h a k l e y Stability Criterion with
Altitude lor lhe Large Probe Descent Caprule
Table 7 . 1B-1. Large Probe Descent Capsule Characteristics

M URGE m a r cr ENW -104
a - SML m a r ~VENTRY
runuol cw)
40 -
w -
* 0 tm 100 m 4a
VB0Cll-f (Mn) Flgure 7.18-1 Largo and Small Robs AlRuda and Velbciiy
Table 7. 1B-2. Small Probe Characteristics

4 . d L
Figure 7.18-4 V a r l ~ l o n o f Cad;lay StabilHy Crtlerbn wHh Mach Numbs1
The criterion essentially reflects the pitch damping derivative, shown
in Figure 7.1B-5. Figure 7.1B-6 further illustrates the sensitivity of the
Coakley parameter to the pitch damping derivative. The square of the di- 2
ameter to radius of gyration ratio (Dlo) = md2 I , significantly influences Y
the stability inasmuch a s the (Dl0 )' t e rm i s a multiplier of Cm + Cm . 9 6
LEGEND:
- URGE nmt RE 3) - - - SUALL H a E [ESTIUAIED)
Figure 7.10-5. Pitch Damping Derivative for the Large and Small Robe

Figurs 7.1~-6. Variltion of ~ o ~ y Stabilly Criterion with ~ a c h Number for Three Fundbns of the Piich Dampig Derivillve lor the Small Prcb
The small probe stability parameter versus roll rate for various values
of the pitch damping derivative is shown in Figure 7.1B-7. For terminal
descent (h = 0 to 60 km), the small probe i s stable for p < 7. 5 rad/s and
C + C 7 -0 . 5 per radian. m 9 m .
a
Figure LIB-7. Varidionof Caaley Stabilly Crnerlon with Roll Rate for Various Values of Pnch Oampig Derivdive

It i s interesting to note that fo r a negative dynamic p r e s s u r e gradient
a t h = 70 km, shown in F igure 7.1B-7, the Coakley parameter i s decreased
by approximately W sin Y S - CD.
q
Figure 7.1B-8 i l lustrates the sensitivity of the pa ramete r fo r the sma l l
probe to the roll-to-pitch moment of iner t ia ratio. F o r p = 5 rpm, changes
in 141 over a reasonable range, do not significantly influence the stability. Y
5 WM h - 0 4 W LEGEND: I D/. -4.1
lL'Iy 3 ---1.0
-1.15
1.50
g 2
!! 5 I
3 - k
Figure 7.16-8. Small Probe w l e y nabllity CrRerlon Sensnlvlty to lxlly Ratb
The effect of varying C , La
C , and C1 on the Coakley param- 'D' ma
73 e te r fo r the sma l l probe i s shown in F igure 7.1B-9. These aerodynamic
coefficients were varied independently and, when compared to the effect
of the pitch damping derivative shown in Figure 7.1B-6, do not have a
significant effect.

N O M W L
----- Cb - Sm (\I N O H VARIED INDWINDENILY CD - M X ( C d NOM
c,, - 4.1s. tc, I NOM - n P ......'' Cm - W X ( C )NOM
a b
2
z 0 ; 0 0
5 3 -2 5
5
4 L Flgure 7.16-9. Tha ~ n g t of Varylnp c . c , c md c1 on the Coaley
Lo ' ma p Stlbilny Crlerlon for the Small Prob
Figure 7.lB-10 presents stability boundaries fo r the sma l l probe a s
functions of pitch damping derivative, rol l ra te , and altitude. The stable
@ s in y region above about 77 k m resul t s p r imar i ly f r o m the density t e r m , p S . The unstable bands a t approximately 60 to 77 km a r e due, in par t , to the
interaction of the drag, gravity, and density t e r m s and cor re la te to the
s t rong negative gradient following peak dynamic p res su re . However, a smal l
change in the damping coefficient, in this case , f r o m -0.10 to -0.15 com-
pletely eliminates the unstable band fo r rol l r a t e s l e s s than 6 r ad l sec . F r o m
0 to 60 km, the pitch damping derivative and rol l r a t e a r e reflected in the
stability. Also, in Equation (If), note that the rolling moment of iner t ia I ( X )
and the rol l r a t e (p), appear a s mult ipl iers . (The o ther t e r m s containing
Ix a r e neglected in the p resen t analysis. ) Thus, the effects of changes in the
I o r in p will be identical. The implication of this fact i s that in Figure X
7.1B-10, increasing I will have the effect of moving the vert ical portion X
of the stabili ty boundary to the left. The vehicle studied in Reference 3
had lx/Iy = 1.8. Therefore, it i s c lear why this vehicle w a s unstable at
such a low rol l rate.

ALTITUDE (r~)l I I
figure 7.16-10. Small Robe Stability b u d a r i a as Fundbnr of Pitch DarnpinJ Derlvtiue, Roll Rae. and Altituda
3. LARGE PROBE
The la rge probe has a n initial roll r a t e of 4.8 rpm. The l a rge prc
descent capsule i s deployed by parachute f rom the l a rge probe a t approx
mately 70 km. A portion of the l a rge probe altitude versus velocity t r a j
tory i s shown in Figure 7.1B-3. Large probe m a s s propert ies and aero .
dynamic coefficients a r e shown in Table 7.1B-3.
Table 7.1B-3. Large Probe Charac ter i s t ics
MACH NUME" C~. (I 5, Cm?.* CD
0.01 -0.m -0.- o -0.10 0.m 0.60 -0.813 -0.- 0 -0.27 0.95 o.m -0.813 -0.w o -0.~0 1.m 1.m 1 .12 4.m 0 40.40 1.2) 1 . 1 -1.224 -0.- 0 40.40 1.42 I.= -1.m .a.osv o 40.40 1.48 1.40 -1.2m -0.lml 0 - 0 1.m 2.m -1.447 -0.1260 o 4 . m 1.m 4.m -1.37 -0.1116 0 -0.30 1.60
1m.m -1.37 4.1116 0 -0.30 1.60

.. , . . . .- . . . . . . - - - . .
fo r p r 0 and 4/rad/s . Again, the large probe coakley criterion essentially
reflects the pitch damping derivative, shown in-Figure 7.1B-5.
4 L Fqure 7.18-11 Varialonol Coakley Stability Crltsrbn wlh Mach Number
for the targs Probe
4. CONCLUSIONS
The Coakley stability criterion has been applied to typical Pioneer
Venus large probe descent capsule, large probe entry vehicle and small
probe configurations. The stability characteristics of the small probe have
been investigated in detail relative to roll rate, aerodynamic coefficients,
and roll-to-pitch moment of inertia ratio.
The large probe descent capsule i s stable for terminal descent veloc-
ities and is not significantly influenced by changes in the ballistic coefficient.
The large and smallprobe stability characteristics a r e strongly related to
the pitch damping derivative--stability increases with more negative values
of the pitch damping dBrivative and decreasing roll rates. The large probe . ,
i s stable at the time of parachute deployment.

The sma l l probe stability charac ter i s t ics a r e summarized a s follows 0
fo r the t ra jec tory considered ( 7 = 40 ):
1) The probe i s stable above 77 km, p r imar i ly due to the atmosphere sca le height t e rm. This corresponds to the period of increasing dynamic p res su re .
2) Between approximately 60 and 77 km, the instability indicated i s dependent on the interaction of the drag , gravity, and density t e r m s , corresponding to the period of rapidly decreasing dynamic p r e s s u r e and strongly influenced by the pitch damping coefficient.
3 ) In te rminal flight the sma l l probe is stable even f o r ve ry smal l values of the pitch damping coefficient.
5. NOMENCLATURE
B Ballistic coefficient, m / ~ S D
C~ Drag coefficient
C , C Lift coefficient curve slope and pitching moment La m a coefficient slope, per rad
C Roll damping derivative IP
C t c 2 Cm + Pi tch damping derivative, -- 2 Cm m
9 m , a
C Magnus moment stability derivative m pa
Reference d iameter
Acceleration of gravity
Altitude
Roll and pitch moment of iner t ia
Mass
Mach number
Roll r a t e
Dynamic p res su re , 6'v2/2

Reference a r e a ndL/4
Velocity
Weight
~ n ~ l e of a t tack
Reciprocal of the atmosphere sca le height, d~ / P dh
Flight path below the horizon plane
Atmospheric density
Radius of gyration in pitch
REFERENCES
1. T. J. Coakley, "Dynamic Stability of Symmetr ic Spinning Miss i les , " Journal of Spacecraft and Rockets, Vol. 5, No. 10, pp. 1231-1232 (October 1968).
2. NASA: "Models of Venus Atmosphere (1972). " NASA Soace Vehicle Design Cr i te r ia (Environment), NASA SP-8011, ( ~ e v i s e d September 1972).
3. Donna L. Shirley and John E. Misselhorn, "Instability of High-Drag Planetary Ent ry Vehicles a t Subsonic Speeds, " Journal of Spacecraft and Rockets, Vol. 5, NO. 10, pp. 1165-1169 (October 1968).

APPENDIX 7. iC
WIND TUNNEL TEST RESULTS
i. MMC Low-Speed Wind Tunnel Tes t s
2. Army Meteorological Wind Tunnel a t Colorado State University
3 . Ames Resea rch Center, HFFB Water Facili ty
4. Langley Research Center Spin Tunnel
5. General Discussion
7. ic-i
7. iC-7

APPENDIX 7. iC
WIND TUNNEL TEST RESULTS
Several aerodynamic test programs have been conducted under the MMC
IRAD Program which supported the selection of preferred probe configura-
tions. These programs have included static force and moment tests , one
degree of freedom and six degree of freedom dynamic tests. Descriptions
of these tests follow.
1. MMC, LOW-SPEED WIND TUNNEL TESTS
Three component force and moment tests have been conducted on a
large number of cone and sphere configurations a s shown in Figure 7.1C-1.
1.1 Conical Models
Aerodynamic coefficients from these tests of the cones with various
afterbodies a r e shown in Figure 7. 1C-2. The effect of afterbody shape i s
seen to be negligible except for the hemisphere, which exhibits an appreciable
negative normal force curve slope and positive pitching moment curve slope.
In spite of these unusual curves, i t i s seen in Figure 7.1C-2e that the center
of pressure , a s indicated by aCm/aCN, i s identical to those for the other
afterbodies.
The aerodynamic coefficients, C , C and Cm a s functions of a a r e L D'
shown in Figure 7.1C-3. A summary of zero lift drag for these configurations
i s given in Figure 7. 1C-3d where it i s seen that a wide range of drag coeffi-
cients i s available from this type of stabilization device. Particular details
of interest in these data a re :
1 ) All fin configurations produce positive lift-curve slopes.
2) C i s very nearly constant with a up to 30 degrees. (This i s a D . desirable feature for an atmospheric probe. )
3 ) The pitching moment slopes a r e quite linear. The data show a nonlinearity for the larger fins and fin angles which i s probably due to fin deformation.

FINNED SFWERE
Vd-0.25; 8 -0 " lo", lo'. lo'
a.m. 8-oo, lo", lo", ao 0.75; 8-0'. lh, lo0, loo
I .M; 8. a", 10". lo0, 30'
SPHERE WlTH PARES
L/d = 0.5
e- lzP D/d = 0, 1.0375
NO. OF CUTOUTS Z& .W 0
9 0.2360.213 24 0.05 0.10 24 0.05 0.lo 14 0.05 o.a
SPHERE WlTH THIN RINGS -0-
SPHERE WITH PERFORATED RINGS
N O . OF HOLES h& D& 0 1.08
24 0.030 1.08
L 48 0 . W 1.08 48 0.M7 1.102 0 1.115
48 0.M7 1.115
BLUNlCD CONES AND AFTER8ODlEP
STEPPED BICONIC HEMISPHERE ELLIPSE-HEMISPHERE BlCONlC
Figure 7.lC-1. Configurdions Tesled in the Martin Marima Subsonic WindTunnel

- =- /\FTIIIBODY 0 BlCONlC
8 $ ELLIPSE-HEMISPllEtE STEPED BICONIC % HEMISPHEIE ELLIPSE-HEMISPHERE STEWED BICCUIC HEWSPHERE
-
ao" BKONlC ao" ELLIPSE-HEMIWHERE
STEPFfD &ICONIC % HEMISPHERE & ELLIPSE-HEMISPHERE
STEPPED BICONIC
NOTE: C.G. AT W X I W M DlAMElER
loo
Wd = 0.50 e - a ' CD w d - 0 , s lo"
If
0 10
ANGLE OFATTACK,a?EGl
A L l F l
- -10 d 0 lo m 20
ANGLE OF ATTACK, a (DEG)
0 - 3 f loo w d - 0 . n lo" If
- -10 0 10 m 9
I ANGLE OF ATTACK. a (DEGI
B. DRAG I I I I I
-10 0 10 m 10
ANGLE OF ATTACK. 0 (DEG)
B. DRAG CONFIGURATION
SYMBOL FCUEBODY AFTERBODY . . . . . . . . . . ., .. , . A 60- BlCONlC
d b ELLIPSE-HEMISPHERE . . . . ~. , , . .
ELLlP5E-HEMISPHERE
. . 45' STEPPED BlCONlC
. . . . d fie HEMISPHERE
CONFIGUIUTION
SYMBU FOREBODY AFTERBODY
ELLlPSbHEMIPHERE STEPPED BICONIC
m nrmlssnEar 45' ELLIPSE-HEMISPHERE 45' STEPPED BlCONlC 4' HEMISPHERE
AT MAXIMUM DlAMElEB NOTE: C.G.
@ NOTE: C.G. AT MAXIMUM DUMETEK Id)
0 0'
0 I$
a loo 0 w=
SYMBOL - FACILITY R~ OPEN MMC s u ~ w . r - 5 . 5 X l d
CLOSED LANGLEY SPIN TUNNEL -1 .7 X id
oT I I I 0 10 m 9 4
FIN DEFLECTION ANGLE, B (DEG)
. . . ANGLE OFAl lACK. (DEGI I C~
D. NORMAL FORCE L PITCHING MOMENT WITH NORMAL FORCE
Figure 7. IC-2. Aerodynamic Coeflicients for Cone F o r e b d y Models
C. PITCHING MOMENT D. SUMMARY OF ZERO LIFT DRAG
Figure I . 1 ~ - 3 . Aerodynamic Coenicients for sphere- in Models (RN . 5 . 5
7. 1 C - 3

1. 3 SphereIThin Rings
Lift, d rag , and pltching moment data for the thin ring stabilized sphere
a r e shown in F igure 7. 1C-4. The effect of ring s ize i s to va ry the l if t-curve
slopes f rom negative to positive a s the D/d var ies f r o m 0. 8 to 1.4. Also,
it appears that the effect of ring location on the lift i s small . The effect of
ring s ize and location on drag coefficient i s pronounced, a s might be expected.
The d rag increases with ring s i ze and decreases a s the ring i s moved aft of
the maximum diameter. The effect of Reynolds number on the zero angle of
attack d rag i s shown in F igure 7. 1C-4d to be negligible over the range tested.
A summary of ze ro lift d rag i s shown in Figure 7.1C-4e and compared
with spin tunnel data. I t appears that the comparison fo r the d/D = 1 . 4 ring
i s not v e r y good. This is probably due t o the model, which has a ve ry l a rge
drag a r e a , shaking in the MMC facility. Also shown in F igure 7. 1C-4e a r e
values fo r the ringed spheres based upon the ring diameter instead of the
sphere diameter. The spin tunnel points f o r the d /D = 1 .2 and 1.4 cases
were used here . I t i s of in te res t that the data very nearly collapse to a
single curve a s might be expected.
The pitching moment curves (Figure 7. 1C-4c) indicate that a l l config-
urat ions tested were statically stable and that the stability increases a s the
ring i s moved aft.
The aerodynamic coefficients fo r the sphere with 12 degree f l a re s
having various vent geometr ies a r e shown in F igure 7. 1C-5. It i s seen
that the differences in these s tat ic coefficients a r e ve ry smal l fo r the config-
urations tested. This i s not too surpris ing because a l l of the vent a r e a s
were made equal intentionally to produce the same drag. The major reason
fo r the variations was to study in the spin tunnel the effects on the dynamic
stability.
1. 5 Sphere/Thick Perforated Rings
Typical plots of the aerodynamic coefficients a s functions of angle of
attack a r e shown in F igure 7 .1C-6for ring porosit ies of 0 and 26 percent.
Although the re i s some sca t te r in these data, the curves appear to be fair ly
l inear up to a = 30 degrees. Aerodynamic derivatives and zero-lift drag a r e

r +%. -r( p-0.2lZd 4 C X -0.ld. 0.2d. 0.a
0 . 9 SVM. 0 :- Q A O D REMUKS BLANK. 9 CUTOUTS', 24 CUTWTS
O/d = 0 I N 0 FENCE)
~ / d L 1.2 I -10 10 20 d~-
a = 45?
D/d= 1.0:
W d - 0 . W ' =L 1 so
Co - IF i iERP ALONE.
0' ANGLE OF ATTACK a (DEG)
ANGLF OF AT1ACI;O I D S )
A. LIFT B. DRAG
0 -- -10 0 10 20 30
ANGLE OF ATTACK.ol(DEG1
I NOTE- C.G. AT hUXIMUM DIAMETER (d) --b-----90- I A LIFT: I B. DRAG
O/d - 0 (NO FENCO . .
0 - 0.8 20 40
RING LOCATION, 0 (OEGI
L SUMMARY OF ZERO DRAC
ANGLE Of ATTACK, (DEG)
C. PITCHING MOMEM ANGLE OF ATTACK. a (DtG)
C. PITCHING MOMENT
REYNOLDS NUMB=, R.N. x
D. DRAG COEFFICIENT AT ZERO ANGLEOF AlTACK US REYNOLDS NUMBER
Figure 7. LC-4;'Aerodynamir Coef l i r ienls for Sphere-Rirq Models IRN - 5.7 x ldl Figure 7. IC-5. bradynamic Coefficients fo r Spheremenled Fldre Models

SYM D/d dllN1 FACILITY
c~ NOTE: CL -
a C ~ . -CD
ANGLE OF AllACK,olDEG)
0.4 NOlE: C L 2 CNm - CD
L 0.4 I I I -10 0 I 0 20 24
ANGLE O f ATlACK,o(DEG)
A R l N C P D R O S l T Y - D B. RING POROSITY - 26%
PER RAD 4.05 v
1 I I I I I 0 I 0 M 30 10 YI
RlNG WROSIW, 4b
NOTE: CLol CN, - Co
ALL VALUES GOOD FOR -m0< 1. < + 30'
C. SUMMARY OF AERODYNMllC DERIVATIVES AND DRAG
Figure 7.1C-6 Aerodynmic Coefficients far Spherellhick Ring C o n f q u r d i o n s

summarized in F igure 7. 1 C-6c fo r a l l of the var ious ring geometr ies and
porosi t ies tested. Drag data obtained f r o m the spin tunnel t e s t s a r e a l so
shown.
2. ARMY METEOROLOGICAL WIND TUNNEL AT COLORADO STATE UNIVERSITY
Conical models with var ious afterbodies and spheres with fins and r ings
configured a s shown in F igure 7.1C-7 were tested fo r one degree of f reedom
stability by mounting them in the wind tunnel on a horizontal w i re running
normal to the a i r flow and through the center of gravity of the models. The
models were perturbed to var ious degrees and then released into one degree
of f reedom motion. Motion pictures were made of the motion history. To
date only qualitative analysis of these data has been made. The resu l t s a r e
summarized in Table 7. 1C-1.
All of the finned spheres tes ted exhibited a s table trim point only a t
a = 0. None of the models would automatically diverge into a tumbling mode;
however, a s indicated in Table 7. 1C-1, those configurations to the lef t of
the dashed line would sustain tumbling if art if icially induced. The r ing-
stabilized spheres would t r i m a t a = 0 and 180 degrees and a l l would sustain
tumbling, but only a f te r ar t i f ic ial init iation.,
All of the cone models, except fo r those with the hemispherical a f te r -
body, would automatically tumble. Many of these models would osci l la te
about a = 0 and 180 degrees and the oscillation would diverge into the tumbling
mode, indicating that they were statically stable and dynamically unstable
at o = 0 and 180 degrees. The models with helnispherical afterbodies would
not t r i m a t o = 180 degrees and would not sustain tumbling if art if icially
induced.
3 . AMES RESEARCH CENTER, HFFB WATER FACILITY
Blunted cone models with half -angles of 45, 55, and 60 degrees , and
various afterbody shapes, a s shown in F igure 7.1-8, were tested in f r e e fall.
The models were fabricated a s thin (1116 in. ) aluminum shel ls with a cent ra l
s c rew and weights a s shown i n F igure 7. 1C-9. Various weights and weight
locations were used to produce the c. g. and D l a values indicated i n Tables
7. 1C-2, 7. 1C-3, and 7. 1C-4. Data consisted of multiple f lash s t i l l photo- I
graphs taken f r o m two orthogonally situated positions. Time has not i

permit ted thorough analysis of these data; however, the qualitative resu l t s
a r e summarized in Table 7.1C-2, 7.1C-3, and 7.1C-4, where it will be
seen that the behavior is not c lear ly cor re la tab le with that observed in the
spin tunnel.
Severa l flights in the water facil i ty with configurations B - E and A - F
were part ia l ly analyzed by ARC. The d rag values deduced f r o m these flights
were in f a i r agreement with those obtained in the Langley spin tunnel and
MMC wind tunnel, a s indicated:
Water Drop Configuration Faci l i ty Spin Tunnel MMC Wind Tunnel
B-E 0.86 0. 83 0. 86
A - F 0.88 0. 72 0. 75
The reason f o r the outstanding value of 0.88 f o r configuration A - F in the
water facility i s not understood.
4. LANGLEY RESEARCH CENTER SPIN TUNNEL
A l a rge number of blunted cone models with var ious afterbody shapes,
and spheres with stabilization/drag amplification devices has been tested in
the spin tunnel to study the i r stability charac ter i s t ics a s affected by c. g.
location and D/a . The configurations tested a r e shown in F igure 7. 1C-10
and 7. 1C-11. The data obtained consisted of color movies on which readings
f r o m a digital clock and a digital wind velocity indicator have been super-
imposed. The resu l t s of the t e s t a r e summarized in the following paragraphs.
4. 1 Spherical Models with F ins , Flares , , and Thin Rings
In general, the spherical models with f ins behaved s imi lar ly to the
one DOF case. Those that tumbled in one DOF a lso tumbled in this case ;
those that would not tumble when launched inverted would quickly turn over
and stabilize.
The models with 12 degree f l a re s having various vent a r e a shapes were
a l l dynamically stable; however, they exhibited an osci l la tory behavior that
i s believed to have resul ted f r o m alternating vor tex shedding. Installation
of a 3116-inch fence just ahead of the f l a re improved the behavior but did
not eliminate it.

0 Table 7.1C -1. Qualitative Results of Table 7.1C-2. Summary of Resul ts fo r 45
One Degree of Conical Forebody Models i n F r e e d o m Tes t s ARC Water Faci l i ty
A, FINNED SPHERES
8. RINGED ssnrars
ALL BISTABLE
ALL AUTOI(O1ATE If SUFFICIENTLY DISTURBED
C. BLUNTED CONES WITH VARIOUS AFTER8001ES NOTE SEE FIGURE 7 1-4 FORCONFIGURATION IDENTIFICATION
ALL MODELS TESTED EXCEPT HEMI5PHERlCAL AFTERBODY WERE DYNAMICALLY UNSTABLE AND DIVERGED INTO AUTOROTATION BfiC - IMPLIES LlMlTCYCLE>f 19 ABOUT a = !slP
LC - lMPLlES LIMIT CYCLE>: 19 ABOUT a- 0
S - IMPLIES STABLE TRIM A I a = 0
LIFT - IMPLIES MODEL EXHIBITE0 LARGE LATERAL OXILLATIONS. SOMETIMES HlTTlNG I l D l OF TANK
A-G-R
A-D LIFT
0 0 Table 7.1C-3. Summary of Resul ts for 55 Table 7.1C-4. Summary of Resul ts f o r 60
Conical Forebody Models in Conical Forebody Models in ARC Water Faci l i ty ARC Water Faci l i ty
NOTE: MODEL WAS STABLE O N FIRST FLIGHT. SUlEQUENT FLlGHTS EXHIBITED LLC. BUTAFTEe 5 MINUTES W*IT FOIIWATER TO SETTLE. A VERY STABLE FLIGHT WAS AGAIN PROOKED. CONCLUSlON REACHED WAS THAT A VERY SMALL DISTURBANCE WAS REQUlREO TO INITIATE THE LLC.
LLC - LARGE LIMIT CYCLE. 360<0<45'
C -CONING a91j0'
' -WILL EXHIBIT S A M EHAVIOR MCKWAROS NOTE SEE NOTE O N TABLE 7.IC-2
PINNED SPHERES
RINGED SPHERES
-0- I l B j l I,' - - - - - - - \\ h
H=O.Id; AE. M , AG, BE, BF, BG 7- I, H = 0.X; AE. BE
BLUNTED CONES AND AFTEWODIB
STEPPED BICONIC TRUNCATE HEMISPHERE -0l
ELLIPSE-HEMISPHERE
MALLORY SLUGS
Figure 7. LC-7. Conf igurat ions for Army Metmrolqical W One Degree of Freedom Tests
nd Tunnel Figure 7.1C-8 Conf igurat ions Tested in the Ames HFFB Water Tank Shoving I d e n l i f i c i t i o n Code

SPHERV?LARES SPHERVPERFOPATED RINGS SPHEREIT I IN RING5
N O OF
-- -- 0.45 0.1 0.225 0.4 0.30 0.4
.TESTED minoui C ~ I N D E R ONLY
"TESTED WTHOUTCYLINOEK AND D/d- 1.037SFOR Vd.O.4.
NO. OF CUTOUTS a u o~
l zO 0.5 0
12' 0.5 0, 1.0175
20" 0.5 1.0175
2 f 0.15 O,I.W75
N d D/d f - - M,5d 0.05 0, 1.0175
0.10 0. 1.0175 0.10 1 . ~ 7 s &
0.375 d REMOVED
.as do " D@ 1.189 1.174
I.,% 1.137 1.131 1.127 1.123
BLANK MEAS 1.122
fOR HARDWARE 1.113
INTEGRATION
24-UaE RlNG D / d = l , l l 3 ' , 1.125 0 . 3 d
NO. OF HOLES h/d O/b - - 24 O M 7 1.125 48 0.017 1.125 1 O M 7 1.115 48 0.047 1.105 a. 0.M7 1.068 a 0 . m 1.mo 30 0 . W 1.113
24-HOLE RlNG D/d=1.113 4 +-0.osUd
SPACER @ OF NGAFT SPACER
I RlNG FWD OF SPACER
24-HOLE RlNG O/d = 1.125 4 k O . c a 3 d
LTESTED WITH AND W/O SPHERE SEGMENT
8LUNTED CONES WTH AFTER BODlES
, ,-"1 d
I I D
D/d = 1.075; AD. ED = 1.15; AD, BD = 1.30; BD
0.310 0'
M 0.232 0' G
ALL OTHERS d = lOON.)
Figure 7.1C-la Conligurdions Tested in the NASALarqley Spin Tunnel Figure 7.1C-11. Sketch of 23-IN S here w i th Perforated Ring and Proluberancer Tested in the ~ A ~ i ~ p i n runnel

The spherical models with thin rings behaved somewhat differently
than in the one DOF tests , i. e . , they would not fly inverted (backwards) a s
they did with one DOF. The models would undergo a divergent oscillation
and eventually tumble when launched inverted. The effects on the stability
of variations in roll rate were very minor.
4. 2 Spherical Models with Perforated, Thick Rings
The results of spin tunnel tes ts on spherical models with various thick,
perforated ring widths and porosities, and various antennas, antenna fairings,
and protuberance arrangements a r e summa rized in Table 7.1 C-5. These
results indicate that the drag coefficient i s readily tailored through variations
in ring geometry. However, it i s also seen that lowering the porosity to
12.8 percent resulted in a limit cycle behavior and reducing the ring width
to D/d = 1. 113 for the 23-inch models (which a r e 81 percent of full scale),
and to D/d = 1.068 f o r the 10-inch models resulting in finite t r im angles.
This difference has not been resolved. It may be a Reynolds number or a
hole geometry effect. The 23-inch model had 30 holes and the 10-inch
model had 48. 'k
The results in Table 7. 1 C- 5 also demonstrate that the effects of
several protuberance arrangements on the t r im behavior of the sphere were
negligible.
The effects of several fairing arrangements designed to accommodate
the windlaltitude radar antenna and of simply attaching the antenna to the
bottom of the sphere a r e seen to result in the model being either unstable o r
developing a finite t r im angle. As shown in Table 7.. 1 C-5c the antenna
fairing was simulated by placing a cylindrical section between the two model
hemispheres. The c. g. was always maintained relative to the lower face
of the perforated ring. Thus, inserting the cylinder resulted in moving the
center of pressure (c.p. ) of the forward hemisphere forward and destabi-
lizing the configuration. The effect of moving the ring fore and aft and of
*In spin tunnel tests i t i s difficult to distinguish between a limit cycle behavior and a finite t r im angle behavior. Sometimes, when the roll rate was very low, a model would tend to limit cycle and, after the roll rate built up, i t would settle on a t r im angle and fly in a circle.

moving the c. g. i s c lear ly shown in Table 7. 1C-5c and it appears that the
c. p. was about a t the center of the cylinder (O.O42d), since the configuration
became marginal ly stable with the c. g. a t O.05d.
The effect of the cylindrical i n se r t in producing t r a n s v e r s e motion
(lift) in the spin tunnel, a s indicated in Table 7. 1C-5c, was shown previously
to occur a l so fo r the conical models. This effect probably resu l t s f r o m the
ex t ra flat a r e a f o r the local p r e s s u r e s to ac t on.
~ d d i n ~ the flat plate antenna to the spherical model (without a cylin
dr ica l section) had the effect of producing a finite t r i m point.
I t s eems a s a resu l t of the spin tunnel t e s t s that the design of the
perforated ring fo r the bas ic sphere i s fa i r ly well in hand and that adding
severa l protuberances has ve ry l i t t le effect. However, accommodating the
r a d a r antenna has not been resolved. The various effects on c. p. movement
discussed above s e e m to be r a the r simple, but fur ther testing with other
var iat ions on antenna fairings and ringfhole geometry a r e in o r d e r before
finalization of the ring o r the antenna configurations.
4 . 3 Roll Devices
The resu l t s of studies performed in the spin tunnel on ro l l devices f o r
the descent capsule a r e shown in F igure 7. 1-12 in t e r m s of helix angle, 2
acquired a s a function of fin o r hole angle. The 4-in. total a r e a fins 2V' 2 a r e shown to be 64 percent efficient. The 9-in. total a r e a fins approach
100 percent efficiency. The canted holes, a s a ro l l device on the sphere /
perforated ring, exhibit g rea te r than 100 percent efficiency. The canted
holes a r e a m o r e efficient rol l device than the fins because in pa r t they
probably sense a higher local velocity.
These resu l t s indicate that hole angles of 0. 54 degrees will produce
a ro l l r a t e of five revolutions p e r kilometer f o r the full scale descent capsule.
It should be apparent that the hole angle required f o r a given ro l l r a t e will
scale i n proportion to the sphere diameter .
4 .4 Conical Models
The conical models with var ious afterbodies, no ro l l ra te , and c. g.
located a t the maximum diameter ( tOO/od) s tations behaved s imi lar ly in the
spin tunnel and in the one degree of f reedom t e s t s a t CSU. Except with the

Table 7 . iC-5. Summary of Results of SphereIThick, Perforated Ring Model Tes ts in the Spin Tunnel
CONFIGURATION
6) ~/OTUIRANCE VARIATIONS
POROSITY I c.G! ( snoTuERANcEs I %RING 1 I TEST % d l TESTED AREA REF. D 08SERVATIONS I
101 RlNG VAXIATIONS
0 . ~ ~ 7 ~c 24 HOLES AT 0.4 DEG
HOLE CCNFIG- UPATION
EF, D
CD
U A T 0 . e
A A T 0.80
24ATO.P
1 -3.5, 1 PROTUBERANCES IS) 22.1 1 0.60 1 ?TRIM, 8-1O0PEINRMTIONS I
D d TEST OBSERVATIONS
-3.5
e ,,MI1 CYCLE
fl TRIM, 2' ARIURBATIONS
1.115
1.115
1.125
PARTICLE ANblYZEU
TEMPEMTUIE I N S M I
h/d
ANTENNA I 2
ANTENNA #I PYRO NUTI I
0.017
0.017
0.017 -3.5
NOTES (0) ONLY SEMICIRCULAR HOLES ('1 REMAIN; PERIMETER Cf RlNG WED mm mn TO EN- CLOSE HOLE.
C.G. % d
21.1
. M O o a s WRE h01 BALANCED AFTER aTIAC*ING A N l t h h ~ S . h O S l t h l F l C A h l DrKl 0 1 AN- IENh&S O h AEPODlhAHICS. I
POROSITY %RING AREA
-5.0
3 . 5
D
COMIGURATION TlTUDE RADAR ANTENNA VMLATIONS +
0.58
$TRIM WITH ANTENNA SIDE DOWN ANTENNA I 3
1.) RiNG VARIATIONS ICONTINUEO)
19.9
19.9
19.9
10' TRIM WITH ANTENNA SIDE DOWN
CONFIGURATION
22.1
0.62
0.58
0.62 0.58
POROSlTY C.G.,%RING EST
O/d % d AREA REF. D OBSERVATIONS
ff TRIM, f PERNRMTIONS
ff TRIM. 4' PERTURBATIONS
@TRIM, 6' PERTURMTIONS
/ d l 3 piPz&, 24-HOLE RING
RING AFT OF AFT SRIT LINE
WND
24 HOLES AT 0.4 DEG CAN1
C , t . % d
-3,5
-3,5
AFT SKIT LINE 1 OFMT sRITLINE
d, IN .
23
23
1
L m u FMI HARDWARE I3 AT 120 DEG)
I I
,0
D/d= 1.123 24-HOLE RlNG
RING POSlllON
RINGFORWARDOF AS1 SRlT LINE
RINGASTOFAFT SRlT LINE
,
RINGASTOFAFT SRITLINE
d - 23 IN . ALL HOLES HAVE 0.4 DEG CANT
-5'6
RlNG AFT OF AFT SKIT LlNE
POROSITY %RING A
22.1
23
20.0
RING AFT Cf AFT SPLIT LINE
' HARDWARE GAPI FILLED I N BUT N O HOLfS.
RlNG AFT OF AFT IR $7 I I N S
RING AFT OF AFT SRlT LINE
20.0
20.0 10'- I5'TNM. TRANSVfRSE I 0's2 1 MOTION
10
23
lo
D/d= 1.113 AND 1.125
24-HOLE RlNG -
RE, D
-
RlNG AFTOF AFT SRIT LINE
0.52
TEST OBSERVATIONS
STATICALLY UNSTABLE
STATICALLY UNSTABLE. SOIN IMPROVEMENT OBVIOUS
12.1
lb TRIM. TRANSVERSE MOTION
20.0
0 .X
RlNG AFT OF AFT SRIT LINE
RlNG AFT OF AFT S R l l LINE
RlNG AFT OF AFT SRlT LINE
RlNG AFT OF AFT SRlT LINE
22.1
OoTRIM, 6' PtRTUR8ATlONS
MRGlNAlLY STABLE URGE TRANSVERSE ~ O T I O N
0.5s
0 .X
M.O
20.0
22.1
20.0
IZ'TRIM. TRANSVERSE MOTION
6'TRIM. II'PERTURBATIONS
,
0 . ~
o.%
0.60
TRIM, IO~PERTURBATION~. WEAK TRIM POINT
I'TRIM. 8'PERTURBATIONS. STRONGER THAN ABOVE
l f f m ! M
s o n l M

FIN CONFIGUK4TION
AREA = 2 IN' 3 IN^ 0 v
d = l O l N 2 0.0 0 u
TOTU FIN N ~ O F
SYM t/d AREA, IN^ FINS
< o*o 0.5 4 2 5 0.4 4 2 .L 0 0 : P 3
lm9b EFfYLINCY
0 0.4
TAN-' W N IDEG)
NO OF NO Of ChNTED NONCANTED
/ SYM HOLES HOiES d (IN)
0 24 0 10 0 24 24 10 A 24 0 23
0 0.4 0.8
Figure 7.1C-12. Roll Device Arqle as a Function 01 Helix Angle
hemispherical afterbody, they w e r e s ta t ical ly stable and dynamically un-
stable and would self -exci te into a tumbling mode. Moving the c. g. a f t
increased the self excitation. In the no- ro l l t e s t s the model behavior was
essent ia l ly planar .
Of par t icu la r i n t e r e s t was the effect of ro l l r a t e on the stabil i ty of the
conical models. As the ro l l accelerated, a point was reached when the
models would en te r a divergent s p i r a l mode. I t was determined f rom study-
ing the motion p ic tures that ro l l accelerat ion and not just ro l l velocity appa r -
ently influenced the stabil i ty; the instabil i ty seemed t o be delayed until com-
pletion of ro l l accelerat ion. Murphy::: d iscussed this phenomenon. T ime has
not permit ted a detailed analysis of the presen t r e su l t s in light of Murphy's
work; however, the spin r a t e s a t which instabil i t ies w e r e observed in the spin
tunnel w e r e much higher than those of i n t e r e s t to the P ioneer Venus probes .
:kc. H. Murphy, "Response of an Asymmetr ic Miss i le to Spin Varying through Resonance", AIAA Journal (November 1971 ).

With the hemispherical afterbody both of the conical forebodies were
dynamically stable a t zero rol l rate. With rol l f ins installed, however,
these models a l so would enter a divergent sp i r a l mode a t some cr i t ica l
value of rol l ra te and acceleration. Fences located a t the maximum diameter
station having heights of 118, 318, 314, and 1-112 inches on the conical
models with hemispherical afterbody resul ted in decreasing stability. A
1/10 d cylindrical section in between the 60 degree cone and hemisphere
resulted in the model developing a side fo rce and flying into the s ide wall
of the tunnel. With the stepped biconic afterbody the model self -excited
into a tumble.
The above discussion pertains to c. g. location in the plane of the maxi-
mum diameter station. It can be seen in Tables 7. 1C-6, 7. 1C-7, and 7. 1C-8
that the effect of moving the c. g. forward and of increasing the value of D/o
was to increase dynamic stability markedly. Examination of Table 7. 1C-6
indicates that configuration A - F with -4.0 percent d c. g. and D l o = 4 .0
(the p re fe r red sma l l probe) exhibited the smal les t l imit cycle angle, and
i t could be perturbed to about 46 degrees without tumbling. I t i s interest ing
that the 23 in. model, which is 81 percent of ful l scale , exhibited a 0-degree
l imit cycle compared to 4 degrees fo r the 10 in. model. * The high degree
of stability, the packaging volume availability, and roll-to-pitch iner t ia
ratio (1. 18) for this configuration led to i t s selection a s the p re fe r red smal l
probe.
The effects of afterbody shape, c. g. location and D/o values fo r the
60 degree la rge probe candidate configurations a r e shown in Table 7. 1-8.
I t i s seen that the F afterbody with c. g. a t -2. 5 percent d appears to be best.
However, in view of packaging the integration requirements , the E afterbody
was deemed to be a satisfactory compromise f o r the Thor/Delta option.
F o r the Atlas/Centaur option, which incorporates the perforated ring r a the r
than the vented f l a re fo r stabilizing the descent capsule, a much sma l l e r
afterbody volume i s required. Also, because of the l a r g e r d iameter r e -
quired by the g rea te r weight, it i s possible to package the probe with a m o r e
*'This behavior i s poss'ibly related to the scale of turbulence in the spin tunnel. I t i s not thought to b e a Reynolds number effect because the drag coefficients, deduced f r o m the equilibrium velocities, were identical f o r the two models.

Table 7. 1C-6. Summary of Spin Tunnel Results for 45' Cones
NOTE: BEHAVIOR CODE. x - X - x
T LIMIT CYCLE HALF ANGLE W I M U M ANGLE WITHOUT TUMBLE (NOT NECESSARILY MlWlMUM CAPABILITYI ANGLE FOR TUMBLING
X N O VALUE AVAILABLE
14-IN DIAMETER MODEL; ALL OTHERS ]& IN DIAMEXR
Table 7. 1 C- 7. Summary of Spin Table 7. 1C-8. Summary of Spin Tunnel Tunnel Results
0 ' for 55 Cones
NOTE SEE NOTE O N TABLE 7.IC-6
Results for 60° Cones
~ ~ ~ ~ p -
NOTE: SEE NOTE O N TMLE 7 . I C d

forward c. g. location, estimated to be - 3 . 5 percent d, and a relatively l a rge
value for D l o , estimated to be 4. 9. These reasons led to a study of the H,
and I afterbodies. I t i s seen in Table 7. 1 C-8 that these configurations
all exhibited satisfactory stability in the spin tunnel.
5. GENERAL DISCUSSION
Two part icular events occurred during these t e s t s that probably would
not have happened in a shor t duration t e s t such a s free-flight in a wind tunnel
o r ballistic range, o r even in an a i r drop. Some models exhibited a double
l imit-cycle behavior. The second ( la rger ) l imit usually occurred only af te r
disturbing the model significantly. Another model exhibited a l imit-cycle
behavior over a long period of t ime, but then, quite suddenly, af ter being
disturbed, apparently by an eddy in the wind s t ream, i t diverged into a
tumbling mode.
Because of the utility and flexibility of the spin tunnel and a lso as a
resul t of the previously described behavior, i t i s believed that the long flight
t ime available for models in the spin tunnel makes this type of testing
mandatory in the final proof t e s t of a part icular configuration.

APPENDIX 7.2A
PRELIMINARY EVALUATION O F TEFLON
AS A REFLECTING HEAT SHIELD FOR VENUS ENTRY
1. Radiation Scattering Theory
2. Radscan Computer P r o g r a m
3 . Teflon Analyses
4. Conclusions and Recommendations

APPENDIX 7.2A
PKELIMINARY EVALUATION AS TEFLON AS A REFLECTING HEAT SHIELD FOR VENUS ENTRY
A probe entering the a tmospheres of Venus and the outer planets
(Jupi ter , Saturn, and Neptune) will experience entry heating very much
l a rge r than that of previous entry environments, p r imar i ly a s a resul t
of the high velocities of typical entry probes. A substantial f ract ion of the
entry heating will be caused by shock-layer radiation. If this radiation
could be totally reflected, the net energy delivered to the heat shield s u r -
face could bc greatly reduced and entirely convective in nature. The resul t
of such a radiation blocking p rocess would be a decreased heat shield weight
requirement and, thus, an increased scientific instrument package. This
i s the concept behind a reflecting heat shield (RHS, a l so called a radiation
scattering heat shield).
The principle of a RHS i s ve ry s imilar to that of white paint. Paint
typically i s composed of a scattering pigment d ispersed in a t ransparent
vehiclc o r "binder." Scattering is accomplished by reflections and r e f rac -
tions a t the in te r face between the pigment and the binder. This p rocess is
most efficient when the difference i n the index of refract ion between the
pigment and the binder i s la rge . White paint appea r s white because the,
scattering p rocess i s equivalent fo r a l l wavelengths in the visible spectrum.
Neither the pigment nor the binder i s white in i tself ; in fact, ideally they
should be t ransparent . ,
Shock-layer radiation during planetary entry covers a broad range of
the electromagnetic spectrum. The exact spec t ra l distribution i s a strong
function of the atmospheric composition and entry conditions. Typically
for Venus entry, a substantial f ract ion i s i n the ultraviolet region. F o r
maximum efficiency, a RHS must show small absorption and la rge sca t te r -
ing ability over the spec t ra l range that i s par t icular to a given entry environ-
ment.
To analyze the concept of reflective heat shields for planetary entry,
a computer p rogram was developed during 1972 under MMC IRAD effort I. ,
(Reference 1). This program, called RADSCAT, i s descr ibed in detail in
Section 2 and 3 of this Appendix. Because it has been proposed that Teflon

could be used a s a reflective ablator (References 2, 3, and 4 ) , analyses
were made using RADSCAT to analyze Teflon's performance. The resu l t s
of these analyses a r e presented i n Section 4 of this Appendix.
1. RADIATION SCATTERING THEORY
Before writing the RADSCAT computer program, various mathe-
matical models were evaluated to determine the best radiation scattering
calculation procedure. F o r a 10-wavelength band analysis , the radiation
subroutine would have t o be called approximately 1000 t imes per problem
by the main program, an important consideration in choosing the calcula-
t ion method. The radiation routine would have t o give good accuracy, but
a t the same t ime, not be unnecessar i ly costly to operate. Previous papers
on'radiation scattering abla tors (References 4 and 5) advocated the use of
the Kubelka-Munk (K-M) method. These pape r s presented some exper i -
mental work which was done on reflecting ma te r i a l s , and K-M absorption
and scattering coefficients for these ma te r i a l s , which had been obtained
by analytical correlat ion of the t e s t resul ts .
The l i te ra ture survey that was conducted i n the initial s tages of the
1972 IRAD work indicated that the recently developed "many-flux" (M-F)
method of Mudgett and Richards (Reference 6) i s one of the mos t accura te
methods available for doing multiple scattering calculations. F o r RHS
applications, the K-M method gives resu l t s that a r e just a s good a s those
of the M - F method and i s much l e s s costly i n computer t ime. (The K-M
method i s described in this Section 1A. ) When doing radiation scattering
calculations by the K-M method, cer tain restr ic t ions must be followed:
1) RHS must extend over a region v e r y l a rge compared t o i t s thickness;
2) Incident radiation m u s t be nonpolarized;
3) Incident radiation mus t be entirely diffuse.
The f i r s t restr ic t ion r e su l t s f r o m the "one dimensional" nature of
the K-M theory. The analysis a s sumes that any radiation sca t te red in a
sidewise direction i s compensated for by equal radiation sca t te red f r o m
adjacent regions. The second restr ic t ion i s imposed because i t is diffi;
cul t to predict the F r e s n e l reflection coefficient (described in this Section
1. 2 ) when the radiation i s polarized. It should be pointed out that these

f irst two restrictions apply , , to the M-F method as well. The third res t r ic -
tion essentially defines the major difference between the K-M analysis and
the M - F analysis. The Kubelka-Munk . , . method i s not a s accurate a s the
"many-flux" method when incident radiation i s collimated. The most ac-
curate analyses by the K-M method a f e oplfa4ned when the incident radia-
tion i s entirely diffuse.
It i s convenient that radiatiop . . . . , ,< scattering heat shield applications a r e
within the range of usefulness o f the Kubelka-Mpnk . z~ method. Generally,
the RHS thickness will be very small compared , :., to the region over which it
extends. The shock-layer radiation p~oduced during atmospheric entry i s
probably one of the besf examples of raqiafion t h a t i s entirely diffuse. The
radiation is predicted tp be EpiEqlayiqed , , . well. Meeting these three
requirements, however, i s dlfficult to aphjeve in laboratory tests, and care
must be.taken in conducting , . tes ts and , c i~ the interpretation of the test results.
1.1 Kubelka -Mu& Theory . . . , . ,
According to the K-M method, j i j l : , $he radiant energy within a RHS can
consist of two compqnents; a radianit flqx being , , trgpsmitted through the
RHS toward the backface, the I flux; . , and . , . . . d a radiant flux caused by back-
scattering by the RHS directed the . , front . ... face, , , the J flux. These radiant
fluxes a r e visually demonstrated in Figure 7. ZA- 1. The change in in-
tensity of I and J with distance . , through the hea t shield, x, i s expressed
by the following set of K-M sirnultapeqps differential equations:
In these equations, S and .., K a r e the scattering and absorption coef-
ficients, respectively, in units of reciprocal . . . length. At the front face of - the heat shield, x = 0, and at the backface, x = X, where R i s the thick-
ness of the heat shield.

U I (81 HEAT SHIELD HEAT SHIELD FPONTFACE I DX I A C F A C E I
Figure 7.2A-I. Schematic Representation ol Kubslka-Munk Analysis
To find solutions to these equations, i t i s convenient to make the
substitutions a = ( S t K ) , b = (S), and d = (d/dx). Equations (1) and (2) can
then be expressed a s follows:
(Dta) I = t bJ ( 3)
Equation (3) i s operated on with (D-a), Equation (4) with (b), and then
Equation (4) i s subtracted from Equation ., (3). to give Equation (5).
(D-a) (Dta)I = b(D-a)J (3) times (D-a)
2 -b I = b(D-a)J (4) times (b) r h \(D-a) (Dta) t b'] I = 0
Solving Equation (5) and making the substitution P = q-ive a s
Equation (6) :
This equation is an expression for the intensity of the I radiation at any
point in the heat shield. C and C' a r e arbi t rary constants which a r e dictated
by the imposed boundary conditions.
To obtain a similar expression for the J radiation, Equation ( 6 ) i s
operated on with (D) to form Equation (7) and operated on with (a) to form

Equation ( 8 ) :
+ Px + C 1 a e - P x
a1 = Cae
Equat ions (7) ancl ( 8 ) a r e added together to f o r m Equation (9) :
I Px = c t ( p - a ) e - P x
(a ID) I = C ( P + a ) e ( 9 )
Using Equat ions (3) and (9) and making t h e subst i tut ion A = ( P t a ) /b,
B = ( P - a ) / b , it i s poss ib le to solve €01. J , which i s given by Equa t ion (10)
+ Px - ClBe - P x J = CAe (10)
T h u s , Equation (6) and (10) a r e solut ions t o the Kubelka-Munk di f ferent ia l
equat ions , and e x p r c s s the in tens i ty of the 1 and J radia t ion a t any point in
the hea t shield a s a funct ion of x.
1. 2 F r e s n e l Reflect ion
F r e s n e l ref lec t ion i s a n e lec t romagne t i c radia t ion phenomena that
o c c u r s a t the smooth boundary between optical ly d i s s i m i l a r media . T h e
magni ludc of the re i l ec t ion is propor t ional t o the d i f fe rence i n index of
r e f rac t ion of the two media . T h e re f l ec t ion coefficients a r e des ignated a s :
R~ - e x t e r n a l re i lec t ion, f ront s u r f a c e
RI - in te rna l ref lec t ion, f ront s u r f a c e
RB = in te rna l ref lec t ion, b a c k - s u r f a c e
T h e physics of R c a n be explained quite eas i ly . When light t r a v e l s I
f r o m a m e d i u m of h igher r e f r a c t i v e index ( e , g . , the RHS) t o one of lower
r e f r a c t i v e index ( e . g . , the a t m o s p h e r e ) , t h e angle between the n o r m a l t o
the s u r f a c e and the light r a y i s m a d e l a r g e r . F i g u r e 7. 2A-2 d e m o n s t r a t e s
tha t when th i s angle r e a c h e s a c e r t a i n va lue , the c r i t i c a l angle , the r e -
f r a c t e d light r a y i s , in fac t , r e f r a c t e d into the s u r f a c e of the m a t e r i a l . Any
angle l a r g e r than the c r i t i c a l anglc cause's light t o be r e f r a c t e d back into
the m e d i u m of h igher r e f r a c t i v e index, resul t ing in in te rna l " ref lec t ion. "
Since the internally incidcnt light i s coming f r o m every d i rec t ion ( i . e . , d i f -
f u s e radia t ion) , due to backscat tcr ing by the m a t e r i a l , a constant p e r c r n l a q e
of light will have a n inciclcnce angle g r c a t e r than the c r i t i ca l anglc and will
bc ref lec ted . T h e p c r c c n t a c e m a k e s u p the m a j o r p a r t of the in ternal

, NOIIWAL TO SURFACE
t I / / / I A l M M R ( E R E -
SOURCE ff DIFFUSE
oc = c a l n c A L ANGLE
Fiiure 7.U-'2. Fresnel Reflection
reflection coefficient, RI. Because the refract ive index is a function of
wavelength and tempera ture , s o a l so i s R I'
This situation does not apply to R where the externally incident E
light i s traveling into a medium of higher refract ive index and i t s angle
with the normal to the sur face i s made smal ler . The re i s . however, a
sma l l external reflection, the magnitude of which depends on the degree
of polarization of the incident light and the variation of intensity with angle
of incidence. The physical explanation of this reflection r equ i r e s some
detai l and will not be given here . Suffice to say that whenever a light
wave fa l ls on to a boundary between two homogeneous and optically d i s -
s imi la r media , some of it is reflected, even when nonpolarized and en -
t i re ly diffuse.
If the back s u r f a c e of t he RHS w e r e free-standing and not at tached to
a substructure , then in te rna l reflection a t the back sur face would be the
s ame a s a t the f ront surface. In other words, R would equal R How- B I' ever , t he magnitude of RB i s controlled to a l a rge extent by the reflectance
of the substructure , the smoothness of the interface, and the method of
attachment. It i s difficult t o accurately predict a value f o r RB f r o m theory;
usually it mus t be determined by experiment.
If the externally incident radiation i s nonpolarized and entirely diffuse,
and the external medium has a re f rac t ive index of approximately 1 . 0 , RE
and R can be es t imated by Equations (11) and (12) given below. In these I equations, n i s the index of re f rac t ion of the RHS.

Z n 3 [ ( < 2 n i 1 ) (n t l ) (n -1) ] t [ y4n411) .] Ln(n\ (n tl) (n -1)
Table 7. ZA-1 gives values for R and R calculated for different indices E I
of refraction using Equations (11) and (12).
Table 7. ZA-1. Fresne l Reflection Coefficient As A
Function of Refractive Index
The three reflection coefficients a r e used in setting up the boundary
conditions for the solution of Equations (6) and ( l o ) , a s described in the
next Section 2.
2. RADSCAT COMPUTER PROGRAM
K t A N D KICOMPUltOFROM EOUIITION5 17.2A-111hND 0 . 2 A - I 7
The RADSCAT computer p rogram is a modified version of the MMC
explicit finite difference digital thermochemical ablation program, T-CAP
111. The one-dimensional ablator model in this program consists of up to
four mater ia l phases: virgin plastic, pyrolysis zone, char , and pyrolysis
vapor. The aeroheating environment is described by time-dependent curves
of convective and radiant heating rates , velocity, and altitude. Surface
heating is accommodated by conduction into the ablator, convective block-
ing due to m a s s injection into the boundary layer , reradiation f rom the
--
0.101V7
0.18810
0.26223
0.32674 0.38332
0.43327
0.17762
0.51718
0.55Ibl
0.58449
0.684-
0.75396
0,80192
-. ~ ~
N
I.050
I . I W
1.150
I .1W > . ? I 0
1.3W
1.350
I 4 W
t.450
I S W
1.m I P W
2 . I W i
- 0 . m
0 .0170
0.D243I
0 . U I
0.02444
0.01223
O.O(E'6
O.OU66 O.OPP38
0.WSII
0.(8831
0.1118~3
0.1397

sur facc , and surface chemical reactions. Material removal. rluc lo s u r -
face react ions , vaporization, sublimation, and spallalion may ljc computed.
The radiant energy absorbed l ~ y each ablator clcmcnt is coml~ined
with the enthalpy t ransi t ions due t o tempera ture changes, pyrolysis r c a c -
Lions, and t ransp i r ing pyroLysis vapors , to clctermine the hcat shicld
t he rma l conduction and internal t empera ture response.
In addition, the thernlal response of a s u l ~ s t r l l c t n ~ ~ c consisting of up
to s ix different nonablating ma te r i a l s can be computed, by means of a t h r e e -
dimensional conduction and radiation heat t ransfer routine.
Tile radiation scat ter ing subroutine in RAIDSCAT divides the heat
shield into two zones: a "hot" and a "cold" zone. Figllre 7. 2 A - 3 denion-
s t r a t e s the analytical model. The hot zone i s the front pa r t of the heat
shicld where the tempera ture i s everywhere higher than T The v a r i - t rans '
T t r a n s i s pre-loaded for a given mater ia l and i s the tempera ture a t
which the scat ter ing ability of the heat shield ma te r i a l i s greatly reduced
because of a change in mic ros t ruc tu re . Many of the ma te r i a l s that will be
considered for u se a s a radiation-scattcring heat shield lose their s c a t t e r -
ing abil i ty a t elcvated tempera tures . "Melting" of the crysta l l ine s c a t t e r -
ing cen te r s rcsu l t s in a l o s s of scat ter ing ability. With Teflon, fo r instance,
opacity maintains until about 6 0 3 ' ~ (330°c) , a t which point the crysta l l ine
cen te r s me l t and the ma te r i a l becomes t ransparen t . The cold zone in
IIADSCAT i s the rcgion a t the backface of the heat shield where the t e m p e r a -
t u r e i s everywhere below T . In addition to being broken up into two t r a n s
zones, the hcat shield i s divided into a la rge number of independently s ized
e lements , for heat t r a n s f e r analysis by finite difference methods. Each of
the two zones i s made up of an integral numbcr of t hese finite difference
elements . Because the elemental t empera tu re s vary with t ime, the boundary
1)ctwccn the hot and cold zones moves with t ime. T h e thickness of each.
c lement i s X where 1, indicates the element number . The total heat L, -
shield thickness i s X . N i s the total number of heat shield e lements , and
M i s the number of hot zone elements . The element a t the sur face of the
al)lator i s a ze ro m a s s and ze ro volume element which is used in an energy
l ~ a l a n c e calculation.

HOT ELEMENTS COLD ELEMENTS
4
u - ZERO HOT LONE
- COLD ZONE
u SU8STRUCTURE
MIS ' TRANS %:tCE SCATTERING COW = Sh T ~ ~ ~ ~ s
SCATTERING COEF c Sc ABSORPTION COEF = Kh AIISORPTION COEF - K c
lol, = I FLUX FROM HOT ZONE INTO c n D ZONE
JO, = J FLUX FROM COiD ZONE INTO MOT ZONE
Figure I . U-3. R ADSCAT Model
In the RADSCAT radiation routine the absorption and scattering coef-
ficients, K and S, a r e preloaded a s functions of wavelength. The routine
does a complete se t of radiation t r ans fe r calculations f o r each wavelength
band and then sums the resu l t s over a l l the bands. Any number of bands
can be input, but presently the maximum number being used i s ten. The K
and S values a r e input in two a r r a y s , in addition to being functions of wave-
length. A "hot" a r r a y i s input for the K and S in the hot zone, and a "cold"
a r r a y i s input for the cold zone. The subscript h i s used to designate the
hot zone and the subscript c for the cold zone; thus K h j Sh, and Kc, Sc.
Every variable could a l so be subscripted with a j t o indicate the band num-
ber . This is done in the p rogram but would be too cumbersome to do in
this discussion. Therefore, subscript j i s implicit in all that follows.
The radiation t ransfer equations in RADSCAT have a closed-form
solution. No i terat ions a r e performed on the radiation fluxes between the
elements. The derivation of the closed f o r m solution i s given a t this
point. As previously presented by Equation (6) and (10). the general solu-
t ions to the Kubelka-Munk differential equations a r e the following:
The closed-form solution requi res that boundary conditions be
specified for th ree regions of the heat shield: (1) the frontface of the hot
zone; (2 ) the boundary between the hot zone and thecold zone; (3) the
backface of the cold zone. The boundary condition a t (1) i s that the intensity
of the I radiation a t the frontface i s equal to a fraction (1-R ) of the E

externally incident radiation (Io). plus a fract ion (RI) of the backscattered
J radiation a t the frontface:
The boundary conditions a t ( 2 ) states that a l l the I radiation that comes out
of the hot zone goes into the cold zone, and a l l the J radiation f r o m the cold
zone goes into the hot zone. The boundary condition a t ( 3 ) s ta tes that a f r a c -
tion (1 -RB) of the I radiation a t the backface of the cold zone i s t ransmit ted
to the substructure, and a fract ion (RB) i s reflected back into the heat
shield a s J radiation.
When the above boundary conditions a r e imposed, they produce the
following s ix simultaneous equations in s ix unknowns:
In the above equations, X and xc a r e the total thicknesses of the hot and h
cold zones, respectively. The s ix unknowns that must be solved for a r e
JO1, IO2, Ch, Ch, C and C;. The solutions can easily be obtained by C
s tandard ma t r ix inversion and multiplication subroutines. Instead of putting
these m a t r i x subroutines into RADSCAT, however, it was decided that i t
would be l e s s costly t o put a c losed-form solution of the above equations in
RADSCAT.

In a typical RADSCAT analysis , the radiation scattering subroutine
sums up the thicknesses of the hot elements to determine the thickness of
the hot zone and then sums the thicknesses of the cold elements to de te r -
mine the thickness of the cold zone. Next, i t solves for the constants
IO2, JO1, Ch, Ch, C and C> After these constants have been solved fo r , C
i t calculates the I and J flux a t the frontface and the backface of each e le -
ment by using Equations (6) and (10). The ra te a t which energy i s absorbed
by each clement, designated E i s equal to I a t the frontface of the element, L' plus J a t the backface, minus I a t the backface, minus J a t the frontface.
The ra te a t which energy i s t ransmit ted to the substructure, Itrans, i s
I a t the backface of the Nth element t i m e s 1-RB. The ra te at which energy
i s "reflected" f rom the frontface of the RHS, Jrefl, is RE t imes the ex ter -
nally incident radiation, plus the J radiation a t the frontface of the 2nd
element t imes 1-R This p rocess i s repeated for each wavelength band I' and the r a t e a t which energy i s absorbed, t ransmit ted, and reflected i s
summed over all the bands.
3. TEFLON ANALYSES
It has been proposed that using a Teflon-reflecting heat shield on the
Pioneer Venus entry probes would be competitive with reradiat ive sys tems
and could possibly be l ighter , a s a resul t of Teflon's ability to scat ter the
incident shock-layer radiation. Therefore , analyses were made using
RADSCAT to quantitatively evaluate Teflon's performance and compare i t
with the performance of other reradiat ive ablators. These analyses were
made for the stagnation point of a blunted Venus probe with the following
entry conditions:
Two probe configurations were considered in the analyses . One was a
sphere-cone forebody with a nose radius ( R ) of 36. 8 cm, and the other was a N
spherical segment forebody, s imi lar to the Apollo design, with a nose r a -
dius of 158. 5 cm. The ma jo r c r i t e r i a on the heat shield performance was

that i t maintain the heat sink s t ruc ture supporting the heat shield at a tem- 0
perature below 422 K fo r stagnation p res su res g rea te r than 1.01 x l o 4 N / r n 2
0 and below 589 K f o r stagnation p res su res l e s s than I . 01 x l o 4 ~ / r n ' . The
substructure heat sink (aluminum) thickness and ablator thickness were
parametr ical ly varied to meet the above temperature c r i te r ia . Note that
a l l analyses described a r e nominal: no design margins a r e included in the
unit weights to accommodate uncertainties. It was assumed in the Teflon
analyses that 30% of the MMC-calculated radiant heating was absorbed by
the ablating boundary layer ( s e e Section 3 . 2). The reradiative ablators ,
however, were analyzed assuming 100% of the MMC-calculated radiation was absorbed a t the surface, with no reflection or absorption in the boundary
layer. Teflon thermophysical propert ies a r e shown in Table 7. ZA-2.
3 . 1 Gray-Body Teflon Analysis
Initially, analyses were conducted using the Teflon radiation sca t t e r -
ing model presented in Reference 4. This re ference predicts Teflon's - 1 - 1
scattering and absorption coefficients to be 10 c m and 0.01 c m , r e -
spectively. These coefficients were derived f r o m reflectometer exper i -
ments on Teflon at room tempera ture and t e s t s of ablating Teflon under
high intensity radiation f r o m a n argon radiation source. It i s assumed i n
th is model that the Teflon i s optically a gray body, with constant absorption
and scattering coefficients over all wavelengths. This model for Teflon
will be r e f e r r e d to a s the "gray-body (G-B) Teflon model ."
F igure 7. ZA-4 presents the resu l t s of the analyses of G-B Teflon a t
the stagnation point of the sphere-cone probe and compares them with the
predicted unit weights of ESA 5500 M3. The total weight of the ablator plus
substructure heat sink i s plotted, because a finite (and in some cases sub-
stantial) heat sink i s required to accommodate the t ransmi t ted energy in
the G-B Teflon analysis. It i s interesting to note the strong influence of
backface reflectance on the G - B Teflon sys tem weight. If a perfect back-
face reflectancc i s achieved (RB = 1. O ) , G-B Teflon is competitive with the
ESA 5500 M3. With a l e s s than perfect backface reflectance, the heat sink
substructure abso rbs a significant fraction of the incident radiation. F o r
a backface reflectance of 0. 9, which i s a real is t ic coefficient for broad-band
reflection, the sys tem weight is nearly twice the weight of a sys tem with
RB = 1. 0. To the left of the minimum weight point in the G - B Teflon curve,

Table 7.2A-2. Teflon Thermophysical P rope r t i e s
DENSITY - 2 1 r o n ~ / ~ ~
VAPOR MOLECULAR WEIGHT - 45.24 KG/MOLE
Htnr OF VAPORIZATION - 1-74 M J ~ G
THERhWI CONDUCTIVITY TEMPERATURE
1. -I - X , JOULUM SEC'I
0.0 0.051m 297.8 o.o51ta 323.9 0.07475 3(8.? 0.07752 283.9 0.07752 407.8 0.WlPB 418.7 0.09436 b53.0 0.07752
I 0 W0.0 0.07752
SPECIFIC HEAT TEMPERATURE
I, OK c,, JOULW%G ' K
0.0 118.4 3W.O 310.1 761.1 426.4
lOm0.0 426.4
SU&:IM/\TION VAPOR PRESSURE -
l/l, O K - ' P (GAS) N/M'
O.OWI8 7.72 x 10'' O.WI80 I . h W x l O o O.WI598 2.W. 10.2 0.W225 2.09" 10
1 0 ~ 0 . 0 2.091 lo-'
0.2 I I I I 0.1 0.2 0.3 0.4 0.5 ' 0.6 0.7 0.8
ABLATOR THICINB i (CM)
Figure 7.2R-4. HeatSh ie ld System Weight versus R,, - GB Teflon
the steep increase in weight i s due to a combination of high t ransmit ted
energy and conducted energy f r o m the hot ablating surface. To the right of
the minimum weight point, the conduction f r o m the hot ablating surface has
l i t t le influence on the substructure temperature, and the increase in weight
i s due to the increase in ablator thickness. In this region of the curve, only
small reductions in t ransmit ted energy occur with increasing G-B Teflon
thidcnesses, and thus only small reductions in the heat sink weight. F o r
ESA 5500 M3 (and G - B Teflon with R B = 1.0) the minimum weight c o r r e -
sponds to a ze ro heat' sink thickness.
Figure 7.2A-5 shows the sensitivity of t h e e n e r g y transmitted to the
backface a s a function of the backface deflectance a n d G-B Teflon thickness.,
and shows why a high backface reflectance i s required to minimize the
t ransmit ted energy (and s t ructure temperature r i se) .
The ablator -heat sink substructure weight versus the substructure
thickness, fo r G-B Teflon and for several reradiative ablators , i s p r e -
sented in Figure 7.2A-6. In addition to the skin thickness weight and

GB T E F L O N TH ICKNESS - C M S; 10CM-l -,
w I: = O . D I C M R - 0 0 R::O:O
Figure 1.U-5. Transmitlance Venus Thibness. R B - GB Teflon
ablator weight, the s t ruc tura l stiffener weight should a l so be included in
the total weight, t o give a t r u e sys tem weight. The effect of st iffeners is
to increase the weight m o r e a t low substructure thicknesses, dependent
only upon the load and tempera ture c r i te r ia , and independent of the ablator
system; therefore, a comparison of ablator performance i s valid with the
present data. Figure 7.ZA-6 shows, a s previously stated, that the minimum
weight of those ablators which do not t ransmit radiant energy corresponds
to a ze ro substructure thickness. On the other hand, when the backface
i s l e s s than perfect , ve ry thick heat sink s t ruc tures a r e required to absorb
the t ransmit ted energy.
STRUCTURE-HL41-SINK m l C K N l S S (CMI
Flqure 7.U-6. Heat Shield Substrudure WelgM Versus Substrwiure Th idna5 - CB Teflon Hdel

Also shown i n F igure 7.2A-6 a r e the sys t em weights for the blunter,
158. 5 an nose radius Apollo configuration. It ha s been suggested that going
to a blunter vehicle would be advantageous with a reflective ablator , since
thc convective environment would be reduced (resul t ing i n l e s s m a s s loss ) ,
and the radiation would be increased, but would a l so be reflected. This
hypothesis i s shown to be t rue , i f the G - B Teflon heat sink s t ruc ture i n t e r -
face i s a perfect reflector. However, with a n in te r face reflectance of 0. 9,
the blunter configuration requi res a substantially g rea t e r sys t em weight
(N60%) than the sphere-cone probe, due t o the ex t re m a s s needed to accom-
modate the increased t ransmi t ted energy. The ESA 5500 M3, on the other
hand, i s relatively insensit ive to the entry configuration. The reduction i n
net convective heating is offset by the i nc rease i n radiant heating for the
Apollo shape, and m a t e r i a l s which accommodate the energy by reradiation
a r c essentially i-ndependent of the entry shape for Venus entry.
Since the heat sink substructure is a significant f ract ion of the G-B
Teflon total sys t em weight, the weight penalty above the ESA 5500 M 3
weight can be reduced by using a m o r e efficient heat sink. F igure 7. 2A-7
shows that significant weight reductions can b e achieved with a beryl l ium
heat sink, but the sys t em weight i s st i l l g r e a t e r than m o r e efficient r e -
radiative ab la tors such a s Quartz Nitrile Phenolic and ESA 5500 M3.
GWY-BODY QUARTZ GRAYdODY TEFLON -1 RB = o.9 C O N NITRILE TEFLON
PHENOLIC RlENOLK E U m A . 3 % = O " tSb 55W M3 C Z n ., * 2 ". 1.5 = 2 Y "$1.0 *
3 Y " 0 = 2 5 0 . 5
3 : < i=
0 WnITPUCrVIE lil BE A1 BE A1 BE A1 BE A I Bt A I BE
\ / ., IPHERWCONE URGE PROBE -
APOLLO LARGE AIWE
Figure 1.2A-1. Redudion in Heal Shield Sydem Weight with Beryllium
7.2A-15

The minimum point in the curve of heat shield-substructure weight
ve r sus substructure thickness in Figure 7.ZA-6 was chosen for the C-I3
Teflon sys tem weights, For the reradiative ablators, the minimum s y s -
t e m weight corresponds to the unrealist ic zero subsLructure thickness.
Therefore, 0. 1 c m aluminum was assumed to be representative of typical
aeroshel l skin thicknesses, and was used a s thc bas is f o r calculating r e -
radiative ablator system weights fo r Figure 7.2A-7.
3 . 2 Non-Gray -Body Teflon Analysis
An examination of the spectral distribution of the shock-layer rad ia-
tion shows that for Venus entry, the major fraction of the energy i s in the
ultraviolet. Figure 7. 2A-8 compares the spectral radiation f rom MMC
calculations (Reference 7) with those of Sutton and Falanga (Reference 8).
Both sources u s e the same radiating models. The differences in resu l t s
a r e attributed to differences in the methods of calculating fluxes, and gas
composition, velocity, gas density, and vehicle nose radius. The resu l t s
plotted a r e for the continuum processes and molecular band radiation only.
No atomic line radiation i s included in the plots, but i s included in the hea t -
ing used in the ablation analyses. The MMC calculations a r e for a se l f -
absorbing, isothermal , adiabatic layer. Sutton and Falanga include non-
adiabatic and nonisothermal efforts. T o account for the nonadiabatic, non-
i so thermal effects in the ablation analyses, the MMC radiation i s multiplied
by a t ime varying "cooling factor" (Reference 9). Sutton and Falanga p e r -
formed m o r e detailed analyses, which included absorption by the ablation
m a s s injection. The spectral distribution of the net flux to an ablating wall
is a l so shown in Figure 7.2A-8. As can be seen, there i s a significant
reduction in heat flux to the wall in the vacuum U V , but no effect in the near
U V , visible, o r infrared. Most of the absorption is due to the cooler bound-
a r y layer , with very l i t t le additional reduction in radiation caused by the
ablation m a s s injection. The analyses of absorption by ablation m a s s in-
jection were performed for steady-state ablation of high density nylon 2
phenolic, ( P W w = 0. 371 k g / m -sec. This i s approximately equal to the 2
m a s s loss ra te of G-B Teflon (0.458 k g l m -set) and ESA 5500 M3 10.640 2
kg /m - sec) a t peak heating.

MMC CALCULATIONS. ISOTHERMAL AOIIIBi\TIC SHOCK LAYER
IUTTON 6 FALANGA. AT THE BOUNDARY LAYB:EDGE
SUTTON 6 FALANGA. AT THE NONABLATINO WALL
- SUTTON & FALANGA. A 1 THE . A B L ~ T I N G WALL
0 1 b 10 11 I4
IINFRAREDI VISIBLE I NEAR U V I VACUUM UV
PHOTON tNERGY ICY)
Figure 7. ?A-8. Boundary Layer and Ablation tlfecis on VenusEntry Radiation
F o r the Teflon analyses (with both the G - B Teflon and the non-gray-
body model described fur ther on), i t was assumed that 30% of the MMC
nonadiabatic isothermal s lab radiation i s absorbed in the boundary layer ,
approximating the predictions of Sutton and Falanga for the net flux to a n
ablating wall.
No increase in convective heating due to boundary layer absorption
was assumed, although Sutton and Falanga maintain that "absorption of
radiation in the boundary layer can increase the convective heating by 5
to 15 percent ." In the ESA 5500 M3, consistent with previous analyses ,
it was assumed that none of the MMC calculated radiation i s absorbed in
the boundary layer .
I t is concluded, based upon the Sutton and Falanga analyses , that
the boundary layer and ablation products will attenuate only a fract ion of
the incident energy i n the ultraviolet , and the remainder must e i ther be
absorbedlsca t te red by the Teflon o r reflected f r o m the Teflon-substrate
interface. At around 5 eV, Teflon absorption inc reases significantly;
therefore, the radiation i n the vacuum UV, which reaches the ablator s u r -
face, will be absorbed nea r the Teflon surface, increasing the Teflon weight
required, and reducing the energy t ransmit ted to the substructure.

Radiation proper t ies derived f r o m experiments with radiation energy
levels l e s s than 5 eV may yield unrealist ic resu l t s . F igure 7. 2 A - 9 c o m -
p a r e s the spec t ra l distribution f rom a xenon a r c lamp (Reference 10) with
the net spec t r a l distribution predicted f o r Venus en t ry by Sutton and Falanga.
It can be seen that the xenon a r c lamp emi ts p r imar i ly in the visible, and
infrared, with a sma l l f rac t ion in the nea r ultraviolet , and none in the vacu-
um ultraviolet. Argon a r c s have s imilar spec t ra l distributions. It can be
seen, therefore , that misleading resu l t s can occur if Teflon i s tested in an
ine r t gas a r c lamp. Over the lamp spec t ra l range, Teflon has low absorp-
tion, and metals show reasonably good reflection, so good performance i s
anticipated. However, analyses show that Teflon t r ansmi t s too much radi-
ation in the spectral range over which i t s absorption i s low. Tes t s confirm
this, a s i s shown in F igure 7. 2A-10. This f igure p re sen t s the resu l t s of
tes t s conducted in the AEHS facil i ty a t NASA-Ames. The tes t models con- 2
sisted of equal weight of ablator (1.15 g / c m ) over polished aluminum,
0. 236 c m thick. T e s t t ime was 2 . 6 5 seconds. At the conditions tes ted,
reradiat ive ab la tors a r e fa i r ly insensit ive to increasing radiation; su r f ace
ablation and reradiat ion increase to accommodate the incident radiation,
with l i t t le change in peak backface temperature . Teflon pe r fo rms different-
ly, with l i t t le change in surface m a s s loss , ~ o n s i s t e n t with previous resu l t s
(Reference 2). Rather than absorbing the radiation, the Teflon ref lects o r
t ransmi ts the radiant energy. These t e s t s indicate that approximately 5%
of the incident lamp radiation i s t ransmit ted to the substructure with a pol-
ished aluminum backface. Less t ransmiss ion may be achieved with a pol-
ished s i lver backface, which has better reflection below 2. 2 eV (Reference
11). This could be optimistic, however, since between 2. 2 eV and 5 eV
Teflon i s expected to be approximately a s t ransparent a s below 2.2 eV, and
the s i lver ref lectance d rops to about 0. 10 a t 3. 9 eV, while aluminum can
retain a reflectance on the o r d e r of 0. 9 0 into the vacuum UV.

P1101CN ENERGY (N)
fiiura 1.2A4. J7mJlant Heating Spedra l Dlstributlon - Xemn Arc Versus Vanus Entry
TEFLON
3.0,-
CARBON PIlENOLlC
u
'----- ESA 5 H a M3
2.5 TEFLON
-0 QUA872 NllRlLE PHMOi IC
P 1.5 ESA 5 W M 3
u y 1,o
0.5
CARBON RlENOLlC
0- 45- 0 Ha lm0 lHa 2.m 2 x 0 Ym 0 Ha IKU lwxl 1.m 2 W 3.m
RADIANT FLUX (WATTS/CM'I RADIANT FLUX IWATTI/CM~)
CONVECTIVE FLUX = l l m WAWSRM~ AT ALL TEST5
Figure 7. U-10. Lblcior Performance in Terts at NASA Ames
For an accurate analysis of Teflon (or any other reflective ablator), the
scattering and absorption coefficients and ablator -heat sink structure
reflectance must be known as a function of wavelength. An approximate
analysis, however, can be made which better describes the behavior of
Teflon in radiation with a vacuum ultraviolet component. An analytical
model was setup which assumed that for the radiation in the infrared and
visible, Teflon has the scattering and absorption coefficients 10 cm-' - 1 and 0.01 cm , respectively, consistent with the available data. In the
near UV, the test data indicates that Teflon has a very small optical depth
(References 3, 12); therefore, the absorption and scattering takes place

nea r the front surface. Based upon this information, i t was assumed that
15% of the incident near UV i s absorbed i n the Teflon sur face and the r e -
maining 8 5 % i s reflected; none of the incident near UV i s t ransmit ted to the
substructure. All the incident vacuum U V i s absorbed in the Teflon s u r -
face.
F igure 7.2A-11 compares the computed Teflon sys tem weights for
this non-gray -body model with the G - B model predicted weights. As in
F igure 7.2A-7, 0. 1 c m aluminum was a s sumed the minimum heat sink
substructure thickness for the reradiat ive ablators . As can be seen, with
the non-gray -body model, significant inc reases i n Teflon weight over the
G-B model a r e required, due to grea ter surface m a s s loss ; but substan-
t ially l e s s heat sink substructure i s required, because of the small f r a c -
t ion of t ransmi t ted energy. This t rade i n heat accommodation modes,
while it does reduce total sys tem weights, does not bring Teflon down to
the unit weights of efficient reradiative ablators .
ABLAlOR WIGHT
GRAY-BODY TEFLON I(. = 0.9
SPHERE-CON;LAIGE PROBE AWLLO L ~ R G E PROBE
Figure 1.2A-11. Comparivln of NCB Teflon with CB Teflon and Other Ablaorr
4. CONCLUSIONS AND RECOMMENDATIONS
A computer p rogram has been written which accurately models the
pertinent physical phenomena associated with radiation scattering heat
shields. Analyses of Teflon with this computer program, using radiation
proper t ies presented in other publications, indicate that for scattering and - 1 - 1 absorption coefficients of 10 c m and 0.01 c m , Teflon t ransmi ts

I substantial fractions of incident radiant energy. This transmission of
radiant energy requires significant heat sink structure weight, which makes
a Teflon heat shield system heavier than other efficient ablative systems
such a s ESA 5500 M3 and Quartz Nitrile Phenolic. Evaluating the spectral
distribution of incident radiation from a Venus entry probe shock layer
indicates that gray-body Teflon analyses a r e not correct since a substantial
fraction of the radiation i s in the vacuum UV where Teflon i s a strong
absorber. Approximate analyses including absorption of the UV predict
that Tcflon heat shield system weights a r e very competitive with carbon
phenolic, but a r e still significantly greater than efficient reradiative
ablators. The absorption of UV by the Teflon reduces the heat sink sub-
structure weight, but increases the surface mass loss.
An improved radiation scattering heat shield with efficiency greater
than reradiative ablators may be achieved if a material i s developed that
has greater heat of sublimation (reducing surface mass loss) , and a higher
scattering coefficient, while maintaining the insulation efficiency of Teflon.
Such a material has yet to be demonstrated, but should be pursued with
emphasis on outer planet entry.

REFERENCES
W. M. Congdon, "Radiation Scattering Heat Shields, 1972 Final Report, " MMC IRAD Report R-72-48691-001 (December 1972).
P. R. Nachtsheim, D. L. Peterson, and J. T. Howe, "Reflecting Ablative Heat Shields fo r Radiative Environments, " AAS Paper pp 71-147 (1971)
D. L. Pe terson and W. E. Nicolet, "Heat Shielding for Venus Entry Probes, " Pre l iminary Data, t o be published.
J. T. Howe, M. J. Greene, and K. Weston, "Thermal Shielding by Subliming Volume Reflectors in Convective and Intense Radiative Environments, " unpublished and updated NASA paper.
K. C. Weston, J. T. Howe, and M. J. Greene, "Approximate Tempera ture Distribution for a Diffuse, Highly Reflecting Material , " AIAA Journal, Vol. 10, No. 9, 1252 (September 1972).
P. S. Mudgett and L. W. Richards, "Multiple Scattering Calculations for Technology, " Applied Optics, Vol. 10, No. 7, 1485 (July 197 1).
Memorandum f r o m C. T. Edquist to J. R. Mellin, "Prel iminary Pioneer Venus Convective and Radiative Results, " MMC P73-44432- 058, January 11, 1973.
K. Sutton and R. A. Falanga, "Stagnation Region Radiative Heating with Steady State Ablation during Venus Entry, " paper presented a t Symposium on Hypervelocity Radiating Flow Fields for Planetary Ent r ies , January 14-15, 1972.
Memorandum f r o m C. T. Edquist t o J. R. Mellin, ItRadiative Cooling Fac tor for Venus Ent ry Environment Predictions," MMC P71-44498- 292, 24 November 1971.
Data f r o m Tamarak Scientific Company, Orange, California.
Y. S. Touloukian and D. P. DeWitt, Thermophysical Proper t ies of Matter, Volume 7, "Thermal Radiation Proper t ies Metallic Elements and Alloys." (Plenum P r e s s , 1970).
Personal communications f r o m P. R. Nachtsheim, D. L. Peterson, NASA ARC, January 16, 1973.

APPENDIX 7 . 4 A
PRESSURE SHELL TEMPERATURE GRADIENTS
WITH CONCENTRATED INSULATION PENETRATIONS

APPENDIX 7.4A
PRESSURE SHELL TEMPERATURE GRADIENTS WITH CONCENTUTED INSULATION PENETRATIONS
The p re fe r red AtlasICentaur l a r g e probe design i s such that a l l p r e s -
s u r e vesse l penetrations a r e located in a single band offset slightly f r o m
the equator of the spher ica l p r e s s u r e vessel. These penetrations include
science windows, e lec t r ica l feedthroughs, and s t ruc tura l members . All
of these p r e s s u r e vesse l penetrations a r e a l so insulation penetrations and
r ep resen t a concentrated heat t ransfer path f r o m the environment to the
p r e s s u r e vesse l wall. This causes a concern relative to the possibility of
having la rge spatial tempera ture gradients along the p r e s s u r e vesse l walls.
If l a rge gradients do exis t they could give r i s e to thermal s t r e s s problems
and, fur ther , would cause inaccuracies in ou r design calculations which a s -
sume the p r e s s u r e vesse l i s i so thermal a t any given instant of time.
In o rde r to investigate this problem, a 17-node thermal model of the
l a rge probe was constructed to de termine the magnitude of the tempera ture
gradients in the p r e s s u r e shell during the descent phase. The probe shell
was divided into five sections a s sketched in F igure 7.4A-1. Nodes 1 and 5
were spherical end caps and nodes 2, 3 , and 4 were spherical segments. All
payload equipment and a l l science penetrations were attached to shell node
number 4. High conductance, c i rcumferent ial flanges were located a t the
junction of nodes 3 and 4 and a t the junction of nodes 4 and 5.
iNS ATE0 / /'"/
HERE /
3 + -- TITANIUM / / / //// - ALUMINUM
, /,
l!ME lHRI Figure 7.44-1. Large ProbeTransient Shell Temperature5
7.4A-1

The actual time-temperature profiles for these 5 nodes a r e shown in
Figure 7.4A-1 for a 0. 53-cm (0.21-inch) thick aluminum shell covered
with a 2. 54-cm (1-inch) layer of MIN-K insulation and a 0. 33-cm (0.13-
inch) thick titanium shell covered with a 1. 5-cm (0.59-inch) layer of MIN-K
insulation. The temperature differences between adjacent nodes a r e shown
in Figure 7.4A-2 for the same descent profile.
I - INSULATION / ,--_ QENETRATIONI CONCENRATED /- ‘ \ a> nrai
\ \ \
-ALUMINUM
-- TITANIUM
I / 3-2
2-1
TIME IHR)
Figure 7.44-2. Temperature Gradients i n Large Probe Pressure Shell
These analyses indicate that the 1. 5-cm layer of insulation results 0
in a titanium shell temperature of 540 K a t the end of the descent. In
addition, the high heat f l u x plus the thin wall thickness and the low thermal
conductivity of the titanium shell compared to the aluminum shell produce
temperature gradients up to 3 5 ' ~ per foot of circumferential length.
Increasing the insulation thickness to 2. 54 cm plus changing the shell
material to aluminum and increasing the wall thickness from 0.33 cm to 0 0.53 cm reduces the maximum shell temperature to 420 K. In addition,
the increased thermal conductivity and cross-sectional conduction area
reduce the temperature gradients in the shell to l ess than 1 1 ° ~ per foot of
circumferential length.
These results show that thermal s t ress i s not an important consider-
ation, particularly for an aluminum shell. Also, the assumptions of an
isothermal pressure shell is shown to be reasonable.

APPENDIX 7 . 5 A
PARACHUTE SIZING ANALYSIS SUMMARIES

APPENDIX 7.5A
PARACHUTE SIZING ANALYSIS SUMMARIES
1. SUMMARY OF SIZING CALCULATIONS
I . 1 Main Parachute
2 2 Required B = 7. 85 k g / m (0.05 s luglf t )
Descent weight, W = 216 kg (475 lb)
Use RGS canopy: C D = 0. 8 (based on inflated d iameter )
Required a r e a , S = w - - 2 16 ,9 .CD 7.85 ( .8 )
2 = 34.4 m 2 (369 f t )
Required d iameter , = d x p m T P n n
= 6 . 6 2 m ( 2 1 . 7 f t ) 2 2
Drag a rea , CDS = 0 . 8 (34.4) = 27. 5 m (295 f t ) 2
Canopy loading = ,4 = 7.85 k g / m , q = 77 N / m 2
Descent velocity a t h = 42.9 km, v = rn P = d3. 855 (1"z~~\em~cy3r
v = - 39. 9 = 6. 32 m / s (20.7 fps) 3. 855 (10 ) (10 )
Opening force, Fo = Xq C S 0 D 2 X = 1.1 (hdbk), q o = 1820 N / m (38 psf)
F = 1. 1 (1820) (27. 5) = 55 000 N(12 400 lb) 0
Chute Dlforebody (aeroshe l l ) d = 6.6211. 75 = 3.78 (good rat io)
1. 2 Pilot Parachute
Cr i te r ia : Apply minimum log force for main chute extract ion o r make 2 ,4 = 0.6 (7.85) = 4. 70 k g / m .
Use the l a r g e r s i ze 2 Assumptions: Inflation q = 1296 N / m (25 psf) and C D = 0 . 4 a s a wors t c a s e
condition
Extraction F = gw; g = 10, W = 9. 80 kg ( f r o m weight es t imates)
F = 10 (9. 80.) (9. 806) = 960 N (214 1b) F 960
Area required, S = q . C D = 1296 ( . 4 )

4(1. 83) D i a m e t e r ( in f l a t ed RGS), D = 4
= 1.52 m ( 5 . 0 0 f t ) 2 : 2 . '
U s i n g 6 = 4 .70 k g / m ( 0 . 0 3 s l u g l f t )
R e q u i r e d C S = m / ~ ; M = w e i g h t of a f t c o v e r a n d p i lo t D = 5. 91 k g ( f r o m weight e s t i m a t e s )
D = dm= n 2.0 m ( 6 . 5 8 f t )
D / a e r o s h e l l d = 2 . 0 / 1 . 7 5 = 1. 1.4 ( f a i r r a t i o )
U s e 2 . 0 m d i a m e t e r RGS p i l o t
Fo = X qo CDS = 1. 1 (1820) 1 .26 = 2520 N(565 lb)
1. 3 P i l o t M o r t a r 3 3
U s e p a c k d e n s i t y = 641 k g / m (40 l b / f t )
W = 0 . 8 2 k g ( 1 . 8 l b ) f r o m e i g h t e s t i r k t e s 3 ,
Vo lume r e q u i r e d = 0.821641 = 0 .00127 m 3 3 = 1270 cm (77.6 in. ) .
U s e s t r o k e / b o i e r a t i o = 1 .0 ( " square" m o r t a r ) .
b o r e = s t r o k e = . = 11 .72 c m (4 .62 i n . )
O v e r a l l d i m e n s i o n s :
12 .25 CM OD (4 .82 IN. )
(6 .85 IN. )

Mortar Reaction F o r c e and Impulse:
Ejected weight, M = 1.05 kg; including pilot and covers (2 .3 lh) e
Ejection velocity = 18. 3 m / s (60 fps) = v
Stroke, s = 0. 117 m (0. 38 f t )
Energy = 1 /2 M v2 = 1 12 (1. 05) (1 8. 3) 2
e = 175 N - m ( 1 2 8 f t -1b) = KE
Assuming a n "inefficiency" factor = 1.3:
Energy = 1.3 (175) = 228 N-m = KE'
Reaction fo rce = K E ' / s = 2281. 117
= 1950 N (440 lb)
Impulse:
2s 2 ( ' 1 1 7 ' = 0 . 0 1 2 8 s = t Operating t ime = - = V 18.3 Average force = K E / s = 175/0. 117 = 1495 N = F
Impulse = F = 1495 (0.0128) = 19. 1 N-s (4. 3 l b - s ) t
2. SUMMARY OF WEIGHT ESTIMATES
Note: Weights a r e based on (1) handbook data, (2) calculations, and (3)
es t imates f r o m available hardware information.
Main Parachute:
Canopy and l ines (handbook and calculations) 8. 15 kg
Deployment bag (est imate) 0.32 kg
Swivel (es t imate)
Bridle calculations:
Total load on 3 legs = 55 000 N
Leg angle = 0.436 rad (25')
Overall design factor (handbook) = 2. 5
1 - leg load = P = " O o O - 20 200 N (4550 lb) 3 cos 0.436 -
Required P = 2. 5 (20 200) = 50 500 N (11 400 lb)
Use 2-ply, 40 000 N (9000 lb) b. s. nylon webbing a t lO /gm/m (3.25 ozIyd)
Leg Length = 0. 615 m (2. 0 f t )
1 - l eg weight (10% allowance) = 1. 1 (2) (101) 0.0615 = 136 gm
Total = 3 (136) = 408 g m = 0.41 kg (0. 9 lb)
Main chute total = 9. 39 t 0. 41 = 9. 80 kg

Pilot parachute, including br id le (handbook
and calculation) 0.82 kg
Pi lot m o r t a r (calculation) 0.59 kg
Main chute container (calculation) 1 .72 kg
Extract ion bridle (calculation) 0.18 kg
Main parachute pack 9.80 kg
Sys tem total 13.11 kg
(28. 9 lb)

APPENDIX 7.6A
COMMUNICATIONS AND TRACKING USING
LOGNORMAL CARRIERS
i. Introduction and Summary
2. Telecommunication System Model
2. i Channel Model Based Upon Turbulence Theory and the Lognormal P r o c e s s
2. 2 The Rician Channel Model and I t s Interconnection with the Lognormal Model
2. 3 The Channel Output Equation
2. 4 Characterization of Channel Multipath Due to Planetary Backscat ter
3. Characterization of a Phase-Locked Loop Receiver Per formance in the P resence of Planetary Multipath and Turbulence (Lognormal Channel)
3. i The Loop Equations fo r Both One-Way and Two-Way Operation
3. 2 The Data Channel Equation
3. 3 E r r o r Probabili ty Per formance
3. 4 Tracking Loop Analysis (Limi ter Absent)
4. Tracking Loop Analysis when a Limi ter Precedes the Loop: Backscat ter and Turbulence P resen t
4. 1 Static Phase E r r o r Build Up Due to the Doppler Profi le
4. 2 Doppler Variance in the Transponder Loop and Suppression on the Downlink C a r r i e r Due to Uplink Effects
5. Performance of Two-way Links in the P resence of Multipath and Turbulence
6. Conclusions
7. Addendum
References

APPENDIX 7.6A
COMMUNICATIONS AND TRACKING USING LOGNORMAL CARRIERS
1. INTRODUCTION AND SUMMARY
This appendix addresses problems pecu l i a r t o comunica t ions systems de-
signed t o t ransmi t information from a probe descending through t h e Venus
atmosphere. The problem of modeling one-way and two-way coherent l i n k s i s
emphasized by iden t i fy ing t h e appropr ia te system parameters t h a t a f f e c t t he
development of accura te design con t ro l t a b l e s .
From the o u t s e t , cha rac te r i za t ion of t h e channel mult ipath, turbulence,
and absorpt ion phenomenona has presented t h e s i n g l e most important and tedious
technica l problem a r e a . Careful ana lys i s and var ious s tudy e f f o r t s were de-
voted t o a r r i v i n g a t a channel model t h a t could be j u s t i f i e d on t h e b a s i s of
compatible t h e o r e t i c a l evidence a s well a s experimental observat ions . The
base o f knowledge c e n t r a l t o t h e channel fading e f f e c t s has developed around
the Rician and lognormal fading phenomenon.
I n i t i a l l y , deWolf (References 1, 2 , 3) produced a theory based upon a
mul t ip le s c a t t e r i n g model which ind ica ted t h a t t h e depth of fading was su f -
f i c i e n t l y severe t o produce a f i r s t - o r d e r Rician dens i ty i n the received s igna l
amplitude f l u c t u a t i o n s . Later , T a t a r s k i i (Reference 4 , pp. 388) pointed ou t
t h a t deWolfls de r iva t ion of t h e s t a t i s t i c s of the amplitude f l u c t u a t i o n s were
incor rec t owing t o t h e f a c t t h a t he had omitted c e r t a i n connections i n t h e
Feynman diagram. Moreover, it i s shown i n t h e addendum of t h i s appendix t h a t
the de r iva t ion of t h e zero cross ing p roper t i e s o f t h e envelope developed by
deWolf (Referenc 2, Equation 5) a r e i n c o r r e c t . However, deWolf used t h i s
theory t o " jus t i fy" t h e magnitude of t h e o u t e r s c a l e s i z e of turbulence which
was conjectured e a r l i e r by Kolosov, Yakovlev and Yefimov (Reference 5). Ac-
cording t o Lawrence and Strohbehn (Reference 6 ) , deWolf now (Reference 7)
seems t o favor t h e lognormal d i s t r i b u t i o n found by T a t a r s k i i (References 4 , 8)
using Rytov's method t o so lve t h e wave equation. A physica l d iscuss ion po in t -
ing out the d i f f e rences i n t h e two approaches (deWolf and T a t a r s k i i ) i s given
by Strohbehn (Reference 10) . The primary d i f f e r e n c e stems from t h e f a c t t h a t
severe depths o f fading lead t o t h e Rician d e n s i t y , while small f l u c t u a t i o n s , lead t o small fading depths and lognormal f l u c t u a t i o n s i n the received s igna l

amplitude. Strohbenhn's (Reference 10) d iscuss ions tend t o favor the lognormal
f l u c t u a t i o n s and so does Ishimaru (Reference l l ) , Woo and Ishimaru (Reference
12) , and Crof t , Eshleman, Marouf, Tyler (Reference 1 3 ) .
Various d a t a taken from t h e Veneras 4 , 5, 6 and 7 spacec ra f t , and t h e
Mariner V f lyby spacec ra f t , have been analyzed t o determine t h e depth of fading
and t h e fading r a t e (References 12, 1 4 , 15). The consensus developed from
t h e i r observat ions seems t o i n d i c a t e the depth of fading i s small and, the re -
f o r e , d i s t r i b u t e d i n accordance with a lognormal d i s t r i b u t i o n . Various o ther
experimental evidence i s quoted i n t h e appendices p red ic t ing lognormal fading.
The a p p l i c a b i l i t y of t h e complex lognormal turbulence model with a
r e l a t i v e l y weak fading amplitude follows e s s e n t i a l l y from two sources of ex-
perimental d a t a . The f i rst i s t h e ana lys i s of t h e experimental d a t a f o r
Venera 7 ( t h e l a t e s t Russian probe d a t a published) by Yakovlev (Reference 14)
based on t h e usual en t ry probe turbulence model used f o r Venera 4, 5 and 6 .
The second i s t h e app l i ca t ion of Mariner-5 d a t a t o a d i f f e r e n t f lyby model
developed and analyzed by Woo and Ishimura (Reference 12) . The r e s u l t s of
Woo and Ishimura ind ica te s good agreement with t h e r e s u l t s of Woo (Reference
15) i n applying Yakovlev's r e s u l t s (Reference 14) t o t h e case of Pioneer-
Venus. I n p r i v a t e communications Woo ind ica te s t h a t t h e worst-case r e s u l t s
f o r the var iance of amplitude and phase f l u c t u a t i o n s given i n Reference 15
w i l l be smal ler upon f i n a l assessment of Mariner-5 d a t a .
Based on t h e work of T a r t a s k i i (References 4, 8 ) , which p r e d i c t s a com-
p lex lognormal channel response f o r small f l u c t u a t i o n s , Woo (Reference 15)
presented a survey o f the va r ious propagation s t u d i e s pe r t a in ing t o t h e Pioneer-
Venus channel. He a l s o summarized and 'derived p e r t i n e n t c h a r a c t e r i s t i c s
needed i n determining bas ic communication system i n t e r f a c e parameters and
frequency spec t ra . Woo (Reference 15) and Woo and Ishimura (Reference 12),
on t h e o the r hand, p resen t p e r t i n e n t d a t a (derived p r imar i ly from processed
Venera and Mariner f lyby da ta) needed i n cha rac te r i z ing t h e parameters o f the
lognormal dens i ty and i n preparing the design c o n t r o l theory.
On the b a s i s of t h e e x i s t i n g turbulence theory and experimental d a t a ,
i t was recommended t h a t the mathematical model f o r the probe telecommunication
system be based upon a lognormal channel. A lognormal channel i s defined here

t o imply t h a t i ts response t o a s inusoidal c a r r i e r produces a lognormal car-
r i e r , i . e . , if A s i n pot + 8(t)] i s t ransmi t ted , then t h e channel output i s 0
given by A(t) s i n pot + $ ( t ) + e(t)] where A(t) = A. exp [ x ( t ) ] , with
Fx(t) 1 a gaussian process and with t h e phase process { $ ( t ) l a l s o gaussian.
The des ign con t ro l t a b l e s a r e prepared u n d e r ' t h e above assumptions.
I n order t o prepare accura te design con t ro l t a b l e s , f o r probe communica-
t i o n systems, it has been necessary t o cons t ruc t a theory which accounts fo r
t h e a f f e c t s which lognormal c a r r i e r s produce on t h e performance of one-way
and two-way phase-coherent t r ack ing and da ta -acqu i s i t ion systems. S ince t h i s
theory has not been completely developed, it has been necessary t o cons t ruc t
( t o t h e extent poss ib le) a theory which accounts f o r degradat ions i n t racking
system performance a s well a s i n t h e d a t a channel. One major cont r ibut ion of
t h e s tudy i s t h a t i t has led t o t h i s development. This theory i s presented
by f i rs t developing a mathematical model of one-way and two-way probe l ink
channels, then ca r ry ing o u t t h e necessary a n a l y s i s . Included i n t h e analys is a r e
the e f f e c t s o f p l ane ta ry backsca t t e r on performance a s well a s t h e development
of how t h e channel amplitude f l u c t u a t i o n a f f e c t s the performance of a phase-
locked system preceded by a bandpass l imiter,
A t t h e o u t s e t , i t was f e l t t h a t t h e body of theory t h a t p resen t ly e x i s t s
i n t h e l i t e r a t u r e f o r designing systems which must combat Rician fading could
be used; however, by making a c a r e f u l ana lys i s and comparisons of t h e theory
developed here f o r lognormal fading with t h a t f o r Rician fading, i t was found
t h a t even though t h e amplitude f l u c t u a t i o n s a r e small, t h e two t h e o r i e s y i e l d
considerably d i f f e r e n t lo s ses . Appendix 7.6C o u t l i n e s the d i f f e rences f o r
uncoded PSK communications. I t t u r n s out t h a t , f o r a f ixed depth of fading,
t h e Rician fading f l u c t u a t i o n s a r e more d i f f i c u l t t o combat than a r e fading
f l u c t u a t i o n s having lognormal s t a t i s t i c s . For example, using t h e da ta given
by Woo (Reference 15) f o r Venera 4 , t he theory p r e d i c t s a fading los s of ap-
proximately 11 d e c i b e l s f o r Rician fading and 2 .2 dec ibe l s f o r lognormal fad-
ing a t t h e su r face . Using Venera 7 d a t a a t t h e su r face and a b i t e r r o r prob-
a b i l i t y o f (Reference IS) , t h e Rician fading l o s s is approximately 5.3
dec ibe l s , while t h e lognormal fading los s i s about 0.7 dec ibe l s f o r zeni th
propagation angles . For very small variances i n t h e aniplitude f l u c t u a t i o n s ,
t h e d i f f e r e n c e between t h e loghormal and Rician dens i ty funct ions i s small .

However, it i s important t o n o t e t h a t even though t h e values of t h e var iance
of amplitude f l u c t u a t i o n s seem smal l , as determined by Woo (Reference 15) f o r
t h e Pioneer-Venus channel, they a r e not small enough t o make Rician fad ing
appear lognormal o r v i c e v e r s a . For l a r g e f l u c t u a t i o n s , t h e lognormal dens i ty
i s markedly d i f f e r e n t from a Rice d e n s i t y . This means t h a t t h e theory devel-
oped f o r each channel model would g ive h ighly d i f f e r e n t r e s u l t s . On t h e o t h e r
hand, i f t h e amplitude f l u c t u a t i o n s a r e l a r g e , then t h e lognormal d e n s i t y , a s
p red ic t ed by Rytov's moethod of so lv ing t h e wave equat ion , no longer remains
v a l i d f o r t h e Venus channel.
I n developing t h e theory f o r use i n prepar ing t h e design con t ro l t a b l e s ,
s e v e r a l d i f f i c u l t problems have a r i s e n ; f o r example, t h e performance of a
phase-locked system whose inpu t s i g n a l component i s fading . A summary of t h e
e f f o r t s and key r e s u l t s developed t o d a t e a r e given i n t h i s appendix. I t
should be pointed out h e r e t h a t although t h e problem cannot be considered as
completely solved c l o s e approximations have been obta ined .
In order t o a s ses s t h e degradat ions i n performance, i t has been necessary
t o model and c h a r a c t e r i z e t h e behavior o f coherent t r ack ing systems i n t h e
presence of lognormal c a r r i e r s . This appendix summarizes and p resen t s mathe-
mat ica l models and i n v e s t i g a t i o n s , wi th in t h e time c o n s t r a i n t s , of the de le-
t e r i o u s e f f e c t s produced on t r ack ing performance a s well a s t h e da ta d e t e c t i o n
process . Although t h e work cannot be considered a s complete, i t has been
shown, f o r t h e lognormal fad ing expected on t h e probes and f o r uncorre la ted
amplitude and phase components, t h a t t h e random p h a s e - c h a r a c t e r i s t i c can be
t racked by t h e loop. The random phase -cha rac te r i s t i c w i l l however a f f e c t t h e
a b i l i t y t o measure doppler accu ra t e ly , and t h e theory t o a s ses s t h e degrada-
t i o n i s given. I t has been d i f f i c u l t t o a s s e s s , exac t ly , t h e e f f e c t s of t h e
amplitude process on t r ack ing performance; however, f o r small amplitude f l u c t u -
a t i o n s , t h e degradat ion i n loop s igna l - to -no i se has been charac ter ized and
shown t o be l e s s than 0 . 2 d e c i b e l . The e f f e c t s of c o r r e l a t i o n between t h e
amplitude and phase process were not f u l l y i n v e s t i g a t e d . I t appears t h a t t h e
c o r r e l a t i o n e f f e c t s manifest themselves by producing an unsymmetric c a r r i e r
spectrum f o r t h e loop t o t r a c k . This e f f e c t i s a cur ious one and should r e -
ce ive f u r t h e r s tudy i n order t o a s ses s t h e degradat ions ( i f any) and e f f e c t s
on t r ack ing performance a s well as on t h e performance of t h e d a t a d e t e c t o r .

Moreover, it i s probably s a f e t o conclude t h a t t h e theory developed t o d e t e r -
mine t h e e f f e c t i v e loop s igna l - to -no i se r a t i o does n o t s e rve t o t e l l t h e com-
p l e t e s t o r y .
An ana lys i s requi red t o a s ses s t h e e f f e c t s of p l ane ta ry back- sca t t e r on
t h e ground r ece ive r and transponder performance i s given i n Appendix 7 . 6 G .
Fur ther d e t a i l e d work needs t o be done, using t h e theory given here, i n o rde r
t o accura te ly determine i t s e f f e c t s ; however, a prel iminary inves t iga t ion
r evea l s t h a t they a r e smal l .
While t h i s appendix p resen t s t h e theory f o r determining t h e degrada-
t i o n s which t h e lognormal amplitude has on t h e e r r o r p robab i l i t y , we have not
been a b l e t o produce a complete s e t o f design curves f o r determining t h e e f -
f e c t s which lognormal c a r r i e r s have on t h e performance of systems which employ
convolut ional codes, however, pre l iminary r e s u l t s a r e given i n Appendices
7 . 6 Band C . This i s an important problem area which needs f u r t h e r s tudy owing
t o t h e impact t h e r e s u l t s w i l l have on t h e s p e c i f i c a t i o n of accura te design
con t ro l t a b l e s . Computer s imula t ions o f f e r one method f o r obta in ing and
v a l i d a t i n g any t h e o r e t i c a l r e s u l t s .
F ina l ly , a l i n e a r theory i s given which can be used t o determine t h e
s t a t i c phase-error bui ldup i n both one-way and two-way systems where lognormal
c a r r i e r s and high doppler s h i f t s a r e p r e s e n t . This includes t h e e f f ec t s o f
tuning t h e vol tage-cont ro l led o s c i l l a t o r with and without p r e d i c t s . Fur ther -
more, a l i n e a r theory has been presented which can be used t o spec i fy t h e
variance of t h e doppler and phase-error i n one-way and two-way systems where
lognormal c a r r i e r s a r e p resen t . Some f u r t h e r numerical work i s recommended
here .
2 . TELECOMMUNICATION SYSTEM MODEL
In a coarse sense , w e s h a l l begin our d iscuss ion of t h e telecommunica-
t i o n system model ( f o r both t h e l a r g e and small probes) from i t s s imples t
r ep resen ta t ion given i n Figure 7.6A-1. I t cons i s t s of t h e t r a n s m i t t e r ( in -
cluding t h e encoder and modulator), t h e channel ( inc luding a random time-
varying f i l t e r ) , and t h e r ece ive r ( inc luding t h e demodulator and decoder) .
For convenience, we have i l l u s t r a t e d t h e source and use r a s blocks ou t s ide
t h e above t h r e e elements. The major blocks which have an impact on t h e

------ 1 I-------------
------ r - - P R O B E I CHANNEL 7 r - - - P R O ~ ~ 1
TRANSMITTER I / I I RECEIVER I
I ' I I I I
I 1 I - 3 I
u I I ,(t) RANDOM x(t)l 1 -1 s ( t , v )
I I I I I- I I I I I I I I I I L ---------- J L ---------- A I _I
Flgure 7.6A-1. Slmplert Telecommunlcatlon System Model
DEMODULATOR DECODER
I
- I
ENCODER ? m
USER SOURCE MODULATOR
I I FILTER ni(t)i I -(
I I
I TIME VARYING
D

design and ana lys i s include: t h e choice of an encoding technique, t h e modu-
l a t i o n technique, t h e channel model (which inc ludes a s t a t i s t i c a l cha rac te r -
i z a t i o n of t h e a t t enua t ion and turbulence us ing t h e body of theory given i n
Reference 1 t o IS) , synchronizat ion, demodulation, and t h e decoding technique.
For t h e p resen t , however, we s h a l l c h a r a c t e r i z e t h e s i g n a l s s ( t ) ,
s ( t , Q), n . ( t ) and t h e received s i g n a l x ( t ) s i n c e f o r a l l ana lys i s t hese 1
s i g n a l representa t ions , modulation formats, e t c . en te r i n t o t h e a n a l y s i s and
design. A general r ep resen ta t ion f o r t h e t ransmi t ted s igna l is given
s ( t ) = Jiko s i n [ m o t + M(t) + y l ( t ) ] (7.6A1)
where 2
P = A. Represents t h e t o t a l t ransmi t ted power
f o = w0/2v C a r r i e r frequency
M(t) = Represents ang le modulation (phase o r frequency)
y l ( t ) = Transmit ter o s c i l l a t o r i n s t a b i l i t i e s both long and s h o r t term
When two-way transmission i s considered, t h e model f o r s ( t ) w i l l change a s a
r e s u l t of t h e up-l ink mult ipath, up-link noise , backsca t t e r from t h e p l ane t ,
e t c . ; however, f o r t h e p resen t we s h a l l neg lec t considering t h e i r e f f e c t s and
in t roduce them a t t h e appropr ia te t ime.
2.1 Channel Model Based Upon Turbulence Theory and t h e Lognormal Process
Owing t o random f l u c t u a t i o n s i n t h e r e f r a c t i v e index o r d i e l e c t r i c con-
s t a n t of t h e Venusian atmosphere caused by random winds, thermal cu r ren t s , and
pressure v a r i a t i o n s , turbulence theory (References 1-15) purpor ts t o model t h e
amplitude f luc tua t ions induced by t h e random time-varying f i l t e r a s lognormal.
What t h i s implies is t h a t t h e amplitude f l u c t u a t i o n s A ( t ) , emerging from t h e
random channel f i l t e r output when s ( t ) s e rves as i t s inpu t , a r e charac ter ized
by
A(t) = A. exp [ x ( t ) ] (7.6A2)
where [ x ( t ) ] i s a gaussian random process which w i l l be assumed s t a t i o n a r y .
In summary, f o r plane-wave propagat ion, Ta ta r sk i (Reference 4 ) has shown by
t h e use of a pe r tu rba t ion approximation t o t h e wave equat ion ( c a l l e d t h e
Rytov approximation) t h a t t h e amplitude A(t) o f t h e received electromagnetic

field has the first-order probability density function*
for 0 < A < m. The parameter m determines the asymmetry while ir controls - - X X
the spread. The nth moment of the lognormal probability density functions
about the origin is given by
E [A"] = Aon exp [n mx + (n20x2)/2].
The lognormal probability density function results from multiplicative
events, i.e., there exist multiplicative central limit theorems (Reference
16), which show that the asymptotic probability density function of the
product of n independent random variables tens to be lognormal for large n.
The statistics of the probe channel appear primarily to be of a multiplicative
nature.
The skewness and shape of the lognormal probability density function can
be easily adapted, see Figure 7.6A-2, to provide a good initial approximation
to a broad class of non gaussian probability density functions defined over
[0, -1. Other experimental investigations (References 4, 16, 17, 18, 19, 20,
21, 22, 23, 24) have, to an extent, substantiated that the underlying statis-
tics are lognormal for various communication channels.
* For a short discussion of the interconnection between a random variable with
a Rician and lognormal probability density functions see the end of Section
2.2.

RANDOM VARIABLE X Figure 7.6A-2. Effects of the Variation of mx on the Shape of the Lognormal Probability Densi ty Function

One can express t h e mean m and var iance a 2 of t h e amplitude f luc tua - A A t i o n s (channel gain) +s
A G l m = E(A) = exp A [m x + 0; /2]
02 A = E [(A-mA)'] = hi exp (u; /2) s inh (0:/2)
= 2Af exp [ 2 h + xu2 x /4)]sinh (0: /2) (7.6A3)
When t h e amplitude turbulence x ( t ) has zero mean then t h e moments of t h e
channel ga in become
( A O l m A = exp (0; /2)
m = 0' x ( ~ 6 ~ 0 ; = 2 exp(2 O Z ) s inh ti /2) 2 x
2 Under a "conservation-of-power", i . e . , E (A2) = A o . argument i t i s easy t o
show t h a t m = -a2 s o t h a t (7.6A3) reduces t o X X
A A = exp (-0: /2)
m = - o Z x
[A12ai = 2 exp 2 sin": h). ( - x 1
I t i s i n t e r e s t i n g t o no te t h a t t h e r a t i o o f t h e mean of t h e lognormal d i s t r i -
but ion t o i t s mode Mmode i s given by
and t h a t the peak value o f t h e p r o b a b i l i t y dens i ty funct ion i s given by

Hence
which demonstrate t h e behavior of the lognormal p r o b a b i l i t y dens i ty funct ion
f o r l a r g e ox.
Furthermore
where
and
en E - m + exp a2/2 X X G = 0
X
Then, i f E is f ixed we have
which would seem t o imply t h a t t h e e r r o r p r o b a b i l i t y i n a coherent system ap-
proaches one-half f o r b inary s i g n a l s and a f i n i t e s igna l - to -no i se r a t i o 2
ADT/NO. Furthermore, turbulence theory (Reference 8) po in t s out t h a t t h e
random channel f i l t e r a l s o d i s t u r b s t h e phase c h a r a c t e r i s t i c of t h e t ransmi t ted
s i g n a l . This suggests t h a t t h e t r ansmi t t ed wave w i l l be f u r t h e r perturbed by
random phase f l u c t u a t i o n + ( t ) which i s charac ter ized a s a zero-mean gaussian ran-
dom process . Thus t h e output of t h e randomly time-varying f i l t e r i s conveniently

cha rac te r i zed from turbulence theory as
s ( t , Q) = f i ~ s i n Q ( t )
where t h e channel phase funct ion i s def ined by
Act) - Amplitude f l u c t u a t i o n s due t o turbulence = A. exp [x ( t ) ]
$ ( t ) - Turbulence phase f luc tua t ions
8 0 - A random epoch uniformly d i s t r i b u t e d on I - , n] e w ( t ) - Trans ient modulation due t o probe o s c i l l a t i o n s ( ze ro on small
probes) a f t e r parachute opens
M(t) - Angle modulation (PSK o r MFSK)
8 ( t ) - Backscat ter mult ipath i n a two-way l i n k (zero i n one-way case) B
d ( t ) - Doppler p r o f i l e i n radians.
I n long hand n o t a t i o n t h i s implies t h a t t h e received s i g n a l X(t) can be char-
a c t e r i z e d as
where n . ( t ) i s t h e a d d i t i v e narrowband gaussian no i se process which we char 1
a c t e r i z e as (Reference 25, Chapter 3)
n . ( t ) = fi n c ( t ) cos w o t - n ( t ) s i n w o t I I (7.6A7) 1 S
wherc n ( t ) and n ( t ) a r e banl imited white gaussian no i se processes o f s i n g l e - C s
s ided s p e c t r a l dens i ty N o watts/Hz.
I n what fol lows, i t w i l l be convenient t o break the s i g n a l s ( t , a) i n t o
two components, a r e s u l t a n t specu la r o r f i x e d term due t o turbulence , and a
random o r f l u c t u a t i n g component due t o t h e turbulence . This w i l l be requi red
t o c a r r y out a d e t a i l e d a n a l y s i s i n what fol lows. There i s no l o s s i n gen-
e r a l i t y i n doing s o . I f we ignore, f o r t h e moment, t h e angle modulation M(t)
then i t can be shown us ing r e s u l t s i n Appendix I , Chapter 13 of Reference 25,
t h a t t h e au tocor re l a t ion func t ion of t h e channel output s i g n a l is given by

R ~ ( T I = ~ [ s ( t , . )SF + i. ?J] 2
= A Q exp hx + a2 - 0.2 x + + Rx (TI + R+(T) cos W ~ T
with x = x ( t ) , x ( t + T) = x and ,- -. T
a r e defined t o be t h e covariance funct ions o f { x ( t ) l and I # ( t ) ) r e spec t ive ly .
In t h e above, one assumes t h a t t h e processes I x ( t ) } and { @ ( t ) } a r e s t a t i o n a r y ,
s t a t i s t i c a l l y independent with [ b ( t ) } having a zero mean. While i t i s a f a c t
t h a t { x ( t ) I and { + ( t ) I a r e s l i g h t l y c o r r e l a t e d (Reference 4 ) , we have neglected
t h i s i n car ry ing out t h e above a n a l y s i s . With a l i t t l e pa t i ence t h i s c o r r e l a -
t i o n can be included and it would be i n t e r e s t i n g t o determine i t s e f f e c t s on
system performance. From (7.6A8) we can f ind t h e power i n t h e f ixed o r s P
specu la r term; i n p a r t i c u l a r , t h e power i n t h e p e r i o d i c component a t f r e -
quency w o i s given by
A . A 2 = l l m = Power i n specu la r term. Sp * -
(7.6A10)
On t h e o t h e r hand, t h e power A; i n s ( t , O) which can be considered i n t h e
random component when turbulence alone is considered, is given by 2
A2 R = 0 - = A e x m + a:][exp a: - exp(-a;)] SP
A: = mi [exp(.: ) - exp (-a;)] . (7.6All)
Taking t h e r a t i o o f specular power t o random power produces t h e r e s u l t
~2 exp [- (rr: + 0 2 ) / 2 1 y 2 L 3 =
A: 2 s i n h [jrr; + O ~ ) / Z ]
~f + a: << 1 then

Equation (7.6A12) i s p l o t t e d i n Figure 7.6A-3.
Using Woo's (Reference 15) es t imate f o r Pioneer-Venus based on the value
of cn ( t h e s t r u c t u r e constant) obtained from Venera 7 da ta u2 = 0.014 a t t he X
su r face and using t h e Woo-Kolmogorov-von Karman combination f o r u 2 it turns $ out t h a t , a t t h e su r face Venus, u2 = 0.0558, so t h a t 4
y 2 = 1 - - 0.0698 - = 13.8 (Venera 7)
e 0.0725
From (7.6A12) and with mx = 0 we no te
along the zeni th . On t h e o t h e r hand, Woo (Reference 15) used t h e Venera 4
d a t a which revealed s t ronger turbulence, from which t h e worst-case numbers
turned out t o be u2 = 0.2232 rad2 and u 2 = 0.056. For t h i s worst-case, with + X m = 0, and along t h e zeni th
X
and
y2 = 3.11 (Venera 4 ) ,
f o r a '"worst-worst" case.
I t is a l s o i n t e r e s t i n g t o know t h e power s p e c t r a l dens i ty o f t h e channel
output . I n theory t h i s can be accomplished by taking t h e Fourier transform of
t h e covariance funct ion

Figure 7.6A-3. Ratio of Power in Specular Component to That of the Random Component Due to Turbulence

Writing t h i s i n t h e form
d? (T) = I(T) COS W o T , S
where
A 2 '(TI = A O exp hX + o: - 02)[exp(nx(r) + R (,I i $ 4 1 - 11.
then t h e Four ier t ransform of (7.6A18) can, i n p r i n c i p l e , be obtained by ex-
panding r ( r ) i n a Taylor s e r i e s about t h e normalized covariance funct ion
A P ~ + $ ( T ) = P ~ ( T ) + P $ ( T ) . (7.6A19)
A with p X ( ~ ) = R ~ ( T ) / O : and p ( T ) = 61 (.r)/02 Then m m + '
( T ) + 0 2 p m m
where
The Fourier transform 3 can then be w r i t t e n i n terms of mul t ip le
convolut ions of p ( T ) . In f a c t
where (x * x)" denotes an n-fold convolution of x(w) with i t s e l f . From t h e
above we can then w r i t e an expression f o r t h e power s p e c t r a l dens i ty
s r ( w ) = 3 ~ . [ ~ ( T ) I - A ~ ~ 3l' [ ~ X P { P ( T ) } - 11
of t h e channel output when turbulence only i s considered, i . e . ,
S (w) = Sr(w - w0) + s (w + !AO) s r

where we have assumed t h a t r ( r ) i s narrowband. I f we take only t h e f i r s t two
terms owing t o t h e smallness of t h e s p e c t r a a s determined by Woo (Reference
15) , then
The roo t mean square bandwidth o f t h e channel output can be obtained from
which can be w r i t t e n i n terms of t h e covariance func t ion of t h e channel output ,
v i z . ,
In the above f = w/2n rep resen t s t h e frequency v a r i a b l e . The parameter Wrms
w i l l be needed when t h e performance of a phase-locked loop i s g iven . This
parameter provides a t h e o r e t i c a l e s t ima te f o r t h e s i g n a l frequency spread
seen a t the output o f t h e channel due t o atmospheric turbulence . Obviously,
t o work t h e problem f u r t h e r , one could cons ider t h e s p e c t r a W (w) and W (w) b x
as developed i n Woo (Reference 1 5 ) . However, it i s r e a d i l y seen t h a t t h e
problem would become q u i t e complex owing t o t h e n a t u r e of t h e numerical i n t e -
g ra t ions involved. I f one were t o i d e a l i z e t h e s p e c t r a i l l u s t r a t e d by Woo
(Reference 15) and r ep lace them by i d e a l i z e d r ec t angu la r s o f appropr i a t e 3
dec ibe l f requencies (on t h e o rde r of 2 t o 3 Hertz f o r amplitude and 1 Hertz
f o r t h e phase) then an "approximate" bandwidth of t h e o r d e r of 2 t o 4 Hertz
seems t o a rough rule-of-thumb f o r t h e bandwidth o f t h e random turbulence com-
ponent. Further d e t a i l s of t h e developments should be pursued with t h e passage
of time; i n p a r t i c u l a r , t h e a d d i t i o n a l e f f e c t s superposed on t h e c a r r i e r due
t o t h e c r o s s - c o r r e l a t i o n func t ion p (T) and, i n add i t ion , xb 'rms a t various
angles along t h e z e n i t h .
7 .a -17
w = - rms
[ e x p I ~ ( o ) l - 11 r = O

2.2 The Rician Channel Model and I ts In terconnect ion with the Lognormal Model
On t h e b a s i s o f t h e previous d iscuss ions , we now cons ider the problem of
remodeling t h e channel output such t h a t it w i l l i n t e r f a c e , i n an approximate
sense, with c e r t a i n s t u d i e s which have been performed f o r fading channels.
A s pointed ou t e a r l i e r , deWolf (Reference 1, 2 , 3) advanced t h e hypothesis
t h a t t h e probe channel was Rician; however, i t seems a s though he has s ince r e -
t r a c t e d h i s pos i t ion . For s i m p l i c i t y i n modeling we begin by neglec t ing a l l
random modulations o t h e r than t h a t due t o turbulence , i . e . , we consider t h e
response o f t h e random channel f i l t e r of Figure 7.6A-1 when t h e input i s a
s i n e wave o f w a t t s . Under a Rician hypothes is , s e e Figure 7.6A-4, t h e 0
output o f t h e random t ime-variant f i l t e r c o n s i s t s o f two terms, v i z . , a
specular term A exp[iwot - i 6 ] (a phasor o f amplitude A and f ixed phase 6) SP SP
and a Rayleigh phasor R exp mot - i e whlch c o n s i s t s of t h e sum of two i n - c' RI '
dependent normal quadrature phasors o f zero mean and var iance 0'. Thus i n
phasor n o t a t i o n , t h e response o f t h e channel f i l t e r t o J2 A. exp[iwot + i o 0 ] is
\ (-ie,)] exp[ iuo t + iB0] s [ t , $1 = fi pip exp(-ib) + R exp (7.6A27)
specu la r term random term
which can be combined t o g ive
The j o i n t p r o b a b i l i t y dens i ty funct ion p(A, 8) is cha rac te r i zed by
f o r 0 - < A - < and 1 (0 - 6) 1 - < IT. The parameters A and o i n (7.6A-29) may SP
be given phys ica l i n t e r p r e t a t i o n s . The q u a n t i t y A~ may be considered t o be SP
t h e power i n t h e specular component while 202 i s t h e s u m o f t h e mean-squared
value of t h e in-phase (.R cos 0 ) and quadruture (R s i n e ) components which R R
cha rac te r i ze t h e Rayleigh vec to r . For convenience we d e f i n e

(a) RICE VECTOR, ASP exp( - is ) + R exp(- ieR)
LOGNORMAL
A ( t ) = Aoe
(b) Lognormal Vector , A. exp [ x ( t ) + i @ ( t ) l
Figure 7.6A-4. Vedor Channel Madelr

as t h e r a t i o of t h e average power received v i a t h e specu la r component t o t h e
random component. The p r o b a b i l i t y dens i ty funct ion is given by
A2 [ A n ' ; ] = A exp I-? - y 2 J I o ( w )
f o r 0 - < A < m. The mean of t h e channel ga in i s given by n -
where I (x) i s a modified Bessel funct ion of imaginary argument. The mean k
squared value i s given by
When y i s l a r g e I (x) % e x p ( x ) / G then k
E (A) 2. JT7;; A s P
while
I t i s a l s o known t h a t f o r l a r g e y t h e p r o b a b i l i t y dens i ty funct ion is approxi-
mately gaussian with p r o b a b i l i t y dens i ty func t ion
f o r A A >> a 2 . On t h e o t h e r hand, t h e p r o b a b i l i t y dens i ty funct ion p ( 0 ) i s s P
given by
1 + e r f c y cos A + ~ J T A c o s e
s P [
2 exP[y2 cos2 01 I

which f o r l a r g e y i s approximated by
a
~ ( 0 ) kC n cos no - $1 n=O
With t h e above approximation i n mind, then i t would seem t h a t t h e lognormal
channel with reasonable l a r g e phase f l u c t u a t i o n s and a l a r g e s p e c u l a r term can
be approximated by a Rician channel when y 2 i s reasonably l a rge , perhaps
y2 . 100:
I t should be noted, however, t h a t t h e values o f y 2 obtained using t h e
numbers given by Woo (Reference 15) y i e l d values f o r v 2 l e s s than 20. I t
would seem t h a t t h e Rice p r o b a b i l i t y d e n s i t y funct ion does not provide an
adequate approximation t o t h e lognormal fad ing expected. I n f a c t , it i s
important t o no te t h a t a lognormal d i s t r i b u t e d random v a r i a b l e can be used t o
approximate a noncentral chi-square random va r i ab le . The noncentral chi-squared
d i s t r i b u t i o n i s defined t o be t h e sum o f N independent Rician random v a r i a b l e s .
I f t h e r e a r e enough degrees of freedom i n t h e composition then t h e noncentral
chi-squared random v a r i a b l e is d i s t r i b u t e d l i k e t h a t o f a lognormal random
v a r i a b l e . For t h e d e t a i l s s e e t h e notes by Ohta and T . Koizumi, Reference
26 and Clark and Karp, Reference 2 7 . Other i n t e r e s t i n g d e t a i l s r e l a t i v e t o
lognormal v a r i a t e s a r e given i n Reference 28 .
2 . 3 The Channel Output Equation
With t h i s i n mind then t h e output o f t h e channel ( inc luding thermal
noise) when modulation and a l l o t h e r u n c e r t a i n t i e s involved is modeled as
X(t) = V6 Age X(t) s i n ~ ( t ) + fi AB(t) s i n QB( t ) + n i ( t )
= V 6 A s i n [ i ( t ) ] + f i x m ( t ) s i n i ( t ) + f i y m ( t ) cos Q ( t ) \
s P / \ / "
specu la r component
mul t ipa th component due t o turbulence
+ fi AB(t) s i n O g ( t ) + n i ( t ) . r p lane ta ry backsca t t e r

d ( t ) - Doppler p r o f i l e
M(t) - Angle modulation (PSK o r MFSK)
( t ) - O s c i l l a t o r i n s t a b i l i t i e s
8 ( t ) - Trans ient modulation due t o probe o s c i l l a t i o n W
go - Random epoch uniform ( n n]
and % ( t ) and Q B ( t ) a r e , r e spec t ive ly , t h e r e s u l t a n t channel amplitude and
phase processes due t o p lanetary backsca t t e r (zero o r small probes) . The
add i t ive thermal noise i s charac ter ized i n ( 7 . 6 ~ 7 ) . In (7.6A40) t h e specular
power is charac ter ized i n (7.6.410) while t h e power i n the mult ipath component
due t o turbulence is charac ter ized i n (7.6All) with m given i n (7.6A3). A
I t would be o f i n t e r e s t t o f u r t h e r cha rac te r i ze t h e zero-crossing prop-
e r t i e s of both t h e lognormal and Rician envelope, i . e . , cha rac te r i ze t h e
average number o f times p e r second the envelope crosses its mean and mean-
squared va lues , as well as t h e average dura t ion between c rosses . These were
evaluated i n c o r r e c t l y by deWolf (References 2, 3) f o r t h e Rician channel;
however, a c o r r e c t mathematical development is given in t h e addendum a t the
end of t h i s appendix.
2 . 4 Character iza t ion o f Channel Multipath Due t o Planetary Backscat ter
Multipath not only a r i s e s due t o t h e s c a t t e r i n g o f t h e inc ident rays
due t o t h e atmospheric inhomogeneities, but a l s o because unscat te red rays of
t h e s i g n a l a r r i v e v i a d i f f e r e n t pa th lengths . This r e s u l t s i n time-spreading
of t h e received s i g n a l , and i s f requent ly r e l a t e d t o t h e channel memory time.
Brookner (Reference 28) discusses t h e problem from a propagation physics po in t
of view. This would determine whether intersymbol i n t e r f e r e n c e e x i s t s as a
r e s u l t of the d i f f e r e n t path l eng ths . I t appears t h a t t h i s e f f e c t i s n e g l i g i b l e .
I f one considers f u r t h e r t h e problem of evalua t ing t h e power r e f l e c t e d
i n t o a spacec ra f t r ece ive r when p lane ta ry multipath o r backsca t t e r i s present ,
and i f one assumes t h a t t h e doppler s h i f t i s cons i s t en t , then t h e r e f l e c t e d
o r backsca t t e r s i g n a l can be modeled a s

where
f - Doppler s h i f t assumed cons tant f o r s i m p l i c i t y of ana lys i s d
AB(t) - Amplitude backsca t t e r
0 ( t ) = Phase backsca t te r . B
Then assuming t h e backsca t t e r process s B ( t ) i s s t a t i o n a r y , t h e au tocorre la-
t i o n funct ion o f I s ( t ) / i s wr i t t en as I B I
Rs(.r) = E [sB(t) s B ( t + TI]
R,(T) = exppmz + u2 z - 06 + a z ( ~ ) + 6? 8~
where z ( t ) = e 1.n AB(t) and
aZ;T) = E [ z ( t ) z ( t + T ] - m2 Z
a r e t h e covariance funct ions o f { z ( t ) 1 and 0 ( t ) r e spec t ive ly . Prom t h i s we I B I
can e a s i l y deduce t h e power, i f any, i n a f i x e d term a t frequency f o + fd
Hertz . In f a c t , i f ire denote t h e power i n and r e f l e c t e d f ixed component as
A$ then
A = Power i n specu la r component o f p l ane ta ry backsca t t e r a t f o + fd Hz
f
while
A = Power i n random component of p l ane ta ry backsca t t e r a t frequency r
f o + f Hz d
and t h e r a t i o becomes

Once u 2 and u 2 have been determined, t h e curve given i n Figure 7.6A-3 can be z 'B appl ied with u 2 now equal t o u 2 + (r2 . In an ac tua l des ign , cha rac te r i za t ion
z OB of t h e t o t a l power r e f l e c t e d from t h e p l ane ta ry s u r f a c e as a func t ion of
antenna ga in , i nc iden t power, e t c . i s what i s requi red . This involves model-
i ng t h e "roughness" o f t h e p l ane t a s well as i t s r a d a r c ross-sec t ion , and
using t h e s e t o determine t h e t o t a l power r e f l e c t e d . This has been done i n
Appendix 7.6 G .
3 . CHARACTERIZATION OF A PHASE-LOCKED LOOP RECEIVER PERFORMANCE IN THE PRESENCE OF PLANETARY MULTIPATH AND TURBULENCE (LOGNORMAL CHANNEL)
Consider t h e communication system model i l l u s t r a t e d i n Figure 7.6A-5.
The terms i n t h e s i g n a l s ( t , 0 as charac ter ized i n (7.6A5), can be r e -
grouped and X(t) o f (7.6A39) can be r e w r i t t e n as
X(t) = & ~ ( t ) s i n [ O ( t ) ] + fi AB(t) s i n OB(t) + n i ( t ) , (7.6A47)
where t h e p l ane ta ry backsca t t e r term w i l l be p re sen t only on two-way l i n k s .
I t should be noted t h a t when t h e p l ane ta ry backsca t t e r term is p resen t , one
has t h e problem o f determining t h e response o f a phase-locked r e c e i v e r t o
two narrowband processes loca ted a t two d i f f e r e n t c e n t e r f requencies . We s h a l l
r e t u r n t o t h i s ques t ion l a t e r a s it w i l l be o f concern on t h e l a r g e probe.
I n Equation (7.6A48) Q ( t ) and A(t) a r e charac ter ized as fol lows:
A(t) = ~ ~ e ~ ( ~ ) - r a n d o m channel ga in process
Q ( t ) = w 0 t + d ( t ) + $ll(t) + $ ( t ) + M(t)
d ( t ) - Doppler phase func t ion
Jll ( t ) - Transmi t te r o s c i l l a t o r i n s t a b i l i t i e s
M(t) = Phase modulation = @ X ( t ) S ( t ) d
= (cos-l m) = modulation index
S ( t ) = Subca r r i e r
X ( t ) = Data modulation d $ ( t ) - Channel phase c h a r a c t e r i s t i c
AB(t ) , Q B ( t ) - Planetary backsca t t e r

Flgure 7.6A-5 Coherent Communlcatlon System Model
S ( ~ I $1 X( t ) - - - -,-
PHASE LOCKED RECEIVER
sCtl c
- - DATA MODULATED SUBCARRIER
-TRACKING REFERENCE
*DOPPLER REFERENCE
I
RANDOM TIME VARY I NG CHANNEL
1

3.1 The Loop Equations f o r Both One-Way and Two-Way Operation
Things a r e now i n t a c t such t h a t t h e model considered i n Reference 25,
page 74, Figure 3-3, app l i e s d i r e c t l y . I f one cha rac te r i zes t h e re ference a A
s i g n a l i n t h e loop as r ( t , @) = f i x l cos [ @ ( t ) ] and de f ine t h e t o t a l loop
phase e r r o r p as
Then t h e loop equat ion becomes ( see Reference 25, pages 76-86) with t h e time
v a r i a b l e suppressed:
3 .1 .1 One-Way System
P = d + $1 + O - s i n q + A s i n apB + N(t, q ) P B I
3.1.2 Two-Way System (Up-Link)
mKF( q = d + $1 + $ + I - + [ A s i n 9 + N ( t , q ) ] - $2 - KVe/p (7 .6A5(1)
where, f o r t h e l i n k involved, we have t h e fol lowing s i g n a l components:
d ( t ) - Doppler phase funct ion
q l ( t ) - Transmi t te r o s c i l l a t o r i n s t a b i l i t i e s
$ ( t ) - Turbulence phase funct ion
I ( t ) - Planetary backsca t t e r
A(t) - A. exp [x ( t ) ] - amplitude process due t o turbulence
N( t , p ) - Equivalent phase noise process (Reference 25)
AB ( t ) , 0 ( t ) - Planetary backsca t t e r process B

$ - Receiver o s c i l l a t o r i n s t a b i l i t i e s
K - VCO ga in v e - Acquisi t ion vo l t age
d p - - Heaviside ope ra to r
d t
K - Open loop gain
m - Modulation f a c t o r
From t h e above equat ions we s e e t h a t t h e t o t a l system phase e r r o r P i s due t o
many d i f f e r e n t e f f e c t s . La ter we s h a l l c h a r a c t e r i z e these and a s ses s t h e
degradat ion on system performance. Furthermore, f o r t h e p resen t we s h a l l
neglec t t h e e f f e c t s o f t h e l i m i t e r and t r e a t t h a t under a s epa ra t e subsec t ion
as it rep resen t s a s l i g h t l y more complex problem.
3 . 2 The Data Channel Equation
The demodulated s i g n a l passed t o t h e s u b c a r r i e r demodulator assembly
(SDA) is cha rac te r i zed by
u ( t ) = A2(t) Xd(t) S ( t ) cos v + N(t , v ) (7.6A5 1)
with A2(t) = (n) A ( t ) . (See Figure 7.6A-6 f o r a system model which ex-
cludes t h e l i m i t e r . ) The l i m i t e r a n a l y s i s w i l l be included l a t e r on i n t h i s
sequel .
I f t h e e f f e c t s o f s u b c a r r i e r t r ack ing loop a r e t o be accounted f o r , then *
t h e r e fe rence s u b c a r r i e r s i g n a l can be modeled a s S ( t ) . Then it i s reasonable
t o approximate t h e baseband s i g n a l t o t h e symbol d e t e c t o r as
The product
cos 4 s i n e wave s u b c a r r i e r s S
S ( t ) S ( t ) =
square wave s u b c a r r i e r s

r------------------ 7
I DATA DEMODULATOR I I I
DEVICE
SYNC I
ESTIMATE I
I
I I 7- VCO I
I I CARRIER TRACKING LOOP I
LOCAL DOPPLER I------- REFERENCE
EXTRACTION
1 - 1 L------J
Figure 7.6A-6. Carrier Tracking Doppler and Phase Modulation Extraction ILlmiter Absent1

where $s is t h e phase e r r o r i n t h e s u b c a r r i e r t r ack ing loop. For i q l i c i t y i n
what fol lows, w e s h a l l assume t h e s i n e wave s u b c a r r i e r case so t h a t
where n ( t ) i s white gaussian noise . The d a t a d e t e c t o r produces t h e random W
v a r i a b l e ( i n f i n i t e quant iza t ion assumed)
where T i s t h e symbol time and T represents t h e symbol synchronizat ion j i t t e r .
The decoder of Figure 7.6A-5 works with t h e quantized va r i ab le V[q]
Thus t h e da ta de tec t ion process i s degraded by t h e channel mult ipath, A2( t ) ,
t h e phase e r r o r i n the c a r r i e r t racking loop including: t h e phase f l u c t u a t i o n s
due t o t h e channel mul t ipa th , and turbulence, t he doppler p r o f i l e , o s c i l l a t o r
i n s t a b i l i t i e s , t h e s u b c a r r i e r phase e r r o r 4 and the symbol synchronizat ion S
j i t t e r . In t h e two-way mode o f opera t ion one must a l s o include degradat ions
i n t h e transponder due t o t h e up-link thermal noise, any o s c i l l a t o r i n s t a -
b i l i t i e s , up-l ink doppler, p l ane ta ry backsca t t e r .
3 . 3 Error P robab i l i ty Performance
To evalua te t h e e r r o r p robab i l i ty one needs an expression f o r t h e con-
d i t i o n a l b i t - e r r o r p r o b a b i l i t y P ( $ $ T, $) t o produce t h e average b i t E -' s' e r r o r p robab i l i ty
Obviously, some reasonable and simplifying assumptions must be made t o ca r ry
ou t any ana lys i s . I 7.6A-29

Our approach t o t h i s end has been t o compute t h e lo s ses separa te ly
more o r l e s s i n t h e approximation, and use t h e "principle-of-superposi t ion"
t o g e t t h e i r combined e f f e c t . (See t h e d e t a i l e d design con t ro l t a b l e s and
o t h e r t echn ica l memos dea l ing with t h e s e design a spec t s . )
In o rde r t o i n d i c a t e t h e problems involved we consider f i r s t t h e e f f e c t s
due t o t h e amplitude f l u c t u a t i o n s A ( t ) . I f we l e t PE(A) denote t h e condi-
t i o n a l symbol e r r o r p r o b a b i l i t y due t o t h e channel amplitude f l u c t u a t i o n s , then
one can argue t h a t t h e average e r r o r p r o b a b i l i t y i s given by
where p(A) i s cha rac te r i zed i n (7.6A4) and
with T being t h e symbol time. Assuming t h a t t h e c o r r e l a t i o n time T of t h e A
amplitude f l u c t u a t i o n is much l e s s than T (slow amplitude f luc tua t ions ) then
Y = A and one can e a s i l y show t h a t t h e symbol e r r o r p r o b a b i l i t y f o r an un-
coded PSK system i s given by
p =LJ exp(-z2)erfc[& exp ( G x z + m dz 2 " 5
-co 11
where R = (1 - ~ ' ) A ~ T / N ~ and 0
Equation (7.6.459) has been evalua ted on t h e d i g i t a l computer f o r t h e
case where m = - u 2 . The degradat ions due t o atmospheric turbulence a r e as- X X
sessed i n terms of t h e l o s s f a c t o r L i n Figure 7.6A-7. This p l o t r ep resen t s
t h e e x t r a s igna l - to -no i se r a t i o (dec ibe l ) requi red above t h a t needed t o over-
come t h e a d d i t i v e n o i s e o f t h e system and t o compensate f o r t h e adverse e f -
f e c t o f turbulence . Using t h e va lue 0' = 0.014 (Venera 7 ' d a t a a t t h e sur face) X

0.08 0 . 1 0 0 . 0 6
0 . 0 3 o . o 2 o 0 . 0 2 5
0 . 0 1 5 - k - I
VENERR 4 - % -
0.006 0, 2 r I
0.004 I
0.003 ; VENERA 7 1 0.0020°'0025 I
0.0015 I I I I I I I L I I . - ~ ~ ~ ~ ~ 1
\ I I " m' > 4 1 1 1 1 1 1 1 10- 10-
I I 1 1 I I I I I e m - G 10-5 10-
L
rigun ,,6r-i, ia~or, L .I Error Proboi l i ty for rmnor.al Fadin9 'urine*'

t h e l o s s due t o atmospheric turbulence alone i s approximately 2 . 2 dec ibe l s at!
PE = For u2 = 0.056 t h e l o s s is approximately 2 . 2 dec ibe l s a t P = 10-3. x E Other p l o t s of equat ion (7.6A59) a r e given i n Appendix 7.6C.
Generally speaking, a n a l y t i c a l expressions f o r t h e b i t - e r r o r p r o b a b i l i t y
achievable when us ing a sequent ia l decoding o r maximum-likelihood decoding
algori thm i n connection with convolut ional codes, is p r a c t i c a l l y impossible t o
achieve owing t o t h e mathematically-nontractable n a t u r e o f t h e problem. Aside
from t h i s f a c t , t h e case i n po in t he re p resen t s o t h e r d i f f i c u l t i e s , namely,
owing t o t h e slow v a r i a t i o n s i n channel ga in , t h e dec is ions made on t h e symbols
a r e c o r r e l a t e d , i . e . , t h e channel possesses memory. The memory e f f e c t s mani-
f e s t themselves a s slow fades due t o t h e noisy synchronizat ion references and
due t o channel ga in v a r i a t i o n s . In c e r t a i n cases i n t e r l e a v i n g techniques can
be used t o he lp a l l e v i a t e t h e problem and t h e amount o f "help" is usua l ly de-
pendent on t h e d a t a r a t e a s wel l a s t h e number of frames of i n t e r l eav ing .
To account f o r t h e b i t e r r o r p r o b a b i l i t y , s h o r t of computer s imula t ions
of t h e combined e f f e c t s (Reference 2 9 ) , one can degrade t h e i d e a l i z e d coded
performance, as obtained by computer s imula t ions i n t h e p re ence of thermal
no i se . This degradat ion can be accounted f o r i n t h e form o an i n t e g r a t i o n
over t h e curve fit P (A) = ~ [ A J T ( ~ - m2)/N0] t o t h e s imula t ion da ta f o r t h e E b i t e r r o r p r o b a b i l i t y . In t h i s case , we have t h a t t h e b i t e r r o r p r o b a b i l i t y
i s
and t h e approximate s i g n i s due t o t h e f a c t t h a t t h e dec i s ions made on t h e
symbols a r e c o r r e l a t e d . I n Appendix 7.6D, Equation (7.6A61) is p l o t t e d f o r
var ious values o f m and u . Computer s imula t ion r e s u l t s a r e needed t o v e r i f y ' X X
t h e reg ion of v a l i d i t y of t h e approximations a s t h e r a t e of v a r i a t i o n s i n
A(t) = mAg exp[x( t ) ] may produce c o r r e l a t e d dec is ions on t h e symbols.
To account f o r t h e noisy r e fe rence lo s ses f o r t h e coded case, one can
provide approximate r e s u l t s by arguing t h a t t h e amplitude ( s e e 7.6A55) of t h e
( - i/(sl cos $ ) and produce an in t eg ra - baseband s i g n a l is e f f ec t ed by cos 9 l S
t i o n over t h e p r o b a b i l i t y dens i ty func t ion p(q) o f t h e phase e r r o r . Using
t h i s approximation, t h r e e cases o f i n t e r e s t a r i s e :

( I ) Phase e r r o r v a r i e s slowing with r e spec t t o b i t time
(11) Phase e r r o r v a r i e s r ap id ly over the b i t time
(111) Phase e r r o r v a r i e s moderately over t h e b i t time
Various s t u d i e s , References 29, 30 , 31, 32, 33 , 34, 35, 36, have been
made f o r both one-way and two-way systems coded and uncoded, and deal with
both t h e coded and uncoded c a s e s . Reference 30 s t u d i e s t h e noisy r e fe rence
los ses , v i a computer s imulat ion techniques, f o r sequen t i a l decoding with
phase-locked demodulation i n t h e presence of white no i se . References 31 and
32 t r e a t uncoded coherent communication system performance due t o noisy r e f e r -
ence los ses i n t h e presence o f white no i se f o r a l l t h r e e o f t h e above mentioned
r a t e s o f phase e r r o r v a r i a t i o n s . Reference 33 s t u d i e s t h e noisy reference
problem i n white no i se f o r convolut ional codes and Vi t e rb i decoding; both
one-way and two-way r e s u l t s a r e a v a i l a b l e . He l l e r and Jacobs (Reference 34)
have demonstrated how t o c a l c u l a t e t h e noisy reference l o s s f o r the white
noise case using s h o r t c o n s t r a i n t length codes. The noisy c a r r i e r r e fe rence
los s has been s tudied i n References 35 and 36 f o r one-way and two-way systems
which use block codes and work i n t h e presence of white gaussian noise . While
t h e above mentioned references do not completely exhaust t h e noisy reference
problem s t u d i e s , they a r e t y p i c a l of t h e cont r ibut ions made. For b r e v i t y we
do not draw conclusions o r reproduce any o f t h e curves based upon t h e above
s t u d i e s contained t h e r e i n . In any case, t h e above mentioned ana lys i s o r simu-
l a t i o n s do not account f o r the channel turbulence and genera l ly neglec t t h e
problem of co r re l a t ed symbol dec is ions when convolut ional codes a r e used.
I t appears a t t h i s po in t t h a t , i f one is t o accura te ly account f o r and as sess
the combined e f f e c t s due t o atmospheric turbulence and a d d i t i v e no i se , f u r t h e r
working o f t h e problem i s necessary.
A t l e a s t two f r u i t f u l avenues a r e ava i l ab le : cha rac te r i ze t h e j o i n t
p robab i l i ty dens i ty funct ion p(A, v ) and average over t h e condi t ional b i t -
e r r o r p r o b a b i l i t y PE(A, 9) f o r t h e t h r e e r a t e s (discussed above) o f v a r i a t i o n ,
i n @ and A o r perform computer s imula t ions which account f o r t h e combined
e f f e c t s which produce los ses and compare t h e r e s u l t s . From e i t h e r o f these
r e s u l t s one can a s sess t h e system losses f o r various probe a t t i t u d e s and
zeni th angles . We now demonstrate t h e two approaches.

For uncoded communications an approximate theory which accounts f o r t h e
combined e f f e c t s can be der ived . For Case I , t h e BEP can be approximated by
when t h e d a t a r a t e i s l a r g e compared t o t h e loop bandwidth and t h e fad ing
bandwidth. Here
:(A, 9) = - ' I exp(-x2/2) dx J2 n
cos . and p = ~ A ~ / N ~ W ~ r ep resen t s t h e loop s igna l - to -no i se r a t i o .
0
For Case I1 t h e phase e r r o r va r i e s r ap id ly over t h e symbol time and t h e
BEP i s approximated by
where
and
For t h e case o f coded communication, t h e e f f e c t s o f atmospheric turbulence
and a d d i t i v e n o i s e on t h e BEP can be assessed i n an approximate theory by r e -
p l ac ing t h e P (A, v) and P (A), f o r Cases I and 11, by funct ions which have E E

been obtained v i a computer s imula t ion and produce averages. This approach is
discussed i n Reference 33.
3 . 4 Tracking Loop Analysis (Limiter Absent)
As seen from t h e loop equation of opera t ion (7.6A50) t h e r e a r e seve ra l
de le t e r ious e f f e c t s which must be accounted f o r i n t h e design o f t h e t r ack ing
system. Several o f these e f f e c t s a r e d i f f e r e n t from previous deep space m i s -
s ions . These include: high doppler , doppler r a t e , and doppler acce le ra t ions .
e t c . , turbulence e f f e c t s , p l ane ta ry backsca t t e r i n two-way mode, perhaps o s c i l -
l a t o r i n s t a b i l i t i e s , a l l combined with low s igna l - to -no i se r a t i o s .
In cons idera t ion o f (7.6A49) it is c l e a r t h a t t h e equation o f opera t ion
represents a formidable equation (nonlinear , s t o c h a s t i c , i n t e g r o d i f f e r e n t i a l
with time-varying coe f f i c i en t s ) t o dea l with even when t h e loop i s l i n e a r i z e d .
I f l i n e a r i z e d , we s e e t h a t t h e equation i s a l i n e a r d i f f e r e n t i a l equation with
randomly time-varying c o e f f i c i e n t s . Consequently, one must r e s o r t t o i n t r o -
ducing approximations i n o rde r t o proceed with an ana lys i s . Based upon the
work o f Woo and T a r t a r s k i (References 4, IS ) , two extreme cases immediately
suggest themselves. As f a r as t h e envelope o f t h e channel mult ipath and
turbulence c h a r a c t e r i s t i c i s concerned: ( I ) If t h e c o r r e l a t i o n time T i s A
small i n comparison with t h e bandwidth o f t h e loop ( i . e . , A(t) o f bandwidth,
say W i s sma l l e r than W o r W << W L , then one can approximate t h e p r o b a b i l i t y A L A
dens i ty funct ion p ( q I ~ ) and average over t h e p r o b a b i l i t y dens i ty funct ion o f A
t o f ind t h e requi red p (v ) ; (11) If t h e c o r r e l a t i o n time rA is l a r g e i n com-
par ison with t h e loop bandwidth, i . e . , T << l / W L , then A(t) r ep resen t s a f a s t A
f l u c t u a t i o n and t h e loop f i l t e r passes , i n t h e approximation, t h e average
value nA = E(A) = exp m + 02 2 Therefore, f o r t h e s e two cases , t h e loop [ x equation can be approximated by:
Case I : WA << W L
P = d + $ + ( + 1 - A s i n p + Ag s i n pg + N(t, q)] I P

Case 11: WA >> WL
p = ~ + $ ] + Q + I - *) [, s i n p I aB s i n Q~ + ~ ( t , v)] P
where, f o r one-way t ransmiss ion I = 0 and A = 0 . Another case o f i n t e r e s t , B
i n theory , would be t h e case where t h e turbulence e f f e c t s have f a s t and slow
varying components. In t h i s case one can expand t h e channel output i n t o two
s e t s o f components excluding perhaps any specu la r term. This includes compo-
nen t s which a r e slowly varying w ~ t h r e spec t t o W and components which a r e ( 4 varying r ap id ly with t ime. In t h i s case , t h e envelope f l u c t u a t i o n s A(t) can
be decomposed i n t o two terms, i . e . ,
where A ( t ) cha rac te r i zes t h e slowly varying terms and A ( t ) r ep resen t s f a s t s f
v a r i a t i o n s . For t h i s decomposition one can w r i t e t h e hybrid o f t h e above
equat ions a s :
Case 111.
where we have suppressed t h e t ime v a r i a b l e . One then so lves t h e Fokker-
Planck equat ion f o r P ( v I ~ s ) and then averages ove r t h e p r o b a b i l i t y dens i ty
funct ion of A . S
I t should be noted a t t h i s po in t t h a t based upon t h e r e s u l t s o f Woo
(Reference 15) , Case I r ep resen t s t h e case o f i n t e r e s t he re . Thus t o obta in
t h e p r o b a b i l i t y dens i ty func t ion p(p) one so lves t h e Fokker-Planck equat ion
f o r ( p l ~ ) and then averages ove r p (A) given i n (7.6A4) . There a r e seve ra l methods f o r approximating t h e p r o b a b i l i t y dens i ty func-
t i o n of t h e phase e r r o r (o r cond i t iona l p r o b a b i l i t y dens i ty funct ion) depending
on t h e parameters o f t h e channel model (Reference 2 5 ) . I n e i t h e r case , t h e
s o l u t i o n w i l l be considerably complicated owing t o t h e f a c t s t h a t A(t) i s chang-
i n g randomly with t ime, e t c . In f a c t , t h e above equat ion (Case I ) i n d i c a t e s

t h e complicated na ture of t h e system ope ra t ion . Even i f t h e thermal noise i s
zero, t h e equation s t i l l represents a s t o c h a s t i c d i f f e r e n t i a l equat ion of op-
e r a t i o n , and even when l i n e a r l i z e d , t h e c o e f f i c i e n t s remain randomly time-
varying owing t o t h e random channel e f f e c t s . Thus any theory which has been
developed i n t h e absence o f noise remains l a r g e l y inva l id owing t o channel mul t i
path e f f e c t s . For example, t h e s t a t i c phase e r r o r ca l cu la t ed i n t h e usual way
does not have meaning because t h e not ion of s i n g u l a r i t i e s has meaning only f o r
de terminis t ic - type d i f f e r e n t i a l equat ion. This is p a r t i c u l a r l y bad f o r t h e
problem a t hand, i n t h a t a t c e r t a i n p o i n t s i n time t h e doppler p r o f i l e possesses
f i r s t , second and h igher order de r iva t ives a s opposed t o t h e usual case wherein
one has t o contend p r imar i ly with doppler o f f s e t s . In f a c t , f o r t h e case under
s tudy t h e "equivalent" channel doppler s i g n a l which t h e loop sees i s
and is t r u l y s t o c h a s t i c process owing t o t h e channel turbulence phase char-
a c t e r i s t i c s , o s c i l l a t o r i n s t a b i l i t i e s , e t c . Another po in t worth mentioning
i s t h a t as a consequence of t h e channel mult ipath, t h e equation which
governs loop behavior does not "enjoy" t h e usual s impl ica t ion which t akes
p lace when t h e no i se vanishes. By l i n e a r i z i n g t h e loop, a formidable problem
remains i n t h a t t h e closed loop t r a n s f e r funct ion becomes meaningless owing t o
t h e channel mult ipath and turbulence. While one can car ry out a loop design
on t h e b a s i s of t h e white noise background theory, it i s d i f f i c u l t t o obta in
loop performance, i n genera l , without making s impl i fy ing assumptions suggested
by s tudying t h e propagation physics o f t h e medium (References 1, 11) . Most
of t h e e f f e c t s of i n t e r e s t e n t e r i n t o t h e system equations i n a nonl inear way,
and as a r e s u l t , t h e use of i n t u i t i o n becomes, i n genera l , suspect when at tempt-
i ng t o ass ign numbers t o t he various s i d e e f f e c t s produced by t h e many d i s tu rb -
ing processes.
In what follows an attempt i s m a d e t o cha rac te r i ze the 'most needed
p r o b a b i l i t y dens i ty funct ion p ( 9 ) . To accomplish t h i s we f i r s t l i n e a r i z e t h e
loop; l a t e r we s h a l l cha rac te r i ze t h e nonl inear e f f e c t s .
3 .4 .1 Linearized Analysis ( s in 9 r 9) of a Second Order Loop
In order t o produce a l i n e a r ana lys i s using t h e s t o c h a s t i c d i f f e r e n t i a l
equat ion developed thus f a r , i t w i l l be necessary t o observe t h a t t h e corre-
l a t i o n time T o f t h e channel amplitude f l u c t u a t i o n s is long i n comparison A

with t h e c o r r e l a t i o n time T o f t h e phase e r r o r process , Reference 11. The 9
impl ica t ion is t h a t one can c a r r y out an approximate ana lys i s by producing
ensemble averages over t h e f a s t f l u c t u a t i n g terms and then averaging over
t h e remaining slow f l u c t u a t i o n s .
I f t h e loop equat ion is l i n e a r i z e d then t h e equat ion of operat ion be-
comes, i n ope ra to r form,
- - mKAF(p) [ A ~ s i n v + ~ ( t . q)] A p + mKF(p) B
which c l e a r l y shows t h a t t h e system phase e r r o r is due t o many e f f e c t s .
When t h e amplitude, A , f l u c t u a t i o n s a r e taken i n t o account t h e loop t r a n s f e r
funct ions becomes
A p + mKF(p)A - mAF(P) 1 - H (p, A) = 9 P + mKF(p)A
which d i f f e r s from t h e case f o r which t h e theory has been developed. If how-
ever , t h e c o r r e l a t i o n t ime T i s much l e s s than t h e r ec ip roca l of t h e loop A
f i l t e r bandwidth then one can assume t h a t
F(p)A(t) % A(t)F(p) , (7.6A70)
i n which case t he loop equat ion is approximated by
where
The assumption t h a t A(t) i s s lowly varying has been addressed i n Woo (Refer-
ence 1 1 ) . For b r e v i t y o f n o t a t i o n i n what follows we w r i t e

Assuming e = 0 (under con t ro l by t h e opera tor ) then t h e t o t a l mean square
phase e r r o r , condi t ional upon t h e slow f l u c t u a t i o n s , is given by*
2 (A) + &(A) + o:(A) + oi(A) + (7.6A74) o2(A) = oi(A) + o p 4 + UA* 0
A where A$ - $2 where we have assumed s t a t i s t i c a l l y independent processes .
The f i r s t term rep resen t s t h e mean-square t r a c k i n g e r r o r defined by
where E [ ] denotes t h e expected value o f t h e Laplace transform o f d ( t ) . The
con t r ibu t ion due t o t h e o s c i l l a t o r i n s t a b i l i t i e s is defined by
a2 (A' - - A* ' - 2n1 11 - ~ ~ ( ~ 1 1 2 ~ A '4 ( s )ds
where S (s) represents t h e "power s p e c t r a l dens i ty" of A$, The t h i r d term A$
rep resen t s a condi t ional variance due t o t h e phase c h a r a c t e r i s t i c s o f t h e
atmospheric turbulence and i s defined by
where S ( s ) represents t h e 'power s p e c t r a l dens i ty" of t h e phase process 0
I $ ( t ) l . The four th term i n a 2 represents a va r i ance component on t h e down- I l i n k s i g n a l due t o those up-l inks components t racked i n t h e t ransponder . Thus
-1-
* A t t h i s po in t we have assumed t h a t t h e processes { x ( t ) > and { 9 ( t ) > a r e s t a t i s -
t i c a l l y independent. I t would be i n t e r e s t i n g t o consider t h e e f f e c t s ( i f any) which t h e c ross -co r re l a t ion produces on t h e loop ' s t r ack ing a b i l i t y .

where S (s) cha rac te r i zes t h e power s p e c t r a l dens i ty of t h e in t e r f e rence , e .g. , I
up-l ink thermal no i se , up- l ink mul t ipa th , up-link doppler , which t h e t ransponder
s e e s . This term is zero f o r one-way ope ra t ion . The var iance term u 2 p re sen t B only i n t h e t ransponder , i s due t o p l ane ta ry backsca t t e r and i s a term which
must be considered i n eva lua t ing t h e performance o f t h e t ransponder loop. I t s
e f f e c t s a r e defined by
where S ( s ) r ep resen t s t h e power s p e c t r a l dens i ty of t h e e f f e c t i v e multipath B s i g n a l AB s i n $ Fina l ly , we have t h a t
B '
r ep resen t a condi t ional var iance owing t o t h e thermal noise f l u c t u a t i o n s .
This reduces t o
NOWL(A) 1 u2(A) = - - A 2~~
9 P (A) where p (A) =
2 ~ ' N o w L (A)
where t h e "condit ional loop bandwidth" i s defined by
The uncondit ional var iance o f t h e t o t a l phase e r r o r can be found by averaging
0 2 ( ~ ) over t h e p r o b a b i l i t y dens i ty funct ion p(A), i . e . ,
which se rves t o c h a r a c t e r i z e t h e spread o f p(p) i n t h e region of opera t ion
where s i n 9 z 9. The approximation app l i e s when o is small enough t h a t X
p(A) = 6(A - A).

3.4.2 The Ef fec t of Thermal Noise on t h e To ta l Loop Phase Er ro r
Notice t h a t when W (A) is not apprec iably a f f ec t ed by t h e amplitude L
f luc tua t ions ( t h i s w i l l be determined by t h e l i m i t e r suppression f a c t o r t o be
considered s h o r t l y ) , then t h e average loop s igna l - to -no i se r a t i o i s
p(A)6(A - K ) ~ A
..m
P 2m2 [E (A) 1
NOW^(^)
and from (7.6A3) we have, under a conservat ion o f power assumption,
2m2~E exp (-u: ) P "
NOW^ (TI
o r small o . With u 2 = 0.056, t h e normalized s igna l - to -no i se r a t i o becomes X X
The above funct ion should be s tud ied f u r t h e r f o r o t h e r l oca t ions along t h e
zen i th .
3 .4 .3 The Ef fec t of Doppler on t h e To ta l Loop phase Error
To evalua te t h e remaining cond i t iona l variances one must eva lua te var ious
ted ious i n t e g r a l s l i s t e d above. We omit t h e d e t a i l s .
When d ( t ) i s cha rac te r i zed by a s imple doppler o f f s e t (we s h a l l t r e a t t h e
more complicated problem of doppler r a t e and a c c e l e r a t i o n l a t e r ) and F(p) =
(1 t T ~ P ) / ( ~ + T,P) then (Reference 25)
When ~ A K / T ~ R ~ << 1 then

and f o r ox << 1
3.4.4 The E f f e c t o f O s c i l l a t o r I n s t a b i l i t i e s on t h e To ta l Phase Error
E lec t ing t o model t h e o s c i l l a t o r i n s t a b i l i t i e s a s i n Reference 25, then
and
where r2 = 45 (5 - loop damping) and G(r) is def ined i n Reference 25, p. 1.51
For p a r t i c u l a r o s c i l l a t o r s t h i s e f f e c t can be eva lua ted .
3 .4 .5 The E f f e c t of t h e Channel Phase C h a r a c t e r i s t i c s Due t o Turbulence on t h e To ta l Phase Er ro r
The next component i n t h e phase-error budget i s due t o t h e channel phase
f l u c t u a t i o n produced by turbulence . I f one c h a r a c t e r i z e s t h e s e f l u c t u a t i o n s
a s RC f i l t e r e d white no i se , then t h e spectrum of { + ( t ) l can be approximated by
(Reference 11)
where a. is t h e 3-decibel r ad ian frequency and u 2 i s t h e var iance o f t h e f l u c t u - + a t i o n s . Without going i n t o t h e tedious d e t a i l s it can be shown t h a t

where
The f a c t o r s p , ro and WLO a r e defined i n Reference 25 from pages 153 t o 156.
S u b s t i t u t i o n o f t h e above r e s u l t s i n t o Equation (7.6A94) and s impl i fy ing ,
leads t o
where f3dB has been determined by Woo, Reference 3 . When ox is small then
3.4.6 The Effect o f t h e Up-Link on t h e Ground Receiver 's Tota l Phase Error
Turning now t o t h e component o f phase e r r o r due t o up- l ink e f f e c t s on
t h e performance of t h e ground r ece ive r U;(A), one can e a s i l y show t h a t

where BI r ep resen t s t h e 3dB frequency o f t h e process I 1 ( t ) j. When o << 1, X
then
The exac t e f f e c t on t h e loop phase e r r o r is bounded by
when o i s smal l . X
3 .4 .7 The Ef fec t o f P lanetary Backscat ter on t h e Total Phase Error*
The var iance due t o p l a n e t a r y backsca t t e r r equ i re s modeling t h e spectrum
o f t h e backsca t t e r process A ( t ) s i n 0 ( t ) - 0 ( t ) . For sake of argument, B [ B A B I assume t h a t t h e power spectrum o f t h e mul t ipa th backsca t t e r can be modeled a s
a narrowband process centered around 2 i ~ f where f r ep resen t s t h e doppler d d s h i f t p re sen t on t h e backsca t te red s i g n a l ( see Figure 7.6A-8). I f we charac-
t e r i z e t h e backsca t t e r spectrum as
SB (u) = - (u - ~ d ) ~ (0 + wdI2 ""' 20 [ex.(- ,,> )+ ex.(- ,,. )] where o i r ep resen t s t h e var iance of tlie backsca t t e r a s a funct ion , 3 dec ibe l
r ad ian frequency 5, then , by assuming t h a t t h e PLL opera tes as an i d e a l f i l t e r ,
(Figure 7.6A-8) of bandwidth WL = 2BL Hertz , then
* The theory should apply t o determining t h e e f f e c t s which p l ane ta ry mul t ipa th
produces i n t h e spacec ra f t and/or ground r e c e i v e r s .

w-
Figure 1.6A-8. Spectrum of Planetary Backscatter and its Effects on the Transponder Loop

m 2 ~ 2 0 2 ( ~ ) = B SB(w)dw.
S u b s t i t u t i o n leads t o
B ( [ 2 T l B ~ g wd] [2nBLg* ud]) m2A2 u;(A) = 5' E r fc + Erfc
where
Erf x = A - j exp(-z2/2)d2
and
E r f x = -Erf (-x) . Now i f w > r 2nBL (fd 1- B ~ ) , then d
On t h e o t h e r hand, if fd << B then L '
I n add i t ion , when 2nB L
> > g a n d f d < < B then L '
and when 2rrB L
< c 0 and fd < c B t hen L'
Therefore, t h e backsca t t e r e f f e c t on t h e loop phase e r r o r is bounded by
0 5 E p i (A)] o r / m2A2. (7.6A108)
The mean-squared value which t h e p l ane ta ry backsca t t e r produces ou t s ide t h e
loop bandwidth ( add i t iona l sideband noise) i s given by

where
A 1 6(z ) = - exp ( - z2 /2 ) . "5%
The parameters 0 and a 2 can presumably be determined by considering t h e antenna B
p a t t e r n and t h e r e s u l t s due t o Glenn, S t a r a s , Roth and Rouland i n an RCA r epor t ,
January 1967. They p resen t models of Venus s u r f a c e roughness, and methodology
o f determining a c t i v e s c a t t e r i n g a r e a s . Appendix 7.6G generates t h e appropri-
a t e parameters f o r a s ses s ing degradation i n t h e t o t a l phase e r r o r i n t h e t r ack -
ing loop of probe and ground r ece ive r s .
3 . 4 . 8 Bound on t h e Variance o f t h e Tota l Phase Error
From t h e above r e s u l t s we can conclude t h a t (if o x i s small)
where t h e loop s igna l - to -no i se r a t i o is
and p o r ep resen t s t h e loop s igna l - to -no i se r a t i o when a and o a r e zero, i . e . , X 4
no turbulence.
3 .4 .9 Nonlinear Analysis of a Second-Order Loop i n t h e Presence o f Multipath and Turbulence
To produce an ana lys i s which g ives t h e cond i t iona l p r o b a b i l i t y dens i ty
funct ion p ( q l ~ = ~,,e') we s h a l l begin by assuming t h a t d ( t ) = 8 0 + R o t and
neglec t t h e p l ane ta ry backsca t t e r term. The assumption about d ( t ) i s of no
t r o u b l e s i n c e we s h a l l s tudy it i n i t s more general na tu re l a t e r ; however,
inc luding t h e p lane tary backsca t t e r term AB s i n @ i n any nonl inear ana lys i s B

c r e a t e s formidable problems as we s h a l l s e e . Without going i n t o pages of
d e t a i l s , it can be shown, under r a t h e r general assumptions (Reference 25,
Chapter 11, 12) t h a t t h e cond i t iona l p r o b a b i l i t y dens i ty funct ion p ( $ l ~ ) i s
given by
X I
p ( v I ~ = Aoe = Cg exp[-uo(co)l r'+2v ~ X P [Uo (x) 1 dx (7 .6Al l l )
9
where we have assumed t h a t t h e bandwidth o f { x ( t ) } i s much smal le r than t h e
loop bandwidth with
A 2 u o ( ~ ) = - [no - AKFO s i n v + ~ [ y ~ 191
K O 0
where K o o is def ined i n Reference 25, page 482, and y l i s def ined i n Reference
25, page 481. The remaining terms a r e condi t ional expecta t ions which must be
approximated i n o rde r t o produce t h e condi t ional p r o b a b i l i t y dens i ty funct ion
p ( v l ~ ) . I f one uses t h e condi t ional expectat ion method t o approximate t h e s e
then
Uo(v) -8 ' (1) - a l ( l ) cos 9 (7.6A113)
where
and a(1) and 8(1) a r e defined on page 537 of Reference 16. Here o 2 = G
E [ ( s i n p - sin)2] and R (0) r ep resen t s t h e value o f t h e c ross -co r re l a t ion XY
funct ion between t h e process x ( t ) and y ( t ) a t zero s h i f t . To ca r ry t h e
ana lys i s f u r t h e r , one must eva lua te t h e s e c o e f f i c i e n t s which r ep resen t de-
t a i l e d c a l c u l a t i o n s . I n o rde r t o e f f e c t a ca re fu l and r a t h e r accura te noisy
re ference l o s s s tudy , t h e above d e t a i l s should be inves t iga t ed f u r t h e r .
When t h e p l ane ta ry backsca t t e r is included i n t h e nonl inear ana lys i s then
t h e r e s t o r i n g f o r c e i n t h e loop becomes (from 7.6.462)

A s i n 9 + AB(t) s i n ( 9 + A + ) = A s i n 0 + AB(t)
[ s i n 9 cos A @ + cos 9 s i n A @ ] (7.6A116)
A where A Q = 0 - O. I f t h e processes a r e slowly varying then t h e p r o b a b i l i t y
B dens i ty funct ion p 9 A , A .A$ l f given by (7 .6Al l l ) with Uo(q) charac ter ized by ( B 1 '
U ) = - 0 1 - ' ( 1 cos 9 + $ s i n A @ s i n p I The r e s u l t i n g p(q) can then be obta ined , i n theory , by averaging over t h e
j o i n t p r o b a b i l i t y d e n s i t y func t ion p A, $, A @ . To access t h e degradat ion i n
t r ack ing loop performance a t low s i g n a l - t o - n o i s e r a t i o s , t h e above a n a l y s i s
should be pursued f u r t h e r . We s h a l l no t proceed with t h i s here; however, we
turn t o t h e problems one i s faced with when a l i m i t e r i s p resen t .
4 . TRACKING LOOP ANALYSIS WHEN A LIMITER PRECEDES THE LOOP: BACKSCATTER AND TURBULENCE PRESENT
We now tu rn t o address ing t h e problem of developing t h e behavior o f a P L L
when it i s preceded by a bandpass l i m i t e r (BPL). We assume t h e lognormal
channel model d iscussed e a r l i e r and inc lude at a l a t e r t ime t h e p l ane ta ry back-
s c a t t e r e f f e c t s . The i n p u t s i g n a l t o t h e BPL can be modeled as
where
I t i s convenient t o expand t h e noise about 9 ( t ) . I t can be shown (Reference r
2 , Chapter 3) t h a t
n i ( t ) = fi Nc(t) cor [uot + er(t)] - Ns( t )s in + Br(t) , I where
A N = n cos 8 + n s i n e c c r s r
4 ns cos O r - n s i n 0 . s r S

~ ( t ) = fi A. exp[x(t) J cos M - N I + f i A o exp[x( t ) ] s i n M + N I
I f we d e f i n e
then t h e output of t h e f i r s t zone ( l i m i t e r is cha rac te r i zed by (Reference 37)
Since t h e power i n t h e f i rst zonal output i s PI = 8 / n 2 and cons tant , we
have
z = [cos y s i n n r + s i n y cos $r I where
Or(tl = wet + B,(t),
wi th
A fi A s i n M + 5 N~
s i n y = J
A fi A cos M - fi Ns
cos y = J
L ~ ( A s i n M + N ~ ) ' + Z ( A cos M - Nc l2 and A = A. exp(x). I t i s convenient t o expand t h e output i n terms o f a s i g n a l
component and a no i se component. Thus, i n t h e first zone of t h e l i m i t e r out-
put we have, t ime suppressed,
- s i n n r + cos @ + NA s i n - NB cos O r
r r I

where
A 2 f i - N = - ( s i n y - s i n y)
A IT
I t i s easy t o show (Reference 2) t h a t
s o t h a t t h e loop 's phase d e t e c t o r output i s given by
E = K K [COS y s i n p + sin cos $1 + NA cos (p - N s i n p 1 m 1 - B
where
A ~ = d + $ ~ + $ + I - 8
so t h a t t h e loop equation of opera t ion can be rewr i t t en a s
- s i n $ + s i n y cos p + N ( t ,
e J
where
A Ne(t. V.) = N A cos p - N B s i n q .
Now with a g r e a t dea l of a lgebra .one can show t h a t
and
4 fiL sin = - TI -(I - m2)a2(x) ~ ( t )
where t h e condi t ional l i m i t e r supression f a c t o r is defined by

.(XI 4 hi exp(2x) exp - [ p i ex:"x) ] P exp(2r))
and p . = 2~: NOWi r ep resen t s t h e s igna l - to -no i se a t t h e output of t h e I F 1
f i l t e r . S ince t h e d a t a modulated s u b c a r r i e r i s designed t o l i e o u t s i d e t h e
bandpass of t h e loop f i l t e r we can w r i t e t h e loop equat ion of opera t ion a s
K e p = d + $ + I + * l - - - - v K F ( ~ ) x ) s i n + N ( t . q ) ] - U~ - -.
P e P
Comparing t h i s equat ion with t h e one developed e a r l i e r , when no l i m i t e r was
p r e s e n t , we s e e t h a t A has been replaced by a(x) and N( t , p) by Ne(t, p ) . I f one assumes t h a t t h e loop i s narrowband with t h e equiva lent s p e c t r a l
dens i ty o f Ne(t, v) a t t h e o r i g i n , condit ioned upon x, then one can approxi-
mate t h i s by
where (Reference 2)
where { x ( t ) } i s t h e amplitude process and rH i s def ined i n Reference 25, page
197 (usua l ly taken t o be around 0 .9 ) . Using t h e above formulas and mater ia l
i n Chapter 4 o f Reference 25, t h e formulas developed i n Sec t ion 3 can e a s i l y
be genera l ized t o t h e case where a l i m i t e r is p r e s e n t . We omit t h e d e t a i l s
here .
I f we now inc lude t h e mul t ipa th e f f e c t s due t o p l ane ta ry backsca t te r ,
t h ings become a b i t more d i f f i c u l t t o ca r ry out owing t o t h e f a c t t h a t t h e
c e n t e r frequency i s not w o + dB / d t ; however, a worst-case a n a l y s i s can be r c a r r i e d o u t by assuming t h a t t h e p l ane ta ry backsca t t e r process can be ex-
panded a s
AB(t) s i n a B ( t ) = fi ngc( t ) cos w o t - f i n ( t ) s i n m o t Br
i n which case , with time suppressed,

n . = JT (nc + nBc) cos u O t - &(n + nBs) s i n wet. 1 s
Without going i n t o t h e ted ious d e t a i l s , t h e condi t ional l i m i t e r suppression
f a c t o r reduces t o
where
and a2 = N W . / 2 , Wi - i f f i l t e r bandwidth, u2 i s t h e var iance o f t h e p l ane ta ry n 0 1 A B
backsca t t e r . I f we de f ine p i = 2 ~ g / N W then 0 i
exp (2x) Q(x) =
assesses t h e e f f e c t on t h e l i m i t e r suppression f a c t o r due t o mult ipath and
turbulence.
I f we now average over Q(x) we f i n d t h a t
A where p m = A;/U; r ep resen t t h e SNR t h e s igna l - to -no i se r a t i o due t o back-
s c a t t e r . I f mx = -u2 then X
represent t h e average s ignal - to-noise r a t i o a f f e c t i n g t h e l i m i t e r suppression
f a c t o r .
When o << 1 then one can approximate X

s o t h a t , t o a good approximation, a l l t h e above l i m i t e r formulas hold when
Q(x) i s replaced by E(Q(x)] and A is replaced by mA = E ( A ) . 4.1 S t a t i c Phase Error Build Up Due t o t h e Doppler P r o f i l e
For a second-order loop preceded by a BPL, t h e t r a n s f e r funct ion f o r
slowly varying amplitude v a r i a t i o n s i s given i n Reference 2 5 , page 156.
When t h e ga in o f t h e loop i s not assumed t o be i n f i n i t e , then
I - H (s ) = 10
9 s=
s o t h a t t h e s t e a d y - s t a t e phase e r r o r becomes
where
i s t h e l i m i t e r suppression f a c t o r and a K represents t h e loop gain a t t h e 1 0 loop design p o i n t . Let d ( t ) = Znf(t) where f ( t ) i s t h e instantaneous f r e -
quency of doppler then
2 n f ( t ) % s ( t ) = p [ "lo +a(r~+l)';(t)]. 2 W ~ o
By appropr i a t e ly choosing t h e VCO c e n t e r frequency "during any time i n t e r v a l
of i n t e r e s t " then

For a 10 Hertz loop which has 0.707 damping then
Vss ( t ) 2 0 . 0 7 0 7 ~ f ( t ) .
And a t threshold P = 1, s o t h a t
qSS ( t ) = 4.05 f ( t ) (degrees) .
From t h e doppler p r o f i l e it appears t h a t an average value f o r f ( t ) = 40
Hertz p e r second near blackout . Therefore a t threshold and en t ry ,
qSS(t) - 160 degrees which i s much too l a r g e (should be l e s s than 30 degrees
a t high s ignal - to-noise r a t i o ) t o t r a c k with a second-order loop. A t en t ry
minus 60 minutes q ( t ) - 12 degrees and with a loop s igna l - to -no i se o f 10 SS dec ibe l s then pSS 2 3 t o 5 degrees. I t i s easy t o compute p a t any pos i -
SS t i o n along t h e predic ted t r a j e c t o r y and wi th t h e passage of t ime f u r t h e r
conclusions can be drawn. Later we s h a l l cons ider t h e problem of two-way
s t a t i c phase e r r o r build-up; s ee Sec t ion 5.
If one d e s i r e s t o s tudy the e f f e c t s of tuning t h e VCO with t h e passage
of t ime, then one rep laces d ( t ) by
where e ( t ) represents t h e tuning vol tage; s e e Equation (7.6A49) and Equation
(7.6A50).
4 . 2 Doppler Variance i n t h e Transponder Loop and Suppression on t h e Downlink C a r r i e r Due t o Uplink Ef fec t s
In a two-way mode o f operat ion t h e r e a r e four random s i g n a l components
c i r c u l a t i n g i n t h e t ransponder loop which se rves t o suppress and spread t h e
downlink c a r r i e r . For t h e present , we do n o t eva lua te t h e r e s u l t i n g c o r r e l a -
t i o n funct ion and s p e c t r a of t h e t ransmi t ted s i g n a l a s t h e r e s u l t s given i n
Sect ion 2 can be applied d i r e c t l y . The s i g n a l s which se rve t o suppress t h e
downlink c a r r i e r include: uplink turbulence, upl ink thermal noise , p l ane ta ry
backsca t t e r and, i f any, o s c i l l a t o r i n s t a b i l i t i e s which a r e n e g l i g i b l e owing
t o t h e s p e c t r a l p u r i t y of t h e t ransmi t ted c a r r i e r .
The mathematics o f t h e s i t u a t i o n can be described us ing Equation (7.6A62
and assuming t h a t s i n v - 9 . Thus the equat ion of opera t ion which governs thc
VCO phase modulation is (e = 0)

A s i n P B + N(t, 9) ;(A) = H I (PI*) d + P I + P + B
m2A2 I So t h a t t h e mean-squared value o f 8 due t o d is turbances o t h e r than d ( t )
i t s e l f i s
where
%2 o (A) = -
'b 1 2111 I H,[S IAIl SPl ( s )ds
and t h e l a s t two terms a r e determined by Equations ( 7 . 6 ~ 8 0 ) and (7.6A102).
General ly, u2 (A) = 0 i s a two-way mode so t h a t one need only determine $1
t h e f i rs t and t h i r d terms. In f a c t , us ing Equation (7.6A92) i n t h e above
produces
where
and d o , d l , dZ and d 3 a r e def ined i n (7.6A93)
I f G r ep resen t s t h e s t a t i c phase ga in of t h e r ece ive r then t h e c a r r i e r
suppression on t h e downlink is given by

i f o << 1. Here X
Fxp [.G~~;(T)] exp [ - G ~ U ; ~ ] .
e x [-G~U;(K)]
Fina l ly , we no te t h a t t h e variance on the doppler measurement i s given
by
5. PERFORMANCE OF TWO-WAY LINKS IN THE PRESENCE OF MULTIPATH AND TURBULENCE
In what fol lows, we spec i fy t h e theory requi red t o ob ta in t h e s teady-
s t a t e response o f a two-way l i n k . We merely s p e c i f y t h e equation o f opera-
t i o n and leave t h e d e t a i l s f o r l a t e r evalua t ion . Subscr ip ts "one" have t o
do with uplink va r i ab les while s u b s c r i p t "two" implies a downlink v a r i a b l e .
Figure 7.6A-9 dep ic t s a two-way system model, a l l t h e disturbances,
and b a s i c equations needed f o r ana lys i s . Previous s e c t i o n s have given t h e
theory f o r one-way opera t ion; consequently, i n what follows we spec i fy t h e
variance of t h e phase and doppler e r r o r . The s t eady-s t a t e phase e r r o r , due
t o "determinis t ic q u a n t i t i e s " can be found from
Using t h e b a s i c equations given i.n Figure 7.6A-9 we have

0 2 = d 2 + $ 2 + $ 2
* N l ( t , 9) AB s i n qB el = Hy1(1 IA1) t
UP-L INK TRANSPONDER DOWN-LINK GROUND RECEIVER ---/ A \
0 1 - - T7* GH (p/A1) - - G ; ~ - H ( P / A ~ ) 2
A
0
Nl(t. 9) AB sin qg el H ( p \ A 2 ) [
A1 t
91 A1 I
/
Figure 7.6A-9. Two-Way Link Model and Basic Equations
(ml = 1) -35-
1
N l ( t , l ~ ) + AB s i n qB N 2 ( t , Y ) A 1 A 1
$1 -
+ 2

as t h e s t e a d y - s t a t e e r r o r due t o t h e upl ink doppler phase funct ion d l ( t ) and
downlink doppler phase funct ion d 2 ( t ) .
Le t t ing i l ( t ) = 2 n f ( t ) = A2(t ) , then
The condi t ional var iance o f t h e two-way phase e r r o r i s given by
while t h e var iance of t h e two-way doppler measurement i s found from

with d l = d2 = 0.
By us ing t h e b a s i c equat ions given i n Figure 7.6A9 we f i n d t h a t
s, (s ) = S (5) + s ( s ) + S ( s ) 2 d2 $2 @ 2
and
S, (5) = S ( s ) + S (5) + S (5). (7.6A124) 1 d 1 '4 1 @ 1
These r e s p e c t i v e equat ions can be s u b s t i t u t e d i n t o o 2 (A) and 02 (A) t o $ 2 8 2
produce cond i t iona l var iances s o t h a t
t o produce t h e average values o f t h e mean-squared value of t h e two-way phase
and doppler e r r o r . The evalua t ion is s t r a igh t fo rward , but t ed ious .
I f o: < r 1 then
where pk represents a ko/ "k and W10 and W r ep resen t t h e design po in t loop 2 0
bandwidth o f t h e t ransponder and ground r ece ive r r e s p e c t i v e l y .

I f one d e s i r e s t o d r i v e t h e ground VCO with a p r e d i c t , then d 2 ( t ) should
be replaced by
and t h e e f f e c t s can be s tud ied from t h e r e s u l t i n g theory .
6 . CONCLUSIONS
This appendix has d e a l t with problems p e c u l i a r t o communication systems
designed t o t ransmi t information through t h e Venus atmosphere from a space-
c r a f t (probe). Since t h e atmosphere produces lognormal c a r r i e r s , and l a r g e
doppler c o e f f i c i e n t s a r e present , a number o f new problems have a r i s e n which
h inder t h e engineer from d i r e c t l y applying (with confidence) t h e usual equa-
t i o n s and rules-of-thumb i n t h e design.
The first problem concerns channel c h a r a c t e r i z a t i o n . This problem
d e a l s with spec i fy ing t h e r e l a t i o n s h i p between t h e communication parameters
and t h e physical parameters o f t h e propagat ion medium. Therefore, t h e f i r s t
p a r t of t h e appendix dea l s with iden t i fy ing t h e r e l a t i o n s h i p between t h e com-
munication and propagation parameters a r i s i n g i n t h e channel. There has been
a considerable amount o f t h e o r e t i c a l work c a r r i e d out by propagation p h y s i c i s t s
on t h e e f f e c t s o f r e f r a c t i v e index f l u c t u a t i o n s (time and s p a t i a l ) upon mono-
chromatic s i g n a l s . Also, t h e r e has been a cons iderable amount o f t h e o r e t i c a l
work by communication engineers on t h e e f f e c t s of randomly time-varying chan-
n e l s on t h e e r r o r p r o b a b i l i t i e s of d i g i t a l communication systems. On t h e
o t h e r hand, t h e r e has been v i r t u a l l y no work on t h e e f f e c t s which randomly
time-varying channels have upon t h e performance of coherent t r ack ing and
synchronizat ion systems. Regarding e r r o r p r o b a b i l i t i e s , cons iderable e f f o r t
has been expended on p r e d i c t i n g system performance when t h e channel model i s
considered Rician. V i r t u a l l y no work has been repor ted which can be used t o
spec i fy t h e performance o f coherent systems where lognormal c a r r i e r s a r e
present . This appendix has given pre l iminary r e s u l t s .
In t h e s tudy o f communications through t h e Venus atmosphere reported
he re , two channel models have been considered, v i z . , t h e Rician channel, and
t h e lognormal channel. On t h e b a s i s of t h i s i nves t iga t ion , it appears t h a t
t h e lognormal channel r ep resen t s a more accura t e cha rac te r i za t ion of t h e
fad ing c h a r a c t e r i s t i c s , i . e . , i f s ( t ) i s t r ansmi t t ed , then exclus ive of

a d d i t i v e n o i s e , t h e lognormal c a r r i e r s ( t ) exp[x(t) + i $ ( t ) ] i s rece ived .
Here both [ x ( t ) ] and [ $ ( t ) J a r e co r re l a t ed gaussian processes . Thus, an
immediate ques t ion a r i s e s concerning how t h e Rice theory does not , i n gen-
e r a l , d i r e c t l y apply. The primary reason is t h a t a lognormally d i s t r i b u t e d
random v a r i a b l e can be used t o approximate a noncentral chi-squared random
v a r i a b l e . A noncent ra l chi-squared random va r i ab le , on t h e o t h e r hand,
represents t h e sum o f t h e squares of s eve ra l R ice -d i s t r ibu ted random v a r i -
a b l e s .
Accomplishing coherent communications over t h e lognormal channel implies
t h a t t h e t ransmi t ted s i g n a l amplitude is mul t ip l ied by exp[x ( t ) ] while it
a l s o undergoes a random phase-sh i f t of e x p ( i + ( t ) ] . In o rde r t o a s ses s t h e
degradat ions i n performance, it has been necessary t o model and cha rac te r i ze
t h e behavior of coherent t r ack ing systems i n t h e presence of lognormal car -
r i e r s . This appendix has summarized and presented t h e s e mathematical models
and inves t iga t ed , t o wi th in t h e time c o n s t r a i n t s , t h e d e l e t e r i o u s e f f e c t s
produced upon t r ack ing performance. Although t h e work cannot be considered
as complete, it has been shown f o r t h e slow lognormal fad ing expected on
t h e probes and f o r uncorre la ted amplitude and phase components, t h a t the
random p h a s e - c h a r a c t e r i s t i c can be t r acked by t h e loop. Fur ther , t h e random
phase c h a r a c t e r i s t i c w i l l a f f e c t t h e a b i l i t y t o measure doppler accura te ly
and t h e theory t o a s ses s t h e degradat ion is given. I t has been d i f f i c u l t
t o a s s e s s , exac t ly , t h e e f f e c t s o f t h e amplitude process on t r ack ing per-
formance; however, f o r small amplitude f l u c t u a t i o n s , t h e degradat ion i n
loop s igna l - to -no i se has been cha rac te r i zed and shown t o be l e s s than 0 .2
dec ibe l . The e f f e c t s o f c o r r e l a t i o n between t h e amplitude and phase process
were not f u l l y i n v e s t i g a t e d . I t appears t h a t t h e c o r r e l a t i o n e f f e c t s mani-
f e s t themselves by producing an unsymmetric c a r r i e r spectrum f o r t h e loop
t o t r a c k . This e f f e c t is a curious one and should r ece ive f u r t h e r study i n
o rde r t o a s ses s t h e degradat ions ( i f any) and e f f e c t s on t r ack ing pe r -
formance a s well as t h e performance o f t h e da ta d e t e c t o r . Moreover, i t i s
probably s a f e t o conclude t h a t t h e theory developed t o determine t h e effec-
t i v e loop s igna l - to -no i se r a t i o does n o t s e rve t o t e l l t h e complete s t o r y .
The theory r equ i red t o a s ses s t h e e f f e c t s of p l ane ta ry backsca t t e r on
t h e ground r e c e i v e r and transponder performance i s given. . Fur ther d e t a i l e d

work needs t o be done, using the theory given he re , i n order t o accura te ly
determine i t s e f f ec t s ; however, a prel iminary inves t iga t ion r evea l s t h a t
they a r e small .
While t h i s appendix has presented t h e theory f o r determining the degra-
da t ions which t h e lognormal amplitude has on t h e e r r o r p robab i l i ty , we have
not been a b l e t o produce a complete s e t o f design curves f o r determining t h e
e f f e c t s which lognormal c a r r i e r s have on t h e performance of systems which
employ convolutional codes. This is an important problem a rea which needs
f u r t h e r study owing t o the impact t h e r e s u l t s w i l l have on the s p e c i f i c a t i o n
of accura te design con t ro l t ab les . Computer s imulat ions o f f e r one method
f o r obtaining these r e s u l t s .
F ina l ly , a l i n e a r theory i s given which can be used t o determine t h e
s t a t i c phasc-error build-up i n both one-way and two-way systems where log-
normal c a r r i e r s and high doppler s h i f t s a r e p resen t . This includes the
e f f e c t s of tuning t h e VCO with and without p r e d i c t s . Furthermore, a l i n e a r
theory has been presented which can be used t o speci fy t h e variance of t h e
doppler and phase-error i n one-way and two-way systems where lognormal ca r -
r i e r s a r e present . Some f u r t h e r numerical work i s recommended i n t h i s a r e a .
7. ADDENDUM
A Correct ion of the Errors i n dewolf's Fading Rate Analysis
This addendum points out a major e r r o r i n deWolfls (References 2, 3, 38)
ana lys i s using an expression f o r the fading r a t e of a Rician envelope. A l -
though the use of t h e Rician d i s t r i b u t i o n f o r amplitude fading has been shown
t o be erroneous, t he e r r o r i n the fading r a t e does not appear t o have been
noticed. This can be important s ince deWolf uses t h e r e s u l t s from h i s ana lys i s
t o p red ic t d i f f e r e n t r e s u l t s f o r t h e fading f o r Venera 4 , 5, and 6 and
Mariner-5. In p a r t i c u l a r , h i s r e s u l t s i n d i c a t e t h a t t h e fading i s more
severe than indica ted by o the r i n v e s t i g a t o r s . Also, i t appears t h a t h i s
c r i t i c i s m of t h e Mariner-5 da ta i s a l s o based i n p a r t on h i s erroneous r e -
s u l t s . Since some recent assessments of models f o r r e l a t i n g experimental
da ta t o theory s t i l l suggest deWolfls method, it appears necessary t o pre-
sent the proper fading r a t e expressions f o r both the Rician and lognormal
s igna l amplitudes. The most recent r e p o r t suggest ing deWolfls erroneous

a n a l y s i s i s t h e SEL repor t by Crof t e t a l . (Reference 13)
DeWolf (References 2, 3 , 38) has made es t imates concerning t h e expected
s i g n a l fading r a t e i n the atmosphere of VEnus due t o turbulence. Based on
measurements from t h e Venera 4 , 5 , 6 and Mariner-5 probes, he tends t o con-
c lude t h a t t h e s igna l fading r a t e can be more severe than t h a t measured o r
p red ic t ed by o t h e r i n v e s t i g a t i o n s . deWolfts analyses have a l l been based on
h i s model of t h e Rice p r o b a b i l i t y d e n s i t y f o r t h e s i g n a l amplitude A ( t ) .
This i s con t ra s t ed with t h e lognormal amplitude d i s t r i b u t i o n obtained from t h e
Rytov apprcximation which i s known t o be v a l i d f o r weak fading . However,
deWo1f"s proof of t h e v a l i d i t y o f Rice d i s t r i b u t i o n (Reference 39) i s now
known t o be inco r rec t (References 4 , 40) . For example, on page 388 of
T a t a r s k i i ' s second book (Reference 4 ) , we have t h e fol lowing footnote :
'I... A p a r t i c u l a r case of equation (22) was derived by
Shishov/l90/ by means o f s e l e c t i v e summation of Feynman
diagrams. deWolf/188, 1891 a l s o t r i e d t o de r ive an
expression f o r T4, but h i s r e s u l t s f o r rq a r e d e f i n i t e l y
erroneous. ( I n p a r t i c u l a r , t h e conclusion regarding t h e
Rayleigh d i s t r i b u t i o n of t h e i n t e n s i t y f l u c t u a t i o n s stems
from t h e u n j u s t i f i e d omission of t h e connected diagrams
descr ib ing t h e f o u r t h cumulants of t h e f i e l d u - - s e e
11961 .)"
Also, a s pointed out i n a d i scuss ion of t h i s sub jec t by Lawrence and
Strohbehn (Reference 6 ) , deWolf o r i g i n a l l y predic ted t h e Rice d i s t r i b u t i o n
when a 2 > 0.64; however, he now tends t o favor t h e lognormal i n t h i s region X
(Reference 7 ) . Although t h e Rice model was used by deWolf t o analyze t h e da ta
from four of t h e Venus probe missions, t h e r e s u l t s of t hese assumptions
s t i l l appear i n t h e l a t e s t assessments of t h e s igna l fading expected from
atmospheric turbulence on Venus f o r Pioneer-Venus, t h e l a t e s t being t h e
SEL repor t by Crof t e t a l . (Reference 13 ) . I t should be noted, however,
t h a t t h e range of va lues f o r a 2 a s determined by Woo (Reference 15) a r e X
much l e s s than 0.64. In f a c t , they appear t o be i n t h e weak f l u c t u a t i o n
reg ion where t h e Rytov approximation is v a l i d and t h e f i r s t - o r d e r fad ing
d i s t r i b u t i o n is lognormal.

deWolffs i n v e s t i g a t i o n s (References 2, 3 , 38) were d i r e c t e d towards
es t imat ing t h e p o s s i b i l i t y o f atmospheric turbulence on Venus and i t s e f f e c t on
microwave s i g n a l fading. deWolf seeks an e s t ima te of t h e d i e l e c t r i c s t r eng th
which i s t h e var iance of t h e d i e l e c t r i c p e r m i t t i v i t y * and i n h i s no ta t ion was
given by E~ : < ( 6 ~ ) ' > * . The approach used was t o cons ider t h e propagation
parameter def ined by o: = k 2 e 2 ~ . ~ . (The no ta t ion is unfor tunate , s i n c e u2 i s 1 E
c a r e l e s s l y used i n t h e SEL r e p o r t (Reference 13) t o r ep resen t t h e propaga-
t i o n parameter as done by deWolf and a l s o t o r ep resen t t h e var iance o f t h e
d i e l e c t r i c p e r m i t t i v i t y . ) The term o i s approximately equal t o t h e measured E
quan t i ty oA, defined a s t h e depth of fad ing . The depth of fad ing i s defined
by deWolf by
. .
and i n terms of a commonly-measured i n t e n s i t y va lue I ( t ) = A2( t ) , by
0 2 E < 1 2 ( t ) > - < 1 ( t ) > 2 I < I ( t ) > 2
Based on t h e Rician theory , deWolf (References 2 , 3, 38, 39) r e l a t e s t h i s value
t o a: by
402 u 2 = l - e - E I
such t h a t
* Unfortunately, deWolfls n o t a t i o n causes some confusion when compared with
some more s tandard work as ind ica t ed , f o r example, i n t h e survey by Strohbehn (Reference 10 ) . I t appears t h a t deWolfls 6 E corresponds t o t h e term ~ , ( r , t )
i n Strohbehnls expression on page 1302. ~ ( r , t ) = E + ~ ~ ( r , t ) , E~ = < E ( x , ~ ) > . In Strohbehn's no ta t ion , we have Ce(o) = < e l ( r , t ) 2>0= < ( 6 ~ ) ' > which c o r r e ~ p o n $ ~ t o deWolfts term c 2 . Also, deWolfls expression E~ = \4<(6n)'> on page 7 of Reference 38 appears t o follow from Strohbehn's d e f i n i t i o n on page 1306 and page 1316, t h a t e ( r , t ) = n ( r , t ) = (1 + 6 n ( 1 - , t ) ) ~ z 1 + 2 6 n ( r , t ) with t h e r e s u l t t h a t CE(o) = 4<(611)~>.

o r o = o f o r small o . The o t h e r terms i n 0' a r e determined by k = 2 n / A , A E E E
t h e propagation d i s t ance L and by t h e i n t e g r a l s c a l e L . ; t h a t i s s t rong ly 1
r e l a t e d t o t h e macroscale s c a l e o f t h e turbulence Lo. deWolfls o b j e c t i v e i s
t o r e l a t e the measured value of oA and t h e fading r a t e f A ( r a t e o f fading of A(t)
below i t s mean value <A(t )>) through h i s Rician theory t o determine t h e macro-
s c a l e Lo. This value can be used i n t u r n t o determine c2. This value of c 2
then determines t h e d i e l e c t r i c s t r e n g t h of t h e turbulence on Venus. From t h i s
value, ex t rapo la t ions t o d i f f e r e n t frequencies and geometries can be made t o
p r e d i c t s igna l fading cond i t ions .
Unfortunately, t h e first equation used i n deWolfls ana lys i s f o r f is A i n c o r r e c t . I n f a c t , by us ing t h e co r rec t expressions f o r Rician and t h e log-
normal s t a t i s t i c s f o r A(t) der ived below, it appears t h a t h i s ana lys i s must be
completely redone. Making c e r t a i n s impl i fy ing approximations f o r weak fading
does not permit j u s t i f i c a t i o n o f h i s expression f o r f nor t h e acceptance of A
h i s r e s u l t s .
The bas ic e r r o r committed by deWolf was t o use Wheelon's formula (2.16)
(Reference 41) f o r l eve l c ross ing t h a t only app l i e s f o r gaussian processes.
Unfortunately, Wheelon d i d no t g ive a reference f o r t h i s formula and d id not
po in t ou t t h a t i t applied only f o r the case o f gaussian processes . Since
deWolf's model i s based on a Rice d i s t r i b u t i o n f o r A(t) o r a noncentral
chi-squared d i s t r i b u t i o n with two degrees o f freedom f o r I (T) = ~ ~ ( t ) , h i s
use o f Wheelon's formula f o r t h e l eve l c ross ing of A(t) below i t s mean value
i s incor rec t and t h e ana lys i s based upon i t s use i s i n c o r r e c t . Af te r d i s -
cussing deWolfls and Wheelon's s p e c i f i c formulas we w i l l de r ive t h e c o r r e c t
formulas f o r the Rician and lognormal cases f o r A(t) and I ( t ) .
deWolfls d e f i n i t i o n o f f given by equation (5) i n Reference 2 is as A
fol lows: "The envelope fading r a t e f is given by t h e average number o f A
c ross ings p e r u n i t time o f A(t) over the mean value <A>. A well-known ex-
press ion f o r fA [Wheelon, 19671 i s

(See footnotes* and ** concerning t h i s quote.)
Wheelon's equat ion (2.16) i s accompanied by t h e following statement:
"To represent t h e average number of times t h a t t h e s i g n a l crosses i t s mean
value with p o s i t i v e s lope p e r u n i t t ime, we adopt t h e s tandard de f in i t ion :
* I t should be noted t h a t t h e fading r a t e should be defined a s the average
number of down cross ings o f t h e mean value pe r second and not by t h e average number o f times it crosses t h i s value s ince t h i s counts both up and down crossings. However, a s used by Wheelon, t h e corresponding formula i s c o r r e c t except o f course t h a t it a p p l i e s only f o r a gaussian process.
* * We no te t h a t t h e fading r a t e f is expressed i n terms of t h e p roper t i e s of A
I ( t ) . We a l s o no te t h a t on page 8 o f reference 38 fA is replaced by f and on I
page 27 f is used. In t h e ana lys i s t h a t we w i l l g ive t h e cross ing r a t e f o r A I ( t ) fo r a l eve l L can be expressed i n terms o f the cross ing r a t e o f A(t) by
L
AL. This allows an easy way t o r e l a t e t o two crl s s i n g r a t e s and avoids r e -
coAputing j o i n t p r o b a b i l i t y d e n s i t i e s f o r I ( t ) and I ( t ) . That is N (L) = - A NI (L2) .

However, formula (2.16) i s t h e c l a s s i c r e s u l t due t o Rice (Reference 42) and
app l i e s only when a ( t > i s a gaussian process . Although Wheelon d i d not s t a t e
e x p l i c i t l y t h a t t h e process a ( t ) was gaussian i t i s obvious t h a t a ( t ) has a
zero mean. This can be seen a s fol lows, from page 684 and 685 of Wheelon's
paper: ---"Models f o r t h e turbulence, which decomposes t h e atmosphere's d i -
e l e c t r i c cons tant e ( r , t ) i n t o i t s mean va lue and a small s t o c h a s t i c f l u c t u -
a t i o n . "
--- "The anomalous phase is thus shown t o be t h e l i n e i n t e g r a l of A E along
t h e ( r e c t i l i n e a r ) r ay pa th
I t follows t h a t , s i n c e t h e expected value of A ~ ( x , t ) i s zero,
< A ~ ( x , t ) > dx = 0.
In genera l Wheelon's formula (2.16) corresponds t o t h e expected number of up
(o r down) cross ings p e r second of t h e l eve l L by t h e s t a t i o n a r y gaussian
process a ( t ) with mean va lue < a ( t ) > = a L - CzLZ
When L = a we ob ta in (2.16)
For deWolfVs case o f a Rician d i s t r i b u t i o n f o r t h e envelope A( t ) , we
can ob ta in t h e c o r r e c t expression f o r f d i r e c t l y from Rice ' s equation (4.8) A
given on page 125 o f r e fe rence 42. F i r s t we de f ine t h e received "sine wave
p lus noise" by
v ( t ) = Q s i n w t + n ( t ) 0

where t h e narrow band no i se process is expressed as
n ( t ) = x ( t ) cos w o t + y ( t ) s i n w t 0
and assuming a symmetric spectrum of n ( t ) about f o we have*
Expressing v ( t ) i n terms o f envelope and phase, we have
v ( t ) = A(,) s i n pot + ~ ( t ) ]
where
~ ( t ) = J ( Q + y ( t ) 1 2 + x 2 ( t )
and
Rice 's express ion f o r t h e average numbers of times pe r second t h a t A(t)
down crosses t h e l e v e l A(t) = L is given by:
where P (L) is t h e Rician dens i ty f u n c t i o n o f A a t A = L A
- We have previous ly used t h e nota t ion <.> t o denote expectat ion i n o rde r t o
conform with t h e quoted r e s u l t s of deWolf and Wheelon. Now we use t h e more commonly-used expression E(-).

Also we have t h e following d e f i n i t i o n s f o r the quadrature noise terms X(t) and
i t s d e r i v a t i v e X'(t) i n terms o f i ts c o r r e l a t i o n funct ion R ( t ) as X
R (0) = ~ [ x ~ ( t ) ] = 0' X
R;'(o) = E[x'(t)12-
For deWolf I s case where L - E[A(t)] = we have
where t h e specular-to-random power r a t i o i s defined by
I t i s seen t h a t the expression f o r N (r) i s a complicated expression and i n A no way resembles deWolfts equation (5) (where f A u R (x) .
A ). I t i s a l s o noted t h a t f o r t h e case o f t h e fading r a t e o f I ( t ) below I,
f ~ ' which corresponds t o if (TI, it can be shown t h a t
I
so t h a t
- N ~ ( I ) = RA(J i j
where
- I = Q~ + 2u2.
Therefore i f I ( 3 can be obtained from i f A ( ~ ) by s e t t i n g L = fi.
This expression is e a s i l y wr i t ten down but i s cumbersome and provides no
ins igh t t o t h e problem in ques t ion . We a l s o note t h a t f o r measurements a v a i l -
a b l e on I ( t ) we should s e t t h e threshold of fading l eve l o f I ( t ) a t (A)2 s i n c e
- N~ (X) = R* ( ( K ) ) .

I t is o f i n t e r e s t t o inves t iga t e t h e Rician case f o r l a r g e values of y .
From Appendix 7.6A. values o f v 2 considered were 3.11 and 14. For t h e case
when y 2 i s l a rge , Rice uses t h e approximation (page 125)
A(t) 2 Q + x ( t ) .
The corresponding expression f o r E A ( ~ ) i s given by h i s equation (4.12) a s
- ( L - Q ) ~
N (L) = - A
e 2lI Rx(o)
Since
L = E[A(t ) j = x = Q
we have f o r t h i s case
I t i s of i n t e r e s t t o r e l a t e t h i s expression t o t h e second moments of A(t)
and A(t) a s i n deWolf's expression. For t h e s e moments we have
E [ A ( ~ ) I ~ = ~2 + ~ ~ ( 0 )
From deWolfls equat ion (5) we have i n t h e p resen t nota t ion
which become upon s u b s t i t u t i o n of t h e above second moments
We n o t i c e t h a t t h i s l a s t expression d i f f e r s from t h e c o r r e c t expression
( co r rec t expression)

by t h e add i t ion term Q~ i n t h e denominator. However, s i n c e we a r e assuming
~2 >> Rx(0), deWolf's expression cannot be d i r e c t l y salvaged f o r t h i s
y 2 >> 1 case .
Actual measurements i n d i c a t e t h a t t h e variance of t h e log amplitude
i s smal l . The lognormal amplitude d i s t r i b u t i o n of A(t) appears t o be
v a l i d . For t h i s case we de r ive an expression f o r f For convenience we A ' def ine
Following the usual procedure we d e f i n e X(t) = Rn A(t) A where A i s ( / o ) 0 t h e received amplitude without fad ing . The process X(t) i s gaussian with
mean M and var iance a2 and R(t) i s a lognormal envelope process . I t i s X X
convenient t o cons ider t h e fad ing r a t e of R ( t ) , . t h e normalized vers ion of
A ( t ) , below t h e l eve l L.
The general expression f o r N L ( ~ ) is given by d e f i n i t i o n
and it can be shown t h a t
where t h e c o r r e l a t i o n funct ion of X(t) i s defined by
2 Rx(.r) = E(x( t )X( t + T) - Mx.
Defining t h e c o r r e l a t i o n funct ions o f A(t)/X by R ( t ) i t can be shown t h a t
where R -(O) corresponds t o n2, where n i s t h e usual d e f i n i t i o n of "depth A/A
of fading."

This allows us t o ob ta in t h e expression f o r R"(0) and Rx(0) i n terms t h a t X
can be obtained from measurements, namely q 2 = R -(0), and R"-(0). A/A A/ A
These expressions a r e
= en[q2 + 1] = Rx(0)
and
For L = a we have
Using these r e s u l t s we ob ta in
Thus t h e expression f o r the fading r a t e of A(t) (normalized by Ao) over i t s
mean value Si has been obtained f o r t h e more meaningful lognormal d i s t r i b u t i o n
of t h e envelope. I n order t o use deWolfls ana lys i s and i t s conclusions, i t
appears t h a t much add i t iona l work must be done. This could be important i n
any assessment of measured d a t a from Venera 4 , 5, 6, 7 , 8 and Mariner-5.

REFERENCES
D. A . deWolf, "Saturat ion o f I r radiance Fluc tua t ions due t o Turbulent Atmosphere," Town. Opt. Soc. Amer. 58 pp. 461-466, (1968). -
D . A . deWolf, "Evidence f o r Severe Microwave Signal Fading i n the Atmosphere o f Venus due t o Turbulence," J . o f Geophys. Research, Vol. 76, No. 7 , pp. 1202-1208, (March 1970).
D . A. deWolf, "Atmospheric Turbulence on Venus: Venera 4 . 5. 6 and . . . . Mariner 5 Estimates," J . o f Geophys. Research, Vol. 76, No. 13, pp. 3154-3158, (May 1971).
V. I . T a t a r s k i i , "The E f f e c t s of the Turbulent Atmosphere on Wave Propagation," - Naka, Moscow, (1967) . Translated and a v a i l a b l e from t h e U.S. Dept. o f Commerce, Spr ingf i e ld , Va.. TT-68-50464.
M. A. Kolosov, 0 . I . Yakovlev, and A . I . Yefimov, "Study o f t h e Propa- ga t ion of Decimeter Radiowaves i n t h e Atmosphere of Venus with t h e Aid of AIS Venera-4," Dokl., Adad. Nauk SSR, Geofiz., Vol. 132, No. 1, pp. 93-94, (1968).
R . W . Lawrence and J . W . Strohbehn, "A Survey o f Clear-Air Propagation Ef fec t s Relevant t o Opt ica l Communications," Proc. o f t h e IEEE, Vol. 58, No. 10, pp. 1523-1545, (October 1970).
D . A . deWolf, "Are Strong I r r ad iance Fluc tua t ions Lognormal o r Rayleigh Distr ibuted?", J . Opt. Soc. Amer. Vol 59, pp. 1455-1460, (1969).
V. I . T a t a r s k i i , Wave Propagation i n a Turbulent Medium, (McGraw-Hill, New York, 1961).
R . S . Kennedy, S . Karp, e d i t o r s , Optical Space Communications, NASA SP-217. (August 1968).
J . W . Strohbehn, "Line-of-Sight Wave Propagation Through t h e Turbulent Atmosphere," Proc. of t h e IEEE, Vol. 56, No. 8, pp. 1301-1318, (August 1968).
A. Ishimaru "Temaoral Freauencv Svect ra o f Multifreauencv Waves i n . Turbulent ~ t m o s G e r e , " IEEE Trans. Antennas & propagation, Vol 20, No. 1 pp. 10-19, (January 1972).
12. R . Wooand A . Ishimaru, "Remote Sensing of t h e Turbulence Character- i s t i c s o f a P lanetary Atmosphere by Radio Occul ta t ion of a Space Probe," Radio Science, Vol. 8 , January 1973.
13. A. C . C ro f t , e t a l . , "Preliminary Reivews and Analysis of Ef fec t s of t h e Atmosphere o f Venus on Radio Telemetry and Tracking of Entry Probes," F ina l Report SEL P r o j e c t 3239, Standard Elec t ronics Labs, (October 1972).

0. I . Yakovlev, A . I . Efimov, and T. S . Timofeeva, "Venera-7 Space- probe Data on Propagation o f Radio Waves Through t h e Venusian Atmos- phere and Through t h e I n t e r p l a n e t a r y Plasma, Kosm. I s s l e . , Vol. 9, No. 5, pp . 748-753, (September-October 1971).
R . Woo, "Pioneer Venus Propagation Study," t o be published i n JPL Fina l Report, (June 1973) . J . A . C . Brown, J . Aitchison, "The Lognormal Di s t r ibu t ion , " Department o f Applied Economics, Univers i ty o f Cambridge, England, Mono. 5 (1957).
H . B. Jones , e t a l . , "Comparison o f Simultaneous Line-of-Sight S igna l s a t 9 .6 and 34.5 GHz," IEEE Transact ions o f Antennas and Propagation, Vol. AP-18, No. 4 , ( Ju ly , 1970).
C . Clarke, "Atmospheric Radio Noise-Studies Based on Amplitude-Proba- b i l i t y Measurements a t Slough, England, During t h e I n t e r n a t i o n a l Geophysical Year," Proc. IEEE (London), 109, p t . B , pp. 393-404, (September 1962).
K . Davies, "Ionospheric Radio Progat ion," National Bureau of Standards, Mono. 80, (November 1965).
L . F. Fenton, "The Sum o f ~ o ~ n o r m a l P r o b a b i l i t y D i s t r i b u t i o n s i n S c a t t e r Transmission Systems," IRE Trans. Communication Systems, Vol. CS-8, pp. 57-67, (March 1960).
K . Furutsu and T. I sh ida , "On t h e Theory of Amplitude D i s t r i b u t i o n of Impulsive Random Noise," J . Appl . Phys., Vol 32, ( Ju ly 1961).
T. Nakai, "The Study o f t h e Amplitude P robab i l i t y ~ i s t r i b u t i u o n s o f Atmospheric Radio Noise," Proc. Res. I n s t . Atmos. (Japan), Vol. 7, pp. 12-17, (January 1960).
A. D . Watt and E . L . Maxwell, "Measured S t a t i s t i c a l C h a r a c t e r i s t i c s o f VLF Atmospheric Radio Noise," Proc. I R E , Vol. 45, pp. 55-62, (January 1957).
H. Yuhara, T. I sh ida , and M. Higashimura, "Measurement of t h e Amplitude P r o b a b i l i t y D i s t r i b u t i o n of Atmospheric Noise," J . Radio Res. Labs. (Japan), Vol. 3 , pp 101-108, (February 1958) .
W . C . Lindsey, Synchronizat ion Systems i n Communication and Control , (Prent ice-Hal l , Englewood Cliffs , New Je r sey , 1972).
M. Ohta, T. Korzrimi, " In t ens i ty F luc tua t ions o f S t a t i o n a r y Random Noise Containing an Arb i t r a ry S igna l Wave," Proceeding of IEEE, Vol. 57, pp. 1231-1232, (June, 1969).
S . Karp, John R . Clark, "Approximations f o r Lognormally Fading Opt ica l S ignals , " Proceedings o f t h e IEEE, Vol. 58, No. 12, pp. 1964-1965, (December, 1970).

28. K . S . Mi l l e r , R . M . Jones , "On the Mul t iva r i a t e Lognormal Di s t r ibu t ion , " Jou rna l o f I n d u s t r i a l Mathematics Socie ty , Vol. 16, Part 2 , (1966).
E . Brookner, "Propagation and Channel Model f o r Laser Wavelengths," IEEE Trans. on Comm. Tech., Vol. COM-18, No. 14, pp. 396-416, (August 1970) . G . K . Huth, C . R . Cahn; C . R . Moore, "Simulation of Sequent ia l Decoding With Phase-Locked Demodulation," IEEE Trans. on Comm. Tech., Vol. COM-21, No. 2, (February, 1973).
W . C . Lindsey, I . F. Blake, "Effects o f Phase-Locked Loop Dynamics on Phase-Coherent Communications," J P L Space Program Summary 37-54, Vol. 111, pp . 192-195, (December 31, 1968).
W . C . Lindsey. "Performance of Phase-Coherent Receivers Preceded by . . Bandpass Limi ters , " I E E E Trans. on Comm. Techn., Vol. COM-16, No. 2 , pp. 245-251, (Apr i l , 1968).
H . M . M e r r i l l , G . D . Thompson, "Designing Communication Systems Using Shor t Cons t ra in t Convolutional Codes," NTC, Houston, Texas, (1972).
-.
J . A . H e l l e r , I . M. Jacobs, "Vi terb i Decoding f o r S a t e l l i t e and Space , Communications," IEEE Trans. Comm. Tech., Vol. COM-19, pp. 835-848, (October, 1971).
W . C . Lindsey, "Block Coding f o r Space Communications Systems," - IEEE Trans . Comm. Tech., Vol. COM-17, pp. 217-225, (Apr i l , 1969).
I . C . Lindsey, "Design o f Block-Coded Communications Systems," IEEE - Trans. Comm. Tech., Vol. COM-15, pp. 525-534, (August, 1967).
J . C. S p r i n g e t t , M . K . Simon, "An Analysis of t h e Phase Coherent- Incoherent Output o f t h e Bandpass Limi ter , " IEEE Transact ions on Communication Technology, Vol. COM-19, No. 1, (1971).
D . A . dewolf, J . W . Davenport, " Inves t iga t ion o f Line-of-Sight Propa- ga t ion i n Dense Atmospheres," F ina l Report, March 1969-May 1970, NASA CR-73440 RCA Labs, Pr ince ton , N . J .
D . A . deWolf, "Saturat ion o f I r r ad iance Fluc tua t ions Due t o Turbulent Atmosphere," J . Opt. Soc. Amer. Vol 58, pp. 461-466 (1968).
Yu. N . Barabznenkov, e t a1 ., "Status o f t h e Theory o f Propagation o f Waves i n a Randomly Inhomogeneous Medium," Usp. F ix . Nank, Vol. 102, pp. 3-42, (September 1970). Trans la ted i n Sov ie t Physics Uspekhi, Vol. 13, No. 5, pp. 551-680, March-April 1971.
41. A . D . Wheelon, "Relation o f Radio Measurements t o t h e Spectrum o f Tropospheric D i e l e c t r i c F luc tua t ions ," J . Appl. Phys., 28, p 684, (1967).
42. Steven 0 . Rice, " S t a t i s t i c a l P rope r t i e s o f a Sine-Wave Plus Random Noise," Bell S y s t . Tech. J o u r . , 27, pp. 109-157, (January 1948).

APPENDIX 7.6B
DISCUSSION ON COMMUNICATIONS CHANNEL MODELS

APPENDIX 7.6B
DISCUSSION ON COMMUNICATIONS CHANNEL MODELS
1. SUMMARY
As pointed out i n Appendix 7.6A, two of the basic pa rame te r s that
charac te r ize the lognormal fading cha rac t e r i s t i c s a r e the var iance o 2
X X
of the exponent i n the channel amplitude charac te r i s t ic A = Aoe and the 2
variance of the channel phase charac te r i s t ic o . Expected values of d
these p a r a m e t e r s for the Venus probe communication links a r e summar -
ized in Table 7.6B- 1. Methods of using these p a r a m e t e r s to compute
other interface p a r a m e t e r s needed for communications sys t em design and
analysis a r e given. The power spec t ra l density of the channel phase and
amplitude cha rac t e r i s t i c s a r e discussed in Woo (Reference 1 ) and a r e not
repeated here . Cer ta in conclusions relat ive to the 3 dB bandwidth of
these amplitude p rocesses a r e summar ized a s a function of altitude.
2 Table 7.6B-1. Y and 3 dB Frequency for x a t the Subearth Point Based on Venera
4 Data - Log Amplitude and P h a s e Fluctuations Data (Reference 1)

2. FADING CHANNEL CHARACTERISTICS
The possibility of s ignal fading on Venus probe communication links
i s a ma jo r consideration in the system design. We investigated the physi-
ca l phenomena of fading and some of the m o r e recent work in the a r e a to
predict Venus probe communication sys t em performance.
Fading. occurs when the propagating electromagnetic wave i s p a r -
t ial ly sca t te red due to var ia t ions in the constituents of the medium through
which it i s traveling (Reference 2, p. 361). The variations of the a tmos -
pher ic constituents i s random in space and t ime in the general ca se s o
that the wave a l so acqui res random fluctuations in amplitude and phase.
One way to model such a wave i s t o idealize the signal a s consisting of
two components, one component with nonrandom amplitude-phase c h a r -
ac t e r i s t i c s and the other component with. random amplitude-phase c h a r -
ac te r i s t ics . In the absence of fading, the t ransmi t ted signal i s received
ent i re ly in the nonrandom or specular component. When a random
component i s present , i t s amplitude and phase o r frequency cha rac t e r i s -
t i c s mus t be used t o optimally design the communication system.
Considering f i r s t the amplitude fluctuations, l e t
be a n unperturbed planewave a t F = r ( s , y, z , t), and
be the wave a t 7 when the atmospheric perturbations a r e included.
Inducing the conservation of total power, the total power in E(7) is the 2 power in the specular component As , plus the var iance in the random
2 2 . component, uR , which approximately equals A. , 1. e. ,

An often used parameter (Reference 3 ) i s
for small fluctuations which is usually the case of interest. Then,
and
from above if we use
Fo r Rician fading, see Appendix 7.6A, communication system perfor-
mance is a function of the ratio of the power in the specular component
to the power in the random component, i. e . .
2 Once ci i s known, y can be computed and when the probability distri- X
bution of the received signal is established, the average performance
for a given communication system can be computed. The phase behavior
must also be properly accounted for with cr actually the variance in R the received signal when both phase and amplitude a r e accounted for.
Before going into the statistical distribution of the received signal, 2
let us consider the evaluation of ox . The cause of the randomness in
the wave is due to random variations in the constituents of the medium,
i. e. , the index of refraction, n, o r the dielectric permittivity, 6.
These a r e functions of the atmospheric elements and temperature and
humidity, which in turn a r e affected by winds. Since x is a random ,

field, the variance of x, ax2, must be taken with respect to three dimen-
sional space and time in general. The variations due to time change a r e
quite negligible, however, and can usually be ignored. In terms of the
index of refraction, n, the Maxwell equation which i s required to be sat-
isfied by the i? field becomes (Reference 3, p. 93),
for short waves. With turbulence present n w i l l fluctuate rapidly with
respect to small space and time dimensions causing corresponding fluc-
tuations in the received F field. The structure constant, C is a factor n' in the structure function of n, D,(T). D,(T) enters into the autoco-
variance of n, B (T) , in cases when n is nonstationary. The function n D (7) is defined on a smal l interval over which n i s stationary.
n 2 To establish a value of ax , either of two parameters can be used,
i.e., the variance of n, a o r the structure constant of the medium, n '
'n' In a random environment this equation is a stochastic differential -
equation and its solution, E, depends on the random field, n. There
a r e a number of equations which can be used to relate ax2 to a or Cn n depending upon the wavelength, A, and assnmptions concerning scale
factors related to the characterization of the turbulent medium. The
basic relations a r e the following (Reference 3, Chapter 7).
where:
k = 2w/X, the wavenumber ,
L = propagation distance of the wave through the turbulent medium
L = integral scale of turbulence which i s the normalized inte- n gral of the correlation of n.

This equation i s based on the assumptions:
a ) XL >>Lo, Lo = outer sca le of turbulence
b ) A < < lo = inner scale of turbulence
c ) n i s a statist ically homogeneous and isotropic random field.
Assumptions :
a ) h L > > l o
b) h < < l o
c ) n is locally homogeneous with correlat ion (s t ruc ture function),
ux = L~ when XL<< lo
where a i s determined by the fo rm of Dn(r).
2 . It should be noted he re that the variance of n, un is sometimes
2 replaced by the variance of the dielectric constant, 6 , since E = n . F o r
sma l l variations in n,
The equation i s then written as:
'Jx = 0 2 k 2 ~ ~ n
E

The distribution of the received signal amplitude i s required in
order to obtain the sys t em performance. There a r e two stat is t ical dis-
tr ibutions that a r e present ly considered in descrtbing the received
signal. The amplitude A can be considered to follow a Rician distribu-
tion o r A/A can be considered to follow a lognormal distribution (1. e. , 0
In A/Ao i s normally distributed). The derivation of e i ther distribution
involves invoking the cent ra l l imi t theorem over a la rge number of inde-
pendent contributors to the resultant signal. In the case of the Rician
distribution the contributors to the randomness affect the signal in an
additive manner . In the c a s e of the lognormal distribution, the contri-
butors to the randomness affect the signal in an independent, multiplica-
tive manner s o that when the logari thm is taken the effects become
additive. Therefore, f o r the situation in which the signal passes through
a thin scattering medium and then t ravels a grea t distance before reach-
ing the receiver , the Rician distribution would be appropriate. In the
case when the scat ter ing can be considered to occur a s the wave passes
through shee ts of turbulent medium such that each sheet affects the wave
independently and multiplicatively, the lognormal distribution would
perhaps be m o r e accura te . In the case when t h e r a n d o m fluctuations
a r e sma l l there i s l i t t le difference in ei ther distribution fo r A since
X = In A/Ao % A/Ao - 1, which implies that A becomes normal and the
Rician distribution is a l so approximately normal . This i s the case when
most of the received power i s in the specular component.
Experimental evidence tends to substantiate using the lo normal + distribution in that the measured normalized variance, (A - A) / A ~ has exceeded the upper bound of .27 for the Rayleigh variance (Reference
4). In modeling a Rician channel, DeWolf has used (Reference 5, p. 41).
where E (R) is the wave perturbed by turbulence and bB i s a Rayleigh
component with:

The power in the specular component is then A exp ( -2u i2 ) and 0
2 exp (-2ux ) i - 2ux
2 2
Y = Y i - exp (-2ux5 2ux2
2 for vx2 small . This disagrees with the above expression fo r y by the
2 factor. However, the m o r e recent work (some by DeWolf) has led
most r e sea rche r s including De Wolf to favor the lognormal distribution
in which case
We need to be able to compute the fract ion of the total received
power which i s in the specular component i n order to compute the sys -
tem performance. We will show that the approximate expression
i s cor rec t when the lognormal distribution i s used assuming x = 0. We 2
need to compute the variance of A, uA , a s a function of the given para-
m e t e r cr 2. Let X
then:
and
x = I n y
X y '= e
E(Y) = E(eX) = M x (1) = exp
2 E(A) = A. exp (112 ux )
7.6B -7

where M i t ) is the moment generating function of the normal variable x X
(Reference 6, p. 220),
xt 1 Mx(t) = E(e ) = exp (mxt t; u x t 2 ) = exp t2)
2 2 2 v a r (y) = E (y ) - E (y) = Mx (2) - Mx (1)
2 2 = exp (2ux ) - exp (ox
Thus :
u A = A : [ exp ( lux 2 ) - exp (u:)]
and
2 for ax smal l . Another approach (Reference 4) has been to use -
2 A' Z= A. ra the r than x = 0. Then
o r
Then,
fo r n small . X

2 . Either approach ~ i e l d s the s a m e value when ux2 FZ 0. The y wlth
respec t t o amplitude variations becomes
2 2 1 + exp (ux ) - exp (2ux ) 1 - 0 2
2 - As Y , Z = 2 N+
A exp (2ux ) - exp (ux2) u X
L f o r uX small .
Up to this point the depth of the amplitude fluctuation has been the
p r imary concern. In communication sys t em design the random behavior
of the phase a s well a s the spectrums of the amplitude and phase a r e
important. An exact computation of the amount of power in the random component must account for phase fluctuations a s well a s amplitude
fluctuations (i. e., uA2). It i s important to recognize that in the devia- 2 .
tions for y given above only the amplitude fluctuations were included.
The effects of the phase fluctuation is given in Appendix 7.6A. The
behavior of the phase is a l so important in that it will affect the perfor-
mance of a c a r r i e r tracking loop used to provide a reference phase for 2 data demodulation. The variance of the phase, u can be computed
' 2 using methods s imi l a r to those outlined above fo r u (Reference 3 ) . X
The spec t rums of x and @ a r e a l so important. A measured quan-
tity which provides a g ross estimation of the typical frequencies (i .e. , 2 power spec t ra l content) of A o r x = In A/Ao is f the number of c r o s s -
2 -2 I' ings of A over A p e r unit t ime. The power spec t rums f o r p and x can
be computed f r o m the temporal autocorrelations R (7) by taking t rans . 9s x
forms. This has been done fo r S-band frequencies based on the Venera
4 data. The 3 dB points of the x process a r e given in Table 7 . 6 ~ - 1 .
The fading bandwidth of the amplitude i s important in determining
the fading effects on the c a r r i e r tracking phase lock loop. F o r the case
when the bandwidth of x i s sma l l relative t o the loop bandwidth, the
effect on the loop performance is negligible (Reference 7 ) i f the fading
depth i s not great . Otherwise, the fading signal will affect the perfor-
mance of the c a r r i e r tracking loop and the data channel and mus t be
accounted for .

In a coherent sys t em the effect of the random phase fluctuations
will essentially be that of causing a noisy c a r r i e r re ference los s (radio
l o s s ) in cases when the tracking loop does not t r a c k the random phase
fluctuations accurately. If the bandwidth of the random phase fluctua-
tions i s much g rea te r than the loop bandwidth, the lpop will be unable to
t r ack the phase. If in addition, the data r a t e o r data bandwidth is much
grea ter than the fading bandwidth the slow fading case will prevail.
This i s the situation resulting in the mos t se r ious degradation.
REFERENCES
1. R. Woo, "Pioneer Venus Propagation Study, " t o be published in J P L Final Report, Contract NAS7- 100-RD-65, JPL.
2. M. Schwartz, Information Transmission, Modulation and Noise, McGraw-Hill Book Company, New York, 1970.
3. V. I. Tatarski , Wave Propagation in a Turbulent Medium. Dover Publications, Inc., New York. 1961.
4. E. Brookner. "Atmosphere Propagation and Communication Chan- nel Model fo r L a s e r Wavelengths, " IEEE Tran . Comm. Technology, Vol. 18, No. 4, August 1970.
5. D. A. DeWolf, J. W. Davenport, "Investigation of Line-of-Sight Propagation in Dense Atmosphere: Phase LI, " Final Report, RCA Laboratories, Pr inceton, New Je r sey , July 1971.
6. E. Parzen, Modern Probability Theory and I ts Applications. John Wiley and Sons, Inc., New York 1960.
7. Results published i n J P L Interim Report, Contract NAS7- 100-RD-65, December i. 1972, Enclosure I.

APPENDIX 7.6C
UNCODED ERROR PROBABILITY PERFORMANCE
COMPARISONS FOR LOGNORMAL
AND RICIAN CHANNEL MODELS

APPENDIX 7.6C
UNC ODED ERROR PROBABILITY PERFORMANCE COMPARISONS FOR LOGNORMAL AND
RICIAN CHANNEL MODELS
1. SUMMARY
This appendix summarizes the effects of a tmospheric turbulence
(fading) on the uncoded data performance of a perfectly synchronized phase
coherent receiver . Two types of fading a r e considered, viz., fading char-
ac ter ized by (1) the Rician probability density function (p. d. f . ), and (2) the
lognormal p. d. f . F o r the perfect ly synchronized receiver two pa ramete r s
se rve to charac ter ize the effects of a tmospheric turbulence on the e r r o r prob-
ability. F o r example, if the turbulence i s character ized by the Rician p. d. f .
then the pa ramete r i s concern i s Y ' , the ratio of the power in the specular
component to the power in the random component ( see Appendix 7.6A). F o r
lognormal fading two pa ramete r s se rve to charac ter ize the fading due to
turbulence; namely, the mean rn and the variance o of the p. d. f . X X
In the following section resul ts a r e presented which show that
communication rece iver performance is ve ry dependent on proper con-
s iderat ion of the effects of atmospheric turbulence and that the loss fac-
t o r s with such turbulence m a y not be neglected in a sys tem which must
operate with a sma l l margin. F o r a n uncoded perfectly synchronized
PSK sys tem, it will be shown that a tmospheric turbulence can cause
los ses of the o rde r of i to 2 dB fo r BER's of when lognormal fad-
ing i s assumed and the pa ramete r s f r o m Table 7.6B-1 of Appendix 7.6B a r e
used.
2. ERROR PROBABILITY FOR LOGNORMAL FADING (PERFECT PHASE SYNCHRONIZATION ASSUMED)
When the fading bandwidth i s sma l l in comparison to the reciprocal
of the data r a t e then the bit e r r o r probability of a PSK demodulator has

been shown (see Appendix 7.6-4) to be given by
where
2
P~ - - -L r e - . e r f c [m exp (d?uxz + mx) dz
2J;; -- I
In o rde r to evaluate the above expression numerically, one needs
to provide a rational fo r determining m By assuming that the var ia- X.
tions in the index of refraction a r e sma l l and possess a z e r o mean,
T a r t a r s k i (Reference 1, p. 97) shows that m = 0. With m = 0, X X
On the other hand, under a conservation of power argument, F r i e d
(Reference 2) has shown that
Eb 2 Figure 7.6B-l represents a plot of the BER versus - = A. T I N f o r N 0
0
typical values of u taken f r o m Table 7. 6B-1 of Appendix 7. 6 s . The val- X
ues of o a r e based upon a view along the zenith. X
With rn = - o i t can be observed f r o m Figure 7. 6C-1 that the degrada- X X
t ion in the uncoded PSK sys t em i s 0.7 dB a t a zenith angle fo r ax = ,1189 - 3 and a bit e r r o r probability of 10 . Using m = 0 the corresponding
X
degradation is 0.45 dB. This i s the value f o r ax calculated by Woo and
given in Table 7. 6B-1 of Appendix 7. 6B on the Venus surface a t the subearth
point based upon the Venera 7 data. At a descending angle of 50 degrees,
Croft (Reference 3) et a l , have computed u t o be about 0. 18. This X
resul ts in degradations of 1.2 dB with mx = 0 and 1.5 dB with mx = - u 2 X
for the uncoded P S K system. It is not c l ea r on the bas is of observation
o r analysis whether m = 0 o r m = -a should be used to provide X X X

A~ 1 SIGNAL-rONO1SE P A T 1 0 1% = elldBi
Figure 1.K-1. Bit E r r a Probabililies for a Perfectly Synchronized PSK Sydem
cor rec t resul ts . It is our position that the conservation of power a rgu-
ment i s valid and the lo s ses based on this position will be used in the
design control tables.
3 . ERROR PROBABILITY FOR RICIAN FADING (PERFECT PHASE S.YNCHRONIZATION ASSUMED)
Communication sys tem performance curves a r e available in the
l i t e ra ture (References 4, 5, 6 ) for Rician fading. F o r the perfect phase
synchronization the bit e r r o r probability is given by (References 4 and 6 )

E ave - - - 2 2 2 Eb ( i t y ) p = (a + 2 a ) -
No No
i s the total average received energy t o noise density and
with
a = amplitude of specular component
2a2 = average power i n random component
This expression i s plotted in F igure 7.6C-2.
AYEIAGE SIGNAL-TC-NOISE ~ 1 1 0 + 2 2 ) No
Flgure 7.6C-2. AvusgeError PraLublllties for a Perlectly Synchronized PSK System

REFERENCES
1 . V. J. Tatarski , Wave Propagation in a Turbulent Medium, Dover Publications, Inc., New York, 1961.
2. D. L. Fr ied , J. Opt. Soc. Am., 56, p. 1372, 1966.
3. J. A. Croft, e t al., "Prel iminary Review and Analysis of Effects of the Atmosphere of Venus on Radio Telemetry and Tracking of Entry Prohes, " Final Report, SEL Project, Stanford Electronics Laboratories, Stanford University, Stanford, California, October 1972.
4. W . C. Lindsey, " E r r o r Probabili t ies fo r Rician Fading Multi- channel Reception of Binary and N-ary Signals, " IEEE Trans Info Theory, Vol. IT-10, October 1964, pp. 339-350.
5. W. C . Lindsey, "Coded Noncoherent Communications, ' I IEEE Trans Space Electronics and Telemetry, Vol. SET- 1 I, pp. 6- 13, March 1965.
6. J. Zelen, e t al., "Study and Analysis of Multipath Analysis and Modulation Selection for Relay Radio Links, " RCA. Astro- Electronics Division, Radio Corporation of America, Princeton, New Jersey , August 1967.

APPENDIX 7.6D
PERFORMANCE AND SELECTION OF A CODING
METHOD OF PIONEER VENUS ENTRY
PROBES USING PSK/PM MODULATION
t. Data Requirements
2. Channel and Receiver Effects
3. Interleaving
4. System Complexity Considerations
5. Conclusions
6. Recommendations f o r F u r t h e r Study
7. References

APPENDIX 7.6D
PERFORMANCE AND SELECTION OF A CODING METHOD FOR PIONEER VENUS ENTRY PROBES
USING PSK/PM MODULATION
The most suitable candidates f o r coding methods t o be used on plane-
t a r y entry probe communications channels a r e sequential and Viterbi. These
coding techniques provide significant reduction in required E b No a t a spec- / i f ied probability of bit e r r o r f r o m the uncoded PSK/PM requirements . They
a l so provide super ior e r r o r r a t e performance to orthogonal codes a s well
a s block codes of equivalent complexity fo r nonfading channels. To a s s e s s
the per formance of each of these techniques f o r a planetary en t ry and descent
probe one mus t include both fading and r ece ive r synchronization\losses.
This appendix develops per formance data fo r these non-ideal conditions and
provides a rationale f o r selecting sequential decoding f o r the Pioneer Venus,
essent ia l ly on the bas i s of DSN compatibility. Suitability of the algori thms
i s discussed i n r ega rd to use r requirements , channel charac te r i s t ics , s y s -
t e m complexity, and hardware compatibility with the DSN. A bas ic under-
standing of the two decoding algori thms i s assumed.
1. DATA REQUIREMENTS ,
The data requi rements cal l for a minimum undetected bit e r r o r r a t e of -3 .
10 w ~ t h a f r a m e deletion r a t e of The deletion r a t e i s applicable t o
sequential decoding only. F o r the sma l l probes, approximately 250 000 data
bi ts will be t ransmi t ted and for the l a rge probe, the total number of t r a n s -
mit ted data bi ts will be approximately 560 000.
Le t us f i r s t consider the coding methods with r e spec t to the undetected
bit e r r o r r a t e of F o r the Viterbi decoder this i s achieved for E b I N o =
2. 3 d B for a r a t e 1/3, constraint length, K = 8 code o r fo r E N - 2. 5 d B b / o -
fo r a r a t e 1/3, constraint length K=6 code a s i l lus t ra ted in F igu re 7.6D-1
(Reference 1). F o r a JPL experimental Fano sequential decoder a bit e r r o r
r a t e of a t 2 kbps i s achieved for E N - 2. 5 d B with an information b/ 0 -
r a t e 1/2 quick-look-in code a s the curve labeled B in F igu re 7.6D-2 (Refe r -
ence 2) i l lust ra tes . The curves labeled A and C a r e f o r sys temat ic and non-
sys temat ic codes. The two methods therefore require essent ia l ly the s a m e - 3 E ~ / N ~ to achieve an e r r o r r a t e of 10 when the sequential decoder opera tes
a t 2 kbps. The required E /N f o r the sequential decoder will be l e s s for 128 b 0
bps, however these data a r e not available a t th i s time.

- -. Po I N DB(IIGNI\L ENEeGY-TO-NOISE RATIO)
Figure 7.60-1. Performance of Rate 18. K - 4. 6 and 8 CodDs with Vlterbi Decoding
lo-' BLOCK SlZE 1024 TAIL 4
BIT RATE 2.0 KBlriS
ENERGY PER BIT-TO-NOISE RAllO E b b o lNOT IN OB)
Figure 7.6D-2. Bit Error Probabilities for JPLExperimental Fano Seouentlal Decoder

Next consider the f r a m e deletion r a t e of lo-'. Since Viterbi decoding
requi res no framing, only the bit e r r o r r a t e i s meaningful. With sequential
decoding the f r a m e deletion r a t e i s an important pa rame te r . F r o m F i g u r e
7.6D-3 (Reference 3) it can be observed that a n ave rage deletion r a t e of
lo-' requi res an E N of 2.2 d B with the DSIF decoders operating a t 128 b/ 0
bps. This performance i s independent of f r a m e length because the decoder
input buffer length is increased with f r a m e length (Reference 3). P e r f o r -
mance curves for the corresponding undetected bit e r r o r r a t e a r e not avai l -
able. In general , however, the higher the deletion r a t e the lower the unde-
tected bit e r r o r r a t e in the successfully decoded f r ames . This i s because
a high deletion r a t e implies that few computations were allowed to decode a
f r a m e so that only the l e s s noisy bit sequences would not be deleted. This
h a s been substantiated through experimentation (Reference 3). The undetec- - 3
t ed bit e r r o r r a t e i n the 2 kbps case i s l e s s by a fac tor on the o r d e r of 10
than the deletion ra te , a s can be seen by comparing F igu res 7.6D-2 and
7. 6D-3. Therefore , a deletion r a t e of lo-' should a s s u r e an undetected bit - 3
e r r o r r a t e of 10 o r l e s s a t 128 bps, and the deletion r a t e i s the more c r i -
t ical parameter . The required Eb/N t o meet the data requi rements of 0
undetected bit e r r o r r a t e and deletion r a t e i s within 0. 3 d B f o r e i ther coding
method with 0.1 d B difference if the R = 1/3, K = 8 Viterbi decoder is used.
The fact that the amount of data t ransmi t ted i s sma l l must be taken
into account. In the above discussion we have been concerned with average
rates . With respec t t o bit e r r o r r a t e s this i s quite sat isfactory since the
number of t ransmit ted bits i s l a rge enough to make a n average bit e r r o r r a t e
meaningful. However, the number of f r a m e s in the case of sequent ia l 'de-
coding i s sma l l enough, par t icu lar ly for the sma l l p robes , so that a n average
deletion ra te i s not v e r y meaningful. Since the lo s s of a few f r a m e s i s very
significant we must explore the probability of such a n event a s well a s the
average .deletion r a t e d i scussed previously. TO do th is we concern ourse lves
with the probability distribution function of the number of computations p e r
bit required t o decode. This distribution, P ( C - > N), of the probabili ty that
t h e number of computations C requi red t o decode a bit i s g r e a t e r than o r
equal to a specified number of computations N, i s P a r e t o (Refere'nce 4).
Experimental curves f o r P(C - > N) based on Pioneer 10 da ta a r e shown in
F igure 7.6D-4 (Reference 3). Since the curves f o r P ( C > N) dec rease - slowly with N, the var iance in the number of computations required t o de-
code a bit i s l a rge . Therefore , over a sma l l sample s e t the probabili ty of
7 . 6 ~ - 3

10-2 DD2- 25 00J COMP/S
# X4B BPS
0 1024
0 512
+ 2% . 128
0 64
32
A 16
X 8
, od I 2 3 4 5 b
\/No 108)
Figure 7.60-3. Thewetical Seguential Decoding Performance
N COMPUIATIONS PER 811
Figure 7.60-4. Experimental Distribution of Computations for Sequential Decoding of Pioneer LO Frame

a large deletion rate cannot be ignored, even when a very large amount
of computation i s used in decoding a frame. F o r example, a t E ~ , / N ~ =
2. 25 dB the probability that the number of computations per bit required to
decode a particular f rame exceeds 10 000 i s 0.005. If a f rame i s comprised
of 200 bits, two million computations would be required to decode the
frame. This i s an exorbitant amount of computation and certainly could not
be done in rea l time. If it were decoded off-line, the number of bit e r r o r s
would be very large. With a Viterbi decoder these data would very likely
also be of poor quality, but the two million computations would not have
been required to decode this section of data and the undetected bit e r r o r
rate of would still be achieved.
The performance of sequential and Viterbi decoding method with r e -
spect to the data requirements can therefore be summarized a s follows. - 3
Sequential decoding provides an undetected bit e r r o r rate of 10 and a de-
letion rate of lo-' for E ~ / N ~ = 2. 2 dB a t a t ransmission rate of 128 bps
using a rate 112 code. Viterbi decoding provides an (undetected bit e r r o r - 3
rate, with no deletions, of 10 for Eb/No of 2. 3 dB to 2. 5 d B (depending
on the code used), and this could be attained in rea l time for transmission
rates much higher than 128 bps. The Viterbi decodlng method i s therefore
the choice based on data requirements considerations although the choice
i s somewhat close.
2. CHANNEL AND RECEIVER EFFECTS
The channel characteristics that affect the coded system performance
a r e the fading on the received signal due to propagation effects and the r e -
ceiver degradation due to synchronization e r ro r s . Receiver synchroniza-
tion e r r o r s a r e caused by a noisy ca r r i e r reference and the subcarr ier
loop. The curves presented here will be used in constructing the design
control tables, a s well a s to aid in the coding method selection.
It i s convenient to t r ea t the case of the combined effects of fading
and synchronization e r r o r s on the coded system performance f irs t . Then
the cases with only fading or synchronization e r r o r s present can be treated
a s special cases. The combined effect of additive thermal noise, an e r -
roneous reference phase (radio loss) and a fluctuating signal amplitude due
to channel fading, when the latter two effects a r e assumed to be indepen-
dent, will be considered. This assumption of independence i s quite accurate

i f the fading bandwidth i s much sma l l e r than the tracking loop bandwidth
and the fading depth i s not grea t . F igure 7. 6D-5 (Reference 5) shows the
effect of slow Rician fading on the phase e r r o r probability density function
when these conditions a r e met. It can be observed that the fading has a
r a t h e r sma l l effect on the phase e r r o r density function. Here we a r e con-
s ider ing lognormal fading r a the r than Rician fading, however the effect on
the phase e r r o r will be s imi lar . These conditions of slow fading and smal l
amplitude fluctuations character ized by the lognormal distribution a r e
anticipated to a la rge degree f o r signals passing through the atmosphere of
Venus based on recent investigations (References 6 and 7).
d Figure 7.60-5. Slow Rician Fading (Received Signal Power the Same i n
Each Casel
The total undetected bit e r r o r o r f r a m e deletion probability, PE, i s
given by
where P ( E / 4 , A) i s the bit e r r o r probabili ty o r f r a m e deletion probability
i n the p resence of white Gaussian noise, conditioned on the phase e r r o r , 6,
and amplitude value A. Then assuming 4 and A a r e independent,

= JA PA (A) P1 (E/A) dA,
where P (e , A) represents the joint probability density function of the un- 1
detected bit e r r o r , e, and amplitude e r r o r , A, in the presence of additive
white Gaussian noise. P1 (EIA) i s the e r r o r probability conditioned on A,
with phase e r r o r effects and additive white Gaussian noise included.
The function P (EIA) can be obtained f rom simulation and analysis. 1
If P(E) , the e r r o r probability due to white Gaussian (thermal) noise only,
i s obtained through simulation, then P (E) , the e r r o r probability due to 1
thermal noise and phase e r r o r s , i s obtained by
p ( E ) = $+ P ( E / + ) p ( 6 ) d4. 1
The functions p ( + ) and P ( E / # ) can be derived quite accurately f rom the
tracking loop equations. The tracking loop static phase e r r o r for a two-way
where ? and ? a r e the signal-to-noise ratios in the spacecraft and ground 1 2
tracking loop bandwidths W and WLZ. L1
These can be found in t e rms of the
loop threshold signal-to-noise ratios in W L10 = 2 B ~ 1 0 L20 = 2 B ~ 2 0
and W
(Reference 8, p. 110). The probability P ( E / # ) i s approximately P(E) de- 2
graded by cos 6 (Reference 9) , where P(E) i s either the bit e r r o r or
f rame deletion probability which has been obtained through simulations.

If the phase e r r o r memory i s equal to o r greater than the decoder
memory the expression i s accurate. This i s approximately the case for
a Viterbi decoder with a 10 Hz loop and a data rate of 200 data bits per
second, but i s not a s accurate for the sequential decoder because of the
longer decoder memory. In order that this expression for P1(E) be accurate
i t i s necessary that
r > M T L
where M i s the decoder memory length in transmitted symbols, T i s the
symbol period and
i s the tracking loop response time. This situation gives the worst-case
degradation because when the phase e r r o r fluctuates about its zero mean
during a decoder memory length the phase e r r o r tends to average to zero.
This is the same effect a s found in uncoded systems, but there the phase
e r r o r only needs to remain constant over one symbol period to give worst-
case degradation.
Similar remarks apply with respect to amplitude variations due to
channel fading. For a fading band near 1 Hz, a s has been computed by Woo
(Reference 6) a t the surface of Venus, the Viterbi decoder memory is
easily included a t 60 data bits pe r second while for the sequential decoder
of constraint length 32, the data rate should be above 80 to 100 bps with the
exact number being difficult to compute analytically.
F o r lognormal amplitude distribution due to fading, the above expres-
sion for PE can be written explicitly a s follows. With
and
A'T - e 2 X ~ 2 T
R' = Eb/No = - - 0 = .\2XR
No N 0
where Go i s the transmitted amplitude and -the received amplitude.
Then
F(RI'") = F ( ~ ~ \ J F ; ) ~ PIE/X)
where F is the probability of e r r o r as a function of received E
P(E/X) i s the e r r o r probability conditioned on X. Then,

with X-MX
z=- 6
we have
- PE - - Lm exp (-2') F [&i exp (+ uX z . + M ~ P. B dz
The function F (0) can be taken a s e i ther bit e r r o r o r f r a m e deletion
probabil i ty with o r without the no isy c a r r i e r r e f e r ence l o s s ( r ad io l o s s ) .
F o r the c a s e of no r ad io l o s s (per fec t synchronizat i I ) , F (0) can b e obtained
by applying curve fi t t ing methods t o F igu re 7. 6D-1 2 d 7. 6D-3. F i g u r e s
7. 6D-6 through 7. 6D-14 give the coded s y s t e m perfc mance f o r var ious com-
binations of coding methods and lo s se s . F i g u r e 7. 6D-6 (Reference 10)
gives the Viterbi decoder pe r fo rmance with noisy c a r r i e r r e f e r ence , P1(E).
F i g u r e 7.6D-7 (Reference 3) gives the sequent ia l decoder deletion r a t e with
all r ece ive r l o s se s (noisy c a r r i e r r e f e r ence plus s u b c a r r i e r loop l o s s e s ) in-
cluded f r o m exper imental da ta a t the DSN. F igu re 7.6D-7 plots f r a m e d e -
let ion probabil i ty v e r s u s da ta channel E /N with the s ignal- to-noise ra t io b 0
in 2BL0 changing with E N (i. e. t he modulation index i s fixed f o r each b/ 0
data r a t e ) . The f igure does not contain sufficient da ta t o opt imumly choose
the loop s ignal- to-noise r a t i o (i. e . , s e t the modulation index) f o r var ious
data r a t e s . Also the pe r fo rmance i s f o r a one-way l ink, whereas we a l s o
a r e concerned with a two-way link. F o r t he se r ea sons we have computed
the deletion r a t e with no isy c a r r i e r r e f e r ence by the method given abdve
and some of the r e s u l t s a r e given i n F i g u r e s 7. 6D-8 and 7. 6D-9.

RECEIVER LOSS INCLUDED o Mars c r m i ori) DDA: - 25 aa 128
COMWTAIIONS~ + 2% loo 12.9 0 512
Lb:N ID81
Figure 7.60-6. Expected Bit Error Rate for Cnnvalulional Code 756617 1k - 6. w - 31: Two-way Link: pl ; ZOdB, Viterbi Decoding
€,,ma 100)
Flgure 7.6D-7. Exprlmenlai Delellon Rate fa Sequential Decodlng from Pioneer 10111 Data
EbmD (OBI Eb/No (DDI
Figure 7.60-8. Deletion Rate i n the Presence o l Noisy Carrier Reference Figure ,,6D4, Rate in the ol Clrrier for Sequential Decoding f a a TmrWay Link
Reference for Sequential Oemding lor a T w W a y Link

It can be observed f r o m Figure 7. 6D-8 that fo r 13.0 dB in the ground
tracking loop 2BL0 with 20 d B in the spacecraf t bandwidth WL = 2BL, the
degradation in deletion r a t e i s 2. 23 dB. With 11.0 dB in the ground ,
loop 2BL0 the degradation i s 2. 92 dB, which indicates that ser ious degra-
dation resu l t s when l e s s than 13.0 dB i s used in the ground loop. F igure
7. 6D-9 i s useful for the design of the sma l l probe l inks, since 30.0 dB in
the spacecraf t loop r ep resen t s closely a one-way link. There a r e still two
important differences between the experimental curves of F igure 7. 6D-7 and
the analytical curves of F igu res 7. 6D-8 and 7. 6D-9. The experimental data
includes a l l rece iver l o s ses which includes the s u b c a r r i e r loop (symbol syn-
chronizer , waveform distortion, and demodulator) l o s s e s a s well a s the
noisy c a r r i e r re ference loss . Also the experimental da ta makes no a s sump-
t ion regarding how long the phase e r r o r r ema ins constant. By analyzing the
DSN s u b c a r r i e r loop we can obtain an es t imate f o r the s u b c a r r i e r losses ,
which in tu rn can be used t o get an est imate of the inaccuracy of the analyt-
i ca l method due t o the constant phase assumption. With this es t imate , F ig-
u r e s 7.6D-8 and 7.6D-9 can be used f o r accura te design purposes.
The pa rame te r values in the experimental and analytical data unfor-
tunately do not allow a n exact comparison between the two. To compare a
data point f r o m the experimental curve of F igure 7. 6D-7 t o the analytical
curve of F igure 7.6D-9 we f i r s t use N = 13. 0 d B and f r a m e deletion r a t e 20 10-l. F r o m the experimental data the required E /N i s 3.6 dB a t 512 bps,
b 0
while f r o m Figure 7.6D-9 the required E N i s 2.12 d B a t 128 bps. To b/ 0
account f o r the difference in data r a t e , F igu re 7. 6D-3, for the ideal case ,
can be used by subtracting the difference between the 512 bps curve, and
the 128 bps curve, f r o m the experimentally required E N of 3.6 dB. b/ 0
This extrapolation gives a required E N of 3.1 dB using the experimental b/ 0
data. The difference between the analytical and experimental data i s
3.1 - 2.12 = 0. 98 dB.
The s u b c a r r i e r l o s s h a s been computed ( see Design Control Table Appendix)
t o be 0. 8 dB. This makes the e r r o r i n the analytical resu l t s due t o the con-
stant phase assumption t o be approximately

at 128 bps. Notice however, that the experimentally required E N fo r a b/ 0
deletion rate of 10-I is greater than that predicted analytically, if only
0. 8 dB i s used in the subcarrier loop. We can only assume a t this point,
that the subcarrier loss i s a t least 0. 98 dB since the constant phase assump-
tion yields worst-case results.
Since subcarrier loop loss depends upon data rate we next take the case
of 8. 0 dB in 2B LO ' for which a deletion rate of 10-I requires an E /N of
b 0
4.65 dB at 128 bps using the experimental data. The corresponding case
f r o m the analytical method requires an Eb/No of 3. 0 dB with 30 dB in the
spacecraft tracking loop. This indicates at least a 1. 65 dB subcarrier loss
at 128 bps. To clearly establish the degradation in the coded system due to
reference phase e r ro r s when the phase does not remain constant over the
entire decoder memory, a simulation with the subcarrier loop bypassed i s
required.
Consider next the performance computation when channel fading due
to propagation effects a r e included. Using the methods outlined above, the
performance of the Viterbi decoder and the sequential decoder with perfect
reference has been computed in Figures 7. 6D-10 through 7.6D-13. The log-
normal f ad~ng model i s used (see Appendix 7. 6B), which i s characterized by 2
the varianceoX2and mean - o . The variance has been computed (Refer- X
ences 6 and 7 ) to be 0.1189 at subearth and 0.18 at a transmitting angle of
50 degrees.
The performance of the coded and uncoded systems in the presence
of both reference phase e r r o r s and channel fading for the sequential and
Viterbi decoders a r e given in Figures 7.6D-14 through 7. 6D-20. The de-
letion rate for the sequential decoder in Figures 7.6D-14 and 7. 6D-15 was
obtained by using the experimental results with a l l receiver losses included
(Figure 7. 6D-7), and then averaging over the signal amplitude, which is fluc-
tuating due to fading. Figures 7.6D-16 and 7. 6D-17 a re for deletion rate with
noisy car r ie r reference (no subcarrier losses) and fading only, using the
above analytical technique. The Viterbi curve also was obtained analytically
by using the curve of Figure 7.6D-6 for the performance of the Viterbi de-
coder with the noisy reference included and then averaging over the ampli-
tude.

J
LOGNORMAL FADING 4 0.18. m - 0.0324
LOGNORMAL FADING
+ -
.
.
10-6 1 1 1 1 1 1 1 1 1 " 1 3 1 I 6 7 8 .
t,, No iOBi
Figure 1.60-10. Viterbi Decode Performance in t h e Presence of Lognormal Fading Assuming S lav Fading Relative to Decoder Memov
Eb/No (001
Figure 76D-12. Deletion Rate for Sequential Decoding with Slow Lognormal Fading
Eb/NoiOBI
Figure 7.60-11. Frame Deletion Probability with Sequential Decoding i n the Presence of Slow LaJnormal Fading Relative to Decoder Memory
, O - ~ I , \ , , 2 3 4 5 6 1 8
Eb/Na IDB)
Figure 7.60-13. Frame Deletion Probability for Sequential Dewding with Slow Lognormal Fading

- 2 It can be observed f r o m the f igures that a deletion r a t e of 10 a t
128 bps for sequential decoding with both rece iver l o s s e s and fading effects
included, requi res l e s s than 7. 5 dB since this i s the required E b P o at
512 bps. This i s t rue if the gain in decoder performance achieved by going
f r o m 512 bps to 128 bps i s g rea te r than the s u b c a r r i e r loop degradation. If
the difference in E N between the 512 bps and 128 bps curve fo r the ideal b / 0
case i s subtracted f r o m the 7. 5 dB we obtain a required E N of 7 .0 dB. b/ 0
This, of course, ignores any difference in the s u b c a r r i e r l o s ses between
the two rates . To be conservative we use 7.1 dB since the subca r r i e r l o s s
i s grea ter for lower r a t e s . F o r the Viterbi decoder a bit e r r o r r a t e of - 3
10 , when both effects a r e included, r equ i re s an E N of 6.5 dB. To b/ o
th i s number we must add the subca r r i e r l o s s which i s es t imated to be be-
tween 0. 80 dB and 1.25 dB. This brings the total E N required by the b / 0
r a t e 1/3, constraint length 6, Viterbi decoder to 7. 5 dB, which i s 0 . 4 dB
g rea te r than the requirement of the sequential decoder. In both cases the
signal-to-noise rat io in the t ransponder i s 20 d B and in the ground loop 2B LO
i s 13. 0 dB. To compensate for Doppler effects i n the subca r r i e r loop an
est imated 0.2 dB should be added to this total.
The performance f o r the uncoded PSK sys t em with both reference phase
e r r o r s and channel fading included i s given in F igures 7. 6D-19 and 7. 6D-20.
This was computed by using the performance curve for the uncoded P S K
sys t em in the presence of a noisy phase re ference (Reference 11) and
averaging over the amplitude. The f igure can be used fo r obtaining the
coding gain. The required E /N to achieve a bit e r r o r r a t e of i s b 0
observed to be 8. 9 dB and when a subca r r i e r l o s s of 0. 8 dB ( this i s sma l l e r
th: n the loss used in the coded case because of the higher signal to noise
rat io) i s added, the total E N required i s 9. 7 dB. The coding gain i s b / 0
the difference between this and 7.1 dB, i. e . , 2.2 dB. It can a l so be observed
f r o m Figure 7. 6D-16 that the loss in the uncoded sys t em i s 2. 0 dB, whereas
the corresponding loss in the coded s y s t e m i s 4.0 dB. The 2 .0 dB difference
between these values i s the enhancement which could be achieved with the
use of interleaving by removing al l memory effects, which a r e g rea te r than
one t ransmit ted symbol durat ion in length between the channel and rece iver ,
and between the rece iver and decoder.

2 . 4 6 8
Eb/No IDBl
. LOOP SNE IN 2Bi0
Figure 1.60-14. Frame Deletion Probability for Sequential Decoding with Receiver Losses and Lcgnormal Fading EffeClS Included
(YIO FROM SUBEARTH) WTH FADING AND RECEIVER LOSS q = O . I 8 , m x - -0.0314
(AT SUBEART~) 7 WITH FADING AND RECEIVER LOSS
=0.1189. m =-0,014
WTH RECEIVR LOSS P 512 UPS ",
RATE In
K = 11
a= LOOP SNR IN lBLO
b
0
l l d 0
Figure 1.60-15. Frame Deletion Prabability f a Sequential Decoding with Receiver Losses and L q n w m l Fading Effects Included at the Venus Surface
PdN. (W'
Flgure l.6D-16. Sequential Decodor ~ r a m e Deletion Robabi l i ty versus EbMo
with N o l q Carrler Referenceand Lcqmxmal Fadlng for TwoQay L lnk w i th 13.0 dB I n Ground Lmp 2BL0 and M DdB in'lransponder Loop 2BL d 128 b P
VITERBI DKODER
IINCHRONIZATION
t \
w l m miq Carr ler Reference and Lalnaml Fafflng IW TrmQay L ink w l th 13.0 dB In Ground L m p 2BLo and 30.0 dB in Transponder Loop 2BL d U8 bpr
I O - ' ~ I I \ I I I I ~ ~ ~ ~ ' ' ~ 1 1 3 4 5 6 1 B V I O l I I 2 I I I 4
yr, 10s
F igwe 7.60-18. Vlterbl Decoder Performance in the R e s e w of N o i q Carr ier Reference and Slow L c q n o r m l Fadlng. Two-Way Link with 20dB in Transponder L m p

€& ""' yr0P0'
Figure 7.60-19. Performance of Unmded PSK in the Presence ol M y ngure 1.60-2l. K K hrfamnce in Presence of Noisy Carrier Reference Carrln Relerence and Sbw Logmmal Fading and Slar Lognorml Fading
F r o m this discussion we conclude that t he re is negligible difference
between the performance of the Viterbi and sequential decoders when the
effects of channel fading and rece iver synchronization e r r o r s a r e included.
The coding gain i s 2 . 2 dB.
3. INTERLEAVING
The combined effect of channel fading and noisy c a r r i e r reference can
be combated using interleaving a s a means of providing time diversi ty to
overcome memory effects. As stated above the benefit that could be achieved
by the use of interleaving i s 2. 0 dB. This a s sumes that the data ra te i s
much g r e a t e r than the fading bandwidth a s well a s the tracking loop bandwidth.
Since the fading bandwidth has been computed to be approximately 1 Hz on
the sur face (Reference 6) and the loop bandwidth is designed a t 10 Hz, this
condition exis t s for the la rge probe transmitting a t 128 bps. F o r data ra tes
l e s s than about 100 bps the interleaving gain i s decreased f r o m 2.0 dB. F o r
data r a t e s l e s s than about 10 bps the re would be no interleaving gain. The
interleaving gain for the small probes transmitting a t 40 to 100 bps can only
be est imated to be between 0. 5 dB to 1. 5 dB.

The complexity of interleaving must be considered in relation to the
gain it can provide. F i r s t , the interleaving must be synchronized. Second,
the buffer in the transmitting end which i s required to accomplish inter-
leaving must be considered. For a fading bandwidth of 2 Hz, the fading
time response i s 0. 5 seconds, which spans 128 transmitted symbols a t a
data rate of 128 data bits pe r second with a rate 1/2 code. If adjacent sym-
bols a r e spread so a s to be separated by 128 symbols by using a square
matrix t-ype storage, a buffer space of 128 x 128 = 16 384 memory words
would be required. The time delay a t the transmitter would be extended
considerably and this storage implies a potentially great loss of data a t
impact. In fact this i s 5 percent of the total data transmitted f rom the large
probe. This degree of interleaving of course i s very elaborate; however,
the fading bandwidth might also be smaller , in which case interleaving over
a greater time interval would be required. Further investigation i s r e -
quired into designing an interleaving system that achieves not a l l the 2. 0 dB
theoretical gain, but a significant portion of this with little complexity.
Since interleaving would provide little advantage on the small probes,
and i t s overall desirability on the large probe i s questionable, and since
the DSN does not presently have de-interleaving capabilities, i ts application
for Pioneer Venus probe mission i s not recommended.
4. SYSTEM COMPLEXITY CONSIDERATIONS
This discussion i s not concerned'with decoder hardware complexity,
but rather with complexity in regards to synchronization and transmission
efficiency, i. e . , loss of user data due to any decoder overhead. With
Viterbi decoding only node o r branch synchronization (assigning the appro-
priate transmitted symbols to each data bit) i s required and synchronization
i s simple. With sequential decoding, f rame synchronization i s required and
a known sequence of 24 bits o r more (Reference 3) i s required for resyn-
chronization after buffer overflow. Frame synchronization must be acquired
before decoding begins, which indicates that a longer framing sequence i s r e -
quired than i f data f r ame acquisition were accomplished on decoded data.
With Viterbi decoding a l l data f rame acquisition i s accomplished on data that
has the protection of the e r r o r correcting code since i t i s done after decoding.
We can obtain an estimate for the data loss due to the code f rame sequence
required in sequential decoding. The length of the data framing sequence

required should be 13 to 15 bits. Allowing a n additional overhead in the
24-bit ta i l for things such a s bit count of 6 bits, t he re i s a 3 percent data
los s assuming a f r ame length of 192 bits. F o r a f r a m e length of 768 bits
the data loss i s 0. 75 percent. Therefore, on a n efficiency bas i s the Viterbi
a lgori thm i s superior a t high e r r o r rates .
5. CONCLUSIONS
Because sequential and Viterbi decoding will provide essentially the
same coding gain, but only sequential decoding i s DSN compatible, sequen-
t ia l decoding i s the recommended method. Although Viterbi decoding i s
s impler f r o m a sys tem point of view, and involves no deletions, the factor
of sequential decoding DSN compatibility i s overriding because of economics.
Interleaving is not recommended f o r the Pioneer Venus mission application.
6. RECOMMENDATIONS FOR FURTHER STUDY
Fur the r study i s required to establish more c lear ly the effect of com-
plex lognormal fading on tracking loop behavior. The joint probability
density p ( 6 , A, 0 ) where 6 i s the loop stat ic phase e r r o r , A i s the received
signal amplitude and 8 i s the received phase fluctuation due to turbulence,
i s required. This requi res fur ther analysis and simulation for various
fading ra t e s and depths. Decoder behavior, when amplitude and loop phase
e r r o r changes occur during a decoder memory length, requi res fur ther
investigation. This will a lmost certainly requi re simulations with noise
accurately representing the additive noise a s well a s the synchronization
e r r o r s and turbulence effects included. Interleaving with the objective of
obtaining a significant portion of the theoretically available interleaving
gain for a small degree of complexity i s an important a r e a requiring addi-
tional study. Finally the analytical resul t s must be compared closely with
any experimental data that become available.

7. REFERENCES
1. J. A. Hel ler , I. M. Jacobs, "Viterbi Decoding f o r Satell i te and Space Communication," IEEE Trans . Comm. Tech. , Vol. COM-19, NO. 5, pp. 835-848 (October 1971).
J. W. Layland, "Information Systems: Multiple-Mission Sequential Decoder - Comparing Per formance Among Three Rate 1/2, K-32 Codes," J P L SPS 37-64, Vol. 11, pp. 50-52 (August 1970).
D. Lumb, Unpublished Data f r o m NASA/Ames.
J. M. Wozencraft, I. M. Jacobs, Pr inc ip les of Communication Engineering, (John Wiley and Sons, Inc. , New York, 1967).
Results to be published i n J P L Final Report, Contract NAS 7-100-RD- 65 in June.1973.
R. Woo, "Pioneer Venus Propagation Study, " t o be published in J P L Final Report, Contract NAS7-100-RD-65 (June 1973).
J. A. Croft, -- e t a l . , "Pre l iminary Review and Analysis of Effects of the Atmosphere of Venus on Radio Telemetry and Tracking of Ent ry Probes , " Final Report SEL Projec t , Stanford Electronics Labora- tor ies , Stanford University, Stanford, California (October 1972).
R. E. Edelson, Telecommunications Systems Design Techniques Handbook, NASA Tech. Memorandum 33-571, J P L , Calif. Inst. of Tech. , Pasadena, California (July 1972).
W. C. Lindsey, "Block Coding for Space Communications Systems, " IEEE Trans. Comm. Tech., Vol. COM-17, pp. 217-225 (Apri l 1969).
H. M. Mer r i l l , G. D. Thompson, Jr . , "Design of Communications Systems Using Short-Constraint- Length Convolutional Codes, " NTC Proceedings (1972).
-
11. W. C. Lindsey, "Per formance of Phase-Coherent Receivers Preceded by Bandpass L imi te r s , " IEEE Trans . Comm. Tech. , Vol. COM-16, No. 2 (April 1968).

APPENDIX 7.6E
MULTIPLE FREQUENCY SHIFT KEYING (MFSK)
WITH CONVOLUTIONAL ERROR CORRECTING CODING
1. Ideal Per formance 7.6E-1
2. Uncoded MFSK Performance with Oscillator 7.6E-4 Instabilities, Doppler and Channel Fading Effects Included
3 . Off-Line Acquisition and Tracking Methods 7.6E-9

APPENDIX 7.6E
MULTIPLE FREQUENCY SHIFT KEYING (MFSK) WITH CONVOLUTIONAL ERROR CORRECTING CODING
Multiple frequency shift keying (MFSK) modulation for digital com-
munication systems has the desirable at t r ibutes that a l l the t ransmi t te r
power can be used in the data channel (no c a r r i e r i s required) and no phase
synchronization i s required. We have conducted a study of MFSK with con-
volutional e r r o r correct ing codes (Viterbi and sequential) to compute the
performance when effects of channel fading, osci l la tor instabili t ies and
Doppler r a t e s a r e included (Reference 1). To accommodate off-line p r o -
cessing, an algori thm for performing frequency and timing acquisition was
derived and evaluated. The performance resu l t s were obtained through
analysis and computer simulation fo r M = 16 tones in the signal set. Fo r
computer simulations, the digital fas t Four ier t r ans fo rm (FFT) , was used
to per form the matched f i l ter (o r correlation) tone detection. An important
resul t pointed out the degradation i n MFSK a t low data r a t e s due to t r a n s -
mi t te r oscil lator frequency instabili t ies. This MFSK degradation due to
frequency synchronization e r r o r s , is analogous to the PSK degradation that
occurs due to phase synchronization e r r o r s a t low data rates . Because of
these degradations, neither MFSK nor PSK i s efficient a t low data r a t e s
( l e s s than 6 to 8 bps).
1. IDEAL PERFORMANCE
A diagram of the convolutional encoder and modulator i s given in
Figure 7.6E-1. The data bi ts a r e encoded using a ra te 1 /4 binary convolu-
tional code and the four encoded symbols a r e used to determine one of 16
frequencies o r tones to be t ransmit ted. To choose the number of data bits
to shift into the encoder fo r each tone t ransmit ted with the use of sequential
decoding, fo r an efficient system, the work of Jordan (Reference 2) was
used. It was determined that two data bi ts shifted into the encoding reg is te r
a t a t ime should be used, making the overall code of r a t e two, i. e . , for each
tone t ransmit ted, two data bits a r e shifted into the encoder. With Viterbi
decoding the same encoding procedure was used and encouraging simulation
resu l t s were obtained. The codes used were binary convolutional codes for
long constraint and sequential decoding (Reference 3) and short constraints with

Figure 7 . 8 - 1 . Convolutional Encoder and Modulator
Viterbi decoding (Reference 4). A constraint length of 16 was used for
sequential decoding of minimum f ree distance 22 and a constraint length
8 code of minimum weight 22 fo r Viterbi decoding. In using Viterbi de-
coding with nonbinary signal s e t s , others (References 5 and 6) have used k
an orthogonal coding method that uses a constraint length such that 2 cquals
the number of signals in the signal set. We have used the method described
above to utilize longer constraint lengths.
The decoding me t r i c s used with the MFSK rece iver outputs were ;
J = log [ I ( ,/-,I - log
for sequential decoding and
fo r Viterbi decoding, where
j = tone index, 2 E = tone energy, A T / 2 ,
r. = amplitude of receiver output for jth tone, J 2
o = additive with Gaussian noise variance,
I = modified Besse l function of the f i r s t kind of order zero. 0
Sixteen levels of quantization werc used.

Digital computer simulations were c a r r i e d out and the resul ts a r e
given in F igure 7.6E-2. The curve for the sequential decoder performance
is based on 110 000 bi ts and the curve for Viterbi decoder performance i s
based on 20 000 bits. The sequential decoder resul ts a r e based on f r a m e s
of 1000 data bits and allowing a maximum of 200 000 computations before
f r a m e deletion. Adequate data to compute the f r a m e deletion rate for
sequential decoding was not obtained. The theory fo r computational behavior
discussed in Appendix 7. 6D will be applicable, however.
1.0
RC FOR M = lb, RATE = I
P I W ) FOR M = 16
PI81 FORM = 16
t 2 106' W- WCXD ERROR @ATE - a - g - b
2 v(81 Mrsx/vlrtael 8 10"
w "I M - I b . K E B . R = 2
PIB) MFSK/IEOUfNlIAL CODING
M = 1 6 , 1 ( - l b , R 2
10.'
0.1 1.0 10.0 1m.0
'blN.
Figure 7.E-2. MfSK Perfcrmnce with Sequential or Viterbi Errar Correcting Coding
F r o m Figure 7 .6E-2 i t i s observed that the required E /N t o obtain - 3 . b 0
an undetected bit e r r o r r a t e of 10 i s 2.4 dB using Viterbi decoding. This i s 0. 2 dB g rea te r than the Eb/No required to obtain a deletion r a t e of

using PSK and sequential decoding. It i s worthwhile to note that the Viterbi
decoder performance i s about 1.0 dB inferior to the sequential decoder p e r -
formance even though the minimum weights of the codes used were identical.
Since the Viterbi decoder i s "maximun~-likelihood" i t s performance should
equal or exceed that of the sequential decoder. This discrepancy could be a
resul t of insufficient data, o r the encoding method used with Viterbi decod-
ing, and fur ther simulation i s required to resolve this question. The mbd-
e r a t e constraint length (K = 16) was used with sequential decoding a s an
attempt to reduce the computations a t low signal-to-noise ratios. However,
theory and fur ther simulations have verified that the computational behavior
is only a weak function of constraint length so that a long constraint length
should be used with an increased minimum f r e e distance. This would i m -
prove the sequential decoder performance somewhat and i t follows that the
coded MFSK and coded PSK sys tems provide equivalent performance to
within 0. 1 t o 0.2 dB. The coding gain in the MFSK system i s 2 .0 dB using
1 6 tones, while for PSK the coding gain i s about 6.0 dB a t a bit e r r o r rate
of
2. UNCODED MFSK PERFORMANCE WITH OSCILLATOR INSTABILITIES, DOPPLERAND C H A N N E L F A D I N G E F F E C T S I N C L U D E D
To design a n MFSK system 1: 1- ..----_-.y to take into account the
effects of oscil lator instabili t ies, Doppler frequency shift, and channel
fading. These will be discussed separately and then the combined effect
will be considered.
2. 1 Oscillator Instability Effects
In any MFSK sys tem the t ransmit ted frequencies will not be pure tones
due to oscil lator instabili t ies i n the t ransmi t te r . The effect of this is to
degrade the bit e r r o r performance and the degradation i s considerable a t
low data r a t e s ( l e s s than 10 tones per second). Frequency ji t ter or l ine-
width resul ts in a dec rease in receiver output signal-to-noise ratio. A s -
suming that the oscil lator frequency i s a Gaussian random process , w(t) ,
stationary over a tone period T , with mean equal to the c a r r i e r frequency 2
and variance u the degradation factor i s given by Reference 7, w

This factor is valid provided that the sum frequency 2W. of any ith f r e - 1'
quency of the signal set , i s not an element of the signal set. The signal-
to-noise ratio degradation factor L, i s plotted in Figure 7. 6E-3. The
factor L i s a function of the symbol period T and the frequency variance
0 ', and decreases with T and/or 02, ranging between 1 and 0. As o 2
approaches 0, I, approaches 1. The factor L i s symmetr ica l in o and T .
However, fo r any physically realizable method of frequency stability m e a s - 2 .
u remen t , a will increase a s the measuring interval becomes smal le r
(References 8 and 9). The measuring interval should be the Nyquist sampling
interv? '2 W T where W i s the signal bandwidth. For low data r a t e s
the? surement intervals a r e practical, while for high data r a t e s (data
r - 3 tones per second) the noisy oscil lator effect i s negligible fo r any
.lably good oscil lator s o that the measurements a r e not c r i t i ca l .
Ol (HZ . I)
Figure 7 6E-3. SNR Degra6ation i n MFSK Due To Oscillator Instabilities
We have computed the performance for MFSK using the FFT through
simulation, and this performance i s given i n Figure 7. 6E-4. The simulation
a s sumes an oscil lator of Gaussian frequency distribution with standard
deviation, o , of 1 Hz a t a transmitted frequency of 2.3 GHz, when measured
over an interval of 0.002 seconds. For a signal set of 16 frequencies sepa-
rated by 16 Hz each, the Nyquist sampling interval of l /ZW = 11512 Hz
% 0.002 seconds was used assuming independence in the frequency noise
f rom sample to sample. In fractional terminology this means that the
signal frequency will be accurate to one par t i n 2. 3 x l o 9 , 68 percent of
the t ime when measured over a 0.002-second time interval. Studies

'dNo Figure 1 K d . MFSK Perfcfmance with Frqwnci Impurities
(References 8 and 10) indicate that th i s i s a real is t ic c r i te r ion . As the
frequencies a r e separated f a r the r to allow for signal uncer ta int ies the f r e -
quency puri ty c r i t e r ion becomes m o r e str ingent. It can be observed f r o m
F igu res 7 .6E-3 and 7.6E-4 that the L factor i s somewhat optimistic, how-
ever i n the simulations t he assumption that the sum t e r m not be i n the
signal s e t was violated. Note f r o m Figure 7 .6E-4 that efficiency degrades
considerably for r a t e s l e s s than about 8 tones/second. .
2. 2 Doppler Effects
The effect of frequcncy sh i f t s due t o Doppler p re sence i s t o move the
signal away f r o m the cen te r of passband of the prede tec t ionf i l t e r s o that the
output signal-to-noise ra t io i s lowered. A rule of thumb used in designing
MFSK sys t ems i s that the amount of frequency shift occurr ing during one
symbol per iod should not exceed the symbol rate. A study by Jean (Ref-
e r ence 11) has t o some extent verified this for the case of a l inear Doppler
ra te , which i s not t racked during the symbol per iod. We have computed
the MFSK per formance in the p re sence of a l inear Doppler r a t e by using the
F F T f o r detection. Using 16 frequencies , the frequency separat ions that
a r c sufficient to avoid interfrequency interference were found experimentally.

The input signal used i s given by,
X(t) = A cos = A case ( t ) ,
where de/dt = w . + dt i s the instantaneous frequency. 1
Figure 7 . 6 E - 5 gives the F F T performance for a selected se t of p a r a m -
e t e r s , d and T. The signal was assumed to be perfectly aligned a t the
beginning of each symbol t ime and no algorithms for tracking the Doppler
shift during the symbol period or for doing Doppler compensation were used.
The figure shows that i n the presence of high Doppler r a t e s i t i s m o r e effi-
cient t o avoid using very low data rates .
1.0
A f 16 HZ. T = Id I
~ o - ~ A , = 8 HZ, 16 HZ E e -
,D-~
0.1 l .o 10.0 1m.0
'dN, Figure 7.E-5. MFSK Perlwmnce with linear Dc~plw Rate
2. 3 Fading Effects on MFSK
The effects of fading on MFSK have been studied by Lindsey (Reference
12) who presents curves for Rician fading fo r binary FSK. These resu l t s
have been extended to the M = 16 case i n Figure 7.6E-6. Channel fading is
described in Appendix 7. 6B in detail and the discussion will not be repeated
here. Briefly 2 0 represents the fraction of the total t ransmit ted signal F power that has been diverted into the fluctuating par t of the received signal

I6 FREQUENCIES
FRACTION Gf POWER IN SPECULA8 COMPOMNT y 2 = 3 - -NOT m m ~ IN FLUCTUATING COMPONFGT
0.1 1 .o IO.0 1m.o
Figure l.e-6. MFSK Perfumnce with Fading
while a 2 i s the power in the specular component. The MFSK detector arnpli-
tude probability density function i s character ized by
Figure 7.6E-6 includes curves for a2 = 0.99 and a 2 = 0.68. The 2
value o. = 0. 68 was used because a t the t ime the curves were computed i t
was thought that this was the value anticipated on Pioneer Venus probes.
Since these computations, however, the lognormal fading model has been
found to be m o r e appropriate than the Rician model. This factor, in
addition to m o r e modera te fading channel parameter value has reduced to
expected fading on the Pioneer Venus probe channels.
2 . 4 Combined Effects of Oscillator Instabilities and Doppler Rates on MFSK
It i s important to compute the combined effect of oscil lator instabili-
t i es and Doppler r a t e s on MFSK. The MFSK performance with linewidth

(frequency impurity) and l inear Doppler r a t e s was mmputed through s imula-
tion using the F F T . The resu l t s a r e shown in F igure 7 .6E -7. It can be
observed that fo r Doppler r a t e s l a r g e r than 6 Hz/second with a signal half-
linewidth of 1 Hz, a symbol period of T = 1 / 8 seconds resu l t s in m o r e
effiaent communication than does T = 1 / 4 second.
MFSK WITH DOPPLER AND LINEWIDTH
EdN. Figure 1.E-1. MFSK Perfumance with Doppler Rates and
Frquenq Impurity
3. O F F -LINE ACQUISITION AND TRACKING METHODS
A method for acquisition in r e a l t ime i s given in Reference 13. A
method for off -line signal acquisition will be discussed here . This has
application in the c a s e where the ent i re received signal has been recorded
on tape. The recording has been made over a bandwidth sufficiently grea t
to include al l frequency uncertainties, which means that the actual received
information bearing signal l ies i n only a fract ion of the recorded band, i. e . ,
in cases wherein the p rec i se frequency band of the received signal i s un-
known a much grea ter band must be used i n the recording process to avoid
losing the signal. The acquisition in this case involves locating the signal
band, Bs, within the total received band, B T'

In doing off-line acquisit ion our philosophy i s t o u s e al l the t ime avai l -
able to lower the signal-to-noise rat io threshold a t which a signal can be
acquired. The acquisition mus t be accomplished in a minimum number of
symbol per iods to allow for l a r g e amounts of uncompensated Doppler effects.
Of course , reasonable t ime l imi t s must be se t and we consider 2 o r 3 gen-
e r a l purpose computer hours to be in order . I t can be seen f r o m the con-
clusions of this study and Reference 1 that the acquisition signal-to-noise
ra t io threshold i s perhaps the key pa ramete r i n designing such low data
r a t e MFSK systems. The c r i t e r i a used i n designing an acquisition method
have been required signal-to-noise rat io and number of computations. The
types of frequency bands considered typical a r e B = 720 Hz and BT = 9 kHz. S
The following acquisition method takes advantage of the non rea l t ime envi r -
rohment and effectively u s e s a matched f i l ter technique in the frequency
domain. The algorithm essentially does frequency and t ime acquisition
together using i terat ions of a basic loop.
A flow char t of the acquisit ion algori thm i s given in F igure 7. 6E-8.
T o begin acquisition a t ime origin i s a rb i t r a r i ly chosen, the F F T is com-
puted over the ent i re recorded spectrum, and the frequency of la rges t
amplitude i s chosen. Ordinarily there will be many e r r o r s because of
t ime origin e r r o r s and because the signal-to-noise rat io used will be only
that required to give acceptable MFSK performance over bandwidth, Bs,
when M choices a r e made. This signal-to-noise rat io will resul t in ve ry
poor performance when operating over bandwidth, BT, and al l frequencies
spaced 1 / T apar t because of the numerous possible choices. We continue
the algori thm by computing the F F T and choosing the frequency of grea tes t
amplitude for K symbol per iods with t ime origin fixed. The resulting K
amplitudes a r e summed with respect to frequency resulting in a "sum
spectrum," S with non-zero entr ies a t each frequency where a grea tes t s ' F F T amplitude was achieved. At this point we would like to separate out
the signal amplitudes f r o m the noise amplitudes i n S using any knowledge S
available about the signal and a l so nar row in on the signal band center . To
do this we use a window function, Sw' which i s matched to the signal i n that
Sw i s B Hz wide and has non-zero entr ies separated by the signal spacing S
(e. g. , the signal spacing m a y be 48 Hz while the spacing of the F F T outputs
o r Ss i s 1 / T Hz). Convolving S with Sw gives a spec t ra , S which can be S c '

used to determine the center of Bs, i. e compute
and choose the frequency of l a rges t amplitude to be the signal band center.
At this point the t ime origin i s shifted by a n increment At and the procedure
i s repeated. After the procedure i s repeated N t imes , where NAt = T a r e
N se t s of spectra Sc, and the t ime origin and signal band center a r e chosen
to correspond to the frequency of the N Sc having the la rges t amplitude.
Figure 7. 6 E - 9 i l lus t ra tes an example.
CHOOSE (F,, A , ]
0 F, W. I
I SUM THE /\MPlllUDfS FRiOUENCY -WISE I KTH FFT OUTPUT
CONVOLVE S U M O LMPLITUDES WllH A WINDOW FUNCTIONMATCHED r0 S l G W
CHOOSE THE COWOLUTION FREOUENCY OF HIGHEST /UIPLITUDE TO BE THE SIGNAL CENTER
Figure 7.e-9. Illustration of Lcqulsltion Method
I I SUM Ai WITH RESPECT TO FREWENCV
UPEAT ABOVE STEPS WITH TIME CRlGlN SHIFTED A N I\**OUNT DELTA f0R N TIMES
I i 0 !L.dl- F1. F7 F~ W1 1 1 - F . . . Us t
4,
After the N t ime origin shifts, the maximum amplitudes can be
CHOOSE TIME ORIGIN AND SIGNAL CENTER CORRESPONDING TO THE CONVOLUTION OF HIGHEST AUPUTUDE
observed and the choice of the l a rges t amplitude can be made. Our s imula-
CONVOLVE Sc = 5, ' Sw
tions were done this way. However, the N la rges t amplitudes with respect
I REDUCE THC BAND AND REPEAT THE ABOVE STEPS TO ATTAIN GREATER RESMUTION I d L - A - Wl
t MTER N TIME SHIFTS WE HAVE
Figure 7.a-8. Off-tine Frequency Tracking Sequence t
to t ime can be f i l tered to eliminate any spurious amplitudes and the la rges t
amplitude of the f i l te red a r r a y can be chosen automatically.

After a t ime or igin and signal band cen te r have been chosen f o r B S
with respec t t o BT, and if K i s not Ia rge (i. e . , the number of symbol p e -
r iods i s not l a rge) t o avoid l o s s in frequency resolution due to Doppler
shif ts t h e r e will r ema in some uncertainty a s to the signal band center .
Nonetheless, the chosen frequency will be within - + Bs of the signal cen te r ,
i. e . , B has been nar rowed to a band 2 B wide. T h e r e will be no d i s - T s
crepancy with respec t t o the chosen t ime origin. Using only the chosen
t ime origin and the B band, the above p r o c e s s can be repeated to nar row S
the 2 Bs band. Our s imulat ions have shown that it i s v e r y easy to get the
2 B band down t o a band of Bs t 2 / T Hz, a t which point the t racking S
a lgor i thm can be used.
This i s not a closed-loop algori thm a s required for r ea l - t ime appl ica-
t ions ( there is no need for a c losed loop), and it i s fe l t that a closed-loop
a lgor i thm would inc rease the frequency e r r o r var iance. The number of
t ime or igin shifts requi red f o r 1 /8< A T < A 1 /4 i s not great . F o r example, with
T = 0.20 second i f we choose A t = 0.02 we need only u s e 10 shifts of the
t ime origin (10 ~t = 0.2 = T) to be within a negligible t i m e c . r o r . F o r T =
118 second, fewer shifts of the or igin a r e required. Fo r K < n the o r d e r of
20 o r 30 (we used only 16) t h i s does not involve much t i m e on a high-speed
digital computer for B = 9 kHz, and the t i n e i s fa i r ly negligible if a ha rd - T
ware F F T box i s used. Notice that a known t ransmi t ted sequence has not
been used. Also i t should be kept i n mind that th is procedure can be applied
anywhere on the recorded signal, hence it i s bes t t o do the acquisit ion
where any uncompensated Doppler effects, e tc , a r e minimum.
To der ive the per formance of this acquisit ion analytically has proven
t o be ra ther formidable and the difficulties a r e shown i n Reference 7. The
per formance has been computed by digital computer simulation for T = 1 / 8
and T = 114, assuming c o r r e c t timing, and i s given in F igure 7. 6E-10.
F o r these curves the total recorded band BT i s 8192 Hz and the signal band
B i s 720 Hz represent ing 16 frequencies separa ted by 48 Hz each. The S
ver t ica l axis gives the ave rage e r r o r r a t e and the horizontal ax is i s of the
symbol energy t o single sided noise spec t ra l density ratio, Es/No. The
cu rves on the right a r e the word e r r o r r a t e s f o r a n MFSK sys t em with
M = 16 and M = 1024 orthogonal frequencies. The M = 1024 curve i s the
per formance that can be expected when the acquisit ion a lgor i thm i s making

FREQUENCY ACGWISITION R I I C W N C E
!, - 0192 HZ, 8, =no HZ, 0, HAS 16 FREOUENCIES SPACED 48 HZ
W - WORD ERROR UTE B - 011 ERROR U l E
VN* +PROBA8ILIIY 1VAT CONVOIUTIONAl FREOUENCY WITH WAXIMUM UIVLIRIDL DOES NOT LIE I N SlGtUL BAND
Figure 1.K-10. Acquisition Method Performance
choices over the ent i re recorded band of B = 8192 Hz, with T = 114 second. T
In this ca se t he re a r e 1024 orthogonal f requencies separated by 4 Hz each
represented by the FFT outputs. The M = I6 curve gives the per formance
for the sys tem af te r acquisit ion assuming no fur ther coding i s used. The
curves labeled T = 114 second and T = 119 second a r e for the acquisition
algori thm performance assuming perfect t iming, and frequency alignment
and using K = 16 symbol periods. An e r r o r i s declared i f the frequency
having the l a rges t amplitude out of the convolution a r r a y , Sc, does not l ie
within the signal band, B . It can be seen that for the s a m e value of E /No S s
the e r r o r r a t e when using T = 118 second i s l e s s than f o r T = 114 second.
However, for E IN to be the same a t T = 1 /8 second a s for T = 114 second S 0
the signal power required i s fi t imes a s great . Fo r the s ame signal power,
the performance i s actually super ior when using T = 114 second.
Using some approximations a fa i r ly accura te performance analysis
can be made. F o r f = 8 Hz (T = 118 second), the probability that two noise-
only components will enter into a convolution component i s given by Ref-
e r ence 7,

which is quite sma l l and will be neglected. The probabili ty that a convolu-
tion component that consis ts of a sum of a t l eas t two signal plus noise F F T
outputs i s g rea t e r than a l l convolution components, which consist of only a
single noise F F T output, can b e a s sumed to be v e r y c lose to 1. Using these
approximations, success fu l signal acquisition will be accomplished if only
two c o r r e c t decisions a r e made over the B 8192 Hz band when M = 16 T =
symbol per iods a r e used. This m e a n s that a word e r r o r r a t e of 1 - 2/16 =
718 can be t o l e r a t e d for success fu l acquisition. F r o m Figure 7. 6 E - 1 0 i t
can be seen that th is point on the curve labeled M = 1024 (8192/8) i s approxi
mately where the acquisit ion curve labeled T = 1 / 8 second becomes steep.
F o r T = 1 /4 second a re fe rence curve fo r 2048 possible f requencies
mus t be used. The per formance will be poorer than for T = 1 /8 second
with respec t to E /N because of the i nc rease in number of choices. When S 0
impure signal frequencies a r e received, the r e f e rence curves mus t be ad-
justed to allow for this ( s ee Section 2. 1).
The curves for the acquisit ion algori thm a r e considerably bet ter than
required for the MFSK sys t ems 5.0 that one may be led into thinking that the
per formance i s bet ter than need be. However, i f additional coding using
e r r o r cor rec t ing techniques i s employed, the per formance of such a n
MFSK sys t em i s considerably bet ter . The performance of a sys t em using
a convolutional e r r o r cor rec t ing code of constraint length 8 with Viterbi
decoding and shifting two data-bi ts into the encoder f o r each t ransmit ted sym-
bol i s given by the curve labeled "MFSK/Viterbi" (Reference 1). Such a s y s - - 4 t e m opera tes a t an e r r o r r a t e of 10 a t E /N = 6. 0 and will do bet ter using
S 0 a longer constra int length in the encoder. It can be observed that this acqui-
sition algorithm i s compatible with the MFSK and Viterbi decoding f o r e r r o r -4 . r a t e of 10 . 1. e . , a t the E /N required by the code to achieve an e r r o r - 4 s 0
ra te of 10 . acquisition can be accomplished. If a much bet ter code were
used a much sma l l c r value of E IN would be required to achieve this e r r o r s 0
r a t e , however, acquisit ion could probably not be accomplished. The code
would be of benefit if lower e r r o r r a t e s were des i r ed a t the E /N required S 0
f o r acquisit ion, but the E /N cannot be lowered beyond that required to s 0 achieve the signal acquisition.

Some comments must be made concerning the assumptions used in
computing the curves of F igure 7. 6E-10, i. e., timing synchronization and
frequency alignment of the signal with the FFT output lines. The parameter
on which co r rec t timing hinges mostly is the value of E /N required to S 0
give acceptable acquisition assuming c o r r e c t t ime synchronization. A sample
run for t ime acquisition i s given in Figure 7.6E-11. We have not been able
to compute t ime acquisition performance (variance and mean of the timing
e r r o r ) analytically, nor have we done extensive simulation in this regards.
The simulations we have done have given the co r rec t resul ts a t E /N = 5.0, S 0
however. It i s difficult to conceive of a method that can'give bet ter resolu-
tion since the t ime increments , A t , used in t ime synchronization can be made
negligibly small without impract ical computation loads fo r pract ical symbol
r a t e s (4 to 8 t ransmit ted symbols per second).
The effect of frequency misalignment of the actual signal with the F F T
0
l ines i s such that frequency detuning e r r o r s should be l e s s than 0. 1 of 1 IT,
I I I I
the F F T frequency line separation in order that the resulting degradation
in performance be negligible (Reference 13). Our simulations of the acqui-
sition algorithm have indicated that for good acquisition a t T = 0.25 seconds
8 & T k i k & i k & i k + m T I M OFFYT
Figure 7.8-11. Aquirlion SampleRun with Tim Acquisition Included

and Es/No = 5.0 dB, the frequency e r r o r should be l e s s than about 0. 5 Hz.
If the e r r o r is l a r g e r than th is , compensations must be made by increasing
Es/No, interpolation on the complex F F T , outputs, o r perhaps creation of
multiple tapes recorded a t slightly different frequencies. Interpolation on
the complex F F T outputs (References 14 and 15) i s the simplest of these,
and can reduce the effect of the wors t -case situation (when the frequency
e r r o r i s half the F F T frequency spacing) to negligible effects on acquisition
performance quite easily when T = 114 or T = 118 second.
Tracking and MFSK - Tracking methods with MFSK in r ea l t ime have
been considered by Chadwick (Reference 13) and Goldstein (Reference 16).
Successful frequency tracking of a signal with l inear Doppler rate of
0 .025 Hzlsecond was reported by Chadwick. Planetary entry probes will
typically experience Doppler r a t e s up to 16 to 20 Hzlsecond. F o r c a s e s
where the data ra te i s low enough for MFSK to be p re fe r red to PSK, off-
line processing most often will be possible. In this case a frequency band
wide enough to include a l l Doppler shifts will be used in the recording
process , and the frequency tracking can be done off-line. For doing off-
line tracking i t s eems plausible to use a more brute force type approach
instead of the usual rea l - t ime approach of obtaining an e r r o r t e r m (hope-
fully an S-type function), which i s f i l tered and used in a local VCO. A
block diagram for a n off-line method of tracking i s given in Figure 7. 6E-12.
Instead of computing a n e r r o r t e r m that i s used to determine a VCO f r e -
quency change, the VCO (i. e. , digital VCO) simply t r i e s a l l frequencies
separated by frequency increments equal to the minimum frequency e r r o r
acceptable. The VCO frequency that resul ts i n the maximum amplitude
out of the FFT i s chosen to be the c o r r e c t reference frequency. The t r ack -
ing i s combined with the digital f i l tering used t o extract the signal band,
Bs, out of the total recorded band, BT. Hence, a f t e r acquisition, the F F T
i s computed only over a digital bandpass version of the signal band, Bs.
The loop will a l so diminish the frequency e r r o r resulting f rom the actual
signal not being aligned exactly to the EFT lines. The bandpass used a t a
par t icular symbol t ime is centered according t o where the signal band was
located on the previous symbol t ime by the tracking loop. The bandpass
must be wide enough, then, t o include any frequency shifts that could have
occurred during the previous symbol interval. The bandpass can be chosen

" tfYC0 ')
'vco "vco ' A' '4 cnoost URGEST or URGES1 M R I - TUNS ITS FRE- QUEN~Y. AND
TO DECODER COPESWNDlNG
Figure 1.e-12. OU-Llne Tracking for MFSK Signal
CHOOSE LARGESI bJAPLINDf AND STMIE ALONG w#Tn ITS FREQUENCY AND lyCO
r(f)
a t the beginning of the tracking effort and be held constant during the entire
message o r the loop could be made to accept inputs governed by the expected
Doppler profiles to va ry the bandpass width. The low pass fi l ter (LPF)
passes a band wide enough to include the signal band, B . This tracking S
method has not been implemented and further investigation will be made on
a future study.
t 1
BANDPASS FILTER BEGINNING AT fVCO
AND % + A WIDE
F o r short t ransmiss ion t i m e s (1 to 2 hours) symbol synchronization
should not be required on low data r a t e channels. For this reason this
problem has not been considered here .
REFERENCES
1. C. C. Korgel, " E r r o r Control Techniques for Cornmunication Channels, 'I Final Report, IRAD Task No. 48744, Mart in Marietta Corporation, Denver, Colorado (December 1972).
2. K. L. Jorden. "The Per formance of Sequential Decoding in Con- - junction with ~ f f i c i e n t Modulation," IEEE Trans . Communication Technology, Vol. COM-14, NO. 3, p. 283.
3. D. J. Costello, "A Construction Technique for Random-Error - Correcting Convolutional Codes ," IEEE Trans . Info. Theory, p. 631 (September 1969).
4. R. B. Blizard, C. C. Korgel, - e t - a l . , "Study of Potential Applications of Digital Techniques to the Apollo Unified S-Band Communications Systems, " Phase 2 Final Report, Mart in Mariet ta Corporation, Denver, Colorado (1970).

5. A. J. Viterbi. "Orthogonal F r e e Codes for Communication in the P resence of White ~ a ; s s i a n Noise," IEEE Trans-Comm. Tech., Vol. COM-15, p. 238 (April 1967).
6. A. R. Cohen, J. A. Hel ler , and A. J. Viterbi, "A New Coding Technique for Asynchronous Multiple Access Communication, " IEEE Trans . Comrn. Tech. , Vol. COM-19, No. 5, p. 849 (1971).
7. C. C. Korgel, "Techniques for Noncoherent Communication," Final Report, IRAD Task No. 48624, Mart in Mariet ta Corporation, Denver, Colorado (December 1972).
8. M. E. Frerkl ing, "Short T e r m Frequency Stability Measurements ," Internal Report, Collins Radio Company.
9. E. J. Baghelady, - e t a l . , - "Short T e r m Frequency Stability: Char- acterization, Theory, and Measurement ," Proc . of the IEEE, p. 704 (July 1965).
10. L. R. Malling, "Phase Stable Osci l la tors for Space Communications, " Proc . IRE (July 1962).
11. F. H. Jean, "Performance of a Conventional MFSK Receiver in the P resence of Frequency Drift ," J P L SPS 37-50, Vol. 111, p. 338.
12. W. C. Lindsey, "Coded Noncoherent Communications," IEEE Trans. on Space Electronics and Telemetry, Vol. SET -11, p. 6-13 (March 1965).
13. H. D. Chadwick and J. C. Springett, "The Design of a Low Data Rate MFSK Communication System," IEEE Trans . on Communication Technology, Vol. COM-18, No. 6 (December 1970).
14. G. D. Bergland, "A Guided Tour of the Fas t Four ier Transform, " IEEE Spectrum, p. 41 (July 1969).
15. R. B. Blackman, J. W. Luckey, "The Measurement of Power Spectra ," Dover Publications, Inc. , New York (1958).
16. R. M. Goldstein, "Low Data Rate Communication: Block-Coded Frequency Shift Keying, " J P L SPS 37-55, Vol. 11, p. 30.

APPENDIX 7.6F
RADIO ABSORPTION AND DEFOCUSING LOSSES
IN THE VENUS ATMOSPHERE

APPENDIX 7.6F
RADIO ABSORPTION AND DEFOCUSING LOSSES IN THE VENUS ATMOSPHERE
1. SUMMARY
Radio propagation los ses i n the Venus atmosphere fo r probe-to-
ea r th d i rec t l inks include: (1) absorption; (2) defocusing; and (3) turbulence.
This Appendix summar izes and draws conclusions f r o m pertinent studies
a s to the separa te and combined effects of absorption and defocusing.
The effects of turbulence were discussed in Appendices 7.6A and 7.6B.
In par t icular , microwave absorption los ses on data taken via ea r th -
based r ada r stations and the Mar iner V radio occultation experiment a r e
discussed. The discrepancy between the absorption losses found by analyzing
ear th-based radar measurements and measurements provided by processing
the Mar iner V occultation data remain, a t this t ime, unexplained. The
absorption and defocusing los ses developed by Croft -- e t al. of Stanford
a r e then compared with the computations made a t Mart in Marietta. On the
basis of the above comparisons and resu l t s , recommendations a r e made
fo r a s ses s ing the absorption and defocusing los ses a s a function of altitude
using the Mart in Mariet ta approach. The recommended approach i s used
in preparing the link design control tables.
2. ABSORPTION ON VENUS EARTH-BASED RADAR DATA VERSUS THE MARINER V RADIO OCCULTATION RESULTS*
The analysis of the Mar iner V occultation experiment by Fjeldbo
et a1 (Reference 1) found anomalous absorption los ses that cannot be - -. * satisfactorily matched to the absorption los ses found f rom earth-based
radar measurements (References 2, 3). This section descr ibes our r e -
working of some of these data in a n attempt to resolve this discrepancy.
This proved to be unsuccessful, and the differences between the occultation
and the r ada r data remain unexplained.
*Section 2 of this Appendix i s a re-edited copy of a Martin Marietta Tech- nical Note: R. J. Richardson and J. A. Camo. "Microwave Absorotion - - - r - - - - on V 1s Ear th-Based Radar Data vs the ~ a i i n e r V Radio Occultation Resu , " November 1971.

We f i r s t reviewed our method of calculating the absorption, and de-
cided t o r ev i se the method used e a r l i e r (Reference 4). It was decided that
the expression due to HO (Reference 5). for attenuation
would be used, with some modifications, fo r computing the effects of water
i n the deeper portion of the atmosphere, while that due to Bean (Reference 6 )
would be used, a l so with modifications, f o r the effects of water in the upper
a tmosphere . The Ho expression with the water t e r m omitted i s used for the
whole a tmosphere in computing C 0 2 and N losses . 2
One modification that was made to both the Ho and the Bean expressions
was a cor rec t ion f o r the composition of the foreign gases causing spec t r a l
broadening on Venus. The atmosphere i s modeled a s 95% CO and 5% N 2 2'
H o t s water t e r m in Reference 1, 1330 A is based on experiments using H20 '
pu re N a s the foreign gas. In the absence of experimental data, the best 2
that can be done i s sca le this i n proportion t o the square of the kinetic c r o s s -
section of CO relative t o N This gives 2 2 '
F o r the 95% C 0 2 and 5% N2 composition the bracketed t e r m becomes 1577
AHZO. A = 13 c m a t the S-band frequency of i n t e re s t , 2297 MHz.
The Bean approach uses the line-broadening pa rame te r AT = 0 . 0 8 7 P X
j3B) 1/2 - 1 cm f o r a i r a s the foreign gas. Revising this for the Venus a tmos -
phere gives

B e a n ' s e x p r e s s i o n h a s two t e r m s . The nonresonan t t e r m i s
-
The resonan t t e r m l o r the T~ = 22 GHz absorp t ion l ine of wa te r , s impl i f ied
o r f , i s a, ( ~ ~ 0 ) = P K S where
A 2AT S =
2 0 . 35 i AT
and
13ean's e x p r e s s i o n is a H 0 a + a Ho s t a t e s tha t h i s express ion ( 2 ) = 2 3'
does not include the ef fec ts of the 22 GHz l ine , which would be reso lved a t
lower p r e s s u r e s , s o we f u r t h e r modified H o ' s e x p r e s s i o n t o a H 0
a + a ( 2 ) =
1 3' F o r high p r e s s u r e s a 3 < < u l , s o th i s modificat ion has negligible
ef fec t a t h i g h e r p r e s s u r e s . The ques t ion of w h e r e t o change f r o m the Bean
to the Ho a p p r o a c h was reso lved by taking
~ [ H ~ o ) = -in ( a + a,, a , + a , ) (7)
T h i s was done because H o t s express ion g ives too high a n at tenuation f o r
low p r e s s u r e s a n d B e a n ' s expreseion gives too high a n at tenuation f o r high
p r e s s u r e s . T h i s puts the c r o s s o v e r around P = 1 a t m , with the Bean f o r m
used above and t h e Ho f o r m below th is point.
Resu l t s a r e shown i n F i g u r e 7. 6F-1 f o r s e v e r a l va lues of A HZO'
The -
dec ibe l l o s s f r o m t h e s u r f a c e in fe r red f r o m r a d a r d a t a a r e a l s o shown i n
F i g u r e 7. 6F-1. Taken toge the r , t h e s e d a t a indicate tha t a nominal value f o r
AHZO i s a r o u n d 0.005, with 0. 01 a s a m a x i m u m value. T h e Venera i n - s i t u
m e a s u r e m e n t s of A a r e a l s o shown. T h e s e a r e i n reasonab ly good H2°
a g r e e m e n t with the r a d a r data .

AllENW1ION.O ID&)
Figure 7.N-1. Computed Zenith Absorption on Venus. 2.3 GHZ
The data required to recons t ruc t the occultation r a y paths were not
given in Reference 1, s o the paths were approximated by a hyperbola a s
descr ibed below. Selecting a given radius fo r the r a y ' s c losest approach
to the planet, the radius of curvature of a horizontal ray a t the selected
radius i s given by (Reference 7):
The asymptotes f o r the hyperbola were found f r o m the refract ion in -
tegra l , which gives the total r a y 13ending in an exponential a tmosphere. The
refract ion integral f o r a horizontal look angle i s (Reference 7): OD
- X e dx
0
(1 t N ~ ~ - " ) (I t e) (1 + Noe-x)2 - (L + No)2
(9)
No and B were selected to match the model a tmosphere a t the point of the
r a y ' s c loses t approach. Given the radius of curvature a t the point of nea res t
approach and the asymptotes, the hyperbola i s readily constructed. The
geometry is sketched in F igure 7. 6F-2. A line integral of a

RADIUS OF CURVATURE AT O, b r =POINT cf RAY'S CLOSEST ' A P R M C H TO PLANETS 2
TAN 8 - Jr?- = &
I R A N I T RADIUS - b M O
X
Figure 1,s-2. Hyperbolic Appoximtion Geometry
Reference 7 along this hyperbola was then computed to give the total absorp-
tion a s a function of A H ~ O '
Results a r e shown in Figure 7.6F-3 along with
I-YND LOSS, (. (0s)
Figure 1,s-3. Conprtld W @ i o n loss la Four b l w s cd Water Contsni Vrsus Lms M, from Ra(atncc 1

those given in Reference 1. I t can be readily seen that no value of A
can be selected to match the curve given in Reference 1 over i t s ent i re length.
The best match comes in the range 0.02 < A Hz0
< 0.03, much higher than
the A inferred f r o m the r ada r data. Hz0
Finally, a s a check on the consistency of the hyperbola approach with
the method used in Reference 1 to invert the occultation data, the computed
a v s r plot p,iven in Reference 1: was approximated a s shown in Figure 7. 6F-4
and this approximated a was used in the hyperbola program. As shown in
F igure 7.6F-5, the resulting total attenuation data ag ree quite well with
that given in Reference 1, confirming that the hyperbola i s an adequate ap-
proximation to the actual r ay path a s computed in Reference 1.
FlgdrP l b f d . Comparison of Straight LineApprorlmat#on 01 Abswpilon Loss to CompJtW VanLesof Relerence I

$-BAND LOSS, e (OW
Figure 7 . 6 5 . Martin h'arielta Complrted Value of Total Absorption Using Hyperbolic Approximation as Compared to Data from Reference I
It i s difficult to conceive of any combination of atmosphere, clouds,
o r dust that would give a a vs r plot s imilar to that shown in Figure 7. 6F-5 .
This, together with the apparently high confidence level given the radar data
by nearly all of the investigators working in the a rea of Venusian microwave
absorption, suggests that the radar data should be used as a basis for mis-
sion designs and the occultation data snoula be ignored. There a r e many
possible sources of e r r o r in the occultation data. Probably the largest
of these i s an incorrect assessment of the signal loss due to pointing e r r o r
in the high-gain antenna. Another i s the losses suffered by the lower f r e -
quency (423 MHz) signal in the ionosphere. A third i s the assumption that
both signals follow the same path through the ionosphere and the atmosphere.
Some attempt was made to account fo r a l l of these factors in Reference 1,
but large e r ro r s may remain in the computations.
To summarize then, because of the sources of possible e r r o r in the
occultation data, and the disagreement between these and other data, viz.. - earth-based radar observations (which is held to be quite reliable by the
appropriate segment of the scientific community), i t is concluded that the

occultation da ta should be disregarded. Al;o, because of the good agreement
between ear th-based r a d a r observations and our resu l t s f o r an H 0 water 2 abundance of about 0.005, it i s fur ther concluded that this value should be
selected fo r a nominal value with 0.01 a s a maximum value. Curves showing
attenuation versus radius a r e shown for these abundances in Figure 7. 6F-1.
Also shown a r e the ear th-based r ada r data and the Venera in-situ measu re -
ment data. I t i s noted that t he re is a l s o relatively good agreement with the
Venera data fo r abundances in the range just mentioned.
3 . RADIO ABSORPTION AND DEFOCUSING LOSSES-VENUS ATMOSPHERE
Absorption and defocusing lo s ses a s a function of altitude and ear th
depa r tu re angle were calculated for the la tes t planet model a s specified in
Table 5 of S P 8011 (Reference 8) using the methods outlined in Section 2 of
t h i s appendix. The r e su l t s a r e shown in F igu re 7.6F-6 along with a few
points f r o m a Stanford University study (Reference 9) . The la t te r analysis
a g r e e s quite well with Mart in Mar ie t ta resu l t s a t the 6050-km altitude but
the attenuation fal ls off m o r e gradually with altitude.
SIGNAL ATltW*TION,a (08)
Figure 7 . 6 F 4 . Radio Propagation Losses. Venus Almosphere
There a r e two basic differences between the Mart in Marietta compu-
tations and those by Croft, e t al . of Stanford (Reference 9 ) . These a re :
the atmospheric models used a t Stanford contain no gaseous H 0, which 2

lowers the absorption relative to that given by Mart in Mariet ta ; and the
Stanford study includes some "layering loss" not included by Martin Mariet ta ,
which r a i s e s the losses relative to those given in the Mar t in Marietta work.
It turns out that a t the su r face these d i f fe rences ve ry nea r ly cancel each
other; consequently both Reference 9 and Mar t in Mariet ta data give essen-
t ially the same loss f r o m the surface. However, this is not t rue a t higher
elevations. Reference gives substantially more lo s s than Mart in Mariet ta
data a t elevations above t6O km.
Now, le t us consider which of these models i s the more reasonable.
Both ag ree reasonably well with the total l o s s f r o m the surface a s determined
by ear th-based r ada r , apparently by design. The absorption due to the
d r y C 0 2 i n the atmosphere i s not enough to give this r a d a r loss. The dif-
fe rence i s made up a t Martin Mariet ta by H 0 l o s s and in Reference 9 by 2 layering loss . The technique used by Martin Mariet ta to determine the
abundance of gaseous H 0 was s imply to add H 0 until absorption l o s s 2 2
matched that given by ear th-based r a d a r measurements . This gave resu l t s
that ag ree with Russian in-s i tu measu remen t s of H 0 abundance. There i s 2
substantial evidence for the presence of a significant amount of H 2 0 in the
Venus atmosphere. Accordingly, the assumption of z e r o H 0 made in Refer- 2 ence 9 i s cont ra ry to existing evidence.
Now, if some H 0 i s included in Reference 2 models, they will have 2
to reduce their layering lo s s to remain in agreement with the ear th-based
r a d a r data. Justification for the amount of layering loss used in Reference
2 i s ra ther weak. It i s based on Mar iner occultation data , which did not
penetrate deep into the atmosphere, a rb i t r a r i l y extrapolated to the surface.
The likelihood of significant layering deep in the turbulent a tmosphere of
Venus i s very sma l l on physical grounds, and no evidence of it was found by
the Russian probes. Therefore , while there may be some layering lo s s in
the s t ra tosphere, this extrapolation to the sur face i s not reasonable.
It should a l so be noted that the explanation of the losses observed by
Mar iner 5 a s "layering loss" i s not strongly justified. These losses , i f
they exist a t a l l , would appear most strongly on a near-horizontal path such
a s an occultation path, and would probably not be observable on the more
near ly ver t ical paths corresponding to probe missions. The authors of
Reference 9 make no allowance fo r this.

We conclude that our assumptions a r e m o r e reasonable than those in
Reference 9, and, therefore , the Martin Mar ie t ta resu l t s a r e used in thc
design control tables and link analyses.
4. GLOSSARY OF SYMBOLS FOR APPENDIX 7 .6F
r = Ray radius of cu rva tu re a t i t s point of c loses t approach to the planet C
r = Distance f r o m the r a y to the planet cen te r a t i t s point of c losest 0 approach t o the planet
n = Index of re f rac t ion
T = Tempera ture , ( K )
g = Plane ta ry gravity
M = Mean molecular weight of the a tmosphere
R = Universal gas constant
r = Radius, measu red f r o m planet center
f = Foca l length of hyperbola used to approximate the r a y path
a = P a r a m e t e r defining the hyperbola used t o approximate the r ay path
b = P a r a m e t e r defining the hyperbola used to approximate the r ay path
A = Abundance of gas X in the planetary a tmosphere X
P = P r e s s u r e , a tmospheres
a = Absorption coefficient (dB/km)
A = R F wavelength ( c m )
0 , Yc = The location of the planet ce'nter in the selected coordinate sys t em
P ( 3 = Absolute humidity g m / m of HZO
N = Refractivity 0
8 - I = Scale height for refract ivi ty

REFER ENC ES
C. l d o A. Kl io rc , V . R. E s h l e m a n , "The Neut ra l Atmosphere of Vcnus a s Studied with the M a r i n e r V Radio Occultat ion E x p e r i m e n t s , " J. A s t r o n (1971).
D. U. Muhleman, "Microwave Opacity of the Venus Atmosphere , " J. A s t r o n . , 74, pp. 57-79 (1969).
J. V . F:vans, "Var ia t ions in the R a d a r C r o s s e c t i o n of Venus , " J. A s t r o n . , 73, pp. 123-124 (1968).
R. J. Richardson, " W a t e r Vapor and Communicat ions on Venus ," MMC Memorandum, M a y 28, 1971.
W. Ho, e t al. , "1,aboratory M e a s u r e m e n t s of Microwave Absorption -- in Models of the Atmosphere of Venus ," J. Geophys. R e s . , 71, pp. 5041-5108 (November 1, 1966).
B. I<. Uean, e t a l . , "Weather Ef fec t s on R a d a r , " i n &r - - Handbook, M. Skelnik, Ed., (McGraw-Hill , 1970). Ch. 24.
"Study of a Venus E n t r y Miss ion , " F i n a l Repor t , Con t rac t J P L 952534, Vol. 11, Ch. VII-A, Mar t in Mar ie t t a Corpora t ion (Apri l 1970).
Anon, "Models of Venus Atmosphere (1972)" NASA Space Vehicle Dcsign C r i t e r i a (Env i ronment ) , NASA SP-8011.
'T. Crof t , e t -- a l . , " P r e l i m i n a r y Review and Analys is of Ef fec t s of Lhe Atmosphcrc of Venus on Radio T e l e m e t r y and T r a c k i n g of E n t r y P r o b e s , " F ina l Repor t S E L P r o j e c t , S tandard Univers i ty (October 1972).

APPENDIX 7.6G
PLANET BACKSCATTER MULTIPATH ANALYSIS
1. Doppler Shift and Rates
2. Atmospheric Loss
3 . Time Delay
4. Reflected Signal Bandwidth
5. Planet Reflectivity
6. Multipath Signal Strength
7 . Summary of Resul t s

APPENDIX 7.6G
PLANET BACKSCATTER MULTIPATH ANALYSIS
A Venus multipath study was needed t o evaluate the multipath effects
on a communication link f r o m ear th to Venus. This study was conducted
for the la rge probe and one small probe entry profile. The la rge probe
entry aspec t angle ( see F igure 7.6G-1) i s nominally 45 degrees with a ba l -
l is t ic coefficient (B) of 0. 16 before staging and 3. 5 af ter staging (46 k m above
the surface of Venus). The small entry aspect angle i s nominally 55 degrees
with a ball ist ic coefficient of 1.26. The entry aspect angles will remain
relatively constant f rom blackout (-70 k m altitude) t o the surface of Venus
(0 k m altitude). The effects of turbulence, parachute swing, etc, on the
entry will not be discussed in this study. F r o m the probe geometry
(Figure 7.6C-1) and velocities with respect t o Venus, the following data
have been tabulated using computer programs: Doppler shift and ra tes ,
atmospheric loss , t ime delay, reflected signal bandwidth, planet reflectivity,
and multipath signal strength.

1. DOPPLER SHIFT AND RATES
The multipath geometry i s shown in Figure 7. 6G-1. The probe is
descending vertically to the sur face of Venus (with velocity 7) and i s com-
municating directly to ear th with an ear th aspect angle of 6 (which i s a l so
the degrees f r o m subearth point). The velocity profiles for both la rge and
small probes a r e shown in Figures 7.6G-2 and 7.6G-3, respectively. F o r
convenience, the velocity vector i s held in the plane of the figure. Vector - d represents the d i rec t signal and X i s the specular component of the mult i -
path signal. The Doppler shift and Doppler difference will be calculated
for the direct signal and the specular component of the reflected signal.
The specular component is the point where the angle of incidence and
reflection a r e equal (6 = 6 = 6). 1 2
I I I I I I I 10 20 a 4 YI 60 7 0
UnNM (KM,
Figure 7.6G-2 Large Probe Velocity Versus Altitude
w r r ROBE (s= 1.26, e=%?
NOTE VELOCITY RELATtD TO PUNtT 110
ALTITUDE (KM)
Figure 7.6G-3, Small Probe Velocity Versus Altitude

The direct path Doppler shift i s
where
A = 0. 13 m (wavelength at f - 2. 3 GHz)
9 = 45O (large probe) 0 and = 5 5 (small probe) earth aspect angle
v = velocity
= velocity profile for large probe, see Figure 7.6G-2
= velocity profile for small probe, see Figure 7.6G-3
The specular (multipath) Doppler shift i s
where
h and v a r e same a s above
*= specular angle (see Figure 7.6G-1)
= 0 for flat surface approximation
= !b (h, e , r , 6) for spherical approximation
The angle LV i s equal to e for a flat surface approximation of planet
multipath. Figure 7.6G-4 shows the geometry and equations associated
with a spherical surface approximation. The angle @ i s a function of h
(height above Venus surface), r (mean radius of Venus 6050 km),
4(specular reflection angle), and e(earth aspect angle). The difference
between using a flat plane approximation and a spherical approximation
model i s that the specular Doppler shift i s greater. This difference be-
comes greater a s the height above the planet increases. Using the veloci-
t ies in Figures 7.6G-2 and 7.6G-3 and a 70 km altitude, the difference in

the specular Doppler shift between a flat plane and a spherical surface
model i s :
Large probe
8 = 45O
h = 7 0 k m
v = 64.34 m / s
A = 0.13 m (f = 2 . 3 MHz)
Flat plane model
' # = 0 = 4 5 0
ff = 348.04 Hz ( f f - - A cosw)
Spherical surface model
ly = 43.7O (calculated from equations in Figure 7.6G-4)
~f = f - f = 7. 66 Hz = difference between flat plane and spherical sP f surface model.
Small probe
Flat plane model
Spherical surface model
A f = f - f - 34. 95 Hz = difference between flat plane and spherical sp f -
surface model.

PEFLECTED SIGNU)
M W S SUWACE
h = O 10 7OKM~LlllUDE)
r - 6020KMWDIUS) 0 =&OR @ EARTH ASVECl ANGLE)
O , = q = 4 . ANGLE FOR SVECULU COMPONENT
WHERE C, = IWCD or LIGHT
1- TIME MLAY OF SPECULM SIGNAL
Figure 7.6G-4. Planet Geometry
The spherical surface model separates the direct signal Doppler
shift (f ) from the specular signal Doppler shift (f ) by a greater margin d s a s shown above.
The Doppler difference i s
Af = fs - fd S
Flat plane model
Spherical surface
Af = (cos @ + cos 6') s A

A plot of Doppler difference (Af ) v s altitude (h) using a spherical S
surface model i s shown in Figures 7.6G-5 and 7.6G-6 for la rge and small
probes, respectively. F igures 7.6G-7 and 7. 6G-8 show the Doppler ra te
of the direct signal for the l a rge and small probes, respectively.
L a n a m o s t m. .16/3.5, 4 9 ) 800
N O W . DOPsLER FREQUENCY DIFFERENCE AS VIEWED F R W EARTH
o 10 m a U) YI M m ALTITUDE IKMJ
F i g u r e 7.66-5. Doppler Frequency Di f ferences B d w e e n D i r e d a n 6 M u l t i p a t h
lbm 1 W A L L ROBE (8- 1.26. B - 55'1 I 1 NOTE: DOPPLER FREQUENCY DIFFERENCE I \ S VIEWED FROM EARTH I
ALTITUDt ABOVE VENUS (IM)
Figure 7.6G-6. DaPpler F r e q u e n c y D i f f e r e n c e Between Direct and Multipath Signals

ALTITUDE /KMI
Figure 7.6C-7. Direct Signal Doppler Rate Versus Anitude
SMALL PROBE (8 - I .2t. 55'1
NOTE: DOPPLER PAT, ASVlEWtDfilOM EARTH WllH STATIONARY PLANETS
ALrlTUDE (<MI
Figure 7.6G-8 Doppler Rate Versus Anltude of Dlrect Slgnal
2. ATMOSPHERIC LOSS
The atmospheric l o s s i s divided into two par t s , absorption and de-
focusing loss. A plot of atmospheric loss vs altitude is shown in F igures
7.6G-9 and 7.6G-10 for l a rge and small probes, respectively. The mult i -
path signal will go through m o r e atmosphere than the direct signal, and
thus will receive m o r e attenuation. This advantage vanishes a s the probes
approach the surface. Figure 7.6G- 11 shows one -way atmospheric loss
with respect t o subearth angles. The Venus nominal a tmospheric model
used i s SP-8011, Table 5 (Reference 1).

l 4 LARGE PROBE ~=0.16/3 .5 , &I
1.2-
NOTt LOSS = bSCXPlION AN0 I X W S I N G
0.2 -
0 1 I 1 I 0
t 10 10 X) 40 YI 60 m
ALTITUDE ABOM VENUS IKM)
Flgure 7.6G-9. Atmospheric LOSS - Dlrect and Munlpath Slgnals
' ' O r
SMALL PROBE iB 1.26. 8 = 55q
NOTE: LOSS - ABSOlPTION & N O DEFOCUSING
I I 10 ?O a UI n 60 10
ALTITUDE ABOVE VENUS (EM)
Figure 7.6G-10. Atmospheric Lass - Oirnt and Multipath Signals
e IMG FROM SUEARTHJ
Figure 7.6G-11. Almospheric Lasses

3. TIME DELAY
The difference in path lengths between the direct and reflected signal
resul ts in a difference in t ime of a r r iva l between the two signals. A
typical profile of the t ime delay i s shown i n F igures 7. 6G-12 and 7. 6G-13
for la rge and small probes, respectively. The symbol period for the la rge
probe Atlas/Centaur miss ion i s 11256 seconds for a r a t e 112, 128 bps
coded link and 1/128 for the 64 bps sma l l probe link. Time delay of the
reflected signal f rom the la rge probe (Figure 7.6G-12) var ies f r o m 330 x - 6
10 seconds a t 70 k m altitude to zero a t the surface. At the higher altitude
this delay amounts to 8. 5 percent of the symbol period and therefore i s a
potential source of intersymbol interference. The smal l probe worst case -6 reflected signal delay of 270 x 10 seconds, f r o m Figure 7.6G-13, is a
relatively small percentage (3.4%) of the sma l l probe symbol period.
NOTE: FREE SPACE SPEED Of LIGHT
s
A l T l N o t (KM)
figure 1.6G-12 Time Delay Versus Anitude (Munipdh Signal1
ls) - M L L W - 0 1 € 0 = 1 . % . 0.359
2 4 - 100-
< 1M-
D -
0 I0 w 1) a a m unruot m1
Figure 7.6-1). Tima Delay Versus AI iudc (MuH@h Slpnall

The ThorIDelta l a rge probe has a delaylsytnbol period comparable
to the Atlas/Centaur l a rge probe (10.470) of the rate 113 symbol period a t
high alt i tudes. The smal l probe t ime delay/symbol period i s comparable
to 1. 1 percent or about 113 of the AtlasICentaur smal l probe.
4. REFLECTED SIGNAL BANDWIDTH
The bandwidth of the reflected signal i s related to the relative velocity
of the probe and the planet, a s well a s the surface roughness. The reflected
signal will have a fluctuating bandwidth given in Reference 2 and 3 a s
A = 0. 13 m e t e r s
v = probeveloci ty (F igures 7. 6G-2 and 7.6G-3)
20 = planet mean slope - L
6 = reflected multipath angle ( see Figure 7. 6G- 1).
2 0 Ear th-based radar measurements indicate that -
L ranges f r o m 0.071 to 24 .
0. 124. A nominal value of - i s 0. 10 and will be used in the above equation. L It was found i n Reference 3 that a f te r some simplifying assumptions the
auto-correlat ion function of the scat tered signal was Gaussian-shaped.
Thus Bw, a s defined above i s the 4.45 sigma width of the spectrum.
The one -sigma point, centered on the off set multipath Doppler f r e -
quency f + fs , of the spec t rum is 0
B f * 2.3 GHz
The multipath spec t rums a t several d iscre te heights above the planet
a r e shown in F igures 7.6G-14 and 7.6G-15 for la rge and small probes,
respectively. A spherical su r face model was used in the above calculations.

DIRECI i l G N A l MULTIPATH SIGNAL
DIRECT MULTIPATH SIGNAL SIGNAL H = l d K M
-
t - IP1.3 HZ f- = 2.3 GHZ i
MULTlPAlH SIGNAL DIRECT
- ; z 2.3 GHZ M.5 HZ f
Figure 7.6G-14. Mu l t ipa th Frequency Spectrum of Large Probe (0 = ,1613.5. 45") (Due to Planet Relleclion On ly l
MULTIPATH SIGNAL
DIRECT f H=rOKM SIGNAL + n = 221.6 HZ -
ro - 192 nz
MULTIPATH SIGNAL
DIRECT S I G N M
H O X M - t
f - 32.4 HZ -
\ 2.3 GHL lo 32.4 HZ 1 (HZ1
F lgure 7.6G-15. M u l t l p d h Frequency Spectrum o l Smal l Probe IB = 1.26, 5 5 3 lDue lo Planet Rellectlon Onlyl

5. PLANET REFLECTIVITY
Expressions forTH (horizontal polarization) a n d r (vertical polariza- v tion) a r e f rom Reference 4.
L - - cos + -dc - sin +
r~ cos + G n 2 +
chas been estimated for Venus from radar data (Reference 5) as c - 4.
A plot of the above equations i s given in Figure 7. 6G-16 for c = 4. For
+near zero r' N 5, which implies that a RHCP wave will reflect a s a LHCP
wave. In principle this means that i f both the direct and reflected waves
a r e circularly polarized, and i f 8-0 (probe near the subearth point), the
reflected wave will be completely orthogonal in polarization to the direct
wave, and thus can be completely eliminated in the receiver antenna. In
practice t h i s ideal is rarely realized because the down-looking part of the
radiation patternis usually only a very poor approximation to being circularly
polarized. However, it i s rea'sonable to expect a 3 dB advantage from this
effect for probes near the subearth point. F o r e > 63. 5' the effective Tc
for circular polarization i s the RMS average of r and r v H '
--- SPECULAR COMFUNENT, ROUGH SURFACE ROUGH WRFACE Y.OOlH SURFACE
ANGU (X INCIIXNEE + IDEGI
Figure 1.6C-16. Reflection Coafficients Versus INidence Angle

A detailed analysis by Glenn (Reference 2) on rough surface scattering
shows a significant departure f r o m ) r l i n the a r e a of l a rge 0. The dashed
curves i n Figure 7.6G-16 a r e f r o m data taken f r o m Reference 3. In
Reference 3 the conclusion was that the dashed curves approximate the
conditions on Venus m o r e completely.
6. MULTIPATH SIGNAL STRENGTH
The multipath signal could cause deep amplitude fades that may cause
loss of lock i n the phase lock loop and cycle slipping in the loop. F igure
7. 6G-17 shows the expected multipath signal strength a s a function of
angular distance f r o m subear the . The multipath signal i s reduced by th ree
factors. These a r e atmospheric attenuation (nominal model S P 8011
Figure 7. 6G-11), antenna directivity (conical beam pat tern, see F igure
7. bG-18) and surface reflectivity (c i rcu lar polarization, s e e F i g u r e 7.6G-16). 0
The total of these drops rapidly decreases a s .9 approaches 90 . Signal in
the loop i s fur ther reduced by the filtering effects of the loop, which depends
on the loop bandwidth, the Doppler offset, and the Doppler spreading.
LEGEND: ------ All€NUATIGU
I B L t C n V I N --- A N l € N M DBECTIVIW
H m
1 o w ~ 1 ~ ) m m m m m U I T H U E C T ANUE. 0
Fiiure7.6G-17. Multlpdh Signal Slrsqth

Figure 7.66-18. Typical Antenna Pattern
7. SUMMARY O F RESULTS
The basic contributing p a r a m e t e r s to the multipath problem w e r e
studied and defined. A t i m e h is tory ( re la ted to altitude) fo r both l a rge and
sma l l p robes , of Doppler, a tmospher ic l o s s , t i m e delay, and reflected
signal bandwidths was given. The multipath signal strength was calculated
f o r var ious subear th communication angles. The data given h e r e were used
t o p r e p a r e the probe link design control tables (Appendix 7.6M) and the one - way vs two-way sys t ems ana lys i s (Appendix 7.6L).

REFERENCES
1. "Models of Venus A t m o s p h e r e (1972)," NASA Space Vehic le Design C r i t e r i a (Env i ronment ) , NASA SP-80 11.
2. A. B . Glenn, "Fading f r o m I r r e g u l a r S u r f a c e s f o r Line-of-Sight Communicat ions , " IEE T r a n s a c t i o n s o n A e r o s p a c e a n d E l e c t r o n i c S y s t e m s ( M a r c h 1968).
3. "1975 Venus Mul t iprobe Miss ion Study," F ina l Repor t , C o n t r a c t J P L 952534, Volume 11, Section B (Apr i l 1970).
4. Study and Ana lys i s of Multipath and Modulation Selec t ion f o r Relay Radio Links. (RCA input to the Voyager Contrac t ) RCA Repor t 100032-A (VCB-155).
5. D. 0. Muhleman, -- e t al. , "A Review of R a d a r Astonomy - P a r t 2 , " I E E E Spect r l im - (November 1965).

APPENDIX 7.6H
TELECOMMUNICATIONS DESIGN CONTROL TABLES
FOR A THORIDELTA MISSION

APPENDIX 7.6H
TELECOMMUNICATIONS DESIGN CONTROL TABLES FOR A THORIDELTA MISSION
The telecommunication design control tables presented here a r e
based on a 1977 ThorIDelta mission. The design control tables have not
been updated to concur with the new science definition data (Version IV)
and a r e based on a Rician fading channel model. New design control tables
have been developed in Appendix 7.6M f o r a 1978 AtlasICentaur mission
using the new science definition data and a lognormal fading channel. A
tradeoff study between a Rician and lognormal fading channel i s given in
Appendices 7. 6B and 7. 6C. A complete s e t of tables for both ThorIDelta
and AtlasICentaur for a 1977 mission and with Rician fading a r e given in
Technical ?Jote P73-203434-074 (Rev A) Februa ry 1973.
F o r both ThorIDelta and AtlasICentaur missions, one la rge probe
and three smal l probes enter the atmosphere of Venus and communicate
direct ly to earth. The la rge probe links a r e two-way coherent to provide
two-way Doppler and the small probe l inks a r e one-way coherent. All
probes use PCM/PSK/PM modulation on the downlink. The la rge probe
uplink i s .unmodulated and i s used solely to provide the two-way Doppler
signal.
The tables a r e grouped providing a summary table for la rge and
small ThorIDelta probes a t each of three altitudes. The 1 km above surface
summary table i s followed by a detail table showing allocations of losses
and sources. An uplink table for the l a rge probe i s given in Appendix 7. 6M,
however, the margin mus t be reduced by 0.9 dB for the ThorIDelta to
account for increased range for the 1977 mission.
In the detail tables under i tems 15 and 20 no los ses have been shown
for recovering data f r o m predetection recordings made a t the DSN. The
reason for this i s that a l l link margins meet o r exceed the sum of the ad-
ve r se tolerances for a l l other losses , and s ince the difference between the
sum of the adverse tolerances and the RSS values exceeds 2 dB in a l l cases ,
this 2 dB i s considered adequate to provide the margin needed f o r predetec-
tion recording losses , especially where i terat ive processing can be resorted
to if necessary. This i s in contrast to Appendix 7.6M in which tolerance

has been included for recording loss in the Atlas/Ccntaur tables. Radome
loss fo r the l a rge probe i s shown in circuit losses even a t the lower altitude
af te r the radome i s jettisoned. Thus, there i s additional margin near the
surface not indicated in the tables.
Table 7.6H-1. ThorfDelta Link Analysis - Large and Small Probes
I I UM ABOVE YJIIFACE LARGE M A L L r a a w w l r r t a POWER w-MINI m 9.1 BIT PATE (BPS1 85.3 10
NO. P&PAMETER - . -- -. . I TOTAi TPANSMllTING POWER (DBW)
2 TWINWITTING CIRCUIT LOSS (081
3 TPANWITTING ANTENNA GAIN (DB)
4 COMUNICATIONS RANGE LOSS (OD)
5 ATMOSPHEllC ASSORPTION 6 DEFKUSING LOSSES (DB)
6 PMARIZATION LOSS (081
I MULTIVATH 6 OTHER LOSSES (08)
B RECEIVINCANTENNA GAIN (081
9 RKEIVING CIRCUIT LOSS (08)
10 NET LOIS (DB) U+3+4+54M7+CP)
I 1 TOTAL RECEIVED POWER (DBW<l+lOl
I 2 RECENOI NOISE SPECTPAL DENSITY - (DBW/HZ)
13 TOTAL RECEIVED POWER/NO (OBW. HZ) (11-12)
C A R R I E R TRACKING
14 CARRIED P O W E R ~ ~ O T A L (DB) I 5 ADOITIONAL CARCIER LOSSES (08)
16 rHar rHo to TUCKING CANDWIDTH - zqo (08)
17 THREIHMD S N R (OBI
IS PERFORMANCEMARGIN (DBI ( I k l4+15- l& lq
DATA CHANNEL
19 DATA POWEBflOTAL (DB)
M ADDITION4L DATA CHANNEL LOSSES (08)
21 DATA 81T PATE - BPS (081
21 THRESHOLD ENERGY PER DATA BIT - E f l 0 (DB)
Paoar . O V E R S
-0.4 - 0 2
-1.2
0
-0.11
-0.1
NOTES
-0.4
0
-2.01
-2.41
t1.0
-3.41
-0.4
-0.2
-0.8
0
-4.81
-0.2
-0.5
0
0
LARGE - NOMINAL
r 13.4
- 2 . 0
i 3.5
-ZSb.7U - 0.89
- o m SEE
t 6 1 . m
0
-194.67
-181.27 -2l4.Y1
r J1.D
. 4 . n
0 7 + 10.0
+ 13.0 + 1-81
- 1.76
- 5.25
* 19.3
+ 2.5
-p WALL
NOMINAL -- r I O . 0
- 1.0
i 3 . 0 -256.8
- 0.7 - 0 . 2
SEf
+ b l . l
0
2
- I U 2
-214.5
30.3
- 1.6 - 0 . 6
t 10.0 4 11.0
i 7.1
- 5.1
- 5.6
+ 10.0
+ 2.5
23 PERFORMANCE MARGIN (DBl 03+19+%21-22) . I. MULTlVATH LOSSES ITEh4 7 &RE INCLUDED
PROBE
AOYERIE
-0.4 -0.2
-1.2
0
-0.1
-0.1
NOTES
-0.4
0 -2.0
-2.4
11.0
-3.4
-0.2 -0.4
-0.8 0
- 4 . 8
-0.5
-0 .8
0
0 + 7.1 4 1 1 - 4 . 1
LARGE PROBE
-4.7
SMALL PROBE I N ITEMS I5 620 .
1. I: = 6. PATE IV3 CONVOLUTIONAL VITERBI SOFT DECISION DECODING.
YJM US8 SUM RSS
VNO. 3.41 1 . 6 8 S/NO. 3.4 1.68 CARRIER 4.81 1.9, CARRIER 4.8 1.91 DATA ,.I1 1.76 DATA 4.7 1.P)

Table 7.6H-2. ThorfDelta Large Probe at Surface
13. TOTAL RECEIVEDVOWERINO. IDBW. HZ) l l l L I2 ) -33.73 - -3.41
14. CARRIER POWEII/lOTAL (081 -d.72 - -0.1
15. ADDITIONAL C A R R I E R LOSSES ID61 - -0.; - -0.2
15.1 DOWNLINK SUPPRESSION OUE TO U P L i N I EFFECTS
15 .11 THERMAL NOISE ON UPLINK -0.2 11.1 2 ATMOSPHERIC MULTIPATH ON UPLlNI -0.2 15.1 3 UPLlNI PLANETARY MULTIPATH -0.2 IS.! 4 DOPPLER TRACKING ERROR -0.2 15.1.5 OSCILLATOR INSTABILITIES -0.2
15.2 AIMOSPHERIC MULTIP&TH O N DOWNLlNI -0.5 15.3 DOWNLINK PLANETARY MIJLTtPhTH NEGLIGIBLE I S 4 OSCILIATOII INST*BILITIES: 2 WAY NEGLIGIBLE
I WAY 0.2 (DELETE UPLINK EFFEClSi 18.5 PEEDETECTION RECORDING LOSS (SEE T E X T us FRONT)
16. THRLSHOLO TRACKING &ANDWIDTH 1081 - 10 -0 .8 - 16.1 LOOP UNDWIDTH - 2BL0 IHZI 10TO 12 HZ NOTE: BLOCK IIIRECEIVER 10.5LD.3DB sE1o : ~ . 8 0 B T O C O V E R
BLOCK IY RECEIVER 10 .0~0 .4 08
17. REQUIRED LOOP SIGNALINOISE I N 2 T 0 UNDWIDTH lDB1 13 0 (INCLUOES LIMITER EFFECT)
- - 18. PERfORMANCf MARGIN IDBI 113-14-15-16-171 4 . 8 1 -4.81 - - I?. DATA POWER/TOTAL 1DBI - 7 6 - -0.2
20. ADDITIONAL DATA CHbNNEL LOSSES (DBI - -5.25 - -0.5
20.) NOISY CARRIER REFERENCE AND MULTIPATH LOSS IDBI 4.15 20.2 SUBCARRIER NOISY REFERENCE AND PHASE AMBIGUITY LOSS lDBl 0.0 20.3 WAVEFOKM DliTORilON LOSS ID81 0.3
21. DATA 81, UTE (OBI -1P.3 - 0 BPS - 85.3
- - 2 . 5 0 - -
CODlNG TYPE CONYOLUllONAL h - 6. MTE 1/3 DECODING TYPE \'IlERBI SOFT DECISION
23. PER6ORMANCE MARGIN (DBI 113-1Pi20-21-271 4.42 -1.11 -
NOMINAL ADVERSE VALUE TOLERANCE --
I. TRANSMITTER POWER 1DBW - 13.4 - -0.4
1 . 1 raaNsMl i r ta Powra w a r r s ) 21.7
2. TRANSMITTING CIRCUIT LOIS lOBi - -2.0 - -0.2
2.1 CABLE ASSEMBLY LOSS (OBI 0.95 2.2 FEEDTHROUGH LOSS IDBI 0.15 2.3 WOOME LOIS tDBi 0.4 2.4 DIPLfXER LOSS iD$i 0.5
3. TRANY*ITTING ANTENNh GAIN (DBi - .3.5 - -1.2
3.1 NOMINAL ANTENNA GAIN lDBl 3.5 AT 50 DEG 3.2 ADVERSE ANTENNA LOIS DUE TO TARGtllNG UNCERTAINTY
INCLUDED IN 3.1 OF 30 = 2.0 DEG 0.0 ID81 LOSS. 3.3 ADVERSE ANTENNA LOSS DUE TO TURBULENCE O N THE PROBE
OFO.0 DEG 0.0 (081 LOSS. 3.4 ANTENNA PATTCRN RlPPLE LOIS I D 1 1.2 3.5 ANTENNA TYPE TURNSTILE/CONE AND nssw im DEG NOTE: REFER TO APPENDIX 7.6). ANTENNA PERFORMANCE TESTS.
1. COMMUNCATIONS RANGE LOSS lDB1 - -256.78 - 0
4.1 RANGE= 7.195X 10⁷KM = 0.481 A U 1.2 FREOUENCI = 2.295 GHZ
5. AIMOSPHERIC ABSORPTION - DEFOCUSING lDBi 0.89 - D.\I
5.1 ABSOOPTtON LOSS (DBI 0.M 55 O f t VALUES USLO 5.2 DEFOCUSING LOSS lD8l 0.21 55 DEG VALUfS USED 5.3 ROBE HEIGHT IKMI AT SURFACE 5.4 IIIRGETINGANGLC IDfGI NOMINAL 48 30 * 2' NOTE: REFER TO APPENDIX 7bF
6. POLARIZATION LOSS 1081 - 0.2 I - 6 . 1 AXIAL RATIO - IRANIMITTING ANTENNA 2.5 D8 6.2 A X I A L RATIO - I(ECtlYINGANTENNA 0.6 DB NOTE. SEE D I N STANDARD PRACTICE 810-5; REV. C P. 2-5
7. MULTIPATH AND OTHER LOSSES 1DBl (INCLUDED I N IS AND 20 BELOW)
8. RECEIVINGANTENNA GAIN 1081
8.1 RECEIVE GAIN ID81 - -61.7 - -0.4 M-METER SUBNET
NOTE; SEE D I N STLNOLRD PPACTICE 810-5; REV. C. P. 2-2
9. RECEIVING CIRCUIT LOSS (OBI - 0 0
9.1 LOSSES INCLUDED I N 8 (RECEIVING ANTENNA GAIN)
ID. NET LO11 (081 (2+3+4+5*6+7*Bfq -194.67 - -2.01
I!. TOTAL RECEIVE POWER 1DBW (1*101 8 1 . 2 7 - -2.41
12. IIECFIVER NOISE SPECTRAL DENSITY (DBWIHLI -214.5 - -1.0
l2.1 N O = I(T--228.6- IOLOGT TRACKlNG iTATlON COVERAGE O N 5-16-77 T - 22% + 3 I( FOR COLD SKY INEAR ZENITH) MADRID WORST-CASE ELEVATION &NGbE IS AT THE SURFACE
ELNATIONANGLE = 18DEG. ADD8 K G a o s i o N r WORST-CASE a r v n i l o r u $ ~ ~ ~ t ,SAT PRE-ENTRY
ELNATION ANGLE = 22 DfG. A00 4 K THIS RESULTS IN A SYSTEM NOISE TEMPERATURE OF
26 (22 6); 113 41%. W I C H CORRESPONDS TO - 2 l 4 . J t I . 0 DBW/H2.
NOTE: SEE DIN STANDARD swCTICE 8 1 W ; ilEV C, P. 2-15, . -

Table 7. 6H-3. ThorIDel ta Small P robe a t Surface
NOMINAL ADVERSE VALUE TOLEX~NCE --
I. TRANSMITTER POWEI- (OBWI -10 -0.4 - - I 1 raaNsMlrrra p o w a warrrl l o
2. TRANWTl lNG CRCUii LOIS (DBI 1.0 - -0.2 2.1 CABLE ASSEMBLY LOSS 1DBI 0.45 2.2 FEiDlHROUGH LOSS 108) O.l5 2.3 RADOMF LOSS iD8I 0.4
3. TWNSMITTING ANTENNA GAIN (DBI A3.0 -1.2 - 3.1 NOMINAL ANTENNA GAIN 1DBI f3.0 AT 55 DEG 3.2 ADVERSE ANTENNA LOSS DUE 1 0 TARGfTlNG UNCERTAINTY
INCLUDED*BOYf OF 30 = 0.0 DEG 0.0 IDB) LOSS. 3.3 ADVERSE ANTENNA LOSS DUET0 TURBULENCE O N THE PROBE
OF 0.0 DEG 0.0 IDBI LOSS. 3.1 ANTENNA PATTERN RIPRELOSS IDBl 1.2 3.S ANTENNA TYPE TURNSTILVCONEANO HPsW 120'
4. COMMUNICATIONS RANGE LOSS (DB) -256.8 - 0 4.1 R A N G I - 7 I 4 X 1 0 ~ ~ ~ - 0 . 4 B l i U 1.2 FREOUiNCY = 2.24 GHL
5. ATMOSPHERIC ABSORflION - DEFOCUSING iDBl -0.9 - -0.1 - 5.1 ABSORPTION LOSS 1DBI 0.M 5.2 DEFOCUSING LOSS (OBI 0.21 5.3 PROBE HEIGHT iKMl AT SURFACE 5.4 TARGETING ANGLE iDEGI NOMINAL 55 3. =INCLUDED NOTE: REFER TO APPCNDIX 7.66
6. PMARIZATION LOSS (08) 0.2 - -0.1 - 6.1 AXIAL PATIO - TRANSMITTING ANTENNA 2.1 DB 6.2 AXIAL RATIO - RECElYING ANTENNA 0.6 08 NOTE: SEE D I N STANDARD PPACTICEB165: REV. C. P. 2-5
7. MULTIPATH AND OTHER LOSSES 108) IINCLUDED IN I 5 AND 20 BELOW)
8. RECEIVING ANTfNNA G k l N (08)
8.1 RECEIVE W I N (DBI * & I 7 - -0.4 &METER 5UBNEl -
NOTE: SEE D I N ITANDARDWACTICE 81L5; REV. C, P. 2-2
9. RECEIVING CIRCUIT LOSS (08) 0 0 - 9.1 LOSSES INCLUDED I N ITEM 8 IRECEIYING ANTENNA GAIN1
10. NET LOSS IDBI il*3+4+5+6*7+&V) -194.2 -2.0 - - I I. TOTAL RECEIVE POWER iD8W lI*1Dl -184.2 -2.4 - - 12. RECEIVER NOISE SPECTRAL DENSITY (DBW/HZI -214.5 - -1.0 -
12.1 N O i K T - -228.6+ IOLOGT TRACKING STATION COVERAGE ON 5-1677 r = ZPK +PK roll COLD SKY (NLI\R ZENITH) MADRID WORST-CASE ELEVATION ANGLE I S AT THE SURFACE.
ELNATION ANGLE - 18 DEG. ADD 8% GCtDITONE WORST-CASE ELEVATION ANGLE IS AT PRE-ENTRY.
ELNATION ANGLE = 21 DEG, ADD 4% THdS RESULTS IN A SYaTEM NOISE TEMPERATURE O r 26 122 * 41 f 7 (3 4 %. WHlCH CORRESPONDS TO -214.5=1.0OBW/HZ.
NOTE: SEE D I N STANDARD PRACTICE 81C-5; CEV. C. P. 2-15. I
13. TOTAL RECEIVED POWER/NO, 10BW - HZ) 111-12) t30.3 -3.4 - - 14. CARRIER POWEP/TOTAL 108) - -1.6 - -0.2
MODULATION INDEX
I>. ADDITIONAL CARRIER LOSSES (OBI -0.6 - -0.4 - 15.1 AIMOSPHERIC MULTIPATII ON DOWNi lN I 0.5 15.2 DWlNLlNX PLANETARY MULTIPATH NEGLIGIBLE 15.3 OSCILLATOR INSTABILITIES: I WAY 0.1 15.4 PREDETECTION RECORDING LOSS (SEE TEXT1
16. THRESHOLD TRACKING BANDWIDTH lDB1 10 - n.8 - 16.1 LOOP MNOWIDTH - 2 y 0 (HZ1 10TO 12HL NOTE: BLOCK lil RECEIVER 10.5=0.3 DB
BLOCK I V KECEIVEII 1 0 . 0 ~ 0 . 4 D8 ::808 T O c O v ~ ~
I 7 REOUIRED LOOP SlGNAl/NOlSE IN 2UL0 BlNDWlDTH 1DBI I I - 0 (INCLUDE5 LIMITER EFFECTi -
18. PERFORMANCE MARGIN (OBI (13+l lAiS- lb l7 l 7.1 - -4.8 - 19. DATA PO\"IERiiOT~L LOB1 -5.1 - -0.5 - 20. ADDITIONAL DATA CHANNEL LOSSFS (OBI -5.6 - "B
20.1 NOISY CARRIER REFERENCE ANDMULTIPATH LOSS (DBI 4.25 1lNCLUDlNG LIMITEM
20.2 OSCILLATOR INSTA8lLlllES LOSS lDBl 0.2 20.3 SUBCARRIER NOISY REFERENCE kND PHASE AMBIGUITY LOSS lD8i 0.8 10.4 WAYEIORM DISTORTION LOSS lDBl 0 3
21. DATA 811 RATE ID$) 10 - 0 BPI= 10 -
22. REQUIRED ENERGY PER DATA BIT - fh'No tDBi .2.5 BER = 1E3 MIN~MUM
- s_
CODING TYPE CONVOLUTIONAL K 6 . RATE I 3 DECODING TYPE VITERBI s o r r DRISION
23. PERPOIWANCE MARGIN ID81 (13-19-20-21-22) - 7 . 1 - -4.7 -

Table 7 . 6H-4. ThorlDelta Link Analys is , 30 KM Altitude
LARGE WALL TRANSMITTER POWER W-MINI M 9.1 Bll RATE 18P9 102.3 10
PROBE
ADVERSE
-0.4
-0.2
-1.8
0
0
-0.1
NOTES -0.4
0
-2.5
-1.9
h . 0
-3.9
-0.2
-0.4
-0.8 0
-5.3
-0.5
-0.8
0
0
-5.2
SMALL PROBE IN ITEMS I 5 M . SUM 1155 SUM RSS
2. X = 6. RATE ID CONVOLUTIONAL VIlER8I SOFT D t l S l O N OECOOING.
S R 1 0 4 . 2.31 S/NO. 3.9 2 1 5 CARRIER 5.5 2.49 CARRIE@ 5.3 2.13 DATA 4.8 2.37 DATA 5.1 2.34 ..
NO.
I
2
3
5 6 7
8 P
10 11
12 13
14 I 5 l a
17 I 8
IP
- -. .... . - . PARAMETER
TOTAL TPANIMITTING POWER (DBW
TP*NIMITTING CIRCUITLOSS (Dq
TRANIMITTING ANTENNA GAIN (08)
COMUNICATIONS PANGE LOSS (DO) ATMOSPHERIC ABSCWTION d DEFOCUSING LOSSES (DO)
PUARIUTION LOSS lD8) MULIIPI.lH OTHER LOSSES 1DD PECEI'JING ANTENNA GAIN (09 RECEIVING CIRCUIT LOSS (08)
NET LOSS (DO ( l + 3 W W 7 + 8 + P l
TOTAL RECEIVED POWER (DBW (I t lOI
RECEIVER NOISE SPECTPAL DENSITY- (DIIWMZI
TOTAL RECEIVED POWEWO (DBW - HZ1 I l l - 1 3
CARRIER TUCKING
cnaa~ta P O ~ W O T A L (ow
AODITIONAL CARRIER LOSSES (001 r n l r r n o r d ~ ~ \ c ~ l ~ ~ MNDWIDTH - qO (DO
THRESHOLD SNR (DO)
PERFORMNCE M R G I N ( D I ( l 3 + l 4 + l S - 1 6 1 ~
DATA CHANNEL
DATA POWEWOTAL (OBI
LARGE
NOMINAL
+ I 3 . U
- 2 . 0
t 3.50
A - 0.1
0 . 2
SEE + d1.m
0
-1a.88
-1m.46 -214.50
+U.W
- 4.71
- 0 . 6 t 10.0
+ 13.0 + 5.52
20 2t
22
23
I.
m O M
ADVERSE
-0.4 -0.2
-2.0
0
0
-0.1
NOTES
.0.4 0
-2.1 -3.1
+I .0 -4.1
-0.4 -0.2
-0.8 0
3 . 5
-0.2
SMALL
NOMINAL
+ 10.0
- 1 . 0 t 3 . O
-216.8 - 0.1
- 0 . 2 SEE
+ 61.m
0 - Im.4
-163.4
-114.5
t 31.1
- t . d
- 0 . 5 + 10.0
+ 11.0 t 8 . 0
- 5.1 1 iq" ADDITIONAL DATA CHANNEL LOSSES (DO)
DATA 611 R4TE - BPS (OBI 0
THRESHOLD ENERGY PER DATA BIT - \mo IDBI + 2.5 0
PERFOWNCE MARGIN (00) ( I ~ + I P ~ ~ W ! - ~ I -- + 4 . 8 -4.0
MULllPPiTH LOSSES ITEM 7 ARE INCLUDED URGE PROBE
- 4 . 5 t 10.0
+ 1.5
r P . 0

Table 7. 6H-5. ThorlDelta Link Analysis, 70 KM Alti tude
LARGE SMLL TRANSMITTER POWER IW-MINJ m 9.1 BIT RATE BPI1 lm.4 I 0
N O . . 1
2
3
I
5
6
7
8
7
l 0
I 1
12
I 3
I 4
IS
16
I 7
18
I S
m 21
22
23
I. MULTIPATH LOSSES ITEM 7ARE ADVERSE TOLERANCES INCLUUtD IN ITEMS 15 & 20.
SUM R S S SUM RSI 2. K 6. WTE l/ICONVO(UTIONAL
VITERBI SOFT DECISION DEC001NG. SWO, 4.8 2.94 I /NO. 4 . 9 3.03 CARRIER 6.2 3.08 CARRIER 6.3 3.11 DATA 5.42 2.- DATA 6.2 3.18
LARGE
NOMINAL - 1 13.4
- 2.0
3.5
-2Sb.R
- 0.1
- 0.2
SEE
4 6 1 . 7 0
0
-IP1.88 - I80 .9
2
+ Y . 0 2 - -
- 4.72
- 0 . 3
+ 10.0
12.8
i 6 . 2
6
- 4 . 2
• 20. 1
+ 2.5
+ 5 . U
PARAMETER ~~ ~ - ~~ ---- - ~
TOTAL TRANSMITTING POWER (DBW
TlUNSMlTTlNG CIRCUIT LOIS 1081
19ANSMITTING ANTENNA GAIN (DB)
COMMUNICATIONS RANGE LOSS (DBl
ATMOSPHERIC ABSORPIION 6 DEFOCUSING LOSSES (DW
POLARIZATION LOSS (DB)
MULTlPAT4 &OTHER LOSSES (DBl
RECElYING ANTENNA GAIN (OBI
RECEIVING CIRCUIT LOSS 108)
NET LOIS 108) (2+3U+S*bi7tB+9)
TOTAL RECEIVED POWER ( D M 11410)
RECEIVER NOISC SPECTUL OENSllY - (DBWBZ)
TOTAL RECEIVED POWER/NO ID8W HZ1 Il l-121 - - ~~ p ~ ~ p p ~ ~-
CARRIER TRACKING
CARRIER POWER/TOIAL 108)
ADDITIONAL CARRlER LOSSES (OW
THRFSHOLLI TRACKING BnNOWlDTH - 081
THRESHOLD SNR (DP PERFORM*NCEMARGJN (DD (I3tl4+l5-161fl
M I A CHANNEL
DATA ?OWER/lOTAL (081
ADDITIONAL DATA CHANNti LOSIES (DW
DATA SIT PATE - BPS ID01
THRESHOLD ENERGY PER DATA 811 - E f l - ID81
PERFORMANCE MARGIN (D81 (I3*I9*20-2l-ZZl --
PROBE . - .. ADVERSE
-0.4
-0 .2
-2.7
0
0
-0.1
NOTES
-0.4
0
-3.4
-3.8
t1.0
-1.8
-0.4
-0.2
-0.8
0
-6.2
-0.2
-0.42
0
0
-5.42
MALL - NOMINhI
i 10.0
- 1 0
1 3 . 0
-256.8
- 0.1
- 0.2
SEE ( 6 1 . 1
0
-193.4
-183.4
-214.5 . 31.1
- 3.6
- 0.3
+ l0.C
t 11.0
' 8 . 2
- 5.1
- 3 . 9
+ 10.0
+ 2.5
* 9.6
PROBE
ADVERSE
-0 .4
-0.2 - 1 . 8
0 0
-0. l
NOTES
-0.4
0
-3.5
-3.9
~ 1 . 0
-1 .9
-0.2
-0.4
-0 .8
0
-6.3
-0.5
-0.8
0
0
-6.2

APPENDIX 7.6J
ANTENNA PERFORMANCE TESTS WITH ANTENNA
MOUNTED ON LARGE PROBE MOCKUP

APPENDIX 7.6 J
ANTENNA PERFORMANCE TESTS WITH ANTENNA MOUNTED ON LARGE PROBE MOCKUP
A t e s t p rogram was conducted to investigate the perturbations on the
radiated antenna pat tern resulting f r o m the mounting arrangement on the
aft-body (basecov'er) of the ThorIDelta l a rge probe and to verify the effects
of design changes. A ful l -scale mockup of the aft-body of the Thor/Delta
la rge probe was built ( s ee F igure 7 .6J-1) and the proposed Pioneer Venus
antenna ( turnst i le lcone a t S-Band) was mounted and tested.
The minimum antenna gain and maximum back lobe requirements fo r
the Pioneer Venus Probe Mission a r e shown i n F igure 7. 6J-2. As seen i n
F igure 7 .6J-1 , the two probable sources contributing to pattern perturbations
a r e the parachute canis ter and the la rge cavity under the antenna (the meta l
s c r e e n under the antenna was added a s a resul t of the tes t program).
The t e s t program was initially divided into five tes t configurations,
and a s a resul t of the f i r s t four , a sixth configuration was added. Each
t e s t configuration was used to investigate the perturbations of a particular
basecover component on the radiated pattern. The tes t configurations a r e
a s follows:
e F r e e space antenna patterns
~ L r g e probe, no canis ter
Large probe, full-length canis te r
Large probe, cutoff canis ter
Large probe, s c reen under antenna
Large probe, s c reen under antenna with swivel.
Two types of radiation pat terns (conic and grea t c i rcle) were recorded
using the coordinate sys tem i n F igures 7 .6J -3 and 7.6J-4.
Conic pat terns a r e defined by rotating the tes t antenna ( turnst i le lcone
on la rge probe) about the d-axis fbr 360 tlegrees while maintaining a con-
stant e anglc. Two conic patterns a r e shown in the f igures for e = 0 degrees
and 60 degrees.

Fipure 7.U-1. Anlennah@untrdon Large ProtmModrup

I 7 D B I
-8
L
$ -6
-5 0" lo" 20' 30° 40' 50' boo 70- 110' 1200 130° 140' 150' 160' 170'
ASPECT ANGLE. 8 IDEGREEI FROM IUBWRTH P O l M l
Figure 7.6J-2. Antenna Gain Requirements
PAWCHUTE CANISTER MSECOVER (METAL) (UPPER HALF T I B E I I G U I I , LOWER H A L F METW
SCREEN UNDER ANTENNA (METAL GROUND FUME)
# = ,soo
21 IN. R
CAVITY UNDER
e= 180°
figure 7.6J-L Mockup of Large Probe

ANTENNA TEIT FIXTURE
Figure 7.6J-4. Antenna Cmrdinale System
Grea t c i r c l e pa t te rns a r e defined by rotating the tes t antenna about
the e axis for 360 degrees while maintaining a constant bangle. T h r e e
g rea t c i r c l e patterns a r e shown in the figures for b - 0, 45, and 90 degrees.
The measured conic pa t te rns show the gain variation (pat tern ripple)
a t an angle 8 a s the probe spins symmetr ical ly about the spin axis of the
probe. The grea t circle pa t te rns measured show the beamwidth and beam
symmetry about the ccnter l ine of the probe. F r o m the grea t c i r c l e cuts,
the antenna's half-power beamwidth (HPBW) and 0-dBi o r 1-dBi beamwidths
can be measured . The pa t te rn ripple, HPBW, 0-dBi and 1 -dBi beamwidth
measurements for each t e s t configuration a r e summarized in Table 7. 6J-1.
All the antenna pat terns a r e recorded on decibel (dB) polar pat tern paper.
Table 7. 6 J - I . Test Configurations

The above t e s t configurations a r e analyzed and briefly discussed i n
the following paragraphs and summarized in Table 7.6J-1.
1. FREE SPACE PATTERNS
The f ree space t e s t pat terns of the turnst i le /cone antenna have
an H P B W of approximately 100 degrees ( see F igures 7.6J-5, 7 .6J-6, 7 .6J-7,
and Table 7. 6J-1). In Column A of Table 7. 65-1, the f r e e space pat tern
charac ter i s t ics of the turnst i lefcone antenna used a r e summarized. The
on-axis gain relative to isotropic i s 5. 5 dB. The pat tern ripple i s l e s s
than 1 dB. F igures 7.6J-8 and 7.6J-9 show the ripple pattern a t e = 0
and 60 degrees, respectively. The source antenna and receiving antenna
(turnsti lelcone) a r e both righthand circular ly polarized. The 0-dBi and
I -dBi beamwidths a r e a l so shown i n the table. These generally mee t the
miss ion requirements (Figure 7. 6J-2); however, this t e s t p rogram i s
mainly concerned with the performance of the antenna for various afterbody
configurations.
1 r 5 . 5 DB I WIN
I Figure 7.6J-5. Free Spce C r e t Clrcle Pattern
I 6- oo: e. oO-wo: F - 2.2 GHZ)

Figure 7 . 6 J 4 . Free Space Great Circle P a t i ~ n 1+.45O: e. oO-30": F - 2.2 GHZI
I y 5 . 5 DBI GAIN
Figure 1.U-1. Free Space Weat Clrcle Pattern
I +- 9C0; 0 - 0~-360~; F - 2.2 GHZl

Figure 7.UB Free Soxe Conic Patfern
( 0- 8: 6- 0'-36fI0: F - 2.2 GHZ)
I /-5.5 DO1 GAIN
Figure 7.6J-9. Frac Space Conlc Panern
I 0-66: *- 00-d: F - Z.ZCHZ)

2. LARGE PROBE TEST, NO CANISTER
The antenna was mounted on the l a r g e probe without the parachute
can is te r o r s c r e e n under thc antenna and a s e t of pa t te rns was measured.
Tbc basic pa t te rns a r e summarized in Column B of Table 7. 6J-1. The
HPBW was cr i t ical ly narrowed by thc cavity. Tlie pa t te rns for this con-
figuration a r e not shown.
3 . LARGE PROBE TEST, FULL-LENGTH CANISTER
A Ldl-length m e t a l parachute can is te r was added a s shown in F ig-
u r e 7 . 6 J - 3 and tes ted. F r o m the summary given in the table, i t can be
seen that the additian of a iull-length can is te r resul ted in a n improverncnt
in the HPBW, but not enough irnprovcment occu r red to mee t the r equ i r e -
men t s of F igure 7. 6J -2.
4. LARGE PROBE, CUT-OFF CANISTER
The can is te r was cut off a t the bottom of the antenna to simulate the
lop half of the can is te r being fiberglass, which i s a s sumed t o be R F t r a n s -
parent . The antenna pat terns for this configuratioll a r e sur r~mar ized in
Column D of Table 7.63-1. The cut-off can is te r nar rowed the HPBW and
increased thc on-axis gain; lher r fore , this configuration i s a l so undesirable.
5. LARGE PROBE, SCREEN UNDER ANTENNA
I t was determined that the cavity under the antenna was the ma in
contributor to the n a r r o w antenna HPBW. A meta l s c r e e n was placed
over the l a rge cavity and under the choke of the antenna ( a s shown i n F'ig-
u r e 7. 6J-1). A summary of the pat terns i s shown i n Column E of Tablc
7 .6 J -1 and the ac tua l pa t te rns a r e shown i n F igurcs 7.6J-10 through
7. 6J-14. The H P B W inc reased over that of the f r e e space pat terns and
t h e on-axis gain was changed to 5.6 dBi. The 0-dBi and 1 -dUi g a i n b r a m -
widths w e r e inc rcased a l s o and generally m e t the probe requirements of
F igu re 7. 6J-2. Therefore , a ground plane such a s a me ta l s c r een o r meta l
foil should be used to cover the la rge cavity on the probe.

r 5 . 6 O B I GAIN
r5.6DBI GAIN
Figure 1.61-11. Large Probe. Screen Under Antenna. Conic Pattern 0 0
I 0 . a : 4.0 -~~O~:F-Z.ZCHZ~

Figure 7.6J-12. Lawe Probe. Screen Under Antenna. Great Circle Pattern
16- 0': 0 = 0 ' - d : F - 2.2 GHZI
figure 7.61-13. Large Probe. Screen Under Antenna. Great Circle Panern
I + - 45': 6- 0~-3$0~: F - 2.2GHZ)
7.6.J-10

I r 3.6 061 GAIN
Figure 7 . 6 ~ 4 . Large Pmbe. Screen under Antennq Greai Circle Pattern
I+-98: e; 0°-wo600, F - zz GHZ)
6. LARGE PROBE, SCREEN UNDER ANTENNA WITH SWIVEL
As the probe i s descending to the surface of Venus, a parachute i s
released following blackout (approximately 70 km above the surface of
Venus). The parachute will have a metal swivel a s shown in Figure 7 . 6 J - 3 .
Since the swivel i s metal and i s only 26 inches from the antenna and on the
centerline, a test was conducted to determine its effect on the antenna pat-
tern, The pattern shows that the on-axis gain was reduced to 4. 1 dBi. A
summary of the patterns i s shown in Column F of the table. The 0-dBi
and 1 -dBi gain beamwidths were reduced slightly from those without the
swivel. It i s apparent that a metal swivel will not be of much consequence
in meeting the ripple and gain requirements of Figure 7. 6J-2 .
7. CONCLUSIONS
An open cavity directly under the turnstilelcone antenna was shown
to appreciably degrade the antenna pattern by narrowing the HPBW. A
metal parachute canister had a slight effect on the beamwidth; however,
the cavity under the antenna swamped out this effect. A metal screen was
constructed over the cavity and under the antenna choke to eliminate the

pattern degradation. This corrective measure was adequate to meet the
mission requirements (Figure 7 . 6 J - 2 ) with the turnstiiefcone antenna.
Tests also indicated that a metal swivel on centerline of the probe
antenna (see Figure 7 .6J -3) has the effect of lowering the on-axis gain
( - 1 . 5 dB), and slightly affecting the beamwidths. No attempt was made to
optimize the antenna performance. However, these preliminary test data
verify that the antenna gain requiretnents can still be met with a swivel.
All test configurations were tested with a 180-degree antenna radome open-
ing and no radome simulation (free space).
An Atlas/Centaur antenna test program, for both large and small
probes, i s currently underway. The data obtained fi.'om the ThorfDelta
configuration proved applicable to the design of the Atlas /Centaur probes,
e. g. , the use of a metal ground plane to cbver the cavity under the antenna.
The Atlasfcentaur testing will be extended to include the foliodng areas:
Radome opening (minimum radome size)
*Radome losses (ablator and stiffners)
*Optimizing antenna pattern on probe bodies.

APPENDIX 7.6L
TRADEOFF ANALYSIS O F ONE-WAY VERSUS
TWO-WAY DOPPLER TRACKING
HARDWARE IMPLEMENTATION
1. Introduction
2. Alternative Equipment Approaches
3 . Comparison of Systems
4. Conclusions
5. Recommendations

APPENDIX 7.6L
TRADEOFF ANALYSIS OF ONE-WAY VERSUS TWO-WAY DOPPLER TRACKING HARDWARE IMPLEMENTATION
1 . INTRODUCTION
System modeling of one-way and two-way l inks between a P ioneer Venus
descent probe and the DSN has been presented i n Appendices 7.6A and 7.6B.
Detail t racking accuracy requi rements and compar i sons have not been ad -
d re s sed i n this appendix; r a the r we d iscuss the probe hardware implications,
the impact on the DSN, the r i sk and effect on the t e l eme t ry channels, plus
acquisition and t racking implications of one-way and two-way links for the
l a rge and sma l l probes .
1 . 1 Tracking P rob lem
Tracking the probes during descent through the a tmosphere may allow
observation and measu remen t of wind s h e a r effects. Measurement of the
received downlink c a r r i e r f requency can yield range r a t e f r o m a single s i te
and tangential velocity with DLBI techniques using dual s i tes . Both one-way
and two-way l inks a r e considered a s viable options for obtaining Doppler
measu remen t s ; however f r o m a cos t standpoint one m u s t consider the capa-
bility of the DSN to handle the number and type of links postulated. Tracking
accurac ies a r e a s s e s s e d i n Section 3 . 2 of this repor t .
1 . 2 Requirements
Basic requi rements a r e : (1) to provide s o m e m e a s u r e of Doppler to
a s s e s s wind s h e a r a s the probes descend to the planet surface: (2) to p r o -
vide downlink te lemet ry f r o m each of the p robes during the descent phase;
( 3 ) to provide capabil i t ies of performing both Doppler measurement and
te lemet ry for a min imum of two p robes and one bus simultaneously for a
s taggered t ime a r r i v a l of probes a t the planet; and (4) alternatively, con-
s ide r providing Doppler measu remen t and te lemet ry for four probe s and
one bus simultaneously f o r a near ly simultaneous a r r i v a l of probes a t the
planet.

2. ALTERNATIVE EQUIPMENT APPROACHES
Assuming that a l l five vehicles were required to operate in a two-way
mode simultaneously with standard DSN frequency translation ra t ios , and
that rea l - t ime (on-line) processing of two-way Doppler were required, the
DSN would need five rece ivers , five uplink channels, and five Doppler
ex t rac tors to handle the tracking. These requirements c rea te a significant
DSN cos t impact for single station coverage o r even for dual station coverage
where five uplinks a r e concerned. Therefore, other a l ternat ives were con-
sidered. These include: ( 1 ) the two-way coherent S-band approach cur rent ly
implemented by the DSN; (2) an alternative two-way Doppler configuration;
( 3 ) a one-way Doppler approach and; (4) a mixture of one-way and two-way
links. Spacecraft equipment and DSN hardware/software a r e described
f o r each of the four approaches. Fur ther , a s taggered probe a r r iva l t ime
concept i s considered where a maximum of two probes and one bus a r e
t racked simultaneously.
2. 1 Spacecraft Equipment Configurations
The standard two-way DSN sys tem is the f i r s t approach considered
because i t i s current ly operational. A s imi l a r technique, where five
simultaneous two-way links a r e required, is to develop a s e t of t ransponders
with close, but unique, frequency turnaround rat ios so that a single uplink
could s e r v e multiple probes at different downlink frequencies. The one-way
Doppler technique uses the t ransmi t te r portion of a transponder a s the
frequency source with stability and accuracy provided by i t s internal
osci l la tor o r a n ul t ra-s table external oscillator.
2. 1. 1 DSN Transponder Approach
An S -band transponder, compatible with the DSN, provides a two-way
Doppler coherence by deriving the t ransmi t te r reference frequency f r o m a
source phase-locked to the received c a r r i e r s o that the t ransmit- to-receive 2 40 frequency ratio i s fixed a t -. Frequencies fo r local osci l la tors and in t e r - 221
mediate rece iver s tages have been selected and tested for minimum i n t e r -
fe rence and spurious signal generation. P resen t ground equipment and soft-
w a r e a r e compatible with this operation a s discussed l a t e r . The t ransponder
block diagrams Figures 7.6L-1 and 7.6L-2 show frequencies in various
p a r t s of the unit. Note that a l l mixer frequencies a r e multiples of the VCO

i = VCO FREQUENCY ' WHEN TRACKING SIGNAL THE INPUT SIGNAL
0
Figure 7.k-1. Functional DialramS-Band Receiver Pation of Transponder
c o H r a f r u r / r r o N COHER~NT M O D E CONTROL F R W 573.7 MHz REC MI SlAdLt OSCILLATC4 "'-
d FROM RECEIVER OR STALE O S C I I L A l M I
TLM l N P U 1
FiQure 7.61-2. Functional Diagram S-Band TranrrninerlDriver Portion 01 T r a n ~ n d w
frequency which is - t imes the received frequency. This frequency i s 221 doubled and sent to the t r ansmi t t e r a s a frequency source for the X60 multi-
p l ie r chain. The stabil i ty of this reference signal i s derived f r o m the
stability of the ground t r ansmi t t e r signal, which is t racked by the rece iver
phase lock loop.
2. 1.2 New Transponder Ratio Approach
All of the probes could operate with a single uplink c a r r i e r and dif-
f e r e n t downlink frequencies i f the probe t ransponders had different f r e - quency rat ios , a l l c lose in magnitude to the DSN rat io of - 240 The numerator 221. i n each ratio must be a multiple of powers of 2, 3 , and/or 5 to e a s e design
of the t r ansmi t t e r multiplier chain. The denominator mainly affects the

design of the r ece ive r phase-lock loops where mixer f requencies mus t be
chosen to minimize image frequency and intermodulation effects. Some 25 64 162 360 400
ra t ios to be considered a r e 149' 331' and - 369'
Th i s approach ca l l s for each probe to he equipped with a t ransponder
having a unique r a t i o s o that one uplink c a r r i e r would se rv i ce a l l the probes
to c r e a t e four unique downlink frequencies. F o r example, if the uplink i s 64 .
DSN channel 22b a t 21 16. 04 MHz, a t ransponder ra t io of -yields a dr~wnlinl< 5 9
a t 2295. 37 MHz c lose to PSN channel 1 5 a . Whether this r a t i o i s p rac t ica l
f r o m a design standpoint can only be proven by an extensive analysis with
breadboarding of the c i rcu i t s .
The chief drawback of this approach i s the need f o r a t ransponder
development p r o g r a m for each probe frequency rat io , with a corresponding
ground equipment cost . There i s a corresponding development cost f o r the
ground receiving and Doppler extraction for each downlink.
2. 1 .3 One -Way Doppler Approach . .
One-way Doppler tracking can be achieved by.monitor ing the frequency
of the received downlink c a r r i e r s for each probe. The frequency source for
the probe t r ansmi t t e r i s a n in te rna l o r ex te rna l osci l la tor that replaces the
coherent d r ive s ignal der ived f r o m the r ece ive r VCO i n a . standard DSN-
compatible t ransponder . The long- te rm and s h o r t - t e r m frequency stabil i ty
l imi t s t he Doppler data accu racy and the f o r m e r can grea t ly influence the
signal acquisit ion t ime a s discussed la te r . This approach requi res no
t ransponder modification i f a n external stable osc i l l a tor having a long- te rm
stabil i ty of - $4 pa r t s i n lo7 o r be t te r i s used. The a l te rna t ive i s to modify
the in te rna l osci l la tor t o improve stability. F o r example, the Viking t r a n s -
ponder in te rna l osci l la tor has a stability of - + I . 5 p a r t s i n l o5 and would
requi re modification to reduce the one-way link acquisit ion t ime as shown
la te r . Addition of t empera tu re compensation c i r cu i t ry should improve 6
stahil i ty to about two p a r t s i n 10 over t he anticipated tempera ture range.
A control led- temperature oven for the osci l la tor c r y s t a l with both a hea te r
f o r init ial warmup and a phase-change heat sink ma te r i a l fo r p rec i se
tempera ture control offers stabil i ty exceeding 1 p a r t i n lo7 f o r a n external
osci l la tor . Osci l la tor development and tes t ing r ep re sen t s the only significant
i n c r e a s e i n cos t f o r one-way Doppler tracking. Unlike the development cos t s
f o r the two-way t ransponders with new frequency t ranslat ion ra t ios , a single

equipment development effor t suffices f o r the s e t of probes . No change i s
needed in the t ransmi t te r for one-way Doppler except f o r the oscil lator
c i rcu i t o r the u s e of a n ex te rna l oscil lator.
2. 2 DSN Equipment for Doppler Tracking
Equipment configurations and associated software a r e reviewed for
operation with the one -way and two-way Doppler approaches. The p re sen t
S-band equipment i n DSN stations i s reviewed a s a baseline, and equipment
changes for the two other Doppler approaches a r e discussed.
2. 2. 1 Two-Way Doppler Extraction
In the sys t em implemented i n the DSN the Doppler ex t rac tor compares 240
the downlink frequency with the t ransmi t te r frequency multiplied by - 22 1' The difference, which i s the Doppler frequency plus var ious e r r o r s , i s
mixed with a bias frequency to eliminate negative values before recording
and processing. The r ece ive r i s designed to avoid spurious signals a t low
signal levels that might be confused with valid c a r r i e r s . All exci ter and
local osci l la tor f requencies a r e synthesized f rom a common atomic m a s t e r 12
osci l la tor with a stabil i ty of I pa r t i n 10 . Doppler processing software
240 ratio. i n the DSN i s a r ranged with constants re la ted to the - 221
If two-way Doppler with this ratio i s used, no additional hardware
o r software i s needed for any single link. However, each 64-meter s i te i s
l imited a t p re sen t to two uplinks, f ive receiving channels, and three Doppler
ex t r ac to r s , so that only two of the five vehicles could be t racked p e r 64-
m e t e r station, assuming a n adequate signal-to-noise ra t io (SNR) i n the
uplinks. If one includes the 26-meter net, a total of three vehicles could
be handled a t one si te. To monitor a l l four probes ?lus the bus s imultan-
eously, one of the two DSN stations would have t o t r ansmi t and receive
on th ree frequencies while the other would need to t r ansmi t and receive on
a t l ea s t two frequencies . IIowever, because the probe uplinks requi re a t
l eas t a 20 dB nominal tracking loop SNR for good downlink te lemetry, i t i s
des i rab le to u s e a t l e a s t 100 kW on each probe uplink. Therefore , only 2
uplinks a r e available to the probes , one a t each 64-meter station. This
power could be reduced to 40 kW to be compatible with the Goldstone station
with some added downlink r i sk and degradation. Thus, with two-station
coverage, assuming two 40 k W probe uplinks a t Goldstone, a 100 kW

64-meter uplink f r o m Canberra and a 26-meter net t ransmi t te r for the bus
uplink one would sti l l be capable of handling only four two-way links s imul-
taneously. Moreover, if a station t ransmi t te r fa i ls , the available probe
uplinks a r e reduced to one o r a t most two i f Goldstone is transmitting in a
dual mode. Thus even for a s taggered a r r iva l mission there i s a possibility
that only one probe and one bus uplink would be available.
2 .2.2 Ground Equipment for New Frequency Ratios
The alternative coherent Doppler approach, where different frequency
rat ios a r e used for each probe, can be implemented for non-real- t ime
Doppler measurement without additional receiving equipment. In this
approach the ground rece ivers t rack the c a r r i e r s in a normal manner for
te lemetry demodulation, but the coherent c a r r i e r signal can be down-con-
.verted to the passband of instrumentation recorders for s torage and off-line
frequency measurement , obviating the need for generating signals f r o m the
ground t ransmi t te r a t p rec i se ra t ios to the uplink c a r r i e r . The ground
configuration requires rece ivers , recorder channels, and frequency syn-
thes i ze r s for each probe downlink. The signals may a lso be recovered
f r o m predetection r ecorde r s for two-way Doppler measurement a t some
reduction i n accuracy.
The single DSN uplink to al l probes establishes the frequency reference
and stability fo r a l l downlinks. These pa ramete r s a r e expected to equal the 12
1 p a r t in 10 stability performance of the equipment present ly installed a t
the DSN.
2. 2. 3 One-Way Doppler DSN Implementation
Receiving and processing of one-way Doppler data can be s imi lar to
the approach described above f o r new frequency ratios. Ground rece ivers
shift the received frequencies t o t h e passbands of instrumentation r ecorde r s
for predetection s torage and off-line processing. Unlike ei ther two-way
technique, the DSN has no control over the frequency of the downlink. Use
of a single atomic frequency source a t the receiving site effectively e l imi-
nates ground e r r o r s i n measuring frequency. The recorded frequency
t ime his tory contains the Doppler shift plus any variations in the probe t r ans - mit t e r frequency. These t ransmi t te r variations a r e partially correctable

by use of probe te lemet ry records and prefl ight calibration of t r ansmi t t e r
frequency variation a s a function of t empera tu re and vibration. Residual
uncertainties in frequency will appear a s e r r o r s in Doppler.
2. 2 .4 A Mix of One -Way and Two-Way Doppler Links
The selected approach for the p re fe r r ed configurations u ses the 400
standard - 221 two-way Doppler for the bus and the la rge probe and uses one- 240
way Doppler for the th ree smal l probes. The DSN implementation for this
a r rangement (assuming simultaneous probe a r r iva l ) u se s the 400 kW Gold-
stone uplink f o r the la rge probe, a 20 kW uplink f r o m a 26-meter station
f o r the bus, four rece ivers a t each of two 64-meter s ta t ions fo r on-line
probe te lemet ry , one r ece ive r a t each of the two 64-meter stations for
open-loop reception of the five downlink signals, which a r e predetection
recorded for off -line processing of Doppler and te lemet ry , and one receiver
and Doppler t r acke r a t each of two 26-meter stations for bus te lemet ry
and tracking.
The DSN ar rangement for the s taggered a r r i v a l i s identical t o the above
except that the on-line bus te lemetry i s received at the 26-meter net, and
two-way Doppler f o r the bus i s extracted a t the 26-meter net. After the
l a s t two probes have entered, on-line te lemet ry reception f o r the bus i s
handled by the 64-meter stations. This a r rangement allows two rece ivers
a t each 64-meter station to operate on-line for each vehicle a s well a s
allowing one r ece ive r a t each 64-meter s ta t ion f o r predetection recording.
3. COMPARISON O F SYSTEMS
This section compares the approaches discussed previously i n t e r m s of
probe subsystem weight and power, DSN compatibility, technical performance,
and relative cos t and complexity. Tracking accurac ies a r e assumed to be
super ior for a two-way link having a high t ransponder loop SNR compared
to a one-way link f o r p rac t ica l probe t r ansmi t t e r osci l la tor stabil i t ies.
3 .1 Weight and Power Requirements
Table 7. 6L-1 compares probe hardware weight and power for one-way
and two-way Doppler t racking, including the rece iver , diplexer, and stable
oscil lator. The t ransponders a r e assumed to be identical in s ize and weight

Table 7 .6L-1. Power and Weight Comparison
f o r both two-way approaches. Also, the t ransmi t te r d r iver for one-way
Doppler i s identical to the t ransmi t t ing segment of the l a rge probe t r a n s -
ponder with e i ther a s table ex te rna l oscil lator or an internal frequency
source. The external osci l la tor i s assumed to have both tempera ture
compensation c i rcu i t ry and a n enclosed c rys ta l oven with both a heater and
phase-change ma te r i a l to minimize tempera ture e f fec t s on frequency
stability. The two-way link weight and power exceed that of the one-way
link by 1.7 kg ( 3 . 75 lb) and 1. 3 W.
3 . 2 Range Rate Measurement Accuracy
Range r a t e measurement accuracy i s influenced by such factors a s
rece iver t he rma l noise, osci l la tor noise, quantization e r r o r , and c a r r i e r
frequency and i s significantly different f o r one-way and two-way Doppler.
The effect of this uncer ta inty on one-way Doppler is shown by the following:
where A f i s the e r r o r i n Doppler frequency, fd, due to a change, A ft, f r o m d
the nominal t r ansmi t t e r frequency, ft.
Also, fi i s the radial velocity, and C
i s the speed of light. The computation of R uses the nominal instead of the
t rue value of f result ing i n a range r a t e e r r o r , A R, proportional to A f t ' d and R.

In a two-way Doppler s y s t e m with turnaround r a t io G, the e r r o r A R 2 i s
R AR = Z G - A f 2 . f t t
In a two-way Doppler s y s t e m , the instabil i ty i s expected to be approxi-
mate ly 1 par t in lo", compared t o 4 pa r t s i n lo7 f o r one-way Doppler.
F igure 7. 6L-3 i s a plot of range r a t e e r r o r a s a function of osci l la tor
instabil i ty (assuming no other e r r o r s ) f o r range r a t e s represen ta t ive of
p reen t ry and parachute descent. The e r r o r , l e s s than 10 m m / s , i s negli-
gible for the two-way Doppler s y s t e m (1 p a r t i n lo1') and within the des i red
range f o r one-way Doppler with an osci l la tor stabil i ty bet ter than i 4 p a r t s - f
i n 10 . A s will be shown below, the oscil lator requi rements a r e equally
s t r ingent f o r acquisition.
ux, '"[I
OSCILLATOR FREQUENCY STABILITY OR UNCERTAINTY + PARTS
Figure 7.61-3. Range Rate Mesuremsnt Errws Due to Uncertainty i n Transmitter Frequency hr O n e W q Doppler
3. 3 Acquisition Comparison
The p roces s of acquisit ion r equ i r e s the s e a r c h f o r , detection of, and
lock-on of the received signal. F o r two-way Doppler, both the probe and
DSN rece ive r s mus t p e r f o r m this operation.
3 . 3. 1 One -Way Doppler Acquisition
The t ime required f o r acquisit ion i s a function of the s e a r c h bandwidth
and the rece iver SNR. The s i ze of the s e a r c h band i s determined by the

uncertaint ies i n t r ansmi t t e r frequency and i n Doppler frequency. System
pa rame te r s determine the available SNR, which de termines the allowable
f requency sweep ra te for the rece iver t o lock on the signal. The maximum
lock-on sweep ra te , f f o r a 90% probability of acquisition i s ( s ee p. 49 max
of Phaselock Techniques by F. M. Gardner , New York, Wiley, 1966):
where:
f = max sweep r a t e (HzIs ) max
d = 0.04 for 0.707 damping
SNRL = Signal-to-noise ra t io in 2 B (double-sided loop noise bandwidth)
L
a = Limi ter suppression factor
a = Threshold l imi t e r suppression factor 0
w = Loop natural frequency a t threshold no
In the DSN Block IV rece iver the ratio of a / a o = 4 f o r a s t rong signal
(1 3 d B i n 2BLO) and w = 10 f o r the 10 Hz loop. Therefore . the maximum no
sweep r a t e for acquisition is 38 H z l s fo r the 10 Hz loop. The signal-to-noise
ra t io fo r the 30 Hz loop is sufficient to allow a sweep r a t e of 150 Hzls .
F igure 7.6L-4 shows the time needed fo r c a r r i e r acquisition of a one-
way downlink for various Doppler uncertainties a s a function of c a r r i e r
frequency stabil i ty for 90 percent probability of acquisition. The range r a t e
used h e r e i s for p reen t ry conditions where the t r ansmi t t e r operates fo r 10
minutes. I t i s expected that a maximum of 100 seconds should be allotted
to c a r r i e r acquisition to allow sufficient t ime to determine that the link i s
operable p r i o r to probe entry. This t ime constraint suggests an oscil lator 7
stabil i ty of - f 4 pa r t s i n 10 f o r a Doppler predict accuracy of - t 1 percent and
u s e of the 10 H z loop. F o r the 30 Hz loop and a - t 1 percent Doppler predict 6
accuracy one could use a n osci l la tor having a stabil i ty of - f 3 p a r t s i n 10 . U s e of the 10 Hz loop and Doppler predict of - $2.5 percent will not allow a
full acquisition sweep i n the t ime allocated. Doppler profiles a r e shown
i n Section 4. 2 of the technical volume.

#'
1 2.5=,, DOPPLER PliEDlCT - -_-___------- : 1.090 DOPPLER PREDICI --.I ____---- 1 2 . 5 %
lo-' lo-5 PEAK PEAK PROBE OSCILLATC$ FREQUENCY STABILITY
Figure 7.614. Search Period lor PC% Probability of Acquisition Versus Peak to Peak Frequency Stability of Oscillator 101 OneWay Link
3. 3 . 2 - Two-way Doppler Acquisition
F o r two -way Doppler acquisition two alternative approaches a r e
available fo r locking the uplink: (1) pe r fo rm a f r e q u e n c y sea rch i n the
transponder: o r (2) r amp the ground t ransmi t te r frequency through the
receiver frequency uncertainty band and re turn i t to the est imate of best
lock frequency.
The lowest cost approach would dictate use of ground t ransmi t te r
ramping. However, s ince the probe a r r i v a l t ime uncertainty i s approxi-
mately two minutes, post-entry uplink ramping of the t ransmi t te r would
be required to continue pas t the nominal entry time. At any reasonable
uplink ramping rate the downlink rece iver could not acquire, therefore
one could lose a few minutes of data immediately af ter entry unless it
could be recovered f r o m predetection tapes. When the uplink frequency
s e a r c h i s performed by the transponder the acquisition can be accomplished
within a few seconds af te r blackout and the re i s no ramping of the downlink
a s a resul t of uplink search . The transponder sea rch circui ty i s a n added
cost and there i s m o r e chance of self lock up with this method (locking to a
spurious signal).

Time required to p e r f o r m uplink acquisit ion, a f t e r probe entry, i s
shown i n Table 7. 6L-2 for var ious values of Doppler uncer ta inty predict
and r ece ive r loca l osci l la tor stabil i ty using a 10 k H z / s t r ansmi t frequency
r a m p a t the DSN station. F o r oscil lator s tabi l i t ies of a t l e a s t - tl p a r t in 6
10 the r amp ra te can be reduced to 1 k H z / s and s t i l l acqui re i n approxi-
mate ly 10 seconds, which i s insignificant compared t o the two minutes of
ramping required due t o t i m e uncertainty.
7. 6L-2. Uplink and Downlink Acquisition T imes
F o r downlink acquisition i t i s in te res t ing to note ( in Table 7. 6L-2) that
the downlink acquisit ion t ime f o r a one-way link becomes l e s s than for a
two-way because the one-way oscil lator f requency uncer ta inty i s reduced.
This i s due to the reduced uncer ta inty i n one-way Doppler predicts ve r sus
two-way Doppler predicts . The 30 Hz DSN tracking loop i s assumed to be
used for ini t ia l acquisition.
LOCKED ( i1.0%) 2.5 (f I IN 10'1 .Old 2.55 10- 0.255 5 33.3 129
3.4 - Telemet ry Pe r fo rmance
Te leme t ry per formance of the two-way link i s expected to be compar -
able to the one-way link (within a few tenths of a dB) provided the re a r e no
uplink anomalies such a s a noisy rece iver o r intermit tent l o s s of uplink
lock ( s e e Appendix 7. 6A and the design control tables) . However, during
the uplink acquisition phase, some lo s s of data may occur when ramping
the ground t r ansmi t t e r through the t ransponder rece ive frequency uncertainty
range. Assuming the probe a r r i v e s a t the nominal t ime , and the rece iver ,
a f te r blackout, acqui res the ramped signal, the ramping operation must
ONE-WAY
LOCKED ONE-WAY
NOTE: 'UPLINK SEARCH RATE COULD BE REDUCED TO LESS THAN I KHZ WITHOUT EXCE5llVt UPLINK ACOUISITION TIME
(?2.5%)6.25 I? 1 IN 10') .OM 6.3 10. 0.63
2.55
12.5 6 . 3
17
83.5 12
68
334 168

continue f o r a n additional per iod s ince the l a t e s t a r r i v a l t ime i s about two
minutes la te r . Thus, the downlink frequency is being ramped a t a r a t e
higher than the DSN rece ive r s can track. An al ternat ive approach i s to
begin the uplink ramping a t the nominal plus two minutes t ime s o a s not to
dis lurh thc downlink. However, in real i ty , the downlink will probably not be
acquired in this period anyway unless a s table auxi l iary osci l la tor i s used.
Another, m o r e expensive alternative, i s to equip the t ransponder with an
auto s e a r c h capability s o tha t the uplink signal will b e acquired a lmos t
immediately a f te r blackout ends. This s e a r c h capability i s not present ly
available i n DSN-compatible transponders.
3 . 5 Relative Costs of Technical Approaches
A basic invrstigation of relative c o s t s and technical complexities was
conducted f o r tlie four approaches. Five simultaneous two-way Doppler
measurements using s tandard - 221 ra t ios a r e not present ly pract ical s ince 2 40
i t exceeds the presen t DSN capability; provis ion fo r additional channels
would be expensive. The cos t of t ransponders with different receive/
t r ansmi t ra t ios would be prohibitive. The c o s t of implementing an auto-
matic s e a r c h capability i n the transponder f o r a two-way link i s more
expensive than a ground t ransmi t te r ramping operation. One -way l inks
possibly requi re development of an u l t ra -s tab le osci l la tor for the probes ,
but do not require diplexers o r rece ivers , hence they would be l e a s t e x -
pensive i n probe hardware (especially s ince some probes mus t be imp le -
mented with one-way l inks due to lack of sufficient DSN uplink capability).
Predetect ion recording m u s t be implemented a t the DSN regard less of
which approach i s chosen; therefore i t does not e n t e r into the cost tradeoff.
Doppler data processing is required for a l l approaches and therefore i t does
not impact the cos t tradeoff.
A two-way link for the la rge probe and one-way l inks f o r the smal l
probes would inc rease the hardware cos t s of the l a rge probe over that of
a one-way link, but would provide a two-way Doppler capability for the
more highly inst rumented l a rge probe, which may be desirable . However,
one-way links for a l l probes would appear to be the mos t cost-effective
approach.

4. CONCLUSIONS
F o r one-way links i t i s des i r ab le to have probe osci l la tor long- te rm
stability equal to o r bet ter than - +4 p a r t s in lo7 to provide l e s s than a - +10
m m / s source of e r r o r due t o frequency uncertainty. In addition, this
stability will allow c a r r i e r acquisit ion t ime at the DSN t o be equal to o r
l e s s than 100 seconds, assuming one sweep using the 10 Hz loop and a
Doppler predict accuracy of +1 percent during the t ransmiss ion period.
F o r a two-way link, a frequency sea rch performed by the probe
transponder could provide m o r e rapid acquisition than the ground t r a n s -
mi t te r frequency r amp method. However, the rece iver au to-search
capability i s a n added expense and possible source of self-lock up o r
other fa i lure mode. The ground t r ansmi t t e r frequency ramping method
may cause lo s s of s e v e r a l minutes of post-entry data af ter blackout.
Table 7. 6L-2 shows that if lock up of the uplink does not occur, the
one-way downlink acquisition t ime is excessive f o r transponder auxiliary
osci l la tor stabil i t ies of - +l . 5 p a r t s i n lo5 cur ren t ly used i n the existing
Viking transponder. I t i s therefore desirable to have a more stable 6
auxi l iary osci l la tor , such a s +2 p a r t s i n 10 . At l eas t some one-way links must be used to be compatible with the
DSN limitation of available uplink channels unless nonstandard turnaround
frequency rat ios a r e used, and the l a t t e r i s too expensive to consider
ser iously. . i r i : . ..
A one-way link provides a saving i n the large-?pr.obe. of -1.7 kg (3.75.1b)
and 1. 3 watts over a two-way link due to the [email protected] of+ stable osc i l - . ,
l a to r f o r a receiver , diplexer, and s o m e additional, s+bling for the la t te r
two components.
In the case of sequential of s taggered a r r i v a l of the probes a t the
planet, each probe, when ar r iv ing in groups of two with no overlap between
groups, may be supported by two rece ivers (and two operators) i n an on-
l ine mode a t each 64-meter station, a s opposed to a single on-line receiver
fo r each probe a t each station when simultaneous a r r iva l i s selected. Having
two opera tors and two rece ive r s fo r each probe will reduce the downlink
acquisition t ime to a minimum and will provide online redundancy all the
way through the DSN hardware s t r ing if one des i res ( subca r r i e r demod, e tc . ) .

5. RECOMMENDATIONS
F r o m the communications standpoint i t i s recommended that sequential
o r s taggered probe a r r i v a l t imes be used to allow dual on-line r ece ive r
coverage of each probe a t each of two DSN stations, such a s Goldstone and
Canberra .
It is recommended that the bus be supported by the 26-meter stations
u n t i l all probes have completed the post-entry link acquisition phase a f te r
which the 64-meter r e t can acquire the bus for the bus entry.
All sma l l probes should be equipped f o r one -way l inks using a s table
oscil lator. It i s des i rab le that the osci l la tor have long-term stability equal
to o r bet ter than - +4 pa r t s i n lo7 to reduce acquisition t ime and minimize
range ra te measurement e r r o r ; however to save hardware cost the stability h may be degraded to the o r d e r of - +2 p a r t s i n 10 and depend upon using the
30 Hz loop l o r ini t ia l acquisition. Fu r the r cos t ve r sus performance evalu-
ation i s required before a final specification c a n b e recommended.
The l a rge probe should be equipped f o r two-way link operation only
if absolutely necessary to obtain the ul t imate i n tracking accuracy because
i t i s both m o r e expensive in equipment, tes t ing, and operations, and m o r e
subject to equipment and operations malfunctions than the one-way link.
Te lemet ry performance for e i ther one-way o r two-way operation i s e x -
pected to be comparable ( a f t e r uplink acquisit ion) due to the strong uplink
signal; however, during uplink acquisition one can expect some lo s s of
data. Therefore u se of a two-way link is, i n a s ense , trading tracking
per formance f o r t e lemet ry performance and t h e r e i s some doubt a s to the
need for the improved tracking performance.

APPENDIX 7.6M
PROBE TELECOMMUNICATIONS DESIGN
CONTROL TABLES, ATLASICENTAUR MISSION
1978 ARRIVAL

APPENDIX 7.6M
PROBE TELECOMMUNICATIONS DESIGN CONTROL TABLES, ATLAS /CENTAUR MISSION, 1978 ARRIVAL
Telecommunication design control tables a r e provided h e r e f o r the
l a rge and sma l l p robes f o r the AtlasjCentaur configuration, including bit
r a t e s for Version IV of the science payload.
The l a rge probe link i s two-way Doppler with PSK/PM modulation on
the downlink a t 128 bps. The sma l l probe link i s one -way Doppler with PSK/
PM modulation a t 64 bps. Six downlink tables (Tables 7.6M-1 through
7. 6M-6) a r e provided, th ree for each probe type a t altitudes above Venus
surface of zero , 30, and 70 km. The la rge probe uplink i s unmodulated and
i s used solely to provide the two-way Doppler signal. Table 7. 6M-7 i s
included fo r the l a r g e probe uplink a t 70 km only. Explanation of the table
en t r ies a r e provided i n notes on the tables and the following paragraphs.
Table 7. 6M-8 summar izes the margins fo r a l l downlinks. The sys tems
a r e designed fo r a margin equal o r g rea t e r than the "Sum of Adverse To le r -
ances . " Also shown a r e the s u m of the adverse to le rances , RSS of the a d -
v e r s e tolerances and antenna gain tolerance plus RSS of a l l o ther tolerances.
In addition, the margin over the values for the three methods of combining
tolerances a r e given. Because of the "one t ime only" nature of the probe
en t r ies and the many uncertaint ies of the link pa rame te r s relating to the
Venus atmosphere, the "Sum of Adverse Tolerances ' ' i s the safes t and most
conservative way to design the link. However, i t does require a lmost 3 dB
m o r e radiated power than an RSS o r combined RSS plus s u m of selected
tolerances, and final performance requirements together with a detailed
cos t analysis could lead to select ion of a l e s s expensive, but higher r isk
design. The reason fo r selection of the antenna tolerance, a s a n example,
to be added to the RSS of a l l other values i s the high probability of antenna
gain variation due to the vehicle rotation and some uncertainty a s to winds
that may t ip the probe fo r severa l seconds.

Table 7. 6M-1. Telecommunications Design Control Table , Atlas /Centaur L a r g e Probe , Near Venus Surface
NO.
2
3
4 5
6
7
8
9
10
11
I 2
13
14
I5 I 6
17
I 8
I9
20 21
?Z
23
NOTE:
I I TOTAL TRANSMITTING QOMR @MI) 34 W I r l . 6 I 0.8 I VaTAGE h T E M
PARAMETER
2. 1.0 DM PREDETECTION RECORDING LOSS t 0.5 OD DOWNLINK SUPPI(ESS1ON 6 DOWLER EFFECTS I N ITEM IS.
3. 1.0 0 1 PREDETECTION RECORDING LOSS r 3.8 DD NOlSV CARRIER 6 FADING t 1.2 D8 W8CARRIER 6 WWLER.
4. K = 32. RATE in CONVOL~TIONAL CODING. FRAME DELETION RATE 10- l .
TRANSMITTING CIRCUIT LOSS (08)
TRANSMlllING ANTENNA GAIN (DO) 8 = 5 d
COMMUNICATIONS PANGE LOSS (DO) 0.43 AU ATMOSRlEMC bASORPTION 6 DEFXUSING LOSSES 108)
POLARIZATION LOS5ID81
MULTIPATH 6 OfnER LOSYS 0 8 ) RECEIVING ANTENNA GAIN IDBI
RECEIVING CIRCUIT LOSS 0 8 )
NET LOSS (D1) @+h4+5d+7+8+9)
TOTAL RECEIVED POWER 0DM) 11+10)
RECEIVER NMSE SPECTRAL DENSIN - (D8hVHZ)
TOTAL RECEIVED P O ~ R ~ * O (olm/nz) 01-121
CAIUIIR TRACKING
CARRIER MWWnOTAL (DBI
ADDITIONAL CAlalER LOSSES (Dl)
THRESHOLD T M C l N G BANDWIDM - 2SL0 1011) MQUlPID Wll (DI1
PERFORhUNCE MARGIN 0 8 ) 113* l4 r l5~6- l7 )
DATA CHANNEL
DATA POWVlOTAL (DBI
ADolTlON4l DATA CHANNEL LOSSES (DB) DATA 011 RATE - BPS (DO)
lURESHOLD ENEKGY PER DATA 811 - E p q ID81
PERFORMANCE MARGIN (DB) (13tl9+2P2l-22l
I. hWLTIPATH INCLUDEDIN 15 &lOBELOW.
N O M I N U VALUt
- 1.6
+ 3.5
-255.9 - 0.9
- 0.2
SEE NOTE I
+ 61.7
0.0 -153.4
-147.8
-1lY.5
r 36.7
- 5.4
- 1.5
1 10.0
+ 13.0
4 6.8
- 1.5
- 6.0
4 21.1
+ 2.3
4 5.8
ADVERSE TOLERANCI NOTES
0.4
1.5
0.0 0.1
0.1
0.4
0.0
2.5
3.3 1.4
SUM 4.7
0.4
0.1
0.8
0.0
SUM 6.1
0.2
0.5
0.0
0.0
SUM 5.4
G l l N VARJATION
JPL 8 I P 5
JPl 81PS
15.52 9.5%
NOTE1
NOTE 3 128 BPS
NOTE 4

Table 7. h M - 2 . Telecommunications Design Control Table, Atlas /Centaur Large Probe , 30-KM Altitude
DATA WWUVTOlAt (D8)
ADDITIONM DATA CHANNEL LOSSES DO)
NO
I
1
3 4
5
6 7
8 9
I 0 11
12
I3
I 4
IS
16 I7
18
111 I DATAIITRATE -BPS p a )
PARMETOI
TOTAL TRANSMI77ING POWER (DIM] 56 W
TRANSMITTING CjllCUlT LO53 IDS)
TRANSMITTING ANTENNA GAIN 0 8 1 COMMUNlCATlOHS RANGE LOSS ID81 A7MOSPWEIIC ABSOllPllON 6 DEFONSING LOSSES (OR1
POLARlZ4TlON LOSS 1081
WLTIPATH &OTHER LOSSESDBI
RECEIVING &NTENN& tA IN(DI1
RECBVING CIKUIT LOSSiO81 NETLOSS 0 8 ) O+34+St6+7*BQ)
TOTM RECEIVED WWER LDBMI (1*101
RECEIVER NOISE S K T U L DENSITY - ( D W H Z I
TOTAL RECEIVED MWFWNO ( D W H Z ] (11-121
CARRIER TUCKING
CARRtER IOWElVTOTAL (DI]
ADDlllONAL C h l l l l t l LOSSES (08)
THIESHOW W K I N G 8ANDWlOTH - WLO 108) R-UIED S N R 108)
PERFO~KEMARUN108I i13+ lh lS-16- l71
DATA CHANNEL
-1w.s
t 37.5 SUM 4.9
N O M I N U VALUE
+ 10.0 13.0
t 7.8 SUM 6.1
ADVERSE TOLERANCE N O T 6
122 1 THRESHolD ENERGY PER DATA Ill - E& 1081 1 + 1.3 1 0.0 I NOTE4 I
I t 15.6 I 0.4 I VOLTAGE LEVEL
" - 13 PERfOlMNCE W I G N(DB1 ll3.I9-IO-Il-ZZl - 7 6 ILLI J 6 1 N O l t 5 I 1.008 W D K I O N RECORDING LOSS + 0 I 0 8 OO*N. lh l SWsslSSlON 6 DOWIER ElfECTS
M L U O I D I N TFM IS .-.... . .~ 2. I .O DO PaEDlCTlON RECWDINGLOSS +2.8 08 NOISY CURLER 8 UFERENCE + 1.2 DO
SLBCARUR coma. 3. MULllVAlH LOSSES INCLUDE0 I N ITEMS I 5 AND 20.
4. K = 32, U T E In CONVOlUl lONAl CODING. F a M DELETION RATE lo-'.

Table 7. 6M-3. Telecommunications Design Control Table, Atlas /Centaur L a r g e Probe , 70 -KM Altitude
NOTES: I. 1.0 OBPREDETECTION RECORDING LOSS t 0.1 08 DOWNLINK SUPPRESSION & DOPPLER EFFECTS INCLUDED I N ITEM 15.
2. 1.0DBPREOETECTION RECORDING LOSS t 2.2 D.NOlSY CARRIER &FADING + I.? 08 SUbCARRIER & DOPRER LOSSES. -
3. INCLUDES 0.4 DB LOSS FOR PAVACHUTE CONTAINER.
4. MULnPATH LOSSES INCLUDED I N ITEMS lSAND20.
NOTES
VOLTAGE LNEL NOTE 3
B=SO'* 15'
0.41 A"-
J R 810-5
JPL 810-5
2 5 . P ~ 9.5'~
NOTE I
NOTE2
128 WS NOTE5
,
5. K - 32. KATE In CONVOLUTIONAL COWNG. F W DELETION BATE 10-'
NO.
I 2
3
1
5
6 7
8 9
10
II
12
13
14
I 5
16 17
(8
I9
.20
21
22
i 23
NOMINM VALUE
+ 45.6 - 2.0
+ 3.5
-255.9
- 0.1 - 0.2
SEE NOTE 4 + 61.7
0.0
-193.0
-147.1
-184.5
+ 17.1
- 5.4
- 1 .I
+ 10.0
+ 13.0 + 7.4
. 1.5
- 4.4
121 .1
2.3
+ 7.8
PARAMETER
TOTAL rRANSMlTTlNG POWER (DBM) 36W
TRANSMITTING CIRCUIT LOSS 1081
TRANSMlTTlNG ANTENNA GAIN (DD COMMUNICATIONS RANGE LOSS (DBI
PITMOSPHERIC A0SORPTION & DEFOCUSING LOSSES (OBI
PUARIZATION LOSS 108) MULTIPATH LOTHER LOSSES (DO
RECEIVING ANTENNA GAIN lD81
RECEIVING CIRCUIT LOSS (08)
NET LOSS (D8)(213+4+5+6+7+8+91
r o r a L RECEIVED POWER (DBM)II+IO)
RECEIVER NOISE SPECTRAL DENSITY - (OBM/HZ]
TOTAL RECEIVED P O W E R / N O ( D ~ Z ) l I I - 1 2 )
CARRIER TRACKING
CARRIER POWWOTAL (DM)
ADDITIONAL CARRIER LOSSES (OBI
THRESHOLD TRACKING 8ANDMDTH - aLS (08) REOUIRED SNI ID01
PWORMANCE MARGIN (D~( I3+14+IC l& l l )
DATA CHANNEL
DATA POWWlOTAL (081
ADOlTlONAL DATA CHANNEL LOSSES (D*
DATA 811 RATE - BPS ID81
THRBHOLD ENERGY PER DATA 811 - tb/No (DO)
, PERFORMANCE MARGIN (D8l(ll+l9tlC-21-22)
ADVERSE TOLEWANCE
0.4
0.4
3.0
0.0
0.0
0.0
0.0 0.4
0.0
3.8
4.2
4
SUM 5.6
0.4
0.1 0.8
0.0 SUM 6.9
0.2
0.5
0.0
0.0
SUM 6.3

TOTAL RECEIVED Q O W r a / N O ( D ~ I l l - I21
CARRIfR TUCKING
CARRIER s o m n n o i n L (oar
ADDITIONAL caaa l~a LOSSES IDB) THRESHOLD TRACKING BANDMOTH -BLOID8) REOUIED SNR LOB)
PrRFORMaNCE M~RG!N (~B)ll3*14*15+-16-lr)
DATA CHANNEL
DATA VOWEVlOTAL IDB) AoolTlONAL DATA CHANNEL LOSSES lDBl
DATA BIT aarr - BPS (04
Table 7. 6M-4 . Telecommunications Design Control Table, Atlas /Centaur Small P robe Near Venus Surface
SUM 4.0
0.5
0.2 0.8
0.0
SUM 5.5
NOTES
VOLTAGt 6 TEMI
NOTE 3
A01 OC€G 0.43 AU
JQL 810.5
JQL 810.5
28.5 r 6 . s " ~
NOTE l I
NO. I
2 3
4
5
b
7
B
9
10
I I
12
1 18.1
+ 2.2 NOTF5
+ 5 2 SUM 4.7
.UTOR 6 DOQRER CFKTS
NOMINAL VliLUE
+ 43.0 - 1 .O
t 3.0
-255.9
- 0.9 - 0.2
- SEE + 61.7
0.0 -1P1.3
-1YI.3
- 1 u . 0
PARAMETER
TOTAL lRANSMlTTlNG POWER ( D W 20W
TRANSMITTING CIRCUIT LOSS IDD
TR&NSMllTlNG ANTENNA GAIN (DBl AT 0 = 55'
COhUUJ!4lCAllONS RANGE LOSS f W l
ATMOIPHERIC ABSORPTION 6 DEFOCUSING LOSSES (08)
QOLARIZATION LOSS [DI)
MULTIQATH 6 OTHER LOSSES(D9
RKEIVING ANTENNA GAIN (DO)
RECEIVING CIRCUIT LOSS ID* NET LOSS (D9.l2*344+54+7+BvP)
TOTAL RECEIVED POWR IDEM) 11rl0)
RECEIVER NOISE SPECTRAL DENSIN - IDW'I~Z)
2. 1.0 DBA(EDETECTI0N RECaUNG LOSS + 4.4 D8NOlSY CARRIER 6 FADING + 1.2 DB WBWKi fR h COQKER.
1. INCLUDES O.4DB RAWME LOSS.
4. MULTIQATH LOSSES INCLUDED I N ITEMS I 5 AND 20.
5. 1: = 32, RATE 1VI CONVOLUTIONAL CODING. FRAME DELETION RATE lo1.
ADVERSE TOLERANCE
0.8
0.2
1.S 0.0
0.1
0.1
NOTE 4 - 0.4
0.0
2.3
3.1
0.9

Table 7 . 6M-5. Telecommunications Design Control Table, Atlas /Centaur Small Probe , 30-KM Altitude
TMRESHOLD TUACWNG BANDMDTH - 2 t 0 m) KEQUlED sm 081
PCEFORMWCE MARGIN (04(13+11+15-lbln
DATA CHANNEL
NOTES
VOLTAGE VARIATIO~
NOTE 3 B = 55': 8'
0.43 AU
3PL 8 l e S
J R 8 l P S
28.5: 6.3%
NOTE I
IP 20
21
22 n
NO.
I
2
3
4
S
6 7
8
P
I 0
I I
I2
13
14
IS
+ 1 0 0
+ 11.0
7.0
NWNU VUUE
r 43.0
- 1.0
+ 3.0
-255.9
- 0.1
- 0.2
- %E
+ 61.7
0.0
-1P1.5
-1I9.S -1III.O
t 31.5
- 5.1
- 1.3
PAMETER
r o r n L T R ~ S M I ~ N G s o m a (MM) 2 0 ~
TRANSMITTING CIRCUIT LOSS mn TRANSMIlllNGANTD4NA G U N ID# COMMUNICATIONS RANGE LOSS I D 4
ATMOSFiiEmC b J S W n O N 6 DEFOCUW+GLOSS€S (on
VCiAKlZAllON LOSS ( 0 9
MULTI~ATH 6 0 1 ~ ~ 9 . LOSSES (08)
RECEIMNG ANTENNA GkIN (08) RECElVlNG ClKU17 LOSS (W NET LOSS (D8)(2+3++516+74849I
TOTl l RECEIVED POWR (Dm) ( I t l 0 )
RECEIVER NOISE SVECRAl DENSITY - (M TOTAL RECEIVED m w m o ( ~ 8 w n z 1 (11-82)
CARRIER TRACKING
C A ~ I E R m w r e n o r a ( o n ADDITIONUEARRIER LOSSES ID81
0.8
0.0 SUM 5.7
NOTES I. I . D ~ P ~ ~ D E ~ E C T I O N RECO~UNG LOIS O.~OBOKILLA~R 6 DOIRER EFFECTS.
2. l . O d PREDEIKTION RECORDING LOSS * 3.15 W N M S Y CARRIER &FADING r 1 2 08 SUCARRIEP. 6 cuvna.
3. INCLUDES 0.4 DB RADOME LOSS.
DATA mmwro~u ma) AWITIONU DATA CHbNNEL LOSSES (m) DATA 811 RATE -8PS (DW THRESHOLD ENERGY PER M I A BIT - Po (DO _ PERF~RWNCE MARGIN ID~~II~+I~+X-ZI-~J
ADVERSE TOLERANCE
0.1
0.2
1.3
0.0
0.0
0.0 NOTE 4 -
0.4
0.0
2.9
3.3
0.9 SUM 1.2
0.1 0.2
- 1.6
- 5.4
111.1
t 2.2
. + 1.2
0.1
0.5
0.0
0.0 SUM 4.7
NOTE2
M BPS
NOTE S

Table 7 . hM-6. Telecommunications Design Control Table, Atlas /Centaur Small Probe , 70 -KM Altitude
NO.
I
2
3 4
5
b
7
B P
10
:1
12
I3
L4
IS 16
I 7
I 8
I9
20
21
22
21
NOTES: I N ITEM 15.
2. I.OOBPltDBECTlON IKOf lD ING LOSS + 2.8 D8NOlSY Cl\RRltl 6 FADING r I .? DO SUBCARRIER 6 DOPPLER.
3. INCLUDES 0.4 D8RADOME toll. 4. MULTIPI\TH LOSSES INCLUDED IN ITEMS 15 AND m. 5. n = 32. Rnrr in c o r ~ v o i u n o E u L CODING. CIVIMS DElUON IU\TE 10.'.
NOMNAL VMUE - . . . . . . . . 1 43.0
- 1.0 1 3.0
-2SI.P
- 0. l
- 0.2
-ICE
, 61.7
0.0 - IR .5
-149.5
-184.0
8 38.3
- 5.2
- 1.3 10.0
I11.0 I 1.0
- 1.4
- 5.0
4 18.1
r 2.2
t 7.2
6 DOPRB
PARAMEltR - . . .
TOTAL TRANSMITTING POWR (DOMI MW TRANSMIITIffi ClRCUlT LOIS (DO
TRANSMIITING ANTENNA GAIN (08)
COMMUNICATIONS RANGE LOIS (DO
ATMOIPHtiOC ABIORPTION IL OBOCUIING LOSSES I D
POLAell+rrON LOll(o81
MULTlPdTH 6 OTHER L O l l t S (081
RECIIVING ANTENNA GAIN (OW
IrCElVING ClRCUlT LOSS ID8
NET LOSS (DBll2131415161718191
TOTAL RKEIVEDPOWER (OW1 IIIIO)
RECEIVE^ NOISE SPCCTEAL OCNSITY - ( D m 2 1
1014 RECEIVED POWER/NO (OBMfiZ)IlI-I21
CAPRIER TRACKING
CARRIER POWEIVIOTAL ( 0 8 ADDITIONAL CARRIER LOSSES ID81 THPLIHOLO TCACKING BANDWDTH - 2\0 con REQUIRED SNr(OB1
PER~ORMnNCEMARGlN(0B)(13'1~'15-16-1~ -
DAT& CHANNEL
DATA POWER/TOTAL (DBI
ADDlTlONAL DATA CHANNEL LOIIES ID81
DATA 811 RATE -0PSiDB
rHI(ESH0LD ENERGY PER DATA 317 - v N a (DO PERFORMANCE MARGIN (DB) (II+I9+%21-221
I. l.OD8PR~DETECTIONllKOllOlNG LOSS + O . I D B O K I L U l O ~
ADYERSt TOLERANCE - .
0.4
0.2
3 .1
0 . 0
0.0
0 0
NOTE 4 - 0.4
0 .0
3.7
4.1
0.9
SUM 5.0
0.5
0.2 0.8
0.0 SUM 6 . 5
0.2
0.5
0.0
0.0 SUM 1.7
BFECTS
NOTES
VOLTAGE YIV*IATlOh
NOTE 3
e ssmI 15-
0.43AU
JPL 810.5 JPL 810-5
NOrr I
NOTE 2
M WS
NOTE I
INCLUDED

Table 7.6M-7. A t l a s I C e n t a u r Link Ana lys i s , L a r g e P r o b e Uplink, 70 KM Alt i tude
NOTE: UPLINK ISUSED SOLELY FOR PURPOSE OF PROVIMNGA ?-WAY TURN AROUND DOPPLER SIGNAL
Table 7. 6M-8. Communica t ions Link M a r g i n Study
NOTES
4m KW JPl-810-5
JPL-81&5
0.43 AU
M KM ALlllUDE
0.3 DBMULTIPATH
2SODAN1. IMOREC
250 HZ 2BL0
NO MOOULAIION
O N CARRIER
TMERANCE ADVERSE
0
-0.1
-0.6 0
0
-0.1
IN ITEM I 5
-3.0
-0.4
-4.2
- 1 . 2
10.1
-4 .4
o -0.2
*0,7
0
-5.3
V N U t
1 86.0
- 0.3
i 60.9
-255.3
- 0.1
- 0.3
INCLUDED
r 3.5 - 2.7
-194.3
-1C8.3
-1M.8
r 58.5
o - 0.4
r 24.0
r 20.0
i 14.1
NO.
I
2
3
4
5
A
7
8
9
l o I1
12
I3
1 4
15
l b
17
18
I 9
20
21
22
23
1 . ?ROBE
1. ALTITUDE(KMI
3. CARRlERORDATACHANNEL
4. MARGIN OVER NOMINAL
5. SUMOFADVERSETOLERANCES 6. RSS TOLERANCES
7. I1 ALL RSS
8. 2lALLEXCEPTANTfNNAGAlN (ADD ANTENNA G Y N TO PSI OF ALL OTHERS)
9. MARGlNOVERSUMOFTOTI\L 10. MARGIN OVER RSS
1 1 . IIRSS ALL
12. 2)RSSALLBUTANTENNAGAIN
PARAMETER
TOTAL TRANSMITTING POWER (DBW TRANIMITTING CIRCUIT LOSS (DW
TRANSMITTING ANTENNA GAIN (DRI COMMUNICATIONS RANGE LOSS (DRI
ATMOSPHERIC A0SORPTION & DEFOCUSlNt LOSSES (08)
WLARlZATlON LOS5(DRl MULTIPATH b OTHER LOSSES (DO
RtCWANG ANTENNA GAIN PO1 RECOVINGClRCUlT LOSSiDR)
N E ~ LOSS(DP (243+4r5*61718+9)
TOTAL RKElVED POWtR (DBMl(ltlO1
RECEIVER NOISE SPECTRAL OENSITY - ( D W H Z l
TOTAL KECEIVED POWER/NO(DWHZ~III-I~~
CARRIER TRACKING
CARRIER Q O W E R ~ O ~ A L (on1
AODITIONAL CARRIER LOSSES (DRI THRESHOLD TRACKING BANDWIDTH - lqo (DBI
REQUIRED ShR (08)
PERFORMANCE MARGIN ( 0 9 (13rllr15-16-17]
DATA CHFNNiL
0 4 1 A POWR/lOTAL (081
ADDITIONAL DATA CHANNEL LOSSEI(DB1
DATA BIT RATE - 8 6 (DO)
THRESHOLD ENERGY PER DATA BIT - V N * (DO1
PERFORMANCE MARGIN (DO1 ll3tIV120-21-221
LARGE PROBE
0 0
SMALL PROBE
CXR
b.8
6.1
1.5
3.5
0.7
4.3
3.3
CXR
6.0
5.5
2.2
3.1
0.5
3.8
1.9
30
DATA
5.8 5.4
2.3
3.3
0.4
3.5
2.5
DATA
5.2
4.7
1.1
1.9
0.5
3.1
2.3
CXR
7.8
6.2
2.9
4.1
1.6
4.9
3.7
- M 30
DATA
7 6
5.6
2.9
4.0
2.0
4.7
3.6
CXR
7.4
6.9
3.5
4.8
0.5
3.9
2.6
CXR
7.0
5.7
2.8
3.8
1.3
4.2
3.2
m DATA
7.8
6.3
3.4
4.7
1.5
4.4
3.1
DATA
7.2
4.9
2.6
3.5
2.3
1.6
3.7
CXR
7.0
6.5
3
4 6
0.5
3.6
2.4
DATA
7.2 5.7
3.3
4.3
1.5
3.9
2.9

T h e following enumeration explains the i t e m s l isted on Tables 7. 6M-l
through 7. 6M-6:
1) T ransmi t t e r power to le rances a r e shown a s e i ther 0 .4 o r 0. 8 dB. The 0.4 d B ent r ies a r e fo r voltage variations of 10 percent. The 0.8 dB ent ry used for probes near the sur face includes output dropoff due to inc reased power amplifier temperatures .
2) Transmit t ing c i rcu i t l o s s for the l a rge probe i s shown a s -1.6 o r 2. 0 d B depending upon whether the parachute container i s in place o r jettisoned. The l o s s e s a r e a s follows:
Cable 4ssembly 0 .95
Feedthrough 0. 15
Parachute Container 0. 4
Diplexer 0 .5
2.0 dB
F o r the sma l l probe the t ransmit t ing c i rcu i t l o s s i s a s follows:
Cable Assembly 0.45
Feedthrough 0. 15
Radome 0 .4 - 1 . 0 dB
3 ) Adverse tolerance on antenna gain consists of initial gain variation f r o m nominal design a t the ta rge t aspect angle, including gain variation "ripple" a s a function of rotation of the probe including misalignment of the antenna, about the probe spin ax is , plus a reduction in gain a s the vehicle is tipped away f r o m the ea r th receiver . These values a r e best engineering es t imates based on measured pat terns . The value of the probe tip-up angle i s assumed to va ry with altitude on the following basis: $15 degrees a t 70 km, t 8 degrees a t 30 km, and zero degrees nearThe surface. -
4) No comment needed.
5) These values a r e taken f r o m the data in Appendix 7.6G.
6) Polar izat ion lo s s i s based on a n a s sumed probe antenna axial ra t io of 2. 5 dB and a DSN antenna ratio of 0. 6 dB.
7 ) These lo s ses a r e included in I t ems 15 & 20.
8) No comment needed.
9 ) No comment needed.
10) No comment needed.

11) No comment needed.
12) The rece iver noise spec t r a l density i s based on wors t stat ion elevation angle during the miss ion and data in JPL handbook 81 0 - 5 .
Nominal zenith s y s t e m noise tempera ture f o r the 64 -me te r station a t
S-band i s 22.0 - t 3 ' ~ . As the antenna i s lowered f r o m zenith, the sys tem
t empera tu re increases . The i n c r e a s e i n s y s t e m noise tempera ture i s a s
follows f o r the wors t stat ion elevation angles during the mission.
La rge P robe
0 Canbe r ra , 16. 5 degree elevation angle - - add 10 K to zenith sys tem t e m p e r -
a ture . 0
Goldstone, 34.0 degree elevation angle - - add 3. 5 K t o zenith noise t empera -
ture .
Smal l P robe
o Canbe r ra , 16. 5 degree elevation angle - - add 10 K to zenith tempera ture .
0 Goldstone, 23.0 degree elevation angle - - add 6. 5 K to zenith tempera ture .
In the design control tables the nominal value used i s the nominal
zenith tempera ture plus the i nc rease i n noise t empera tu re for the bes t
station. The tolerance i s equal to the tolerance on zenith plus the difference
between the increased tempera ture f o r t he two stations a s follows:
La rge P robe
0 Nominal station noise tempera ture = 22. 0 t 3. 5 = 25. 5 K
0 Adverse tolerance = 3.0 t 6. 5 = t 9 . 5 K
Small P robe
0 Nominal station noise tempera ture = 22. 0 t 6. 5 = 28. 5 K 0
Adverse tolerance = 3 . 0 t 3. 5 = 6. 5 K
13) No comment needed.
14) Modulation index of I radian f o r l a rge probe, 0. 98 radian for smal l probe.
15) Additional c a r r i e r l o s se s include 1.0 dB predetect ion recording loss and e i ther 0.5 o r 0. 3 dB suppression plus Doppler effect losses which a r e es t imated, o r i n the c a s e of the sma l l probe the 0 . 5 o r 0. 3 dB i s estimated to cover Doppler effect and osci l la tor noise losses .

16) See Item 16 explanation in Appendix 7. 6H.
17, 20, Fr 22) These a r e explained i n Appendix 7.6D and i n Section 7. 6. 3 of the technical volume. A breakdown of values i s also shown in a note on each table.
The entr ies on Table 7.6M-8 a r e explained in the following enurnera-
tion:
1 through 4) No comment needed.
5 ) See Appendix 7. 6F.
6 ) Estimated to be 0. 1 dB worse than a t the t ransmi t frequency. See Tables 7. 6M -1 through 7.6M-6.
7) See Appendix 7. 6A - This i s an est imated value.
8) Same comments a s for I tem 3 of Tables 7. 6M-1 through 7.6M-6.
9) Circuit loss is estimated a s follows:
Cable Assembly 0.95
Feedthrough 0. 15
Parachute Containers 0 . 4
Parachute & Radome 0 .4
Diplexe r 0 .8
2.7 dB
10 & 11) No comment needed.
0 1 2 ) Receiver noise figure 7. 5 dB, antenna contribution 250 K.
13 & 1.4) No commend needed.
15) Losses a r e an estimate of combined fading and Doppler effects on tracking loop.
16) No comment needed.
17) This i s the minimum desired signal level above the 2BL0 tracking
loop bandwidth to minimize downlink effects. Margin using the 400 kW t ransmi t te r brings this level to about 29 dB. If forced to use the 100 kW transmit ter , this would drop to about 23 dB which would sti l l be allowable.
18) Margin equals o r exceeds "Sum of Adverse Tolerance, " see Item 17 above.

APPENDIX 7.8A
PROBE BATTERY ANALYSIS AND SELECTION
I. Introduction/Summary
11. Battery Selection and Sizing
111. Battery Life Character is t ics

APPENDIX 7.8A
TECHNICAL NOTE P 7 3 - 2 0 3 4 3 4 - 0 7 0
PROBE BATTERY ANALYSIS AND SELECTION
28 F e b r u a r y 1 9 7 3
BURTON M. OTZINGER
PIONEER VENUS PROJECT
MARTIN MARIETTA AEROSPACE DENVER DIVISION DENVER, COLORADO

TABLE OF CONTENTS
Contents . . . . . . . . . . . . . . . . . . . . . . . i i
. . . . . . . . . . . . . . . . L i s t of I l l u s t r a t i o n s ii i
. . . . . . . . . . . 11. Bat t e ry Se lec t ion and S iz ing 2
. . . . . . . . . . . . . A. Ba t t e ry IRAD Program 2
B. C e l l Design Se lec t ion . . . . . . . . . . . . 3
. . . . . . . . . C. C e l l Design C h a r a c t e r i s t i c s 3
. . . . . . . . . . . . D. Thermal Considerat ions Ir
E. Se lec ted Ba t t e ry S izes . . . . . . . . . . . . &
. . . . . . . . . . . 111. Ba t t e ry L i f c C l ~ a r a c t e r i s t i c s b
A . Storage L i f c . . . . . . . . . . . . . . . . b
B . C y c l e L i E ~ . . . . . . . . . . . . . . . . . b
R e f e r e n c e s . . . . . . . . . . . . . . . . . . . . . . i
Figure 1 . . . . . . . . . . . . . . . . . . . . . . S
Figure 2 . . . . . . . . . . . . . . . . . . . . . . 9
Figure 3 . . . . . . . . . . . . . . . . . . . . . . 10
F i g u r e 4 . . . . . . . . . . . . . . . . . . . . . . 11
Table I . . . . . . . . . . . . . . . . . . . . . . 12
Appendix A . . . . . . . . . . . . . . . . . . . . 13-15
Appendix B . . . . . . . . . . . . . . . . . . . . 16-24
Appendix C . . . . . . . . . . . . . . . . . . . . 25-30

1 . F i n a l Condit ioning Capacity
2 . Discharge C h a r a c t e r i s t i c s f o r F u l l y Charged Type 1 , C e l l Tempera- ture A Parameter
3 . S i z e and Weight v s . Capacity f o r IRAD Developed S i l v e r - Z i n c C e l l
4 . Charged Stand Loss C h a r a c t e r i s t i c for IRAD Type 1 C e l l , Temperature A Parameter
Table - I Design Data Sheet f o r Type 1 , 10 A-H,
I U D Cell

The s t u d y e f f o r t p r e s e n t e d i n t h i s t e c h n i c a l n o t e was conducted t o f u l f i l l Task D e s c r i p t i o n 6313-02 a s d e s c r i b e d i n MCR-72-249, Rev. I , P i o n e e r Venus Miss ion A n a l y s i s and Probe Design S t u d y P l a n , d a t e d October 1972.
Da ta c o l l e c t e d from IRAD Task 48705 was e v a l u a t e d and probe b a t t e r y d e s i g n f o r Thor D e l t a and A t l a s CenLaur b o o s t v e h i c l e a p p l i c a t i o n were developed. A Lable showing t h e we igh t and volume of b a t t e r y d e s i g n s s e l e c t e d a r e g iven i n S e c t i u n 1I.E. B a t t e r y c a p a c i t i e s a r e shorn i n t h e d e t a i l e d c a l c u l a t i o n s , Appendix C .
The u s e of s t a n d a r d a e r o s p a c e b a t t e r y c e l l s were considcl-ed f o r u s e on t h e A t l a s Cen taur a p p l i c a t i o n s . I t was determined t h a t t h e i n c r e a s e d weight and volume r e q u i r e d d i d n o t j u s t i f y t h e s m a l l p a r t s c o s t s a v i n g .
A t o t a l a c t i v a t e d l i f e of 16 months i s ticeded t o s a t i s l y t h e P i o n e e r Venus Probe a p p l i c a t i o n s w i t h o u t r e q u i r i n g b a t t e r y re lacement p r i o r t o l aunch . Nine months o f a c t i v a t e d l i f e a t g : 80 F including 6 months open c i r c u i t charged s t a n d (c ru , i se ) have been demons t ra ted t o d a t e . T h i s t e s l i n g w i l l c o n t i n u e u n t i l c e l l wearout o c c u r s .

11. B a t t e r y S e l e c t i o n and S i z i n g
A. B a t t e r y IRAD Program
An Independent Research and Dcvelopment Program (IRAD) f o r "Advanced B a t t e r y 1)evelopment f o r Space Systemsu was e s t a b l i s h e d a t t h e Denver D i v i s i o n oL Mal-tilt. M a r i e t t a AC>L-ospace, i n l a t e 1971, w i t 1 1 an on-going program conducted by r e r s o n n e l o f ' t l i e Design and E l e c t r o n i c s Engineering Department.
The p r i n ~ a r y o b j e c t i v e of t h e program i s t o de- s i g n a r e p r e s e n t a t i v e c e l l and b a t t e r y f o r a probe a p p l i c a t i o n t h a t w i l l overcome major problems i d e n t i - f i e d and p rov ide s u f f i c i e n t test d a t a t o prove d e s i g n adequacy and p r e p a r e a d e s i g n manual. Problems i d e n t i - f i e d i n c l u d e long l i f e w i t h h i g h energy d e n s i t y i n t h e o r d e r of 40 wa t t -hour p e r pound, s t e r i l i z a b i l i t y ,
0 0 c r u i s e t empera tu res r a n g i n g from -54 F t o +I25 F and s u s t a i n e d d e c e l e r a t i o n i n e x c e s s of 500 "g".
An i n t e r i m r e p o r t h a s been p repared and p rov ides t h e d e s i g n c o n s i d e r a t i o n s f o r c e l l s and b a t t e r i e s f o r p robes and low c y c l e l i f e o r b i t e r s f o r p l a n r t a r y e x p l o r a t i o n [ I ] . A f i n a l r e p o r t f o r tlie 1972 e f f o r t h a s been prepared and i s i n a f i , n a l s ign-of f phase . R e s u l t s of t h e i n t e r i m r e p o r t denionst ra te t h a t a probe b a t t e r y w i t h an end o f l i f e energy d e n s i t y of 42 Watt-Hours p e r pound i s a t t a i n a b l e f o r t h e V e n u s Probe Miss ion u s i n g t h e c e l l s developed a t minus t h r k e sigma of t h e p r o d u c t i o n l o t . None of t h e s t o r a g e modes i n v e s t i g a t e d o f f e r d i s t i n c t advan tages a l though t h e open c i r c u i t cha rge c o n d i t i o n h a s : the g r e a t e s t d e g r a d a t i o n r a t e . T r a d e - o f f s a t t h e subsystem l e v e l , e .g . e l i m i n a t i o n o f a c h a r g e r , may make open c i r c u i t cha rge s t o r a g e mode more a t t r a c t i v e . Two 13 c e l l probe b a t t e r i e s s u c c e s s f u l l y s u r v i v e d a c c e l e r a t i o n l e v e l s of up t o 750 "g".
A s a r e s u l t of t h e probe c e l l t e s t s , improvements have been cons ide red and i n c o r p o r a t e d i n t o a new pro- curement o f 110 c e l l s f o r t h e 1973 t e s t program. The c o n d i t i o n i n g c y c l e test d a t a on 45 of t h e new c e 1 . s i n d i c a t e an improved c a p a c i t y from 9 A-H t o 12 A-H o v e r t h e 1972 c e l l procurement.

B. Ce l l Design S e l e c t i o n
The s i l v e r - z i n c , type 1B cel I , l c s i ~ c l a Lt,st-~,rl a s p a r t of t h e 1972 Ba t t e ry I K A U I)l-osram, was s e l ~ ~ c t c d a s the b a s i s f o r Venus Pioneer Probc b a t t e r y ~\rsist)s. This c e l l type was se l ec t ed s incc i t nlects L I I ~ 11igI1 energy dens i ty requi red and s u c r c s s l u l l y met thc sus- ta ined high "g" dece lcra t io t l t e s t i n a 13 c C l l baLL~,ry form. Since no s i g ~ l i f i c a n t d i l l c r ~ ! n ~ , t , ill da t a t r c ~ ~ < l was noted beLween types 1 A and lU, Ll~c da ta w i l l be simply considered a s i n g l e body ol r y p f 1 c e l l d a t a . Althouglt l imi ted d a t a ind ica t e l11at t l ~ c i~~~pruvc t l ~ ~ 1 1 . procured for tllc 1973 IRAD program, ~>r<)v idcs 30% more capaci ty i n the same s i z e casc , tl~c, i~nl\~ovcincnt w i l l not be rc f lcc tc i l i n the cur rent design L.alcl11ations.
, . l l ~ e typc 1 c e l l d a t a was clcraccd o r co~llpcnsilLed whenever necessary t o provide e s t i a ~ a t c d mon~ivclcnt b a t t e r y opera t ing c h a r a c t e r i s t i c s and s i z i n s values 1 2 ) .
Considerat ion was given to the use o f l e s s ex- pensive s tandard aerospace c e l l s , Eagle-Picher SZLB s e r i e s , t o meet the Atlas/Centaur requirement. I t vas determined t h a t t h e increased weight and volume re- quired d id not j u s t i f y the small p a r t s c o s t saving.
C. Ce l l Design C h a r a c t e r i s t i c s
The des ign d a t a shee t f o r the 10A-H, type 1, c e l l developed f o r t h e 1 9 7 2 IRAD program i s shown i n Table I. The manufacturing c r i t e r i a f o r these c e l l s e s t ab l i shed by the Martin Mar ie t ta work s tatement and Eagle-Picher process con t ro l provides c e l l s which may be matched except ional ly w e l l . The p l o t of new c e l l capac i ty f o r a l o t of 45 c e l l s on p robah i l i t y paper i s shown i n F i g u r e 1. It should be noted t h a t , the d i s t r i b u t i o n con£orms t o u s t r a i g h t l i n e ind ica t ing a nunnal d i s t r i - bu t ion of c e l l capac i ty i n a p r o ~ l u c . t i o ~ ~ l o t and tltc 10A-H c e l l i s i n r e a l i t y a 8.75 A-ti c e l l taken a t t l l ~ d i s t r i b u t i o n mean o r 50"i. ord ina te [ J I . A p lo t of t h e discharge vol tage vs. time chal -ac te l - i s t ic with temperature a v a r i a b l e f o r the 1OA-H c e l l i s s:lom i n F igure 2.
A s e t of c e l l he igh t and weight vs . capac i ty curves shown i n F igure 3 was generated t o f a c i l i t a t e the rap id c a l c u l a t i o n of b a t t e r y s i z e and weight. The

10A-H IRAD c e l l was t ~ s c d a s a g e n e r i c type i n t h e g c n c r a t i o n of t h e c u r v e s and t h e rallge i n c a p a c i t y sl~own i n d i c a t e s the c a p a c i t y 1 i111i ts f o r a c e l l of 0 . 7 2 i n c h e s t h i c k by 1.49 inches wide t h a t Eagle- P i c h e r would rcco~~micnd f o r manuiacture . Changes i n cell c a p a c i t y reqt l imd, and :he r e s u l t a n t vulun~e , i s t h c r e l o r e a f u n c t i o n of on ly c e l l / p l ; l t c l i c i g l ~ t . V a r i a t i o n s i n t h e c e l l h e i g h t l p l a t c l c n g t l ~ w i t h i n t h e range i n d i c a t e d have no c o s t o r r e t c s t impact . A c c l l o f l e s s than 5A-H c a p a c i t y would pose a s e r i o u s d c s i g n and r e t e s t problem. C a p a c i t i e s i n e s c e s s of 1 8 A-H would r e q u i r e a d i f f e r e n t c a s e and header s i z e b u t would no t c a u s e s e r i o u s d e s i g n o r r e t e s t problems.
D. Thermal C o n s i d e r a t i o n s
The grobe b a t t e r y t empera tu res w i l l be mainta ined 0
between 0 F and 70 F d u r i n g t l ~ c d l ~ p r o s i o i a t ~ ~ 110 day c r u i s e p e r i o d from launcll t o s c p a r a ~ l u n . A f t e r s e p a r a t i o n , tlre s m a l l probe t e n ~ p c r a t u r e decays d u r i n g t e e 25-day p r e - e n t r y p e r i o d t o a t c l ~ q ~ c r a t u r c o i
0 + O0F 20 F -15 F a t e n t r y . The I U D Data i n d i c a t c s tile
f o l l o w i n g v o l t a g e t empera tu re r e l a t i o n s h i p s under t h e a n t i c i p a t e d b a t t e r y load and o p e r a t i o n :
0 Temperarure f F) B a t t e r y ( V o l t s 1
80 28.6 55 26.6 30 23.6
0 It c a n be seen t h a t o p e r a t i o n below 55 F would n o t be w i t h i n t h e r e q u i r e d l o a d v o l t a g e r e g u l a t i o n of 28 _+ 10%. This c o n d i t i o n was c o r r e c t e d by app ly ing power t o a h e a t e r i n t e g r a l t o each s m a l l probe b a t t e r y f o r a t h r e e hour p e r i o d p r i o r t o f i r s t usage of tlie b a t t e r y . Tlie l a r g e probe b a t t e r y t empera tu re w i l l be i n e s c e s s of
0 55 F a t t h e t ime of e n t r y . The smal l probc b a t t e r y h e a t e r c a l c u l a t i o ~ ~ s a r e shown i n Appendis A .
E. S e l e c t e d B a t t e r y S i z e s
The Probe Power P r o t i l e s and A l l o c a t i o n s f o r Thor D e l t a and A t l a s Centaur, show11 i n Appendix B, were used t o e s t a b l i s h t h e b a t t e r y energy and power

requ i rements needed t o c a l c u l a t c ha t t c t -y c a p a c i t y . The d e s i g n d a t a s h c c t s f u r n i s h e d i n Appendix C show t h e d e t a i l e d c a l c u l a t i o n s laad? t o establish t h e s e l e c t e d b a t t c r y desig11 w c i g h t s and v u l r ~ ~ n c s g iven i n t h e Eollowing t a b l e :
Large Probe
Smal l Probe
T l ~ o r D e l t a
Weixht (LB) Volume ( 1 2 )
8 . 2 130
5 9 3
A ~ l a s Centaur
W e i ~ h t (L8) Volunie ( I n 3 1 14.2 2 3 5
7 . 1 119

111. Bat t e ry L i f e C h a r a c t e r i s t i c s
A. S torage L i f e
The IRAD, Si lver -Zinc , Cells were procured i n a d ry discharged s t a t e from the Eagle-Picher Co. C e l l s i n t h e d ry discharged s t a t e have a s to rage l i f e wel l i n excess of 3 years when s tored under favorable temperature and humidity condit ions.
Activated l i f e ( e l e c t r o l y t e added) t e s t d a t a , c o l l e c t c d t o d a t e , i n d i c a t e successfu l c e l l operat ion
0 a f t e r 9 months a t 80 F including 6 months open c i r c u i t charge s tand ( c r u i s e ) . The charged stand los s charac- t e r i s t i c s f o r the type 1 c e l l i s shown i n Figurc 4 . Activated l i f e t e s t i n g w i l l be continued u n t i l c e l l wear-out occurs . A t o t a l a c t i v a t e d l i f e of 16 months i s needed t o s a t i s f y the Pioneer Venus probe s to rage and f l i g h t requirements.
The s to rage orcondi t ioned temperature i s a c r i t i c a l f a c t o r i n extending the l i f e of a s i l v e r - z inc b a t t e r y d c e l l . The b i c t t e ry l ce l l should be main- ta ined a t 30 F o r less whenever poss ib le .
S ta te -of -charge i s a l s o a f a c t o r i n extended l i f e and t h e b a t t e r y / c e l l s should be maintained i n a p a r t i a l l y discharged (monovalent) s t a t e whenever possible .
B . Cycle L i f e
Cycle l i f e t e s t da t a i n d i c a t e a degradat ion of 50% i n capac i ty a f t e r 32 cyc les atolOO% depth-of- d ischarge (1.2 v o l t cu t -o f f ) a t 70 F. The probe mission does not r equ i re ex tens ive cyc l ing but i t i s improtant t o note the s u b s t a n t i a l na ture o; the c e l l s epa ra t ion system, i n t h a t , no f a i l u r e s were recorded i n 32 deep d ischarge cycles . This i n d i c a t e s t h a t the c e l l s w i l l "d i e gracefu l ly" and thereby
prec lude c a t a s t r o p h i c c e l l sho r t ing .

1. - - - Advanced Battery DevelopmenL for Space System, Interim Report for IRAD Task D48705, MMA Denver, January 1973.
2 . - - - Technical Note P73-203434-70 Regulated Vs. Unregulated Power Bus.
3 . - - - Practical Engineering Uses of Probability Paper by A. Boyajian, General Electric Review, Vol. 53, Nos. 6 and 7, 1950.

FIGURE 1 FINAL CONDITIONING CAPACITY

FIGURE 2
DISCHARGE CHARACTERISTICS . ~~~ ~
FOR FULLY CHARGED, TYPE 1, CELL AT 2 AMPERE RATE WITH TEMPERATURE A PARAMETER
TIME, HOURS

FIGURE 3
SIZE & WEIGHT VS. CAPACITY IRAD 48705 DEVELOPED SILVER-ZINC CELL TYPE
CAPACITY ( M E R E - HOURS)

FIGURE 4
CHARGED STAND LOSS CHARACIERISTIC FOR, IRAD TYPE 1, CELL, TEMPERATURE A PARAMETER
CHARGED STAND TIME (MOMHS)

TABLE I
DESIGN DATA SHEET FOR TYPE 1 10A-H IRAD CELL
I. Performance
Voltage (volts)
Capacity (Ampere-Hours)
Discharge Rate (Amperes)
Activated Stored Life (Years)
Charge/discharge Cycle Life (20% D.O.D.)
Relief value setting (PSIG)
Open circuit 1.86 Nominal load 1.45
To 1.0 volt 10 Cut-off
Nominal 2
11. Operatin# Conditions
Temperature (operate) 55'~ to 200'~
Temperature (non-operate) -44OF to 80°F
Sustained Acceleration ("g") 750
Shock and Random Vibration Meet Thor Delta require- ments
111. Conf iaurat ion
Volume KOH (Cubic Centimeters) 17 f ',
Number of Positive Plates 6
Number of Negative Plates 7
Positive Plate Area (Square inches) 2.57
Plate Constraint
Separator
Weight (lbs)
Outline Dimensions
Terminals
Hysol bond at bottom corners.
1 layer Polypropylene Felt 4 layers Irradiated Poly- ethylene (Permion 307Mn)
Screw dam, low profile

APPENDIX A
BATTERY HEATER CALCUIATIONS

APPENDIX A
BATTERY HEATER CALCULATIONS
Assume,
Battery Discharge 0
Start Temperature 20' + OoF . . . . . . . . . -15 F
Heater Operate Time . . . . . . . 3 Hours Temperature Rise . . . . . . . . . 70'~ Heat Losses . . . . . . . . . . . . 10%
Batterv Com~osition Mass Cp
KoH (H 0 solution) 2 0.212 1.0
Plastic 0.12 0.3
Silver 0.668 0.06
then, Q = M C p AT
= 1 x 0.288 x 70 = 20.1 BTU
- Q = 6 . 7 2 ~ l W = 1.96 WattsILb of Battery
3.412 BTUIHr
Q = 1.96 + 10% loss = 2.16 WattsILb oE Battery

APPENDIX A (Continued)
Thor Delta, Small Probe Heater Requirements -- Assume Battery Weight - 5 pounds then,
Heater Size (watts) = 2.16 WattsILb s 5 Lb
= 32.4 W- H
Atlas Centaur, Small Probe Heater Requirements - -
Assume Battery Weight = 7.1 pounds
then,
Heater Size (watts) = 2.16 Watts/Lb x 7.1 Lb
= 15.3 Watts
Battery Energy Req. (W-H) = 15.3 Watts x 3 hours
= 46 Watt-Hours

APPENDIX B
PROBE P W E R PROFILES AND ALLOCATIONS
FOR
THOR DELTA
AND
ATLAS CENTAUR

K - S rin
B + 0, Entry H Z 1 sec. To
To + 4 to 6 sec
To + 12 sac
To + 26 sac To + 29 aec T + 30 sec 0
To+15 min 20 se
Statt Coart Timer
Separation
Ptnatary Flux Radiometer Black Body R e f . t . ON
? I-
T k Acquisition
e Science ON
VI
250 km !" a
0.5 0 Window Htrs. ON
Shock Layer Radiom. OFF
N o
W
Tranamitter ON
- Mortar Fire (12 A.) Release Aeroshell (36 A.)
- Mass Spec Low Htr. ON
N I- I-
W
Release Parachute (36 A.) N Mass Spec. High Htr . ON I- u w
N
t: 0
IMPACT
Aur. Ext. Det. h Hygro. OFF
All Science except Accel. OFF 6 Window Btra. OFF r, I.
no I Accelerometer Seismic Operation

TABLE B - 1
THOR DELTA
LAllGB PROBE WWEB ALLOCATION
AVERAGE POm ALLOCATED (WATTS)
EQUIPElENT (UNRECULATKD RlwhRKS
Science:
- Temperature Gauges
- Pressure gauges 1 .O
- Accelerometers 2.3
- Nephelometer 2.0 12 Watt continuoue plus
- Neutral Mass Spectrometer 12/18/24 6 Watt heater on parachute whicb increases to 12 Wattr on re lease
- Cloud Par t ic le Size Analyzer 2 0 . 0 of the m i n parachuta.
- Solar Flux Radiometer 4.5
- Planetary Flux Detector 4.5
- Aureole/Extinction Detector 2 .O
- Shock Layer Radiometer 1 .O
Engineering :
-25 Day Timer
- 'Transmitter Driver
- Power Amplifier
- Receiver 1.5
- Data Handling and Command 3.0
- Power Control 0 . 2
- Transducers 2 .O
- Window Heaters (4) 55
Self-contained battery

(TED) t Start Coast Timer
S - 0 Separation
Driver, PA, Xducers On
DHC. Xmtr Driver. PA, Xducers OFP
m 1 m
F - m
Ei P
? Stable Oecillator I- I.--- Science, DHC. Xducer 0.1
lr yl I-
m m
"P' O U h D
2 C C em
0 . . r m M r r S M 0 n O r W W M
c 0 E E E " K P ? E 3 s 1
2 r
IE science window
7 m
'a
v n r 0
k 5
To 4 33 aec
:

TABLE B-2
THOU DELTA
SWALL PROBE POWW ALLOfXTIOtl
EQUIPMENT
AVWAGE POWER
ALLOCATED (WATTS) (UNREGUUTED)
Science:
- Temperature Gauges
- Pressure Gauges
- Accelerometer
- Nephelometer
- Magnetometer
- Stable Oscillator
0.5
0.5
1 .o
1.6
1.6
0.4 1 to 2 watt peak for 112 hour before entry during DL81 experiment. Integrated with transmitter electronice balm.
Engineering:
- 25 Day Timer - Self-contained Battery
- Wanemitter Driver 3.9
- Power Amplifier 42.3
- Data Handling & Camand 2.0
- Power Control 0 . 2
- Transducers 2.0
- Window Heater 9 .O

PZ-V8'L K - 25 Day Start Coast Timer
- t Separation
K - 2 Days
B - 60 rin K - 50 min
W2l eec, TO
To+4 to 6 se
To + 12 sac
To + 224 aec To + 29 eec To + 30 sac
. Planetary Flux Radiometer
1 0 Black Body Ref. Htr. ON
&I! Acquisition N 2 g m 7
0 W
r Science OW
7
250 irm
0.5 g
z - OD
?, Window Htrs. ON Shock Layer Radiom. OFF
C C I- Transmitter ON bo
N OD u 0
- Mortar Fire (12 A.) Release Aeroshell (36A)
* Mass Spec Low Htr. ON
N w I-
OD
Release Parachute (36 A.)
Mass Spec. High Htr. ON
Aur. Ext. Det. & Hygro. OFF
N a u u
MPACT c All Science except Accel. OFF & Window Htrs. OFF
C 1 a I N
I L Accelerometer Seismic Operation

TABLE B-3
ATLAS CENTAUR
LARGE PROBE POWER ALLOCATION '
AVERAGE POWER
ALLOCATED (WATTS) (UNREGULATED)
Science:
- Temperature Gauges 1 .O - Pressure Gauges 1 .0 - Accelerometers 2 . 3
- Nephelometer 2 .O - Neutral Mass Spectrometer 1 2 . 0 / 1 8 . 0 / 2 4 . 0 - Cloud Particle Size Analyzer 2 0 . 0
' -Sr.lar Flux Radiometer 4 . 5 - Planetary.Flux Detector 4.5 - Aureole/Extinction Detector 2 .O ':- Shock Lycr Radiometer 1 . 0 - Hygrometer 0 . 3
Seismic operation if Probe survives impact.
12 w . continuous plus 6 u . heater on par-? ' , .<I 1. 8 .
increases tc. . t i . 0 1 release d '
of the main parach1:tr IR reference on 2 days before entry Off at 30km Off after blackout Off at 30 km
. . - Data H G . !.' .:: 5 r:ommand !:<:, Power i; . . 7 1 - Transducers - Window .:,, Hei<Lcrs . .. ( 4 )
. . . . .
- Self-contained battery 4 . 0
170 .0 lko Small Probe Power Amplifiers paralleled 4
5 . O . . 0 . 2 . . . . . . . ~ . . ,
2 . 0 : ; 55 .0

S + Sec
S + 3 Uin
t Start Coast Timer
t Separation
on lhgnetometer Calibration
0
E - 60 nin Stable Oecillator. DHC, Xmtr Driver, PA. Xducers ON
E - 50 Uin DHC, Xmtr Driver, PA, Xducers OFF
rD N m N N
r
B - 30 Min -
I
0
m
E - 5 Min Science, DHC, Xducer On
E - 0 E+25 Sec(To) Science Window
Hen t er PA & Xmtr Driver ON
v
v Deploy Science (12 A.)
Impact
T + 20 Sec .. 0
To + 33 Sec
S + 25 Dnye
1 0)
.. To + 63 Min
I Accelerometer Seismic Operatton
I z ';P 1

TABLE B-4
ATLAS CENTAUR
SlZALL PROBE POWER ALLNATION
AVERAGE POWER
ALLOCATED (WATTS) EQUIPMENT (UNREGULATED) RPWARKS
Science:
- Temperature Gauges - Preseure Gauges - Acc2lerometer - Nephelometer - Magnetometer
- Stable Oscillator 0 .4
Engineering:
- 25 Day Timer - Transmitter Driver - Power Amplifier - Data Handling b C o m n d - Power Control - Transducers - Window Heater
Seismic operation if Robe survives impact
Periodic cruise calibration right after separation.
1 to 2 watt peak for 112 hour before entry during DLBI experiment.
Self-contained battery
Identical to Large Probe

APPENDIX C
BATTERY S I Z I N G CALCULATIONS

APPENDIX C (Cont inued)
Large Probe BaLterv Thor D e l t a
C a l c u l a t i o n s
t 1 Assumptinns:
Load ~ n e r ~ y ~ c ~ u i r e d = 207 W - H L i n e b ContacL Loss = ' 1% Cl~arged Stand Loss = yk Contingency = 5‘% Monovalent O p e r a t i o n = 25% Mallufacturing T o l e r a n c e = I?/>
TwLal Load Energy - 207 W'-H
Applying Losses and D e r a t i n g s , 207 W-H
B a t t e r y Energy Req. = 0 . 9 9 x 0.95 x 0.95 x 0.75 20.88
= 351 W-H
B a t t e r y Capac i ty ( r a t e d ) = 351 W - H = 12.3 A-H ( D i v a l e n t )
2 8 . 6 V . = 9 . 2 A-H(E1onovalent)
B a t t e r y Weiglit = 4.65 o z x 20 c e l l s L 1.4 p a c k . i a c t o r 1 b uz.
= 8.15 l b .
B a t t e r y Volume = 7.95 i n x 3.48 i n . s 4 . 7 i n .
= 130 i n 3
. .
C e l l : B a t t e r y :
Note 1: Load Energy r e q u i r e d t aken from a r e a under cu rve shown i n Appendix B-1. Other a s sumpt ions e x p l a i n e d i n Smal l Probe Thor Delta C a l c u l a t i o n s .

APPENDIX C (Continued)
Small Probe Ba t t e ry Thor Del ta
Calcula t ions
Assumptions:
Note 1 Load Energy Required = 82.5 Watt-Hours
Note 2 Heater Energy Required = 32.4 Watt-Hours
Line & Contact Loss = 1%
Note 3 Charged Stand Loss = 5% ( 1 Mo. @ 8 0 ' ~ plus 4 Mo @ 30O~)
Contingency = 5% (Load growth)
Note 4 Monovalent Operation = 25%
Note 5 Manufacturing Tolerance = 12% (Using Rated A-H)
T o t a l Load Energy = Load (Watt-Hours) + Heater (Watt-Hours)
= 82.5 W-H + 32.4 W-H
= 114.9 115 W-H
Applying Losses and Dera t ings ,
B a t t e r y Energy Req. = 115 W-H
0.99 x .95 x .95 x .75 x .88
= 195 W-H
Ba t t e ry Capacity (Rated) = 195 W-H = 6.82 A-H (Divalent)
28'6 5 .1 A-H (Monovalent)
Ba t t e ry Weight = 2.85 oz x 20 c e l l s x 1.4 Pack Factor 16 oz
= 5 pounds
B a t t e r y Volume = 7.95 in. x 3.48 in . s 3.35 in.
= 92.6 in . 3
Where,
Cel l : Bat tery:
L = 0.72 ' L P ( . ? 2 x 10) + .75 = 7.95
W = 1.49 W = (1.49 x 2) + .5 = 3.48
H = 2.85 H = 2.85 + .5 = 3.35

APPENDIX C
Stsall Probe Battery Thor Delta Calculations (Continued)
NtrLe 1 Area under curve Appendix B-2
Note 2 Heater energy calculation shown in Appendix A
NoLe 3 Charged Stand Loss values taken from Figure 4
Note 4 Need for Monovalent Operation described in Technical biote P73-203434-070.
Note 5 Manufacturing tolerance was taken from Figure 1 and allows use of total cell population for battery manufacture. -
X (Rated A-H) - 3 0 (A-H) 12% = X (Rated A-H)

APPENDIX C (Continued)
Probe B a t t e r i e s A t l a s Centaur
C a l c u l a t i o n s
Note 1 Assumptions:
Large Probe Energy Required' = 287 Watt-Hours Smal l Probe Energy Required = 132 Watt-Hours H e a t e r Energy Required = i b Watt-Hours L ine & Contac t Loss = l X Charged S tand Loss = 5X Cont ingency = 5"/, Monovalent O p e r a t i o n = 25'L Manufac tu r ing To le rance = 12%
L a r g e Probe Smal l Probe
T o t a l Energy = 287 W-H T o t a l Energy = 132 + 46 = 178 W-H
Use two Smal l P rohe b a t t e r i e s i n p a r a l l e l f o r Largc Probe energy r e q u i r e m e n r , commonality r e s u l t s i n c o s t s a v i n g .
Then compare,
L.P. = 187 W-H = 143 W-H < 178 W-kl = S.P. 2
S i n c e Smal l Probe b a t t e r y energy requirement is g r e a t e r than h a l f L a r g e Probe r e q u i r e m e n t , b a s e d e s i g n on Small Probe requ i rement . Excess e n e r g y s e r v e s a s marg in i n Large Probe a p p l i c a t i o n and h e a t e r i s n o t connec ted .
Applying Losses and D e r a t i n g s ,
B a t t e r y Energy Req. - - 178 W-H 0.99 x .95 x . 95 x .75 x .88
= 302 W-H
B a t t e r y C a p a c i t y ( r a t e d ) = 302 W-H
28.6 V = 10 .6 A-H ( D i v a l e n t )
7 . 9 A-H (Plonovalent)
B a t t e r y Weight = 4 . 0 5 o z x 20 c e l l s x 1 . 4 pack f a c t o r 16 02.
B a t t e r y Volume = 7.95 i n x 3.48 i n x 4 . 3 i n
= 119 i n 3

APPENDIX C
Probe Batteries Atlas Centaur Calculations (Continued)
where,
Cell: Battery:
Note 1 Large Probe Energy from Appendix B-3
Small Probe Energy from Appendix B-4
Other assumptions explained in Small Probe Thor Delta Calculations.

APPENDIX 7.8B
REGULATED VERSUS UNREGULATED POWER BUS
I. lntroduction/Summary
11. Regulated Bus Approach
111. Unregulated Bus Approach
IV. Cornparis on of Alternate Approaches

APPENDIX 7.8B
', : . ,
TECHNICAL NqTE P 7 3 - 2 0 3 4 3 4 - 0 6 9 A)
REGULATED VS UNREGULATED POWER BUS
. . . ..
by. . a . . '
; . ,.
BURTON M. OTZINGER POWER SUBSYSTEM ENGINEER
FlARTIN MARIETTA CORWRATION
February 22, 1973 , - . .
. . . .
. . ,. . . , , : .. .

CONTENTS
TITLE . contents . . . . . . . . . . . . . . . . . . . . .
. . . . . . . . . . . . . . . List of Illustrations
. . . . . . . . . . . . . . . I Introduction/Summary
. . . . . . . . . . . . . . I1 Regulated Bus Approach
. . . . . . . . . . A . Subsystem Considerations
B . Regulator Design . . . . . . . . . . . . . . . . . . . . . . C . Advantages and Disadvantages
. . . . . . . . . . . . . I11 Unregulated Bus Approach
. . . . . . . . . . A . Subsystem Considerations
. . . . . . . B. Battery Voltage Considerations
C . Battery Design . . . . . . . . . . . . . . . . . . . . . . . D . Advantages and Disadvantages
. . . . . . . IV . Comparison of Alternate Approaches
References . . . . . . . . . . . . . . . . . . . . . . . . . . . . . . . . Appendfx A Sample Calculations
PACE . ii
iii
1
1
1
1
2
3
3
3

LIST OF ILTAJSTRATIONS
FIGURE - TITLE - PACE - 1 Discharge Characteristic for Fully Charged
Battery of 20 Type I, I U D Cells . . . . . . 2 Estimated Cell Voltage Plateau Vs. Current
Density for IRAD Type Silver-Zinc Cell at 55OF . . . . . . . . . . . . . . . . . . . .
3 Estimated Discharge Voltage for 20 Cell Probe Silver-Zinc Battery . . . . . . . . . . . .
4 Estimated Large Probe Battery Chargc Voltage Vs. Current for 18 A-H 20 Cell Configuration.

A probe primary power bus vol tage of +28 v o l t s dc was d i c t a t ed by t h e power requirements of the experiments and a v a i l a b l e communica- t i o n s components. m A regula ted bus approach was presented i n the proposal and cons is ted of boost r egu la t ing the nominal +19 v o l t power from a 13 c e l l s i l v e r z inc b a t t e r y t o +28 v o l t _+ 2% power f o r d i s t r i b u t i o n t o the loads. a Supplying t h e requi red power and r egu la t ion d i r e c t l y from a s i l v e r - z inc b a t t e r y was considered a s an a l t e r n a t e approach i n t h i s t echn ica l note.
An a n a l y s i s of t h e load r e g u l a t i o n requirements d isc losed t h a t only 2 wa t t s of Small Probe and 8 wa t t s of Large Probe power required i 2% regu la t ion , t h e remaining demand was unregulated C+10%) power. - It was the re fo re concluded t h a t t o t a l primary power conversion and r e g u l a t i o n was unnecessary. A t r a d e o f f between the approaches was made and i t was decided t h a t primary power be supplied d i r e c t l y from a 20 c e l l , rechargeable, s i l v e r - z i n c b a t t e r y designed and condit ioned t o provide a f l a t d ischarge vol tage c h a r a c t e r i s t i c .
11. Regulated Bus Approach
A. Subsystem Considerat ions
The Probe E l e c t r i c a l Power Subsystem conf igura t ion presented i n t h e Proposal included conversion of a l l the b a t t e r y power t o i 2 8 v o l t + 2% regula ted power f o r d i s t r i b u t i o n t o a l l loads except Ordnance and Timer. The regula ted primary power was f u r t h e r converted t o secondary vol tages a s needed wi th in each subsystem o r experiment. The conversion t o +28 v o l t s was accomplished by a boost r e g u l a t o r , boos t ing t h e +19 v o l t power from a 13 c e l l s i l v e r - z i n c ba t t e ry . Redundant r egu la to r s a r e requi red i n t h e l a r g e probe design t o ensure the necessary system r e l i a b i l i t y . The redundant r egu la to r was on standby s t a t u s :.nd would be switched i n with occurrence of a f a i l u r e .
B. Regulator Design
The b a s i c c i r c u i t des ign f o r t h e l a rge and small probe boost r e g u l a t o r s was i d e n t i c a l . The d i f f e r e n c e i n power r a t i n g between the probe a p p l i c a t i o n s precluded comwn usage.

B. Regulator Design - (Continued)
It was est imated t h a t 193 p a r t s would be requi red f o r t h e l a rge probe r e g u l a t o r and 96 p a r t s f o r the small probe regula tor .
. .
It was est imated t h a t the r egu la to r s would operate a t an e f f i c i e n c y of 85%. s i z i n g r a t i o s of 1 lb . per 60, wat t s and 63 cubic .inches per lb . f o r r egu la to r s handling i n excess of 100 wat t s were used t o es t imate r egu la to r weight and volume., A r egu la to r handling 50 watts was est imated . t o weigh 1 lb . These c r i t e r i a were used i n c a l c u l a t i n g the values shown i n the t rade- o f f s of Sec t ion I V t o meet t h e power requirements spec i f i ed i n the . power a l l o c a t i o n s and. p r o f i l e s . D Sample ca l cu la t ions a r e provided i n Appendix A.
C. Advantages and Disadvantages
Supplying a probe primary power bus by means of boost regula t ion of a v a i l a b l e b a t t e r y energy has t h e following advantages:
1. I n - f l i g h t charging of a probe s i l v e r - z i n c b a t t e r y o f up t o 13 c e l l s can be accomplished with regula ted +28 v o l t power from the bus (vehicle) with a minimum of log ic and con t ro l c i r c u i t r y .
2. The wide inpu.t vo l tage to l e rance of the boost r egu la to r . . would accommodate.the t y p i c a l wide vol tage range 0 f . a f u l l y charge& s i lve r -z inc b a t t e r y , ,.and the lower, voltage, range t h a t would r e s u l t from shorted c e l l opera t ion . ' '
3. The f i l t e r i n g e f f e c t of the r egu la to r components would reduce the vol tage t r a n s i e n t on the bus a s a r e s u l t of ordnance f i r i n g ' d ~ i r e c . , from b'attery'.
Disadvantages a r e a s follows:
1 . O s c i l l a t o r i n boost reguiato"r i i c r e a s i s . . EM1 c o n t r o l . problem.
. . 2. .Need f o r t r a n s f & n e r s and chokes increases magnetic
c l ean l iness problem. . . ,.
3. Large number o f . p a r t s i n c r i t i c a l equipment decreases subsystem r e l i a b i l i t y .
4 . See trade-off values i n Sec t ion I V f o r c o s t , weight and . . volhme considerat ions.

111. lrnregulatetl Bus Approach
A. Suhsystcm Considerat ions
An important advantage of the boost r egu la to r approach, s t a t e d i n I1 C.2, was t h a t a wide range of b a t t e r y voltage could be accommodated and the re fo re a b a t t e r y of s p e c i a l design would not be requi red . Conversely, i n the design of a b a t t e r y t o supply primary power d i r e c t l y , a l l of the bus power requirements and environmental cons t r a in t s must be c a r e f u l l y considered.
The probe power a l l o c a t i o n , presented i n Reference 3, shows t h a t t h e load demand can be s a t i s f i e d with unregulated e l m ) +28 v o l t power i n l i e u of the +2% speci f ied f o r t h e Proposal conf igura t ion . The small amount of regula ted e2%) power required f o r experiments i s included i n the unregulated power t o t a l and could be supplied from a s e r i e s r egu la to r a s explained i n the next subsect ion.
Es tabl i sh ing a t o t a l power requirement wi th in a 210% regula- t i o n was e s s e n t i a l s ince a s i l v e r - z i n c b a t t e r y can be constructed and charged t o provide t h i s range of r egu la t ion wi th in the +55O~ t o +150°F opera t ional temperature range. Ihe minimum e n t r y temperature of +55OF i s insured i n the Small Probe by a b a t t e r y hea te r turned on f o r three hours p r i o r t o ent ry . The Large Probe en t ry teniperature of 55oF is achieved by pass ive thermal con t ro l .
B. n:vt t e r y Voltage Considerat ions
There a r e t h r e e major vol tage cons idera t ions i n the s e l e c t i o n of the b a t t e r y design. The f i r s t i s the s e l e c t i o n of an appropr ia te nominal vol tage (number of c e l l s ) , the second i s t o determine t h a t the r egu la t ion requirement can be met and t h i r d , t h a t t r a n s i e n t vol tage performance, such a s Ordnance f i r i n g , w i l l bc wi th in l i m i t s .
The nominal vol tage provided by a b a t t e r y of 19, 2 0 o r 21 c e l l s a t the r a t e requi red a r e a l l wi th in the +10% regu la t ion (25.2 t o 30.8 v o l t s ) a s shown i n the following t ab le :
No. C e l l s 19
Nominal Vol ts 27.2

B. Battery Voltage Considerations - (Continued) A 20 cell battery configuration was selected for the following reasons :
1. With an average discharge voltage above +28 volts, it is possible to provide closely regulated ( t 2 % ) power using a series regulator at low power loss. The high initial load voltage precluded the use of 21 cells.
2. Using 20 cells, it is estimated that the average battery voltage would be great enough to furnish power within regulation with failure mode operation equivalent to the loss of one cell.
A typical discharge characteristic for a fully charged, 20 cell, battery based on IRAD developed cells is shown in Figure 1 a . This figure depicts the condition that would exist during ground testing at nominal temperatures and full load. The high starting voltage condition is unacceptable; especially for tests involving less than full load.
The unacceptable high starting voltage can be eliminated, for a limited number of charge cycles, by a method, developed for Titan I11 battery charging a . The special charge control method plus monovalent operation of the battery as described by J. F. Dittmann would provide a stable capacity and flat discharge voltage characteristic . A weight penalty corresponding to a 25% capacity derating was used in the trade-off calculations for monovalent operation as suggested by the Dittmann paper. The Titan I11 battery charge control work, however, indicates that no more than 25% of the full charge capacity was lost using the special charge method employed. This suggests then, that with the adjustment in negative to positive active plate material for monovalent operation, the capacity penalty should be more like 10% for no charged stand and a capacity advantage for power delivered after extended charged stand periods characteristic of Space Probe application. Characterization tests using the special charge control method have begun with a quantity of the 110 new silver-zinc cells procured for the 1973 IRAD Program.
A calculation of minimum entry, voltage for the Large Probe was developed using Figure 2 and isshown in the sample calculations, Sheet 1. Appendix A.

B. B a t t e r y Vol tage C o n s i d e r a t i o n s - (Continued)
The e s t i m a t e d d i s c h a r g e v o l t a g e c h a r a c t e r i s t i c f o r a 20 c e l l probe b a t t e r y u s i n g t h e s p e c i a l cha rge method i s shown i n F i g u r e 3. Note t h e d o t t e d c h a r a c t e r i s t i c showing degraded performance w i t h 1 .4 v o l t l o s s .
The maximum number of p y r o t e c h n i c b r i d g e s t o be f i r e d a t any t ime i s 6. The x f i r i n g c u r r e n t i s 3.5 amperes, t h e r e - f o r e t h e nominal f i r i n g ' c u r r e n t is 21 amperes. The l a r g e probe b a t t e r y p l a t e a r e a i s 56.1 square i n c h e s , t h e r e f o r e t h e c u r r e n t d e n s i t y a t f i r i n g i s 0.382 ampslsq. inch and u s i n g F i g u r e 2 , t h e i n d i c a t e d b a t t e r y v o l t a g e w i l l be g r e a t e r t h a n t h e r e q u i r e d 22 v o l t s .
C . B a t t e r y Design
The b a s i c d e s i g n s o f t h e Large and Smal l probe c e l l s a r e i d e n t i c a l e x c e p t f o r c a p a c i t y and a r e d e r i v e d from t h e development o f a 10 A-H IRAD Cell. Each probe b a t t e r y c o n t a i n s 20 s e r i e s connected c e l l s , a t h e r m i s t o r f o r t empera tu re s e n s i n g , magnet ic compensat ion loop i f r e q u i r e d , a h e a t e r i n t h e smal l probe b a t t e r y o n l y , p l a s t i c encasement and connec to r .
The b a t t e r y w i t h r e g u l a t o r u s a g e had 13 c e l l s o f a g r e a t e r c a p a c i t y . The c o s t d i f f e r e n c e would be minimal and p r i m a r i l y i n m a t e r i a l s c o s t s .
C a l c u l a t i o n s of b a t t e r y weight and volume r e l a t i o n s h i p s a r e shown i n T e c h n i c a l Note PV-(170 and t h e Sample C a l c u l a t i o n s , Appendix A.
A t y p i c a l p l o t o f b a t t e r y v o l t a g e and c u r r e n t t h a t could be expec ted d u r i n g GSE t o p - o f f c h a r g e p r i o r t o launch is sliown i n F i g u r e 4.
D. Advantagesand Disadvan tages
D i r e c t supp ly f rom t h e b a t t e r y p r o v i d e s a s imple r e l i a b l e approach e s p e c i a l l y i f i n - f l i g h t c h a r g i n g i s n o t planned.
A d i s a d v a n t a g e i s t h e s p e c i a l d e s i g n c o n s i d e r a t i o n s n e c e s s a r y s i n c e t h e b a t t e r y must meet t h e power q u a l i t y r equ i rements o f t h e power bus .

I V . Comparison of Al t e rna te Approaches . , .
A weight and volume t rade-off between a l t e r n a t e approaches i s presented i n the following t ab le :
Large Probe Bat tery Boost Regulator Total Weight Volume Weight Volume Weight Volume (LBS) ( i d ) (LBS) (in3) (LBS ) (in3)
with' Regulator 8.4 145 5.4 336 13.8 481 Without Regulator 10.4 156 --- - - - 10.4 156
Small Probe Bat tery Boost Regulator Tota l Weight Volume Weight Volume Weight Volume (LBS) (in3) (LBS) ( in3) (LBS) (in3)
With Regulator 3.4 7 0 1 63 4.4 133 Without Regulator 4.6 87 - - - 4.6 87
It can be seen t h a t a s u b s t a n t i a l saving i n volume and weight i n the case of the l a rge probe can be r ea l i zed by the de le t ion o f the Boost Regulator. A s u b s t a n t i a l cos t saving would a l s o be r ea l i zed .
Based on the above f indings , i t is recommended t h a t the Boost Regulator be de le ted and the e l e c t r i c a l power supplied d i r e c t l y from the b a t t e r y a s described.

REFERENCES
1 - - Science Definition Report, Ames letter 242-3, PV-02-181 and PV-02-229.
2 -- Systems Design Study of the Venus Pioneer Spacecraft, Volume I Technical Proposal, Section 4.3.
3 - - Pioneer Venus Directive PVD-13 and PM-14 of- latest revision.
4 -- Advanced Battery Development for Space System, Interim Report for IRAD Task D48705, MMA Denver, January 1973.
5 -- Summary Test Report, Battery 60A-H, PD94S0026, Rechargeability Test Program.
6 -- Capability of the Cadmium-Silver Oxide System by J. F. Dittmann, Eagle-Picher Co., Joplin, Mo., and reported in Progress in Astronautics and Aeronautics, Volume XI, 1963.

FIGURE 1 .
I
---- ---- +&-
- 1 -1p
\
I I 1 .
1 2 3 4 5 6 7 8 9 10
DISCHARGE CAPACITY (AMPERE-HOURS)

E S T ~ B D c n L VOLTAGE mmu 0s. cmnml' DENSITY YOR IRM TYPE SILVER-ZLNC CEZL AT 5 5 9

TO = Entry


APPENDIX A
PROBE BATTERY
VOLTAGE AT MINIMUM
ENTRY TEMPERATURE
IRAD Data ind ica t e s :
2A Rate, 5 5 ' ~ Discharge Data - S/N 60 1.44 SIN 62 1.46 Use 1.45 VICell S/N 64 1.43
with s t a r t v o l t of 1.45 a t 2A f o r 9 A-H c e l l .
2 Amp = 0.065 AIin2 30.8 P l a t e Area ( inL)
Large Probe Power s t a r t = 205 wa t t s
Assume T r i a l Volt = 1.33 VICell
205W Then' 'Oad = 1.33 X 20 Ce l l s = 7 . 7 Amp
7.7 Am 2 56.1 P i a t e Area ( i n q =
From Volts Vs . Current Density - 1.33 V / C e l l Resu l t s a t 5 5 ' ~ and 205 Watts
1.33 V X 20 = 26.6V (Battery)
-25.2 - 1.4 Volt Margin
1.4VZTo One C e l l