Embed Size (px)
Citation preview
TDC Group & DKT HoldingsQ1 2021
.
6 May 2021
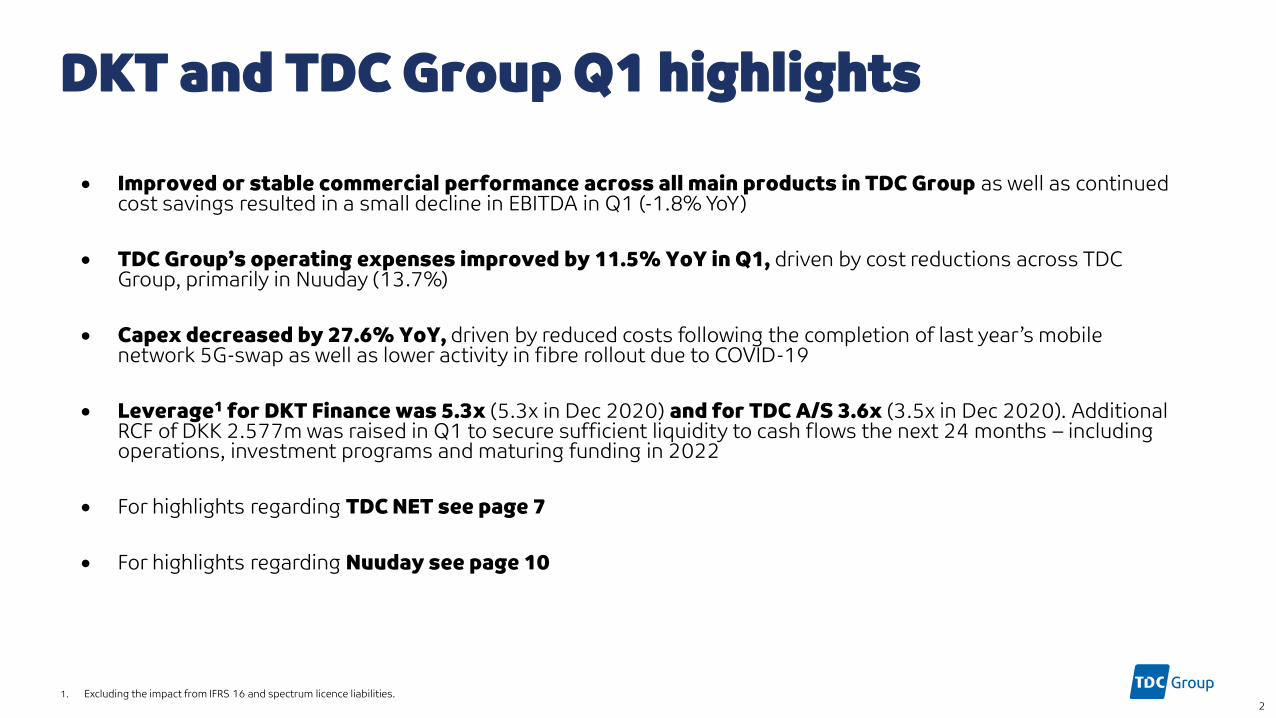
DKT and TDC Group Q1 highlights
1. Excluding the impact from IFRS 16 and spectrum licence liabilities.2
• Improved or stable commercial performance across all main products in TDC Group as well as continued cost savings resulted in a small decline in EBITDA in Q1 (-1.8% YoY)
• TDC Group’s operating expenses improved by 11.5% YoY in Q1, driven by cost reductions across TDC Group, primarily in Nuuday (13.7%)
• Capex decreased by 27.6% YoY, driven by reduced costs following the completion of last year’s mobile network 5G-swap as well as lower activity in fibre rollout due to COVID-19
• Leverage1 for DKT Finance was 5.3x (5.3x in Dec 2020) and for TDC A/S 3.6x (3.5x in Dec 2020). Additional RCF of DKK 2.577m was raised in Q1 to secure sufficient liquidity to cash flows the next 24 months – including operations, investment programs and maturing funding in 2022
• For highlights regarding TDC NET see page 7
• For highlights regarding Nuuday see page 10
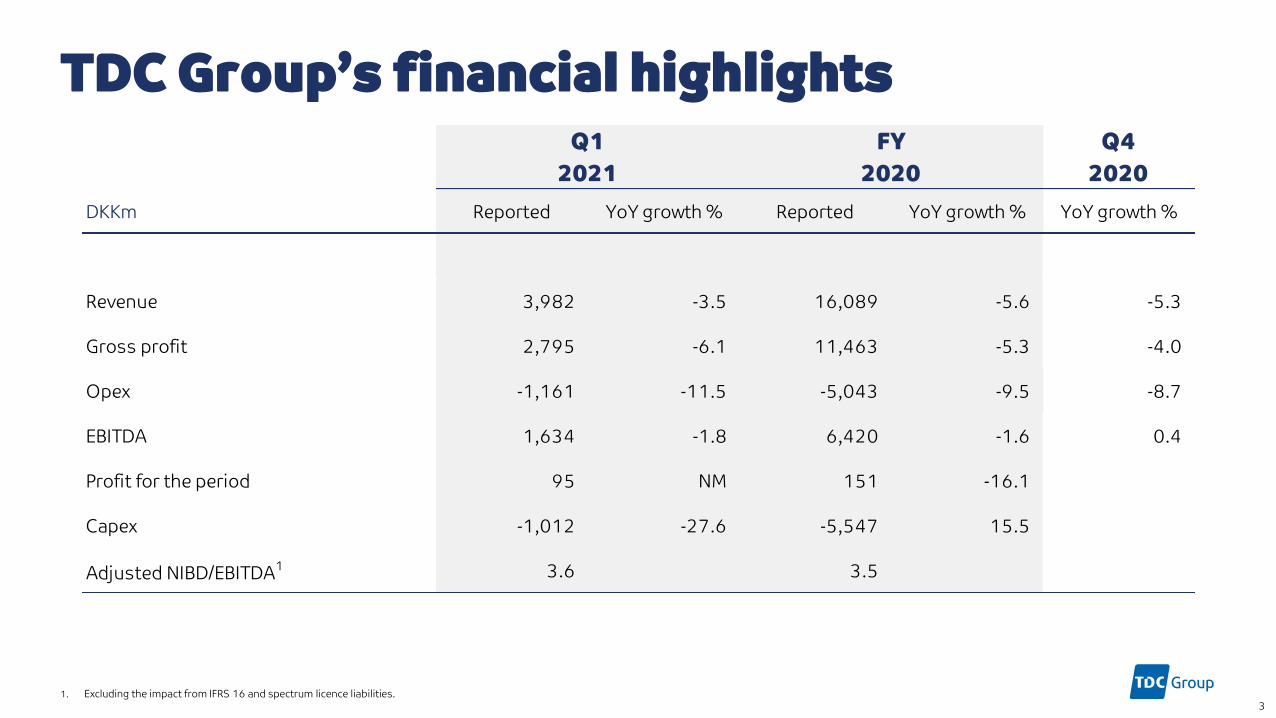
TDC Group’s financial highlights
1. Excluding the impact from IFRS 16 and spectrum licence liabilities.3
Q4
2020
DKKm Reported YoY growth % Reported YoY growth % YoY growth %
Revenue 3,982 -3.5 16,089 -5.6 -5.3
Gross profit 2,795 -6.1 11,463 -5.3 -4.0
Opex -1,161 -11.5 -5,043 -9.5 -8.7
EBITDA 1,634 -1.8 6,420 -1.6 0.4
Profit for the period 95 NM 151 -16.1
Capex -1,012 -27.6 -5,547 15.5
Adjusted NIBD/EBITDA1 3.6 3.5
FY
2020
Q1
2021
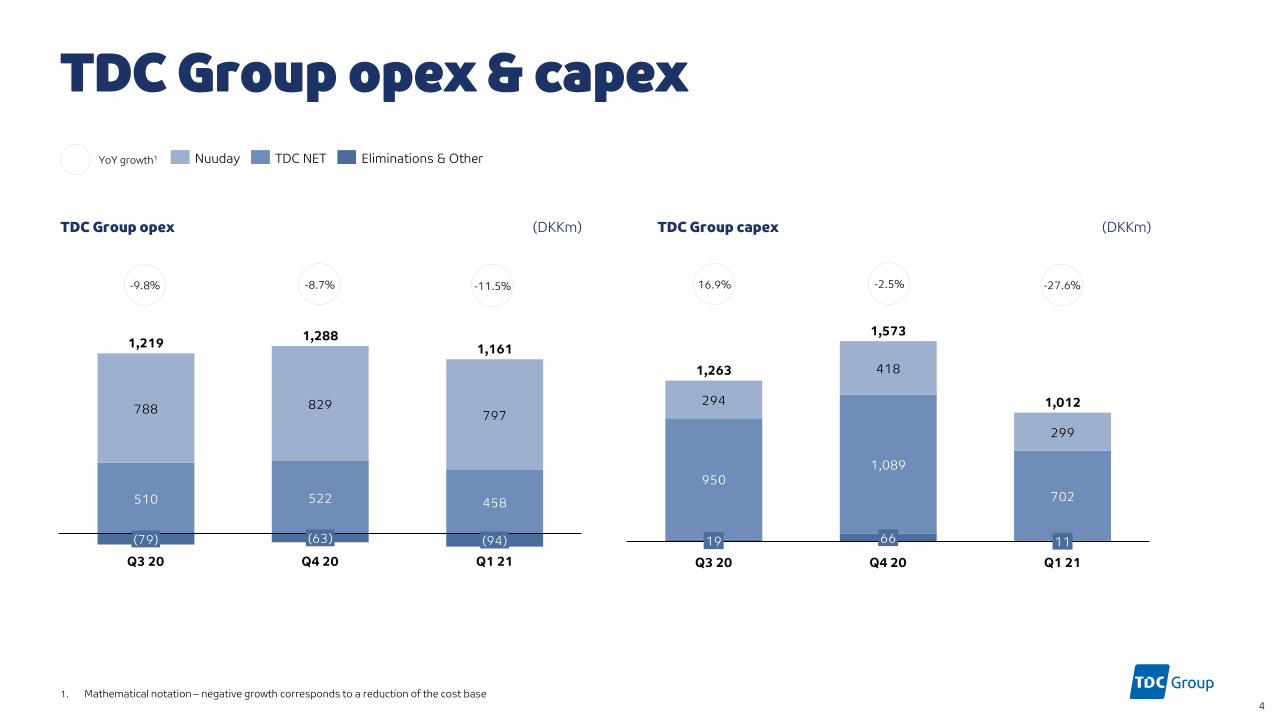
510 522 458
788 829797
Q1 21
1,288
(94)(79) (63)
Q3 20 Q4 20
1,219 1,161
TDC Group opex & capex
TDC Group opex (DKKm)
1. Mathematical notation – negative growth corresponds to a reduction of the cost base
TDC Group capex (DKKm)
YoY growth1
-9.8% -8.7% -11.5%
4
9501,089
702
294
418
299
6619
Q3 20 Q1 21Q4 20
1,263
11
1,573
1,012
Eliminations & OtherNuuday TDC NET
16.9% -2.5% -27.6%
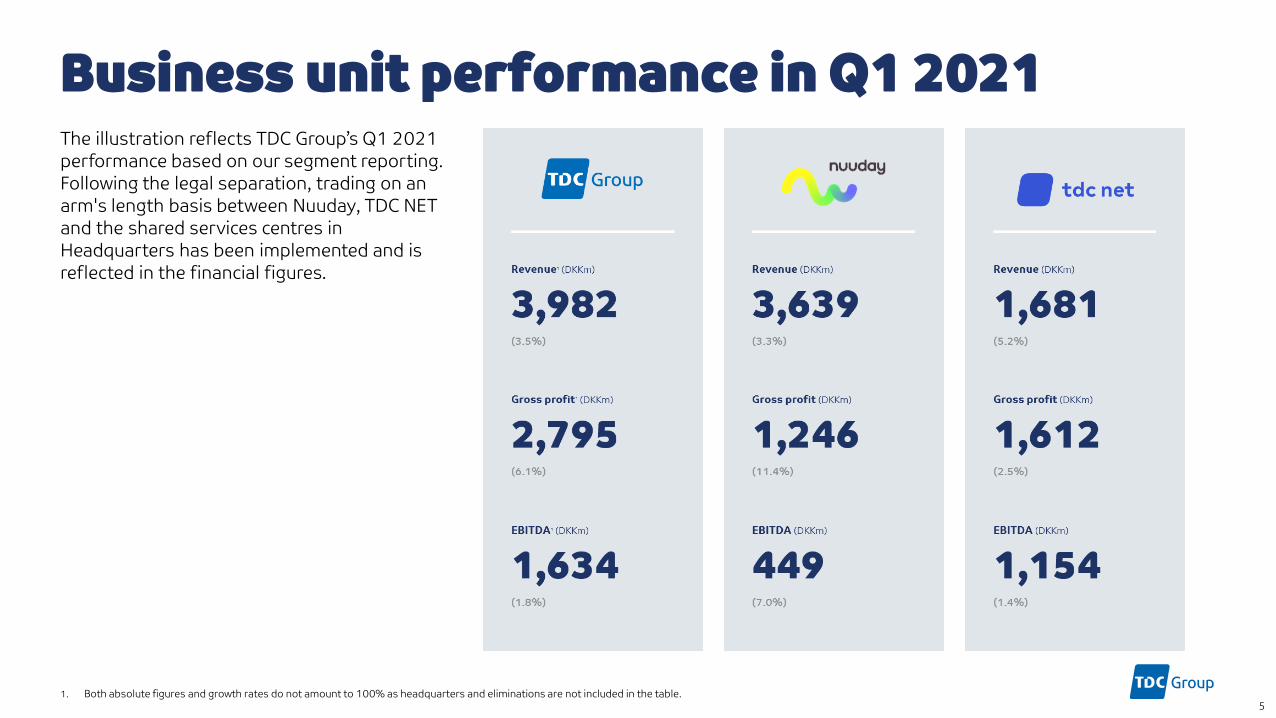
Business unit performance in Q1 2021
1. Both absolute figures and growth rates do not amount to 100% as headquarters and eliminations are not included in the table. 5
The illustration reflects TDC Group’s Q1 2021
performance based on our segment reporting.
Following the legal separation, trading on an
arm's length basis between Nuuday, TDC NET
and the shared services centres in
Headquarters has been implemented and is
reflected in the financial figures.
6
We connect Denmark.To benefit everyone.
TDC NET
TDC NET highlights
7
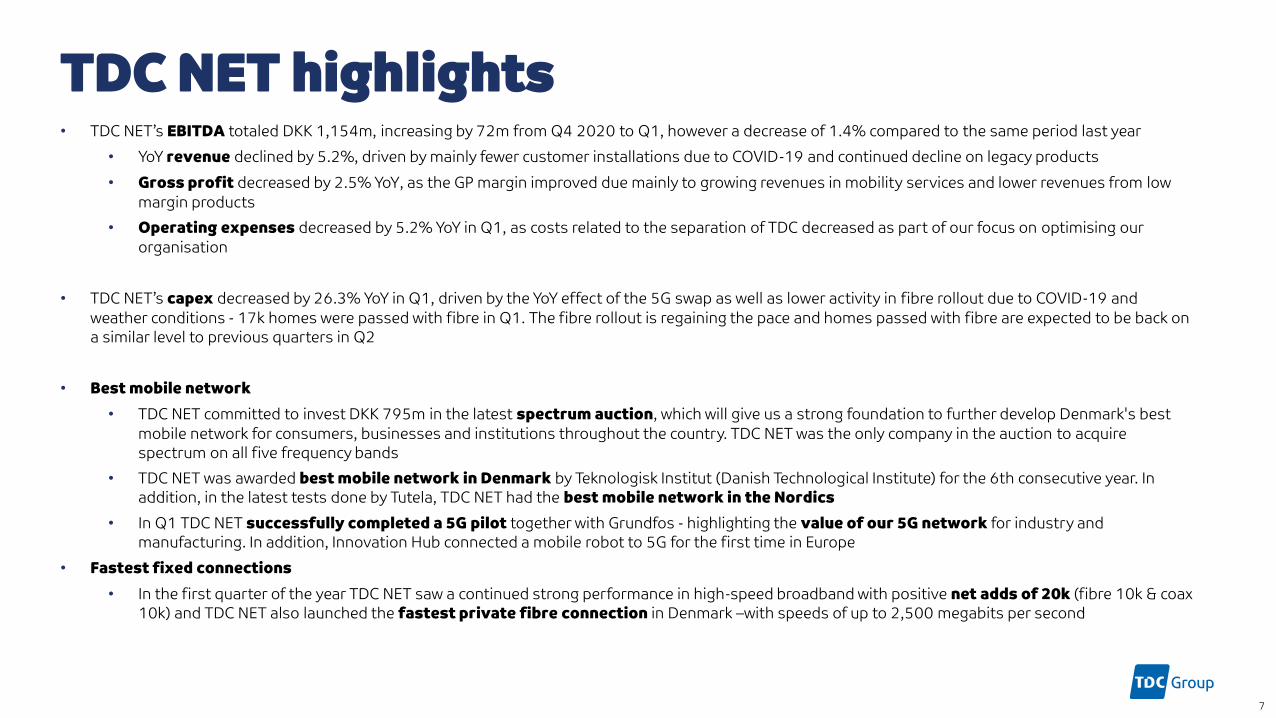
• TDC NET’s EBITDA totaled DKK 1,154m, increasing by 72m from Q4 2020 to Q1, however a decrease of 1.4% compared to the same period last year
• YoY revenue declined by 5.2%, driven by mainly fewer customer installations due to COVID-19 and continued decline on legacy products
• Gross profit decreased by 2.5% YoY, as the GP margin improved due mainly to growing revenues in mobility services and lower revenues from low
margin products
• Operating expenses decreased by 5.2% YoY in Q1, as costs related to the separation of TDC decreased as part of our focus on optimising our
organisation
• TDC NET’s capex decreased by 26.3% YoY in Q1, driven by the YoY effect of the 5G swap as well as lower activity in fibre rollout due to COVID-19 and
weather conditions - 17k homes were passed with fibre in Q1. The fibre rollout is regaining the pace and homes passed with fibre are expected to be back on
a similar level to previous quarters in Q2
• Best mobile network
• TDC NET committed to invest DKK 795m in the latest spectrum auction, which will give us a strong foundation to further develop Denmark's best
mobile network for consumers, businesses and institutions throughout the country. TDC NET was the only company in the auction to acquire
spectrum on all five frequency bands
• TDC NET was awarded best mobile network in Denmark by Teknologisk Institut (Danish Technological Institute) for the 6th consecutive year. In
addition, in the latest tests done by Tutela, TDC NET had the best mobile network in the Nordics
• In Q1 TDC NET successfully completed a 5G pilot together with Grundfos - highlighting the value of our 5G network for industry and
manufacturing. In addition, Innovation Hub connected a mobile robot to 5G for the first time in Europe
• Fastest fixed connections
• In the first quarter of the year TDC NET saw a continued strong performance in high-speed broadband with positive net adds of 20k (fibre 10k & coax
10k) and TDC NET also launched the fastest private fibre connection in Denmark –with speeds of up to 2,500 megabits per second
TDC NET financials
8
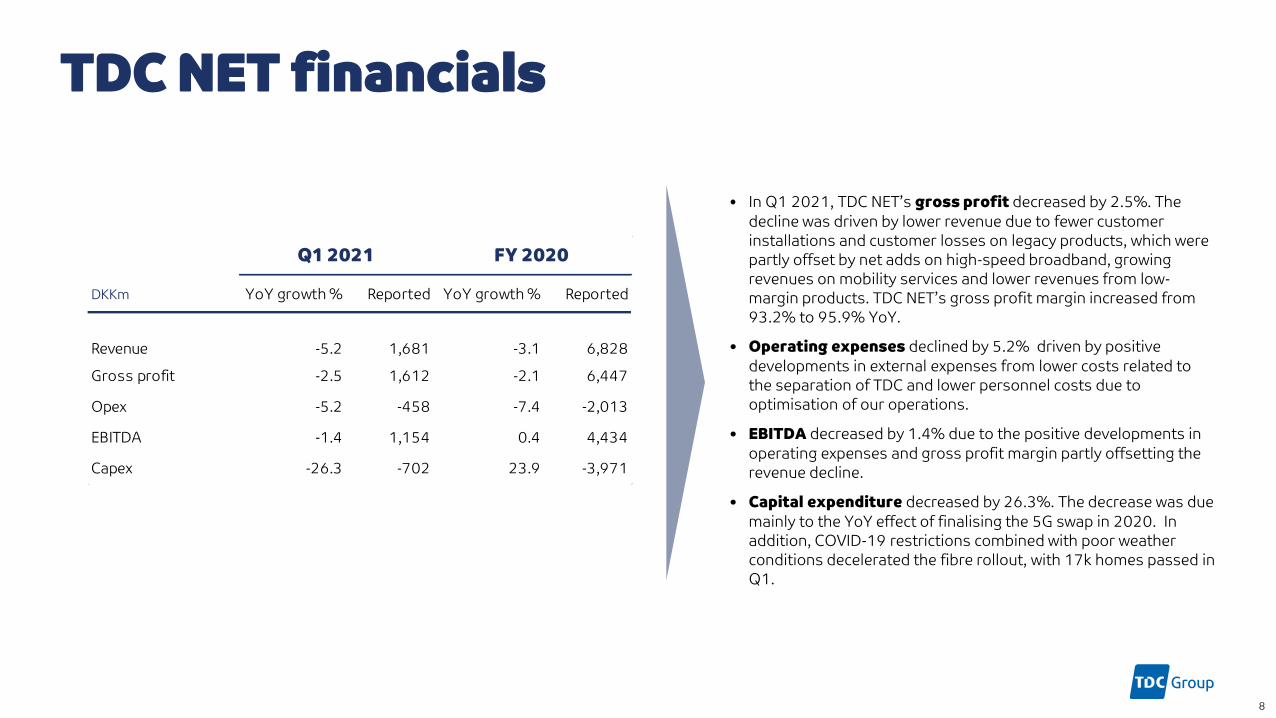
• In Q1 2021, TDC NET’s gross profit decreased by 2.5%. The
decline was driven by lower revenue due to fewer customer
installations and customer losses on legacy products, which were
partly offset by net adds on high-speed broadband, growing
revenues on mobility services and lower revenues from low-
margin products. TDC NET’s gross profit margin increased from
93.2% to 95.9% YoY.
• Operating expenses declined by 5.2% driven by positive
developments in external expenses from lower costs related to
the separation of TDC and lower personnel costs due to
optimisation of our operations.
• EBITDA decreased by 1.4% due to the positive developments in
operating expenses and gross profit margin partly offsetting the
revenue decline.
• Capital expenditure decreased by 26.3%. The decrease was due
mainly to the YoY effect of finalising the 5G swap in 2020. In
addition, COVID-19 restrictions combined with poor weather
conditions decelerated the fibre rollout, with 17k homes passed in
Q1.
DKKm YoY growth % Reported YoY growth % Reported
Revenue -5.2 1,681 -3.1 6,828
Gross profit -2.5 1,612 -2.1 6,447
Opex -5.2 -458 -7.4 -2,013
EBITDA -1.4 1,154 0.4 4,434
Capex -26.3 -702 23.9 -3,971
Q1 2021 FY 2020

Nuuday
Nuuday highlights
10
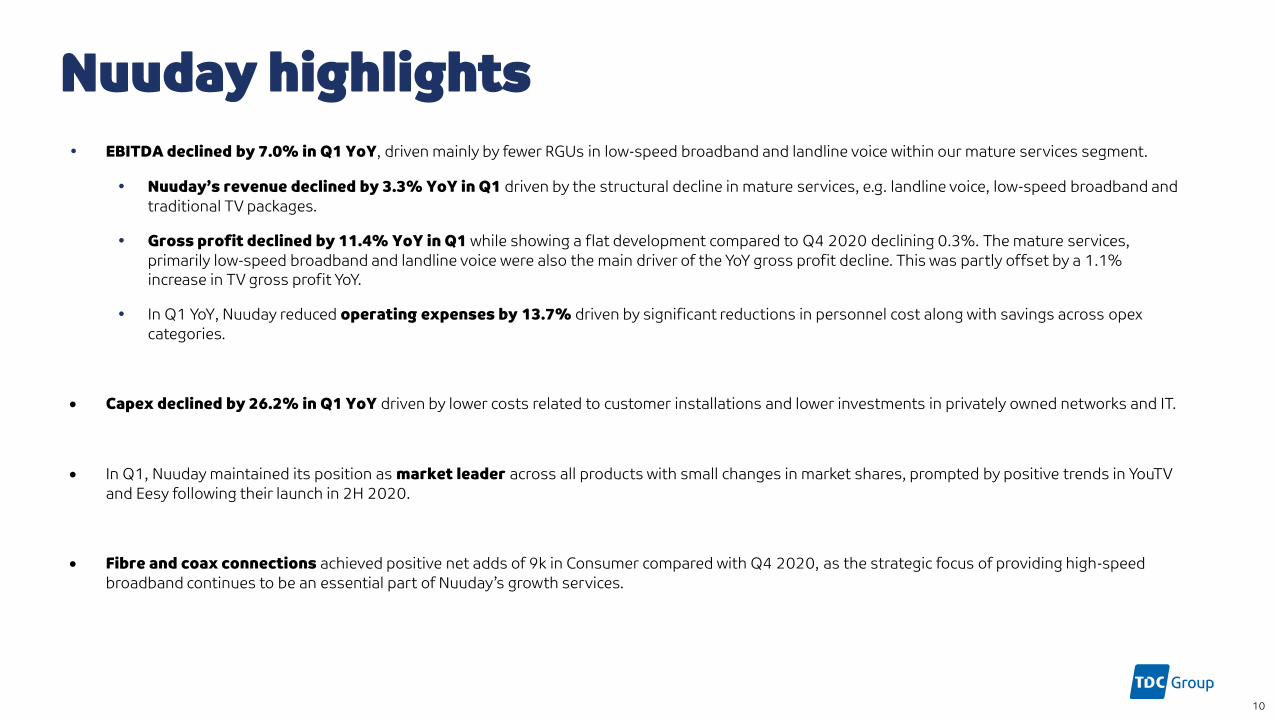
EBITDA declined by 7.0% in Q1 YoY, driven mainly by fewer RGUs in low-speed broadband and landline voice within our mature services segment.
Nuuday’s revenue declined by 3.3% YoY in Q1 driven by the structural decline in mature services, e.g. landline voice, low-speed broadband and
traditional TV packages.
Gross profit declined by 11.4% YoY in Q1 while showing a flat development compared to Q4 2020 declining 0.3%. The mature services,
primarily low-speed broadband and landline voice were also the main driver of the YoY gross profit decline. This was partly offset by a 1.1%
increase in TV gross profit YoY.
In Q1 YoY, Nuuday reduced operating expenses by 13.7% driven by significant reductions in personnel cost along with savings across opex
categories.
• Capex declined by 26.2% in Q1 YoY driven by lower costs related to customer installations and lower investments in privately owned networks and IT.
• In Q1, Nuuday maintained its position as market leader across all products with small changes in market shares, prompted by positive trends in YouTV
and Eesy following their launch in 2H 2020.
• Fibre and coax connections achieved positive net adds of 9k in Consumer compared with Q4 2020, as the strategic focus of providing high-speed
broadband continues to be an essential part of Nuuday’s growth services.
Nuuday financials
11
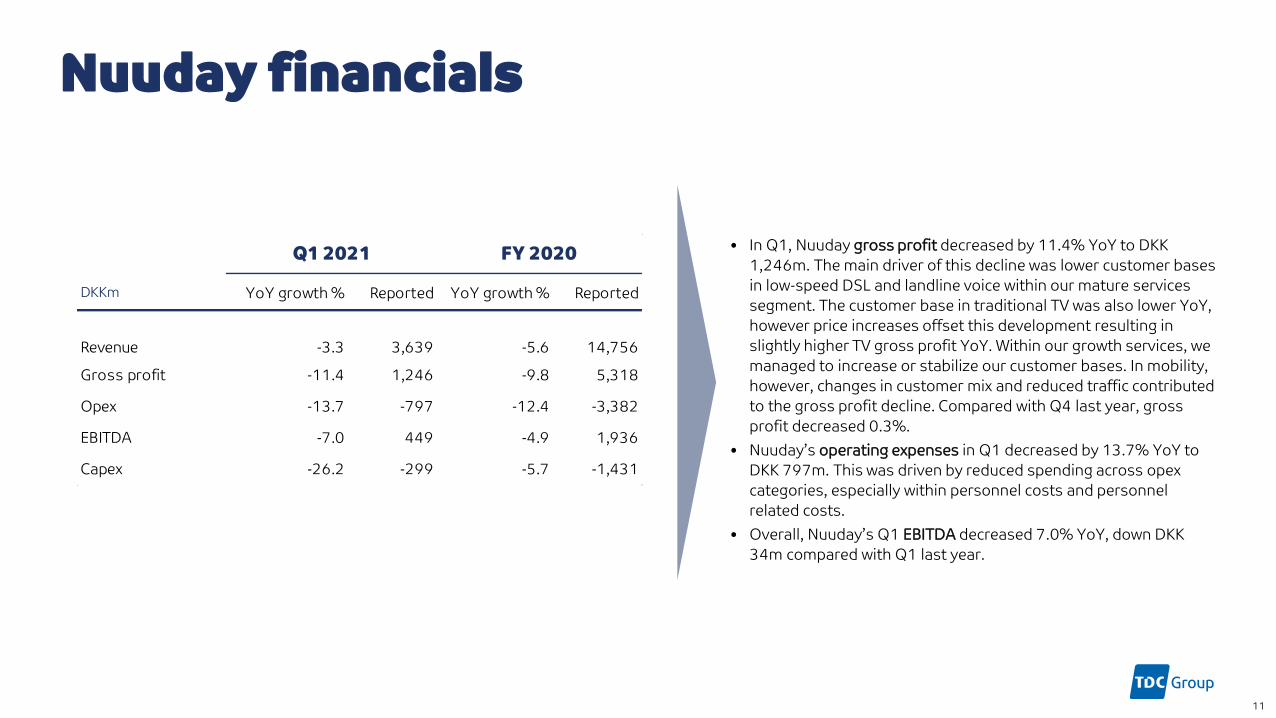
• In Q1, Nuuday gross profit decreased by 11.4% YoY to DKK
1,246m. The main driver of this decline was lower customer bases
in low-speed DSL and landline voice within our mature services
segment. The customer base in traditional TV was also lower YoY,
however price increases offset this development resulting in
slightly higher TV gross profit YoY. Within our growth services, we
managed to increase or stabilize our customer bases. In mobility,
however, changes in customer mix and reduced traffic contributed
to the gross profit decline. Compared with Q4 last year, gross
profit decreased 0.3%.
• Nuuday’s operating expenses in Q1 decreased by 13.7% YoY to
DKK 797m. This was driven by reduced spending across opex
categories, especially within personnel costs and personnel
related costs.
• Overall, Nuuday’s Q1 EBITDA decreased 7.0% YoY, down DKK
34m compared with Q1 last year.
DKKm YoY growth % Reported YoY growth % Reported
Revenue -3.3 3,639 -5.6 14,756
Gross profit -11.4 1,246 -9.8 5,318
Opex -13.7 -797 -12.4 -3,382
EBITDA -7.0 449 -4.9 1,936
Capex -26.2 -299 -5.7 -1,431
Q1 2021 FY 2020
Nuuday products
12
606
760
272 293
Mobility servicesInternet & Network
Consumer Business
883
96 118
TV Landline voice
-5.5%
YoY growth
-4.6% 0.1% -4.9%
-13.5% -13.2%-3.1%
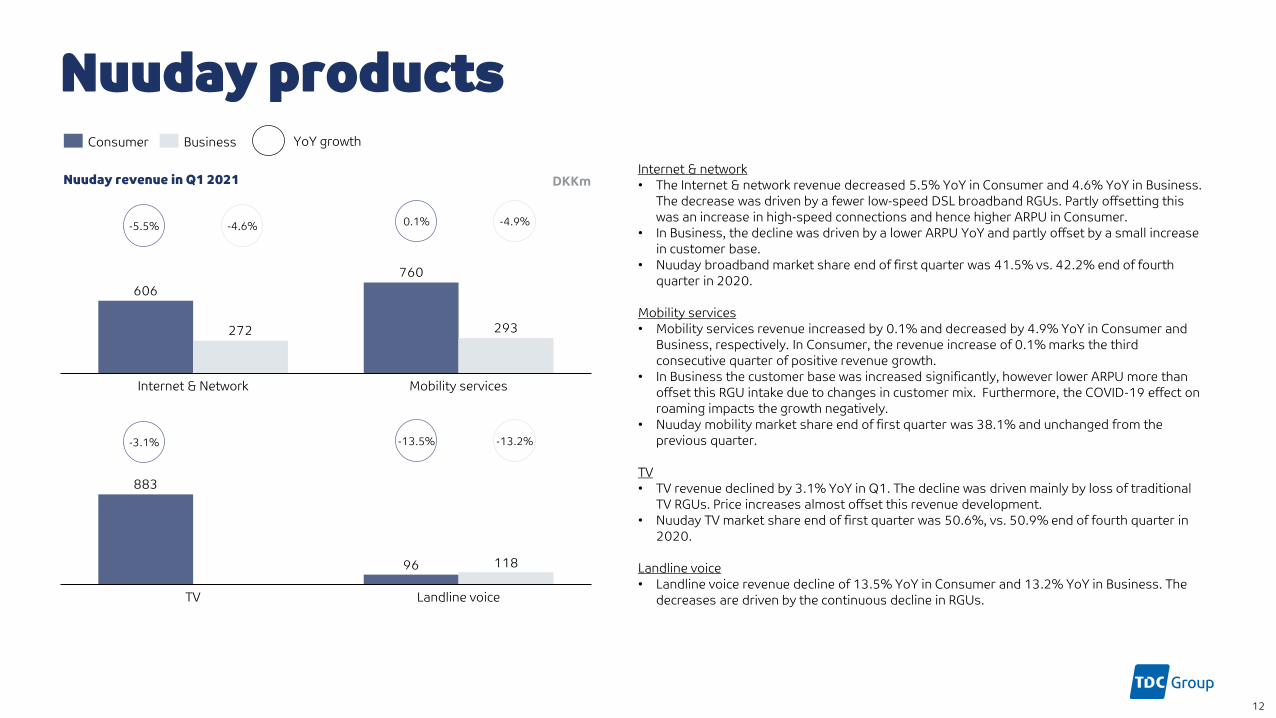
DKKmNuuday revenue in Q1 2021Internet & network
• The Internet & network revenue decreased 5.5% YoY in Consumer and 4.6% YoY in Business.
The decrease was driven by a fewer low-speed DSL broadband RGUs. Partly offsetting this
was an increase in high-speed connections and hence higher ARPU in Consumer.
• In Business, the decline was driven by a lower ARPU YoY and partly offset by a small increase
in customer base.
• Nuuday broadband market share end of first quarter was 41.5% vs. 42.2% end of fourth
quarter in 2020.
Mobility services
• Mobility services revenue increased by 0.1% and decreased by 4.9% YoY in Consumer and
Business, respectively. In Consumer, the revenue increase of 0.1% marks the third
consecutive quarter of positive revenue growth.
• In Business the customer base was increased significantly, however lower ARPU more than
offset this RGU intake due to changes in customer mix. Furthermore, the COVID-19 effect on
roaming impacts the growth negatively.
• Nuuday mobility market share end of first quarter was 38.1% and unchanged from the
previous quarter.
TV
• TV revenue declined by 3.1% YoY in Q1. The decline was driven mainly by loss of traditional
TV RGUs. Price increases almost offset this revenue development.
• Nuuday TV market share end of first quarter was 50.6%, vs. 50.9% end of fourth quarter in
2020.
Landline voice
• Landline voice revenue decline of 13.5% YoY in Consumer and 13.2% YoY in Business. The
decreases are driven by the continuous decline in RGUs.

DKT Holdings
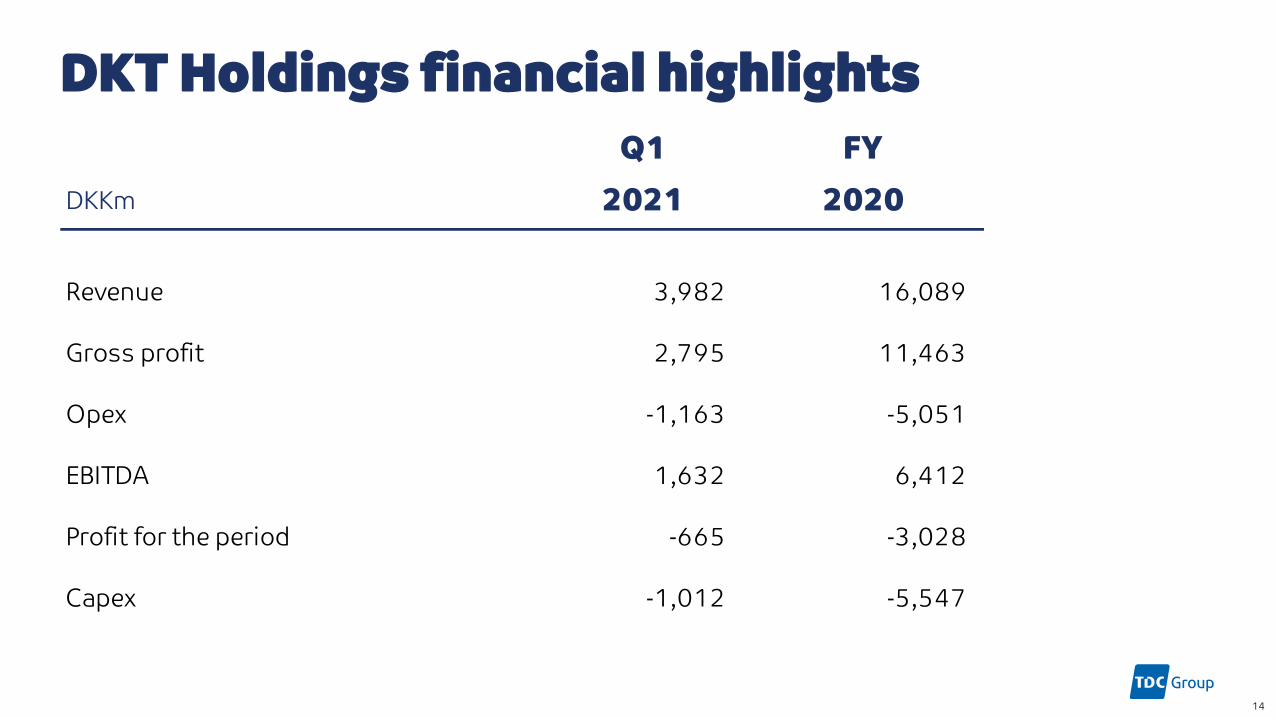
DKT Holdings financial highlights
14
Q1 FY
DKKm 2021 2020
Revenue 3,982 16,089
Gross profit 2,795 11,463
Opex -1,163 -5,051
EBITDA 1,632 6,412
Profit for the period -665 -3,028
Capex -1,012 -5,547
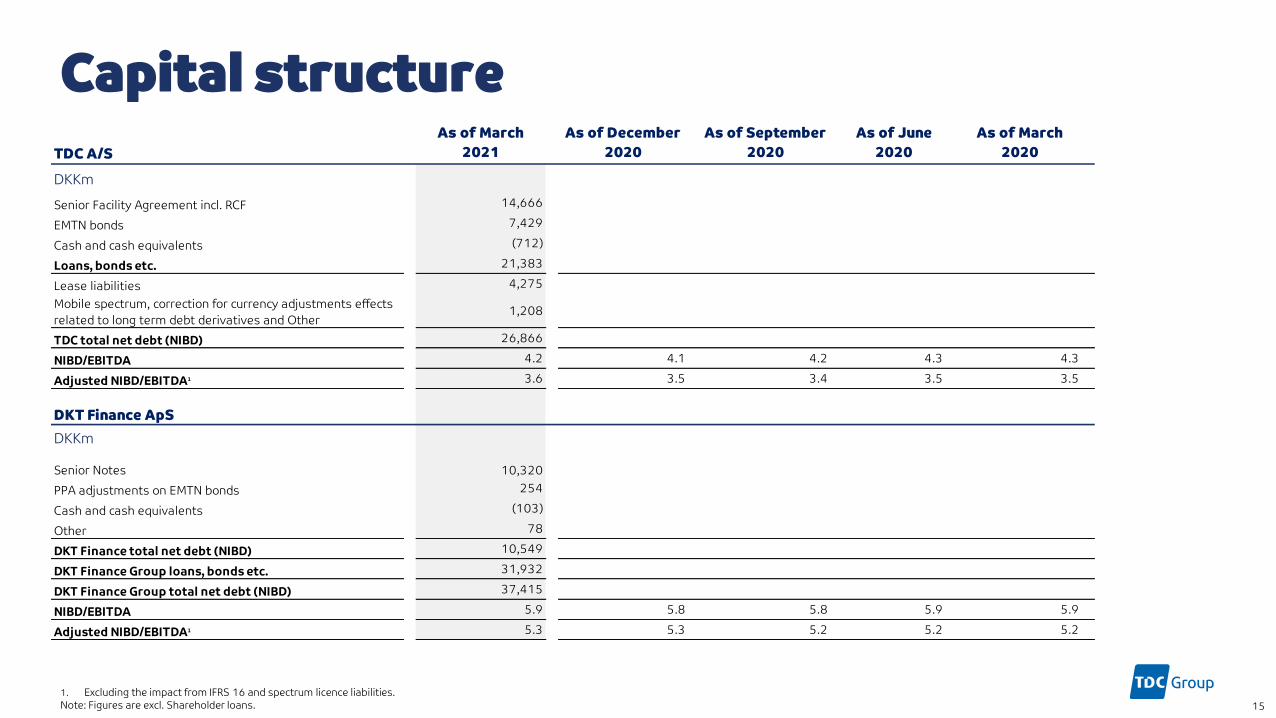
Capital structure
1. Excluding the impact from IFRS 16 and spectrum licence liabilities.
Note: Figures are excl. Shareholder loans. 15
TDC A/S
As of March
2021
As of December
2020
As of September
2020
As of June
2020
As of March
2020
DKKm
Senior Facility Agreement incl. RCF 14,666
EMTN bonds 7,429
Cash and cash equivalents (712)
Loans, bonds etc. 21,383
Lease liabilities 4,275
Mobile spectrum, correction for currency adjustments effects
related to long term debt derivatives and Other 1,208
TDC total net debt (NIBD) 26,866
NIBD/EBITDA 4.2 4.1 4.2 4.3 4.3
Adjusted NIBD/EBITDA1 3.6 3.5 3.4 3.5 3.5
DKT Finance ApS
DKKm
Senior Notes 10,320
PPA adjustments on EMTN bonds 254
Cash and cash equivalents (103)
Other 78
DKT Finance total net debt (NIBD) 10,549
DKT Finance Group loans, bonds etc. 31,932
DKT Finance Group total net debt (NIBD) 37,415
NIBD/EBITDA 5.9 5.8 5.8 5.9 5.9
Adjusted NIBD/EBITDA1 5.3 5.3 5.2 5.2 5.2