Embed Size (px)
Citation preview

DJIA 1
Beneath the Calm Waters: A Study of the Dow Index
Group 5 members
Project Choice: Hyo Joon You
Data Retrieval: Stephen Meronk
Statistical Analysis: Christopher Ross
Powerpoint Presentation: Anthony Mak
Executive Summary: Joseph Singh
Technical Appendix: Alejandro Vicente

DJIA 2
Brief info about the Dow A measure of entire U.S. market,
covering all major industries Maintained and reviewed by the
editors of WSJ. Stocks selected for reputation, growth, popularity, representation of its industry
Dow Jones Index currently consisting of 30 components (individual companies)

3DJIA
DJIA Calculation DJIA = sum of component stock prices divided by
a divisor
i ti
tt pd
I ),(
1
where It = Dow index value at time t, dt =
divisor value at time t, and P(i,t) = price of
component i at time t.

DJIA 4
Introduction What: Is there a relationship between the Dow
Jones set divisor and DJIA? Why: If there is, then the index is biased in
that the divisor, which is determined by WSJ, can be set in such a way as to keep the DJIA levels relatively constant when prices of the components are in fact changing. An unbiased divisor should only reflect splits and dividends.
How: Analyze daily prices of stocks and find the relationship between changes in DJIA and divisor.

DJIA 5
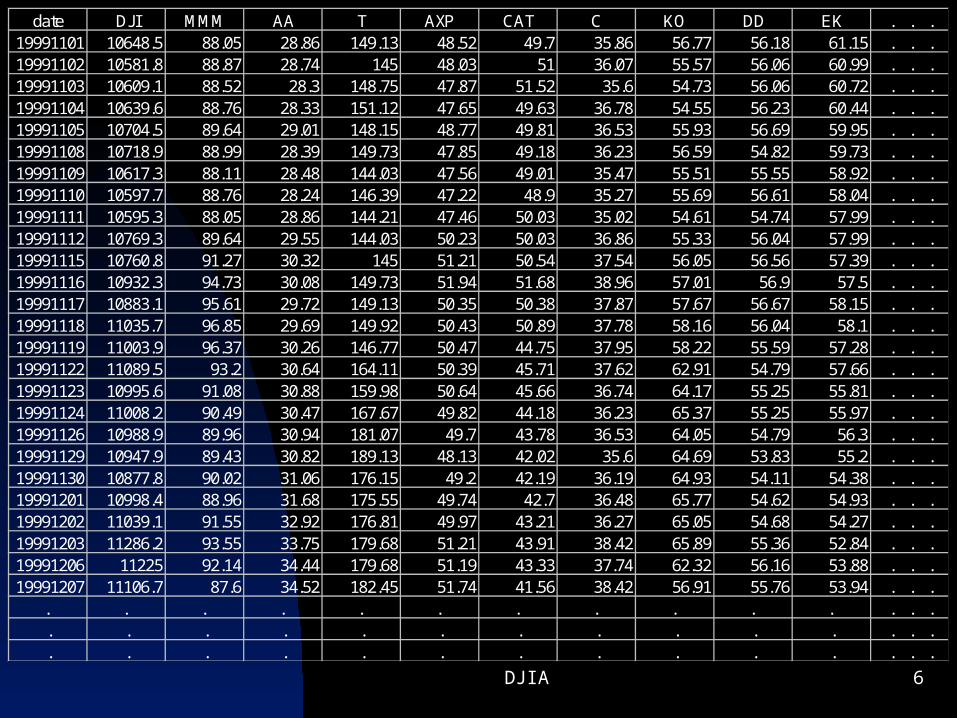
Data
Closing index values and prices at each operating day from November 1st, 1999 to November 22nd, 2002
date DJI MMM AA T AXP CAT C KO DD EK XOM19991101 10648.5 88.05 28.86 149.13 48.52 49.7 35.86 56.77 56.18 61.15 37.1319991102 10581.8 88.87 28.74 145 48.03 51 36.07 55.57 56.06 60.99 36.8119991103 10609.1 88.52 28.3 148.75 47.87 51.52 35.6 54.73 56.06 60.72 36.2619991104 10639.6 88.76 28.33 151.12 47.65 49.63 36.78 54.55 56.23 60.44 36.2619991105 10704.5 89.64 29.01 148.15 48.77 49.81 36.53 55.93 56.69 59.95 35.0819991108 10718.9 88.99 28.39 149.73 47.85 49.18 36.23 56.59 54.82 59.73 36.9119991109 10617.3 88.11 28.48 144.03 47.56 49.01 35.47 55.51 55.55 58.92 37.4119991110 10597.7 88.76 28.24 146.39 47.22 48.9 35.27 55.69 56.61 58.04 37.7519991111 10595.3 88.05 28.86 144.21 47.46 50.03 35.02 54.61 54.74 57.99 38.1519991112 10769.3 89.64 29.55 144.03 50.23 50.03 36.86 55.33 56.04 57.99 38.6819991115 10760.8 91.27 30.32 145 51.21 50.54 37.54 56.05 56.56 57.39 38.7419991116 10932.3 94.73 30.08 149.73 51.94 51.68 38.96 57.01 56.9 57.5 39.3319991117 10883.1 95.61 29.72 149.13 50.35 50.38 37.87 57.67 56.67 58.15 39.8619991118 11035.7 96.85 29.69 149.92 50.43 50.89 37.78 58.16 56.04 58.1 40.2619991119 11003.9 96.37 30.26 146.77 50.47 44.75 37.95 58.22 55.59 57.28 39.5819991122 11089.5 93.2 30.64 164.11 50.39 45.71 37.62 62.91 54.79 57.66 39.5119991123 10995.6 91.08 30.88 159.98 50.64 45.66 36.74 64.17 55.25 55.81 38.7419991124 11008.2 90.49 30.47 167.67 49.82 44.18 36.23 65.37 55.25 55.97 39.319991126 10988.9 89.96 30.94 181.07 49.7 43.78 36.53 64.05 54.79 56.3 38.7419991129 10947.9 89.43 30.82 189.13 48.13 42.02 35.6 64.69 53.83 55.2 39.4219991130 10877.8 90.02 31.06 176.15 49.2 42.19 36.19 64.93 54.11 54.38 39.3919991201 10998.4 88.96 31.68 175.55 49.74 42.7 36.48 65.77 54.62 54.93 40.9819991202 11039.1 91.55 32.92 176.81 49.97 43.21 36.27 65.05 54.68 54.27 40.7719991203 11286.2 93.55 33.75 179.68 51.21 43.91 38.42 65.89 55.36 52.84 40.9919991206 11225 92.14 34.44 179.68 51.19 43.33 37.74 62.32 56.16 53.88 41.6619991207 11106.7 87.6 34.52 182.45 51.74 41.56 38.42 56.91 55.76 53.94 41.6619991208 11068.1 88.54 34.03 181.6 51.53 41.06 37.58 57.87 54.17 53.17 41.4619991209 11134.8 88.25 34.79 182.23 52.04 41.67 37.03 59.92 53.71 53.61 42.7819991210 11224.7 88.49 35.98 179.68 54.63 42.47 37.7 61.01 54.68 53.83 41.13
DJIA 6
date DJI MMM AA T AXP CAT C KO DD EK . . .19991101 10648.5 88.05 28.86 149.13 48.52 49.7 35.86 56.77 56.18 61.15 . . .19991102 10581.8 88.87 28.74 145 48.03 51 36.07 55.57 56.06 60.99 . . .19991103 10609.1 88.52 28.3 148.75 47.87 51.52 35.6 54.73 56.06 60.72 . . .19991104 10639.6 88.76 28.33 151.12 47.65 49.63 36.78 54.55 56.23 60.44 . . .19991105 10704.5 89.64 29.01 148.15 48.77 49.81 36.53 55.93 56.69 59.95 . . .19991108 10718.9 88.99 28.39 149.73 47.85 49.18 36.23 56.59 54.82 59.73 . . .19991109 10617.3 88.11 28.48 144.03 47.56 49.01 35.47 55.51 55.55 58.92 . . .19991110 10597.7 88.76 28.24 146.39 47.22 48.9 35.27 55.69 56.61 58.04 . . .19991111 10595.3 88.05 28.86 144.21 47.46 50.03 35.02 54.61 54.74 57.99 . . .19991112 10769.3 89.64 29.55 144.03 50.23 50.03 36.86 55.33 56.04 57.99 . . .19991115 10760.8 91.27 30.32 145 51.21 50.54 37.54 56.05 56.56 57.39 . . .19991116 10932.3 94.73 30.08 149.73 51.94 51.68 38.96 57.01 56.9 57.5 . . .19991117 10883.1 95.61 29.72 149.13 50.35 50.38 37.87 57.67 56.67 58.15 . . .19991118 11035.7 96.85 29.69 149.92 50.43 50.89 37.78 58.16 56.04 58.1 . . .19991119 11003.9 96.37 30.26 146.77 50.47 44.75 37.95 58.22 55.59 57.28 . . .19991122 11089.5 93.2 30.64 164.11 50.39 45.71 37.62 62.91 54.79 57.66 . . .19991123 10995.6 91.08 30.88 159.98 50.64 45.66 36.74 64.17 55.25 55.81 . . .19991124 11008.2 90.49 30.47 167.67 49.82 44.18 36.23 65.37 55.25 55.97 . . .19991126 10988.9 89.96 30.94 181.07 49.7 43.78 36.53 64.05 54.79 56.3 . . .19991129 10947.9 89.43 30.82 189.13 48.13 42.02 35.6 64.69 53.83 55.2 . . .19991130 10877.8 90.02 31.06 176.15 49.2 42.19 36.19 64.93 54.11 54.38 . . .19991201 10998.4 88.96 31.68 175.55 49.74 42.7 36.48 65.77 54.62 54.93 . . .19991202 11039.1 91.55 32.92 176.81 49.97 43.21 36.27 65.05 54.68 54.27 . . .19991203 11286.2 93.55 33.75 179.68 51.21 43.91 38.42 65.89 55.36 52.84 . . .19991206 11225 92.14 34.44 179.68 51.19 43.33 37.74 62.32 56.16 53.88 . . .19991207 11106.7 87.6 34.52 182.45 51.74 41.56 38.42 56.91 55.76 53.94 . . .
. . . . . . . . . . . . . .. . . . . . . . . . . . . .. . . . . . . . . . . . . .
7
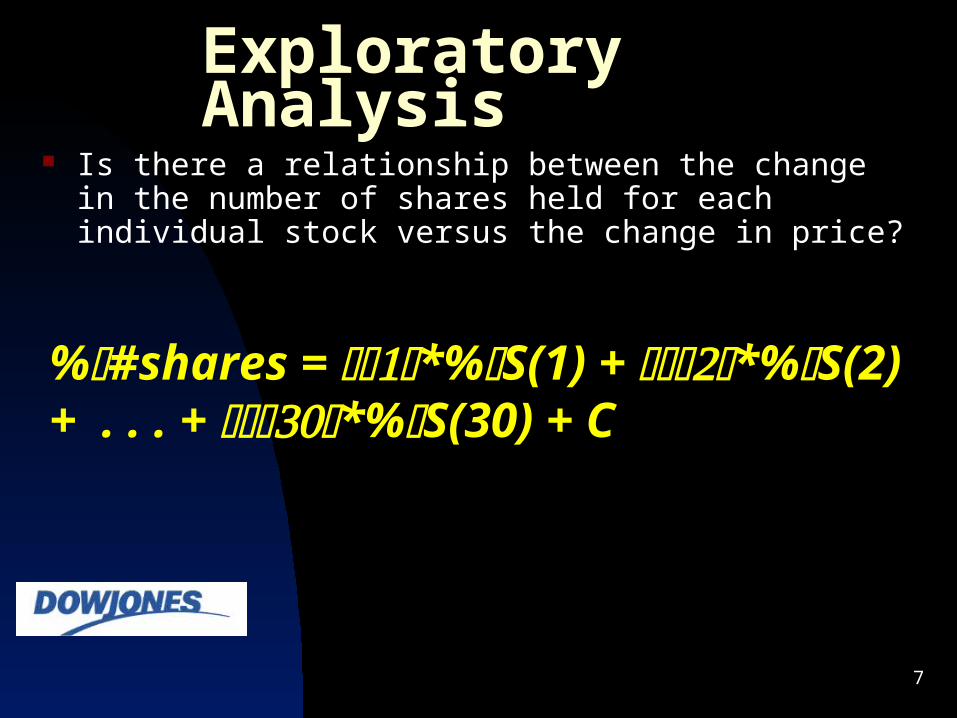
Exploratory Analysis Is there a relationship between the change in the number of
shares held for each individual stock versus the change in price?
%#shares = *%S(1) + *%S(2) + . . . + *%S(30) + C

8
Exploratory AnalysisCall:lm(formula = shares ~ MMM + AA + T + AXP + CAT + C + KO + DD + EK + XOM + GE + GM + HPQ + HD + HON + INTC + IBM + IP + JPM + JNJ + MCD + MRK + MSFT + MO + PG + SBC + BA + DIS + UTX + WMT + 0, data = P) Residuals: Min 1Q Median 3Q Max -1.39436 -0.24627 -0.02073 0.24519 1.94281 Coefficients: Estimate Std. Error t value Pr(>|t|) MMM 0.013522 0.003633 3.722 0.000213 ***AA 0.015499 0.003079 5.034 6.04e-07 ***T -0.132302 0.003210 -41.212 < 2e-16 ***AXP 0.018347 0.004150 4.421 1.13e-05 ***CAT -0.025740 0.005441 -4.731 2.68e-06 ***C 0.029800 0.003885 7.670 5.43e-14 ***KO 0.001976 0.004308 0.459 0.646631 DD -0.043242 0.005971 -7.242 1.12e-12 ***EK -0.001057 0.002805 -0.377 0.706283 XOM 0.016022 0.005169 3.100 0.002009 ** GE 0.019873 0.003558 5.586 3.27e-08 ***GM 0.007839 0.002964 2.644 0.008357 ** HPQ 0.002107 0.002697 0.781 0.435052 HD -0.000881 0.003317 -0.266 0.790606 HON -0.017194 0.002937 -5.855 7.17e-09 ***INTC -0.004738 0.001846 -2.567 0.010463 * IBM 0.003808 0.003136 1.214 0.225104

9
Exploratory AnalysisIP 0.039177 0.006189 6.331 4.24e-10 ***JPM -0.019003 0.003597 -5.284 1.67e-07 ***JNJ -0.007824 0.004463 -1.753 0.080017 . MCD 0.001297 0.004616 0.281 0.778833 MRK -0.011812 0.003347 -3.529 0.000443 ***MSFT -0.019897 0.002943 -6.761 2.79e-11 ***MO 0.007771 0.001474 5.271 1.78e-07 ***PG -0.039595 0.004155 -9.529 < 2e-16 ***SBC 0.013263 0.003583 3.702 0.000230 ***BA 0.014151 0.002902 4.876 1.33e-06 ***DIS -0.004581 0.002725 -1.681 0.093097 . UTX -0.009107 0.003467 -2.627 0.008804 ** WMT 0.008481 0.003889 2.181 0.029519 * ---Signif. codes: 0 `***' 0.001 `**' 0.01 `*' 0.05 `.' 0.1 ` ' 1 Residual standard error: 0.4177 on 738 degrees of freedomMultiple R-Squared: 0.9987, Adjusted R-squared: 0.9986 F-statistic: 1.875e+04 on 30 and 738 DF, p-value: < 2.2e-16

10
Exploratory Analysis
date DJI Shares %changeDJ %changeShares19991101 10648.50 6.26 0.00% 0.00%19991102 10581.80 6.27 -0.63% 0.13%19991103 10609.10 6.26 -0.37% 0.00%19991104 10639.60 6.28 -0.08% 0.18%19991105 10704.50 6.29 0.53% 0.44%19991108 10718.90 6.29 0.66% 0.47%19991109 10617.30 6.30 -0.29% 0.59%19991110 10597.70 6.29 -0.48% 0.44%19991111 10595.30 6.30 -0.50% 0.55%19991112 10769.30 6.33 1.13% 0.97%19991115 10760.80 6.33 1.05% 1.00%19991116 10932.30 6.32 2.67% 0.95%19991117 10883.10 6.32 2.20% 0.81%19991118 11035.70 6.32 3.64% 0.86%19991119 11003.90 6.33 3.34% 1.04%19991122 11089.50 6.28 4.14% 0.32%19991123 10995.60 6.29 3.26% 0.45%19991124 11008.20 6.26 3.38% 0.01%19991126 10988.90 6.23 3.20% -0.61%19991129 10947.90 6.20 2.81% -1.06%19991130 10877.80 6.21 2.15% -0.79%19991201 10998.40 6.24 3.29% -0.46%19991202 11039.10 6.23 3.67% -0.48%19991203 11286.20 6.24 5.99% -0.41%19991206 11225.00 6.23 5.41% -0.54%19991207 11106.70 6.25 4.30% -0.15%19991208 11068.10 6.24 3.94% -0.34%
. . . . .
. . . . .
. . . . .

DJIA 11
Exploratory Analysis
DJIA 12
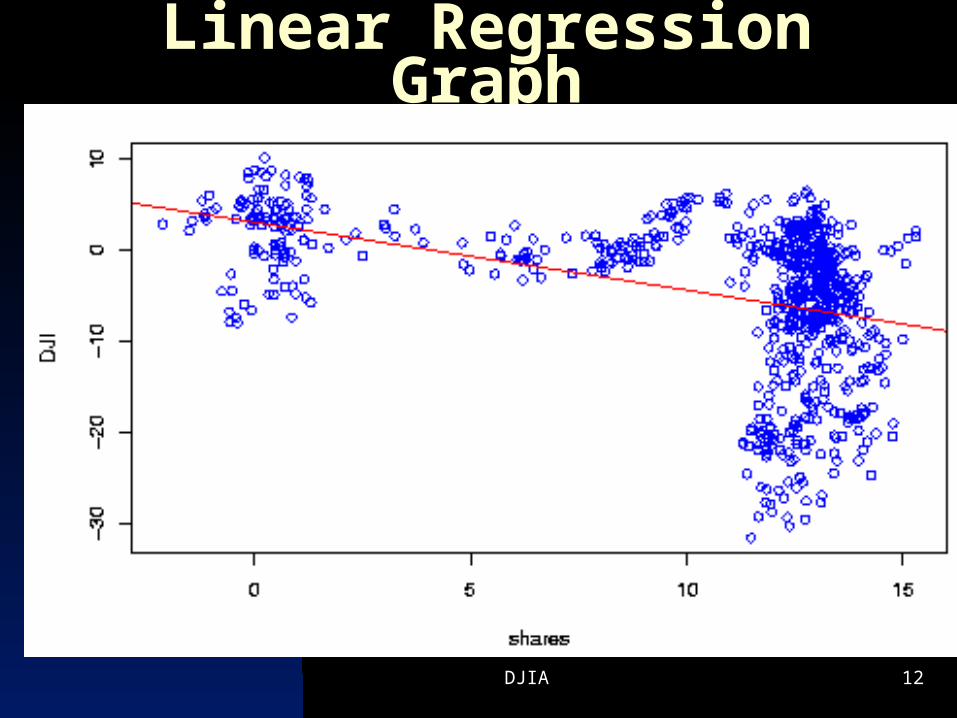
Linear Regression Graph

DJIA 13
Statistical AnalysisCall:
lm(formula = DJI ~ shares, data = P)
Residuals:
Min 1Q Median 3Q Max
-26.069 -2.791 1.497 5.453 12.928
Coefficients:
Estimate Std. Error t value Pr(>|t|)
(Intercept) 3.04238 0.65735 4.628 4.33e-06 ***
shares -0.74398 0.05811 -12.802 < 2e-16 ***
---
Signif. codes: 0 `***' 0.001 `**' 0.01 `*' 0.05 `.' 0.1 ` ' 1
Residual standard error: 7.527 on 766 degrees of freedom
Multiple R-Squared: 0.1763, Adjusted R-squared: 0.1752
F-statistic: 163.9 on 1 and 766 DF, p-value: < 2.2e-16
Formulas:
%DJIA = *%#shares + C
%DJIA = -0.74%#shares + 3.04
DJIA 14
Conclusions
There is a statistically significant relationship between the divisor values and the movements of DJIA across time.
Effort to inflate index value above fair valuation?

DJIA 15
Questions?