Embed Size (px)
Citation preview
Vol. 13, 2019-45 | October 29, 2019 | http://dx.doi.org/10.5018/economics-ejournal.ja.2019-45
Dividend payout ratio follows a Tweedie distribution: international evidence
Victor Dragotă, Daniel Traian Pele, and Hanaan Yaseen
Abstract Dividend policy is still a largely discussed issue in corporate finance literature. One of the main indicators used in analysing the dividend policy is the dividend payout ratio. Using a database consisting of 12,085 companies operating in 73 countries, for the period 2008– 2014, the authors found that the dividend payout ratio follows a Tweedie distribution, and not a normal one. This distribution is stable over time for the entire analysed period. In addition, it describes the case of almost all the countries included in the sample. Thus, a better estimation of the probability that dividend payout ratio is lower or higher than a benchmark can be provided. Also, an analysis of dividend policy, distinctly considering payer versus non-payer companies, can offer additional important information for both practitioners and academics.
JEL G35 C01 C51 C55 Keywords Dividend policy; dividend payout ratio; Tweedie distribution
Authors Victor Dragotă, Bucharest University of Economic Studies, Romania, [email protected] Daniel Traian Pele, Bucharest University of Economic Studies, Romania Hanaan Yaseen, Bucharest University of Economic Studies, Romania
Citation Victor Dragotă, Daniel Traian Pele, and Hanaan Yaseen (2019). Dividend payout ratio follows a Tweedie distribution: international evidence. Economics: The Open-Access, Open-Assessment E-Journal, 13 (2019-45): 1–34. http://dx.doi.org/10.5018/economics-ejournal.ja.2019-45
Received June 4, 2019 Published as Economics Discussion Paper July 2, 2019 Revised October 16, 2019 Accepted October 17, 2019 Published October 29, 2019 © Author(s) 2019. Licensed under the Creative Commons License - Attribution 4.0 International (CC BY 4.0)
Economics: The Open‐Access, Open‐Assessment E‐Journal 13 (2019–45)
www.economics‐ejournal.org 2
1 Introduction
Corporate finance literature discusses dividend policy from different perspectives (Lintner 1956, Miller and Modigliani 1961, Bhattacharya 1979, Easterbrook 1984, Holder et al. 1998, La Porta et al. 2000, Fama and French 2001, Fidrmuc and Jacob, 2010, Floyd et al, 2015, Jiang et al. 2017, etc.). Different viewpoints on dividend policy are contradictory, from its neutral impact on firms’ value (Miller and Modigliani 1961) to normative advices to increase (Graham and Dodd 1951) or to decrease (Walter 1956) the amount paid to shareholders, or to explain this financial decision through agency problems, asymmetrical information, socio-cultural or institutional factors, etc. (Bhattacharya 1979, Easterbrook 1984, La Porta et al. 2000, Fidrmuc and Jacob 2010, etc.). Among them, the studies concerning the factors determining dividend policy are an important direction (see, among others, La Porta et al. 2000, Fidrmuc and Jacob 2010, Nicolosi 2013, Ye et al. 2019).
Different indicators are used for modelling dividend policy, each of them with its infor-mative power. One of the most important is the dividend payout ratio (Holder et al. 1998, La Porta et al. 2000, Ye et al. 2019) (hereafter, DPR), respectively the part of the net earnings paid to shareholders, as dividends, considering the firms which record net profits (and excluding those which record losses).1 In a sense, DPR reflects exactly the interest expressed by one profitable company for paying dividends to its shareholders. Analysed for one period, a DPR equal to 100% reflects a totally dedicated policy to pay dividends to shareholders, and one of 0% a reflection of a non-interest to dividends (argued in many cases as the company’s interest for investing). DPR is used in a large variety of studies, as dependent variable (e.g., Holder et al. 1998, La Porta et al. 2000, Faccio et al. 2001, Fidrmuc and Jacob 2010, Jiang et al. 2017, etc.), but also as explanatory variable in different contexts (e.g., Lintner 1956, Lamont 1998, Lettau and Ludvigson 2001, Arnott and Asness 2003, Cincotti et al. 2010, Baker et al. 2012, He et al. 2017). In such studies, the average DPR is often considered representative, as in the case of a Gaussian distribution.
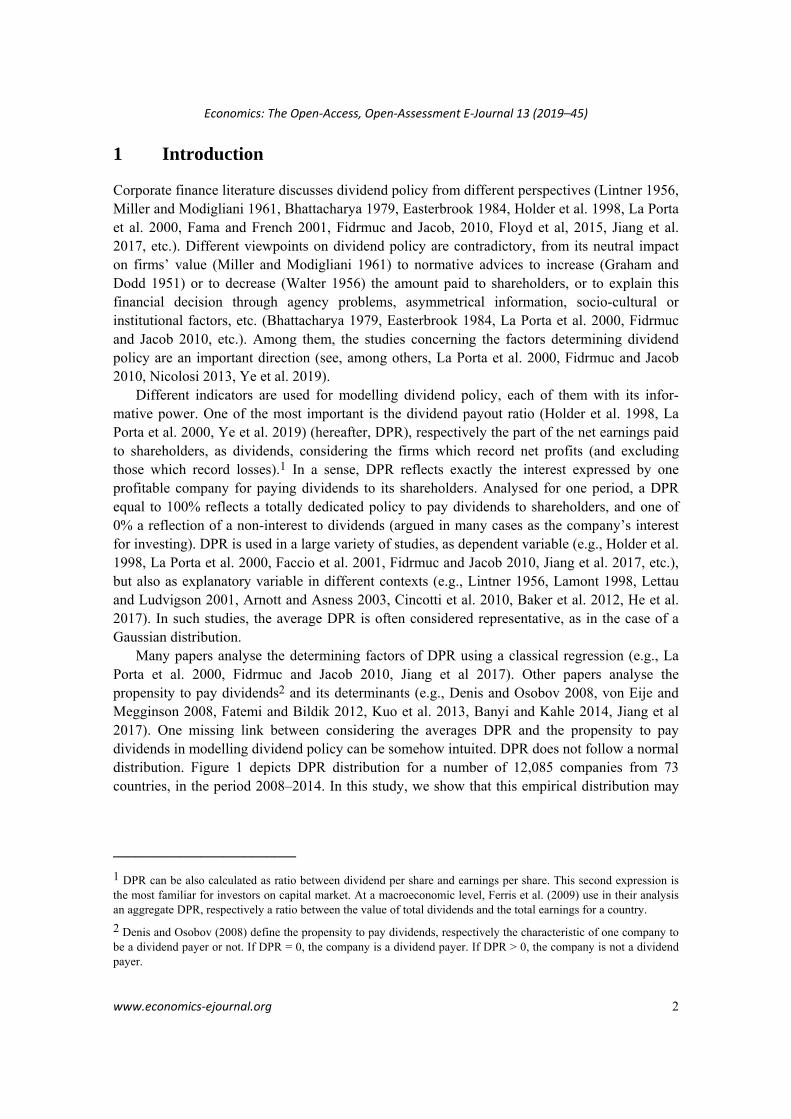
Many papers analyse the determining factors of DPR using a classical regression (e.g., La Porta et al. 2000, Fidrmuc and Jacob 2010, Jiang et al 2017). Other papers analyse the propensity to pay dividends2 and its determinants (e.g., Denis and Osobov 2008, von Eije and Megginson 2008, Fatemi and Bildik 2012, Kuo et al. 2013, Banyi and Kahle 2014, Jiang et al 2017). One missing link between considering the averages DPR and the propensity to pay dividends in modelling dividend policy can be somehow intuited. DPR does not follow a normal distribution. Figure 1 depicts DPR distribution for a number of 12,085 companies from 73 countries, in the period 2008–2014. In this study, we show that this empirical distribution may
_________________________
1 DPR can be also calculated as ratio between dividend per share and earnings per share. This second expression is the most familiar for investors on capital market. At a macroeconomic level, Ferris et al. (2009) use in their analysis an aggregate DPR, respectively a ratio between the value of total dividends and the total earnings for a country.
2 Denis and Osobov (2008) define the propensity to pay dividends, respectively the characteristic of one company to be a dividend payer or not. If DPR = 0, the company is a dividend payer. If DPR > 0, the company is not a dividend payer.
Economics: The Open‐Access, Open‐Assessment E‐Journal 13 (2019–45)
www.economics‐ejournal.org 3
Figure 1: Dividend payout ratio for the companies included in the sample, in the period 2008–2014. All
companies’ financials were collected from the Thomson Research Worldscope database. DPR is
computed as:
.
be fitted at best by a Tweedie distribution (Tweedie 1984). Moreover, this distribution is stable in time for the entire analysed period. In addition, it describes the case of almost all the countries included in the sample and the most part of the years (some more detailed statistics are provided in Appendix 1). As far as we know, finding the distribution for DPR is a new contribution for financial literature.
The distribution depicted in Figure 1 suggests that dividend policy is mainly an issue of “to be or not to be” a dividend payer, some authors suggesting the decrease in dividend payments in time (Fama and French 2001, Fatemi and Bildik 2012, Kuo et al. 2013), which can be modelled through the propensity to pay dividends (Fama and French 2001, Denis and Osobov 2008, von Eije and Megginson 2008, Fatemi and Bildik 2012, Kuo et al. 2013, Banyi and Kahle 2014, Floyd et al. 2015, Jiang et al. 2017, etc.). As practical implication, a proper analysis of DPR should consider both components of the distribution – the 0 inflated component and the distribution for DPR > 0. However, as Figure 1 suggests, this is not a 0% / 100% dividend payout ratio policy! An analysis concerned only about the decision to pay or not to pay dividend can miss some important information.
The most appropriate distribution for modelling DPR is not the normal (Gaussian) one, but the less used Tweedie distribution, proposed by Maurice Tweedie (1984). Using a better fit for the distribution, a better estimation of the probability that the event to occur (e.g., DPR to be lower or higher than a benchmark) can be provided. This result can be useful for instance in the context of international portfolio management, especially if the investments are made in a large
Economics: The Open‐Access, Open‐Assessment E‐Journal 13 (2019–45)
www.economics‐ejournal.org 4
number of companies (with minority participations), and when forecasting of the future collected dividends is of interest.
One important contribution, comparative to previous research, is the large number of countries considered (73). For instance, the database used by La Porta et al. (2000) includes 33 countries, the one of Ferris et al. (2009) 25, etc. Our sample is geographically diverse, including countries from Africa, North and South Americas, Asia, Australia, and Europe. From here, a large diversity regarding the cultural values, but also legal systems (our sample includes common law, but also civil law countries) can be noticed.
The remainder of our paper is structured as follows. Some related studies are discussed in Section 2. Section 3 presents the methodology. Section 4 describes the data. Section 5 presents and examines the results. In Section 6, we conclude.
2 Theoretical background. Modelling dividend policy through dividend payout ratio
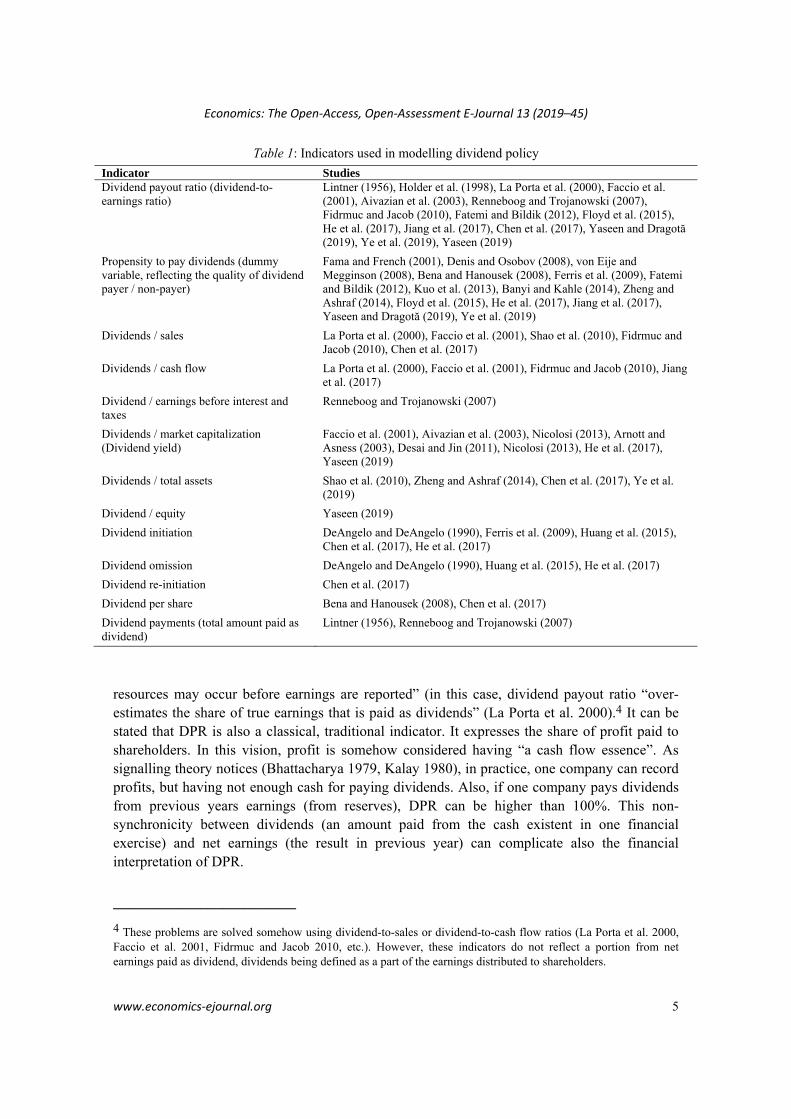
Different indicators are used for modelling dividend policy, in various contexts (see Table 1). Of course, each of these indicators expresses something else, but all of them can be used in analysing dividend policy. Two indicators are extensively used in studies on dividend policy, respectively dividend payout ratio (DPR) and the propensity to pay dividends (hereafter, PPD). They are somehow related, in the sense that PPD can be modelled as a particular case of DPR. Thus, PPD can be defined as: PPD = DPR if DPR = 0, and PPD = 1 if DPR > 0.
DPR is defined as the ratio between net dividend paid to shareholders and net earnings (for instance, DPR in the year t, as a ratio between dividend per share and earnings per share, both recorded in the year t) and calculated only if the company records profit, and not loss (La Porta et al. 2000, Fidrmuc and Jacob 2010). Dividend is considered usually as total cash dividend paid to common and preferred shareholders (La Porta et al. 2000, Fidrmuc and Jacob 2010).3 DPR can be considered as explaining the interest of the shareholders for receiving dividends (or, in some cases, the interest of managers to protect the shareholders’ interests). Share repurchases can be considered as an alternative to dividend payments (La Porta et al. 2000, von Eije and Megginson 2008, Fidrmuc and Jacob 2010, Banyi and Kahle 2014, Baker and Weigand 2015), and some studies correct DPR for accounting for this type of shareholders’ remuneration (e.g., Renneboog and Trojanowski 2007, Floyd et al 2015, Ye et al. 2019). However, share repur-chases imply the termination of the role as shareholder for the receiver of the payment, and this is why it should be analyzed independently by dividend payments.
Undoubtedly, as most of the financial indicators, DPR has certain limits. Net earnings depend on the countries’ accounting conventions and are not always comparable from one country to another, being also easily manipulated by “accounting tricks”. Also, “diversion of
_________________________
3 In some cases, supplementary adjustments are made. For instance, “Earnings are measured after taxes and interest but before extraordinary items” (e.g., La Porta et al. 2000, Faccio et al. 2001).
Economics: The Open‐Access, Open‐Assessment E‐Journal 13 (2019–45)
www.economics‐ejournal.org 5
Table 1: Indicators used in modelling dividend policy
Indicator Studies Dividend payout ratio (dividend-to-earnings ratio)
Lintner (1956), Holder et al. (1998), La Porta et al. (2000), Faccio et al. (2001), Aivazian et al. (2003), Renneboog and Trojanowski (2007), Fidrmuc and Jacob (2010), Fatemi and Bildik (2012), Floyd et al. (2015), He et al. (2017), Jiang et al. (2017), Chen et al. (2017), Yaseen and Dragotă (2019), Ye et al. (2019), Yaseen (2019)
Propensity to pay dividends (dummy variable, reflecting the quality of dividend payer / non-payer)
Fama and French (2001), Denis and Osobov (2008), von Eije and Megginson (2008), Bena and Hanousek (2008), Ferris et al. (2009), Fatemi and Bildik (2012), Kuo et al. (2013), Banyi and Kahle (2014), Zheng and Ashraf (2014), Floyd et al. (2015), He et al. (2017), Jiang et al. (2017), Yaseen and Dragotă (2019), Ye et al. (2019)
Dividends / sales La Porta et al. (2000), Faccio et al. (2001), Shao et al. (2010), Fidrmuc and Jacob (2010), Chen et al. (2017)
Dividends / cash flow La Porta et al. (2000), Faccio et al. (2001), Fidrmuc and Jacob (2010), Jiang et al. (2017)
Dividend / earnings before interest and taxes
Renneboog and Trojanowski (2007)
Dividends / market capitalization (Dividend yield)
Faccio et al. (2001), Aivazian et al. (2003), Nicolosi (2013), Arnott and Asness (2003), Desai and Jin (2011), Nicolosi (2013), He et al. (2017), Yaseen (2019)
Dividends / total assets Shao et al. (2010), Zheng and Ashraf (2014), Chen et al. (2017), Ye et al. (2019)
Dividend / equity Yaseen (2019)
Dividend initiation DeAngelo and DeAngelo (1990), Ferris et al. (2009), Huang et al. (2015), Chen et al. (2017), He et al. (2017)
Dividend omission DeAngelo and DeAngelo (1990), Huang et al. (2015), He et al. (2017)
Dividend re-initiation Chen et al. (2017)
Dividend per share Bena and Hanousek (2008), Chen et al. (2017)
Dividend payments (total amount paid as dividend)
Lintner (1956), Renneboog and Trojanowski (2007)
resources may occur before earnings are reported” (in this case, dividend payout ratio “over-estimates the share of true earnings that is paid as dividends” (La Porta et al. 2000).4 It can be stated that DPR is also a classical, traditional indicator. It expresses the share of profit paid to shareholders. In this vision, profit is somehow considered having “a cash flow essence”. As signalling theory notices (Bhattacharya 1979, Kalay 1980), in practice, one company can record profits, but having not enough cash for paying dividends. Also, if one company pays dividends from previous years earnings (from reserves), DPR can be higher than 100%. This non-synchronicity between dividends (an amount paid from the cash existent in one financial exercise) and net earnings (the result in previous year) can complicate also the financial interpretation of DPR.
_________________________
4 These problems are solved somehow using dividend-to-sales or dividend-to-cash flow ratios (La Porta et al. 2000, Faccio et al. 2001, Fidrmuc and Jacob 2010, etc.). However, these indicators do not reflect a portion from net earnings paid as dividend, dividends being defined as a part of the earnings distributed to shareholders.
Economics: The Open‐Access, Open‐Assessment E‐Journal 13 (2019–45)
www.economics‐ejournal.org 6
DPR does not reflect a return (like dividend yield); it is a share of profit paid to shareholders. If dividends and retained earnings are considered as expressing opposite interests (see the literature regarding minority shareholders’ protection, e.g., La Porta et al. 2000), DPR would reflect a higher interest for one issue or another or, maybe, a power in negotiation. However, the interpretation of the indicator should be made cautiously. If one company records 100 monetary units (m.u.) as earnings and pays 50 m.u. as dividends, it records only a 50% DPR, comparatively with another, which pays 100% as dividends from its 1 m.u. earnings. Looking only to DPR, the second one seems to be more oriented to shareholders; however, it does not mean that its shareholders would be more satisfied.
DPR is used as dependent variable in regressions (La Porta et al. 2000, Fidrmuc and Jacob 2010, Jiang et al 2017). Different factors are considered as determinants of DPR, some of them – financial (e.g., size, return of assets, leverage, sales growth, in Fidrmuc and Jacob 2010, Jiang et al 2017, Ye et al. 2019), other – legal (legal system, mandatory dividends, tax advantages, etc., as in La Porta et al. 2000, Fidrmuc and Jacob 2010, Ye et al. 2019, etc.), cultural (individualism, power distance, uncertainty avoidance,5 in Fidrmuc and Jacob 2010), related to ownership structure (Jiang et al 2017, Ye et al. 2019), board gender diversity (Chen et al. 2017, Ye et al. 2019), etc. DPR is also used as independent variable in some studies (e.g., Lintner 1956, Lamont 1998, Lettau and Ludvigson 2001, Arnott and Asness 2003, Cincotti et al 2010, Baker et al. 2012, He et al. 2017, Chen and Desiderio 2018).
Based on empirical evidences, different papers found that the presence of non-paying dividends companies is significant (Fama and French 2001, von Eije and Megginson 2008, Fatemi and Bildik 2012, Kuo et al. 2013). Maybe for this reason, many papers prefer to analyse the propensity to pay dividends and its determinants, along with dividend payout ratio or not (e.g., Denis and Osobov 2008, von Eije and Megginson 2008, Fatemi and Bildik 2012, Kuo et al. 2013, Banyi and Kahle 2014, Jiang et al. 2017, Ye et al. 2019) (see also Table 1). Even PPD is a less sensitive indicator, it has the same purpose as DPR in reflecting the company’s interest for paying dividends for shareholders.
One missing link between considering averages DPR and propensity to pay dividends in modelling dividend policy can be somehow intuited. On the one hand, the use of the average DPR can be misleading, as long as DPR is 0% in many cases. An average DPR should be interpreted cautiously; it is as if you would say that in average you feel all right if one part of you is kept in frozen water and the other one in boiling water. On the other hand, neglecting the distribution of DPR in the absence of DPR = 0 (considering 1% DPR to be as such important as a 100% DPR) can determine missing some information.
For all these reasons, finding if probability distribution of DPR can be modelled can provide a useful result for both academics and practitioners. Finding the probability distribution for one variable is studied in literature (e.g., Clauset et al. 2009). In general, in is accepted that the selection procedure is following some subsequent steps, respectively (Clauset et al. 2009): (1) choose a suitable theoretical model; (2) estimate the model parameters; (3) determine the significance level and use a goodness-of-fit test in order to determine the most appropriate theoretical distribution. As far as we know, finding the distribution for DPR is a new con-tribution for financial literature. _________________________
5 These indicators are proposed by Hofstede (2001), as proxies for the national culture.
Economics: The Open‐Access, Open‐Assessment E‐Journal 13 (2019–45)
www.economics‐ejournal.org 7
3 Methodology
Our methodology is focused on finding the most appropriate distribution for DPR. In order to fit the probability distribution for DPR, we follow the methodology recommended by Clauset et al. (2009), and we applied it for the analysed variable. Thus, the fitting problem can be split in three main tasks (Clauset et al. 2009).
First, we have chosen a suitable theoretical model. Descriptive statistics like histogram and skewness are useful in this step. Based on the shape of the empirical distribution, we have decided to estimate a range of theoretical distribution that may fit the data: Tweedie, Scaled Tweedie, Lognormal, Burr, Weibull, Inverse Gaussian, Exponential, Generalized Pareto Distri-bution, Pareto and Gamma distribution. The Tweedie distribution, as a model for zero-inflated data (see Gilchrist and Drinkwater, 1999), has been previously used in other areas, such as healthcare data (Kurz 2017), modelling insurance claims (Renshaw 1994; Jørgensen et al. 1994), etc.
Secondly, we have estimated the model parameters. In order to estimate the parameters of the theoretical distributions, the Maximum Likelihood method was used.
Finally, we have determined the significance level and we have used a goodness-of-fit test in order to determine the most appropriate theoretical distribution. For finding the most appropriate distribution for the data, we have used the Anderson-Darling test (Anderson and Darling 1954). This is one alternative used to test and to find the distribution of experimental data that follows a theoretical distribution. The conclusion of the Anderson–Darling test is usually drawn by comparing the obtained statistics with the available critical value. This test is one of the most frequent tests used to find the best distribution for the data, generally called „goodness-of-fit tests” (Pearson 1895, Anderson and Darling 1954, Stephens 1974, Jäntschi and Bolboacă 2018). This methodology has the advantage of allowing a more sensitive test (Scholz and Stephens 1987). By minimizing the statistics obtained from the Anderson Darling test, we have chosen the most appropriate distribution for our data.
4 Data
All companies’ financials were collected from the Thomson Research Worldscope database.6 We have included in our database only those countries with minimum 10 companies available for the entire period (for this reason, we have excluded from the initial database some countries). In addition, we have not considered the financial institutions because of the difference in the accounting standards for financial reporting, as La Porta et al. (2000), Fidrmuc and Jacob (2010), Jiang et al. (2017), etc.7, 8 Furthermore, we have imported from the original database only companies with data available for the entire analysed period. Also, we have
_________________________
6 The access to the Thomson Research Worldscope Database was granted by Deloitte Romania.
7 Different studies, after the exclusion of companies with missing values, eliminate from their databases: (i) utility companies (Fidrmuc and Jacob, 2010); (ii) companies from Luxembourg (La Porta et al. 2000, Fidrmuc and Jacob 2010); (iii) companies completely or partially owned by the governments (La Porta et al. 2000); (iv) companies from
Economics: The Open‐Access, Open‐Assessment E‐Journal 13 (2019–45)
www.economics‐ejournal.org 8
excluded from our database those companies which recorded negative net income (as in La Porta et al. 2000, Fidrmuc and Jacob 2010). The inclusion of this kind of data is incoherent with the financial logic of the indicator – dividend payout ratio is defined as a share of profit paid to shareholders. Another criterion for the imported data from Thomson Research Worldscope was that dividend DPR ≥ 0 (to eliminate possible negative dividend payout ratio) (Jiang et al. 2017). We considered dividends, but not other forms of shareholders’ remuneration (such as shares repurchases) (as Floyd et al. 2015, among others) (due to data availability, but also because share repurchases determine the end of the quality of company’s shareholder for their receiver). Also, have considered only cash dividends, and no other “cosmetically” (non-cash) operations (e.g., dividends in stocks).
The final database consists of 12,085 companies operating in 73 countries in the period 2008–2014. As such, our database covers a crisis, but also a post-crisis period. The data are winsorized to 2% and DPR is limited to 100%.9 We have considered each company as being a different and sole company, in the case of a group of companies, which activates in more than one country.10
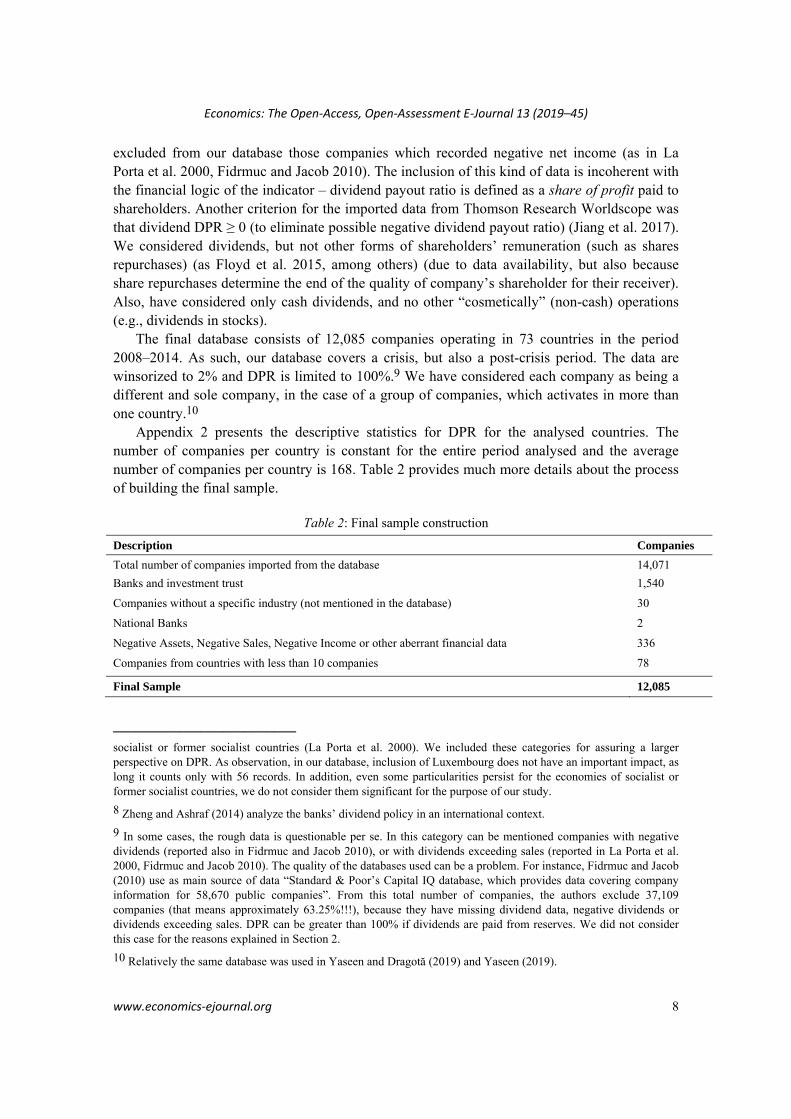
Appendix 2 presents the descriptive statistics for DPR for the analysed countries. The number of companies per country is constant for the entire period analysed and the average number of companies per country is 168. Table 2 provides much more details about the process of building the final sample.
Table 2: Final sample construction
Description Companies
Total number of companies imported from the database 14,071
Banks and investment trust 1,540
Companies without a specific industry (not mentioned in the database) 30
National Banks 2
Negative Assets, Negative Sales, Negative Income or other aberrant financial data 336
Companies from countries with less than 10 companies 78
Final Sample 12,085
_________________________
socialist or former socialist countries (La Porta et al. 2000). We included these categories for assuring a larger perspective on DPR. As observation, in our database, inclusion of Luxembourg does not have an important impact, as long it counts only with 56 records. In addition, even some particularities persist for the economies of socialist or former socialist countries, we do not consider them significant for the purpose of our study.
8 Zheng and Ashraf (2014) analyze the banks’ dividend policy in an international context.
9 In some cases, the rough data is questionable per se. In this category can be mentioned companies with negative dividends (reported also in Fidrmuc and Jacob 2010), or with dividends exceeding sales (reported in La Porta et al. 2000, Fidrmuc and Jacob 2010). The quality of the databases used can be a problem. For instance, Fidrmuc and Jacob (2010) use as main source of data “Standard & Poor’s Capital IQ database, which provides data covering company information for 58,670 public companies”. From this total number of companies, the authors exclude 37,109 companies (that means approximately 63.25%!!!), because they have missing dividend data, negative dividends or dividends exceeding sales. DPR can be greater than 100% if dividends are paid from reserves. We did not consider this case for the reasons explained in Section 2.
10 Relatively the same database was used in Yaseen and Dragotă (2019) and Yaseen (2019).
Economics: The Open‐Access, Open‐Assessment E‐Journal 13 (2019–45)
www.economics‐ejournal.org 9
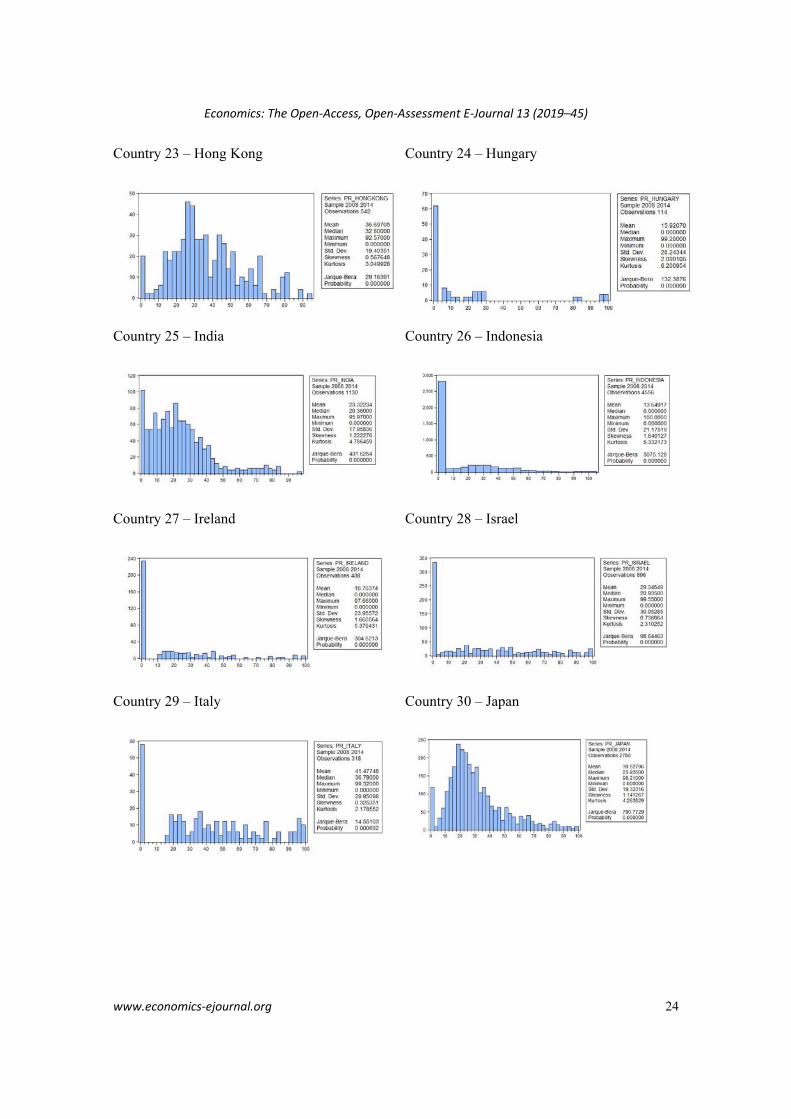
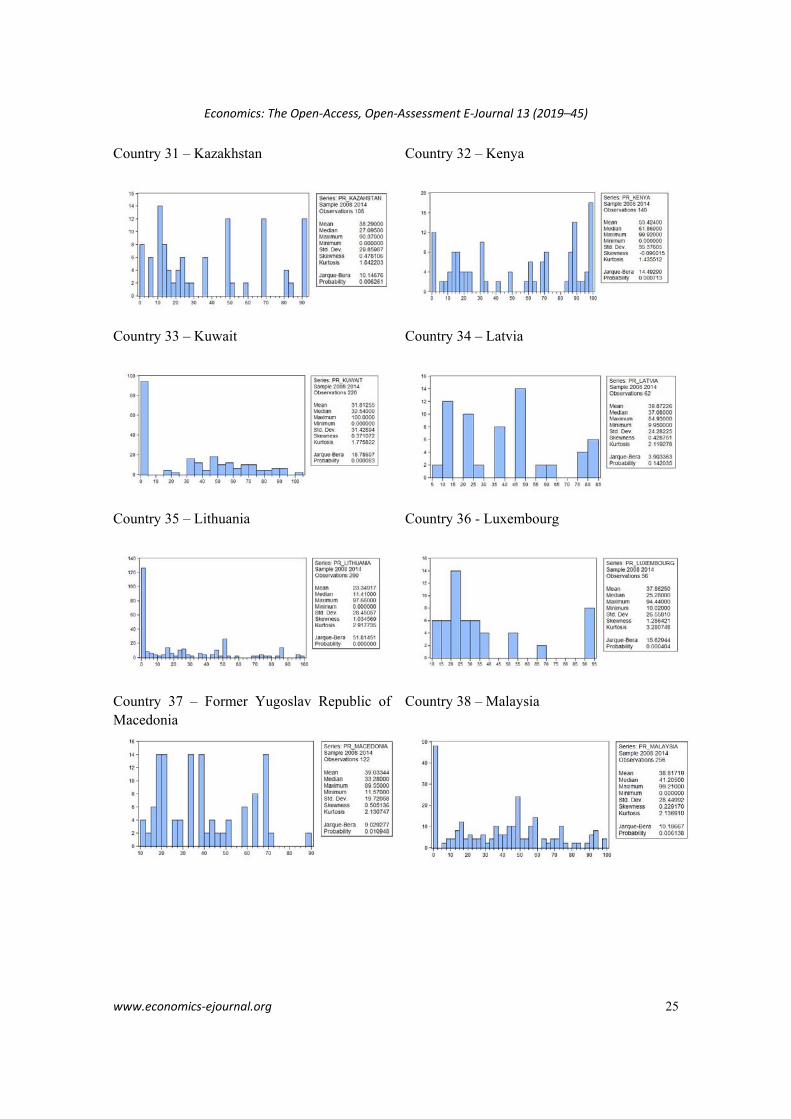
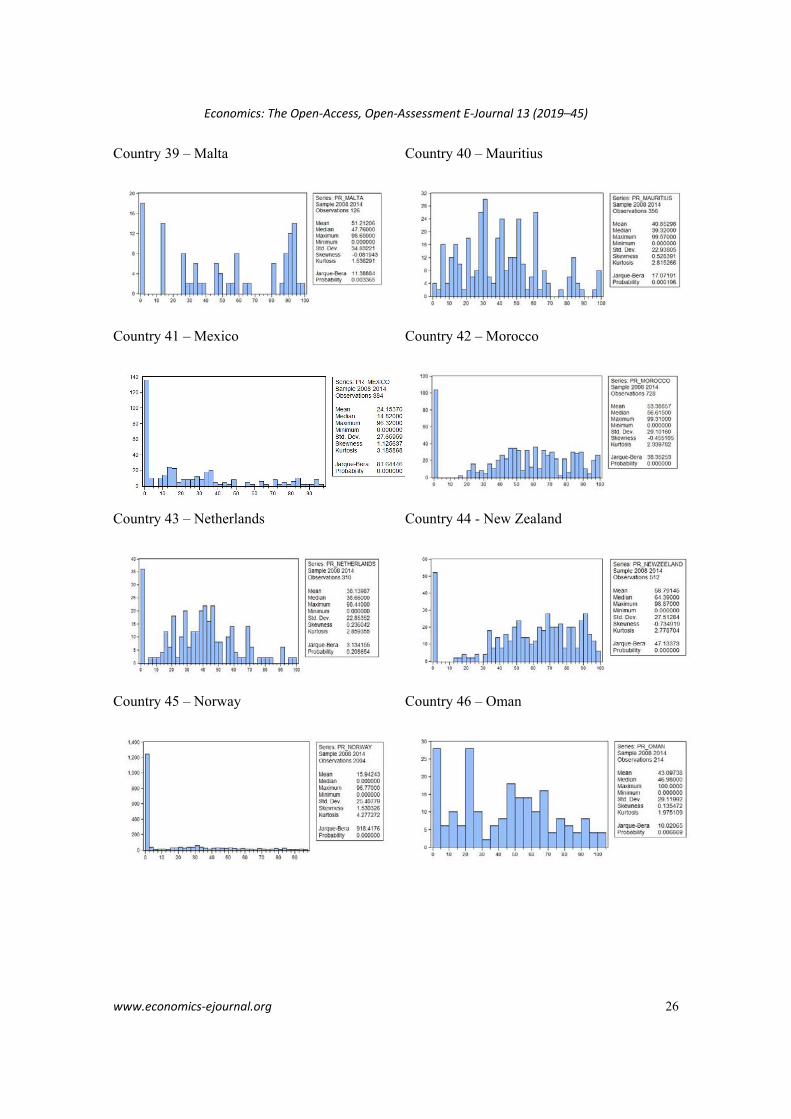
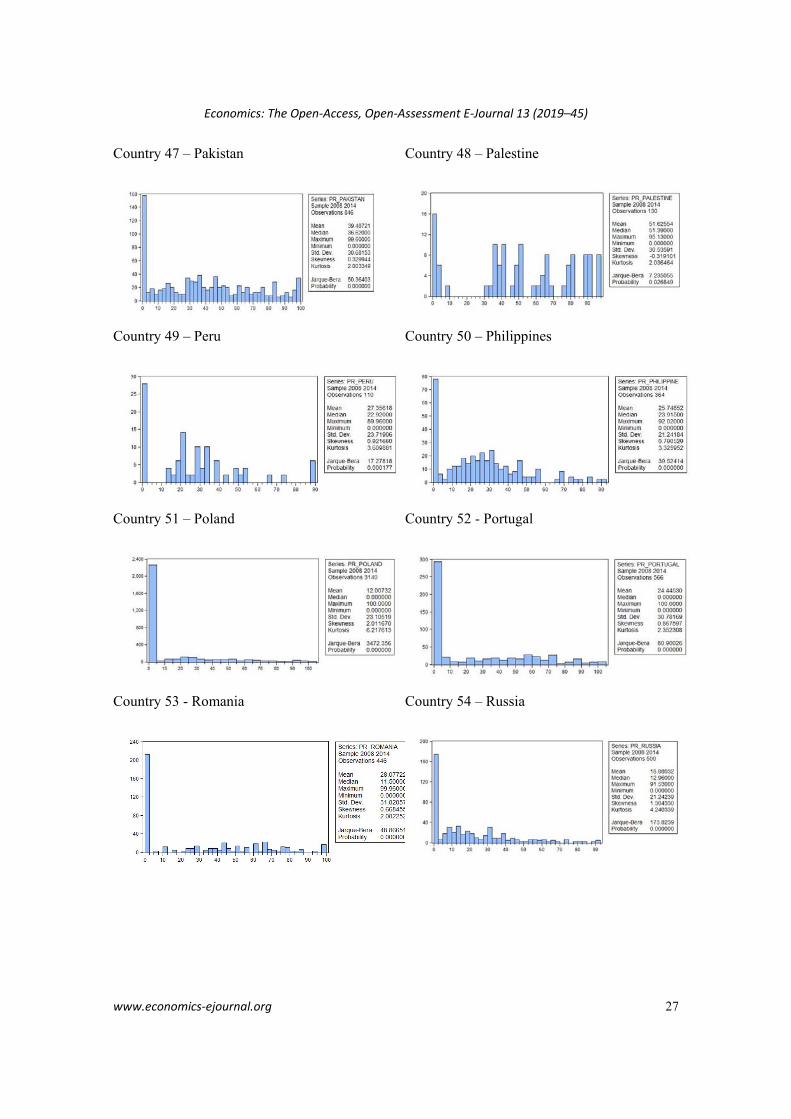
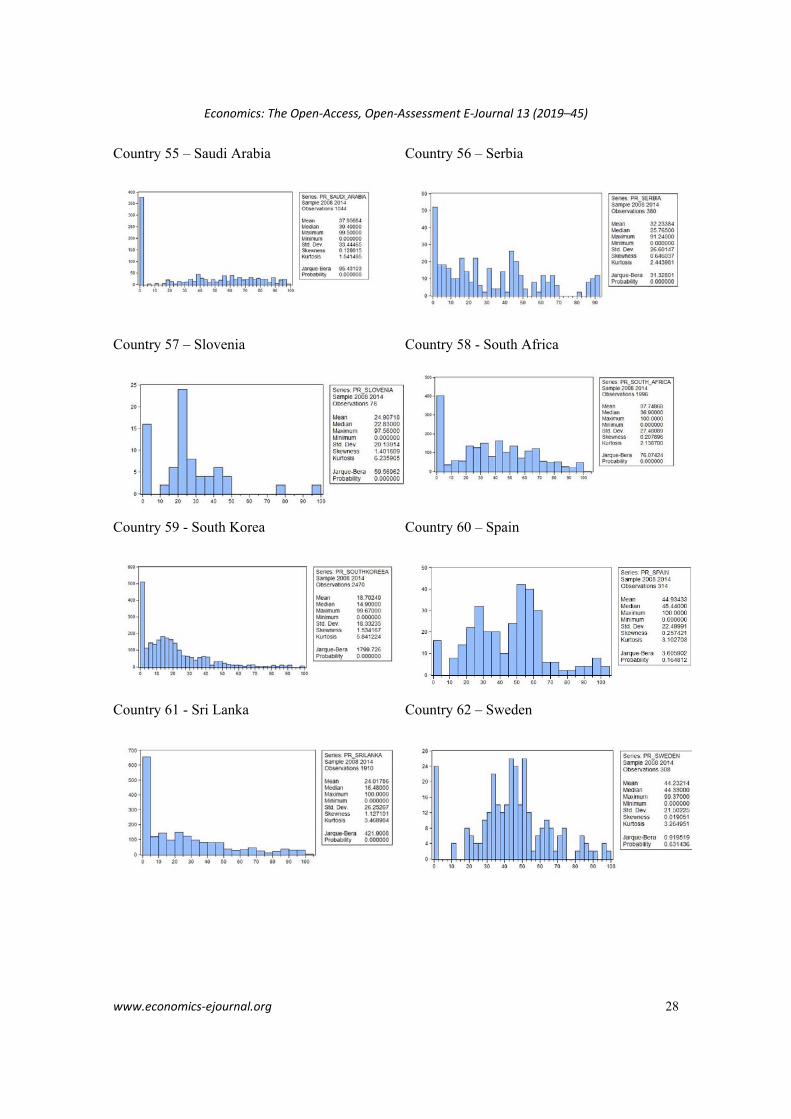
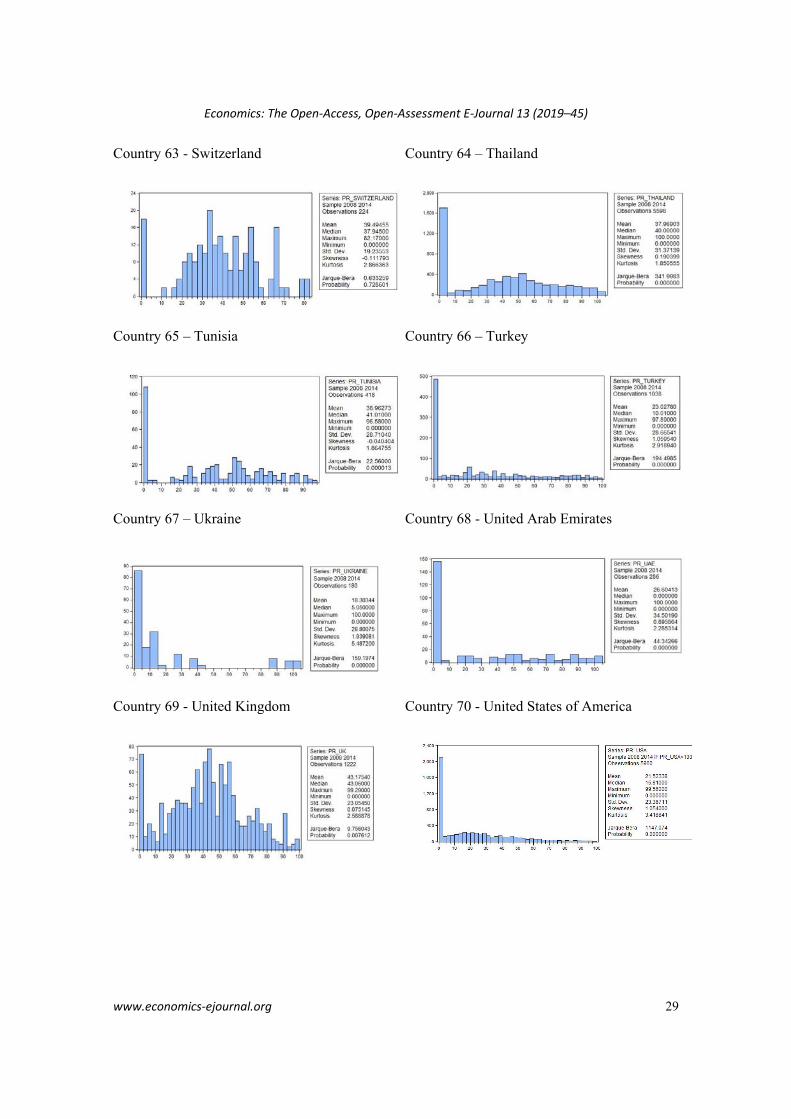
Appendix 1 presents DPR distributions for the countries included in our sample, for the period 2008–2014. In almost all of the cases (53 countries from 73, respectively 72.6% from the total population), DPR distribution is zero inflated (the modal value of the distribution equals 0).11
One issue that can complicate the picture is the existence in some countries of the mandatory dividend, respectively a legal requirement that a fraction of earnings to be paid as dividend.12 The results (somehow surprising) confirm the same distribution even for the cases of the countries with regulated dividend payment. The mode for DPR for Brazil, Greece, Peru, Philippines and Venezuela is zero, and the percent of companies that do not pay dividends in Chile is important (44%).13
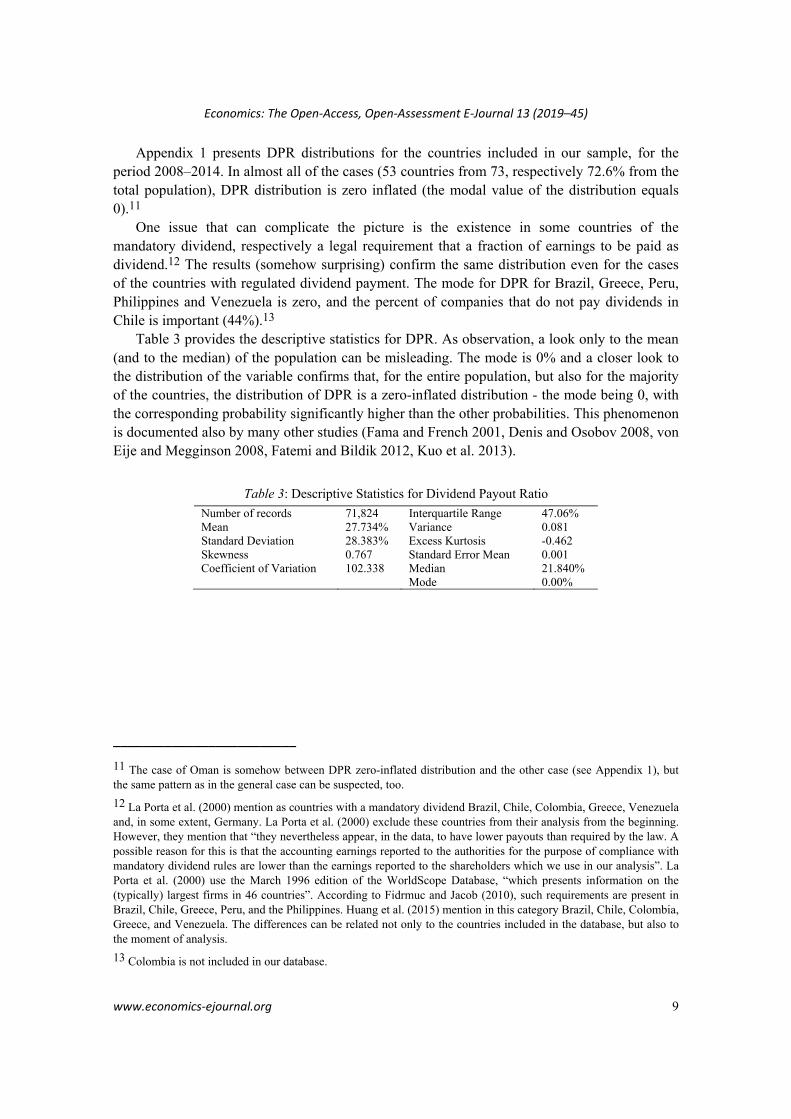
Table 3 provides the descriptive statistics for DPR. As observation, a look only to the mean (and to the median) of the population can be misleading. The mode is 0% and a closer look to the distribution of the variable confirms that, for the entire population, but also for the majority of the countries, the distribution of DPR is a zero-inflated distribution - the mode being 0, with the corresponding probability significantly higher than the other probabilities. This phenomenon is documented also by many other studies (Fama and French 2001, Denis and Osobov 2008, von Eije and Megginson 2008, Fatemi and Bildik 2012, Kuo et al. 2013).
Table 3: Descriptive Statistics for Dividend Payout Ratio
Number of records 71,824 Interquartile Range 47.06% Mean 27.734% Variance 0.081 Standard Deviation 28.383% Excess Kurtosis -0.462 Skewness 0.767 Standard Error Mean 0.001 Coefficient of Variation 102.338 Median 21.840% Mode 0.00%
_________________________
11 The case of Oman is somehow between DPR zero-inflated distribution and the other case (see Appendix 1), but the same pattern as in the general case can be suspected, too.
12 La Porta et al. (2000) mention as countries with a mandatory dividend Brazil, Chile, Colombia, Greece, Venezuela and, in some extent, Germany. La Porta et al. (2000) exclude these countries from their analysis from the beginning. However, they mention that “they nevertheless appear, in the data, to have lower payouts than required by the law. A possible reason for this is that the accounting earnings reported to the authorities for the purpose of compliance with mandatory dividend rules are lower than the earnings reported to the shareholders which we use in our analysis”. La Porta et al. (2000) use the March 1996 edition of the WorldScope Database, “which presents information on the (typically) largest firms in 46 countries”. According to Fidrmuc and Jacob (2010), such requirements are present in Brazil, Chile, Greece, Peru, and the Philippines. Huang et al. (2015) mention in this category Brazil, Chile, Colombia, Greece, and Venezuela. The differences can be related not only to the countries included in the database, but also to the moment of analysis.
13 Colombia is not included in our database.
Economics: The Open‐Access, Open‐Assessment E‐Journal 13 (2019–45)
www.economics‐ejournal.org 10
5 Results
Analysing visually the histogram of distribution, it can be easily observed that it is a zero-inflated distribution (see also Appendix 3). Statistical literature documents the existence of different zero-inflated distributions (e.g., Poisson, Gamma, Tweedie) (El-Shaarawi et al. 2011, Jørgensen and Kokonendji 2016, Bonat and Kokonendji 2017).
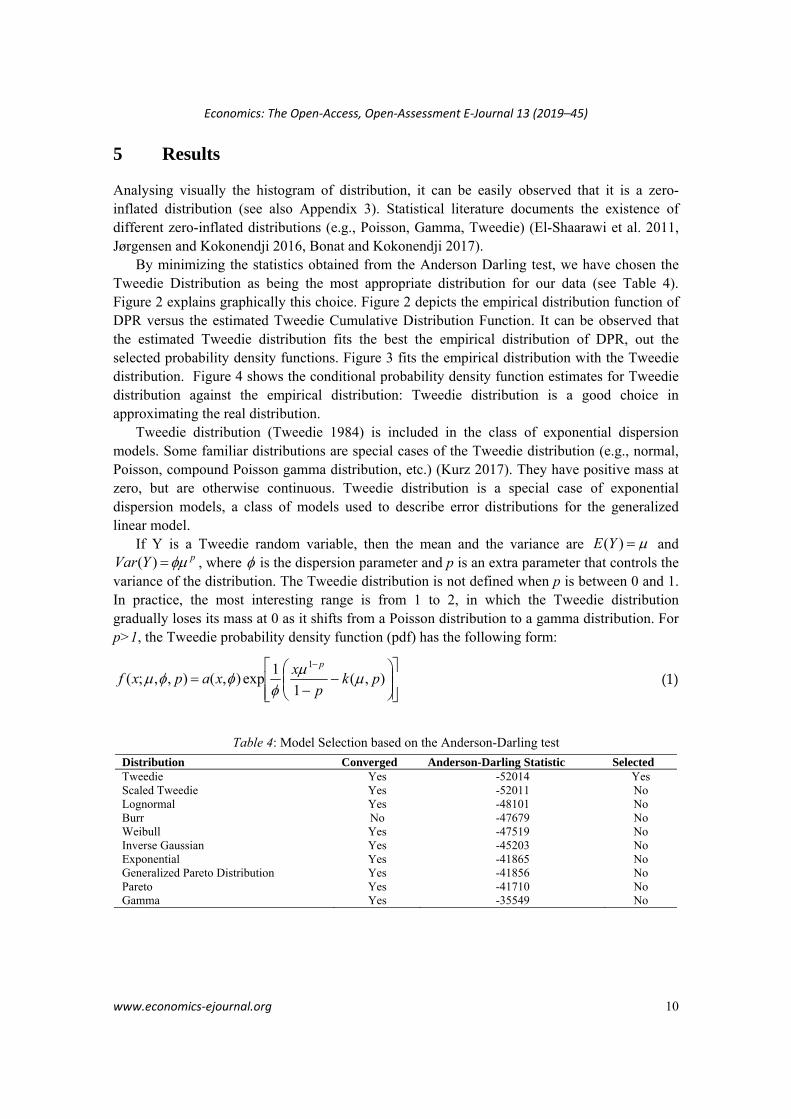
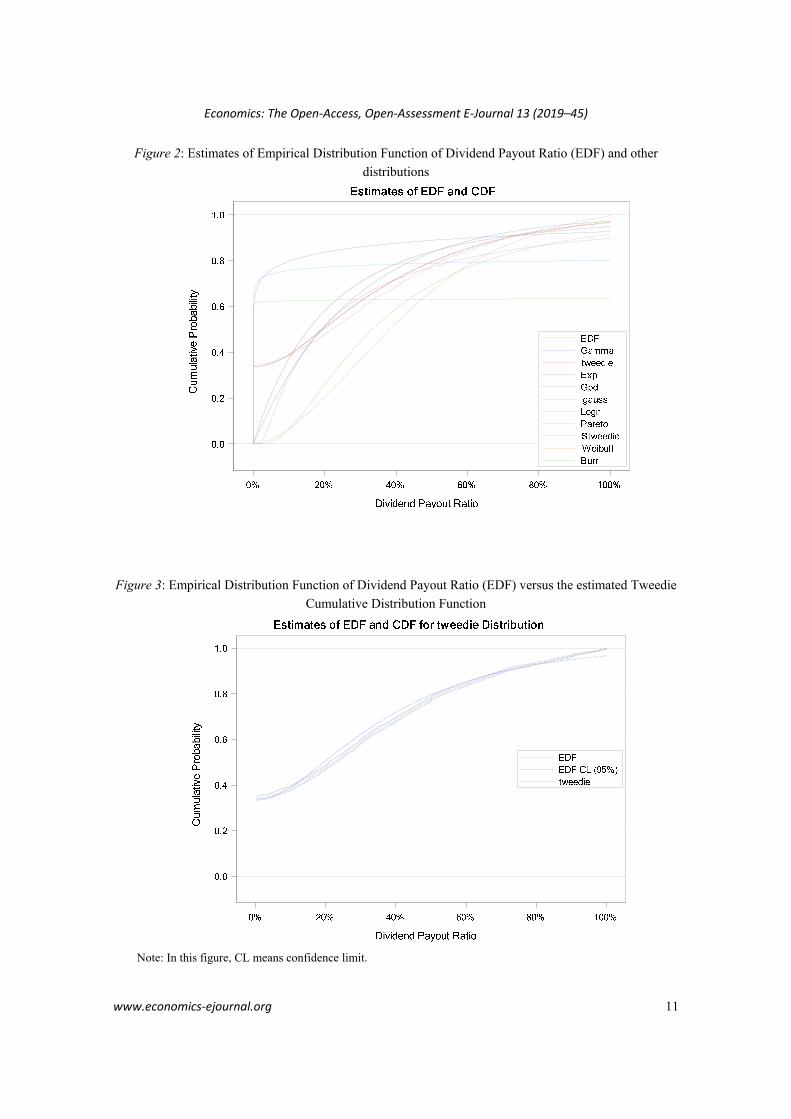
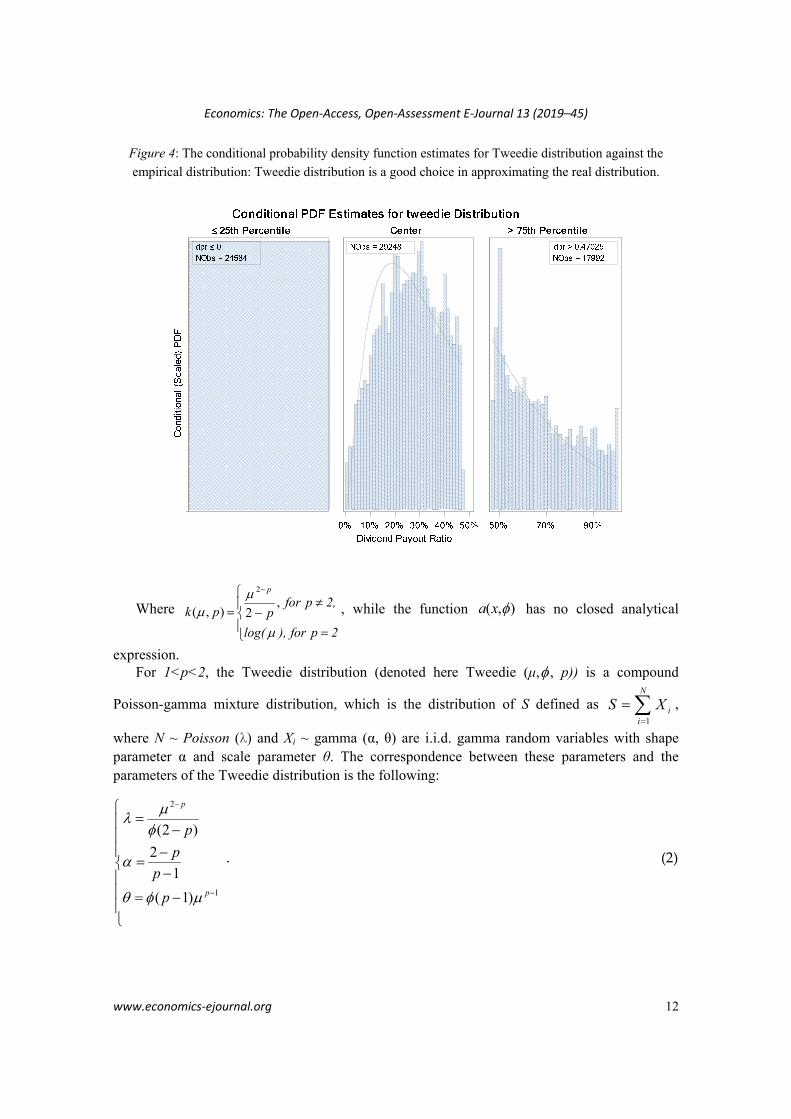
By minimizing the statistics obtained from the Anderson Darling test, we have chosen the Tweedie Distribution as being the most appropriate distribution for our data (see Table 4). Figure 2 explains graphically this choice. Figure 2 depicts the empirical distribution function of DPR versus the estimated Tweedie Cumulative Distribution Function. It can be observed that the estimated Tweedie distribution fits the best the empirical distribution of DPR, out the selected probability density functions. Figure 3 fits the empirical distribution with the Tweedie distribution. Figure 4 shows the conditional probability density function estimates for Tweedie distribution against the empirical distribution: Tweedie distribution is a good choice in approximating the real distribution.
Tweedie distribution (Tweedie 1984) is included in the class of exponential dispersion models. Some familiar distributions are special cases of the Tweedie distribution (e.g., normal, Poisson, compound Poisson gamma distribution, etc.) (Kurz 2017). They have positive mass at zero, but are otherwise continuous. Tweedie distribution is a special case of exponential dispersion models, a class of models used to describe error distributions for the generalized linear model.
If Y is a Tweedie random variable, then the mean and the variance are )(YE andpYVar )( , where is the dispersion parameter and p is an extra parameter that controls the
variance of the distribution. The Tweedie distribution is not defined when p is between 0 and 1. In practice, the most interesting range is from 1 to 2, in which the Tweedie distribution gradually loses its mass at 0 as it shifts from a Poisson distribution to a gamma distribution. For p>1, the Tweedie probability density function (pdf) has the following form:
),(1
1exp),(),,;(
1
pkp
xxapxf
p
(1)
Table 4: Model Selection based on the Anderson-Darling test
Distribution Converged Anderson-Darling Statistic Selected Tweedie Yes -52014 Yes Scaled Tweedie Yes -52011 No Lognormal Yes -48101 No Burr No -47679 No Weibull Yes -47519 No Inverse Gaussian Yes -45203 No Exponential Yes -41865 No Generalized Pareto Distribution Yes -41856 No Pareto Yes -41710 No Gamma Yes -35549 No
Economics: The Open‐Access, Open‐Assessment E‐Journal 13 (2019–45)
www.economics‐ejournal.org 11
Figure 2: Estimates of Empirical Distribution Function of Dividend Payout Ratio (EDF) and other
distributions
Figure 3: Empirical Distribution Function of Dividend Payout Ratio (EDF) versus the estimated Tweedie
Cumulative Distribution Function
Note: In this figure, CL means confidence limit.
Economics: The Open‐Access, Open‐Assessment E‐Journal 13 (2019–45)
www.economics‐ejournal.org 12
Figure 4: The conditional probability density function estimates for Tweedie distribution against the
empirical distribution: Tweedie distribution is a good choice in approximating the real distribution.
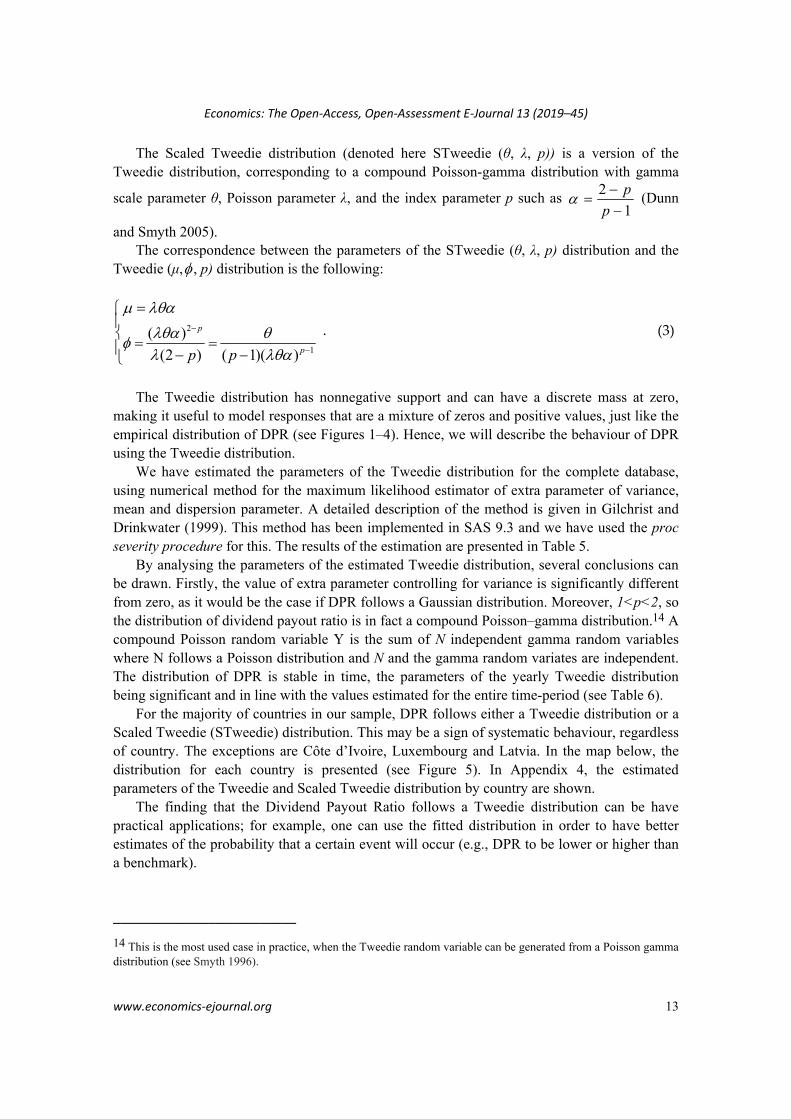
Where
2p for ),log(
2,p for ppk
p
,2),(
2
, while the function ),( xa has no closed analytical
expression. For 1<p<2, the Tweedie distribution (denoted here Tweedie (μ, , p)) is a compound
Poisson-gamma mixture distribution, which is the distribution of S defined as 1
N
ii
S X
,
where N ~ Poisson (λ) and Xi ~ gamma (α, θ) are i.i.d. gamma random variables with shape parameter α and scale parameter θ. The correspondence between these parameters and the parameters of the Tweedie distribution is the following:
2
1
(2 )
2
1
( 1)
p
p
p
p
p
p
. (2)
Economics: The Open‐Access, Open‐Assessment E‐Journal 13 (2019–45)
www.economics‐ejournal.org 13
The Scaled Tweedie distribution (denoted here STweedie (θ, λ, p)) is a version of the Tweedie distribution, corresponding to a compound Poisson-gamma distribution with gamma
scale parameter θ, Poisson parameter λ, and the index parameter p such as 2
1
p
p
(Dunn
and Smyth 2005). The correspondence between the parameters of the STweedie (θ, λ, p) distribution and the
Tweedie (μ, , p) distribution is the following:
2
1
( )
(2 ) ( 1)( )
p
pp p
. (3)
The Tweedie distribution has nonnegative support and can have a discrete mass at zero,
making it useful to model responses that are a mixture of zeros and positive values, just like the empirical distribution of DPR (see Figures 1–4). Hence, we will describe the behaviour of DPR using the Tweedie distribution.
We have estimated the parameters of the Tweedie distribution for the complete database, using numerical method for the maximum likelihood estimator of extra parameter of variance, mean and dispersion parameter. A detailed description of the method is given in Gilchrist and Drinkwater (1999). This method has been implemented in SAS 9.3 and we have used the proc severity procedure for this. The results of the estimation are presented in Table 5.
By analysing the parameters of the estimated Tweedie distribution, several conclusions can be drawn. Firstly, the value of extra parameter controlling for variance is significantly different from zero, as it would be the case if DPR follows a Gaussian distribution. Moreover, 1<p<2, so the distribution of dividend payout ratio is in fact a compound Poisson–gamma distribution.14 A compound Poisson random variable Y is the sum of N independent gamma random variables where N follows a Poisson distribution and N and the gamma random variates are independent. The distribution of DPR is stable in time, the parameters of the yearly Tweedie distribution being significant and in line with the values estimated for the entire time-period (see Table 6).
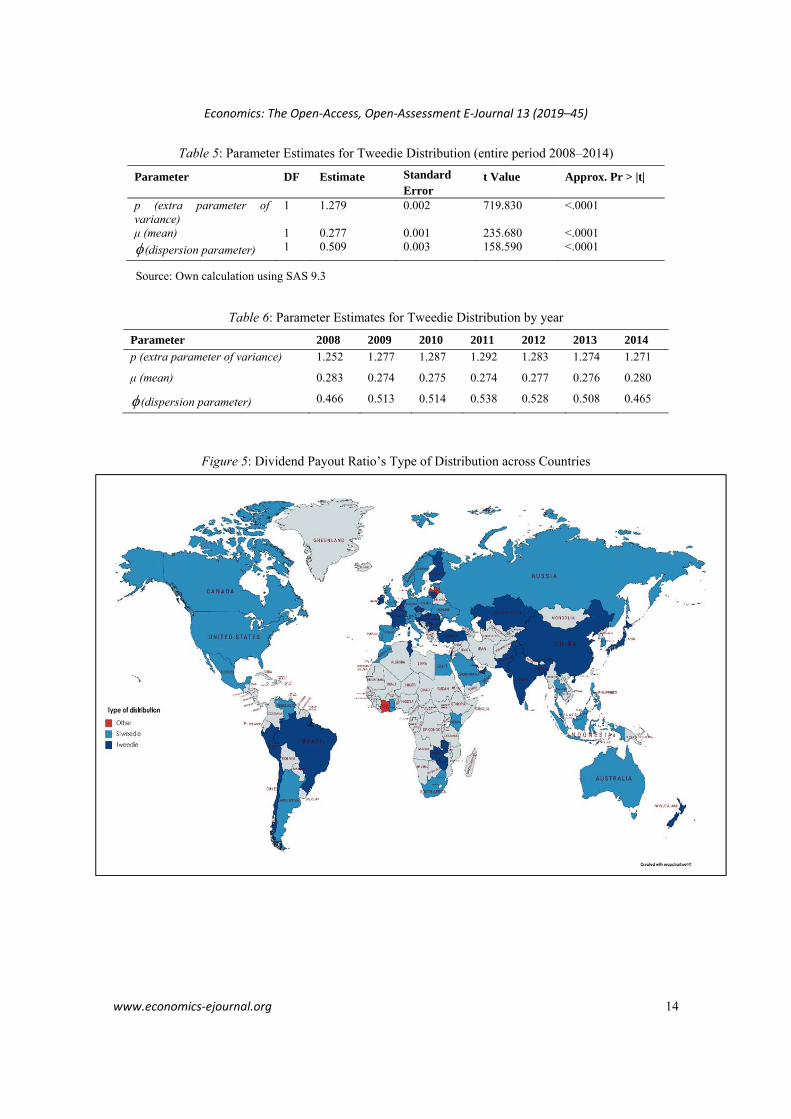
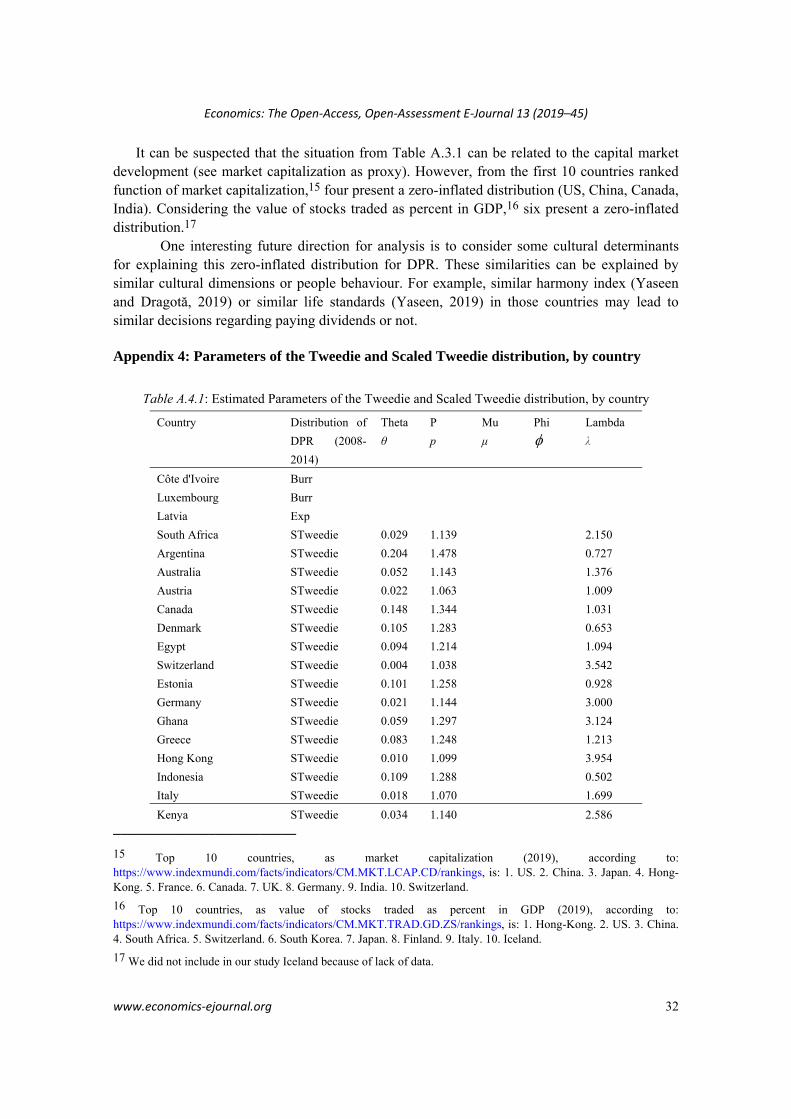
For the majority of countries in our sample, DPR follows either a Tweedie distribution or a Scaled Tweedie (STweedie) distribution. This may be a sign of systematic behaviour, regardless of country. The exceptions are Côte d’Ivoire, Luxembourg and Latvia. In the map below, the distribution for each country is presented (see Figure 5). In Appendix 4, the estimated parameters of the Tweedie and Scaled Tweedie distribution by country are shown.
The finding that the Dividend Payout Ratio follows a Tweedie distribution can be have practical applications; for example, one can use the fitted distribution in order to have better estimates of the probability that a certain event will occur (e.g., DPR to be lower or higher than a benchmark).
_________________________
14 This is the most used case in practice, when the Tweedie random variable can be generated from a Poisson gamma distribution (see Smyth 1996).
Economics: The Open‐Access, Open‐Assessment E‐Journal 13 (2019–45)
www.economics‐ejournal.org 14
Table 5: Parameter Estimates for Tweedie Distribution (entire period 2008–2014)
Parameter DF Estimate Standard Error
t Value Approx. Pr > |t|
p (extra parameter of variance)
1 1.279 0.002 719.830 <.0001
μ (mean) 1 0.277 0.001 235.680 <.0001
(dispersion parameter) 1 0.509 0.003 158.590 <.0001
Source: Own calculation using SAS 9.3
Table 6: Parameter Estimates for Tweedie Distribution by year
Parameter 2008 2009 2010 2011 2012 2013 2014
p (extra parameter of variance) 1.252 1.277 1.287 1.292 1.283 1.274 1.271
μ (mean) 0.283 0.274 0.275 0.274 0.277 0.276 0.280
(dispersion parameter) 0.466 0.513 0.514 0.538 0.528 0.508 0.465
Figure 5: Dividend Payout Ratio’s Type of Distribution across Countries
Economics: The Open‐Access, Open‐Assessment E‐Journal 13 (2019–45)
www.economics‐ejournal.org 15
6 Conclusions
Dividend policy is still a largely discussed issue in corporate finance literature. For its analysis, dividend payout ratio has certain advantages and is extensively used. Using a database consisting of 12,085 companies operating in 73 countries, for the period 2008–2014, we found that this indicator does not follow a normal distribution, but a zero-inflated one. The most appropriate distribution for modelling dividend payout ratio is the Tweedie distribution (Tweedie 1984) and its version Scaled Tweedie Distribution (Dunn and Smyth 2005). Thus, a better estimation of the probability that dividend payout ratio is lower or higher than a benchmark can be provided. Also, an analysis of dividend policy, distinctly considering payer versus non-payer companies, can offer additional important information for practitioners and, also, for academics. The use of the average levels of dividend payout ratio can determine misleading results. As far as we know, finding the distribution for DPR is a new contribution for financial literature.
Another contribution, comparative to previous research, is the large number of countries considered (73) and covering a crisis and a post-crisis period (2008–2014). Our sample included countries from Africa, North and South Americas, Asia, Australia, and Europe. From here, conclusions are validated for countries with a large diversity regarding the cultural values, but also legal systems (our sample includes common law, but also civil law countries).
This outcome could be useful in the future research where a more appropriate distribution could be used for modelling the influencing factors of the DPR. Based on our knowledge, our paper is the first one that tried to investigate which would be the most appropriate distribution function for DPR. Our result can be useful in the context of international portfolio management, especially when we discuss about investments made in a large number of companies (with minority participations), and when forecasting of the future collected dividends is of interest.
As a limitation of the study, our analysis and results are made on only one financial indicator that describe dividend policy - dividend payout ratio. One interesting extension can be made analyzing other indicators reflecting the dividend policy, too. Also, accounting rules are different from country to country (Chui et al. 2002; Dragotă et al. 2018) and from sector to sector (Short et al 2002). Fiscal systems are also different and they can have an impact on financial decisions (Chui et al. 2002, Dragotă et al. 2018), including dividend policy (Short et al 2002, Fidrmuc and Jacob 2010). These issues can have an impact on earnings (La Porta et al. 2000), and, from here, on dividend payout ratio.
Acknowledgements We would like to thank the anonymous referee of this study, who provided very
valuable observations. Also, we wish to thank to Dan Anghel, Andreea Curmei-Semenescu, Bogdan
Negrea, and Mădălina Ecaterina Popescu, for their useful comments. We also wish to thank to the
participants to the 19th Annual Conference on Finance and Accounting organised by the Faculty of
Finance and Accounting, University of Economics, Prague (25 May 2018), and especially to David
Prochazka, Marcio Fernandes Gabrielli, and Jan Hospodka. The remaining errors are ours.
Economics: The Open‐Access, Open‐Assessment E‐Journal 13 (2019–45)
www.economics‐ejournal.org 16
References
Aivazian, V., Booth, L., and Cleary, S. (2003). Do Emerging Market Firms Follow Different Dividend Policies from U.S. Firms? The Journal of Financial Research, 26(3), 371–387. https://doi.org/10.1111/1475-6803.00064
Anderson, T.W., and Darling, D.A.A. (1954). Test of Goodness-of-Fit. Journal of American Statistical Association, 49, 765–769. http://www.hep.caltech.edu/~fcp/statistics/hypothesisTest/PoissonConsistency/AndersonDarling1954.pdf
Arnott, R., and Asness, C. (2003). Surprise! Higher Earnings Growth. Financial Analysts Journal, 59(1), 70–87. https://www.tandfonline.com/doi/abs/10.2469/faj.v59.n1.2504
Baker, K.H., and Weigand, R. (2015). Corporate Dividend Policy Revisited. Managerial Finance, 41(2), 126–144. https://www.emeraldinsight.com/doi/abs/10.1108/MF-03-2014-0077
Baker, K.H., Chang, B., Dutta, S., and Saadi, S. (2012). Why Firms do not pay Dividends: the Canadian Experience. Journal of Business Finance & Accounting, 399(10), 1330–1356. https://onlinelibrary.wiley.com/doi/abs/10.1111/jbfa.12005
Banyi, M.L., and Kahle, K.M. (2014). Declining Propensity to pay? A Re-examination of the Lifecycle Theory. Journal of Corporate Finance 27, 345–366. https://www.sciencedirect.com/science/article/pii/S0929119914000698
Bena, J., and Hanousek, J. (2008). Rent Extraction by Large Shareholders: Evidence Using Dividend Policy in the Czech Republic. Finance a úvěr-Czech Journal of Economics and Finance, 58, 106–130. http://journal.fsv.cuni.cz/storage/1125_str_106_130--bena-hanousek.pdf
Bhattacharya, S. (1979). Imperfect Information, Dividend Policy, and the Bird in Hand Fallacy. The Bell Journal of Economics, 10(1), 259–270. https://econpapers.repec.org/article/rjebellje/v_3a10_3ay_3a1979_3ai_3aspring_3ap_3a259-270.htm
Bonat, W.H., and Kokonendji, C.C. (2017). Flexible Tweedie Regression Models for Continuous Data. Journal of Statistical Computation and Simulation 87(11), 2138–2152. http://www.leg.ufpr.br/~wagner/Articles/BONAT_JSCS_2017.pdf
Chen, J., Leung, W.S., and Goergen, M. (2017). The Impact of Board Gender Composition on Dividend Payouts. Journal of Corporate Finance, 43, 86–105. https://www.sciencedirect.com/science/article/pii/S0929119917300020
Chen, S., and Desiderio, S. (2018). What moves the Beveridge curve and the Phillips curve: an agent-based analysis. Economics: The Open-Access, Open-Assessment E-Journal, 12 (2018-2): 1–30. http://dx.doi.org/10.5018/economicsejournal.ja.2018-2
Chui, A.C.W., Lloyd, A.E., and Kwok, C.C.Y. (2002). The Determination of Capital Structure: Is National Culture a Missing Piece to the Puzzle? Journal of International Business Studies, 33(1), 99–127. https://link.springer.com/article/10.1057/palgrave.jibs.8491007
Cincotti, S., Raberto, M., and Teglio, A. (2010). Credit Money and Macroeconomic Instability in the Agent-based Model and Simulator Eurace. Economics: The Open-Access, Open-Assessment E-Journal, 4 (2010-26): 1–32. http://dx.doi.org/10.5018/ economics-ejournal.ja.2010-26
Economics: The Open‐Access, Open‐Assessment E‐Journal 13 (2019–45)
www.economics‐ejournal.org 17
Clauset, A., Shalizi, C. R., and Newman, M.E.J. (2009). Power-law Distributions in Empirical Data. SIAM Review 51(4), 661–703. https://epubs.siam.org/doi/abs/10.1137/070710111
DeAngelo, H., and DeAngelo, L. (1990). Dividend Policy and Financial Distress: An Empirical Investigation of Troubled NYSE Firms. Journal of Finance, 45(5), 1415–1431. https://onlinelibrary.wiley.com/doi/abs/10.1111/j.1540-6261.1990.tb03721.x
Denis, D.J., and Osobov, I. (2008). Why do Firms pay Dividends? International Evidence on the Determinants of Dividend Policy. Journal of Financial Economics, 89(1), 62–82. https://www.sciencedirect.com/science/article/abs/pii/S0304405X08000445
Desai, M.A., and Jin, L. (2011). Institutional Tax Clienteles and Payout Policy. Journal of Financial Economics 100(1), 68–84. https://www.sciencedirect.com/science/article/abs/pii/S0304405X10002497
Dragotă I.M., Dragotă V., Curmei-Semenescu A., and Pele D.T. (2018). Religion and Capital Structure: Some International Evidences. Acta Oeconomica 68(3), 415–442. https://akademiai.com/doi/abs/10.1556/032.2018.68.3.5
Dunn, P.K., and Smyth, G.K. (2005). Series Evaluation of Tweedie Exponential Dispersion Model Densities. Statistics and Computing 15(4), 267–280. https://link.springer.com/article/10.1007/s11222-005-4070-y
Easterbrook, F.H. (1984). Two Agency-Cost Explanations of Dividends. American Economic Review 74(4), 650–659. https://econpapers.repec.org/article/aeaaecrev/v_3a74_3ay_3a1984_3ai_3a4_3ap_3a650-59.htm
El-Shaarawi, A.H., Zhu, R., and Joe, H. (2011). Modelling Species Abundance Using the Poisson–Tweedie Family. Environmetrics 22(2), 152–164. https://onlinelibrary.wiley.com/doi/abs/10.1002/env.1036
Faccio, M., Lang, L.H.P., and Young, L. (2001). Dividends and Expropriation. American Economic Review, 91(1), 54–78. https://www.aeaweb.org/articles?id=10.1257/aer.91.1.54
Fama, E.F., and French K.R. (2001). Disappearing Dividends: Changing Firm Characteristics or Lower Propensity to pay? Journal of Financial Economics 60(1), 3–43. https://www.sciencedirect.com/science/article/abs/pii/S0304405X01000381
Fatemi, A., and Bildik, R. (2012). Yes, Dividends are disappearing: Worldwide Evidence. Journal of Banking & Finance 36(3), 662–677. https://www.sciencedirect.com/science/article/pii/S0378426611002858
Ferris, S., Sen, N., and Unlu, E. (2009). An International Analysis of Dividend Payment Behavior. Journal of Business Finance & Accounting, 36(3–4), 496–522. https://onlinelibrary.wiley.com/doi/abs/10.1111/j.1468-5957.2009.02126.x
Fidrmuc, J.P., and Jacob, M. (2010). Culture, Agency Cost and Dividends. Journal of Comparative Economics, 38(3), 321–339. https://www.sciencedirect.com/science/article/pii/S0147596710000260
Floyd, E., Li, N.,S., and Douglas, J. (2015). Payout Policy through the Financial Crisis: The Growth of Repurchases and the Resilience of Dividends. Journal of Financial Economics, 118(2), 299–316. https://www.sciencedirect.com/science/article/abs/pii/S0304405X15001415
Economics: The Open‐Access, Open‐Assessment E‐Journal 13 (2019–45)
www.economics‐ejournal.org 18
Gilchrist, R., and Drinkwater, D. (1999). Fitting Tweedie Models to Data with Probability of Zero Responses. Proceedings of the 14th International Workshop on Statistical Modelling, 207–214. https://link.springer.com/chapter/10.1007/978-3-642-57678-2_39
Graham, B., and Dodd, D. (1951). Security Analysis. 3rd ed. New York, McGraw-Hill, Book Company, New York.
He, W., Ng, L., Zaiats, N., and Zhang, B. (2017). Dividend Policy and Earnings Management across Countries. Journal of Corporate Finance, 42, 267–286. https://www.sciencedirect.com/science/article/pii/S0929119916303182
Hofstede, G. (2001). Culture’s Consequences: Comparing Values, Behaviors, Institutions, and Organizations across Nations. Beverly Hills CA: Sage.
Holder, M., Langrehr, F., and Hexter, L. (1998). Dividend Policy Determinants: An Investigation of the Influences of Stakeholder Theory. Financial Management, 27(3), 73–82. https://papers.ssrn.com/sol3/papers.cfm?abstract_id=143689
Huang, T., Wu, F., Yu, J., and Zhang, B. (2015). Political Uncertainty and Dividend Policy: Evidence from International Political Crises. Journal of International Business Studies, March 2015, 1–22. http://ifas.xmu.edu.cn/uploads/soft/130426/paper.pdf
Jäntschi, L., and Bolboacă S.D. (2018). Computation of Probability Associated with Anderson–Darling Statistic. Mathematics — Open Access Journal, 6(6), 88. https://doi.org/10.3390/math6060088
Jiang, F., Ma, Y., and Shi, B. (2017). Stock Liquidity and Dividend Payouts. Journal of Corporate Finance, 42, 295–314. https://www.sciencedirect.com/science/article/pii/S0929119916303583
Jørgensen, B., and Kokonendji, C.C. (2016). Discrete Dispersion Models and their Tweedie Asymptotics. AStA Advances in Statistical Analysis 100(1), 43–78. https://link.springer.com/article/10.1007/s10182-015-0250-z
Jørgensen, B., Paes De Souza, M.C. (1994). Fitting Tweedie's Compound Poisson Model to Insurance Claims Data. Scandinavian Actuarial Journal 1, 69–93. https://www.tandfonline.com/doi/abs/10.1080/03461238.1994.10413930
Kalay, A. (1980). Signalling, Information Content and the Reluctance to cut Dividends. Journal of Financial and Quantitative Analysis, 15(4), 855–869. http://ecsocman.hse.ru/data/909/126/1231/kalay_-_signaling_1980.pdf
Kuo, J., Philip, D., Zhang, Q. (2013). What drives the Disappearing Dividends Phenomenon? Journal of Banking & Finance 37(9), 3499–3514. https://www.sciencedirect.com/science/article/pii/S0378426613002215
Kurz, C. (2017). Tweedie Distributions for Fitting Semicontinuous Health Care Utilization Cost Data. BMC Medical Research Methodology 17, 171, 1–8. https://bmcmedresmethodol.biomedcentral.com/articles/10.1186/s12874-017-0445-y
La Porta, R., Lopez-de-Silanes, F., Shleifer, A., and Vishny, R.W. (2000). Agency Problems and Dividend Policies around the World. Journal of Finance, 55(1), 1–33. https://onlinelibrary.wiley.com/doi/10.1111/0022-1082.00199
Lamont, O. (1998). Earnings and Expected Returns. Journal of Finance 53(5), 1563–1587. https://onlinelibrary.wiley.com/doi/abs/10.1111/0022-1082.00065
Economics: The Open‐Access, Open‐Assessment E‐Journal 13 (2019–45)
www.economics‐ejournal.org 19
Lettau, M., and Ludvinson, S. (2001). Consumption, Aggregate Wealth, and Expected Stock Returns. Journal of Finance 56(3), 815–849. https://onlinelibrary.wiley.com/doi/10.1111/0022-1082.00347
Lintner, J. (1956). Distribution of Incomes of Corporations among Dividends, Retained Earnings and Taxes. American Economic Review 46(2), 97–113.
Miller, M.H., and Modigliani, F. (1961). Dividend Policy, Grow and the Valuation of Share. Journal of Business, 34(4), 411–433. https://www2.bc.edu/thomas-chemmanur/phdfincorp/MF891%20papers/MM%20dividend.pdf
Nicolosi, G. (2013). Demographics of Dividends. Journal of Corporate Finance 23, 54–70. https://www.sciencedirect.com/science/article/pii/S0929119913000606
Pearson, K. (1895). Contribution to the Mathematical Theory of Evolution. II. Skew Variation in Homogenous Material. Philosophical Transactions of the Royal Society of London, 91, 343–414.
Renneboog, L., and Trojanowski, G. (2007). Control Structures and Payout Policy. Managerial Finance, 33(1), 43–64. https://www.emeraldinsight.com/doi/abs/10.1108/03074350710715809
Renshaw, A.E. (1994). Modelling the Claims Process in the Presence of Covariates. ASTIN Bulletin 24, 265–286. https://www.cambridge.org/core/services/aop-cambridge-core/content/view/S051503610000283X
Scholz, F.W., Stephens, M.A. (1987). K-Sample Anderson–Darling Tests, Journal of the American Statistical Association, 82(399), 918–924.
https://www.tandfonline.com/doi/abs/10.1080/01621459.1987.10478517
Shao, L., Kwok, C.C.I., and Guedhami, O. (2010). National Culture and Dividend Policy. Journal of International Business Studies, 41, 391–414. https://link.springer.com/article/10.1057/jibs.2009.74
Short, H., Zhang, H., and Keasey, K. (2002). The Link between Dividend Policy and Institutional
Ownership. Journal of Corporate Finance 8(2): 105–122. https://www.sciencedirect.com/science/article/pii/S092911990100030X
Smyth, G.K. (1996). Regression Analysis of Quantity Data with Exact Zeros. In Proceedings of the Second Australia-Japan Workshop on Stochastic Models in Engineering, Technology, and Management, edited by R. J. Wilson, S. Osaki, and D. N. P. Murthy, 572–580. Queensland, Australia: Technology Management Centre, University of Queensland. https://pdfs.semanticscholar.org/8136/348cd0080641a3eccac2bfdfceec38b0edb5.pdf
Stephens, M.A. (1974). EDF Statistics for Goodness of Fit and Some Comparisons. Journal of the American Statistical Association, 69(347), 730–737. https://www.tandfonline.com/doi/abs/10.1080/01621459.1974.10480196
Tweedie, M.C.K. (1984). An Index which distinguishes between some Important Exponential Families. In J.K. Ghosh and J. Roy (Eds.), Statistics: Applications and New Directions. Proceedings of the Indian Statistical Institute Golden Jubilee International Conference, Calcutta: Indian Statistical Institute.
von Eije, H., and Megginson, W.L. (2008). Dividends and Share Repurchases in the European Union. Journal of Financial Economics 89(2), 347–374. https://www.sciencedirect.com/science/article/abs/pii/S0304405X08000949
Economics: The Open‐Access, Open‐Assessment E‐Journal 13 (2019–45)
www.economics‐ejournal.org 20
Walter, J.E. (1956). Dividend Policies and Common Stock Prices. Journal of Finance, 1(1), 29-41. https://onlinelibrary.wiley.com/doi/full/10.1111/j.1540-6261.1956.tb00684.x
Yaseen, H. (2019). Dividend Policy explained by Country’s Standards of Living: An International Evidence. In: D. Procházka (ed.), Global versus Local Perspectives on Finance and Accounting. Springer Proceedings in Business and Economics, Springer Nature, Switzerland AG 2019. https://link.springer.com/chapter/10.1007%2F978-3-030-11851-8_12
Yaseen, H., and Dragotă, V. (2019). Harmony, Hierarchy and Dividend Policy around the World. In: D. Procházka (ed.), Global versus Local Perspectives on Finance and Accounting. Springer Proceedings in Business and Economics, Springer Nature, Switzerland AG 2019. https://link.springer.com/chapter/10.1007%2F978-3-030-11851-8_11
Ye, D., Deng, J., Liu, Y., Szewczyk, S., and Chen, X. (2019). Does Board Gender Diversity increase Dividend Payouts? Analysis of Global Evidence. Journal of Corporate Finance, 58, 1–26. https://www.sciencedirect.com/science/article/pii/S0929119918300312
Zheng, C., and Ashraf, B.N. (2014). National Culture and Dividend Policy: International Evidence from Banking. Journal of Behavioral and Experimental Finance 3, 22–40.
https://www.sciencedirect.com/science/article/abs/pii/S2214635014000392
Economics: The Open‐Access, Open‐Assessment E‐Journal 13 (2019–45)
www.economics‐ejournal.org 21
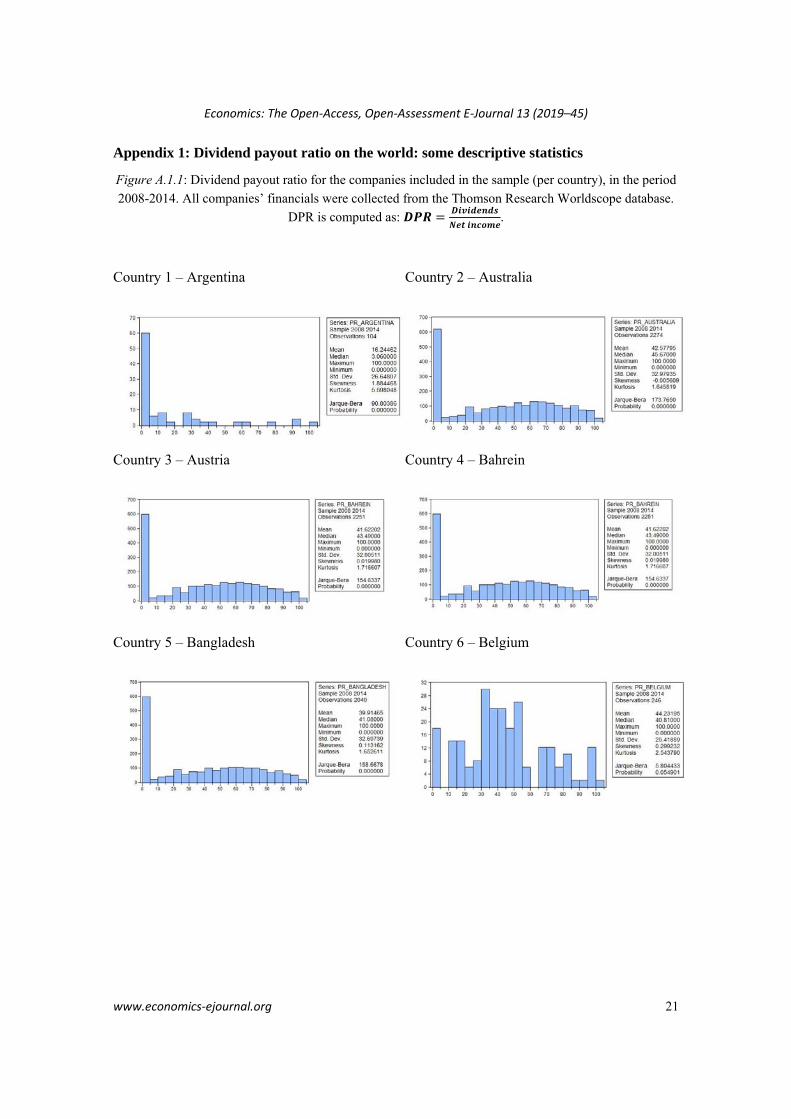
Appendix 1: Dividend payout ratio on the world: some descriptive statistics
Figure A.1.1: Dividend payout ratio for the companies included in the sample (per country), in the period
2008-2014. All companies’ financials were collected from the Thomson Research Worldscope database.
DPR is computed as:
.
Country 1 – Argentina
Country 2 – Australia
Country 3 – Austria
Country 4 – Bahrein
Country 5 – Bangladesh
Country 6 – Belgium
Economics: The Open‐Access, Open‐Assessment E‐Journal 13 (2019–45)
www.economics‐ejournal.org 22
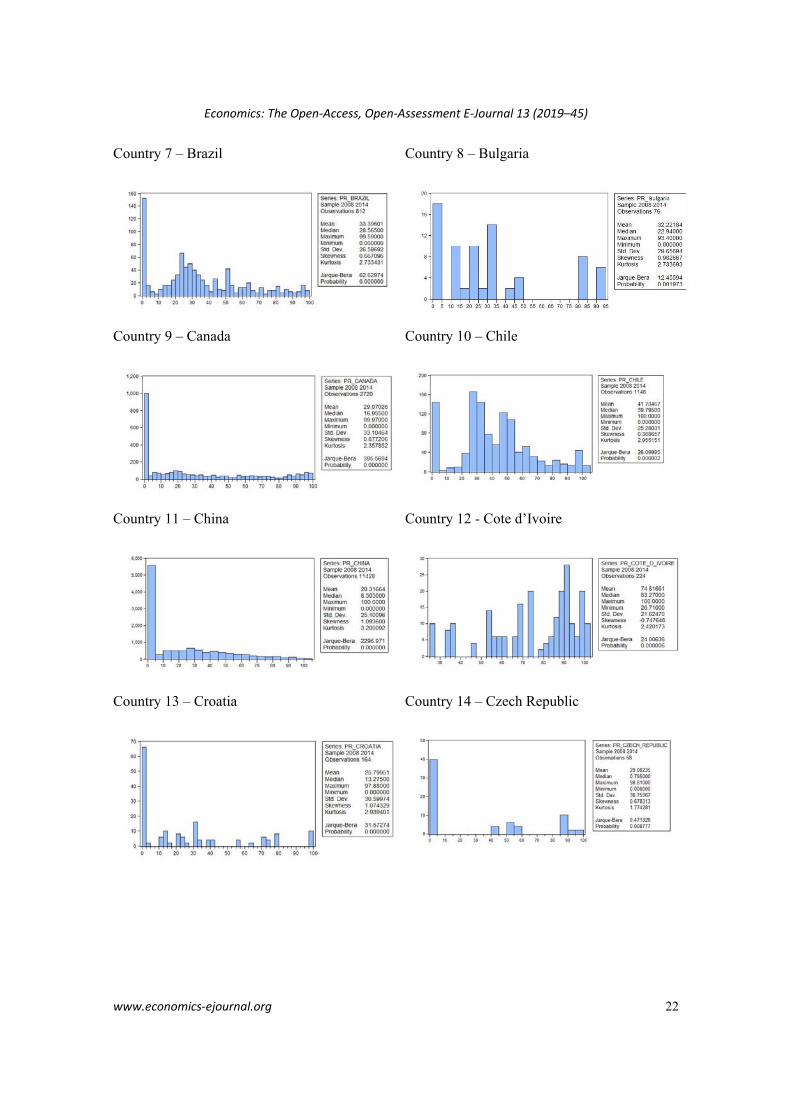
Country 7 – Brazil
Country 8 – Bulgaria
Country 9 – Canada
Country 10 – Chile
Country 11 – China
Country 12 - Cote d’Ivoire
Country 13 – Croatia
Country 14 – Czech Republic
Economics: The Open‐Access, Open‐Assessment E‐Journal 13 (2019–45)
www.economics‐ejournal.org 23
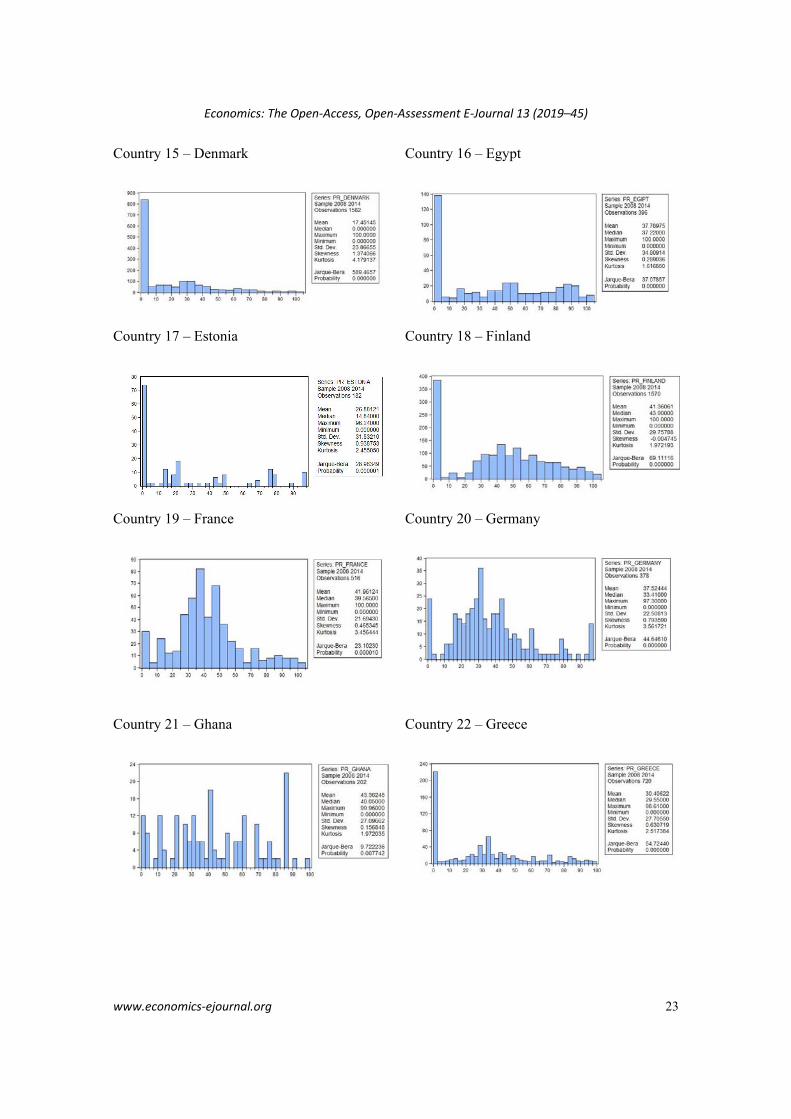
Country 15 – Denmark
Country 16 – Egypt
Country 17 – Estonia
Country 18 – Finland
Country 19 – France
Country 20 – Germany
Country 21 – Ghana
Country 22 – Greece
Economics: The Open‐Access, Open‐Assessment E‐Journal 13 (2019–45)
www.economics‐ejournal.org 24
Country 23 – Hong Kong
Country 24 – Hungary
Country 25 – India
Country 26 – Indonesia
Country 27 – Ireland
Country 28 – Israel
Country 29 – Italy
Country 30 – Japan
Economics: The Open‐Access, Open‐Assessment E‐Journal 13 (2019–45)
www.economics‐ejournal.org 25
Country 31 – Kazakhstan
Country 32 – Kenya
Country 33 – Kuwait
Country 34 – Latvia
Country 35 – Lithuania
Country 36 - Luxembourg
Country 37 – Former Yugoslav Republic of Macedonia
Country 38 – Malaysia
Economics: The Open‐Access, Open‐Assessment E‐Journal 13 (2019–45)
www.economics‐ejournal.org 26
Country 39 – Malta
Country 40 – Mauritius
Country 41 – Mexico
Country 42 – Morocco
Country 43 – Netherlands
Country 44 - New Zealand
Country 45 – Norway
Country 46 – Oman
Economics: The Open‐Access, Open‐Assessment E‐Journal 13 (2019–45)
www.economics‐ejournal.org 27
Country 47 – Pakistan
Country 48 – Palestine
Country 49 – Peru
Country 50 – Philippines
Country 51 – Poland
Country 52 - Portugal
Country 53 - Romania
Country 54 – Russia
Economics: The Open‐Access, Open‐Assessment E‐Journal 13 (2019–45)
www.economics‐ejournal.org 28
Country 55 – Saudi Arabia
Country 56 – Serbia
Country 57 – Slovenia
Country 58 - South Africa
Country 59 - South Korea
Country 60 – Spain
Country 61 - Sri Lanka
Country 62 – Sweden
Economics: The Open‐Access, Open‐Assessment E‐Journal 13 (2019–45)
www.economics‐ejournal.org 29
Country 63 - Switzerland
Country 64 – Thailand
Country 65 – Tunisia
Country 66 – Turkey
Country 67 – Ukraine
Country 68 - United Arab Emirates
Country 69 - United Kingdom
Country 70 - United States of America
Economics: The Open‐Access, Open‐Assessment E‐Journal 13 (2019–45)
www.economics‐ejournal.org 30
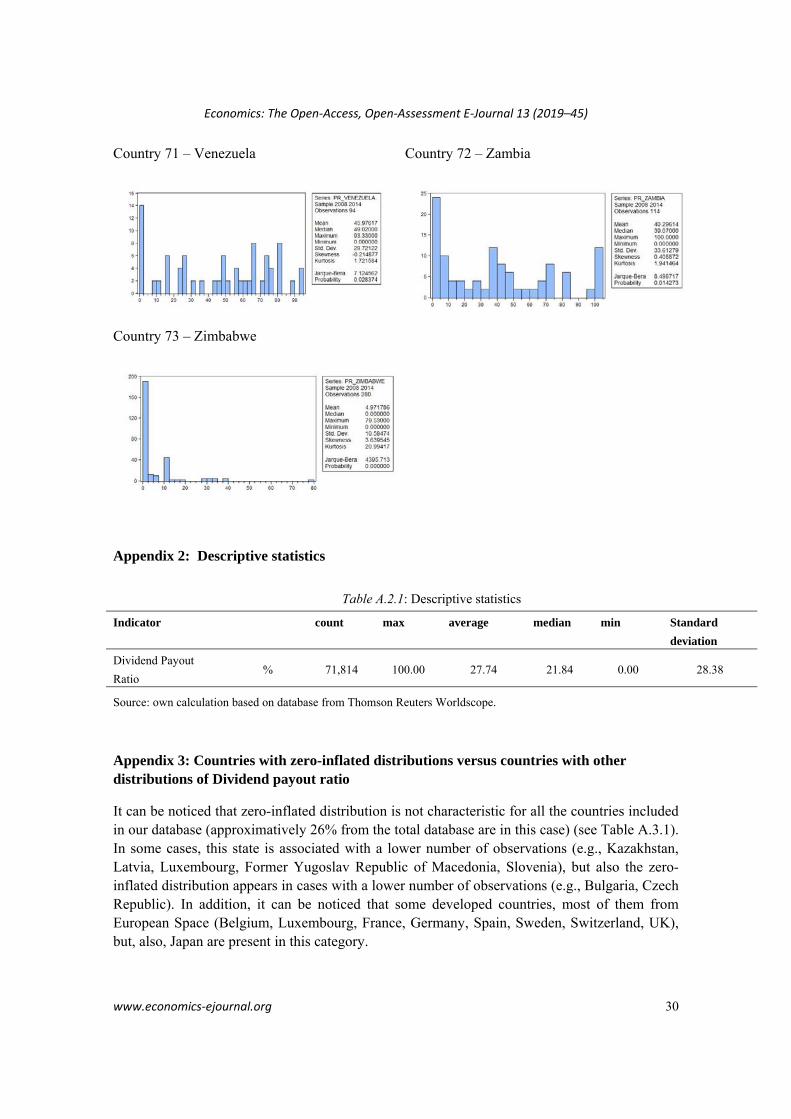
Country 71 – Venezuela
Country 72 – Zambia
Country 73 – Zimbabwe
Appendix 2: Descriptive statistics
Table A.2.1: Descriptive statistics
Indicator count max average median min Standard
deviation
Dividend Payout
Ratio % 71,814 100.00 27.74 21.84 0.00 28.38
Source: own calculation based on database from Thomson Reuters Worldscope.
Appendix 3: Countries with zero-inflated distributions versus countries with other distributions of Dividend payout ratio
It can be noticed that zero-inflated distribution is not characteristic for all the countries included in our database (approximatively 26% from the total database are in this case) (see Table A.3.1). In some cases, this state is associated with a lower number of observations (e.g., Kazakhstan, Latvia, Luxembourg, Former Yugoslav Republic of Macedonia, Slovenia), but also the zero-inflated distribution appears in cases with a lower number of observations (e.g., Bulgaria, Czech Republic). In addition, it can be noticed that some developed countries, most of them from European Space (Belgium, Luxembourg, France, Germany, Spain, Sweden, Switzerland, UK), but, also, Japan are present in this category.

Economics: The Open‐Access, Open‐Assessment E‐Journal 13 (2019–45)
www.economics‐ejournal.org 31
Table A.3.1: Countries with zero-inflated distributions versus countries with other distributions of
Dividend payout ratio
Zero-inflated distribution Other distributions Austria Belgium Argentina Bulgaria Australia Chile Bahrein Cote d’Ivoire Bangladesh Former Yugoslav Republic of Macedonia Brazil France Bulgaria Germany Canada Hong-Kong China Japan Croatia Kazakhstan Czech Republic Kenya Denmark Latvia Egypt Luxembourg Estonia Mauritius Finland Slovenia Greece Spain Holland Sweden Hungary Switzerland India United Kingdom Indonesia Ireland Israel Italy Kuwait Lithuania Malaysia Malta Mexico Morocco New Zeeland Norway Pakistan Palestine Peru Philippines Poland Portugal Romania Russia Saudi Arabia Serbia South Africa South Korea Sri Lanka Thailand Tunisia Turkey Ukraine United Arad Emirates United States of America Venezuela Zambia Zimbabwe
Note: the results for Oman are not conclusive.
Economics: The Open‐Access, Open‐Assessment E‐Journal 13 (2019–45)
www.economics‐ejournal.org 32
It can be suspected that the situation from Table A.3.1 can be related to the capital market development (see market capitalization as proxy). However, from the first 10 countries ranked function of market capitalization,15 four present a zero-inflated distribution (US, China, Canada, India). Considering the value of stocks traded as percent in GDP,16 six present a zero-inflated distribution.17
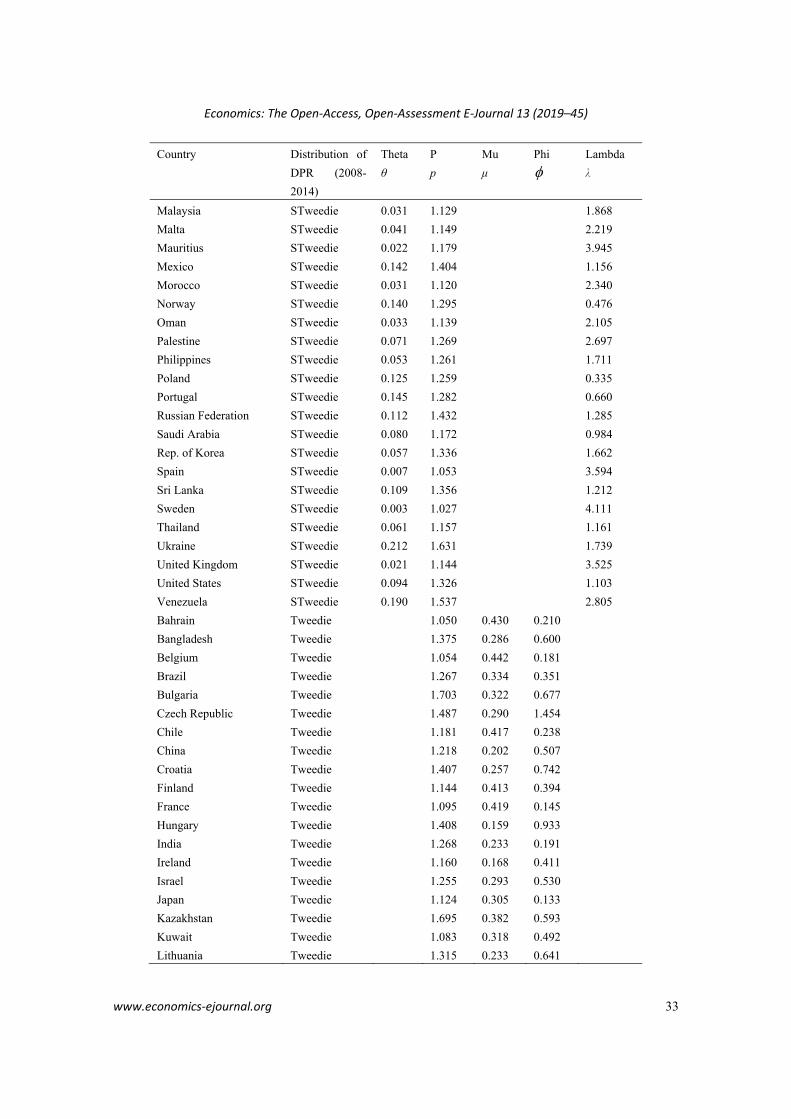
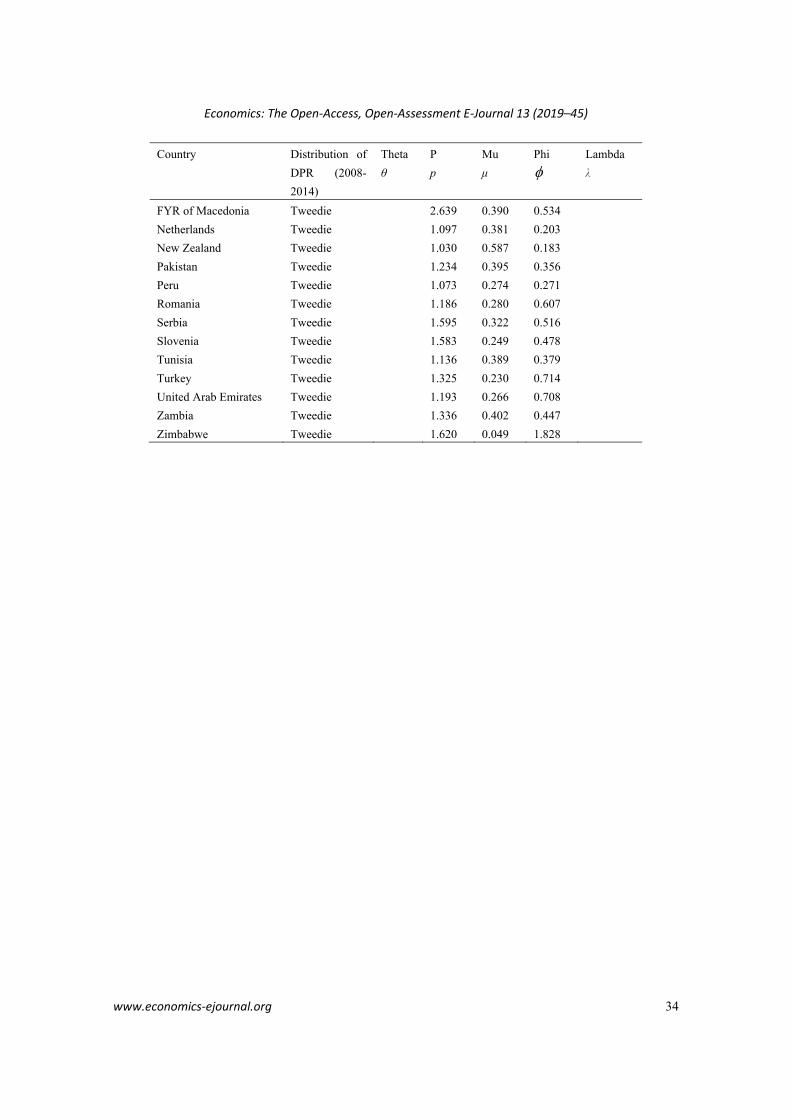
One interesting future direction for analysis is to consider some cultural determinants for explaining this zero-inflated distribution for DPR. These similarities can be explained by similar cultural dimensions or people behaviour. For example, similar harmony index (Yaseen and Dragotă, 2019) or similar life standards (Yaseen, 2019) in those countries may lead to similar decisions regarding paying dividends or not. Appendix 4: Parameters of the Tweedie and Scaled Tweedie distribution, by country
Table A.4.1: Estimated Parameters of the Tweedie and Scaled Tweedie distribution, by country
Country Distribution of
DPR (2008-
2014)
Theta
θ
P
p
Mu
μ
Phi
Lambda
λ
Côte d'Ivoire Burr
Luxembourg Burr
Latvia Exp
South Africa STweedie 0.029 1.139 2.150
Argentina STweedie 0.204 1.478 0.727
Australia STweedie 0.052 1.143 1.376
Austria STweedie 0.022 1.063 1.009
Canada STweedie 0.148 1.344 1.031
Denmark STweedie 0.105 1.283 0.653
Egypt STweedie 0.094 1.214 1.094
Switzerland STweedie 0.004 1.038 3.542
Estonia STweedie 0.101 1.258 0.928
Germany STweedie 0.021 1.144 3.000
Ghana STweedie 0.059 1.297 3.124
Greece STweedie 0.083 1.248 1.213
Hong Kong STweedie 0.010 1.099 3.954
Indonesia STweedie 0.109 1.288 0.502
Italy STweedie 0.018 1.070 1.699
Kenya STweedie 0.034 1.140 2.586 _________________________
15 Top 10 countries, as market capitalization (2019), according to: https://www.indexmundi.com/facts/indicators/CM.MKT.LCAP.CD/rankings, is: 1. US. 2. China. 3. Japan. 4. Hong-Kong. 5. France. 6. Canada. 7. UK. 8. Germany. 9. India. 10. Switzerland.
16 Top 10 countries, as value of stocks traded as percent in GDP (2019), according to: https://www.indexmundi.com/facts/indicators/CM.MKT.TRAD.GD.ZS/rankings, is: 1. Hong-Kong. 2. US. 3. China. 4. South Africa. 5. Switzerland. 6. South Korea. 7. Japan. 8. Finland. 9. Italy. 10. Iceland.
17 We did not include in our study Iceland because of lack of data.
Economics: The Open‐Access, Open‐Assessment E‐Journal 13 (2019–45)
www.economics‐ejournal.org 33
Country Distribution of
DPR (2008-
2014)
Theta
θ
P
p
Mu
μ
Phi
Lambda
λ
Malaysia STweedie 0.031 1.129 1.868
Malta STweedie 0.041 1.149 2.219
Mauritius STweedie 0.022 1.179 3.945
Mexico STweedie 0.142 1.404 1.156
Morocco STweedie 0.031 1.120 2.340
Norway STweedie 0.140 1.295 0.476
Oman STweedie 0.033 1.139 2.105
Palestine STweedie 0.071 1.269 2.697
Philippines STweedie 0.053 1.261 1.711
Poland STweedie 0.125 1.259 0.335
Portugal STweedie 0.145 1.282 0.660
Russian Federation STweedie 0.112 1.432 1.285
Saudi Arabia STweedie 0.080 1.172 0.984
Rep. of Korea STweedie 0.057 1.336 1.662
Spain STweedie 0.007 1.053 3.594
Sri Lanka STweedie 0.109 1.356 1.212
Sweden STweedie 0.003 1.027 4.111
Thailand STweedie 0.061 1.157 1.161
Ukraine STweedie 0.212 1.631 1.739
United Kingdom STweedie 0.021 1.144 3.525
United States STweedie 0.094 1.326 1.103
Venezuela STweedie 0.190 1.537 2.805
Bahrain Tweedie 1.050 0.430 0.210
Bangladesh Tweedie 1.375 0.286 0.600
Belgium Tweedie 1.054 0.442 0.181
Brazil Tweedie 1.267 0.334 0.351
Bulgaria Tweedie 1.703 0.322 0.677
Czech Republic Tweedie 1.487 0.290 1.454
Chile Tweedie 1.181 0.417 0.238
China Tweedie 1.218 0.202 0.507
Croatia Tweedie 1.407 0.257 0.742
Finland Tweedie 1.144 0.413 0.394
France Tweedie 1.095 0.419 0.145
Hungary Tweedie 1.408 0.159 0.933
India Tweedie 1.268 0.233 0.191
Ireland Tweedie 1.160 0.168 0.411
Israel Tweedie 1.255 0.293 0.530
Japan Tweedie 1.124 0.305 0.133
Kazakhstan Tweedie 1.695 0.382 0.593
Kuwait Tweedie 1.083 0.318 0.492
Lithuania Tweedie 1.315 0.233 0.641
Economics: The Open‐Access, Open‐Assessment E‐Journal 13 (2019–45)
www.economics‐ejournal.org 34
Country Distribution of
DPR (2008-
2014)
Theta
θ
P
p
Mu
μ
Phi
Lambda
λ
FYR of Macedonia Tweedie 2.639 0.390 0.534
Netherlands Tweedie 1.097 0.381 0.203
New Zealand Tweedie 1.030 0.587 0.183
Pakistan Tweedie 1.234 0.395 0.356
Peru Tweedie 1.073 0.274 0.271
Romania Tweedie 1.186 0.280 0.607
Serbia Tweedie 1.595 0.322 0.516
Slovenia Tweedie 1.583 0.249 0.478
Tunisia Tweedie 1.136 0.389 0.379
Turkey Tweedie 1.325 0.230 0.714
United Arab Emirates Tweedie 1.193 0.266 0.708
Zambia Tweedie 1.336 0.402 0.447
Zimbabwe Tweedie 1.620 0.049 1.828

Please note:
You are most sincerely encouraged to participate in the open assessment of this article. You can do so by either recommending the article or by posting your comments.
Please go to:
http://dx.doi.org/10.5018/economics-ejournal.ja.2019-45
The Editor
© Author(s) 2019. Licensed under the Creative Commons License - Attribution 4.0 International (CC BY 4.0)