Embed Size (px)
Citation preview
AN L-95/22* ~'i.P
4 2..,
T~'y
T? cogyNoey
e *. : '
*
Divf ia-DivisonDivisionDiAlston
DivisionDoveskn
... . . . .* '4. , .4' ...
4''.''. '4.42".
Weight Losses of Marble andLimestone Briquettes Exposedto Outdoor Environment in the
Eastern United States
Results of Exposure 1988-1992
by K. J. Reimann
ArgcI Natiial Laboratory, Argonne, Illinois 60439operated by The University of Chicago
fob th Urted States Department of Energy under Contract W-31-109-Eng-38
Y M_" 1. 4
/A, ~
I,-.8'. 4
~
1
. ifs "
Argonne National Laboratory, with facilities in the states of Illinois :And Idaho. LS
owned by the United States government, and operated by The University of Chicagounder the provisions of a contract with the Department of Energy.
DISCLAIMERThis report was prepared as an account of work sponsored by an agency ofthe United States Government. Neither the United Stales, Go-eruinent norany agency thereof, nor any of their employees, makes any warranty. expressor implied, or assumes any legal liability or responsibility for the accuracy.completeness, or usefulness of any information, apparatus, product, or process disclosed, or reprsents that its use would not infringe privately ownedrights. Reference herein to any specific commercial product, process, orservice by trade name, trademark, manufacturer. or otherwise, does notnecessarily constitute or imply its endorsement, recommendation. orfavoring by the United States Government or any agency thereof. The viewsand opinions of authors expressed herein do not necessarily state or reflectthose of the United States Government or any agency thereof.
Reproduced irom the bell available copy.
Available to DOE and DOE contractors from theOffice of Scientific and Technical lnfonnation
P.O. Box 62Oak R idge, T 379 t i
Prices available from (421) %76-8401
Available to the puhcI frnn theNatinoal Tectutical informnation Sct-vicc
U.S. Department of Commerce5285 Port Royal Road
Sprinfield, VA 22161
DistributionCategory:
Energy Research(UC-400)
ARGONNE NATIONAL lABORATORY9700 South Cass Avenue. Argonne. Illinois 60439
ANL-95/22
WEIGHT LOSSES OF MARBLE AND LIMESTONE BRIQUETTESEXPOSED TO OUTDOOR ENVIRONMENT IN THE
EASTERN UNITED STATES
RESULTS OF EXPOSURE 1988-1992
by
K. J. Reimann
Energy Technology DivisionInstrumentation and NDE Section
MASTER
April 1995
Work sponsored by
U.S. NATIONAL PARK SERVICEas part of the National Acid Precipitation Assessment Program
DSTT JION OF THIM EOCR lEI T W F g

DISCLAIMER
Portions of this document may be illegiblein electronic image products. Images areproduced from the best available originaldocument.
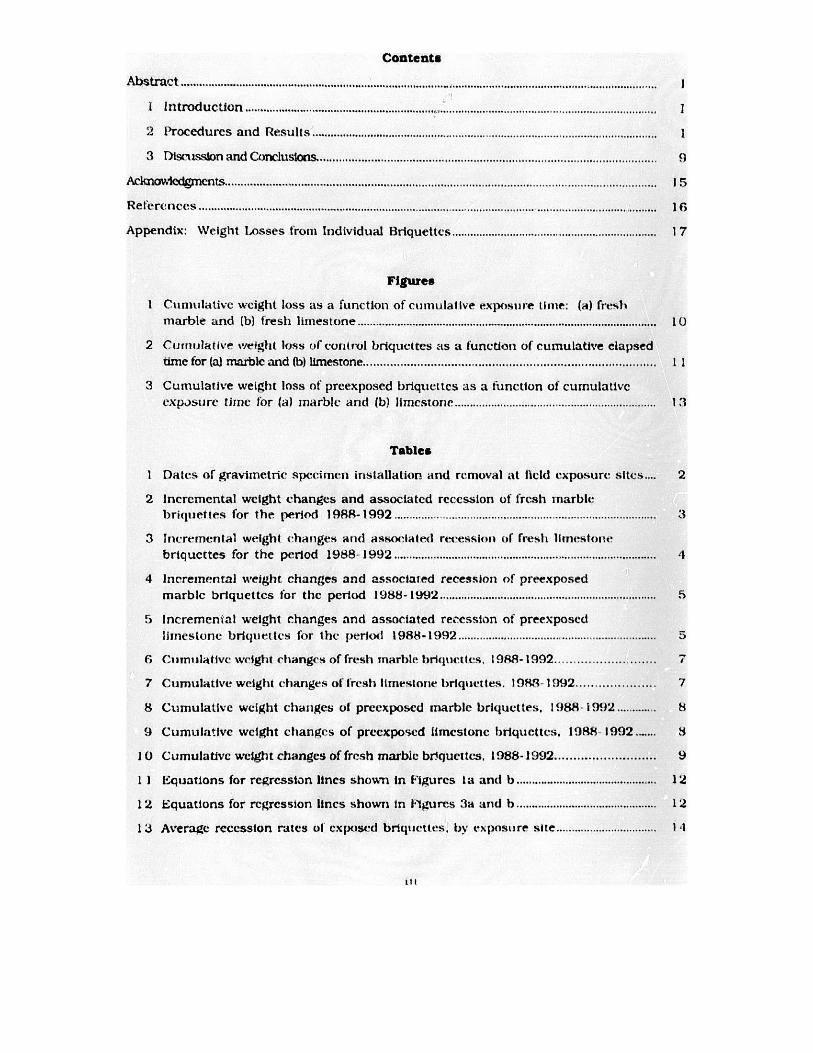
Contents
Abstract ....
I introduction .............................................................. ..................................................................... , I
2 Procedu rcs an d R esu lts .............................................................................................................. 1
3 D iscussion and C onclusions.......................................................................................................... 9A ckn ow ledg m en ts....................,..............................,.................................................................................... 15
R e e re n e s 1.................................................................................................................................................... I 6
Appendix: Weight Losses from Individual Brquettes ................................................................... 1 7
Figures
I Cumulative weight loss as a function of cumulative exposure time: (a) freshmarble and (b) fresh limestone .................................................................................................. 10
2 Cumivrudative weight loss of control briquettes as a function of cumulative elapsedtime for (a) marble and (b) limestone..................................................................................... I I
3 Cumulative weight loss of preexposed briquettes as a function of cumulativeexposure time for (a) marble and (b) limestone................................................................. 1 3
Tables
1 Dates of gravimetric specimen installation and removal at field exposure sites.... 2
2 Incremental weight changes and associated recession of fresh marblebri(li ettes for the period 1988-1992 .............. ................................................................... 3
3 Incrernental weight (hanlges and associated recession of fresh limestone
briquettes for the period 1988- 1992.................................................................................. 4
4 incremental weight changes and associated recession of preexposedmarble briquettes for the period 1988- 1992...................................................................... 5
5 lncremenial weight changes and associated re:cssion of preexposedlimestone briquettes for the perkid 1988-1992................................................................ 5
6 Ciamulative weight changes of fresh marble briquecies. I988-1992........................... 7
7 Cumulative weight changes of fresh limestone briquieties. 198 1992..................... 7
8 Cumulative weight changes of preexposed marble briquettes. 1988- i992........... 8
9 Cumulative weight changes of precxposed limestone briquettes. 1988 1992....... 8
10 C Cumulative weight changes of fresh marble briquettes, 1988-1992........................... 9
1 1 Equations for regression lines shown in Figures la and b ............................................. 12
12 Equations for regression lInes shown in 1-'1gures 3a and b ............................................. 12
1 3 Average recession rates of exposed briquettes, by exposure site................. ....... 1
Lii
A.1 Weight changes in exposed and control briquettes: fresh stone. annuals.9 8 8 -19 8 9 .......................................................................................................................................... 19
A.2 Weight changes in exposed and control briquettes: fresh stone, annuals.1989-1990 and 1990 1992 ........................................................................................................ 20
A.3 Weight changes in exposed and control briquettes: fresh stone.qu inqu en n ials. 1984 -1989 .......................................................................................................... 2 1
A.4 \Veight changes in exposed and control briquettes: fresh stone,qvinquennials. 1989 runoff....................................................................... ................................ 22
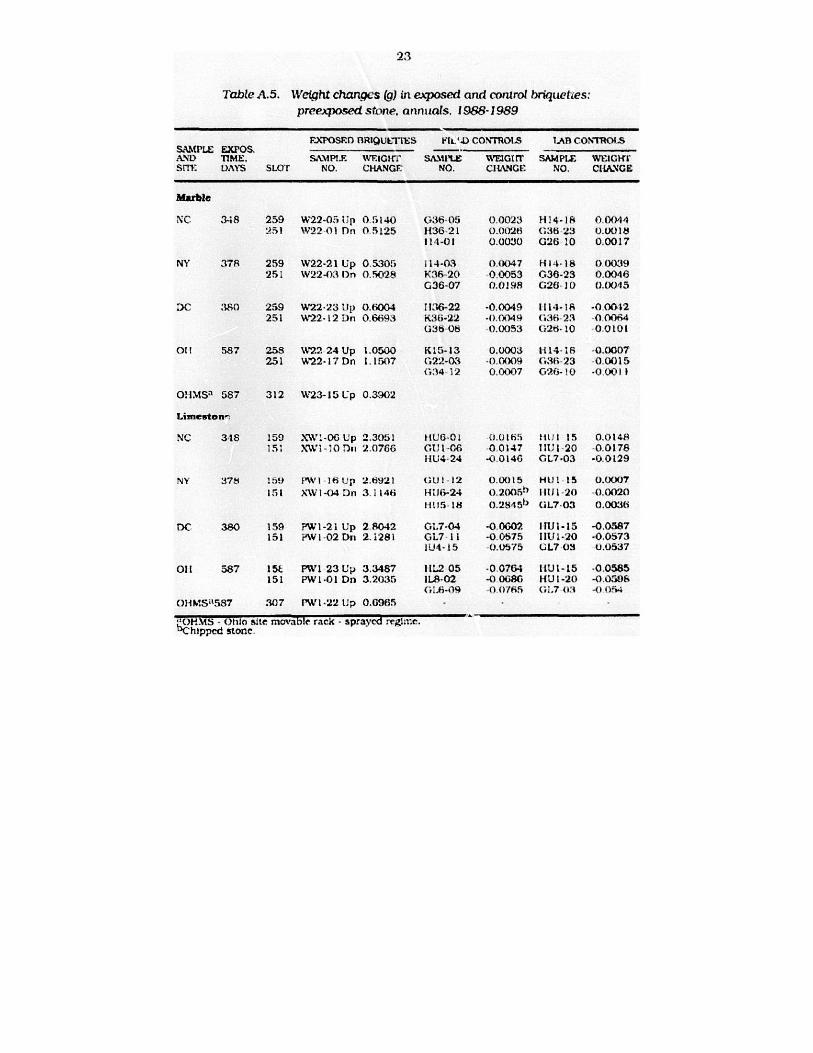
A.5 Weight changes in exposed and control briquettes: preexposed stone,an n u als. 198 8 1989 ........................................................................................................................ '2 3
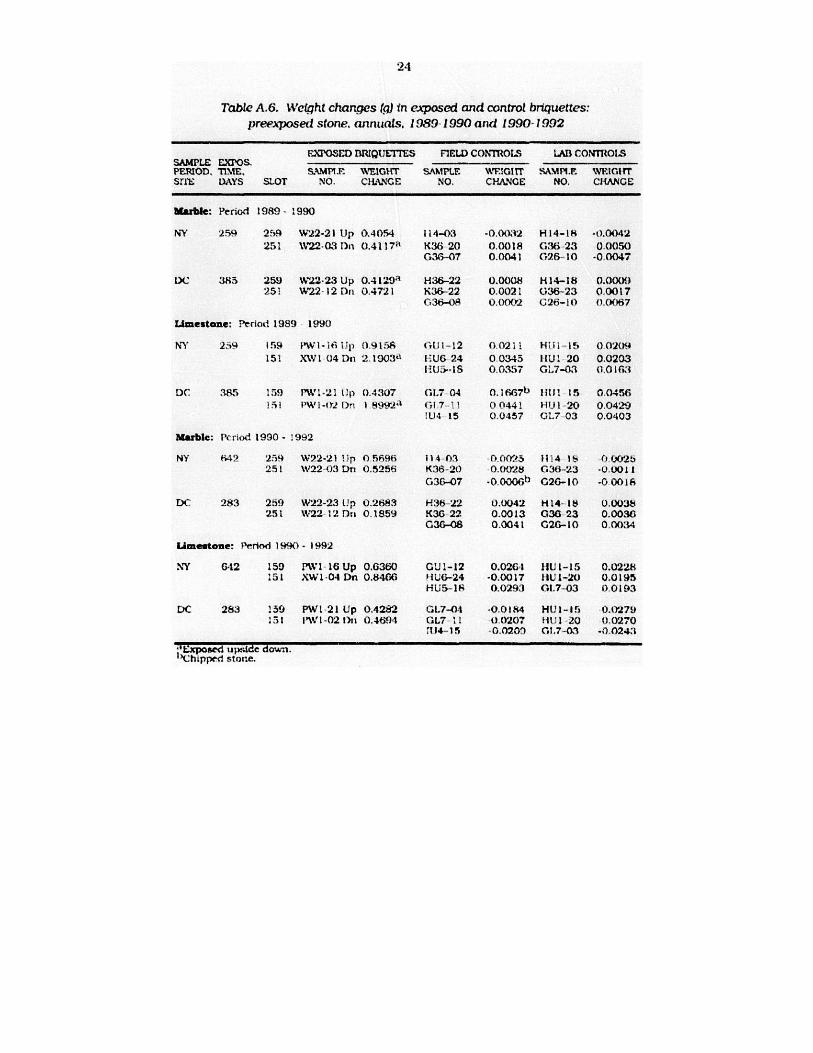
A.6 Weight changes in exposed and control briquettes: preexposed stone,annuals. 1989-1990 and 1990 1992 .................................................................................... 24
iv~
WEIGHT LOSSES OF MARBLE AND LIMESTONE BRIQUETTESEXPOSED TO OUTDOOR ENVIRONMENT
IN THE EASTERN UNITED STATES
RESULTS OF EXPOSURE, 1988-1992
by
K. J. Reinarn
ABSTRACT
Monitoring continued on weight changes in marble and limestone briquettes exposedto the outdoor environment at sites in the eastern United States. This report presentsdata for the exposure period 1988-1992 and summarizes results for the entire period from1984. Since 1989. only three exposure sites have remained active, but briquettes frompreexposed material were added at those sites. A linear relationship was found betweencumulative gravimetric losses and exposure period. These losses resulted in an averagerecession rate of 1 I to 21 pt/yr for marble and 21 to 45 pm/yr for limestone. Therecession rates are site-dependent and can be described with respect to rain depth andother atmospheric conditions, as evidenced by the very low rates at the Ohio site on themovable rack. dry regime. Weight monitoring is continuing in a planned 10-year program.
1 INTRODUCTION
Studies of the effects of acid precipitation and air pollution on the weathering ofShelburne marble and Salem limestone at test sites in the eastern United States arecontinuing under the sponsorship of the U.S. Department of Interior. National ParkService. Monitoring of weight changes of marble and limestone briquettes after exposureto the environment at the test sites is one of sev# rai tasks perforMed at Argonne NationalLaboratory (ANL).
The environmental exposure of stone briquettes began in May 1984 at test sites inRaleigh, NC: Chester. NJ; Newcomb. NY: Washington. DC: and in 1986 in Steubenvile.OH 1. The exposure sites are instrumented to record a wide range of etnironmertalparameters.
Sets o' gravimetry briquettes are Installed in racks at vach siter for annual or nottyearexposure periods. Withdrawal, weighing, and reinstallation of gravimetrie briquettesfollows a strict protocol.1 summarized in the description of experimental procedures inRefs. 2 and 3. Outdoor exposure of briquettes at the NJ site was discontinued in 1987. butthe quinquennial briquettes were retrieved in 1989 and weighed. Similarly, exposure atthe NC site was discontinued in 1989.
This report details the results obtained by weight xmeasuremetits from 1988 to 1992.All data from 1984 to 1992 were used to generate the graphs in order to assess trends oflong-time exposure. Weight changes of individual briqluettrs are listed in the Appendix.
2 PROCEDURES AND RESULTS
Three briquettes of each stone type exposed at each active site, together with the sitesimulation samples, were retrieved according to schedule, dried, weighed, and returned tothe exposure site for reinstallation. Included in the measurement procedure 2 were threecontrol samples that were kept at ANL. In 1989. three quinquennial briquettes of rach
2
stone type were retrieved and measured, together with the annual samples from therespective exposure sites (except NJ and ail). At the NJ site. no annual samples wereexposed after 1987. Quinquennial briquettes from 011 were not due for retrieval in thalyear. In 1988. after installation of preexposed briquettes at NC. NY. DC. and OR. thcrretrieval and weight measurements were made to cotnckde with those of annual briquettesformed from fresh stone.
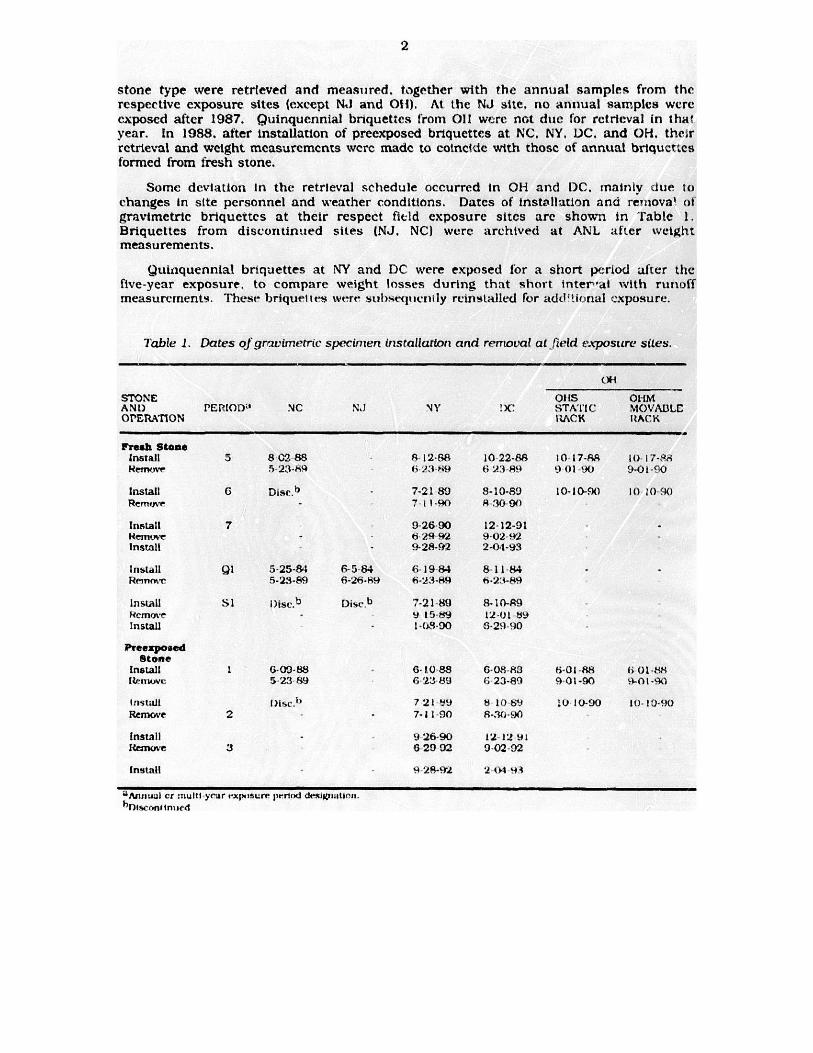
Some deviation in the retrieval schedule occurred in OH and DC. mainly d:iue tochanges in site personnel and weather conditions. Dates of installation and removal ofgravimetric briquettes at their respect field exposure sites are shown in 'Table 1.Briquettes from discontinued sites (NJ. NC) were archived at ANL aofer weightmeasurements.
Quinquennial briquettes at NY and DC were exposed for a short period after thefive-year exposure. to compare weight losses during that short internal with runoffmeasurements. These briquet es were subseq len! ly reinstalled For additional xposure.
Table 1. Dates of gravimetric specimen installaron and removal at field exposure sites.
OH
STONE OffS OHMAND PEPIOD' NC NJ NY !x' STATIC M)VALILEOPErATION 1iACK ItACK
Fresh StoneInstall 5 8 02 88 8.12-88 10 22-88 10 17-88 1 I7-98Remov- 5 23-84 h2I 39 6 23 A9 9 01 90 9-01-f'10
Install 6 Disc.b 7-21 80 8-10-89 10-10-90 10 1090Remve - 7 1 190 9090Install 7 9-26-90 12-12-91 -Renoe -- 29 92 9-02 92Install 9-28-2 2-4-93
Install Qi 5-25-84 6-5-84 6 1984 8-1 1 84 - -Remrn- 5-23-89 6-26-K9 6-23-89 6-23-89
install Si Disv.b Dise.b 7-21-89 8-10-89Remove 9 15-89 1201 9Install - 1-08-90 6-29-90
PreexposedStone
Install 1 6-00-88 6-10 88 6-08 83 -01-88 6 014"*Remove 5-23 9 6 23 89 G 23-87 9-01-90 9-01 -90
Install t)isc.h' 7 21 89 8 108W9 :V 10-90 Wt. 1-90Remove 2 7-1 1 -90 8-30-90
Install -9 26-90 12 12.iRemove 3 6 29 92 0-02-92
Install - 9 28-92 2 0 914
"Annuul cr nultI y-ar expusurr Iwrtxd desi aticun.hrnwnnllnuecd
3
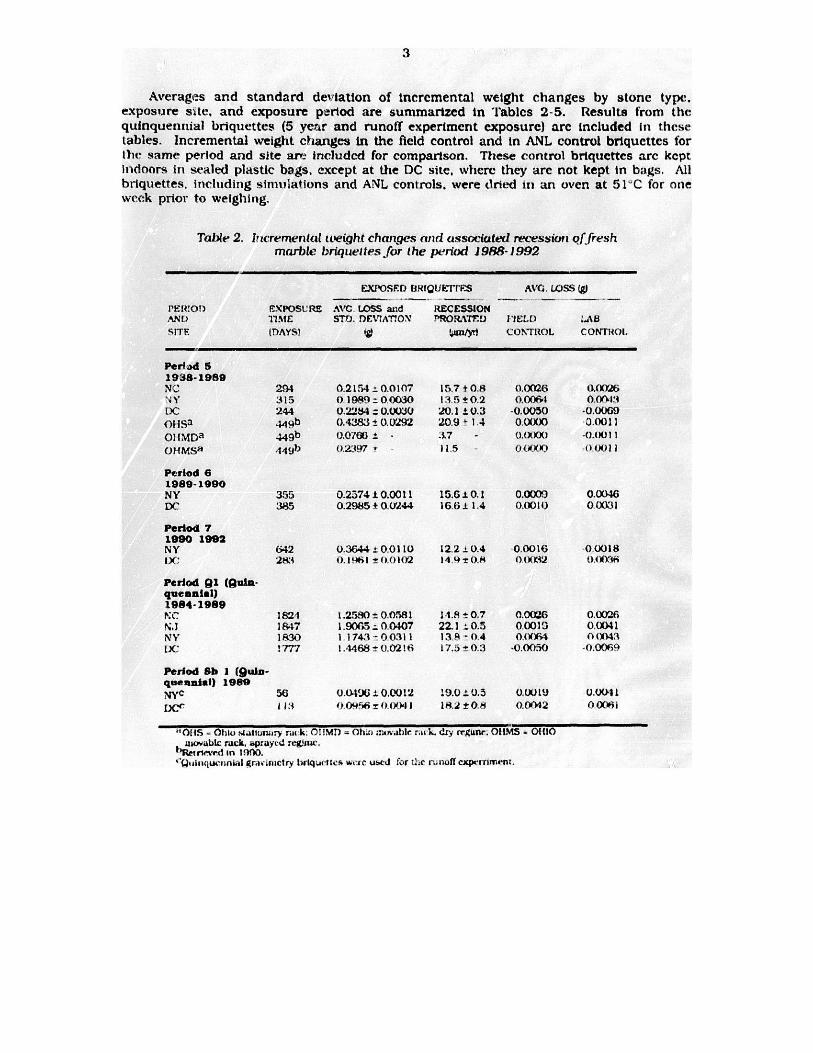
Averages and standard deviation of incremental weight changes by stone type.exposure site. and exposure period are summarized in Tables 2-5. Results from thequinquennial briquettes (5 year and runoff experiment exposure) arc included in thesetables. Incremental weight changes in the field control and in ANL control briquettes forthe same period and site ar, included for comparison. These control briquettes arc keptindoors in sealed plastic bags. except at the DC site, where they are not kept in bags. Allbriquettes. including simulations and ANL controls. were dried in an oven at 51"C for oneweek prior to weighing.
Table 2. 1rtcrernen al tteight changes and associate& recessiont of freshmarble briquettes for the period 1988-1992
EXPOSE) (IR!QU1T:ReS AVG. 1OSS gj
PERIOD EXPOSURE AVC. LOSS and RECESSIONANt TIME STD. DOEIAT'ON PRORATrU I'E) LASITE IAYS) Imn/yt CONTROL CONTROL.
Peread 51938-1989N C 24 0.2154 .0.0107 15.7 t 0.8 0.0026 0.0026
''315 0 19851: 0.0030 13.5 +0.2 0.0064 0.("13DC 244 0.22,4: 0.= o. 20.1 0.3 -0.0050 -0.0069
oHS3 444b 0.4283 0.W292 20.9 - 1.4 0.0000 0.0011OIIMDa 449 b 0.076G _ - 3.7 - 0.XXI -0AI0 11
OHMSa .44 9 1) 0.2397 11.5 00 %1) 00011
Period 61989-1990NY 355 0.2574 10.0011 15.6.0.1 0.0000 0.0046DC 385 0.2985 0f.244 16.6 . 1.4 0.0010 00031
Period 71990 1992NY 642 0.3G44 . 0.0 110 12.2 -0.4 0.0016 0.0018IN: 283 I).1 'i l 0.012 14 4 T 0.8 0 4X32 o.o(I
Period Q1 (guin-quennial)1984-1989KC 1821 1.2580 0.0581 1.8 e 0.7 0.0026 0.0026N.J 1847 1.90G5:.0407 22.1 .0.5 00010 00041NY A830 1 1743 - 00311 13 - 0.4 O)WW 4(043
DC !777 I1.4468 t .02!t 17.5 - 0.3 -0.0650 -(.0069
Period Sb I (gun-quennial) 1989NYc 56 0.04 .Mi 0.0012 19.0 0.5 0.0019 0.004I1Dc 1 13 0456 0 N$)4 1 18.2 0.8 0.0042 0 001i
"Of IS - Ohio mIattcgry ru k. 0 MD - h.u .:uvabi rt. l. dry rrgunr. OHiMS - 01110uaoabkc r.ck. bprayed retu2ac.
hiRetrimed r 1900.'*Qiuiqeiniad qra: iretry briquettes wcrr used .or thec ruff expemmiren.
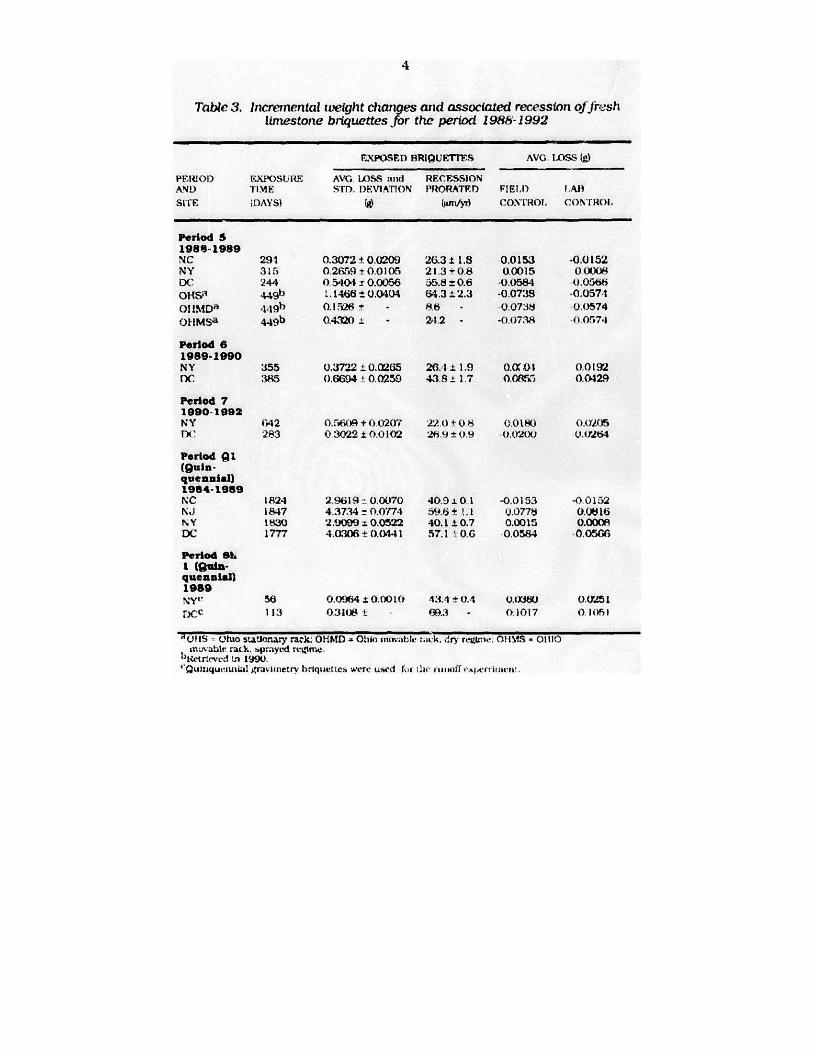
4
Table 3. Incremental weight changes anid associated recession oJfresihlimestone briquettes for the period 1988-1992
EXPOSED RRIQUETTES AVG. LOSS (g)
PFRJOD EXPOSURE AVG I.DS and RECESSIONAND TIME ST. DEVATION PRORATrD FIELD I.AB
SITE DAYS) (g) turn/yr CONTROL CONTROL,
2913152444 4 gb
44.-b
0.30721 0.02090.2659 t 0.01050 5404 s 0.0056.. 1466 0.0404
0..152f + -
0.4,320-, -
Period S1988-1989NCNYDCOHSII0! !MDaO1IMSa
Period 61989-1990NYDC
Period 71990-1992NYDC
Period Q1(QuiD-quennial)1984-1989NCN.JNYDC
Period SL1 (Quin-quennial)1989NYrr)cC
26.31 1.821.3 - 0.855.8 : 0.6(4.3 i2.3
24.2 -
0.01530.0015
-0.0584
-0.07380.07321
-.0,738
20.-111.9 0.C(/Ij43.9 1.7 0.05 5
220 +08 0.01w)2. t.9 0.0200
40.9.t 0 1:i. . .40.1 10.757.1 0.G
-0.0153u.077t30.00150.0584
413..1 0.4 .03' w
C .3 - 01017
355 0.3722 ! 0.0265385 0.6694 1 0.0250
642 0.56 +t 011207283 0 3022 10.0102
1824 2.9619 : 0.00701847 4.3734 - 0.07741830 2.9099 0.05221777 4.0306 0.0441
56 0.0964 t 0.0010113 0:3109 L
-0.01520 (X*48o.05ti-0.057.10.057440574
0.01920.429
O.W205VA024
-00152O.0160.00090.0516G
0.CY2510 1orI
UIS - Ohio stationary rack: OHMD . Ohio miumwvzi :.wk. dry rtame. 01MIS - 01110
betr:"teved tn 1990.4
QuIlaqu miuilal gravLInetrv hrigqitts were utied lur 1!w ruuioff velic is:irn'.
5
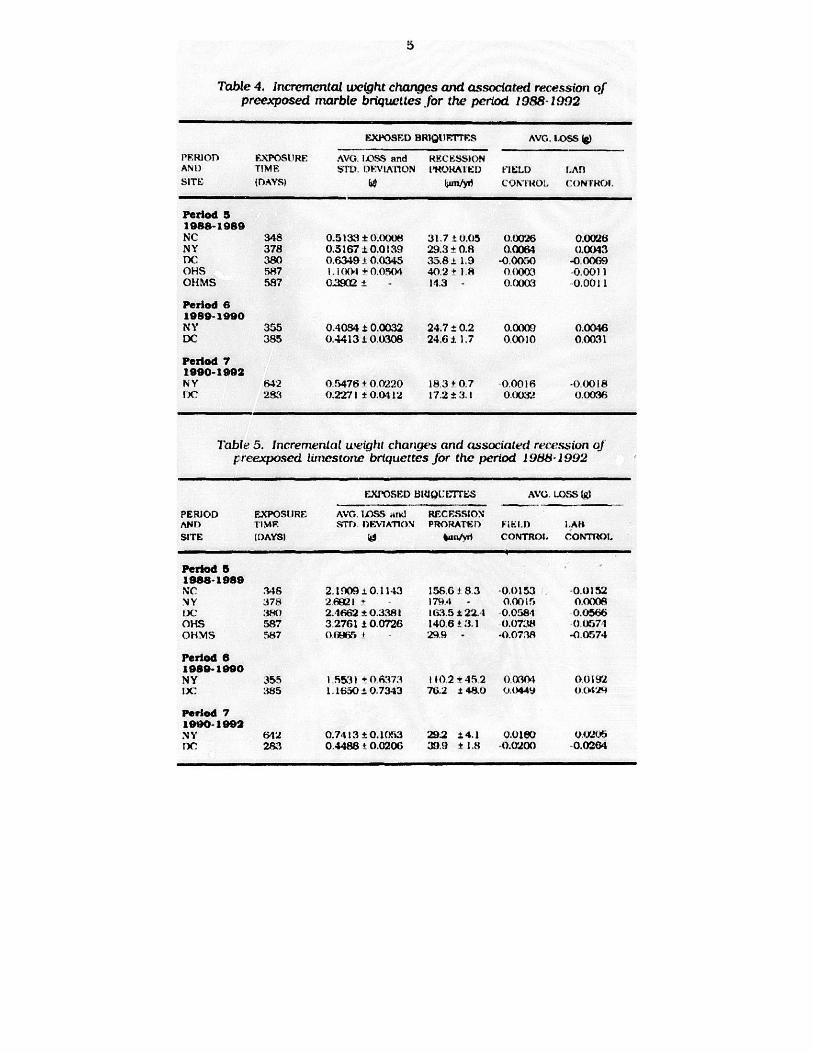
Table 4. Incremental weight changes and associated recession ofpreexposed marble briquettes for the period 1988-1992
EXPOSED BR1Q91F1TTES AVG. LOSS (g)
PERIOD EXPOSIIRE AVG. IA)SS and RKC SSIONAND T!ME :TU. I.WVIAtLON Il4.OA 1EU 1-'IELD LAniSITE (DAYS) W In/yI t C9NTHOL CON HOI.
Period 51988-1989NC 348 0.5133 t 0.0008 31.7 t 0.05 0.X26 0.0026NY 378 0.516710.0139 29.3 0.8 0.0004 0.0043DC 380 0.63491 0.0345 35.8.i 1.9 -0.0050 -0.0069OHS 587 I.1(0I + 0.05(4 40.218 0 000 -0.0011OH MS 587 0.3902 - 14.3 - 0.0003 0.0011
Period 61989-1990NY 355 0.408410.0032 24.7 0.2 0.000 0.0046DC 385 0.44131 0.0308 24.61 1.7 0.0010 0.0031
Period 71990-1992NY 642 0.''476 ; 0 0220 18.3+0.7 0.0016 -0.00181 283 0.2271 t 0.04 12 17.2 w 3.1 0.('03: 0.0036
Table 5. Incrermenlal weight changes and associated recession ofpreexposed UImestone briquettes Jor the period 1988-1992
EXPOSED 8RiQLE'tTES AVG. LOSS g)
PERIOD EXPOSURE AVO. Loss and RECRSSIONANr) TIM. STr) DEVIATION PRORATED iEl.D IAHSITE DAYSI is ran/y CONTROL. CONTROL
Period 51988-1989tC 34 2.1009 . 0.1143 15.G 8.3 -0.0153 -0.01 %2NY 378 262I - - 179.4 - 0.001i 0.000fi :3t 0 2.4662 0.3381 163.5122.4 0.0584 0.0566OHS 587 3.2761 10.0726 140.6 3.1 0.0738 0.0571OHMS 587 ()f*#Wr - 24.4 - -0.0738 -0.0574
Period 61989-1990NY 355 1 5531 + 0 A373 1102 t45 2 U.O(xn 0.0192IX: 385 1.1650 . 0.7343 76.2 48.0 0.0449 04 (,24
Period 71990-1992NY 642 0.74113 0.1053 292 14.1 0.0180 0.f205DC 283 0.4488 ( 0.0206 39.9 t 1.8 .0200 -0.0264
6
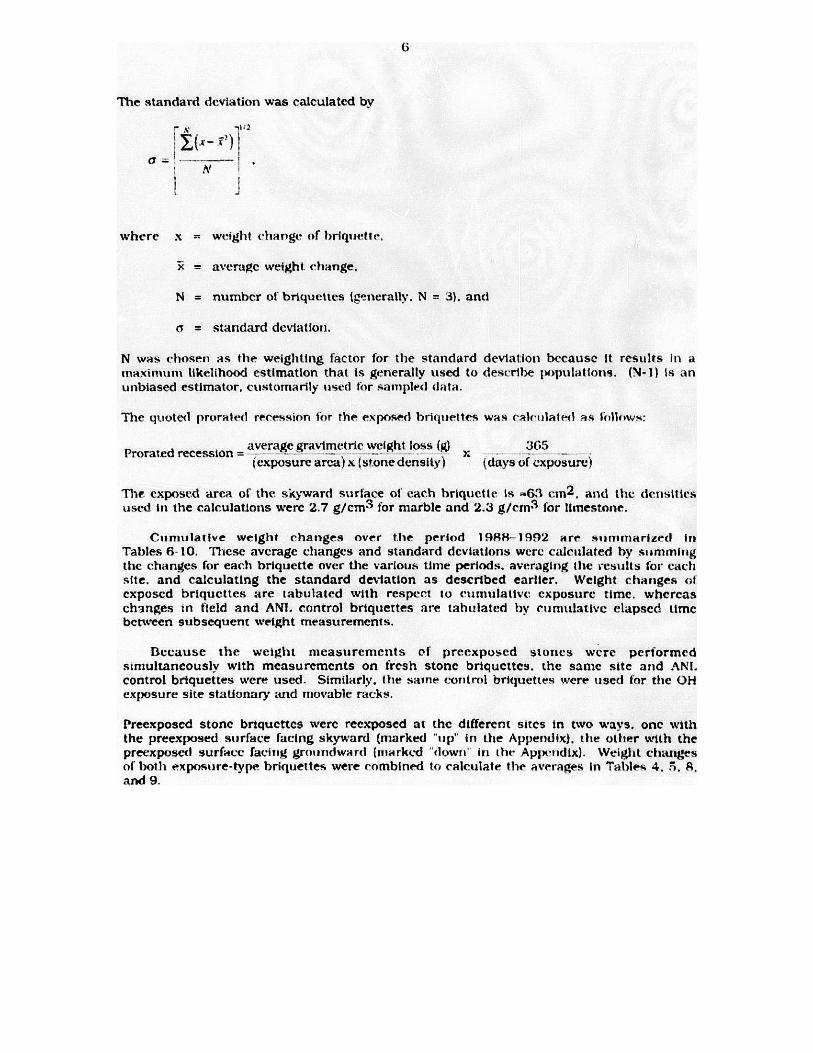
The standard deviation was calculated by
i - N
where x = weight change of briquetle,
x - average weight. change.
N = number of briquettes (generally. N = 3), and
a = standard deviation.
N was chosen as the weighting factor for the standard deviation because it results in amaximum likelihood estimation that is generally used to describe lwpulations. (N-1) is anunbiased estimator, customarily used for sampled data.
The quoted prorated recession for the exposed bricuettes was calculated as idlsows:
average gravimetric weight loss (g) 3G5Prorated recession = - - -X --
(exposure area) x stone density) (days of exposure)
The exposed area of the skyward surface of each hriquetie is =.63 cm2 . and the densitiesused in the calculations were 2.7 g/cm3 for marble and 2.3 g/crn3 for limestone.
Cumulative weight changes over the period 1988-1992 are summarized inTables 6-10. These average changes and standard deviations were calculated by summingthe changes for each briquette over the various time periods. averaging the results for cactisite. and calculating the standard deviation as described earlier. Weight changes ofexposed briquettes are tabulated with respect to cumulative exposure time, whereasch-nges in field and AN1. control briquettes are tabulated by cumulative elapsed timebetween subsequent weight measurements.
Because the weight measurements of preexposed stones were performedsimultaneously with measurements on fresh stone briquettes. the same site and AN!.control briquettes were used- Similarly, the same control briquettes were used for the OHexposure site stationary and movable racks.
Preexposcd stone briquettes were reexposed at the different sites in two ways. one withthe preexposed surface facing skyward (marked "tip" in the Appendix). the other with thepreexposed surface facing grouindward (marked "down' in the Appendix). Weight changesof both exposure-type briquettes were combined to calculate the averages in Tables 4. 5. R.and 9.
7
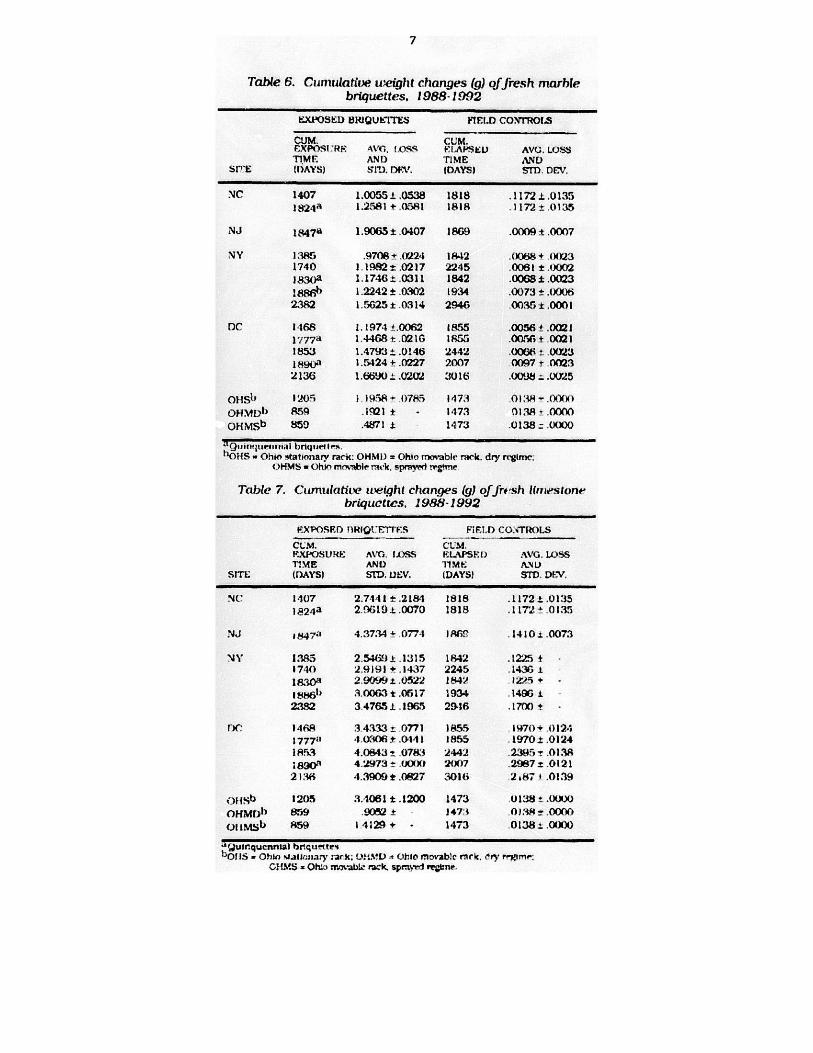
Table 6. Cl1dative weight changes (g) of fresh marblebriquettes. 1988-1992
EXAOSEU) owqu1erES E.D COROlS
CuM. CUM.FXPOS R1' AVGI. OS(I FIAPSEL AV(;. LUS
TIMr AN!D TIME ANDSI'E tAYS) STt3. DIV. DAYS) STD. DEV.
NC 1407 1.0055 .0538 1818 .11721.01351 24a 1.2581 + .0581 1818 .1172 .0135
NJ 1847 a 1.9065 t.0407 1869 .0009 .0007
NY 385 .9708 - .0224 1842 .0068 + 2)231740 1.1992:.0217 2245 .0061 t .0002
A3(0a 1.1746 .0311 1842 .00681.00231886hl 1.2242 .0302 1934 .0073 .0(x)2.32 1.5625 .0314 2946 .0035 .0001
DC 11168 1.1974 .0062 1855 .0056 .002117 774 1.4468 t .021G 1855 .00. + 00211853 1.4793!..0146 2442 .0001i .023
189 0 a 1.5424 .0227 2007 0097t 00232136 1.6600 _ .0272 3016 .Yj .:.0025
oisb 1205 i 1458- 0785 1473 0138 .0001
OHM1)b R5q .19#21 1 - 1473 0138 ' .0000
OHMSb 859 .4871 1473 .0138 : .0000
" uitrnmi briquellt'sh10HS - Ohio atationary rack: OHMD = Ohio moabIe rack. dry rtgimc:
OHMS : Ohio mmnble mk. sprwa.et rvtme
Table 7. Cumulatite wetqht changes (g) offresh rniestonebriquettes. 1988-1992
FXPOSFD ORIQI ETTF.S FitF1D CONTROLS
CLM. CU M.F-XPOSURE AVG. WOSS ELAPS1 F AVG. LOSSTIME AND '11MI AN)
SITE (DAYS) SM. UEV. (DAYS) Sf0. DE-V.
NC 1407 2.7141 t.218- 1818 .1172 .01:3518 2 4 a 2.9GI9 .0070 1818 .172+.0135
NJ a847;' 4.3734 4 0774 13r .1410 s .0073
NY 1.5 2.5469 .1315 1842 .1225 +1714) 2.9191 + .1437 2245 .143 .
a30a 2.90999 0522 l84' :.5+-
g Ht61 3.0063 t .0,17 1934 .1496 123.32 3.4765 .1965 2916 .1700 -
rxC 1463 3 433.3 0771 1A55 1470+ .012417771 4.0306 t .044 1855 .1970.01241853 4.0843 - .0783 2442 .2395- .0138
;890" 4.273 .0(11(4 2007 .2987 = .01212136 4.3909 t .0827 3016 2187 1 .0139
OF1 b 1205 3.1061 t .1200 1473 .0138 .xxx)0
OHMDb1 859 .9052 ! 1473 01:*I - .0000
(itIMSb 859 1 4129 + - 1473 0138.i.a.XXX
Aguir.qucnntal brquettes13115- Ohio .uaiosnary rark; .M.V (JhIo movab!c rinrk. &ry r.vm,:
CHMS = Ohio uimabi. rack. sprnyd reone.
8
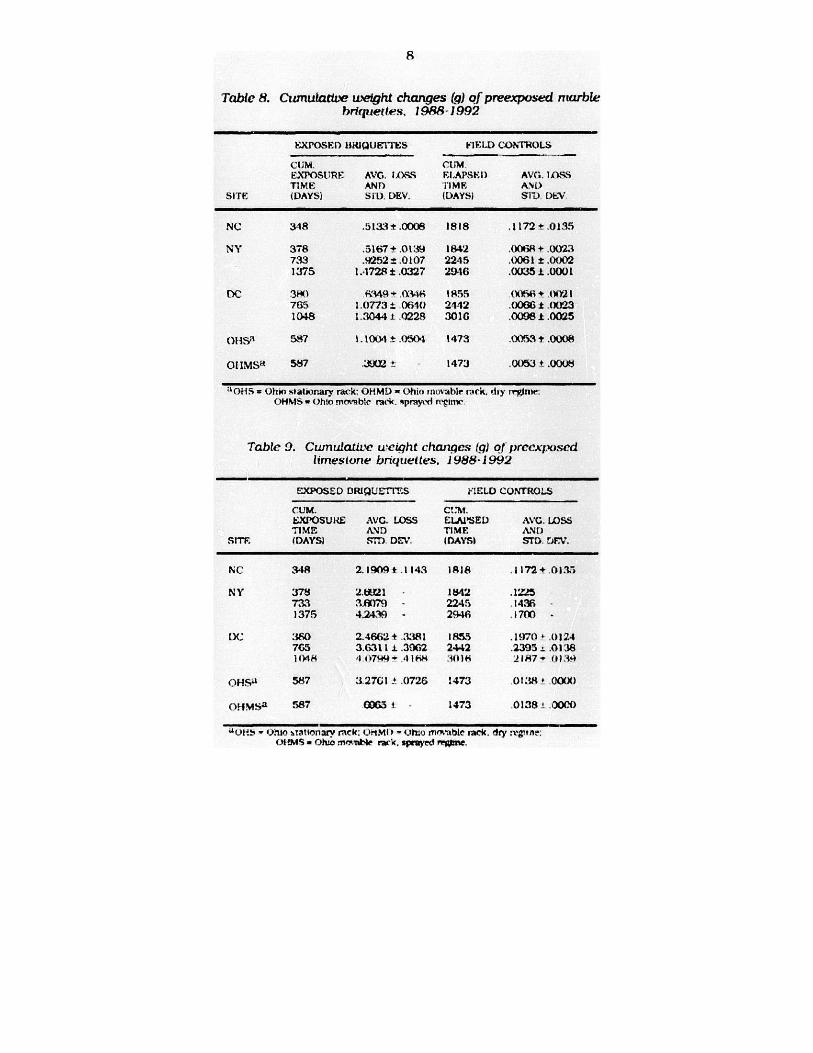
Table 8. Cumuattz weight changes (g) of preexposed marblebriquettes. 1988-1992
EXPOSED HRIQUET'ES FHELD CONTROLS
CUM. CUMEXPOSURE AVG. 108 EI.APSE!) AVG. ILMSTIME AND TIME AND
SITE WAYS) 51). DEV. (DAYS) S1'D DE.V
NC 348 .5133 .0008 1818 .1172 .0135
NY 378 .5167+.0139 1842 .006 +.0023733 .W,52 = .0107 2245 .0061 r .00021375 1.-1728 1 .0327 2946 .0035 L .0001
DC 3140 tii9 -. M46 1955 (W66 + .Y1) 1765 1.0773 1 0610 2-142 .0066 .t .)023
1048 1.3044..0228 3016 .008 .0025
OS 587 1.1004 .(5S4 1473 .(K 3 t .0008
OIMSa 587 .3002 t 1473 . t(53 .0M"
"OH S = Ohio ateimnany rack: OHMD = (hjif movablr rack. dhy r.mne:OHMS ohto mm'bc raek. aprayei regititm
Table 9. Cumulative eight changes 1g) of preex;.puscdlimestone briquettes. 1988-1992
EXPOSED DRIQUETFS F!ELD CONTROLS
CUM. Ct.'M.EXPOSURE AVC. LOSS ELAPSED AVG. LOSSTiME AN D TIME AND
SITE (DAYS) SM. DEV. DAYSI STD. DFV.
NC 34 2.14(. t .1143 1818 .1172 + 0135
NY 378 2.1J21 1842 .1195733 3.6079 - 2245 .14.61375 4.24'0 - 2946 .1700 -
x' 380 2.4662+ .3381 I855 .1970 + .0124765 3.6311 i .362 2442 .2395-: .0138il1m4 4 074+ . 1188 .301W 2IM7 + 0134
OHSU 587 3.2761 ! .0726 !473 0138* 000)
ow MSa 587 0065 1473 0138! .0000
"O1+ - lrutio %Tattonarv rack: UrtMi - jhto mtbie tack. dry xgn?:.OHMS " Oho rntime rack. sprayed "vAe.
9
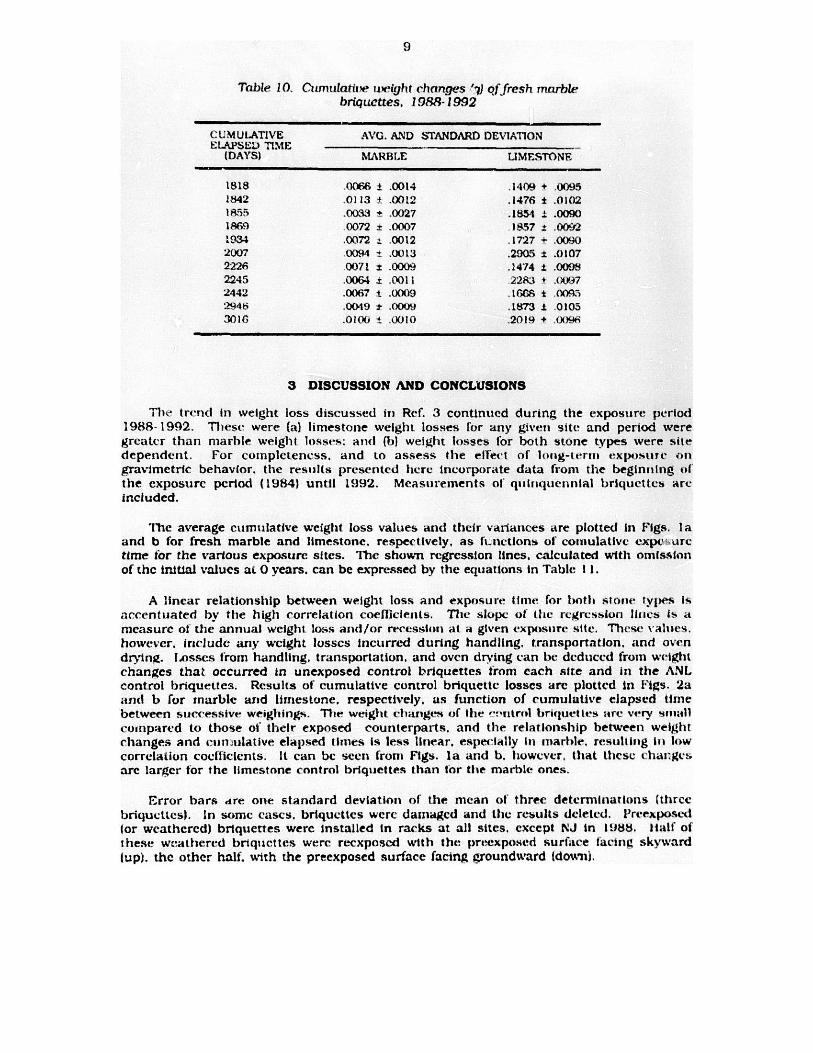
Table 10. Cumularive tight changes 'I) qf fresh marblebriquettes. I 988-1992
CUMULATIVE AVG. AND STANDARD DEVIATIONELAPSE) TIME
(DAYS) MARBLE UMESTONW
1818 0066 .0014 .1409 + .00951842 .0113 3 .0012 .1476 t .01021.0033 + .0027 .1854 s .0090169 0072 .0007 1857 .00921934 .0072 . .0012 .1727 + .00902007 .0094 t .0013 .2905 .0107
2226 0071 .0009 .1474 .000982245 .0064 1 .0011 223 + .00972442 .00(67 t .0009 .1GGr t .009294+ .0049 t .000 .1873 .01053016 .0100 t .0010 .2019 + .+ ox
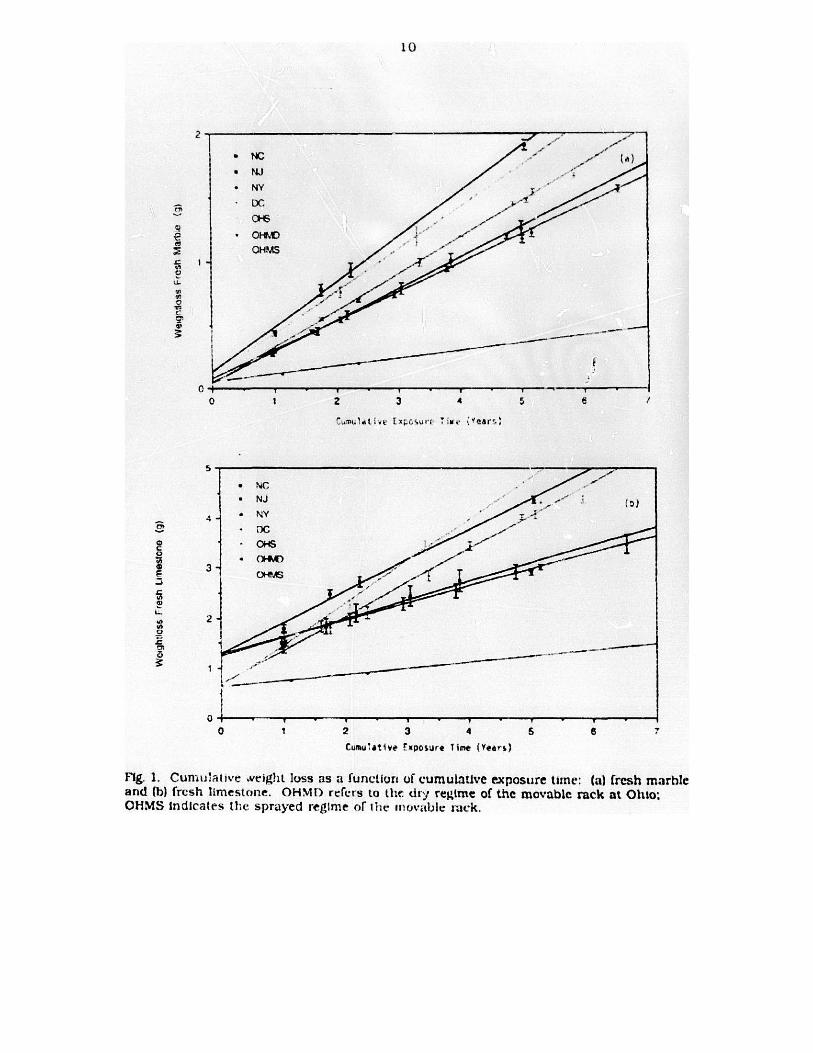
3 DISCUSSION AND CONCLUSIONS
The trend in weight loss discussed in Ref. 3 continued during the exposure period1988-1992. These were (a) limestone weight losses for any givent site and period weregreater than marble weight losses: and (I) weight losses for both stone types were sitedependent. For completeness, and to assess the etfect of loig-term exposure Ofngravimetric behavior, the results presented here incorporate data from the beginning ofthe exposure period (1984) until 1992. Measurements of quinrquennial briquettes areincluded.
'iMe average cumulative weight loss values and their variances are plotted in Figs. laand b for fresh marble and limestone, respectively, as ft.tnctions of comiulative expC',aretime for the various exposure sites. The shown regression lines, calculated with omissionof the initial values aL 0 years. can be expressed by the equations in Table I 1.
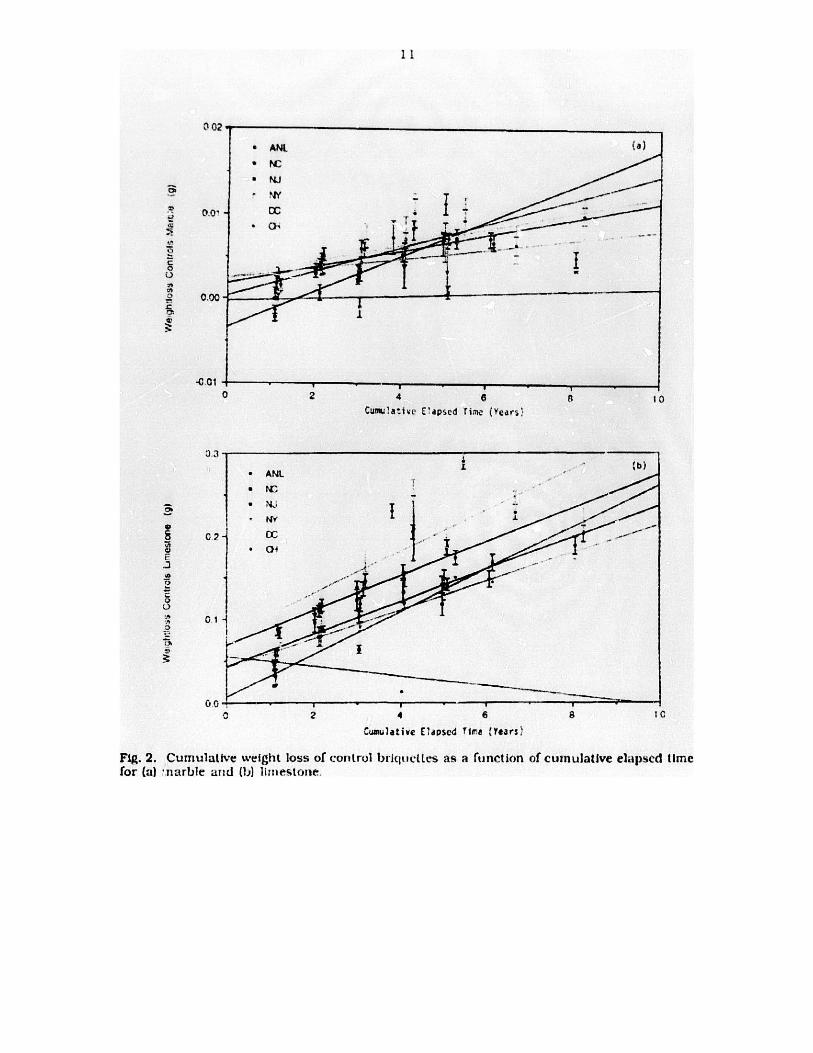
A linear relationship between weight loss and exposure time for hoth stone types isaccentuated by the high correlation coefficients. The slope of the regression 111es is ameasure of the annual weight loss and/or recession at a given exposlure site. These values.however, include any weight losses incurred during handling. transportation, and ovendrying. losses from handling, transportation, and oven drying can be deduced from weightchanges that occurred in unexposed control briquettes from each site and in the ANLcontrol briquettes. Results of cumulative control briquette losses are plotted in Figs. 2aand b for marble and limestone, respectively, as function of cumulative elapsed timebetween successive weighings. Thr weight changes of the -- enrol britluet tes are very smallcompared to those of their exposed counterparts. and the relationship between weightchanges and cun:ulative elapsed times is less linear, especIldly in marble, resulting it lowcorrelation coefficients. It can be seen from Figs. la and b. however. that these chat:gesare larger for the limestone control briquettes than for the marble ones.
Error bars are one standard deviation of the mean of three determinations (threebriquettes). In some cases. briquettes werc damaged and the results deleted. Preexposedfor weathered) briquettes were installed in racks at all sites, except NJ in 1188. hlalf ofthese weathered briquettes were recxposed with the preexposed surface facing skyward(up). the other half, with the preexposed surface facing groundward (down).
10
3,
2
NJ -U-
" NY
-DC
HM -
50 2 3 4
CufW ative exposure Time (Years)
6
Fig. 1. Cumuialive eight loss as a function of cumulative exposure time: (a) fresh marbleand (b) fresh limestone. OHMD refers to the dry regime of the movable rack at Ohio.OHMS indicates the sprayed regime of the novable rack.
4
s:
v
UMr,0
r.
CT
a
S
0
r0
1
Coe Excsri :r :ears
' NC
* NJ- NY
0 HS
OHMS
o 1 2 3 4 S E
1
r
I
{
I
0
11
;I
4 6
Cumulative Elapsed Tire ;Years'
C,-
G1
2
Fig. 2. Cumulative weight loss of cointrul briqItites as a function of cumulative eLapsed timefor (a) narble and (b) limestone.
R:
0
2
i
0.0
0.0
3,
0
U
* ANL -b
Dc-- 04
8 ICr. r.
" ANL (a)
* NJ
* ~rr
a - _
1 -
0 2 4 6 R tCumi a*iv' E apsed rime (Years,
4'0
0
12
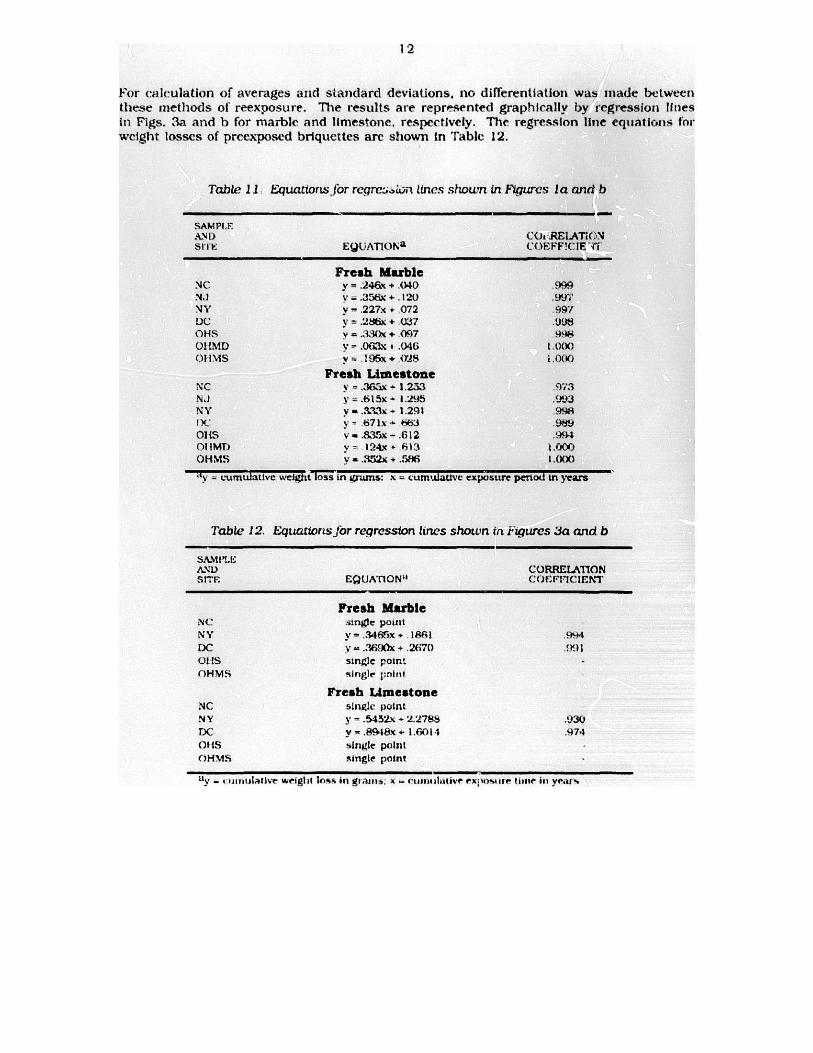
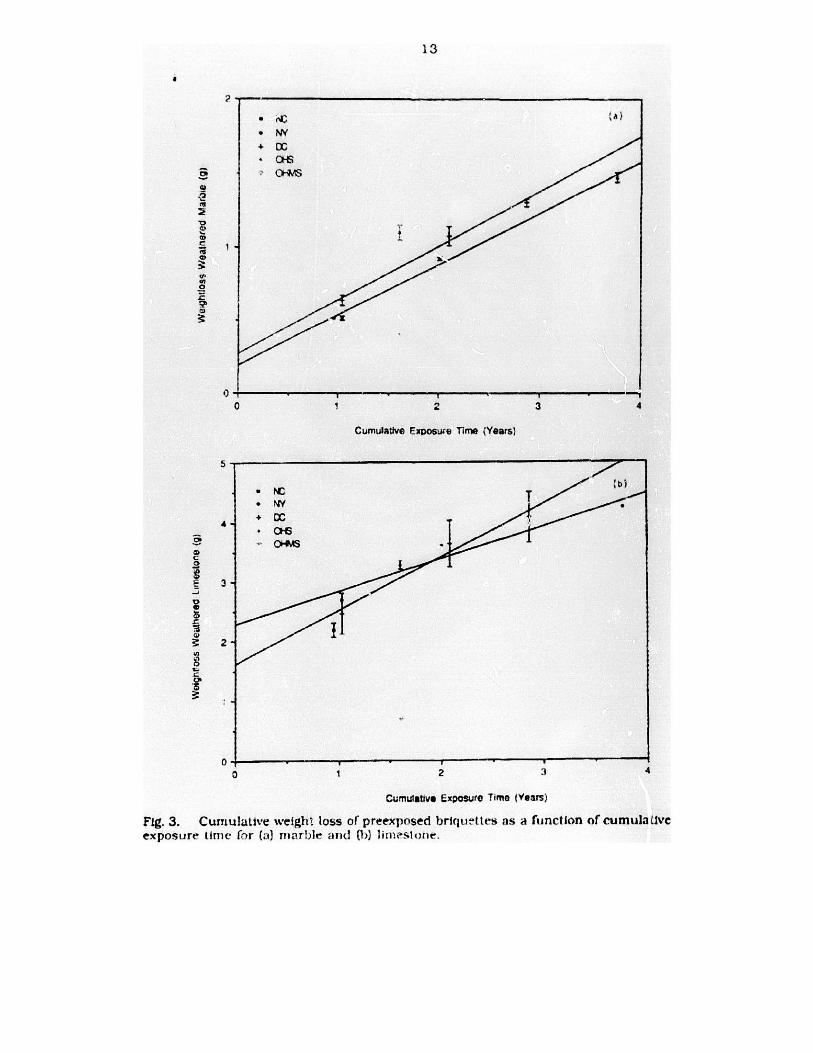
For calculation of averages and standard deviations, no differentiation was made betweenthese methods of reexoosure. The results are represented graphically by regression finesin Figs. 3a and h for marble and limestone. respectively. The regression line eqtiations. forweight losses of prccxposed briquettes are shown In 'rable 12.
Table 11 Equalorts jor rcgre, ion tines shown int Ftiures Ia and b
SAMPIFAN) CO, RELATIONSI E EQUATIONa COEFFPC IE'7i
NCNJNYDCOHSOINID01 IMS
Fresh Marbley = .246x + .cov-.356x + .120)y-.227x " 072y .286x + -W7v = .330x + O97
y *- .03 t .046
y = 195x + 02tFresh LAimestone
999.99.'997
t .0(X)i.000
NC =.,%Ix - 1.233 )'3N.J = .615x + 1.295 .'03N Y y ..33..x 1.2m1 99DC v. - 67 1x - h63 .9e9
OHS v " 833x - .612 .99401IMT) y - 124xr + F13 1.000OHVMS v .3X + .5m 1.(XX)
y = cuulative weight Toss in grums: x = cumulative exposure penor in years
Table 12. Equations for regression ines shown in i-qurcs 3a and b
SAM!'.EAND CORRELATIONs1TF EQUATION" C([IFICIENT
Fresh MarbleNC :ingle point
N Y y - .3466x - . 1861 994DC V _ .:69x + .2670 991QH!S single Point -OHMS single point
Fresh UrmestoneNC single pointN Y y - .5432x - 2.2784 .930DC y - .848x + 1.6114 .474
Ot IS single pointOHMS single point
"V - 4 iiirmuiative weight loss in g amin. ) 4iuimaauiive exposure timnle ill Vet%
13
a
'2
CD0_
0a'I
U,0
C)
4)
5
4
A0
m
C,7
o 2 3 4
Cumulative Exposure Time (Years)
I
3
2
00 2 3 *
Cumulative Exposure Time (Years)
Fig. 3. Currnulative weight loss of preexposed briquetles as a function of cumula llveexposure time fr (a) inarble and (b) liIiwstqne.
+ C
C
+ OC
I
1
14
At the two sites where more than one data point way ob tained for 1ireexposedbriquettes, a linear relationship between weight loss as function of exposure time is evidentfrom the high correlation coefficient. Delennination of any t rend in weight loss at the siteswhere only one measurement was available awaits additional data.
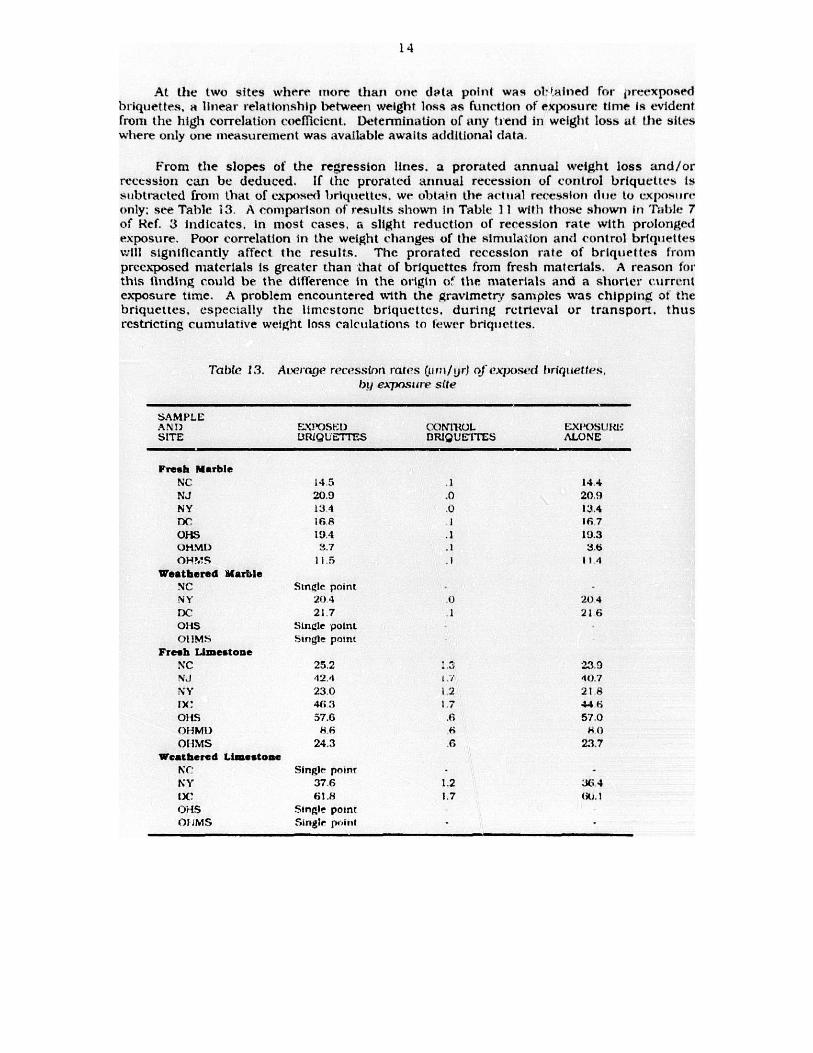
From the slopes of the regression lines, a prorated annual weight loss and/orrecession can be deduced. If the prorated annual recession of control briquettes issubtracted from that of exposed briquettce., we obtain the at hal recessioi dime to expos reonly: see Table M3. A comparison of results shown in Table 1 1 with those shown in Table 7of Ref. 3 indicates, in most cases, a slight reduction of recession rate with prolongedexposure. Poor correlation in the weight changes of the simiulaiion and control briquietteswill significantly affect the results. The prorated recession rate of briquettes frompreexposed materials is greater than that of briquettes from fresh materials. A reason forthis finding could be the difference in the origin o, the materials and a shorter currentexposure time. A problem encountered with the gravimetry samples was chipping of thebriquettes, especially the limestone briquettes. during retrieval or transport, thusrestricting cumulative weight loss calculations to tewer briquettes.
Table 13. Average recession rates (uttm / yr) of expose 'd briqu ettes,bij exTM).Su4re site
SAMPLEA N!) E.XPOStEI CONTROL Exi'()S~LRSITE DRIQUE:,1IES DRIQUETIES ALONE
Fresh MarbleNC 145 .1 14.4NJ 20.0 .0 20.9NY 134 .0 13.4Tx' 16A 1 167OHS 19.4 .1 19.3OMM) 3.7 .1 3.OHMS 11 .1 114
Weathered MarbleNC Single pointNY 20 4 .0 204DC 21.7 1 216OilS Single point.0 MS bingle point
Fresh LimestoneNC 25.2 .3 23.9NJ 42.4 1i 40.7
23.0 1 2 21 iIX' 46 3 1.7 44 6OilS 57.6 .6 57.0OHMi) S6 6 $0
OhIMS 24.3 .6 23.7Weathered Limestone
NC Single point -NY 37.6 1.2 X, 4DC 61.8 1.7 (A,.!OHS Single point
J JNMS Single peint
- -
15
Incomplete data, the result of instrument failure 4. 5 made it nec-essary to abandonefforts to correlate weight losses with amounts of precipitation during the exposureperiods. The same is arue for other atmospheric data, such as SO2 and H+ concentrations.We anticipate that all of the data will be available after the 10-year exposure period.
Holographic recessic' and roughness measurements were post ioned until the c'd ofthe 10-year exposure period because of budgetary restrictions. A comparison of the tworecession measurement methods will also be postponed until then.
The results obtained by graviinetry can be summarized as follows:
I. The linear trend of weight loss or recession as a function of exposure timecontinued over the period 1984-1992, with a high corrclati(n coefficient.
2. Prorated recession for marble, ranging from i1 to 21 pm/year, is halt the valuefor limestone, which ranged from 21 to 45 gm/year, and is dependent on exposure site.
3. Weight changes in simulation and control briquettes are very small and showpoor correlation. indicating effects of drying and ambient measurement conditions.
4. The smallest weight losscs/recession occurred at O!I in the movable rack, dryregime, indicating a strong Influence of the amount of rain.
5. A statistical evaluation of rain 4ciect could not be performed, because site datawere incomplete.
6. Weight losses of quinquennial briquettes correspond well with the cumulativelosses of annual briquettes.
Forthcoming gravimetry retstilts will allow assessment of recession over even longercumulative exposure tmes and comparison of the results with those from laserinterferometry measurements.
ACKNOWLEDGMENTS
It is a pleasure to acknowledge the valuable assistance and cooperation of many peoplein this investigation. In particular. the author thanks Susan 1. Sherwood of the NI'S ProjectOffice for her encouragement. support, and advice: and field site operators Curtis Moore(NC). Paul Fiechler (NJ). Ray Masters (NY). Ni'S personnel (DC). and Dan Zorbini (011) fortheir assistance in briquette installation. exchange. and removal.

143
REFERENCES
1. "Acid Rain Site Managemenit Plan for Dimension Stone," Vol. 2. National Park Servicecarid Argonne National Laboratory. Dec. 1988.
2. "WeIht Losses of Marble and Limestone Briqucttes Exposed to Outdoor Environmentsin the Eastern United States," C. A. Youngdahl, Argonne National Laboratory ReportANL-87-56 (1987).
3. "Weight Losses of Marble and Limestone Briquettes Exposed to Outdoor Environmentsin the Eastern United States," Results of Exposure 1984-1988, K. J. Reirn-ann.Argonne National Laboratory Report ANL 90/24 (1990).
4. S. 1). Cramer. private communication. U.S. Department of the Interior. Burean ofMines. zibanv. OR (1993).
5. D. A. Dolske. Illinois State Water Survey, Atimiosplicric Sciences Division. Champaign. IL(1995).
17
Appendix:
Weight Losses from Individual Briquettes(1988-1992)

is
19
Table A. 1. Weight changes (g) in expOsed cid contru. briquettes:
fresh stone. annuals, 1988 1989
EXPOSED BRIQUFT1Fl:s : FIELD CO.I NuS LAH CONTROLSSAMPLE FXPOS. - - - -
AND ILNIE. SAMPLE WE Irr SAMPLE WEIGHT SAMPLE WEIG-WSITE DAYS SLOT NO. CILANGE NO CIIANGE NO. CUiIJNGE
Marble:
M(' 294 2b3
207265
NY 315 263207265
DC 244 263207205
QIV 440 263207215
OHMLD)I.c 441
Limestone.
33
335
H14-17 0.22E4)G36-19 0.201V)G26-02 0.2 16S
G34i-Oh 0.()Y23 HI4-114
1136 21 0.0026 G36 23114-. 0.0030 C26-10
0.00440.1,010.0017
H14-15 0.2028 114-03 0.0047 1114-18 0 0039GLit-17 0. 1954 K36-20 -0.A053 636-23 0 0046026-22 0.1984 U36 07 0.019S G26--10 0.004.)
W : 1-10 0 865914U36- 22 0.2254G2- : 1 02313
G34 -21 0.405:K13-08 0.4675G22-17 m 7 ng
024 19 0.6706K14-14 0.2397
H36-22 -0.0040 H 14 18 0 0042K36-22 0.0049 G36-23 -0.00'4
G3G-08 0.0053 026 10 0.01()1
K 15 13 0.0003 111 1-I1M -0.0007G22-03 -0.0000 G36-23 0.(X)15
i34 12 0.0007 (20-10 -00011
NC 294 163107165
NY :ii 163107165
:C 244 1631071t h.
OHa 449 363107165
H(l7-0- 0.3191 H16 01 0,01h5 H. 1-15 -001418
11.4-22 0.277.4 GUll-06 0.0147 II1' 90 -0017)mGL7-(K9 0.3217 H114-2-1 -0.0146 GL7 03 -0.U 12 )
HU1S-22IL4-036L7-18
IIU5- 10IL4-14GL7-15
0.27150.25110.2750
0.53482.1679a0.5459
1 A 22 I.0$97111.2 12 1.1701GLG 15 1.1700
GUI-1211UG-24HU-18
GL7 04(L7 1 1114-15
0.001.0.2003'02945a
-0.0602-I.1)575
0 0575
In: I-15HIt.I 20(iL7-03
HU 1-15HC 1-2061.7-03
0.0007-A (XY200 00733O0036~" .0SW7
-0 0573-0 0537
H.:)-05 -0.0764 N 1 i5 -) ()5.' V11, 02 0.0616 H U I 20 ) 0.9?GL6 09 0.07h.) G07-03 0 0540
01 LMDc 449 334 ILS-06 0.15106OHMSc.d 449 320 11L2-19 0.4320 - -
Chippri satwNe.biiMU - Ohho site mut'bl'te imk - drv ret&lm".C rr-1 rt-e-1 i in t90.
dOH MS - Ohh) sitc mcwable rack +1rynr(e rrgim.
20
Table A.2. Weight changes (g) in exposed and control brqu-eies:fresh stone, annuals. .1989 1990 and 1990 1992
EXPiOSED DIIQUErs "ELI) CONTH. ? I Ab C0.T1HOLi
PKii>I). -nlME. SAMPEi WEIGHT SAMPLE: WEIGin' SAMPLE WEIGHTSrT DAYs SlOT NO. CIANGF NO. ClAN': NO CHANCE
Marble: Period 1989 - 1990
NY 355 263 1114-15 0.2550 114 03 0.00:2 H14 18 0.0042207 036-17 0.2585 K36-20 0.0018 G36 23 0.0050265 G26-22 0 2578 G36-07 0 004 I G26- I ) 0.0047
DXC 385 2632072G5
H 14 10 0.3316G3- 22 0.2735G2G-11 0.2903
H36-22 1.0008 HI'4-18 0.0tx)K30 22 0.0021 G36 23 0.0017G36-08 0 0002 G26-10 0.0067
Limestone: Nenod 1989 1990
NY 355 163107i65
rC 385 163107165
HUS-22 0.403 GU:-12 0.021: 11U1-15 0.0200IL4-03 0.3397 116-24 0.0345 HU' 2 ) 00203Gi.7-18 0.3724 iU:--18 0 0357 t o1.7 03 0 O il
HU-5-10 06498 ( 37-4 CI 6A7.A4 -19 0. 700 G1.7 1) 00441
GL7-15 1.6523 1; 1-lb 0.0.157
61-;1 -15S11 l iI 20;L7 03
4) 045A0 04240 0403
Marble: Per;d :990 - 1992
NY 642 263207265
7C 283 263207265
H i - i 0 377"GA'36- 1! 0.:1-.1()G26 22 0 ?(,(0
H 14-10 0 2090G36-22 0.1811G26- I 0.1.53
1114-13 I 025 H I 4- i -0.tA)25K36-20 -U.l,726 (3u-23 -0.00 1 1G36 07 0.0006 G26 10 0.0018
1136-22 0.0042 1114-18 0.0038K:U--22 0 0013 (3E-24 0 0034;G3t1 08 0.0041 G26 10 0.0034
LImestone: Period 1000 - 1992
NY 642 163107405
1(C 283 163107165
IIUS 22 0.8 3 7 : GU1 12 0.0264 11:1 1 0.022811.4-03 0.5402 1hU6 24 -0.0017 Il U 20 0.0195GL7-18 0.5815 1101-18 0.0293 GL7-03 0.0103
HLS 10 0.3022 c;L7 04 0.0184 HU t 15 0.1279114 19 0290 GL7 11 0.0207 11U 1 '20 002700L7-15 0.3110 IU4 15 0.0209 GL7 03 0.0243
1CIhIppeel sto1:e.
21
Table A.3. Weight changes (g) in exposed and control briquelles:
fresh stone, quinquennials, 1984-1989
P-XPOSRD IQUFTWS IF l.D CONTRO S LA B C RO1 SSAMPLE: EXPOS.AND TlME. SAMPLE WEIGHT SAMPLE WIGIfrl SAMPLE WEIGIfISI DAYS SLOT NO. CILANGE NO. CIVANGE NO. CILANGE
Mabie: Period 1984 1089
NC 2821 219 E26-23 37.8916"272 931108 1.1999245 136-21 1.3161
G:36 05113G-21114.01
0.0078 H14-1S 0.00470.0071 G36-23 0.00790.0070 GZG-10 0 0082
NJ 1847 219 A33-14 1.85:8 114-02 0.0000 H14 18 0.0064272 A33 22 1.9182 K36 18 0.0017 G36-23 0.0081245 136-01 1.9494 G36 06 0.0011 (26-10 0.0070
NY 1830 219 A33-15272 A33-06'.>45 1 h-06 >
1.1 441.2069I. 1326
114-03K3G-20G36-047
0.00910.0045o. 7,-Wa
H14-18036 23G26 10
O.009AU.01270 0114
DC 1777 219272245
A33-10 1.4587 1136-22 0.0083 1114 18 0( -f2A3:3-3 I .4652 K36-22 0.0051 036-23 0.0061136-10 1.4164 36-(8 0.0033 G2.G-10 0.0003
Limestone: Period 198-1 - 1981J
V'C 1S24 119i72145
N.) 1847 119172145
NY. 18:111 119172145
Dc 1777 119172145
IIUv-14 2.9589 IM6 01 0.1043 HUi-IG 0.14743I14-oi 2.'9716 ( G(1 --0 0.1359 H. 1 -20 O. 1274(L7 22 2.9552 HU4 24 0 1114 (1.7 03 #) 1478
HU.5 23 4 473. GU 1i-07 i.-i3io!A- 18 4.2852 HU6 14 0 1483
GL7 06 -1.3614 1113-04 0.1337
HUS-09IL4-I 1GL7-l9
2.15902.88912.9817
GC M--1211U6 241115-18
0.12250.3210"o. 3 4 5 6 u
1il-15H1 11-201GL7 (E3
HUt-15H U 1-20GL7-03
0.19410.173i0.1890
0.15420. 13320.1554
Mt15-21 ,.. J9M5 G.7-04 0.2017 11111-- I 0.19391L4-23 6.1143* 1.7-I 1 0.2092 1IIU1 20 U.1730GL7-14 4.0747 (114-15 0.1800 1:L7-03 0.1892
aChIpped sturie.
22
Table A.4. Weight c1.:unges (g) in exposed and control briquettes:fresh stone. quinquennials. 1989 runoff
EXPS"E URIgUETrES FIELD CONThOLS LAfB CO 0 (7HISSA-NU1'LL EXOS.
AND TIMF. SAMPLE WEIGHT SAMP(.F WF.GHT SAMii. WEIGHT";IK 1),%N.e SOT NO. CHANGE NO. (CHANE NO CHAN* A
Marble:
NY 56 219272245
DC '.13 210272245
Limestone:
NY 56 119172145
DC : 13 1! 9I 72145
A33-15 0.0.183 111-03 -0.0021 111.4--!SA33-06 0.0494 K36-20 0.0033 GW3-23136-06 0.0511 G36-07 0,0047 G2C",10
-0.00130.0043
-0.0036
A33 19 0.1013 1136 22 0.0044 !114--1t 0 0037A33-03 0.0J16 K36-22 0.0043 G36-23 0.0049138 10 0.0939 G36-08 0.003: G26 10 00096
HU5-09H.-11G;l7-9
.'U5-2411.1-230L7 14
0.09780.aJ:40 045~4
0.31080.y77a 0.8232
GUI-12HUG-24HI..5-18
(L7-04(1.7-1 II0.4-I S
0.0271
0.0343a0 0415'"
0.1038
0 '.07
i-15!IJ 1-2()G 1.7-03
tI1-15I-1 1 I .1
GL7 03
0.0260(1.0270O 02113
0.1 10fiCO 101.36
0.09: I
aChipped stone.
23
Table A.5. Weight changes (g) in exposed and control briquettes:preexposed stone. annuals. 1988-1989
rXPOSF. nRIQUE-1TES Fin'.L C0NTROIS 1.AR CONTROLSSAMPLE EXPOS. ---AND 'TME. SAMPI.F WEIG1rC SAIMILE %EGIlr SAMPLE WEIGHTSm. DAYS SLOT NO. CHANGE NO. CHANGE NO. CHANGE
Marble
NC 348 259 W22-05 Up 0.5140251 W22 01 On 0 5125
NY 378 259 W22-21 Up 0.5305251 W224)3 On 0.5028
DC 380 259 W22-23 1ip 0.6004251 W22-12 Dn 0.6693
0!! 587 258 W22 24 Up 1.0500251 W22-17 Dn 1.1507
O!IMS-' 587 312 W23-15 Lp 0.3902
Limeston-
NC 318 159 XW-06 Up 2.3051151 XWI-0 D n 2.0766
G36-05 0.0023 H14- IS 0.044H36 21 0.0026 Gr3b 23 0.0018i1 I-Cl 0.0030 G26 10 0.0017
1 14-03K36-20G36-07
0.0047 H 14- 18 0 00390.0053 c36-23 0.00460.0198 G26 10 0.0X)45
I136-22 -0.0049 1114-18 -0 0042K36-22 -0.0044 G36 23 -0 0064036 05 0.0053 G26. 10 0.0101
K15-13 0.0003 1114- 18 -0.0007G22-03 -0.0(X)9 G:36 23 0.0015634 12 0.007 GA 6-!0 -00011
1026-01 0.01611 MA 15 0.014801-06 00147 1W! 20 0.0178
HUL4-24 -0.014G GL7-03 -0.0129
NY 37, 1.)
151PW I S6 Up 2.6921XNV 1-04 Dn 3.1 146
DC 380 159 PW1-21 Up 2 8042151 W I-02 Dn 2.1281
01i 587 154 PW1 23 Up 3.3487151 PW 1-O1 Dn 3.2035
OH MSzI587 307 PWI-22 U p 0.6965
GL7-04 -0.002 1il1-15 -0.0587GL7 11 -0.0575 IIUi-20 -0.05731U4-15 0.0575 L;L7 03 u.0537
11L2 05 -0.0764ILA-02 -0 0G8661.6-09 0 4 ffis
IlU1-15 -0.0585HU I -20 -0.059801.7 1i -0 o54
.:)N 1S - (.idn site movable rack - sprayed reixe.blhlpped stone.
G(L1 1214116-241115 18
0.00150.2005"0.284151
Hill 111111 20GL7.03
0.00070.00200.0036
24
Table A.6. Weight changes (q) in exposed and control brquettes:preexposed stone, annuals. 1989 1990 and 1990-1992
P-\TOSED 11RIQUETIES FIELD CONM011S LAD CONTROLSSAMPLE EXPOS.PERIOD. TIME. SAMI'.F WEIGHT SAMPLE WTIGiTT SAMP.L. WEIGIrTSN'E DAYS SLOT NO. CHANGE NO. CHANGE NO. CHANGE
Maubie: Period 1989 - 1990
NY 259 2 9 W22-21 Up 0.4054251 W2203 Dn 0.4117"
DC 385 259 W22-23 Up 0.41 2 a251 W22-12 Dit 0.4721
Limestone: Period 1989 1990
NY 2i9 159 MyW- ifip 0-9156151 XW 1 04 Do 2.10311
DC 365 59 MV.-21 Ip 0.4307151 PW I-I2 Dri 1 99924
Marblc: Pc riod 1990 - :992
NY K42 259 W92-21 !'p ) 5696251 W22 43 Dn 0.5256
DC 283 259 W22-23 Up 0.283251 W22 12 Dn 0.1859
U1mentone: ]grind I 990 - 1992
NY 612 150 PWI 16Up 0.6360:51 XW1-04 Dn 0.8400
DC 283 39 PW 1 21 Up 0.4282151 IW I-02 1)o 0.4694
114-03K36 20G36-07
-0.0032
0.00180.0041
H 14-18G36 23026 10
-0.0042
0.0050-0.0047
H36-22 0.0008 H 14-18 0.0000K36-22 0.0021 036-23 0.0017C3t-08 0.0002 G26-10 1.0067
4*ll--12
I UG 24I :Uj 1S
002110 03450.0357
Hiii - 9IIU! 20GL7-03
002490.02030.0163
G1.7 04 0 . 16 6 7 b 11111 15 0 0456Gi 7 i1 00441 H11 20 0.042)!U4 15 0.0457 CL7 03 0.0403
1 1 d 03K36-20G36-07
0 00050.0028
11i4 li,G36-23026-10
6 (A 2b-U W 1 1-0 06 16
N36 22 0.0042 H14- 18 0.0038K30 22 0.0013 C30 23 0.0036G3G-08 0.0041 02G- 10 0.0034
GUI-12 0.0261 HU1-15 0.0228IUG-24 -0.0017 lu 1-20 0.0195
H US-IS 0.0293 G1.7-03 0 0193
GL7-0.1 -0.0184 HUI-I) 0.0279GL7 1 ! 0 0207 H 1 20 0.02703114--15 -0.020' (.1.7-03 -0 024:1
'Exposed upside down.1iChipped stone.

25
Distribution for ANL-95/22
int rn aIH. Dr''cker R. B. Poeppel C. E. TillP. Hess A. C. Raptis R. A. ValentinC. A. Malefyt K. J. Reimann (71 M. WeselyS. A. Moll J. Shannon TIS Files
D. Streets
DOE/OSTI. for distribution per UC-400 (25.ANL Libraries
ANL-EANL-W
DOE-Chicago Field Office:ManagerD. T. GoldmanF. f erbatyA. L. Taboas
Energy Technology Division Review Committee:H. K. Birnbaum. University of Illinois. UrbanaR. C. Buchanan. University of Cincinnati. Cincinnati. OHS. -N. Liu. Fremont. CAH. S. Rosenbaum. Fremont. CAR. K. Shah. University of Kentucky. LexingtonS. Smialowska. Ohio State University. ColumbusR. E. Smith. Altran Corp.. Huritersville. NJC
National Park Service:M. GilbergL. NelsonJ. RogersS. SherwoodM. Striegel (20)
United States Geological Survey:P. BaedeckerM. KingstonJ. MorganV. Mlossotti
R. PickeringM. ReddyE. SpikerE. McGee
Colorado School of Mines:D. Langmuir