Embed Size (px)
Citation preview
Retrospective Theses and Dissertations Iowa State University Capstones, Theses andDissertations
2008
Diversity, productivity, and stability in perennialpolycultures used for grain, forage, and biomassproductionValentín Daniel Picasso RissoIowa State University
Follow this and additional works at: https://lib.dr.iastate.edu/rtd
Part of the Agricultural Science Commons, Agronomy and Crop Sciences Commons, Ecologyand Evolutionary Biology Commons, and the Horticulture Commons
This Dissertation is brought to you for free and open access by the Iowa State University Capstones, Theses and Dissertations at Iowa State UniversityDigital Repository. It has been accepted for inclusion in Retrospective Theses and Dissertations by an authorized administrator of Iowa State UniversityDigital Repository. For more information, please contact [email protected].
Recommended CitationPicasso Risso, Valentín Daniel, "Diversity, productivity, and stability in perennial polycultures used for grain, forage, and biomassproduction" (2008). Retrospective Theses and Dissertations. 15849.https://lib.dr.iastate.edu/rtd/15849
Diversity, productivity, and stability in perennial polycultures
used for grain, forage, and biomass production
by
Valentín Daniel Picasso Risso
A dissertation submitted to the graduate faculty
in partial fulfillment of the requirements for the degree of
DOCTOR OF PHILOSOPHY
Major: Sustainable Agriculture
Program of Study Committee: E. Charles Brummer, Co-major Professor
Matt Liebman, Co-major Professor Philip Dixon Brian Wilsey
Kevin de Laplante
Iowa State University
Ames, Iowa
2008
Copyright ©Valentín Daniel Picasso Risso, 2008. All rights reserved
UMI Number: 3291999
32919992008
UMI MicroformCopyright
All rights reserved. This microform edition is protected against unauthorized copying under Title 17, United States Code.
ProQuest Information and Learning Company 300 North Zeeb Road
P.O. Box 1346 Ann Arbor, MI 48106-1346
by ProQuest Information and Learning Company.
ii
To Lucia,
Mati and Santi,
and all the children of this planet.
Ad Maiorem Dei Gloriam
Om Mani Padme Hum
iii
TABLE OF CONTENTS
ACKNOWLEDGEMENTS v
ABSTRACT ix
RESUMEN (ABSTRACT IN SPANISH) x
CHAPTER I. INTRODUCTION 1
CHAPTER II. HISTORY AND PHILOSOPHY OF THE BIODIVERSITY–
ECOSYSTEM FUNCTIONING DEBATE IN ECOLOGY 3 INTRODUCTION 3 BACKGROUND: THE DIVERSITY-STABILITY DEBATE 4
The 1950s and 1960s 5 The 1970s and 1980s 6 The 1990s 8 Diversity-stability relationships and environmental policy 9 Diversity-stability relationships and the holism-reductionism debate in ecology 10
BIODIVERSITY AND ECOSYSTEM FUNCTIONS: KEY CONCEPTS 11 Biodiversity 12 Ecosystem function 15
THE BIODIVERSITY-ECOSYSTEM FUNCTIONING DEBATE 25 The Program begins (early 1990s) 26 Critical response (late 1990s) 30 “War among ecologists” 31 Conciliation and synthesis 33
RECENT WORK IN BIODIVERSITY-ECOSYSTEM FUNCTIONING 35 Refining the mechanisms 35 Second generation biodiversity experiments 37 Balancing the synthesis 37 Quantitative synthesis 38 Other issues 39
DISCUSSION: INTERPRETATIONS OF THE BIODIVERSITY-ECOSYSTEM
FUNCTIONING DEBATE 40 Success or failure? 40 A new paradigm for ecology? 41 Ecology, agriculture, and Darwin’s legacy 41
CONCLUSION 44
CHAPTER III. CROP SPECIES DIVERSITY AFFECTS PRODUCTIVITY AND
WEED SUPPRESSION IN PERENNIAL HERBACEOUS POLYCULTURES UNDER
TWO MANAGEMENT STRATEGIES 46 ABSTRACT 46 INTRODUCTION 47
iv
MATERIALS AND METHODS 50 Experimental design 50 Data analysis 53
RESULTS 54 Effect of driver species on biomass of seeded species 56 Weed biomass 57 Functional composition effects on biomass of seeded species and weeds 58
DISCUSSION 59
CHAPTER IV. DIVERSITY AFFECTS PRODUCTIVITY OVER TIME THROUGH
COMPLEMENTARITY AND STABILITY IN PERENNIAL POLYCULTURES 73 ABSTRACT 73 INTRODUCTION 74 MATERIALS AND METHODS 75
Experimental design 75 Data analyses 78
RESULTS 81 Richness x year interaction 81 Overyielding and mechanisms 82 Stability analysis 83
DISCUSSION 83 Effect of richness over time 84 Complementarity and selection effects 84 Stability, productivity, and adaptation 86
CHAPTER V. SEED YIELD, FORAGE PRODUCTION, AND COMPETITIVE
ABILITY OF PERENNIAL CROPS IN POLYCULTURES 95 ABSTRACT 95 INTRODUCTION 96 MATERIALS AND METHODS 98
Experimental design 98 Statistical analyses 101
RESULTS AND DISCUSSION 102 Monocultures 102 Bundleflower – wheatgrass binary mixture 103 Polyculture performance 104 Weed suppression in polycultures 105 Seed yields of perennial grains 106 Promising perennial polycultures 107 Future research directions 108
CHAPTER VI. GENERAL CONCLUSIONS 114
REFERENCES 117
v
ACKNOWLEDGEMENTS
Starting and finishing this PhD program was possible because of the support of lots of
people. Now it is the time to thank each and every one of you. Trying to name all involves
the risk of forgetting those who were located in the neurons that I permanently burnt and lost
in this process. However, I will do my best.
First, I want to thank my PhD Program of Study Committee: E. Charles Brummer, Matt
Liebman, Philip Dixon, Brian Wilsey, and Kevin de Laplante. Thanks Charlie for being my
sensible mentor, reasonable boss, and good friend. Thanks for giving me the freedom to
pursue my own research and teaching interests while providing guidance when I needed it,
and showing me that an academic life can be enjoyable and fun. I hope we continue working
together in the summer of either hemisphere. Thanks Matt for being the ideal balance
between a hard core scientist focused on practical solutions for farming problems and a
passionate person fired up in the construction of a more just and sustainable world. Thanks
for your patience, advice, and friendship. “Keep up the good work.” Thanks Phil, the most
sensible priest in the religion of statistics, for providing timely and practical solutions to my
life threatening statistical questions, without making me feel guilty in the process and always
teaching me something new. It was always a blessing hearing your “OK!”. Thanks Brian, for
your practical advice on community ecology matters and helping me bridge the gap between
ecologists and agronomists. See you in the pampas of Uruguay some time soon. Thanks
Kevin, for broadening my perspective of the science of Ecology and opening the door to
understanding the philosophical debates within the human quest for sustainability. You
probed to be a person “de la planta”.
Several other Iowa State faculty members contributed to enrich to my PhD experience,
including Mary Wiedenhoeft, my Preparing Future Faculty mentor, Gretchen Zdorkowski,
Ricardo Salvador, Neal and Jan Flora, Jean-Luc Jannink, Lorna M. Butler, Tom Richards,
Clare Hinrichs, Whitney Sanford, John Miranowki, Richard Gladon, Kathleen Delate, Donna
Kienzler, Matt Helmers, Heidi Asbjornsen, Betty Wells, Clark Wolf, our grandparents Fred
Kirschenmann and John Pesek, and others in the Graduate Program in Sustainable
Agriculture. I am grateful for all I learned from you.
vi
Thanks also to my friends and colleagues from the international Brummer’s forage lab
gang: Julia Olmstead, Muhammet Sakiroglu, Xue-hui Lee, Babita Thapa, Fred Iutzi, Joe
Robins, Mindi W., Heathcliffe Riday, Baldomero Alarcón, and also our Jannink’s lab
cousins: Murli Gogula, Yoon-Soup So, Shengqiang Zhong, Dong Hong Pei, Alona
Chernyshova, Massiel Orellana, and Lucia Gutierrez, for sharing so many fun and boring
moments in the computer lab, the seed lab, and the field. It is over and we survived! I am
grateful also to my fellow students in the glorious Graduate Program in Sustainable
Agriculture, especially the 2003 cohort: Ann Finan, Cassi Johnson, Emily Newman, Karie
Wiltshire, Matt Haan, Mathew Muma, Enrique Ortiz, and the famous Andy Heggenstaller.
Also to Carlos Khatounian, Amy (the) Best, Sarah Carlson, Pete Lammers, Ryan Atwell,
Denis Reich, Mary Nyasimi, and many other future world leaders in the quest for a more
sustainable planet.
The vision and inspiration for this research came from The Land Institute think-tank.
Thanks to my friends: Wes and Joan Jackson, Jerry Glover, Cindy Cox, Lee DeHaan, David
van Tassel, Stan Cox, and all the Natural Systems Agriculture fellows and participants of the
Summer Workshops 2003-2006.
The Uruguay Fulbright Commission and the Institute for International Education at the
Rocky Mountains Office, provided encouragement and financial support to start this graduate
studies in the USA. Financial support for this research project came from the people of the
State of Iowa through their taxes, The Land Institute Natural Systems Agriculture Graduate
Fellowship, North Central Region – Sustainable Agriculture Research and Education (SARE)
Graduate Student Grant, the Raymond Baker Center for Plant Breeding at Iowa State
University, and the ISU Agronomy Department Endowment (thanks Kendall Lamkey!).
Thanks to Norman Mc Coy and his kind mother Miriam for opening the gates of their
farm to perennial polyculture alternatives and their kitchen for delicious meals, and to Rick
Exner for helping with the on farm research among other fun things. Jean-Luc Jannink, Jode
Edwards, Ken Moore, and Lucia Gutierrez provided advice on statistical issues throughout
the research project. David Correl and Miguel Carriquiry provided advice for the economic
comparisons of perennial cropping systems. Carol Williams helped with spatial
representation and analyses of the experiment. Thank you so much.
vii
Thanks to Mark Smith for all his help in the field, for taking great care of my
experimental plots, and teaching me all I will ever know about agricultural machinery and
safety. Mike Barker also helped during fieldwork. Several students, friends, and family
members helped with the most tedious parts of the research, including among other things
fieldwork in the hot Iowa summer days, weighing thousands of biomass samples bags, plant
species sorting and identification, and entering data in the computer: Alejandra, Andrea,
Marina, Alicia, Laly, Catalina, Lucia, David, Abraham, Esteban, Carlos, Facundo, Royce,
Feca, Ray, Jaime, and Alfred. Emma Flemmig processed hundreds of seed samples and I
think she learned her lesson.
My understanding of the biodiversity-ecosystem functioning research was enhanced by
the participants in the inter-institutional Agrobiodiversity and Ecosystem Services DGS
Seminar: Stacy Philpott and Kumar Mainali at Univ. of Toledo, Fabrice de Clerck, Carlos
Cerdan Cabrera, Astrid Luz Pulido, Beatriz Salgado, and Diego Tobar Lopez at CATIE,
Jacob Lowenstein at AMNH and Columbia, and Oliver Soong at UCSB.
My graduate student life was very much simplified by the excellent help of Jaci
Severson, whom “deserves a monument” as we say in Uruguay. Also thanks to the marvelous
Melissa Stolt, Charles Sauer, and Sue Sprong from the Agronomy Student Services Office.
Thanks to Mary Lents, Robbie Kerkove, and Jill Litwiller for their always smiling support.
Thanks to all the other people in the a-maize-ing Agronomy Department: the fun and
energetic custodial staff, the active main office, Rita Brueland and the awesome Baker Lab,
Debra Hop and Mary Davis, Brian Hill and the Soil and Plant Analysis Lab, Trish Patrick
and the Forage Quality Lab, George Patrick, and Al Vogl. Also a million thanks to Deb
Vance and the International Students and Scholars Office at ISU.
This PhD experience involved learning about international issues in sustainable
agriculture from students and faculty in various “Study abroad” courses to Uruguay. Thanks
to Shelley Taylor, David Acker, the Agriculture Study Abroad Office staff, Marta Chiappe,
Mario Costa, Lucia Salvo, and all the people in Uruguay who made these courses possible.
Thanks to Charlie, Gretchen, and Neal for co-teaching these courses. Thanks also to all the
students who participated in these courses and the internships which followed up.
viii
This is the last stage in my formal education (I promise!), which started almost 30 years
ago. I want to acknowledge all my previous educators from Uruguay who guided me
throughout this long learning path: Mercedes Cereijo and all my kindergarten teachers,
Mercedes, Ma. Del Carmen, Susana, Graciela, Norma, Clara, and all my elementary school
teachers, Alejandro Villamil and all my high school teachers, Julio César Fernández S.J. and
all the excellent Jesuits, and finally Tabaré Abadie, Carlos Paolino, Jorge Franco, Artigas
Durán, Raquel Pérez, Jorge Monza, and all my other undergraduate professors in the College
of Agriculture, University of the Republic of Uruguay. Also thanks to my English teachers at
the school and the ANGLO-Uruguay.
During these five-and-a-half years there were many happy and difficult moments in
Ames, and many friends to share them all. Thanks to Laly, Alicia and Mario, Gretchen and
Todd, John, Gabriel, Alejandra and Jajo, Andrea and Maro, Julia and Philip, Ann and
Christopher, Sarah, Louis and family, Mónica and Pablo, Facundo and Natalia, Esteban and
Mónica, Marina y Pedro, Raúl, Mariana and Oscar, Andrés and Gaby, Karina and Francisco,
Fede y Mariana, Peti-Lu, Mario and Lula, and all my MATES friends. Special thanks also to
all my KINDERMATES friends who encourage me not to give up and “just go on”: Jacinto,
Nacho, Mati, Sofi, Naidi, Alexa, Zoe, and Brodie.
I am very fortunate to have a very supportive family who was always present in many
ways and opportunities during this time in the USA. Thanks to my parents Serrana and
Daniel for their unconditional love, dedication, and encouragement to keep studying. Thanks
to my siblings Cuca, Pancho, and Cati, my grandma Quita, my grandparents Potota and
Elbio, ina, and all my extended family of aunts, uncles, and cousins. Thanks to my in-laws
Laly and Jaime, for all your support, balance, and peace, and thanks to all the Gutis for the
support too.
Finally, thanks to Lu for being always present in every step of my life and my PhD:
motivating, supporting, challenging, lifting me up when I needed, shining your light in my
life, grounding my head, and caring for my heart. Thanks for your strength, wisdom,
endurance, patience, and love over all these years. And thanks to Mati and Santi for “making
everything holy now.”
ix
ABSTRACT
The objective of this dissertation was to determine to what extent plant species diversity
affects biomass and seed productivity, weed invasion, and stability in perennial herbaceous
polycultures across three years, two harvest management regimes, and two locations in
central Iowa, USA. Average biomass productivity consistently increased in polycultures with
increasing species richness across all environment-years. In most situations, polycultures
were more productive than the average of monocultures, but not more productive than the
best adapted species in monoculture for each environment. Polyculture overyielding was due
to complementarity among species in the community rather than to selection effects of
individual species at all richness levels across environments and was likely explained by
legume-grass facilitation. Polycultures with high richness had lower variability in yield (i.e.,
greater stability) than the highest yielding monocultures. Seeds of two perennial grain species
were harvested; intermediate wheatgrass produced up to 65.8 ± 6.5 g m-2 of seed and Illinois
bundleflower up to 55.0 ± 8.1 g m-2. Plant breeding and better agronomic management are
needed to increase these yields in the near future to be practical for production situations. The
mixture comprising both perennial grains produced as much seed as the best yielding
monoculture each year. Polycultures of Illinois bundleflower with C4 grasses and
polycultures of intermediate wheatgrass with legumes produced as much seed as the
monocultures. Weed biomass decreased exponentially with seeded species richness in all
environments. Most polycultures exerted greater weed suppression than perennial grain
monocultures but also they had reduced seed yields. Breeding and management of crop
mixtures to optimize the trade-off between seed yield and weed suppression is a central
challenge for the development of perennial polyculture systems. The dialogue between
Ecology and Agriculture provides a basis for designing sustainable production systems.
x
RESUMEN (ABSTRACT IN SPANISH)
El objetivo de esta tesis doctoral fue determinar el efecto de la diversidad de especies
de plantas en la productividad de biomasa total y semilla, la invasión de malezas, y la
estabilidad de la producción en policultivos herbáceos perennes durante tres años, dos
sistemas de manejo, y dos localidades en Iowa, Estados Unidos. La productividad promedio
de biomasa se incrementó consistentemente en policultivos con mayor riqueza de especies en
todos los años y ambientes. En la mayoría de los casos, los policultivos fueron más
productivos que el promedio de los monocultivos, pero no más productivos que el
monocultivo de la especie más adaptada a cada ambiente. La ventaja en rendimiento de los
policultivos fue causada por la complementariedad entre las especies de la comunidad y no
por efectos de selección de especies individuales para todos los niveles de riqueza de
especies en todos los ambientes, y fue probablemente explicada por facilitación entre
leguminosas y gramíneas. Los policultivos con mayor riqueza de especies tuvieron menor
variabilidad en rendimiento (mayor estabilidad de producción) que los monocultivos de
mayor rendimiento. Se cosechó semilla de dos especies perennes para grano; Thinopyron
intermedium produjo hasta 65.8 ± 6.5 g m-2 de semilla y Desmanthus illinoensis hasta 55.0 ±
8.1 g m-2. Si bien estos rendimientos no son viables para la producción comercial, a través
del mejoramiento genético y la utilización de mejores prácticas agronómicas, se pueden
incrementar estos rendimientos en el corto plazo. La producción de semilla de la mezcla de
ambas especies no fue diferente del monocultivo más productivo cada año. Algunos
policultivos (D. illinoensis con gramíneas C4 y T. intermedium con leguminosas) produjeron
tanta semilla como los monocultivos respectivos. La biomasa de malezas se redujo
exponencialmente al incrementar la riqueza sembrada de especies en todos los ambientes. La
mayoría de los policultivos suprimieron más a las malezas que los monocultivos, pero
tuvieron menor rendimiento de semilla. Mejoramiento genético e investigación en manejo
agronómico de mezclas de especies que optimicen el compromiso entre producción de
semilla y supresión de malezas es un desafío central para el diseño de sistemas de
policultivos perennes. El diálogo entre Ecología y Agricultura es la base para desarrollar
sistemas de producción sustentables.
1
CHAPTER I. INTRODUCTION
These are challenging times for humanity: climate change, wars, hunger and obesity
epidemics, biodiversity loss, pollution and coastal dead zones, prospects of an energy crisis,
poverty in rural and urban communities… These are exciting times for creative alternatives
in the field of agriculture, when the passion for working towards sustainability is combined
with the systematic method of scientific inquiry. A central challenge to scholars and
practitioners of sustainable agriculture is to acknowledge the scientific and technological
paradigms in which our work is embedded, which provide both foundations and limitations
to our work. This dissertation follows a holistic scientific paradigm, which considers
ecosystems as wholes with properties not reducible to the sum of their component parts. It is
immersed in the Sustainable Agriculture tradition which seeks food systems at the same time
socially fair, environmentally friendly, and economically viable. Also it is inspired by a
technological paradigm in agriculture that seeks to mimic the structure of natural ecosystems
to develop agroecosystems that run on sunlight and minimal external inputs, minimize
ecological degradation, are efficient, stable, and support vibrant rural communities, i.e.,
Natural Systems Agriculture (Jackson, 1985). As such, it seeks to solve the 10,000 years old
problem of agriculture based on annual crop monocultures by investigating the potential of
diverse perennial polycultures as a more sustainable alternative production system.
Agro-biodiversity has many dimensions: temporal, spatial (at field, farm, and landscape
scales), species, and genotypes, among others. Agro-biodiversity has been proposed as a key
feature of sustainable agroecosystems. In Ecology, the role of biodiversity in various
ecosystem functions has been a fertile field of research in the recent years. This dissertation
draws insight from ecological and agroecological literature, applying it to perennial
herbaceous polycultures. The objective of this dissertation is to determine to what extent
plant species diversity affects biomass and seed productivity, weed invasion, and stability in
perennial herbaceous polyculture communities across years, management regimes, and
environments in central Iowa, USA.
The role of diversity in productivity and stability of ecosystems has been subject of an
intense debate. I introduce the history of this debate in Chapter II of this dissertation,
2
providing an overview of the early diversity-stability debate in ecology, the biodiversity-
ecosystem functioning debate, and some implications for the dialogue between Ecology and
Agriculture.
In the following three chapters I report results from an extensive well replicated field
experiment conducted over 4 years at two locations in central Iowa, USA, in which plots
varying in perennial herbaceous plant species and in monocultures and polycultures were
measured for biomass productivity, seed yield, and weed invasion.
In Chapter III we test the hypotheses that during the first two years of the experiment: 1)
crop biomass productivity increases with increasing species richness; 2) weed biomass is
reduced with increasing species richness; 3) the presence or absence of certain species
changes the slope of the regression of biomass production on species richness; and 4) harvest
management changes the slope of the regression of biomass production on species richness.
In Chapter IV, we test three hypotheses: 1) that the observed relationship between
richness and biomass productivity is due to complementarity among species and not to a
selection effect; 2) that the richness—productivity relationship remains the same across two
harvest management regimes at each of two locations across three years; and 3) that diverse
polycultures are more stable across environments than monocultures.
In Chapter V, we consider a subset of the experiment to explore issues of perennial
forage and seed production and competitive ability of two dual purpose perennial crops
(Illinois bundleflower and intermediate wheatgrass), testing four hypotheses: 1) the binary
mixture of bundleflower and wheatgrass outperforms the constituent monocultures in terms
of seed, forage, and protein yields and competitive ability with weeds; 2) companion species
from different functional groups enhance production of the mixture compared to companion
species from the same functional group; (3) bundleflower and wheatgrass exhibit good
competitive ability in polycultures with other perennial companions by producing as much or
more seed and forage than expected based on their proportion in the mixture; and 4)
perennial polycultures including highly competitive companion species increase weed
suppression without reducing yield compared to monocultures.
Finally, Chapter VI summarizes the main conclusions of the dissertation and suggests
some future research questions to pursue.
3
CHAPTER II. HISTORY AND PHILOSOPHY OF THE BIODIVERSITY–
ECOSYSTEM FUNCTIONING DEBATE IN ECOLOGY
A modified version of this paper will be submitted as a chapter in
Brown, B., K. Peacock, and K. de Laplante (Eds). 2008. Philosophy of Ecology. Vol. 11
of Handbook of the Philosophy of Science.
Valentin Picasso1 and Kevin de Laplante2
INTRODUCTION
Population/community ecology and ecosystem ecology present very different
perspectives on ecological phenomena. Over the course of the history of ecology there has
been relatively little interaction between the two fields at a theoretical level, despite general
acknowledgment that many ecosystem processes are both influenced by and constrain
population- and community-level phenomena. However, recent years have seen a growing
interest in theoretical models and experimental studies aimed at investigating the relationship
between biological diversity and higher-level community and ecosystem properties, such as
invasibility and productivity. This research on biodiversity and ecosystem functioning has
spawned a large and growing literature that holds great promise for productive engagement
between community ecology and ecosystem ecology. Indeed, the synthetic viewpoints
developing out of this research may represent a genuine “paradigm shift” in ecology (Naeem,
2002).
However, this research has also generated heated debate among ecologists over
experimental methodology and interpretation of research results. The debate burst into the
public sphere in 2000 when a group of critics of the biodiversity-ecosystem functioning
experiments accused proponents of misrepresenting the scientific debate to the public for
political purposes. One media source described it as a “full war among ecologists” (Kaiser,
2000). Recent writings have been more conciliatory in tone, but this incident points to a
1 PhD candidate in Sustainable Agriculture, Iowa State University, senior author. 2 Associate Professor, Philosophy, Department of Philosophy and Religious Studies, Iowa State University.
4
broader socio-political context that has played an important role in both motivating and
enabling research on biodiversity-ecosystem functioning relationships: the context of
conservation science and environmental policy. A comprehensive overview of this debate
needs to take account of this socio-political context.
Young ecologists are often unaware of the intellectual history of their field, or the
relevance of this history for understanding the scientific and socio-political environment
within which their work is situated. The primary aim of this paper is to provide an historical
and conceptual overview of the biodiversity-ecosystem functioning debate that will help to
illuminate research that is currently being conducted in this field. The paper also serves as an
overview of the relevant philosophical literature on foundational concepts in ecology, and
consequently may be of interest to historians and philosophers of ecology.
The biodiversity-ecosystem functioning debate is best viewed against the background of
the diversity-stability debate in ecology, which we introduce first in this paper. Because the
concepts of “biodiversity” and “function” are themselves subjects of considerable debate in
ecology and philosophy of ecology we then critically assess the status of these concepts as
they are used in ecology generally and in the biodiversity-ecosystem functioning literature in
particular. Next we provide a historical account of the biodiversity-ecosystem functioning
debate focusing in the development of the research program, the critical response, the public
“war among ecologists” and the synthesis framework that arose in 2000. A brief review of
the research during recent years concludes the historical account. Finally, we discuss some
interpretations of this debate focusing on the connections to environmental policy,
philosophy of ecology, and agriculture.
BACKGROUND: THE DIVERSITY-STABILITY DEBATE
The long-standing debate in ecology over the relationship between the diversity and
stability of ecological systems is commonly divided in three historical periods. Each period is
characterized by a particular theoretical and empirical perspective on diversity-stability
relationships, with the third period identified with a shift toward what we now call
biodiversity-ecosystem functioning relationships (Ives, 2005; McCann, 2005).
The history of the diversity-stability debate has important lessons for contemporary
research on biodiversity-ecosystem functioning. Central among these lessons is the
5
importance of distinguishing between (a) genuinely competing ecological hypotheses that
share the same operational definitions of diversity and stability, and (b) different ecological
hypotheses that employ different definitions of diversity and stability, and that hence may not
be in genuine conflict.
The 1950s and 1960s
The view that diversity is positively correlated with stability was endorsed by a number
of prominent ecologists in the 1950s and 1960s, including Eugene Odum, Robert MacArthur,
and Charles Elton.
Odum (1953) related the notions of diversity and stability to the flow of energy through
the trophic links in an ecological network. A system with greater redundancy in energetic
pathways will be more stable than one with lesser redundancy. For Odum, diversity is
interpreted as diversity of network connections, and stability as stability of energetic
throughput and organizational structure – the more stable system is the one that suffers the
least change in energy flow with the removal of a random species. However, these ecosystem
concepts have a rough correspondence to population and community concepts via the
identification of network nodes with species populations and network connections with
trophic links.
MacArthur (1955) follows Odum in understanding stability as a measure of “the amount
of choice which the energy has in following the paths up through the food web”. He sketched
a series of food webs and described the ramifications of energy partitioning for stability using
information theory. Formally, MacArthur’s notion of stability is a measure of the response of
a community to a perturbation that influences the density of at least one of the species.
MacArthur gives a semi-formal argument that recapitulates Odum’s conclusion – in general,
more diverse communities will be more stable than less diverse communities.
Elton’s (1958) arguments draw on a wider range of theoretical and empirical evidence,
but he agrees that diversity and stability are positively correlated. Elton noted that both
simple Lotka-Volterra models and simple laboratory microcosms suffered from instability,
and argued that simpler food webs are more vulnerable to invaders. Elton’s definitions of
stability vacillate within his discussion, but they reflect his general interest in dynamic
instabilities that drive destructive oscillations and population explosions in food webs.
6
Elton’s work on stability was based on plant species invasions and plant diseases in
ecosystems, and therefore he is cited as the father of the diversity-invasibility hypothesis:
species rich communities are more resistant to invasions by exotic species, because there are
fewer resources available for new species in diverse communities. The diversity-invasibility
debate would become one important dimension of the biodiversity-ecosystem functioning
debate, because of the concerns with invasive species in natural ecosystems and weeds in
agroecosystems.
To sum up, the broad consensus during this period was that stability of ecological
systems is positively correlated with diversity, and indeed that diversity is a causal factor in
generating stability.
The 1970s and 1980s
This consensus did not survive the next two decades. By the end of the 1980s the general
consensus was that diversity is not, in general, positively correlated with stability. How did
this shift in attitudes come about?
In the early 1970s mathematical ecologists began to systematically study diversity-
stability relationships in model communities (Gardner and Ashby, 1970; May, 1973; Pimm,
1980). The conclusion of these studies undermined the conventional wisdom about diversity
and stability.
The most influential work of this period was Robert May’s seminal 1973 book Stability
and Complexity in Model Ecosystems. May argued that diversity actually begets instability.
More specifically, he showed that the chances of a randomly constructed Lotka-Volterra
community being stable decreases with both the number of species in the community and the
connectance among species, where connectance is measured by the probability that a pair of
species interacts.
May’s argument employed a very specific definition of stability: it is the probability that
the population size of every species in the community would return to equilibrium if there
were an arbitrarily small perturbation in the population size(s) of one of the species. It is
important to note that this so-called “neighborhood stability” (or “Lyapunov stability”) is an
all-or-nothing property; for a given perturbation, either every population returns to
equilibrium or it doesn’t. May presents his results in terms of the probability that a
7
community, randomly selected from a certain hypothetical population of communities, is
neighborhood-stable.
Stuart Pimm (1980) came to a similar conclusion in his influential analysis of stability
properties of food webs. However, Pimm’s analysis employs a different definition of
stability. He questioned the ecological relevance of May’s “arbitrarily small perturbations”
and chose to model instead the effects of a more significant perturbation, the permanent
removal of one of the species in the community. This “species-deletion stability” is defined
as follows: it is the probability that the removal of one species will not lead to any further
local extinctions. Pimm’s analysis showed that, indeed, communities with more species were
less “species-deletion stable” than communities with fewer species.
These theoretical results were taken to have broad significance for ecology and lead to a
general rejection of the diversity-stability hypothesis among ecologists. The significance of
these results can be challenged, however.
Consider, for example, that a negative diversity-stability relationship is an immediate
statistical consequence of the definitions of stability used by both May and Pimm. If every
species population must return to equilibrium after a perturbation (May), or if every species
population must survive the permanent deletion of one species (Pimm), then the criteria for
stability necessarily becomes more and more strict as you add more species to the
community. The conclusion is independent of any particular feature of ecological
communities; indeed, it can be viewed as an artifact of probability theory.
This fact can be viewed as undermining the empirical significance of the conclusions; the
stability definitions that are employed in the analysis turn what ought to be an empirical
hypothesis into a probabilistic tautology in idealized systems that are unlikely to be realized
in nature anyway (Mikkelson, 1997). Moreover, it can be argued that these strict, population-
level concepts of stability don’t faithfully capture the original notions of stability expressed
in the writings of Odum, MacArthur and Elton, which more often referred to functional
properties of whole communities or ecosystems.
It is this intuition – that a proper test of the diversity-stability hypothesis should focus on
functional properties of communities and ecosystems – that motivates more recent work on
diversity-stability relations.
8
The 1990s
The 1990s saw a revival of the diversity-stability hypothesis in experimental studies that
indicated a positive relationship between diversity and the stability of various functionally
defined properties of communities and ecosystems. The leading figure in this revival was
David Tilman (Tilman and Downing, 1994; Tilman et al., 1996), though many researchers
have since contributed to research in this field.
The general conclusion of these more recent studies is that increasing species diversity
may well decrease the stability of individual plant populations, but it may simultaneously
increase the stability of higher-level community and ecosystem properties. This is because
the increased fluctuations in population size induced by increased diversity aren’t in phase
across all populations – while some populations are decreasing, others may be increasing.
Within a more diverse community there is a greater chance that downward fluctuations will
be balanced by upward swings elsewhere in the community, resulting in greater stability of
community and ecosystem properties that are averaged over individual population sizes.
These studies typically employ one of two measures of stability: resistance to invasion
by new species, or temporal stability of an ecosystem property like biomass or productivity.
Here, “temporal stability” is the mean value of a variable divided by its standard deviation,
both calculated over time; it is a measure of the degree of variability of a property over time.
These concepts of stability self-consciously reflect the concerns with resistance to invasion
and temporal variability that dominated pre-1970s thinking about diversity-stability
relationships. Note that this shift in stability measures inspired a corresponding shift in
terminology, from talking about the stability of population sizes to the stability of ecosystem
functions.
Another feature of the recent literature on diversity-stability relations is a recognition that
“diversity” itself has many possible measures other than species richness. There is
considerable interest, for example, in studying relationships between the functional diversity
of a community and the stability of ecosystem functions (see section 3.1.2). Consequently,
recent work has moved toward a broader investigation of relationships between different
measures of biodiversity and the stability properties of ecosystem functions. Thus we arrive at
the contemporary biodiversity-ecosystem functioning studies.
9
Diversity-stability relationships and environmental policy
Diversity-stability hypotheses do have implications for environmental policy, and this
fact may be relevant in evaluating how ecologists interpret and report research findings.
Consider, for example, (1) increasing concern over loss of biodiversity induced by
environmental deterioration and loss of habitat, and (2) the growing perception that human
impacts on the biosphere may significantly alter the behavior of ecosystems and threaten
vital ecosystem services. Diversity-stability hypotheses are relevant to environmentalist
arguments in both areas of concern by linking issues in one area to issues in the other. If you
believe that certain types or levels of biological diversity are necessary to maintain the
stability of ecosystems and correlated ecosystem services, then you can easily develop an
argument for placing a high instrumental value on biodiversity, and thereby motivate
environmental policies that promote the conservation and restoration of biodiversity.
This observation highlights an important fact: ecological research on diversity-stability
relationships is conducted in a socio-political environment that favors certain outcomes over
others. People who endorse environmental protection policies often look to ecology for
scientific support for their agendas. Indeed, ecologists themselves may be motivated for
similar reasons to look for evidence that supports a positive diversity-stability relationship.
In the 1970s and 1980s the majority view among ecologists was broadly skeptical of
diversity-stability hypotheses. It was easy to regard ecologists who continued to defend a
positive relationship between diversity and stability in light of the evidence mounting against
it as either stuck in an outmoded paradigm, engaged in wishful thinking, or overly beholden
to environmentalist interests.
In the 1990s it once again became scientifically respectable to defend diversity-stability
hypotheses, but many ecologists remained wary of the influence of environmental advocacy
on the interpretation and presentation of scientific results. As will be shown in greater detail
later, these concerns came to a head in 1999 when critics complained that an Ecological
Society of American Bulletin presented a biased and politically motivated account of the
biodiversity-ecosystem functioning research results.
10
Diversity-stability relationships and the holism-reductionism debate in ecology
The study of diversity-stability relationships also takes place in a context framed by the
historical schism in ecology between holistic and reductionistic research traditions and
worldviews. A belief in a positive diversity-stability relationship is commonly associated
with some kind of commitment to holism, while skepticism is more commonly associated
with reductionism. Thus, in addition to biases arising from environmental policy
considerations as outlined above, we must also consider biases arising from philosophical
predispositions toward holism or reductionism in ecology.
These claims require some elaboration. In ecology, holistic and reductionistic theses
come in several varieties, but they can generally be divided ontological or epistemological.
Ontology pertains to the nature of reality, of what exists. Epistemology pertains to
knowledge and the justification of beliefs about the world (in a scientific context, issues
concerning scientific methodology fall into this category). For example, ecologists may differ
on the ontological constitution of communities and ecosystems (e.g. whether they have
“emergent causal properties” at the community and ecosystem level), and they may differ on
the best way to represent and analyze ecological systems in ecological theories (e.g. whether
community- and ecosystem-level phenomena can be exhaustively explained in terms of the
behaviors of their component parts). The latter is an epistemological issue, the former an
ontological issue.
There are several reasons why a belief in a positive diversity-stability relationship is
commonly associated with holism:
(1) There is an historical association between diversity-stability theses and traditional
notions of the “balance of nature”, the view that ecological systems are naturally driven
toward an equilibrium state in which community composition persists and population sizes
are (roughly) stable. In its original formulation with the Greeks, the balance of nature was
explained in terms of teleological principles governing nature as a whole. In the Medieval
period the common explanation was divine providence. In the modern period the favored
explanations have referred either to density-dependent regulation or the stabilizing effects of
network redundancy (as articulated, for example, in the arguments of Odum, MacArthur, and
Elton). Whether these modern explanations are properly described as “holistic” depends
11
largely on how one defines the term, but the point is that the diversity-stability hypothesis has
an historical association with worldviews that are widely regarded as holistic.
(2) We noted that the diversity-stability hypothesis fell out of favor in the 1970s and
1980s in the wake of theoretical studies that seemed to undermine any positive relationship
between diversity and stability. It is notable that this period also saw the rise to prominence
of a new “non-equilibrium” paradigm in ecology that rejected the balance of nature
hypothesis outright (Botkin, 1990). This paradigm reconceptualized the default state of
nature as one of constant flux and change, and its proponents were often motivated to label
the paradigm as reductionistic to contrast it with the holism associated with equilibrium
views of nature (Simberloff, 1980). Proponents of the non-equilibrium paradigm were also
inclined to associate the rejection of the diversity-stability hypothesis with the broader move
toward reductionism during this time period.
These developments were, and continue to be, significant for research aimed at reviving
the diversity-stability hypothesis. The fact is that within mainstream academic ecology –
particularly plant ecology – there is a general bias toward reductionistic and away from
holistic hypotheses and methods. The default view is to be skeptical of holistic hypotheses.
Insofar as a positive diversity-stability relationship is associated with ecological holism one
can expect it to face the same default skepticism.
As contemporary research on biodiversity-ecosystem functioning relationships continues
to mature these default attitudes may slowly be changing, but among plant ecologists who
continue to strongly identify with reductionism (e.g. neo-Gleasonian views on plant
dynamics) one is likely to encounter resistance to any diversity-stability hypothesis that are
perceived as appealing to holistic mechanisms or properties to account for experimental
results.
BIODIVERSITY AND ECOSYSTEM FUNCTIONS: KEY CONCEPTS
One of the lessons learned from earlier studies of diversity-stability relationships is the
importance of being clear about the definitions of key theoretical terms and their empirical
measures. Biodiversity-ecosystem functioning research is particularly vulnerable to charges
that their key concepts, “biodiversity” and “ecosystem function”, either are too vague, multi-
faceted or value-laden to properly serve the needs of empirical science. In this section we
12
discuss the various meanings with which these terms are used in the ecological literature,
identify some of the conceptual challenges facing the use of these terms in a scientific
context, and clarify their usage in the biodiversity-ecosystem functioning literature.
Biodiversity
Biodiversity and Conservation
The concepts of biological and ecological diversity are as old as natural history, but the
term “biodiversity” only appeared in the scientific lexicon in the late 1980s, coinciding with
the emergence of conservation biology as an applied science aimed at preserving and
conserving biological diversity in the facing of a looming biodiversity “crisis” (Soule, 1985).
Attempts to define “biodiversity” as an object of conservation have always been
complicated by the fact that, in this context, the objects that comprise biodiversity are
associated with conservation values, i.e. those aspects of the natural environment that we
value and wish to preserve for current and future generations (or for their own sake). In
principle this may include any biological entity or biological process of interest, a move that
runs the risk of making biodiversity co-extensive with all of biology and consequently
rendering biodiversity conservation impractical, since everything biological would become a
goal of conservation (Sarkar, 2005).
Definitions of biodiversity are also complicated by the fact that objects of biological and
ecological interest don’t fall under a single hierarchy of nature. One can distinguish at least
two distinct hierarchies: (i) a taxonomic hierarchy that includes genes and alleles, genotypes,
subspecies, species, genera, families, orders, classes, phyla, and kingdoms; and (ii) a
spatial/compositional hierarchy that includes biological molecules, cell organelles, cells,
individuals, populations, meta-populations, communities and ecosystems (communities plus
their physical environments), and extending ultimately to the entire biosphere. Complications
arise from the fact that biological entities of interest may not fall cleanly into any specific
category in either hierarchy (consider fungi, symbionts or asexual species), and at every level
of each hierarchy there is significant variation – for example, any two individuals of the same
species will differ in genetic profile, and no two communities of the same type will be
identical (Sarkar, 2005).
13
Standard definitions of biodiversity attempt to simplify the problem by focusing on the
diversity of entities at three levels of organization – alleles or genes, species, and ecosystems.
The presumption is that if you can preserve allelic diversity then you’ll likely preserve most
of the variation of interest below the level of the individual; if you preserve species diversity
then you’ll preserve all of the taxonomic entities above the species level; and if you preserve
ecosystem diversity then you’ll preserve most kinds of communities.
This traditional approach to defining biodiversity has been criticized for being overly
focused on conserving biological entities – individuals, species, communities, etc. In addition
to entities, conservation efforts are also (or should be) aimed at conservation of unique or
valuable biological and ecological phenomena that don’t fit into either the spatial or
taxonomic hierarchies. A standard example is seasonal migration patterns, such as the
remarkable migration of monarch butterflies in North America from the eastern and western
regions of the US and Canada to Mexico and back. This migration pattern would disappear if
overwintering sites are destroyed, though the species itself may persist. Conservation of
unique biological phenomena isn’t guaranteed by conservation of genetic, species, and
ecosystem diversity.
Conservation science and the associated literature on biological diversity has also been
influenced by the rise to prominence of holistic conservation concepts like “biological
integrity”, “ecosystem integrity” and “ecosystem health”. Here the focus is less on preserving
individual species and more on preserving or restoring the biotic and abiotic conditions that
allow different community and ecosystem types to persist. On this more holistic view, the
targets of biological conservation also include ecosystem properties like network
organization, characteristic rates of cycling and throughput of energy and materials, and
dynamical properties related to adaptability and resilience.
These and other considerations have lead many writers to suggest that the concept of
biodiversity – in the context of conservation science and policy – is necessarily pluralistic
and value-laden (Norton, 2001; Sarkar, 2005). There is no single correct measure of
biodiversity to be discovered but many, each representing different ways of valuing biotic
and abiotic resources.
14
Biodiversity and ecosystem function experiments
Many of the complicating factors noted above (relating to, for example, the association
between biodiversity and conservation values) are fortunately not present in the context of
the common forms of biodiversity-ecosystem functioning experiments. In this context we
are concerned with determining empirical relationships between biodiversity and various
measures of community or ecosystem stability and function. The experimental context
requires that all biodiversity concepts be operationally measurable and controllable in such a
way that empirically significant conclusions can be drawn. In practice this amounts to a
severe restriction on the scope of possible biodiversity measures. Typical experiments focus
on one taxonomic group (usually plants, but sometimes microorganisms) and then consider
only the species level of biodiversity, leaving the genetic and ecosystem levels out of the
discussion. At the species level, various measures of diversity may be used, such as the
Shannon-Weiner index which takes into account two components, richness (the number of
species in an area) and evenness (the relative abundance of different species in an area).
Another class of biodiversity-ecosystem functioning studies focuses on relationships
between functional diversity and ecosystem function. Functional diversity includes diversity
of functional traits and groups. Functional traits are the characteristics of an organism that
are considered relevant to its response to the environment and/or its effects on ecosystem
functioning (Diaz and Cabido, 2001). Examples include leaf size, seed size, dispersal mode
and canopy structure. A functional group or type is a set of organisms sharing similar
responses to the environment (e.g. temperature, water availability, nutrients) or similar
effects on ecosystem functioning (e.g. productivity, nutrient cycling). Like species diversity,
common measures of functional diversity include two components: i) functional richness (the
number of different functional groups or the proportion of a multi-dimensional trait space
covered by a particular suite of species) and ii) functional composition (presence or absence
of certain functional groups or traits). Although functional diversity can apply to an indefinite
number of traits, it is commonly measured by measuring the diversity of functional groups.
Though biodiversity-ecosystem functioning experiments involving functional diversity
are becoming more common, it remains the case that for the majority of biodiversity-
ecosystem functioning studies, the proxy for biodiversity is nothing more than plant species
15
richness – the number of plant species in a plot. There are several practical reasons for this
simplification: species are easy to identify; plant communities are easy to assemble,
manipulate and maintain in pots and fields; and many interactions among plants are well
documented in ecology. Also, policy makers tend to prefer single numerical measures over
complex multidimensional indices to make decisions about conservation (Purvis and Hector,
2000)
Not surprisingly, this simplification imposes serious limitations on the interpretation of
biodiversity-ecosystem functioning studies. Claims about the significance of biodiversity in
general for ecosystem functioning, or about the applicability of observed biodiversity-
ecosystem functioning relationships for ecological systems in general (in both experimental
and non-experimental contexts) will be extremely tentative at best. This is a potentially
serious concern because, as noted in section 2.4, one of the motivations for the biodiversity-
ecosystem functioning research program is the perception that this research has policy
implications. Indeed, one of the criticisms was that the authors were too hasty in drawing
general conclusions for environmental policy from the biodiversity-ecosystem functioning
literature (Wardle et al., 2000).
Ecosystem function
For some ecologists the term “ecosystem function” is suspect because it carries with it
associations of holism and teleology that are perceived to be outdated and unscientific. The
term seems to presuppose the existence of ecosystems as integrated entities with emergent
properties that can properly be said to fulfill “functions”. However: (i) the general trajectory
of plant ecology over the past thirty years has been away from strongly holistic conceptions
of communities and ecosystems, and (ii) the concept of “function” in ecology is historically
associated with Clementsian teleology and group-selection mechanisms of community and
ecosystem development, both of which are now widely viewed as empirically falsified and/or
inconsistent with neo-Darwinian evolutionary theory.
Defenders of the concept of “ecosystem function” should have something to say in
response to objections such as these. In this section we take a closer look at these objections
and clarify the meaning of the term “ecosystem function” as it is employed in the
biodiversity-ecosystem functioning literature. We will see that, as with the case of
16
“biodiversity”, in the context of biodiversity-ecosystem functioning experiments the
operational meaning of the term “ecosystem function” is usually rather tightly circumscribed,
and consequently is less problematic than it might otherwise be. Nevertheless, ecologists
need to become more aware of the conceptual issues surrounding the use of “function
language” in science if they wish to avoid confusion and misreading of their work.
Modern science and the challenge to natural functions
Tools and other artifacts have obvious functions (a carpenter’s hammer has the function
of hammering nails, a coffee maker has the function of making coffee, etc.), but the function
of these artifacts is grounded in the intelligent design of human beings – these objects are
built and used for a conscious purpose. But do the objects studied by the natural sciences
have functions? Do water molecules, chemical reactions, cells, frogs or lakes have functions?
If an object is not the product of conscious intelligent design, can it have a function?
Greek and Medieval natural philosophers believed the answer was “yes”: in fact, all
natural systems have functions, and these functions are essential to any explanation of what
they are and why they behave the way they do. Within Aristotle’s philosophy of nature,
every object has a “final cause” or “telos”, which is the goal or purpose of the object and
every object strives to fulfill its natural goal or purpose. This is what is meant by saying that
Aristotle has a “teleological” worldview.
Indeed, Aristotle believed that natural systems possess a set of functions that reflects a
hierarchical and teleological conception of the cosmos as a whole. The cosmos is an organic
whole composed of many parts nested in various hierarchies. The functions of the parts are
partly defined in relation to the role they play within the greater wholes that contain them.
Thus, one function of plants is to grow and develop as plants do, but for Aristotle another
function of plants is to provide food for animals, and this function is part of the explanation
for why plants exist with the properties that they do.
Greek and Medieval scholars working out of this teleological tradition agreed that dead,
inert objects could not have natural functions of their own – any functions they have must be
derived from some form of intelligent agency. For Plato and the Medieval theologians, this
agency is derived from the creative work of an external designer (a “demi-urge” for Plato, a
theistic God for theologians). For Aristotle this agency is not external, but internal, immanent
17
in the fundamental nature of objects. Thus, while not all objects are conscious in the way that
higher animals and human beings are, all objects possess “mind-like” qualities in some sense.
Within this context, traditional ecological notions like the “balance of nature” were
articulated in explicitly teleological language, appealing either to the immanent teleology of
Aristotle or the external teleology of divine creation.
However, the scientific revolution of the 16th and 17th centuries brought about a dramatic
change in cosmological worldview. The “mechanical philosophy” developed by (among
others) Bacon, Galileo, Kepler, Hobbes, Boyle, Gassendi, Descartes, and Newton was
grounded in the notion that the physical universe was entirely made up of small solid
corpuscles in motion, and that these corpuscles are inert, devoid of any of the “psychic
characteristics” that were common to the earlier frameworks. Within this framework, natural
phenomena are explained as the result of mechanical interactions of inert particles. The
immanent teleological principles of Aristotle were “squeezed out”, and the origin of natural
functions was consolidated in the external agency of God.
The more serious challenge to the concept of natural functions arose as scientific
explanation became increasingly “naturalized” and explicit references to God were
discouraged. Without reference to God or other forms of intelligent agency, how are we to
understand natural functions?
Natural functions, “function talk” and the philosophy of biology
The view that came to dominate the physical sciences was that appeal to natural functions
could not be justified, and reference to them should be eliminated in scientific explanations.
By the end of the 18th century the dominant research programs in physics and chemistry were
mechanistic in orientation.
In the biological sciences the mechanical revolution had a less dramatic impact on the use
of natural function concepts in scientific explanation. To most scientists there seemed no
hope of explaining the striking adaptedness of organisms to their environments, or
phenomena such as embryonic development, in purely mechanical terms. Darwinian
evolutionary theory eventually offered a non-teleological explanation for biological
adaptations, but in many areas of biology teleological explanations continued to flourish
under the banners of vitalism, Lamarckism, and orthogenesis.
18
It was not until the neo-Darwinian synthesis of the 1930s and 1940s and the discovery of
the molecular basis of heredity that overt teleological explanations were eliminated from
most areas of biology and the prevailing view in the physical sciences was finally endorsed:
teleological explanations are illegitimate outside the context of human intentional
explanation.
But of course function talk didn’t disappear in the biological sciences. Biologists and
ecologists continue to use expressions like “the function of”, “the role of”, “for the sake of”,
“serves as” and “for the purpose of” in discussing biological and ecological entities,
processes and mechanisms. Function talk also persists in the social sciences and in medicine.
This linguistic fact poses a puzzle: on the one hand, modern scientists officially disavow
teleological explanations in science; on the other hand, they routinely use the language of
functions in scientific description and explanation. Is this usage justified? And if so, how is it
justified? This question has spawned a large philosophical literature on the relationship
between function talk and teleology.
Early work by philosophers was uniformly hostile to teleology and attempted to show
how function talk can be reinterpreted in non-teleological terms without loss of meaning
(Hempel, 1959; Nagel, 1961). This project had only limited success. The problem is that
function talk – and especially reference to “natural functions” – seems to presuppose a degree
of normativity that resists analysis in purely descriptive terms.
To give a standard example, we might say that the heart can perform a number of
functions in virtue of its causal properties: it can produce rhythmic sounds, for instance; it
can also be used to train medical students in physiology and dissection. But we also want to
say that producing rhythmic sounds or assisting the training of medical students isn’t the
proper or natural function of the heart – the proper or natural function of the heart is to pump
blood through the circulatory system of an organism. And when a heart fails to pump blood,
then it’s malfunctioning. The concepts of “natural function” and “malfunction” appear to be
normative concepts in the sense that they refer not only to what hearts in fact do, but what
they should do. This kind of normative function attribution is quite common in biology, but
where and how does the normativity arise in the absence of immanent teleological properties
(as in Aristotelian science) or intelligent design by an external agent like God?
19
More recent work on the philosophy of functions has attempted to naturalize the
teleology that is evident in normative function ascriptions. The most discussed theory of
normative functions is based on the observation that Darwin’s theory of natural selection
seems to justify a certain kind of teleology (Millikan, 1984). We say that certain traits were
“selected for”. For what? For the effects of that trait that contributed to its persistence within
a population over evolutionary time frames. Hearts haven’t persisted in populations because
they make rhythmic sounds; they persisted because they perform a particular adaptive
function – pumping blood – that contributed to the survival of organisms; they were selected
for this causal effect. Thus, the selection history of a trait allows us to distinguish between
causal effects of a trait that are merely accidental and causal effects that contributed to
survival because they performed an adaptive function. This conception of natural functions
justifies a certain kind of normative teleological language without recourse to intelligent
agencies or immanent teleological principles in nature.
However, not all philosophers are happy with theories of natural functions based on
evolutionary history. If an organism didn’t have any evolutionary history – if, say, it was an
entirely new species created in a laboratory – but it still had a heart, wouldn’t we still want to
say that the heart has a function, and that function is to pump blood? Considerations such as
these have motivated philosophers to develop alternative accounts of functions that are not
based on evolutionary history.
For current purposes there is no need to survey the (vast) philosophical literature on
functions any further (for an extended survey see Wouters, 2005), suffice it to say that, while
there is currently no consensus theory of functions among philosophers or biologists, there is
widespread agreement that function talk is unlikely to be eliminated from biology, and that
certain kinds of normative function attributions may be justified without presupposing
Aristotelian or theological conceptions of nature.
Functions and ecology: the holism-reductionism split once again
Though biologists and ecologists have conducted their affairs largely in ignorance of the
philosophical debate over functions, we should not conclude that philosophical attitudes
toward functions and functional explanations have played no role in shaping the practices of
20
scientists. These philosophical attitudes are revealed in general attitudes toward scientific
methodology and holistic versus reductionistic research programs.
With respect to methodology, it is a generally accepted principle of modern scientific
reasoning that a proper scientific explanation is either causal-mechanical in nature or
grounded in general laws that describe uniform regularities; overt appeals to teleological
principles in explaining the properties of natural systems are either discouraged or dismissed.
This is the legacy that modern science has inherited from the scientific revolution of the 17th
century.
In addition, the history of 20th century ecology is marked by a schism between holistic
and reductionistic research programs that reveal differing views on the proper role of
functions and function language in ecology. Put succinctly, holists are more willing than
reductionists to attribute functions to higher-order ecological entities and processes.
Some of the reasons for these predilections should be obvious. In the non-human world,
function talk is most naturally applied to well-organized systems with component parts that
play distinctive roles in maintaining the structure and behavior of the system as a whole.
Organisms are the quintessential example of such integrated systems and consequently
function talk is most naturally applied to organisms. There is a long-standing tradition of
holistic theorizing in ecology that is grounded in analogies between ecological systems and
organisms. The most obvious historical example is the Clementsian concept of the plant
community as a kind of “superorganism” that has an ontogeny and phylogeny directly
analogous to that of individual organisms (Clements, 1916). Organismal metaphors are also
prominent in ecosystem ecology via the language of respiration, metabolism, growth,
development and self-organization, and in the work of certain theorists who self-consciously
defend non-trivial analogies between organismal and ecosystem development (e.g., Odum,
1969)There are also holistic traditions of population and community ecology that emphasize
the roles of individual species in contributing to the stability of higher level ecological
properties, such as resistance to invasion (Elton, 1958; Elton, 1966). It is within these holistic
traditions of ecological theorizing where one is most likely to find the language of functions
and functional roles applied to populations, communities and ecosystems.
21
By contrast, within more reductionistic approaches to ecology that are more strongly
under the influence of either neo-Gleasonian individualist conceptions of plant communities
and succession (Egler, 1954; Gleason, 1939), and/or the view that ecological principles must
at least be consistent with, if not ultimately grounded in, neo-Darwinian evolutionary theory
(Mayhew, 2006; Pianka, 1999), one is far less likely to find the language of functions applied
to ecological entities above the levels of individuals and populations. And when it is used the
tendency is to have the function language grounded in natural selection history.
There are at least two reasons for this. First, research within these traditions emphasizes
the changing, stochastic, non-equilibrium aspects of ecological systems, and by and large
rejects the holistic view of communities and ecosystems as coherent, organized entities with
emergent causal properties. By rejecting the organismal metaphor they consequently reject
function attributions that are predicated on strong analogies between ecological systems and
organisms.
Second, attitudes toward function language in ecology have been influenced by the group
selection debate that took place in the 1960s (Williams, 1966; Wynne-Edwards, 1962). The
critique of group selection was based on the affirmation that within orthodox evolutionary
theory, natural selection acts primarily at the level of individual organisms (or, indeed, the
level of individual genes), and rarely if ever at the level of groups. This debate raised
awareness among ecologists of the broader implications of the theoretical perspective
represented in population genetics and the neo-Darwinian synthesis, and was partly
responsible for the rise of evolutionary ecology in the late 1960s and early 1970s.
Evolutionary ecologists tend to associate the language of functions with organism-
environment relationships relevant to selection and adaptation (e.g. “functional traits”). But if
natural selection only acts at the level of individuals within species populations, then the
language of functions should only apply at this level. Consequently, evolutionary ecologists
are inclined to be skeptical of function attributions at the community and ecosystem level.
To sum up, in ecology the language of functions is historically and conceptually tied to
philosophical and theoretical debates between holists and reductionists that have played
central roles in the intellectual history of the discipline. The biodiversity-ecosystem
functioning literature is notable for its heavy use of function talk. It is an open question
22
whether and to what extent differing philosophical attitudes toward functions (and their
affiliation with holistic research traditions) influence the work of researchers within this
field, but it would be naïve to assume that they play no role at all. There is no doubt,
however, that some ecologists (generally, those not directly involved in biodiversity-
ecosystem research) view this research program with suspicion because of its affiliations
with what they regard as a discredited ecological holism.
Functions in the biodiversity-ecosystem functioning literature
We have seen that function attributions come with a certain amount of philosophical
baggage associated with commitments to holism and the normativity of so-called “natural” or
“proper” functions. But not all function talk in biology or ecology carries this baggage. In
many cases the term “ecological function” is used synonymously with “ecological process”,
and merely refers to an ecologically relevant causal process. The biodiversity-ecosystem
functioning literature uses the term “function” in a wide range of senses, some of which are
innocuous and with no implications for the philosophical issues described earlier. But this is
not always the case. In some cases the language of functions is used in ways that invoke the
normative sense of function and that presuppose a certain kind of holism with respect to
ecosystems.
Kurt Jax (2005) offers a helpful review of function language in ecology and specifically
in the context of biodiversity-ecosystem functioning research. Jax distinguishes four major
uses of the term “function” in ecology:
(1) to characterize processes and interactions between pairs of objects, and the causal
relations that sustain them. This sense of function refers to pair-wise interactions. Examples:
a fox eats a mouse; a plant assimilates nutrients. In most cases the term “function” can be
replaced by “process” or “interaction” without loss of meaning.
(2) to characterize processes and interactions between a collection of objects, and the
causal relations that sustain them. At this level we are viewing the objects as constituting or
as situated within a larger system, and asking how the objects (now conceived as “parts”)
contribute to or relate to the larger system (now conceived as a “whole”). Examples: biomass
production and phosphorus cycling within a lake; community population dynamics. These
kinds of investigations are the stock-in-trade of a great deal of ecological research.
23
(3) to characterize the overall processes that sustain an ecological system as a whole,
and the role of the component parts in these processes. At this level the focus is on whole-
system properties and processes. The parts of the system and their behaviors are reconceived
as bearers of functions in relation to properties and processes of the whole. Examples:
describing a plant species as a “primary producer” or a bacterium as a “decomposer”; a
species conceived in terms of its Eltonian “functional role” niche.
(4) to characterize those aspects of an ecological system that are useful or important to
humans. Examples: the concept of an “ecosystem service”, such as providing oxygen or
purifying water. Though this concept of function is most generally used in relation to human
needs and interests, in principle it could be applied to other living beings.
Another important distinction that cross-cuts these categories is between functions
conceived as “means” and as “ends”. When conceiving of functions as “ends” we are simply
focusing on the activity or performance of various objects within a temporal sequence or
causal chain. When conceiving of functions as “means” we are asking about the role or
contribution that an object makes for something else (e.g. “what is the function of
biodiversity to ecosystem functioning?”; “what function does species X play in the service of
ecosystem property Y?”). Studies that focus on functions as ends are generally unproblematic
since they involve nothing more than empirical investigation of a process (like productivity,
or drought resistance). Studies that focus on functions as means are more problematic
because they require that we consider the “aims”, “goals” or “purposes” served by the
function, and this brings into play the issues of teleology and normativity discussed earlier.
We argued earlier that certain kinds of normative function attributions can be justified in
biology, but raised questions about their applicability to ecosystem processes (we return to
this issue below).
The question to be asked is this: How is the language of functions used in the
biodiversity-ecosystem functioning literature? And are these uses problematic or
unproblematic?
Jax distinguishes three kinds of research questions in the biodiversity-ecosystem
functioning literature that employ different meanings of “function” (Jax, 2005):
(1) How does biodiversity relate to ecosystem processes (= ecosystem function)?
24
(2) How does biodiversity relate to the functioning of ecosystems?
(3) How does biodiversity relate to ecosystem services (= ecosystem functions)?
The bulk of the experimental work on biodiversity-ecosystem functioning relations is
focused on answering the first question, where the variables of interest (productivity, drought
resistance, decomposition of litter, etc.) are treated as ends, not as means to some other end.
This usage is largely unproblematic since it is does not invoke the normativity of functions
conceived as means to some other end.
The second question employs a sense of “function” that can be problematic when the
expression “functioning of ecosystems” (or “ecosystem functions”) refers to the overall
behavior or performance of an ecosystem, because this usage often presupposes a certain
conception of ecosystems as entities in the world. Consider how the expression is used in the
controversial ESA article on “Biodiversity and ecosystem functioning”:
Ecosystem functioning reflects the collective life activities of plants, animals, and
microbes and the effects these activities – feeding, growing, moving, excreting waste, etc. –
have on the physical and chemical conditions of the environment. (Note that ‘functioning’
means ‘showing activities’ and does not imply that organisms perform purposeful roles in
ecosystem-level processes.) A functioning ecosystem is one that exhibits biological and
chemical activities characteristic of its type.” (Naeem et al., 1999)
The authors try to head off worries about their use of function language but the last line
betrays a normative interpretation of this language. A functioning ecosystem is one that
“exhibits biological and chemical activities characteristic of its type”. As Jax puts it,
The aim of investigating “functioning” ecosystems here is clearly not to observe any
activities of organisms in a particular area, but specific activities that sustain some “typical”
ecosystem. Here “functioning” clearly receives a normative dimension in the sense that it
refers to some pre-defined reference states of an ecosystem (those that “exhibit biological
and chemical characteristics of its type”). The “functioning” of the ecosystem thus is a
desirable state, and the organisms in fact are investigated as if they perform purposeful roles
in its perpetuation. This is a legitimate aim of applied ecological research, but it goes beyond
a pure description of processes that occur in some aspect of nature. (Jax, 2005)
25
In short, this usage presumes that one can describe ecosystems as functioning or
malfunctioning relative to some reference state that characterizes an idealized ecosystem
“type”. The problem here isn’t so much the normativity of the function ascription as the
conception of ecosystems and ecosystem individuation that is being presupposed. Very few
ecologists believe that ecosystem “types” are part of the furniture of the world. By far the
more common view (even among holists) is that the boundaries and variables that
characterize an ecosystem are chosen by observers, they’re not given in nature as such.
Consequently, making statements about the functioning of ecosystems demands that
observers delimit the ecosystem in question and specify the relevant reference states. The
problem, as Jax sees it, is that this is almost never done in a careful, explicit and motivated
fashion. As a result, the concept of a “functioning ecosystem” is never operationally defined.
This kind of usage lends support to critics who charge that expressions like “ecosystem
function” are nothing more than trendy buzzwords that don’t belong in the scientific lexicon
of ecology.
Jax (2005) identifies a number of other examples in the biodiversity-ecosystem
functioning literature where distinctions between ecosystem processes and ecosystem
functions, and between normative and descriptive senses of function, are blurred, resulting in
semantic confusions that hinder rather than help the empirical investigation of biodiversity-
ecosystem functioning relationships. We agree that this research can benefit from a
theoretical framework that encourages greater precision in the use of key concepts and that is
more mindful of the historical and philosophical issues associated with the use of these
concepts.
THE BIODIVERSITY-ECOSYSTEM FUNCTIONING DEBATE
We now turn to the historical account of key events of the biodiversity-ecosystem
functioning debate, dividing the continuum into four sections: the beginning of the research
program (early 1990s), the critical response (late 1990s), the heat of the debate (2000), and
the conciliation process (2000-01). The history of the biodiversity-ecosystem functioning
debate has been marked by considerable interplay among theoretical developments, empirical
results, institutions, policy concerns, the media, and the personalities of the scientists
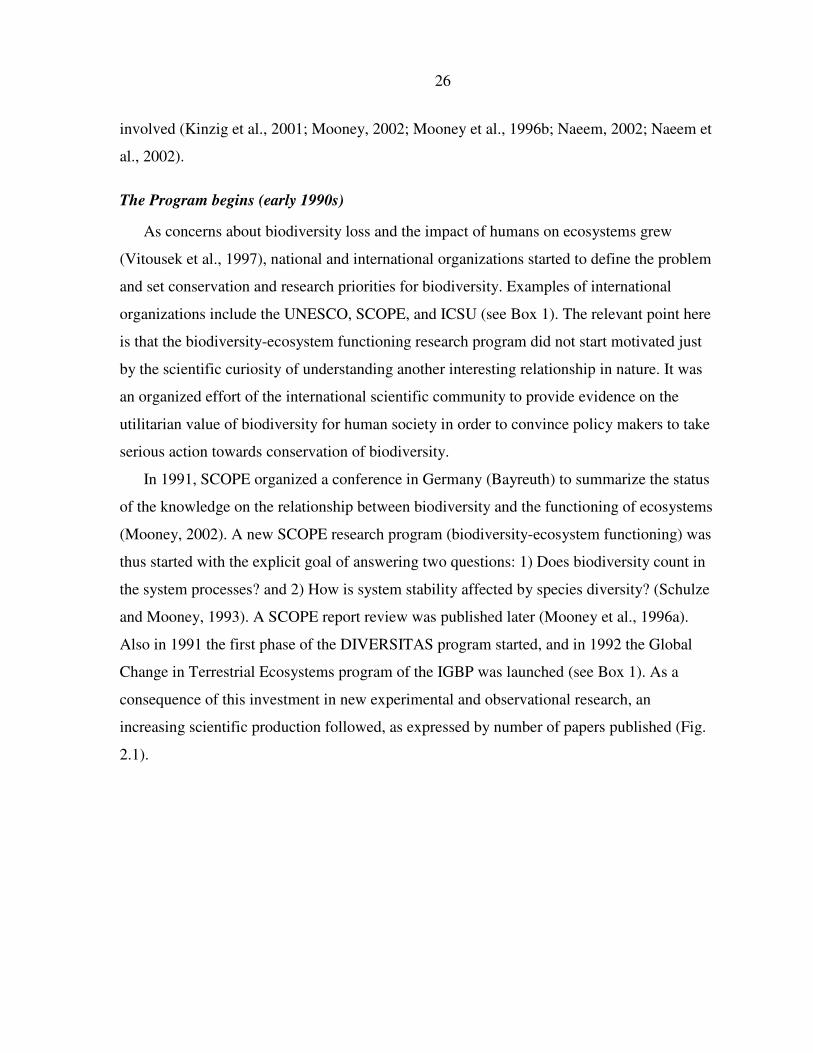
26
involved (Kinzig et al., 2001; Mooney, 2002; Mooney et al., 1996b; Naeem, 2002; Naeem et
al., 2002).
The Program begins (early 1990s)
As concerns about biodiversity loss and the impact of humans on ecosystems grew
(Vitousek et al., 1997), national and international organizations started to define the problem
and set conservation and research priorities for biodiversity. Examples of international
organizations include the UNESCO, SCOPE, and ICSU (see Box 1). The relevant point here
is that the biodiversity-ecosystem functioning research program did not start motivated just
by the scientific curiosity of understanding another interesting relationship in nature. It was
an organized effort of the international scientific community to provide evidence on the
utilitarian value of biodiversity for human society in order to convince policy makers to take
serious action towards conservation of biodiversity.
In 1991, SCOPE organized a conference in Germany (Bayreuth) to summarize the status
of the knowledge on the relationship between biodiversity and the functioning of ecosystems
(Mooney, 2002). A new SCOPE research program (biodiversity-ecosystem functioning) was
thus started with the explicit goal of answering two questions: 1) Does biodiversity count in
the system processes? and 2) How is system stability affected by species diversity? (Schulze
and Mooney, 1993). A SCOPE report review was published later (Mooney et al., 1996a).
Also in 1991 the first phase of the DIVERSITAS program started, and in 1992 the Global
Change in Terrestrial Ecosystems program of the IGBP was launched (see Box 1). As a
consequence of this investment in new experimental and observational research, an
increasing scientific production followed, as expressed by number of papers published (Fig.
2.1).
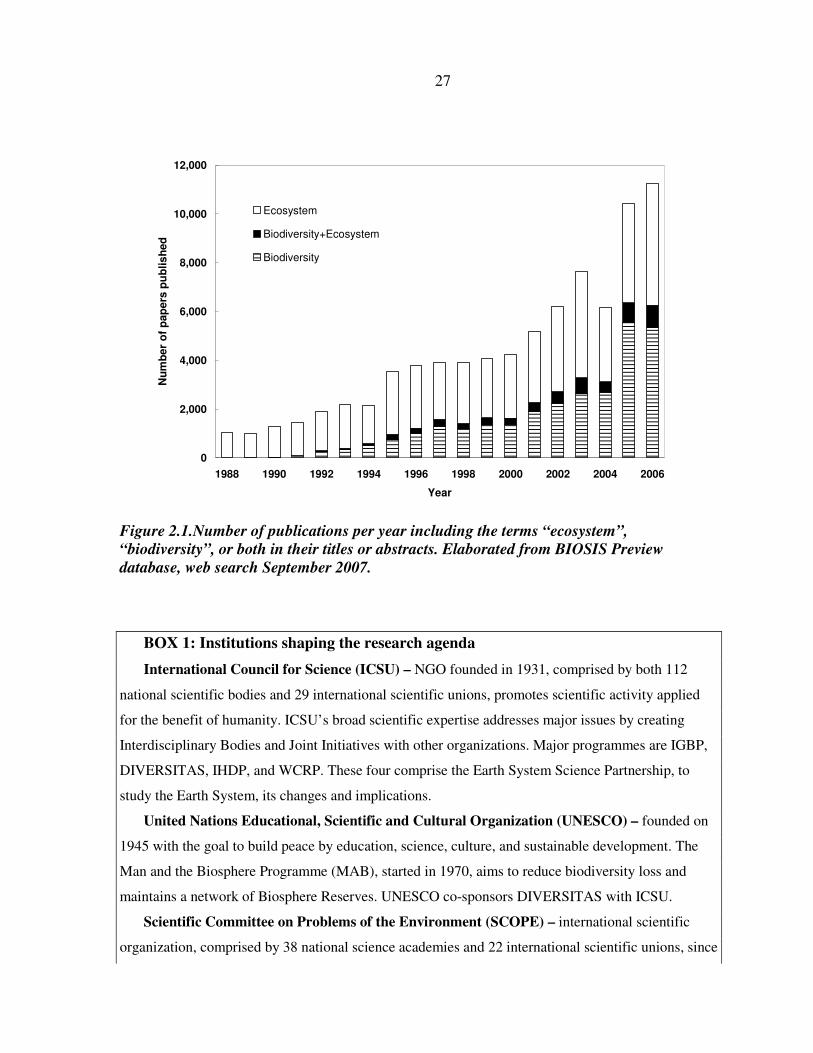
27
0
2,000
4,000
6,000
8,000
10,000
12,000
1988 1990 1992 1994 1996 1998 2000 2002 2004 2006
Year
Nu
mb
er
of
pap
ers
pu
blis
hed
Ecosystem
Biodiversity+Ecosystem
Biodiversity
Figure 2.1.Number of publications per year including the terms “ecosystem”,
“biodiversity”, or both in their titles or abstracts. Elaborated from BIOSIS Preview
database, web search September 2007.
BOX 1: Institutions shaping the research agenda
International Council for Science (ICSU) – NGO founded in 1931, comprised by both 112
national scientific bodies and 29 international scientific unions, promotes scientific activity applied
for the benefit of humanity. ICSU’s broad scientific expertise addresses major issues by creating
Interdisciplinary Bodies and Joint Initiatives with other organizations. Major programmes are IGBP,
DIVERSITAS, IHDP, and WCRP. These four comprise the Earth System Science Partnership, to
study the Earth System, its changes and implications.
United Nations Educational, Scientific and Cultural Organization (UNESCO) – founded on
1945 with the goal to build peace by education, science, culture, and sustainable development. The
Man and the Biosphere Programme (MAB), started in 1970, aims to reduce biodiversity loss and
maintains a network of Biosphere Reserves. UNESCO co-sponsors DIVERSITAS with ICSU.
Scientific Committee on Problems of the Environment (SCOPE) – international scientific
organization, comprised by 38 national science academies and 22 international scientific unions, since
28
1969, sponsored by ISCU. SCOPE develops scientific reviews of environmental issues on three
cluster areas: Managing Societal and Natural Resources, Ecosystem Processes and Biodiversity, and
Health and Environment. The biodiversity-ecosystem functioning program was part of the second
cluster.
International Geosphere Biosphere Programme (IGBP) – one of ICSU’s interdisciplinary
boards to study global change starting in 1987. On of its projects, Global Change in Terrestrial
Ecosystems (GCTE) 1992–03, addressed how global change would affect terrestrial ecosystems and
feedbacks to the climate system. One focus of GCTE was the link between ecosystem functioning,
biodiversity, stability, resilience, and buffering capacity to natural and human perturbations. A new
program, the Global Land Project (GLP) was launched in 2005 co-sponsored by IHDP and IGBP with
the goals of measuring, modeling and understanding the coupled human-environmental system.
DIVERSITAS - joint initiative by SCOPE, UNESCO, ICSU, IUBS, and IUMS, starting in 1991.
It provides an international multi-disciplinary framework to promote integrative biodiversity science,
by synthesis of scientific knowledge, promoting new interdisciplinary research, and communicating
policy implications. In 2003 DIVERSITAS-II defined three core areas: bioDISCOVERY,
ecoSERVICES, and bioSUSTAINABILITY. The three foci of the ecoSERVICES project are
biodiversity-ecosystem functioning research (spatial and temporal scales, microbial diversity, and
“second generation” research), linking ecosystem functioning to ecosystem services, and human
responses to those.
National Science Foundation (NSF) - a USA federal agency created in 1950 to promote the
progress of science; to advance the national health, prosperity, and welfare; and to secure the national
defense. With an annual budget of about $5.92 billion, it funds 20 % of all federally supported basic
research conducted by America's colleges and universities. The Directorate of Biological Sciences,
Division of Environmental Biology, funded much of the biodiversity-ecosystem functioning research.
European Science Foundation (ESF) - association of 75 member organizations (European
national research councils) devoted to scientific research in 30 European countries. Established in
1974, it has coordinated a wide range of pan-European scientific initiatives. LINKECOL, a program
to promote a synthesis between population, community, and ecosystem ecology, funded much of the
biodiversity-ecosystem functioning research between 1999 and 2004.
29
Three main experiments characterize the initial phase of the research program: the
ECOTRON (UK), Cedar Creek (USA), and BIODEPTH (Europe). In the ECOTRON,
Naeem et al. (1994) assembled communities of plants, microorganisms, and animals
(representing trophic levels of decomposers, producers, and consumers) with three different
biodiversity levels (9, 15, and 31 species), in replicated controlled growth chambers, and
observed an increase of plant productivity and community respiration in the more species
rich communities. They explained this positive association between biodiversity and
ecosystem functioning by the mechanism of niche complementarity: diverse communities of
plants have a canopy structure that intercepts more light; therefore, there is more energy for
ecosystem processes.
The second set of experiments was conducted at Cedar Creek, Minnesota, USA, where
Tilman and colleagues established several experiments in grasslands communities. In the first
experiment, they used different nitrogen fertilizer rates to alter the species composition and
diversity of native grasslands, and observed an increase in stability with species richness (and
fertilizer), which they measured as resistance and recovery after a major drought (Tilman and
Downing, 1994). In the second experiment, they assembled communities of native grassland
species with different species richness levels (1 to 24 species) drawing species at random
from a list, and measured an increase in productivity and nutrient use with greater diversity
(Tilman et al., 1996). A similar mechanistic model was used to explain these results: diverse
communities make more complete use of the resource space, increasing the resources
available for ecosystem processes. This experiment also provided evidence to support the
diversity-invasibility hypothesis: species rich communities were less invaded than low
diversity ones (Knops et al., 1999).
The third major experiment was the European BIODEPTH (Biodiversity and Ecological
Processes in Terrestrial Herbaceous Ecosystems). Hector et al (1999) manipulated replicated
artificially assembled grassland communities with varying species richness (1 to 32) at eight
different sites (Silwood and Sheffielf in UK, Sweden, Portugal, Ireland, Greece, Germany,
and Switzerland) and observed a reduction in total plant productivity with decreasing
diversity levels. They explained the results by niche complementarity and positive species
interactions, as well as the sampling effect (see below). These experiments and others
30
provided evidence for a general and positive relationship between species richness and
productivity. All these experiments were featured in prestigious scientific magazines (like
Science and Nature), as well as the media to support the urgent need for biodiversity
preservation. The biodiversity-ecosystem functioning research program was succeeding.
Some experiments looking at other ecosystem processes such as soil organic matter
decomposition fail to provide evidence for a positive relationship of diversity and ecosystem
functioning (e.g., Griffiths et al., 2000). Other studies highlighted the greater contribution of
functional composition rather than species diversity to ecosystem processes (Hooper, 1997;
Tilman et al., 1997b). Because species diversity and functional composition may not
necessarily be correlated, the interpretation of the functional composition effects also became
an issue of debate.
Critical response (late 1990s)
Two main sorts of scientific criticisms challenged the results of the previous experiments:
1) observational studies contradicted the experimental results (e.g. Wardle et al., 1997) and
2) the design of the experiments made the interpretation of results difficult or invalid
(Huston, 1997; Huston et al., 2000). First, most of the high productivity ecosystems in the
world have low species richness, and this contradicted the results of the experiments (Huston
and McBride, 2002). If diversity was positively related with productivity, this association
should be evident in natural ecosystems. One of the central concepts of community ecology
was the hump-backed model of diversity-productivity (Grime, 1973) which predicted that
species numbers would be maximized in environments with intermediate productivity.
Indeed, at low levels of environmental productivity (e.g. poor soils), species diversity in
natural ecosystems is low because few species can survive. Diversity increases as more
resources become available to species to exploit, reaching a maximum at intermediate levels
of productivity. Then diversity declines at higher levels of productivity because dominant
species out-compete others (competitive exclusion). A similar patter is observed with
disturbance (Connell, 1979). From this perspective, critics defended that environmental
conditions are the driver of diversity, and not the other way around. Only when the
environment is controlled the relatively small effects of species composition on productivity
can be found (Huston and McBride, 2002).
31
A similar issue occurred in the diversity-invasibility dimension of the debate: at
geographic scales larger than field level (e.g., landscape, biomes) areas of high native species
diversity were more invaded than areas of low species diversity (Stohlgren et al., 1999),
which contradicted the results of small scale experiments. Areas of high diversity are often
correlated with higher environmental heterogeneity, higher species turnover, nutrient pulses,
and more opportunities for invasive species to become established (Stohlgren et al., 2003).
Second, experiments with randomly assembled plant communities have several “hidden
treatments” confounded with the diversity effect. The most important of these is the
sampling effect, also known as selection probability effect (Huston, 1997; Tilman et al.,
1997a): the probability to include the most productive species increases at higher diversity
levels, thereby the effect of one key species is confounded with the effect of diversity
(Huston and McBride, 2002). To the critics, the sampling effect was not a biological valid
mechanism to explain an increase in productivity with species richness, but an artifact of the
way the experiments were conducted. Other design problems of the first experiments
included quasi replication (low diversity replicates are less represented, and there is more
chance that the most productive individual species are not included) and variance reduction
effects (high diversity replicates are more similar than low diversity replicates, confounding
experimental error with the diversity effect). All these design problems made critics state that
all conclusions about the relationship diversity-ecosystem function based on previous
experiments was invalid (Huston et al., 2000). In reply, Tilman et al. proposed that the
sampling effect was indeed the simplest valid mechanism to explain the relationship. Given
that the nature of the species extinction process it is poorly understood, assuming that the
species loss was random it was a reasonable thing to do (Tilman et al., 1997a). The
interpretation of the role of the sampling effect in biodiversity experiments remained a
contentious issue. The debate “deepened” (Grime, 1997).
“War among ecologists”
The acrimony exploded in 1999, when a panel of scientists reported in “Issues in
Ecology”, an Ecological Society of America (ESA) publication aimed to the general public
and policy makers, that there was scientific evidence that loss of biodiversity impacted
ecosystem functioning by reducing plant productivity, decreasing ecosystem resistance to
32
environmental perturbations, and increasing the variability of soil nitrogen levels, water use,
and pest cycles (Naeem et al., 1999). A group of critics of the biodiversity-ecosystem
functioning experiments wrote a letter to the ESA Bulleting heavily criticizing the Issues in
Ecology report, claiming the authors stated opinion as facts, did not represent one of the two
schools of thought in the debate, and did un-ethically selective citation of literature (Wardle
et al., 2000). This immediately reached the media, with articles like this one in Science: “An
acrimonious dispute has broken out over whether the data on biodiversity are robust enough
to inform public policy. A long-simmering debate among ecologists over the importance of
biodiversity to the health of ecosystems has erupted into a full-blown war. Opposing camps
are dueling over the quality of key experiments, and some are flinging barbs at meetings and
in journals” (Kaiser, 2000). Debate is usually welcomed within the academic community but
when the goal is to inform policy-makers, debate among scientists is viewed as uncertainty
and lack of evidence. No clear message, no actions taken in pro of biodiversity conservation.
The biodiversity-ecosystem functioning was turning into a failure.
Several sociopolitical factors fueled this process. As stated earlier, the biodiversity-
ecosystem functioning research program was intended to inform public policy for
biodiversity conservation. This had a first implication relating to the psychological dimension
of hypothesis testing (Loehle, 1987): scientists have a tendency to seek confirming evidence
(confirmation bias) and usually they have a persistent belief in a theory in spite of contrary
evidence (theory tenacity). These two features can impair scientific progress especially in
research concerning long time scales and complex systems. To a certain extent this may have
influenced both sides of the debate. A second implication relates to funding, given that
biodiversity experiments received considerable grant money. For instance, Tilman’s Cedar
Creek experiment between 1994 and 2007 was awarded US$ 10 million in NSF grants (NSF
awards online database http://www.nsf.gov/awardsearch). Naeem’s ECOTRON cost the UK
Natural Environment Research Council about £ 1 million to build (Kareiva, 1994). The
BIODEPTH project cost the European Commission 2 million euros between 1996 and 1999
(Imperial College, http://www.ic.ac.uk/P1200.htm). Competition from other groups for
funding may have intensified the debate in an effort to garner some of the funds. A third
implication of the direct policy connection is the exposure of primary research projects and
33
their methodology to the media. Probably other heated debates in scientific methodology do
not reach the public arena as much, because the policy implications may not be as relevant.
Conciliation and synthesis
A conference was held in Paris in December 2000 as an attempt to bring everybody to the
table, and reach a consensus on the issues regarding biodiversity-ecosystem functioning. This
“Synthesis Conference” was an effort to reconcile the different viewpoints, and also to
reconcile ecologists and the general public. A synthesis framework came about in part as a
consequence of the same policy implications which caused the acrimony. After the heated
discussion, scientists lost their public credibility, and that was uncomfortable. After the
conference it was celebrated that “the conference was a delight” (Naeem et al., 2002).
“Perhaps it was the rich desserts and the French wine, but there were few signs of acrimony
at the conference” (Hughes and Petchey, 2001). There was a clear effort to reach the public
again showing the scientific consensus among civilized ecologists.
In the conference results from the main experiments were discussed, and new statistical
analyses integrating data from various experiments were conducted. The concepts and terms
had been interpreted in different ways, and at this conference they were better defined,
thereby reducing confusion. Clarification of the potential mechanisms operating in the
experiments and observational studies was a major advance. The conference pointed to new
experiments to test the issues which remained uncertain.
The consensus framework was structured by pointing out the issues that were clear, and
for each of those which questions remained to be answered, so that the framework served as
a guide for future research endeavors. First, it is clear that a large number of species is
required to maintain ecosystem functioning, but whether this is because more rich
communities have some key species that affect ecosystem function or complementary among
various species has a great effects on ecosystem function is still unknown. This provided a
focus for further studies: separating and measuring the effects of these two non-exclusive
mechanisms: the sampling effect and complementarity among species. Whether or not
species extinctions are random is an important future area of inquiry to settle the issue of the
relevance of the sampling effect (Loreau et al., 2001). Furthermore, the selection effect was
also defined as a potential mechanism (see below). Second, greater number of species may be
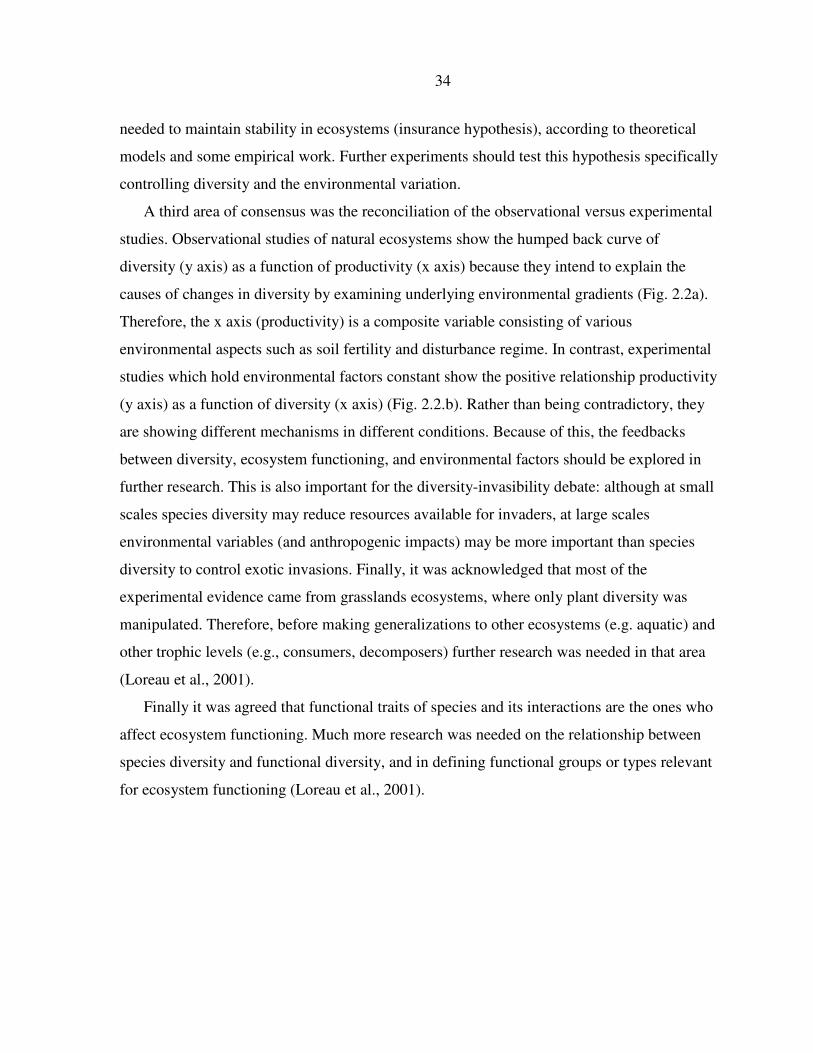
34
needed to maintain stability in ecosystems (insurance hypothesis), according to theoretical
models and some empirical work. Further experiments should test this hypothesis specifically
controlling diversity and the environmental variation.
A third area of consensus was the reconciliation of the observational versus experimental
studies. Observational studies of natural ecosystems show the humped back curve of
diversity (y axis) as a function of productivity (x axis) because they intend to explain the
causes of changes in diversity by examining underlying environmental gradients (Fig. 2.2a).
Therefore, the x axis (productivity) is a composite variable consisting of various
environmental aspects such as soil fertility and disturbance regime. In contrast, experimental
studies which hold environmental factors constant show the positive relationship productivity
(y axis) as a function of diversity (x axis) (Fig. 2.2.b). Rather than being contradictory, they
are showing different mechanisms in different conditions. Because of this, the feedbacks
between diversity, ecosystem functioning, and environmental factors should be explored in
further research. This is also important for the diversity-invasibility debate: although at small
scales species diversity may reduce resources available for invaders, at large scales
environmental variables (and anthropogenic impacts) may be more important than species
diversity to control exotic invasions. Finally, it was acknowledged that most of the
experimental evidence came from grasslands ecosystems, where only plant diversity was
manipulated. Therefore, before making generalizations to other ecosystems (e.g. aquatic) and
other trophic levels (e.g., consumers, decomposers) further research was needed in that area
(Loreau et al., 2001).
Finally it was agreed that functional traits of species and its interactions are the ones who
affect ecosystem functioning. Much more research was needed on the relationship between
species diversity and functional diversity, and in defining functional groups or types relevant
for ecosystem functioning (Loreau et al., 2001).
35
Figure 2.2. a. Diversity as a function of productivity, driven by environmental conditions
across sites. b. Productivity as a function of diversity under constant environmental
conditions. Reproduced from Loreau, Naeem et al. 2001
RECENT WORK IN BIODIVERSITY-ECOSYSTEM FUNCTIONING
Refining the mechanisms
After the synthesis framework, further refining of the mechanisms was elaborated, and
mathematical equations derived to calculate the magnitude of each mechanism. One way of
differentiating mechanisms explaining the biodiversity-ecosystem functioning relationship is
by considering the “biological” effects, i.e., complementarity and selection (Loreau and
Hector 2001). Another way of differentiating mechanisms is by considering community
assembly effects, i.e., whether sampling effect is present (Loreau, Naeem et al. 2001).
Complementarity involves niche partitioning and/or facilitation. Species with complementary
traits can use different resources or niches, providing the community as a whole access to
more resources and making it more productive than its constituent species individually (niche
partitioning). Positive interactions among species can also increase the performance of the
community (facilitation). It is a non-competitive species interaction (any interaction that is
not competition). Selection processes such as interspecific competitive interactions cause one
36
species to dominate the community (higher relative abundance). It can be positive or negative
depending whether the dominant species is positively or negatively associated with
ecosystem functioning (e.g., monoculture yields are high or low). The term does not imply
any connection with natural selection (Stachowicz et al., 2007).
Sampling effect (also called sampling model, sampling hypothesis, selection-probability
effect) occurs in randomly assembled communities because high diversity communities are
more likely to contain a species (or a set of species) that contributes significantly to observed
levels of ecosystem functioning. For instance, the probability of including a highly
productive species in the community increases as the number of species increases. Note that
sampling effect can operate both for selection and complementarity mechanisms, although
most often is identified with selection. In a high diverse community, the probability of having
two complementary species (e.g. legumes and grasses) also increases with diversity. Early
definitions of the sampling effect sometimes combined/confounded it with the selection
effect.
The selection effect can be partitioned also in two effects: dominance and trait-dependent
complementarity (Fox, 2005). When all species have the same productivity in polyculture as
in monoculture but species with higher monoculture yields are more competitive and
dominate the mixture, the dominance effect equals the selection effect. However, when
species that are more productive in monoculture overyield in polyculture but do not displace
other species, some of the selection effect involves trait-dependent complementarity, i.e., the
portion of the complementarity effect that is correlated (covaries) with the trait of interest.
Fox (2005) relabeled the complementarity term of Loreau and Hector (2001) as trait-
independent complementarity, i.e., the portion of the complementarity effect that is not
correlated with the trait of interest, but is instead shared between all species. Another
different partitioning of mechanisms was also formalized later (Fox, 2006) , although it has
not had considerable attention in empirical work.
Several new experiments and re-analyses of old experiments have focused on measuring
the magnitude of complementarity versus selection effect. As a general trend,
complementarity increases over time, while selection is more variable (Cardinale et al., 2007;
Fargione et al., 2007; Loreau and Hector, 2001).
37
Second generation biodiversity experiments
As a consequence of the synthesis several second generation biodiversity experiments
were started to address the issues raised in the previous years of the debate. One example is
the Jena Project in Germany (Roscher et al., 2007; Temperton et al., 2007), another one is the
forest biodiversity mega-project in Sabah, Malaysia (Scherer-Lorenzen et al., 2005). These
experiments were many and diverse, and usually have some of the following characteristics:
1) the treatments included as much monocultures as possible, in order to make comparisons
of overyielding, complementarity, and selection, 2) they had a balanced design to allow
contrasts for plots with and without certain species or groups of species, 3) they were
designed with the objective of testing specific mechanisms directly beyond the general
overyielding in a specific function, 4) they extended for longer time periods, and larger
spatial scales, 5) experimental design was thoroughly evaluated including replications, and
local environmental control, 6) they consider more trophic levels (producers, consumers,
predators).
Balancing the synthesis
As a follow up of the Synthesis Conference, a committee of scientists from the
Ecological Society of America (ESA) published a review in Ecological Monographs titled:
“Effects of biodiversity on ecosystem functioning: A consensus of current knowledge”
(Hooper et al., 2005). Like every other paper in the literature this report started describing the
threats that biodiversity loss and environmental degradation pose to society, and finished
recommending to policy makers to set biodiversity as a priority for action. The tone of this
report was moderate and balanced though, discussing uncertainties and contradictions present
in the literature avoiding generalizations, and describing the many factors other than diversity
influencing ecosystem functions. The main points stressed throughout the report were: 1)
functional composition is more important than species richness in affecting ecosystem
functioning, 2) abiotic controls (climate, resources, disturbance) interact with biodiversity to
influence ecosystem properties, and the feedbacks between biotic and abiotic controls are
central to understanding ecosystem functioning, and 3) diversity effects and the underlying
mechanisms can differ among ecosystem properties and ecosystem types. Diversity may have
38
no effect on some ecosystem processes (e.g., when multiple species carry out similar
functional roles or abiotic conditions primarily control the process) but as larger spatial and
temporal scales are considered, greater diversity is needed to maximize functioning. With
less certainty: complementarity of resource use by certain combinations of species can
increase productivity, species richness decreases exotic species invasion under similar
environmental conditions, usually not across environments, and species diversity can
stabilize ecosystem process in response to disturbances and variation in abiotic conditions.
Finally, the uncertainties that need further research include: the relationships between
taxonomic diversity, functional diversity, and community structure, multiple trophic levels
response to varying composition and diversity of consumer organisms, the need of long-term
experiments to assess temporal stability, and perturbations to assess response to and recovery
from disturbances.
Quantitative synthesis
One of the most recent advances where the meta-analyses of the more than 150
biodiversity experiments conducted in terrestrial and marine ecosystems (Balvanera et al.,
2006; Cardinale et al., 2006; Cardinale et al., 2007; Stachowicz et al., 2007). These studies
using some standardized measure of response of ecosystem functions to changes in diversity,
found that on average the effect of biodiversity on ecosystem processes was positive,
although there was variation between studies. Biodiversity effects were weaker in field
versus microcosms experiments (e.g., pots, bottles), stronger at the community level (e.g.,
polyculture biomass) than ecosystem level (e.g., soil nutrients) and negative at population
level (e.g., species biomass). The effects on stability measures were stronger than the ones on
performance measures in the review of marine ecosystems, but as strong in the first review
which included mainly grasslands ecosystems. Although in most cases diverse communities
performed better than the average of monocultures (i.e., overyielding was the norm), in very
few cases diverse communities were better than the best monoculture (i.e., transgressive
overyielding was infrequent). On average there was no transgressive overyielding across
trophic levels and ecosystems, although 12 % of plant experiments and 25 % of marine
experiments reported transgressive overyielding. A critical finding was that overyielding and
the probability of transgressive overyielding increased in experiments that ran for longer
39
timeframes because complementarity effects among species increased with time. Since most
experiments have been short term, and transgressive overyielding in plant communities may
take 5 years to be observed, experiments may have underestimated it.
Other issues
Experiments have looked at dimensions of diversity other than species richness, like
evenness, and diversity indices (e.g., Simpson’s) and found that richness alone does not
capture the variation in diversity (Wilsey et al., 2005). When evenness and richness were
manipulated in plant experiments, evenness did not change the relationship richness–
productivity (Wilsey and Polley, 2004), but high evenness was positively associated with
controlling invasions (Losure et al., 2007). A new methodological approach to disentangle
richness and evenness effects on productivity has shown that evenness and species
interactions consistently affect productivity across multiple sites (Kirwan et al., 2007).
There have also been advances in the measurement of functional diversity. Rather than
defining functional groups a priori, multivariate approaches that summarize species traits
data are being used, and then comparing them using cluster techniques, distances measure
between species in trait space, dendrograms, and species abundances. These techniques
promise a better understanding of the relationship between species diversity, functional
diversity, and ecosystem functioning (Petchey and Gaston, 2006). A recent experiment
documented the role of plant genotypic diversity in plant productivity and abundance of
arthropods (Crutsinger et al., 2006) expanding the boundaries of biodiversity –ecosystem
functioning studies to the often overlooked genetic dimension.
A concept that emerged in recent years was multifunctionality: ecosystems perform
several processes simultaneously and are managed for various ecosystem services. Different
species often influence different processes, so focusing on one single process like plant
productivity provides an incomplete picture. When multiple functions are considered
together, higher levels of diversity are needed to maximize ecosystem performance. Several
studies confirm this mechanism of multivariate complementarity (Hector et al., 2007;
Stachowicz et al., 2007).
40
DISCUSSION: INTERPRETATIONS OF THE BIODIVERSITY-ECOSYSTEM
FUNCTIONING DEBATE
The biodiversity-ecosystem functioning debate is an extremely interesting case study for
various disciplines. In this section we provide a brief account of some interpretations of the
debate from the perspectives of environmental policy and philosophy of ecology. Finally, we
suggest an original interpretation of the debate from the perspective of agriculture and
agroecology.
Success or failure?
Srivastava and Vellend (2005) questioned small spatial scales of experiments, and the
single focus on one variable, and trophic system, and concluded that biodiversity-ecosystem
functioning was irrelevant for conservation ecology. In a similar way, a “Review for policy
makers” of the debate (Thompson and Starzomski, 2007) concluded that results were
inconsistent regarding the role of biodiversity in productivity and stability, and the
relationships changed with scale, while had failed to address critical issues like the loss of
rare species or the identification of keystone species. Furthermore, they state that the debate
may affect the positive value society places on biodiversity, and using this research to justify
biodiversity protection is very difficult. Addressing these criticisms various reviews assigned
to each ecosystem function or process an overall ecosystem service and emphasized that
there was clear evidence that biodiversity had positive effects on most of these services.
Indeed, the new research agenda from DIVERSITAS, for instance, focuses on how
biodiversity, ecosystem function, and ecosystem services are related. Future work on this
area may provide direct linkages between ecological research and environmental policy that
were absent in the earlier stages of the debate.
The great irony of the process is that it started with the goal to provide evidence to policy
makers for the conservation of biodiversity, but maybe rushed to generalizations, and after a
heated debate policy makers may have became more skeptical about the utilitarian value of
biodiversity (Thompson and Starzomski, 2007). It should be clear, though, that the
dependence of ecosystem services on biodiversity was never a debated issue. The contented
issues were the mechanisms, and what was the role of species, functional groups, and traits
41
on ecosystem functions. The program indeed provided scientific evidence of how different
ecosystem functions depend on biodiversity. And all quantitative and qualitative reviews
agree with in the main conclusions: there is a positive role of biodiversity on ecosystem
functioning and therefore ecosystem services with utilitarian value. Furthermore, regardless
of the utilitarian value, there are other ethical, cultural, and aesthetic reasons for slowing the
rate biodiversity loss due to human activities (Hughes and Petchey, 2001).
A new paradigm for ecology?
The biodiversity-ecosystem functioning debate is an interesting case study in the history
of science, and has been interpreted as a process of scientific revolution sensu Kuhn (1970),
where the previous paradigm of community ecology was challenged by new evidence and a
alternative hypotheses were articulated into a new paradigm (Naeem, 2002). Naeem also
suggested here a dialectic evolution of ideas, where the central thesis of community ecology
(i.e., biodiversity is a consequence of evolutionary adaptation of individuals and populations
to variable environmental conditions) was contradicted by the antithesis that biodiversity
determines ecosystem functioning. This dialectic thesis-antithesis evolution will eventually
lead to a new synthesis between ecosystem and community ecology. Indeed, some models
have started to be created looking at the feedback between resource supply, species richness,
resource use, and biomass production (Gross and Cardinale, 2007). These two branches of
ecology had advanced separately and without interacting much, and probably the most
important success of the program was bringing them together.
Ecology, agriculture, and Darwin’s legacy
In The Origin of Species Charles Darwin (1859) wrote: “it has been experimentally
proved that if a plot of ground be sown with one species of grass, and a similar plot be sown
with distinct genera of grasses, a greater number of plants and a greater weight of dry
herbage can thus be raised.” For this statement, Darwin was considered the father of the
biodiversity-ecosystem functioning debate (Hector and Hooper, 2002). Interestingly enough,
Darwin pointed to a “sown” plot rather than native grasslands. Furthermore, in the next line
Darwin continues: “The same has been found to hold good when first one variety and then
several mixed varieties of wheat have been sown on equal spaces of ground.” Darwin was
42
referring to an agriculture situation, rather than a natural ecological situation, more precisely,
to an intercropping experiment. As he did throughout the book starting with “variation under
domestication” and then moving to “variation under nature”, Darwin draws many examples
from familiar agriculture situations.
Perhaps one of the most interesting aspects of the biodiversity-ecosystem functioning
debate was the interplay between Ecology and Agriculture. Although both fields have
considerable overlapping, for instance, in ecosystem restoration, crop ecology, and
agroecology, the research traditions, mindsets, and focus of interest (one could even say
paradigms) are very different. A contrast of both disciplines is out of the scope of this
chapter, and can be found in the vast agroecology literature (Altieri, 1987; Gliessman, 1998;
Jackson, 1985; Vandermeer, 1989) but the main differences could be drawn from a
simplified sketch. In Andy Hector’s words ecologists are “people who can work with partial
differential equations who can also climb up a 70-metre rainforest tree to collect pollen”
(2007, Nature 448:7150, p. xi). An agronomist in contrast has been defined as “confronter of
world hunger” and “keeper of the land” in a major recruiting campaign at a leading
agriculture university (see www.imanagronomist.net). Although both fields are concerned
with protecting the environment, the methodological approaches are different. Agriculture
systems are normative systems: they have goals, and they must perform certain functions
(Vandermeer et al., 2002). Furthermore, ecologists are interested in descriptive and
explanatory models of natural variation, whereas agronomists are interested in management
decisions to maximize functions.
Biodiversity-ecosystem functioning research had the potential to inform Agriculture in
various ways. Sustainable agriculture systems must be productive and stable, control
invasions of pests and diseases, and recycle nutrients efficiently among other ecosystem
functions. Modern agriculture systems usually have very low planned and associated
biodiversity, being the annual grain monocultures an extreme situation. It is not a novel idea
that if diversity had benefits in terms of ecosystem functions, agriculture should build on that.
In fact, several publications out of biodiversity-ecosystem functioning research suggested
recommendations to agriculture systems, particularly for European grasslands (Minns et al.,
2001), forage production and grazing systems (Sanderson et al., 2004; Tracy and Sanderson,
43
2004a; Tracy and Sanderson, 2004b; Tracy and Faulkner, 2006), and bio-fuel oriented
systems (Tilman et al., 2006a).
On the other hand, it can also be said that the agriculture perspective played a central role
in the biodiversity-ecosystem functioning program. One could even go deeper, and interpret
the whole debate as a dialogue between these two contrasting perspectives. Ecologists
initially neglected the literature on intercropping and crop mixtures (Wardle et al., 2000).
Intercropping literature showed that diverse mixtures of few species usually are more
productive than the average of the species grown in monoculture, but not greater than the
most productive species in monoculture (non transgressive overyielding), with the exception
of legume–grass mixtures (Trenbath, 1974). The interest of agriculture researchers is to
achieve transgressive overyielding and therefore ecological research celebrating the role of
diversity in non transgressive overyielding in randomly assembled communities was called
into question (Garnier et al., 1997). The first reaction from ecologists was to reveal their
assumptions: agriculture systems fall in the low end of the diversity range, and
agroecosystems usually operate at higher nutrient concentrations (e.g., soil nitrogen) than
natural systems, therefore agroecology literature was considered irrelevant (Naeem, 2000).
Furthermore, the hottest area of debate, i.e., the interpretation of the sampling effect as an
artifact of the experiment (Huston, 1997) or as an assembly mechanism (Tilman et al.,
1997a), was actually a debate between the agricultural and ecological perspectives. Farmers
do not plant a random assortment of crops in their fields, so experiments where the sampling
effect is operating have little use if any for farmers. In contrast, at least in theory extinctions
in natural ecosystems could be considered random, and therefore the biodiversity
experiments are informative.
While much of the heat of the debate may have come form the contrasting paradigms of
agriculture and ecology, the dialogue between the two contributed to solving many issues in
the debate. Indeed, the use of intercropping indices like Relative Yield Totals to understand
overyielding and the focus on proper statistical design of experiments (true replication of
treatments and local control) can be seen as two central contributions from Agriculture to the
debate.
44
Although the hypothesis that the agriculture perspective was central in articulating the
debate cannot be readily confirmed from the institutional affiliation of most authors involved
in the discussions, some insights are suggestive. Michael A. Huston, the leading voice of the
criticisms of the interpretations of the biodiversity experiments, grew up in Iowa and was
very aware of agriculture (Krause, 1996). John Vandermeer, a co-author in the critical
response to the BIODEPTH first results, is the author of most of intercropping theory. Both
authors contributed in the synthesis conference and the publications that followed.
The dialogue between agriculture and ecology during the debate certainly went both
ways, and that was what made it a fertile debate. Introducing the concepts of transgressive
and non transgressive overyielding for instance, was important, but as much important was to
point out that complementarity among species may exist and exert a strong effect in absence
of transgressive overyielding (Loreau, 1998). Both fields expanded the understanding of
reality in this process. Hopefully the legacy of Darwin will continue to provide insight in the
much needed dialogue between Ecology and Agriculture. “As has always been my practice,
let us seek light on this head from our domestic productions. We shall here find something
analogous”.
CONCLUSION
Several lessons may be learned from the history of the biodiversity-ecosystem
functioning debate about how Science works and the interplay between Science and Policy.
A central lesson is that considering any research project as a linear and simple process of
hypothesis testing based on logic and empirical evidence is a naive and incomplete picture of
Science. Any research project is immersed in several concentric contextual spheres: a
disciplinary context, a scientific paradigm, an institutional framework, and a socio-political
context. All of these influence the evolution of scientific inquiry, and are relevant to
understand the scientific discourse.
Scientific debates may become heated and passionate. Consensus and scientific progress
can occur by focusing on clarifying definitions, making methodological and conceptual
assumptions explicit, and embracing a perspective that help transcending the disciplinary
boundaries and blindness. In the case of the biodiversity-ecosystem functioning debate, the
dialogues between the disciplines of ecology and agriculture, and between community and

45
ecosystem ecology have been and will continue to be essential for advancing towards a
strong scientific basis for policy decisions in biodiversity conservation and sustainability.
46
CHAPTER III. CROP SPECIES DIVERSITY AFFECTS PRODUCTIVITY AND
WEED SUPPRESSION IN PERENNIAL HERBACEOUS POLYCULTURES UNDER
TWO MANAGEMENT STRATEGIES
A paper published in Crop Science (2008) 48:331-342
Valentín D. Picasso1, E. Charles Brummer2, Matt Liebman3,
Philip M. Dixon4, and Brian J. Wilsey5
ABSTRACT
Species diversity can increase natural grasslands productivity but the effect of diversity in
agricultural systems is not well understood. Our objective was to measure the effects of
species composition, species richness, and harvest management on crop and weed biomass in
perennial herbaceous polycultures. In 2003, 49 combinations of seven species (legumes, C3-,
and C4-grasses) including all monocultures and selected 2 to 6 species polycultures were
sown in small plots at two Iowa, USA locations in a replicated field design. Plots were split
in half and managed with either one or three harvests in each of 2004 and 2005. Biomass
increased log-linearly with species richness in all location-management environments and the
response was not different between managements. Polycultures outyielded monocultures on
average by 73 %. The most productive species in monoculture for each management best
explained the variation in biomass productivity. The biomass of plots containing this species
did not increase with richness in most environments but biomass of plots without this species
increased log-linearly in all cases. Weed biomass decreased exponentially with richness in all
environments. On average, increasing species richness in perennial herbaceous polycultures
increased productivity and weed suppression, but well-adapted species produced well
regardless of richness.
1 PhD candidate in Sustainable Agriculture, Iowa State University, senior author 2 Professor in Forage and Biomass Crop Breeding, Center for Applied Genetic Technologies, Crop and Soil Sciences Department, University of Georgia 3 Professor in Agronomy, Agronomy Department, Iowa State University 4 Professor in Statistics, Statistics Department, Iowa State University 5 Associate Professor in Ecology, Ecology, Evolution and Organismal Biology Department, Iowa State University
47
INTRODUCTION
Diverse multispecies agroecosystems have been proposed as a viable alternative to
sustain agriculture productivity in the near future (Kirschenmann, 2007). Perennial
herbaceous polycultures are mixtures of perennial crops grown for biomass, forage, or food
production. Such mixtures can produce agronomic and environmental benefits derived from
perennial cover and species diversity (Jackson, 2002). Relative to annual crop species,
perennial crops can produce more ground cover, thereby reducing soil erosion (Pimentel et
al., 1987); minimize nutrient leaching (Dinnes et al., 2002); sequester more carbon in soils
(Freibauer et al., 2004); and provide continuous habitat for wildlife (Entz et al., 2002).
Mixtures of species in intercrops or polycultures have the potential to improve the
performance of a cropping system in terms of yield, nutrient cycling efficiency, weed
suppression, and other pests control (Holland and Brummer, 1999; Liebman, 1995;
Vandermeer et al., 2002). Perennial herbaceous polycultures are commonly used in forage
production, especially as legume-grass mixtures (Barnes and Collins, 2003). Mixing
legumes with cool-or warm-season grasses can improve forage yield, nutritive value, stand
longevity, and seasonal distribution of forage compared to grass monocultures, including
those fertilized with nitrogen (George et al., 1995; Sleugh et al., 2000). Perennial grain
production and bioenergy are two additional uses of perennial herbaceous polycultures that
have been proposed. Perennial grain crops for human food or animal feed are being
developed in the USA (Cox et al., 2002; DeHaan et al., 2005) and elsewhere (Sacks et al.,
2003; Weik et al., 2002a). Finally, with the increased interest in bioenergy, perennial
polycultures offer a low-input, less polluting, and more efficient alternative to annual
monocultures (Tilman et al., 2006a).
The contribution of plant species diversity to productivity and other ecosystem functions
is a controversial issue in ecology (Loreau et al., 2001). Species diversity refers to the
number of species present in an area (i.e. richness) and their relative abundance (i.e.
evenness), and most studies use species richness as a proxy for diversity. The current
consensus among ecologists is that ecosystem functions are influenced by individual species’
traits, complementarity among them, and environmental factors (Hooper et al., 2005).
Although increasing diversity can have a range of effects on ecological processes, depending
48
on species composition and environmental context, diversity can increase productivity
because of: a) the major effect of one or few very productive species (Huston et al., 2000); b)
positive interactions among species due to complementarity or facilitation (Tilman et al.,
2006b); and c) a combination of both (Loreau and Hector, 2001). In most experiments with
randomly assembled plant communities from natural grasslands, plots with greater species
diversity tend to out-yield plots with low diversity (Hector et al., 1999; Tilman et al., 2006b).
However, diversity may not change ecosystem functions that are controlled primarily by
abiotic factors or by the dominance of a single species (Hooper et al., 2005). When
environmental factors are held constant, increasing species richness generally decreases
community susceptibility to invasion by weeds or other pests, because fewer resources are
available to invaders and because species that are strongly competitive or that offer biotic
control of a prospective invader are more likely to be included (Knops et al., 1999). Diversity
may also increase ecosystem stability by reducing variability in response to environmental
fluctuations and increasing resistance and resilience to perturbations (Loreau et al., 2002).
In agriculture, research on forage crop mixtures and on intercrops has focused on the role
of diversity in productivity and other agronomic variables. The effect of diversity on biomass
productivity depends on the particular system, species, and processes considered (Sanderson
et al., 2004; Trenbath, 1974). Mixtures of forages have received considerable attention
because domesticated pastures and hay fields often are seeded with multiple species and
natural grazing lands contain a diversity of species. A review of the literature on forage
mixture experiments shows that productivity can be maximized at either low or high
diversity, but complex mixtures (i.e. mixtures with more than 2 species) can maximize more
ecosystem functions at the same time, e.g., temporal distribution of production, persistence,
resistance to invasion, tolerance to fluctuating environmental conditions, and positive
impacts on water quality (Sanderson et al., 2004). Experiments using management strategies
such as cattle grazing instead of clipping indicate that complex mixtures comprising grasses,
legumes, and composites are more productive in dry years, and have less weed invasion than
simple mixtures (Sanderson et al., 2005).
Most ecological research modeling the relationship between diversity and ecosystem
function cannot be extrapolated directly to agriculture. First, ecologists typically use a
49
relatively large number of native species in randomly assembled communities, without
including “true replications” (sensu Huston and McBride, 2002) of the same species
combinations in their experimental design. Second, the research is often conducted in low
fertility soils and with a single management scheme, i.e., one-time biomass harvest (see for
example Tilman et al., 1996). Finally, the experiments usually include just a few dominant
species, which comprise most species in agriculture and which can have major effects on
ecosystem functions (Hooper, 1997). In contrast, most agricultural research considers only a
subset of mixtures of well-adapted species (Soder et al., 2007), and consequently does not
provide a range of species richness to fit a model of productivity-richness.
Our objective was to measure the effect of species composition, species richness, and
harvest management on aboveground crop and weed biomass in perennial herbaceous
polycultures in fertile agricultural soils in central Iowa, USA. We tested the hypotheses that:
a) crop biomass productivity increases with increasing species richness; b) weed biomass is
reduced with increasing species richness; c) the presence or absence of certain species
changes the slope of the regression of biomass production on species richness; and d) harvest
management changes the slope of the regression of biomass production on species richness.
Our intent was to bridge the gap between agronomic and ecological experiments by
conducting the study under agricultural conditions (i.e., well adapted species grown on fertile
soils) using true replication and a set of mixtures large enough to model the relationship
between diversity and ecosystem function.
50
MATERIALS AND METHODS
Experimental design
Eight perennial species from four functional groups were included in the experiment
(Table 3.1): legumes (alfalfa, [Medicago sativa L.], white clover [Trifolium repens L.],
Illinois bundleflower [Desmanthus illinoensis (Michx.) MacM. ex B.L. Robins. & Fern.]),
cool-season grasses (orchardgrass [Dactylis glomerata L.] and intermediate wheatgrass
[Thinopyrum intermedium (Host) Barkworth & D.R. Dewey]), warm-season grasses
(switchgrass [Panicum virgatum L.] and eastern gamagrass [Tripsacum dactyloides (L.) L.]),
and a composite (Maximilian sunflower [Helianthus maximiliani Schrad.]). These species
were chosen because they are widely sown forage and biomass species or, in some cases, are
potential perennial grain crops (Cox et al., 2006). Within functional groups, the species
possess different traits that give rise to divergent phenotypes (e.g., depth of rooting or
spreading vs. bunch-type growth).
We assembled 52 plant community entries (i.e., treatments), including all monocultures
(8 entries) and certain polycultures of two (19 entries), three (13 entries), four (7 entries), six
(3 entries), and eight species (1 entry); an unseeded plot was also included for weed biomass
comparisons. Maximilian sunflower was poorly adapted and did not survive well, so the
three entries with this species were dropped from all analyses (one monoculture and two
polycultures with four and eight species). Table 3.2 shows the 49 entries considered in the
analyses. For all levels of species richness some entries included each individual species and
other entries did not. We included at least one legume species in all plots except for non-
legume monocultures and two-species combinations of grasses. The same individual grasses
and grass mixtures were included with each of the three legumes. Each entry was replicated
three times in a 12 by 13 lattice design at two locations in Iowa, USA: the ISU Agronomy
and Agricultural Engineering Research Farm, east of Boone, Boone Co., IA, with a Nicollet
loam soil (fine-loamy, mixed, superactive, mesic Aquic Hapludolls) and the ISU Hinds
Research Farm, north of Ames, Story Co., IA, with a Spillville loam soil (fine-loamy, mixed,
superactive, mesic Cumulic Hapludolls). The Boone site had a long-term history of forage
breeding nurseries (primarily alfalfa, birdsfoot trefoil, white clover, and orchardgrass) in a
51
seven year rotation with corn, soybean, and oat, while the Ames site was previously in row
crops (corn, soybean, and oat experiments).
The entire plot area was tilled before planting in spring 2003. Seed density was based on
the recommended seeding rates for monoculture stands (Barnhart, 1999; Piper and Pimm,
2002) corrected for germination percentage (Table 3.1). Seed density for species in mixtures
was reduced proportionally to the number of species in the mix (e.g., a two-species mix
included half of the seeds of each monoculture). The experiment was planted on 18 May
2003 in Ames and 21 May 2003 in Boone. Seeds were drilled into 4-m by 3-m plots
consisting of 20 rows spaced 0.15-m apart. Plots were separated by 1.5-m borders planted
with tall fescue (Festuca arundinacea L.) managed as turfgrass. No fertilizer or lime was
applied. Soil samples were taken on 1 July (Boone) and 2 July (Ames) 2003. Six soil cores
0.15 m deep per plot were sampled from 5 plots in each replication and location, and
analyzed in the ISU Agronomy Soil Testing Lab. Analysis for Boone was 42 ± 5 mg.kg-1 P,
143 ± 14 mg.kg-1 K, 11.3 ± 1.9 mg.kg-1 N-NO3, and 4.1 ± 0.4 mg.kg-1 N-NH4, and for Ames
82 ± 5 mg.kg-1 P, 157 ± 14 mg.kg-1 K, 14.7 ± 1.9 mg.kg-1 N-NO3, and 6.2 ± 0.4 mg.kg-1 N-
NH4.
Plots were mowed on 18 June and 12 Sept. 2003 in Boone, and on 20 June and 13 Sept.
2003 in Ames, to a 0.15-m height to control weeds; biomass was not measured or removed.
In October 2003, we measured plant establishment by counting the number of plants of each
species present along a 1-m transect per plot. Eastern gamagrass was reseeded by hand in
April 2004, because no plants were found in 2003.
In 2004, each plot was split in half to form two 2-m x 3-m sub-plots that were allocated
to either a three harvest management, simulating a hay system with removal of all biomass,
or to a one harvest management, simulating a perennial grain system with only seed biomass
of selected species being removed. The same allocations were used in 2005 as well. Plots
were machine clipped with a flail-type harvester (Carter Mfg., Brookston, IN) equipped with
an electronic weigh system. A single 1-m wide by 3-m long strip was harvested for biomass
through the center of each small plot. The adjacent 50-cm strips on either side of the
measured area were cut immediately after data collection so that all forage was clipped to
ground level. In the three harvest management the clipped material was removed from the
52
plot area while in the one harvest management it was not. These two contrasting
managements allow us to compare a forage system where all biomass is removed (three
harvests) with a perennial grain crop system, where most nutrients remain on the plots (one
harvest).
Plots in the hay management were harvested on 26 May, 13 July, and 13 Sept. 2004 and
25 May, 8 July, and 22 Aug. 2005 in Boone, and on 28 May, 15 July, and 16 Sept. 2004 and
3 June, 27 July, and 15 Sept. 2005 in Ames. In the grain management, the reproductive
structures of the four species with the highest seed yield and most easily harvested seeds
(Illinois bundleflower, orchardgrass, intermediate wheatgrass, and switchgrass) were hand
harvested from the entire plot area as each species matured, dried, weighed, and added to the
total plot biomass. Although some seed was produced by alfalfa, pollinators were infrequent
in the plots and the seed yield was minimal. Biomass on these plots was harvested once at the
end of the growing season, on 8 Nov. 2004 and 4 Oct. 2005 in Boone, and 9 Nov. 2004 and
27 Oct. 2005 in Ames.
Before each harvest, biomass was sampled by clipping two 0.09-m2 quadrats per plot.
Samples were weighed fresh, species were identified and sorted in the laboratory, dried, and
dry mass was recorded. The dry matter percentage of the samples and the fresh weight of the
machine harvested strips were used to calculate total biomass dry weight per square meter.
Relative proportion of each species was also calculated and used to differentiate biomass
productivity of the seeded species versus weeds. Due to field labor constraints, samples were
not collected immediately before the third harvest in the three-harvest management in 2004
at Ames although machine harvest was conducted. Therefore, because data on the relative
proportion of each species and of weeds are missing for this harvest the data were dropped
from the analysis and the total yield for the hay management in Ames, 2004 comprised only
the first two harvests.
The dominant species in each plot was defined as the seeded species with maximum
biomass production in the plot. The Berger-Parker dominance index, which represents the
proportion of whole plot biomass produced by the dominant species, was calculated for each
plot (Wilsey and Polley, 2004).Values of the dominance index close to one indicate
communities that are dominated by one single species.
53
In this paper, “biomass of seeded species” refers to aboveground plant biomass of the
species deliberately seeded into the plot; “biomass of cultivated weeds” refers to seeded
species that occurred in plots where they were not intended, either because they were in the
soil seed-bank, or seeds were carried from adjacent plots by the wind, or in few cases the
planter; “biomass of wild weeds” refers to species outside the seeded list. We define
“biomass of cultivated species” as the sum of the biomass of seeded species plus the biomass
of cultivated weeds; “weed biomass” is the sum of biomass of cultivated and wild weeds; and
“total biomass” of a plot comprises biomass of seeded species plus weed biomass. Although
crop species diversity comprises species richness and evenness, in this experiment we
manipulated only crop species richness as a proxy for crop diversity.
Data analysis
To determine differences among entries and relevant interactions, an overall analysis
of variance for biomass was performed including location, management, year, and species
combinations as fixed effects and replication and block within replications as random effects.
If interaction effects were significant, further analyses by location, management, or year were
conducted. The yield of monoculture plots was separated using Fisher’s protected least
significant difference (LSD) with α=0.05.
A series of nine linear models of biomass of seeded species as the dependent variable
and seeded species richness as the independent variable and transformations of each variable
using natural logarithm and inverse functions were compared using R2 and Akaike’s
Information Criterion (AIC) statistics (data not shown). Biomass of seeded species as a
function of natural logarithm of seeded species richness was the best model using this
criterion and was used in all further analyses. The linear effect of seeded species richness on
seeded biomass, cultivated biomass, weed biomass, and total biomass was tested with
contrasts.
To determine the relative importance of the presence or absence of a single species
and the importance of seeded species richness on the biomass of seeded species, we used a
model selection procedure as described by Deutschman (2001). Several mixed models were
constructed using biomass of seeded species as the dependent variable, with entries nested
54
within the following explanatory variables, which were considered to be fixed effects: (1) the
presence or absence of each species individually, (2) the natural logarithm of seeded species
richness, (3) both the natural logarithm of seeded species richness and the presence or
absence of the single species that individually best explained the variation in biomass, and
(4) both variables included above together with their interaction. Models were compared
using AIC, where models with smaller AIC values indicated a better fit. The single species
that best explained the variation in biomass within each environment was denoted the “driver
species” for that environment. We used contrasts to test the linear effects of logarithm of
seeded species richness on biomass of seeded species in plots with and without the driver
species. If the linear contrasts were significant, we calculated the regression coefficients,
standard error, and their 95% confidence intervals on the original data (not means). Two
slopes were considered different from each other if their 95% confidence intervals did not
overlap. To test for functional group composition effects, contrasts in each environment
were performed among plots with different functional group composition.
For the weed biomass data, a similar set of analyses was conducted to that described
for biomass of seeded species. The best model for total weed biomass as a function of seeded
species richness across all environments was an exponential function (i.e., natural logarithm
of weed biomass as a linear function of seeded species richness). The same model selection
procedure, based on the AIC values, was conducted to determine the relative importance of
the presence or absence of single species and of seeded species richness on total weed
biomass. Linear effects of seeded richness were then tested with contrasts on entries with the
most weed suppressive species and on those without the most weed suppressive species.
All analyses of variance and contrasts were performed using PROC MIXED, and
regression coefficients were calculated using PROC REG, in the SAS statistical software
package (SAS-Institute-Inc., 2003).
RESULTS
Because the entry x year x location and entry x year x management interactions were
generally absent, and the trends of biomass productivity as a function of richness were
similar across the two years in which biomass was measured (data not shown), all subsequent
analyses were averaged across years (2004 and 2005). In contrast, the presence of an entry x
55
location x management strategy interaction suggested we analyze each location by
management combination separately. For simplicity, we refer to location-management
combinations as “environments” and these are Boone-one harvest (B1), Boone-three harvests
(B3), Ames-one harvest (A1), and Ames-three harvests (A3).
The observed number of seeded species increased linearly as actual seeded richness
increased (R2=0.69 overall, 0.76 for B1, 0.73 for B3, 0.68 for A1, and 0.59 for A3, P<0.0001
in all cases). Therefore, seeded species richness was a good estimator of observed seeded
species richness. The species which were most often missing were eastern gammagrass and
switchgrass, particularly at higher seeded richness levels. Because the analyses with seeded
and observed richness produced very similar results, we report the results using seeded
richness to be able to make planned comparisons based on the original experimental design.
Evenness was not controlled experimentally and all mixture plots showed a high level of
dominance (Table 3.3). The species that dominated most plots based on the Berger-Parker
dominance index were alfalfa for B3, orchardgrass for A1, and both alfalfa and orchardgrass
for B1 and A3 (Table 3.3).
Biomass of seeded species
Entries (i.e., treatments) differed for biomass of seeded species in all environments (i.e.,
we rejected the ANOVA null hypothesis that all entries are the same, data not shown).
Among monocultures, the most productive species under three harvests was alfalfa, while for
the one harvest management, intermediate wheatgrass was the most productive (Table 3.4).
The differences in biomass among species grown in monocultures also varied greatly with
environments, with alfalfa yielding 7.3 times the average of the other monocultures in B3,
while the best species outyielded the average of the other monocultures by 2.4 times for A3,
3.4 times for B1, and 3.5 times for A1 (Table 3.4). The average yield of polycultures was
73% greater than the average yield of the monocultures across all environments (61% for B1,
102% for B3, 49% for A1, and 79% for A3; P <0.0001 in all cases).
Seeded biomass, cultivated biomass, and total biomass increased log-linearly with seeded
richness in all environments (Fig.1). There was no evidence of differences in the slopes of
the regressions of biomass of seeded species on seeded species richness across management
56
strategies (Fig.1). For B1, 95% confidence intervals for slopes were 222 ± 74 g.m-2: for B3,
339 ± 98 g.m-2: for A1, 164 ± 68 g.m-2: and for A3, 227 ± 52 g.m-2.
Effect of driver species on biomass of seeded species
In each environment the species that yielded the most in monoculture (Table 3.4) was
also the species whose presence or absence best explained the variability in biomass of
seeded species based on the AIC values obtained through our model selection process (Table
3.5). For this reason we refer to these species as the “driver species” in each environment.
For the three harvest environments, alfalfa was both the driver species and the species that
dominated most plots (Table 3.3). However, for the one harvest environments, intermediate
wheatgrass was the driver species, having lower AIC values than both alfalfa and
orchardgrass, which dominated most plots (Table 3.3). Models of biomass as a function
solely of the driver species in each environment had lower AIC values than models including
only seeded species richness (Table 3.5) suggesting that the driver species had a greater
effect on productivity than did richness per se. Nonetheless, of the ten models compared
using AIC (Table 3.5), the one that included seeded species richness, the presence or absence
of the driver species, and their interaction produced the best fit for three out of four
environments. For the fourth environment, A3, the best model included both variables but not
their interaction.
On average plots including the driver species in a particular environment produced 2.4
times as much biomass as the plots without a driver species (B1=1.7 times, B3=3.7 times,
A1=2.2 times, A3=2.0 times; P <0.0001 in all cases). In plots without the driver species, the
biomass of seeded species increased log-linearly with increasing seeded species richness
(Fig. 3.2) and the slopes of the regressions were not different across management strategies
(slopes were 198 ± 97 g.m-2 for B1, 188 ± 53 g.m-2 for B3, 99 ± 72 g.m-2 for A1, and 165 ±
59 g.m-2 for A3). In contrast, plots containing driver species produced the same or less
biomass as species richness increased. The one exception to this trend was A3, where all
plots consistently increased biomass with richness. In this environment the slopes of
regressions of biomass of seeded species as a function of seeded species richness were not
different, because the interaction of intermediate wheatgrass by richness was absent in the
57
model (Table 3.5) and the 95% confidence intervals for the slopes overlapped (slope for A3
plots with alfalfa was 105 ± 69 g.m-2).
Weed biomass
The most frequent wild weeds were Taraxacum officinale G.H. Weber ex Wiggers,
Conyza canadensis (L.) Cronq., Chenopodium album (L.), and Setaria spp. Alfalfa and
orchardgrass were the most frequent cultivated weeds. Species in monoculture varied in their
ability to suppress weeds, with alfalfa the most suppressive in Boone and orchardgrass in
Ames (Table 3.4). White clover and intermediate wheatgrass were also weed suppressive.
Cultivated weed biomass, wild weed biomass, and total weed biomass decreased
exponentially with seeded richness in all environments (Figs.1 and 3). Models of ln
transformed weed biomass as a function of seeded species richness had higher AIC values
than models including only the most weed suppressive species in each environment (Table
3.5). Therefore, the impact of particular species on weed suppression was greater than
richness per se. As with biomass, of the ten models compared using AIC (Table 3.5), the best
was a factorial model of seeded species richness and the most weed suppressive species. For
B1, the best model also included the interaction between species richness and the presence or
absence of the most weed suppressive species, but for the other three environments, the best
model did not include the interaction.
On average, plots not including the most weed suppressive species in the environment
had 6.4 times more weed biomass than the plots with the most weed suppressive species (6.3
times for B1, 3.8 times for B3, 10.7 times for A1, and 4.8 times for A3; P <0.0001 in all
cases). In three out of four environments, total weed biomass decreased with seeded species
richness in all plots regardless of the presence or absence of the most weed suppressive
species (Fig. 3.3). In A1, where orchardgrass exerted very high weed suppression, there were
no significant trends. As expected, because the interaction of species by richness was not
present for most environments (Table 3.5) slopes for regressions of weed biomass as a
function of seeded species richness in plots with and without the most weed suppressive
species (Fig. 3.3) were not different. The only exception was B1, where the reduction in
58
weed biomass in plots without alfalfa was greater than the reduction in plots with alfalfa, and
where the interaction of alfalfa by richness was also present in the model (Table 3.5).
A strong negative exponential relationship between total weed biomass and biomass of
seeded species was observed in each environment. All linear regressions of logarithm of total
weed biomass as a function of biomass of seeded species were significant at P<0.0001.
Equations for total weed biomass (y, in g m-2) as a function of biomass of seeded species (x,
in g m-2) were: y=70.8*0.997x (Adj. R2 =0.17) for B1, y=213.0*0.997x (Adj.R2 =0.34) for
B3, y=174.4*0.995x (Adj.R2 =0.30) for A1, and y=304.7*0.995x (Adj.R2 =0.31) for A3.
Functional composition effects on biomass of seeded species and weeds
Plots including both C3 grasses and legumes outyielded plots with only legumes or only
C3 grasses in almost all environments (Table 3.6). The two exceptions were in B3, where
legume-only plots outyielded legume – C3 grass mixtures, and in A1, where C3 grasses were
no different from legume – C3 grass mixtures. As a group, legumes outyielded C3 grasses in
the three harvestmanagement at Boone, and C3 grasses outyielded legumes in the one harvest
management in both locations. The contribution of C4 grasses to biomass production was
marginal overall during the period of measurements of this study as expected for newly
establishing warm-season grasses. Adding a C4 grass to a plot with legumes and C3 grasses
did not change the productivity in any environment.
Plots including both C3 grasses and legumes had less weed biomass than plots with only
legumes or only C3 grasses in almost all environments (Table 3.6). The three exceptions were
in B3, where legume-only plots and legume – C3 grass mixtures had no differences in weed
biomass, and in the one harvest managements, where C3 grasses-only were no different from
legume – C3 mixtures. Legume-only plots had lower weed biomass than plots with only C3
grasses in B3; they were not different in B1 and A3; plots with only C3 grasses had lower
weed biomass than legumes-only plots in A1. Adding a C4 grass to a plot with legumes and
C3 grasses did not reduce weed biomass in any environment except A3.
59
DISCUSSION
Our first hypothesis that crop biomass productivity increased with increasing species
richness was supported by the evidence. Therefore, in our agriculture systems with fertile
soils and highly productive forage species, polycultures on average yielded more than
monocultures, and more diverse polycultures yielded more than less diverse ones. We
measured this trend at richness levels with six or fewer species, which may be relatively low
for natural systems, but which are relevant for agricultural systems, Our results are consistent
with previously published research from natural grasslands and forage mixtures (Hector et
al., 1999; Loreau et al., 2001; Sanderson et al., 2004; Tilman et al., 2006a).
However, a deeper analysis of the data revealed that the highest yields were from plots
including a single driver species, and that plots at any species richness (even monocultures)
that included this species had nearly equivalent yields and were the highest of those observed
for a given environment. This is also consistent with a recent meta-analysis of ecological
research: yields of diverse polycultures do not differ from the best yielding monoculture
(Cardinale et al., 2006).
The diversity-productivity relationship can be explained by complementarity among
species or by selection effects (Loreau and Hector, 2001). Different species with
complementary traits (e.g., rooting depth) can use different resources or niches, providing the
community as a whole access to more resources and making it more productive than its
constituent species individually. Positive interactions among species can also increase the
performance of the community, a process called facilitation. Selection effects are apparent
when highly productive species dominate a mixture due to processes such as inter-specific
competition (Loreau and Hector, 2001). Selection effects can result from sampling species
for inclusion in randomly assembled communities (Huston and McBride, 2002), because the
probability of including a highly productive species in the mixture increases as the number of
species in the mixture increases.
In our experiment, species combinations were not assembled at random, but rather
designed so that each level of species richness had plots with and without each species. This
design does not avoid the sampling effect, because the proportion of plots with each single
species has to increase with increasing species richness. However, we were able to separate
60
the individual species effects from richness effects. We showed that individual species had
major effects on productivity: the presence or absence of alfalfa in the three harvest
management and intermediate wheatgrass in one harvest management better explained
biomass productivity than did species richness. This suggests that the relationship between
biomass productivity and species richness may change depending on the presence or absence
of certain “driver” species. These driver species are well adapted to the agronomic
environment (soils, climate, and management) and are highly productive. The driver species
can dominate the plant community when it has a higher competitive ability than other species
(e.g., alfalfa in B3) but in other situations, other species that are less productive but more
competitive can dominate instead (e.g., orchardgrass in A1). The inclusion of a driver
species in the polyculture is the main factor that explained the increase in average
productivity of the more species-rich communities. Polycultures where this driver species
was present did not show an increase in biomass productivity with species richness.
However, biomass productivity increased with species richness in the absence of the driver
species. Seeding a monoculture or a binary mixture of the best adapted, highest yielding
species is easier to manage and may be a better option than seeding a complex polyculture in
some circumstances (see for instance Tracy and Sanderson, 2004a). Nevertheless,
polyculture yields were typically as high as the best monoculture, and in some environments
were even higher (e.g., A3). Because increasing species richness may offer other benefits
than simply biomass productivity, as we discuss below, mixture planting may be a better
option.
The results of this study also support our second hypothesis that weed biomass is reduced
with increasing species richness. These findings are consistent with the hypothesis that
resident diversity increases the competitive environment and makes invasions by other
species more difficult (Elton, 1958). Our results are limited to the context of the species, soil
types, and high weed pressure of the agricultural conditions studied. Nevertheless, these
results add to the experimental evidence supporting the contention that plant species richness
increases resistance of ecosystems to weeds and other pests (Dukes, 2002; Knops et al.,
1999; Tracy and Sanderson, 2004b). Highly weed-suppressive species had strong effects on
weed invasion; some monocultures (alfalfa in Boone, orchardgrass in Ames) were as
61
effective at suppressing weeds as polycultures. However, the same species may not maximize
both biomass productivity and weed suppression together simultaneously. In our experiment,
alfalfa monoculture in B3 maximized both productivity and weed suppression, but in the
other three environments, different species maximized each function (combinations of
intermediate wheatgrass, alfalfa, and orchardgrass). This suggests that as more agronomic
and ecological functions are considered, species-rich polycultures may simultaneously
optimize more functions, and may be more beneficial than simple monocultures (Sanderson
et al., 2004).
In this paper we reported results from the second and third year after establishment of
perennial plant communities. Although for these two years the trends of productivity vs.
richness were the same, we expect that succession in further years may change species
richness and evenness of the community, and possibly identity of driver species and the slope
of the regression productivity vs. richness. The potential of polycultures in maintaining stable
communities over time under agricultural conditions is a relevant issue to be explored in
further years of this experiment.
Our final hypothesis that harvest management changes the relationship between
productivity and richness can be rejected because the overall trends were similar for both
management strategies (i.e., they had equal slopes [Fig. 3.1 and 3.2]). This means that
species-rich plots had higher yields and lower weed invasion under both one- and three-
harvest managements, and that the increase in yield with richness was similar for both
managements. These findings suggest that species rich polycultures should be considered
even in intensively harvested agroecosystems, such as herbaceous perennial mixtures
harvested as biofuel feedstocks (Tilman et al., 2006a). However, the identity of the driver
species changed for each management regime, suggesting that harvest management needs to
be considered when choosing the species to include in a polyculture. Furthermore, in farming
systems where management practices may change due to unplanned conditions such as
weather or market fluctuations, polycultures may offer the advantage of more flexibility in
management options, whereas monocultures are more rigid in their requirements.
Differences in biomass productivity among plots with different functional group
composition can be explained by differences in species composition. For instance, in
62
environments where alfalfa was the driver species, plots with legumes outyielded plots with
C3 grasses, but where intermediate wheatgrass was the driver, plots with C3 grasses
outyielded legume plots. Plots with a combination of legumes and C3 grasses in most cases
were the highest yielding plots, as is well known in forage production. The marginal
contribution of the C4 grasses is explained because C4 grasses tend to take longer to establish,
and this is particularly the case in our experiment with Eastern gamagrass, which did not
establish at all in the first year. We expect that the contribution of C4 grasses will increase in
future years of the experiment.
In a sustainable agriculture context, crop communities need to simultaneously optimize
various ecosystem functions, including but not limited to productivity. Although dominance
effects explained the majority of the relationship between diversity and productivity in our
study, the productivity of perennial monoculture and polyculture plots over longer time
frames is needed to determine the ultimate role of complementarity effects in explaining the
relationship between diversity and stability over time. Because single species may have great
effects on the relationship between diversity and ecosystem function, experiments where
species effects cannot be discriminated from richness effects should be considered with
caution. Controlling experimentally both richness and species composition increases the
number of plots exponentially, necessitating the judicious choice of species adapted to the
environments considered.
This experiment yielded two main conclusions. First, increasing species richness in
perennial herbaceous polycultures has measurable benefits in terms of productivity and weed
suppression. This finding, well acknowledged by ecologists, should be applied to the design
of agriculture systems. Second, well adapted species have major effects on the relationship
between diversity and ecosystem function. This finding, more widely understood by the
agricultural community, should inform more ecological theory. More research bridging these
two scientific traditions is needed to advance towards a more sustainable agriculture.
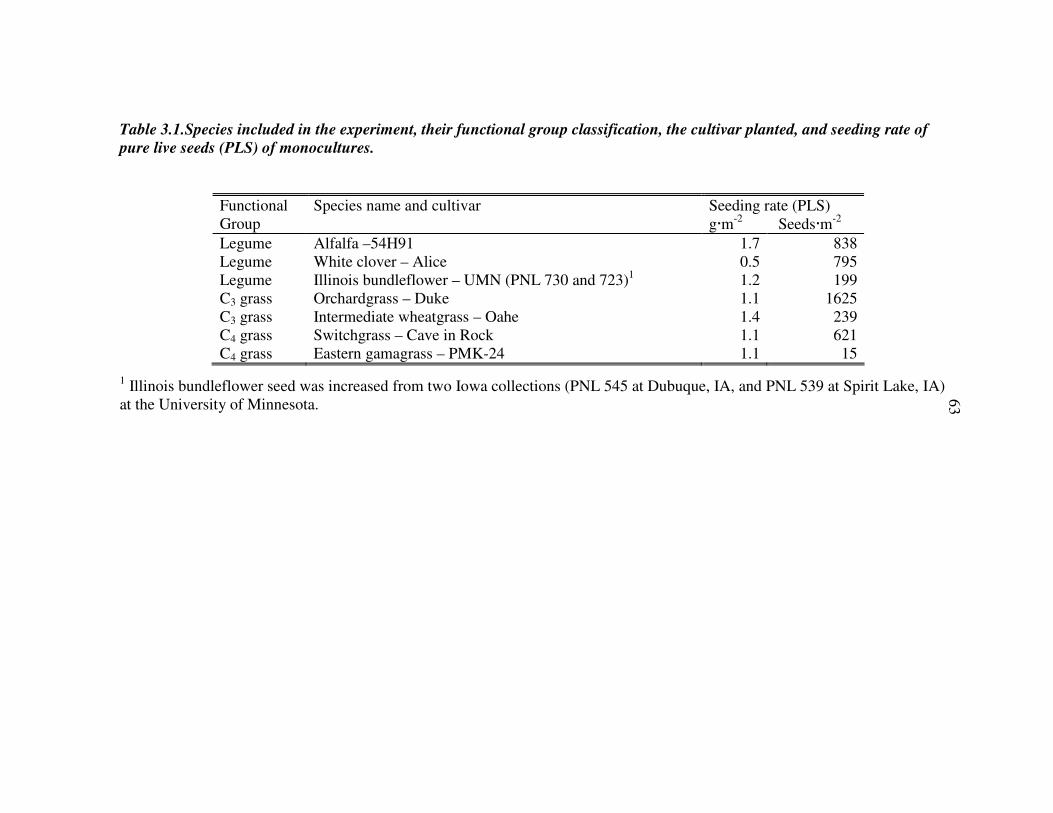
Table 3.1.Species included in the experiment, their functional group classification, the cultivar planted, and seeding rate of
pure live seeds (PLS) of monocultures.
1 Illinois bundleflower seed was increased from two Iowa collections (PNL 545 at Dubuque, IA, and PNL 539 at Spirit Lake, IA) at the University of Minnesota.
Functional Species name and cultivar Seeding rate (PLS) Group g·m-2 Seeds·m-2
Legume Alfalfa –54H91 1.7 838 Legume White clover – Alice 0.5 795 Legume Illinois bundleflower – UMN (PNL 730 and 723)1 1.2 199 C3 grass Orchardgrass – Duke 1.1 1625 C3 grass Intermediate wheatgrass – Oahe 1.4 239 C4 grass Switchgrass – Cave in Rock 1.1 621 C4 grass Eastern gamagrass – PMK-24 1.1 15
63
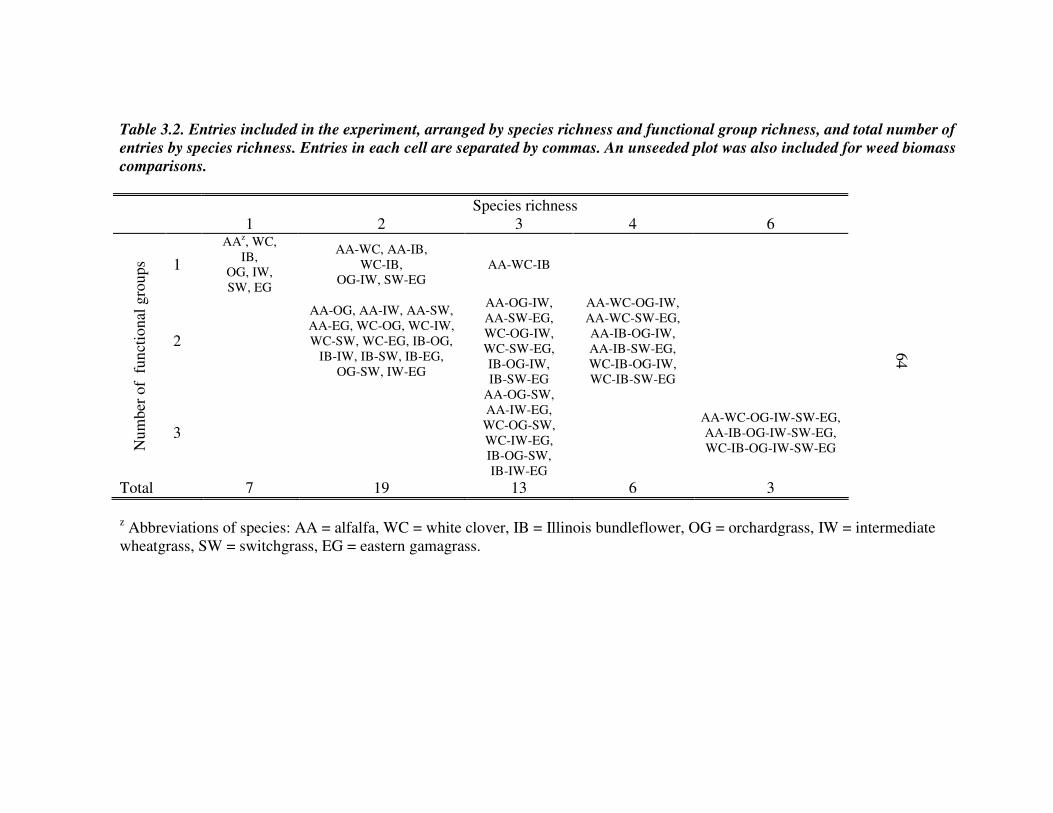
Table 3.2. Entries included in the experiment, arranged by species richness and functional group richness, and total number of
entries by species richness. Entries in each cell are separated by commas. An unseeded plot was also included for weed biomass
comparisons.
Species richness
1 2 3 4 6
1
AAz, WC, IB,
OG, IW, SW, EG
AA-WC, AA-IB, WC-IB,
OG-IW, SW-EG AA-WC-IB
2
AA-OG, AA-IW, AA-SW, AA-EG, WC-OG, WC-IW, WC-SW, WC-EG, IB-OG,
IB-IW, IB-SW, IB-EG, OG-SW, IW-EG
AA-OG-IW, AA-SW-EG, WC-OG-IW, WC-SW-EG, IB-OG-IW, IB-SW-EG
AA-WC-OG-IW, AA-WC-SW-EG, AA-IB-OG-IW, AA-IB-SW-EG, WC-IB-OG-IW, WC-IB-SW-EG
Num
ber
of
fun
ctio
nal
gro
ups
3
AA-OG-SW, AA-IW-EG,
WC-OG-SW, WC-IW-EG, IB-OG-SW, IB-IW-EG
AA-WC-OG-IW-SW-EG, AA-IB-OG-IW-SW-EG, WC-IB-OG-IW-SW-EG
Total 7 19 13 6 3
z Abbreviations of species: AA = alfalfa, WC = white clover, IB = Illinois bundleflower, OG = orchardgrass, IW = intermediate wheatgrass, SW = switchgrass, EG = eastern gamagrass.
64
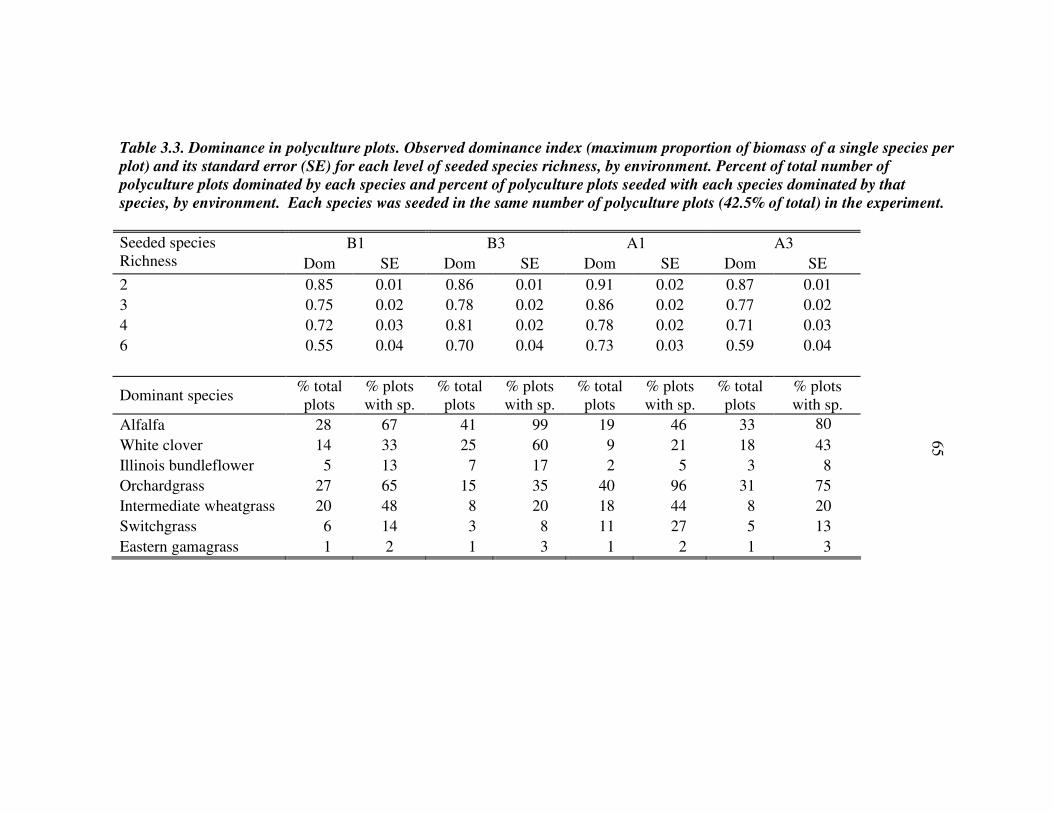
Table 3.3. Dominance in polyculture plots. Observed dominance index (maximum proportion of biomass of a single species per
plot) and its standard error (SE) for each level of seeded species richness, by environment. Percent of total number of
polyculture plots dominated by each species and percent of polyculture plots seeded with each species dominated by that
species, by environment. Each species was seeded in the same number of polyculture plots (42.5% of total) in the experiment.
B1 B3 A1 A3 Seeded species Richness Dom SE Dom SE Dom SE Dom SE
2 0.85 0.01 0.86 0.01 0.91 0.02 0.87 0.01
3 0.75 0.02 0.78 0.02 0.86 0.02 0.77 0.02
4 0.72 0.03 0.81 0.02 0.78 0.02 0.71 0.03
6 0.55 0.04 0.70 0.04 0.73 0.03 0.59 0.04
Dominant species % total plots
% plots with sp.
% total plots
% plots with sp.
% total plots
% plots with sp.
% total plots
% plots with sp.
Alfalfa 28 67 41 99 19 46 33 80
White clover 14 33 25 60 9 21 18 43
Illinois bundleflower 5 13 7 17 2 5 3 8
Orchardgrass 27 65 15 35 40 96 31 75
Intermediate wheatgrass 20 48 8 20 18 44 8 20
Switchgrass 6 14 3 8 11 27 5 13
Eastern gamagrass 1 2 1 3 1 2 1 3
65
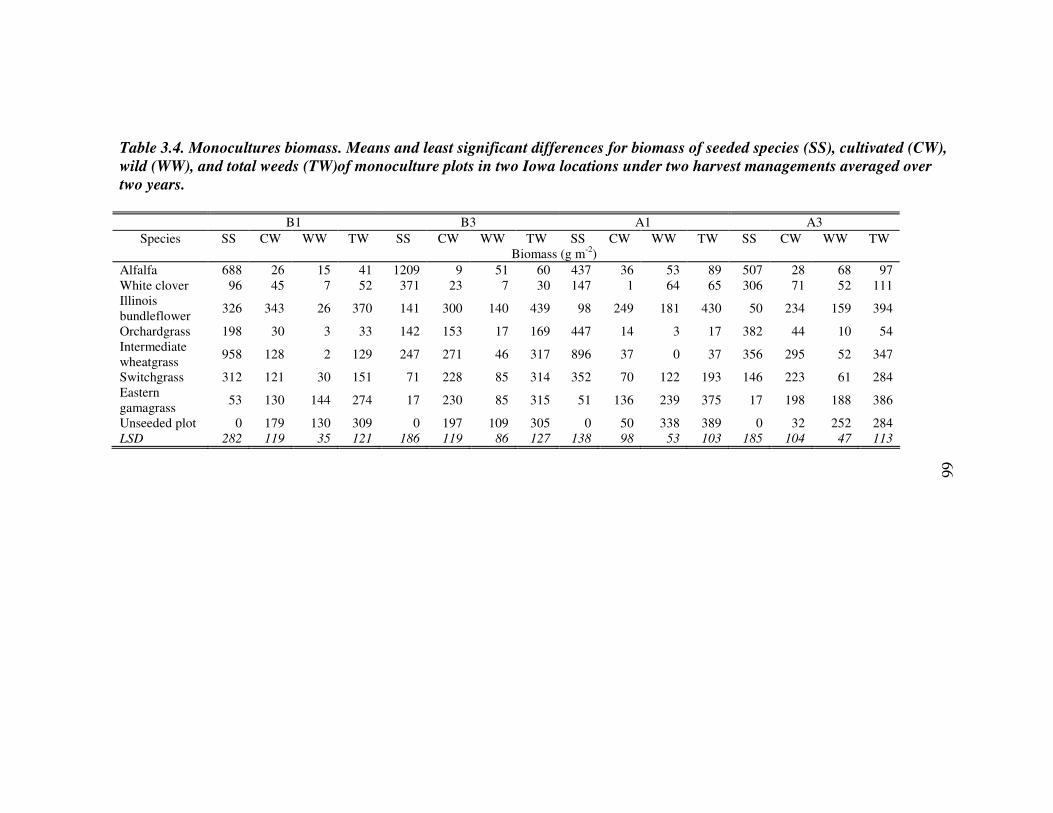
Table 3.4. Monocultures biomass. Means and least significant differences for biomass of seeded species (SS), cultivated (CW),
wild (WW), and total weeds (TW)of monoculture plots in two Iowa locations under two harvest managements averaged over
two years.
B1 B3 A1 A3
Species SS CW WW TW SS CW WW TW SS CW WW TW SS CW WW TW Biomass (g m-2)
Alfalfa 688 26 15 41 1209 9 51 60 437 36 53 89 507 28 68 97 White clover 96 45 7 52 371 23 7 30 147 1 64 65 306 71 52 111 Illinois bundleflower
326 343 26 370 141 300 140 439 98 249 181 430 50 234 159 394
Orchardgrass 198 30 3 33 142 153 17 169 447 14 3 17 382 44 10 54 Intermediate wheatgrass
958 128 2 129 247 271 46 317 896 37 0 37 356 295 52 347
Switchgrass 312 121 30 151 71 228 85 314 352 70 122 193 146 223 61 284 Eastern gamagrass
53 130 144 274 17 230 85 315 51 136 239 375 17 198 188 386
Unseeded plot 0 179 130 309 0 197 109 305 0 50 338 389 0 32 252 284 LSD 282 119 35 121 186 119 86 127 138 98 53 103 185 104 47 113
66
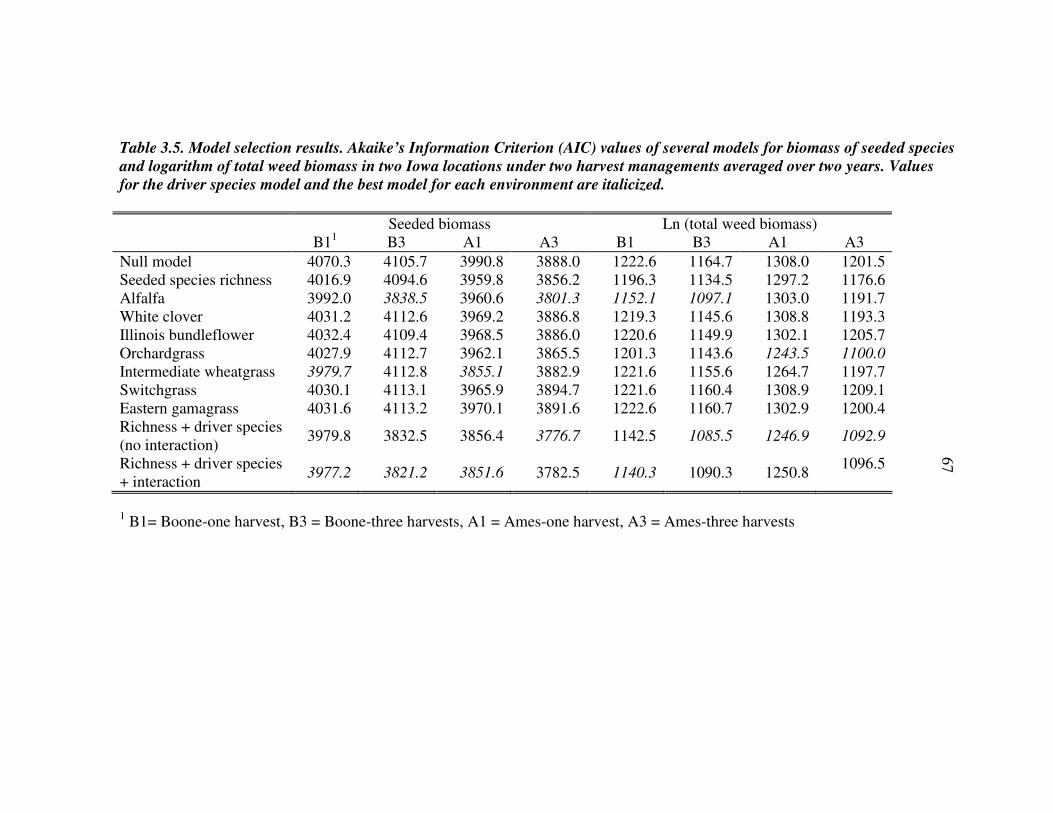
Table 3.5. Model selection results. Akaike’s Information Criterion (AIC) values of several models for biomass of seeded species
and logarithm of total weed biomass in two Iowa locations under two harvest managements averaged over two years. Values
for the driver species model and the best model for each environment are italicized.
Seeded biomass Ln (total weed biomass) B11 B3 A1 A3 B1 B3 A1 A3
Null model 4070.3 4105.7 3990.8 3888.0 1222.6 1164.7 1308.0 1201.5 Seeded species richness 4016.9 4094.6 3959.8 3856.2 1196.3 1134.5 1297.2 1176.6 Alfalfa 3992.0 3838.5 3960.6 3801.3 1152.1 1097.1 1303.0 1191.7 White clover 4031.2 4112.6 3969.2 3886.8 1219.3 1145.6 1308.8 1193.3 Illinois bundleflower 4032.4 4109.4 3968.5 3886.0 1220.6 1149.9 1302.1 1205.7 Orchardgrass 4027.9 4112.7 3962.1 3865.5 1201.3 1143.6 1243.5 1100.0
Intermediate wheatgrass 3979.7 4112.8 3855.1 3882.9 1221.6 1155.6 1264.7 1197.7 Switchgrass 4030.1 4113.1 3965.9 3894.7 1221.6 1160.4 1308.9 1209.1 Eastern gamagrass 4031.6 4113.2 3970.1 3891.6 1222.6 1160.7 1302.9 1200.4 Richness + driver species (no interaction)
3979.8 3832.5 3856.4 3776.7 1142.5 1085.5 1246.9 1092.9
Richness + driver species + interaction
3977.2 3821.2 3851.6 3782.5 1140.3 1090.3 1250.8 1096.5
1 B1= Boone-one harvest, B3 = Boone-three harvests, A1 = Ames-one harvest, A3 = Ames-three harvests
67
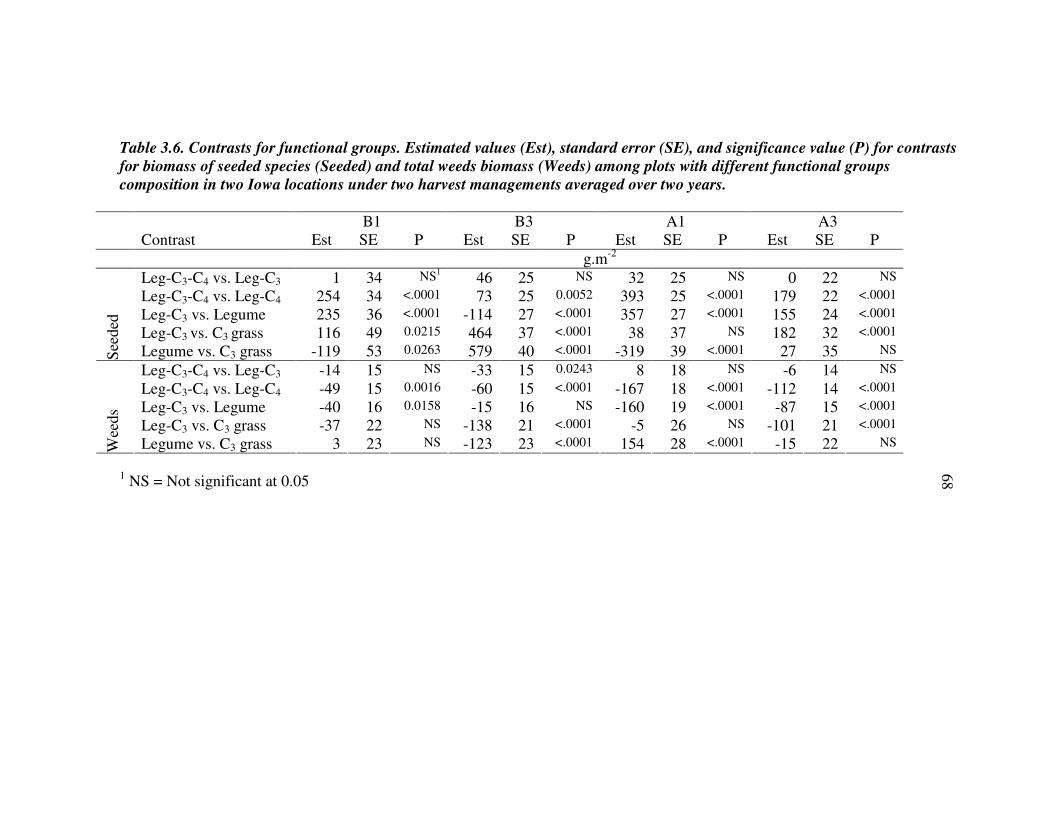
Table 3.6. Contrasts for functional groups. Estimated values (Est), standard error (SE), and significance value (P) for contrasts
for biomass of seeded species (Seeded) and total weeds biomass (Weeds) among plots with different functional groups
composition in two Iowa locations under two harvest managements averaged over two years.
B1 B3 A1 A3 Contrast Est SE P Est SE P Est SE P Est SE P
g.m-2
Leg-C3-C4 vs. Leg-C3 1 34 NS1 46 25 NS 32 25 NS 0 22 NS
Leg-C3-C4 vs. Leg-C4 254 34 <.0001 73 25 0.0052 393 25 <.0001 179 22 <.0001
Leg-C3 vs. Legume 235 36 <.0001 -114 27 <.0001 357 27 <.0001 155 24 <.0001
Leg-C3 vs. C3 grass 116 49 0.0215 464 37 <.0001 38 37 NS 182 32 <.0001
See
ded
Legume vs. C3 grass -119 53 0.0263 579 40 <.0001 -319 39 <.0001 27 35 NS
Leg-C3-C4 vs. Leg-C3 -14 15 NS -33 15 0.0243 8 18 NS -6 14 NS
Leg-C3-C4 vs. Leg-C4 -49 15 0.0016 -60 15 <.0001 -167 18 <.0001 -112 14 <.0001
Leg-C3 vs. Legume -40 16 0.0158 -15 16 NS -160 19 <.0001 -87 15 <.0001
Leg-C3 vs. C3 grass -37 22 NS -138 21 <.0001 -5 26 NS -101 21 <.0001
Wee
ds
Legume vs. C3 grass 3 23 NS -123 23 <.0001 154 28 <.0001 -15 22 NS
1 NS = Not significant at 0.05
68
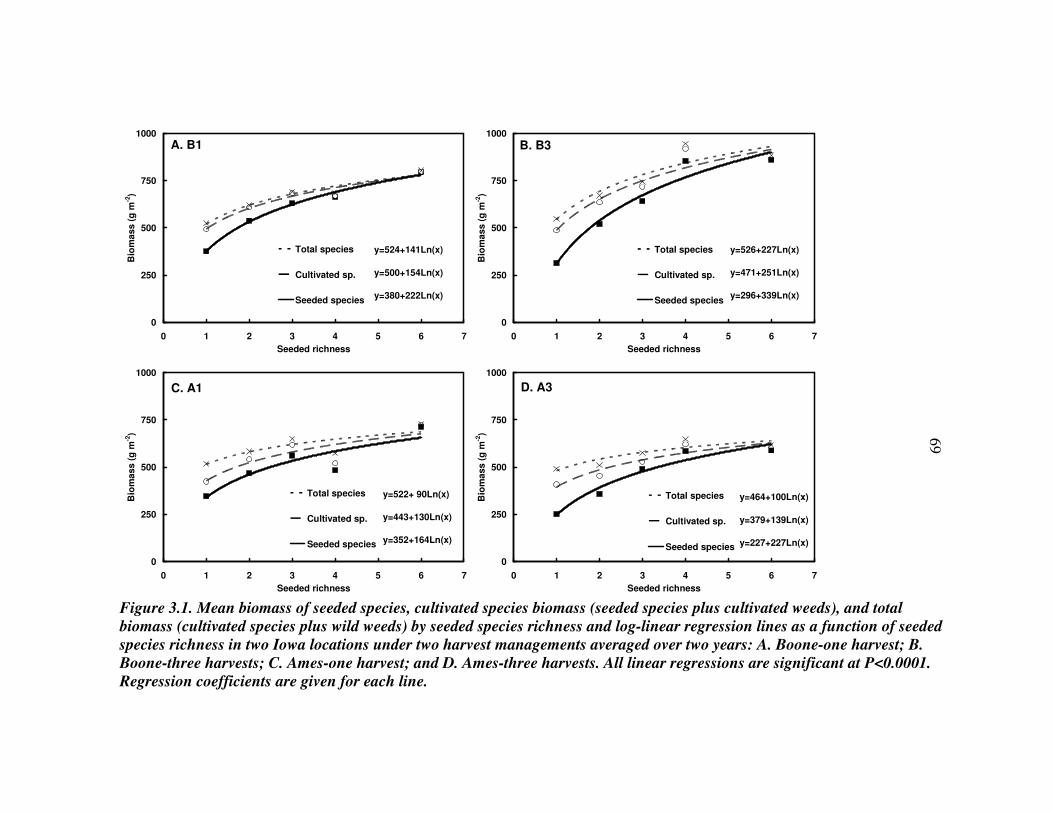
0
250
500
750
1000
0 1 2 3 4 5 6 7
Seeded richness
Bio
mass (
g m
-2)
Total species
Cultivated sp.
Seeded species
A. B1
y=524+141Ln(x)
y=500+154Ln(x)
y=380+222Ln(x)
0
250
500
750
1000
0 1 2 3 4 5 6 7
Seeded richness
Bio
mass (
g m
-2)
Total species
Cultivated sp.
Seeded species
B. B3
y=526+227Ln(x)
y=471+251Ln(x)
y=296+339Ln(x)
0
250
500
750
1000
0 1 2 3 4 5 6 7
Seeded richness
Bio
mass (
g m
-2)
Total species
Cultivated sp.
Seeded species
C. A1
y=522+ 90Ln(x)
y=443+130Ln(x)
y=352+164Ln(x)
0
250
500
750
1000
0 1 2 3 4 5 6 7
Seeded richness
Bio
mass (
g m
-2)
Total species
Cultivated sp.
Seeded species
D. A3
y=464+100Ln(x)
y=379+139Ln(x)
y=227+227Ln(x)
Figure 3.1. Mean biomass of seeded species, cultivated species biomass (seeded species plus cultivated weeds), and total
biomass (cultivated species plus wild weeds) by seeded species richness and log-linear regression lines as a function of seeded
species richness in two Iowa locations under two harvest managements averaged over two years: A. Boone-one harvest; B.
Boone-three harvests; C. Ames-one harvest; and D. Ames-three harvests. All linear regressions are significant at P<0.0001.
Regression coefficients are given for each line.
69
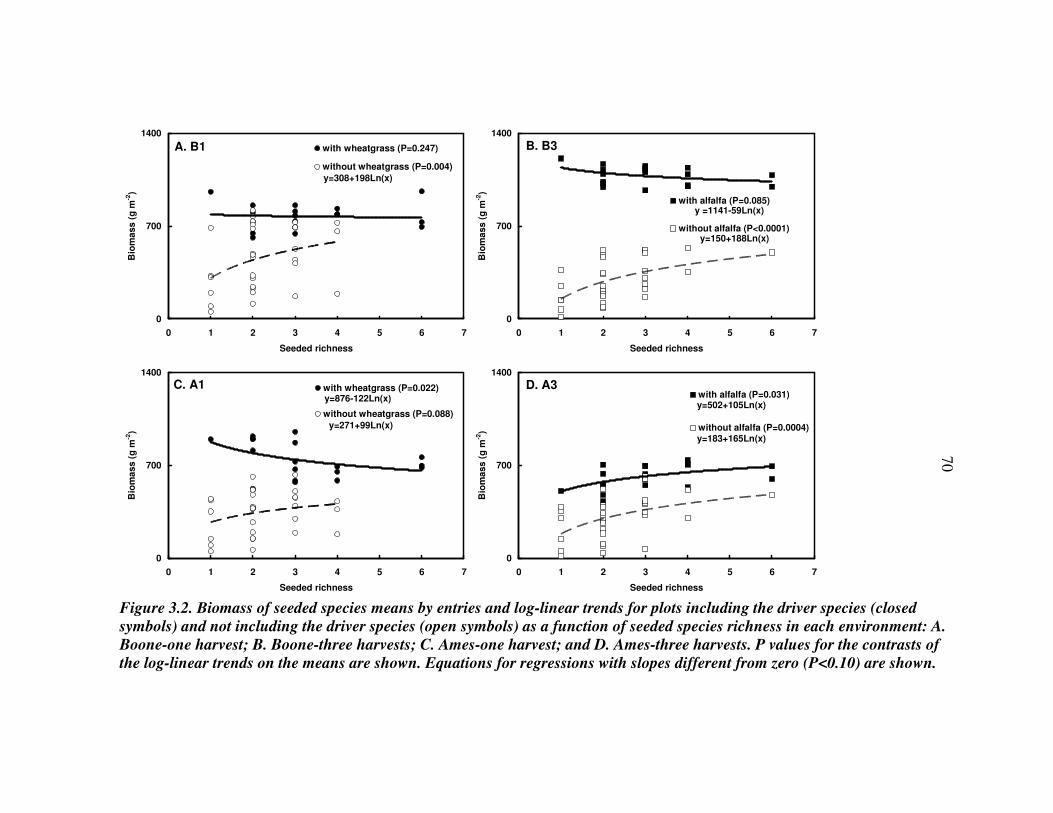
0
700
1400
0 1 2 3 4 5 6 7
Seeded richness
Bio
mass (
g m
-2)
with wheatgrass (P=0.247)
without wheatgrass (P=0.004)
A. B1
y=308+198Ln(x)
y =1141-59Ln(x)
0
700
1400
0 1 2 3 4 5 6 7
Seeded richness
Bio
mass (
g m
-2)
with alfalfa (P=0.085)
without alfalfa (P<0.0001)
B. B3
y=150+188Ln(x)
y=271+99Ln(x)
0
700
1400
0 1 2 3 4 5 6 7
Seeded richness
Bio
mass (
g m
-2)
with wheatgrass (P=0.022)
without wheatgrass (P=0.088)
C. A1y=876-122Ln(x)
0
700
1400
0 1 2 3 4 5 6 7
Seeded richness
Bio
mass (
g m
-2)
with alfalfa (P=0.031)
without alfalfa (P=0.0004)
D. A3
y=183+165Ln(x)
y=502+105Ln(x)
Figure 3.2. Biomass of seeded species means by entries and log-linear trends for plots including the driver species (closed
symbols) and not including the driver species (open symbols) as a function of seeded species richness in each environment: A.
Boone-one harvest; B. Boone-three harvests; C. Ames-one harvest; and D. Ames-three harvests. P values for the contrasts of
the log-linear trends on the means are shown. Equations for regressions with slopes different from zero (P<0.10) are shown.
70
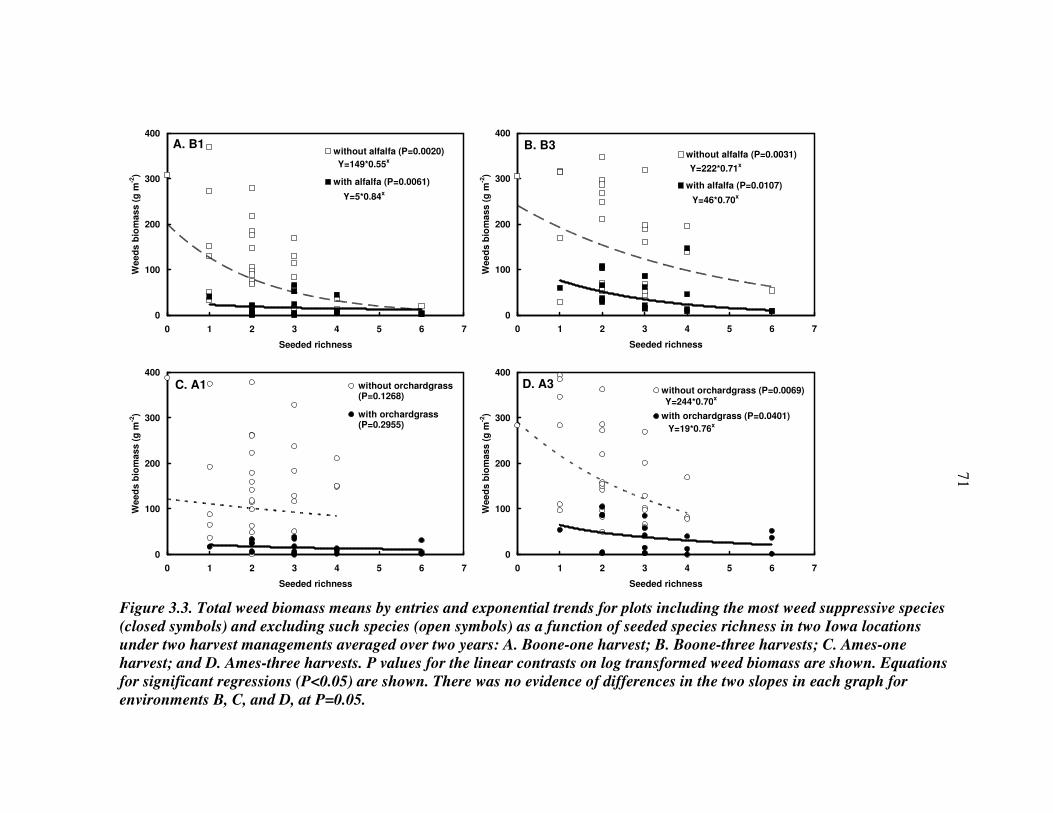
0
100
200
300
400
0 1 2 3 4 5 6 7
Seeded richness
Weed
s b
iom
ass (
g m
-2)
without alfalfa (P=0.0020)
with alfalfa (P=0.0061)
A. B1
Y=149*0.55x
Y=5*0.84x
0
100
200
300
400
0 1 2 3 4 5 6 7
Seeded richness
Weed
s b
iom
ass (
g m
-2)
without alfalfa (P=0.0031)
with alfalfa (P=0.0107)
B. B3
Y=222*0.71x
Y=46*0.70x
0
100
200
300
400
0 1 2 3 4 5 6 7
Seeded richness
Weed
s b
iom
ass (
g m
-2)
without orchardgrass(P=0.1268)
with orchardgrass(P=0.2955)
C. A1
0
100
200
300
400
0 1 2 3 4 5 6 7
Seeded richness
Weed
s b
iom
ass (
g m
-2)
without orchardgrass (P=0.0069)
with orchardgrass (P=0.0401)
D. A3
Y=244*0.70x
Y=19*0.76x
Figure 3.3. Total weed biomass means by entries and exponential trends for plots including the most weed suppressive species
(closed symbols) and excluding such species (open symbols) as a function of seeded species richness in two Iowa locations
under two harvest managements averaged over two years: A. Boone-one harvest; B. Boone-three harvests; C. Ames-one
harvest; and D. Ames-three harvests. P values for the linear contrasts on log transformed weed biomass are shown. Equations
for significant regressions (P<0.05) are shown. There was no evidence of differences in the two slopes in each graph for
environments B, C, and D, at P=0.05.
71
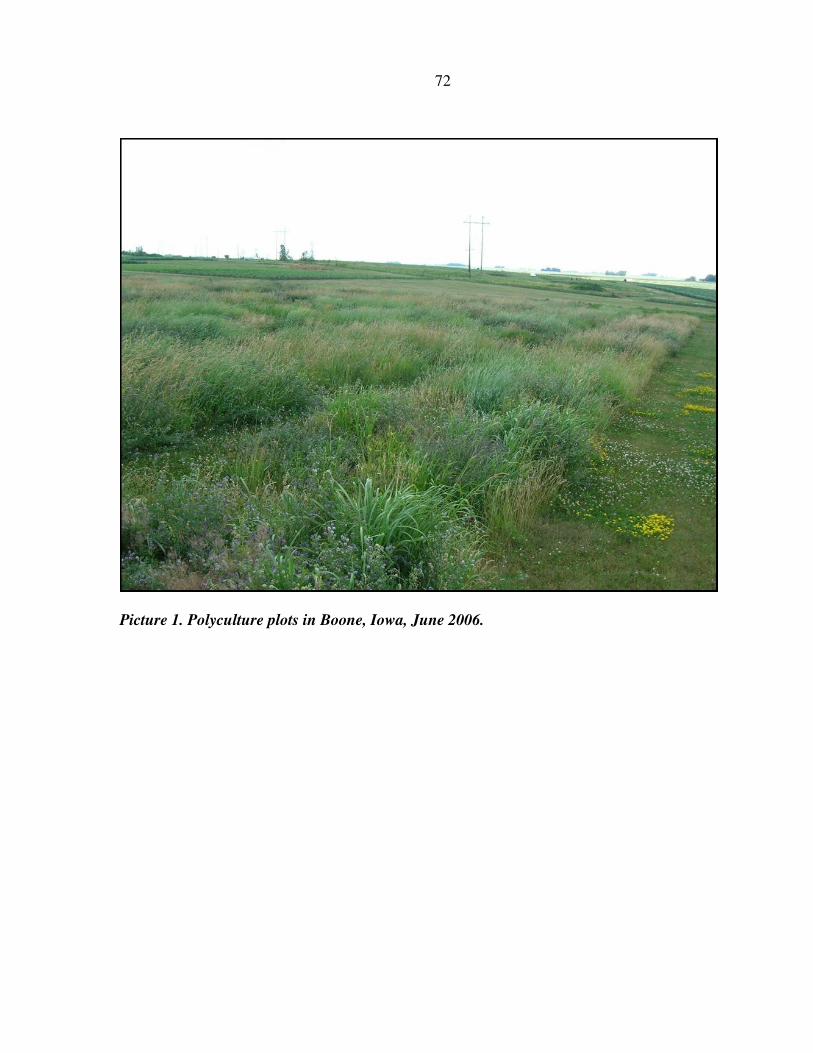
72
Picture 1. Polyculture plots in Boone, Iowa, June 2006.
73
CHAPTER IV. DIVERSITY AFFECTS PRODUCTIVITY OVER TIME THROUGH
COMPLEMENTARITY AND STABILITY IN PERENNIAL POLYCULTURES
A paper to be submitted to Crop Science
Valentín D. Picasso1, E. Charles Brummer2, Matt Liebman3,
Philip M. Dixon4, and Brian J. Wilsey5
ABSTRACT
The mechanisms responsible for increases in productivity with increased species diversity
are subjects of debate, as is the consistency of diversity effects across time and environments.
The effects of species richness, species composition, and time on biomass production was
measured for perennial herbaceous polycultures under two management systems in a
replicated experiment over four years at two locations in Iowa, USA. Biomass increased with
richness in all environments but one, and year did not change the biomass-richness
relationship. Individual species differentially affected the biomass-richness relationship
between years under the single harvest management regime, but not under the multiple
harvest management regime. The observed polyculture overyielding was due to
complementarity among species in the community rather than selection effects of individual
species at all richness levels across environments. Legume-grass facilitation may explain this
complementarity effect. Polycultures with high richness had lower variability in yield (i.e.,
greater yield stability) than the highest yielding monocultures measured as deviations of the
regression between entry means and the overall environment-year means. Diverse perennial
polycultures may be a stable and sustainable alternative for low input production situations.
1 PhD candidate in Sustainable Agriculture, Iowa State University, senior author 2 Professor in Forage and Biomass Crop Breeding, Center for Applied Genetic Technologies, Crop and Soil Sciences Department, University of Georgia 3 Professor in Agronomy, Agronomy Department, Iowa State University 4 Professor in Statistics, Statistics Department, Iowa State University 5 Associate Professor in Ecology, Ecology, Evolution and Organismal Biology Department, Iowa State University
74
INTRODUCTION
Most current agriculture systems are structured with the goal of maximizing productivity
in the short term, sometimes at the expense of stability over time (Brummer, 1998).
Diversification of farming and cropping systems with multiple species can enhance
simultaneously productivity and stability. For instance, polyculture systems may reduce the
dependence on external inputs, economic risk, and food insecurity, while protecting natural
resources (Liebman, 1995). Perennial herbaceous polycultures for grain, forage, or biomass
production offer an alternative to increase diversity in agricultural landscapes, especially in
highly erodible lands suitable for low input systems (Cox et al., 2006; Jackson, 2002; Schulte
et al., 2006).
Plant species and functional diversity can increase productivity compared to
monocultures, a phenomenon termed overyielding, but the mechanisms responsible for these
effects are debated (Fargione et al., 2007; Hector et al., 2007; Loreau et al., 2001). Species
rich communities have a greater diversity of traits (e.g., various rooting depths) and may use
resources more completely than monocultures. Positive interactions among species can
enhance productivity in diverse communities (e.g., legumes can improve nitrogen availability
to other species). These mechanisms, collectively referred as complementarity, provided the
initial hypothesis for the relationship between diversity and productivity (Loreau and Hector,
2001; Tilman et al., 1996). Experimentally assembled diverse communities also have greater
chance to include highly productive dominant species that increase community productivity
(Huston, 1997), an example of the selection effect (Loreau and Hector, 2001). Because
complementarity and selection have different practical implications for the management of
agroecosystems and both may operate at the same time, it is relevant to distinguish between
these effects in biodiversity experiments.
A second issue of debate is whether overyielding effects observed in diversity
experiments are consistent across time and environments. Long term studies in grasslands
have shown a consistent and increasingly positive diversity effect on productivity and
stability (Tilman et al., 2006b), and experiments conducted at multiple locations throughout
Europe have shown in general a consistent increase in productivity with diversity across
locations (Hector et al., 1999). However, experiments may operate at spatial and temporal
75
scales smaller than relevant to capture community dynamics (Hooper et al., 2005; Srivastava
and Vellend, 2005).
Stability of a system has many dimensions that are not necessary correlated: variability
of production over time, the ability to maintain productivity in face of external disruptions
(resistance), the speed of recovery after a perturbation (resilience), and the amount of
perturbation tolerated before reducing productivity substantially (robustness) (Loomis and
Connor, 1992; Loreau et al., 2002; McCann, 2000). Stability of production may be observed
at the community level while drastic changes at the population level occur over time
(Lehman and Tilman, 2000). Because of this hierarchical aspect of stability, research should
focus on precise definitions that could provide practical information for management
decisions. The plant breeding concept of yield stability of crop varieties (Finlay and
Wilkinson, 1963) is proposed here as a potential contribution to the study of stability in
biodiversity experiments.
Previous research with herbaceous perennial polyculture communities in central
Iowa, USA, showed an increase in mean biomass production with seeded species richness,
but with a strong effect of individual species on that relationship (Picasso et al., 2008). In this
paper, we examine the richness—productivity relationship over a longer time frame (three
years) to test three hypotheses: (1) that the observed relationship between richness and
biomass productivity was due to complementarity among species and not to a selection
effect; (2) that the richness—productivity relationship remained the same across two harvest
management regimes at each of two locations across three years; and (3) that diverse
polycultures were more stable across environments than monocultures.
MATERIALS AND METHODS
Experimental design
Fifty-two plant community entries (i.e., treatments) were assembled using eight perennial
species from four taxonomic groups: legumes (alfalfa, [Medicago sativa L.], white clover
[Trifolium repens L.], Illinois bundleflower [Desmanthus illinoensis (Michx.) MacM. ex B.L.
Robins. & Fern.]); C3 grasses (orchardgrass [Dactylis glomerata L.] and intermediate
76
wheatgrass [Thinopyrum intermedium (Host) Barkworth & D.R. Dewey]); C4 grasses
(switchgrass [Panicum virgatum L.] and eastern gamagrass [Tripsacum dactyloides (L.) L.]);
and a composite (Maximilian sunflower [Helianthus maximiliani Schrad.]). All monocultures
(8 entries) were included, as well as selected polycultures of two (19 entries), three (13
entries), four (7 entries), six (3 entries), and eight species (1 entry); an unseeded plot was also
included for weed biomass comparisons. The suite of treatments was not random but rather
was intended to balance species composition; for all levels of species richness some entries
included each individual species and other entries did not, so we could analyze the effect of
individual species. Because legumes have shown to have a major impact on biodiversity
experiments (Hector et al., 2007; Spehn et al., 2002), we included at least one legume in all
entries except for monocultures and two-species combinations of grasses, and the same grass
species and mixtures were included with each of the three legumes. Monoculture seed
identity and seed density were: alfalfa (cv. 54H51) 838 PLS m-2, white clover (cv. Alice) 795
PLS m-2, bundleflower (Univ. of Minnesota accessions) 199 PLS m-2, orchardgrass (cv.
Duke) 1625 PLS m-2, intermediate wheatgrass (cv. Oahe) 239 PLS m-2. switchgrass (cv.
Cave-in-Rock), 621 PLS m-2, eastern gamagrass (cv. PMK-24) 15 PLS m-2, and Maximilian
sunflower (local prairie seed) 332 PLS m-2 based on standard agronomic recommendations
for Iowa (Barnhart, 1999; Piper and Pimm, 2002). A replacement design was used (Jolliffe,
2000), such that seed density for species in polycultures was reduced proportionally to the
number of species (e.g., a two-species mix included half of the seeds of each monoculture).
Thus, the expected proportion of each species in the polyculture was 0.50, 0.33, 0.25, 0.17,
and 0.13 for two, three, four, six, and eight species respectively, and expected evenness was
1 for all polycultures.
Each entry was replicated three times in a 12 by 13 alpha lattice design at two locations
in Iowa, USA: the Iowa State University Agronomy and Agricultural Engineering Research
Farm, east of Boone, Boone Co., IA, with a Nicollet loam soil (fine-loamy, mixed,
superactive, mesic Aquic Hapludolls) and the ISU Hinds Research Farm, north of Ames,
Story Co., IA, with a Spillville loam soil (fine-loamy, mixed, superactive, mesic Cumulic
Hapludolls). In spring 2003 tillage was conducted before drilling the mix of seeds into 4-m
by 3-m plots consisting of 20 rows spaced 0.15-m apart. Plots were mowed in June and Sept.
77
2003 to a 0.15-m height to control weeds. In October 2003 the number of plants of each
species present along a 1-m transect per plot was counted. Eastern gamagrass was reseeded
by hand in April 2004, because no plants were found in 2003. More details on the sites can
be found elsewhere (Picasso et al., 2008).
In 2004, each plot was split in half to form two 2-m x 3-m sub-plots that were allocated
to either a multiple harvest system with removal of all biomass, or to a single harvest
management simulating a perennial grain system with only seed biomass of selected species
being removed. The same allocations were used in 2005 and 2006 as well. Plots were
machine clipped with a flail-type harvester (Carter Mfg., Brookston, IN) equipped with an
electronic weigh system. A single 1-m wide by 3-m long strip was harvested for biomass
through the center of each small plot. The adjacent 50-cm strips on either side of the
measured area were cut immediately after data collection so that all biomass was clipped to
ground level. Dry matter percent of samples taken from each plot immediately before each
harvest were used to calculate dry biomass weight per plot (hereafter referred as total
biomass).
In the multiple harvest system, plots were harvested three times per year in 2004 and
2005, in late May, mid July, and mid Sept.; and twice in 2006, in late June and mid Aug. In
Ames in 2004 the third harvest was incomplete, and so this harvest data was dropped from
the analyses. In the single harvest management, plots were harvested in late Oct. to early
Nov. each of the three years. Reproductive structures of four species (bundleflower,
orchardgrass, wheatgrass, and switchgrass) were hand harvested from the entire plot area as
each species matured, weighed, and added to the total plot biomass in 2004 and 2005, but no
seed harvest was conducted in 2006.
Two different methods were used to estimate relative abundance of each species (both
seeded and weeds). In 2004 and 2005, individual species biomass was measured by clipping
two 0.09-m2 quadrats per plot, sorting species in the laboratory, and weighing them. In 2005
and 2006, individual species ground cover percentage was recorded from visual observations
on each plot by the same observer. Linear regressions for the relative abundance of each
species based on biomass and ground cover for 2005 revealed a strong association between
the two variables for most seeded species (all P values <0.0001 and average R2 = 0.78),
78
although linear coefficients were not equal to one for several species. Therefore relative
abundance in 2006 was estimated using relative cover data for 2006 and regression
coefficients from 2005. We estimated the biomass using the regression coefficients, rather
than using the cover estimates, because the linear coefficients differ among species because
of density differences, i.e., the biomass per percent of cover varies among species.
Data analyses
Because previous analyses (Picasso et al., 2008) demonstrated the existence of location
and management system x entry interactions, all analyses were conducted by location and
management, hereafter referred as environments: Boone-one harvest (B1), Boone-three
harvests (B3), Ames-one harvest (A1), and Ames-three harvests (A3). For each
environment a heterogeneous regression lines mixed model was fit including observed
richness of seeded species (natural log transformed, continuous variable), year (repeated
measures on each plot), richness x year interaction, replications, and blocks within
replication. All factors were considered fixed except for replication and block(rep) which
were considered random. An autoregressive covariance structure for the residuals was used.
In order to fit the correct model, we first tested the hypothesis that the effect of richness was
zero for all years by fitting a model with only year and year x richness effects, which we
rejected if the year x richness effect was significant. If the first hypothesis was rejected, we
tested a second hypothesis of no year x richness interaction by fitting a full model with year,
richness, and year x richness, and rejecting if year x richness was significant (Littell et al.,
1996). Least square means for each entry were calculated, and means were separated using
Fisher’s protected LSD. Because the presence of individual species was shown to affect the
relationship between biomass and richness (Picasso et al., 2008), the effect of the single
species with higher monoculture yields (i.e., alfalfa in the multiple harvest management and
intermediate wheatgrass in the single harvest system) at each location was tested. First, the
three way interaction of richness x year x species was tested, and if found significant the
richness x species interaction was tested for each year independently, using the same iterative
procedure as described before.
79
In order to identify the ecological mechanisms behind the relationships between total
biomass and richness, we partitioned the net richness effect into complementarity and
selection effects using the method of Loreau and Hector (2001) as follows:
),cov( MRYNMRYNYYY EO ∆+∆=−=∆
where the net richness effect Y∆ is the difference between the observed yield of the
polyculture )( OY and the expected yield )( EY based on the sum of the component species’
monoculture yields weighted by their proportion in the mixture. A positive net richness effect
means that the polyculture yields were greater than the average of the monocultures, a
condition we define as “polyculture overyielding.”
The complementary effect is denoted by MRYN∆ , where N is the number of species in
the mixture, M is the mean monoculture yield of the component species, and RY∆ is the
mean relative yield deviation across the i species in the polyculture. The relative yield
deviation of a given species, ∆RYi, is the difference of that species’ observed relative yield
(RYi)—its polyculture yield divided by its monoculture yield—and its expected relative yield
(ERYi) based on the proportion seeded in the polyculture. A positive value of ∆RYi means
that the species in polyculture yielded greater than expected, a condition we define as
“species overyielding.” The selection effect is defined as ),cov( MRYN ∆ , i.e., the covariance
between relative yield deviations and monoculture yields.
Complementarity occurs when the species in the polyculture, on average, yield more (or
less) than expected based on their monoculture yield and their proportion in the mixture. The
selection effect is present if the relative yield deviation is related to monoculture performance
(i.e., as monoculture yield increases, relative yield deviations in polycultures also increase).
The net richness effect, complementarity, and selection effect can each be positive or
negative independently, so this method provides a practical framework to understand the
mechanisms involved in the productivity- richness relationships.
A mixed model similar to the one used for biomass was fit for each of the three effects
(i.e., net richness effect, complementarity, and selection effects) and least square means by
richness were calculated across years by environment, and compared using Fisher’s protected
LSD. In our calculations we used the monoculture yields averaged over the three replications
80
in the experiment, so the mean monoculture yield by environment and year was the basis for
comparisons to polyculture yield and relative yield as is recommended for intercropping
experiments by Federer (1993). Monoculture yield of eastern gamagrass was zero in 2004 in
Boone, so we excluded it from the analyses for that environment and year to avoid the
problem of relative yields approaching infinity when monoculture values are too small
(Fargione et al., 2007).
Stability of the entries across environment-years was analyzed using the same
approach used for crop varieties in plant breeding programs (Bernardo, 2002; Eberhart and
Russell, 1966; Finlay and Wilkinson, 1963). Each of the 12 combinations of location,
management system, and year was defined as a unique environment-year combination. The
overall mean biomass across all entries was used as a measure of the productivity potential of
each environment-year. Entry means by environment-year were regressed against the
environment-year means. Also, a second group of regressions were calculated by richness
level, to test the effect of richness in stability. The linear regression coefficients (b1) and root
mean squared errors of the regression (RMSE) were used to evaluate the stability of each
entry or richness group. The linear coefficient measures the amount of yield change along the
environmental gradient and RMSE is associated with the variability of yields and the fit to
the linear regression model (Becker, 1981). Three agricultural definitions of stability where
considered (Bernardo, 2002): Type I stability occurs when b1 = 0, thus the entry yields the
same in all environment-years; Type II stability occurs when b1 = 1, thus the entry performs
parallel to the mean for the environment-years; Type III stability considers the RMSE, where
lower RMSE values mean higher stability. Finally, a plot of b1 against the means by entry
across environment-years was used to analyze the adaptation of the entries across
environment-years (Finlay and Wilkinson, 1963).
All analyses of variance and contrasts were performed using PROC MIXED, and
regression coefficients were calculated using PROC REG, in the SAS statistical software
package (SAS-Institute-Inc., 2003). Statistical significance is assessed at the 5% level unless
otherwise indicated.
81
RESULTS
Monoculture plots differed for biomass yield among species within environments for all
years (Table 4.1). Alfalfa in the multiple harvests management and intermediate wheatgrass
in the single harvest management were the highest yielding species in monoculture in most
years. In the single harvest system there was no evidence of differences in alfalfa and
switchgrass monoculture yields to intermediate wheatgrass some years. White clover, eastern
gamagrass, Maximilian sunflower, and orchardgrass usually had the lowest yields across
environments and years.
Richness x year interaction
There was a strong association between the observed richness of seeded species
(hereafter, S) and the original richness of seeded species at the time of sowing (S0) for each
combination of environment and year (P<0.0001). However, linear coefficients and the R2
values for the fitted regressions decreased after the first year under the three harvest
management system in both locations, indicating that the association became weaker as some
species were apparently lost from the plots across richness levels. The upper bounds on the
95% confidence intervals for the linear regression coefficients were lower than 1 for all
environments in all years, so S was consistently lower than S0. In order to reflect accurately
the observed richness of seeded species in the plots, S was used for analyses of richness by
year interaction.
We found an overall effect of species richness on biomass in A3 (P=0.047), B1
(P=0.0004), and B3 (P=0.055), but not in A1 (P=0.37). The three-harvests environments had
no richness x year interaction (P=0.42 for A3 and P=0.91 for B3), therefore, a model without
interaction was fit, where biomass was a log linear function of richness (b1=91.7, P=0.012 for
A3 and b1=138.4, P=0.0065 for B3). A richness x year interaction was found only in B1
(P=0.052), although the slopes for all years were positive (b1=106.4, P=0.041 for 2004,
b1=241.4, P<0.0001 for 2005, and b1=163.1, P=0.011 for 2006). There was not a consistent
trend of either strengthening or weakening of the relationship with time. For all environments
biomass differed among years (P<0.0001).
82
Alfalfa in the multiple-harvests regime and intermediate wheatgrass in the single-harvest
regime were two individual species that were shown previously to affect the biomass-
richness relationship (Picasso et al., 2008). The three way interaction of richness x year x
species (intermediate wheatgrass for single-harvest and alfalfa for multiple-harvests) was
found for the single-harvest management (P<0.0001 for A1 and P=0.002 for B1), but not for
the multiple-harvests (P=0.05 for A3 and P=0.08 for B3). Biomass of plots with alfalfa was
consistently higher than that in plots without alfalfa across richness levels (i.e., no interaction
richness by alfalfa was found). The interaction richness x species was tested for each year
separately in the single harvest system, and it was found for B1 in 2004 and A1 in 2005.
However, in these two situations biomass of plots with intermediate wheatgrass was usually
higher than that in plots without intermediate wheatgrass across richness levels (i.e., there
was no crossover, only magnitude differences).
Overyielding and mechanisms
A positive net richness effect was observed across all environments for all richness levels
(Fig. 4.1). Therefore, polyculture yields were greater than the average of the component
species in monoculture; in other words, the polycultures exhibited overyielding. In Boone,
overyielding was similar across richness levels, but in Ames, the overyielding was larger for
polycultures with more than three species. A positive complementarity effect was also
observed across all environments, and the effect was larger at higher richness levels (Fig.
4.1). This indicated that on average the species in polycultures had relative yields greater
than expected based on their seeded proportion (i.e., species overyielding was observed). No
selection effect was present at any richness level in A1, A3, and B3. However, in B1, a
negative selection effect was observed, in which polycultures with higher richness values had
a larger negative selection effect.
The relative yield deviation (∆RYi,) of orchardgrass ranged from 0.4 to 1.8 and was
the largest of all species in polycultures across all richness levels in all environments,
indicating orchardgrass overyielding was highest. Relative yield deviation for alfalfa ranged
between 0 and 0.3 across richness levels in all environments. The relative yield deviations for
all other species were usually zero across richness levels in all environments.
83
Stability analysis
Monocultures and polycultures displayed a wide range of linear coefficients and RMSE
(Table 4.2). Entries with linear coefficients equal to zero had the lowest mean yields across
environment-years. Alfalfa had the highest coefficient (b1=2.4 ± 1.3), which was
significantly greater than one (P<0.1), indicating that this species in monoculture has yields
above average in high productivity environment-years, and below average in low
productivity situations. White clover, Illinois bundleflower, intermediate wheatgrass, and
Maximilian sunflower had coefficients equal to one, indicating that these species had yields
parallel to the environment-year mean, and therefore are stable according to the Type II
stability definition. Orchardgrass, switchgrass, and eastern gamagrass had coefficients lower
than one and not different from zero (P<0.1), indicating that they have constant yields across
environment-years. The two monocultures with highest yields across environment-years
(alfalfa and intermediate wheatgrass) had the two highest RMSE values for monocultures,
and therefore, the lowest Type III stability. All polycultures with more than four seeded
species had higher Type III stability than the two highest monocultures.
When the regressions were calculated across entries by richness level, all linear
coefficients of polycultures were equal to one (Fig 2a), indicating Type II stability.
Monocultures had average linear coefficient lower than one. Also, polycultures with
increasing seeded richness had increasingly lower RMSE values as a trend, and therefore,
higher Type III stability.
All entries with alfalfa had both higher linear coefficients and higher yield across
environment-years than entries without alfalfa (Fig 2b). Within the entries with alfalfa, those
with wheatgrass had lower linear coefficients than those without wheatgrass. Within the
entries without alfalfa, those with wheatgrass had higher overall means than those without
wheatgrass.
DISCUSSION
84
Effect of richness over time
The lack of richness x year interaction across environments in our experiment with high
yielding species in agricultural conditions provides further evidence that richness effects are
not transient, as many ecological studies have shown (Hector et al., 2007; Hooper and Dukes,
2004; Tilman et al., 2006b; van Ruijven and Berendse, 2005). The diverse polycultures had
similar yields as the highest yielding species in monoculture, which were the same for the
three years. The production difference between the highest yielding species in monoculture
and the other species decreased over time, and changes in the ranking of species for
monoculture yields are likely in future years (e.g., switchgrass in the single harvest system
continuously increased its yields and reached the yields of wheatgrass by 2006, while
wheatgrass continuously decreased yields over time). In perennial plant communities, long
term changes are central to deciding which species or combination of species to plant.
Although in the short term the best adapted monocultures are no different than the
polycultures, in the long term polycultures may be advantageous and transgressive
overyielding may be observed more often.
Complementarity and selection effects
Across all environments and richness levels, the net richness effect was positive; that is,
polyculture overyielding was observed. Complementarity effects were positive and the
selection effects either negative or zero. Complementarity arises when the average relative
yield deviation is greater than zero. In the absence of a selection effect, the polyculture will
exhibit overyielding if complementarity is present. However, complementarity may be
counteracted by a negative selection effect, resulting in a polyculture that does not exhibit
overyielding. In our experiment the two species, orchardgrass and alfalfa, showed
overyielding—i.e., they consistently had RY∆ greater than zero, whereas most other species
had RY∆ consistently less than zero. This suggests that orchardgrass and alfalfa were largely
responsible for the positive complementarity effect. The largest complementarity effect was
the result of orchardgrass overyielding in polycultures with legumes. Although we did not
85
measure plant nitrogen, orchardgrass leaves in polycultures were visually greener than leaves
in monocultures. This suggests that nitrogen facilitation may have explained the
complementarity effect, consistent with other experiments that measured nitrogen pools (see
e.g., Fargione et al., 2007).
Positive selection effects are observed when species with highest yields in monoculture
overyield in polycultures and low yielding monocultures perform poorly in polycultures. In
contrast, negative selection effects exist when species with lowest yields in monoculture
overyield in polycultures and species with high monoculture performance underyield. In our
experiment, alfalfa in general was highly productive in monoculture and overyielded in
mixtures, intermediate wheatgrass was highly productive in A1 but did not overyield in
mixtures, and orchardgrass yielded poorly in monocultures but highly overyielded in
mixtures in all environments. As a result, in most environments no selection effects were
observed because the positive effect of alfalfa was cancelled out by negative effect of
orchardgrass. In A1, a negative selection effect was observed due to orchardgrass
overyielding and intermediate wheatgrass, with a high monoculture performance not
overyielding in mixture.
Our results are consistent with the BIODEPTH experiment at multiple sites throughout
Europe (Hector et al., 1999) where across sites polycultures overyielded and
complementarity effects were positive, but selection effects were variable. Also, long term
experiments on Minnesotan grasslands showed that the complementarity effect increased
consistently over time, whereas the selection effect was positive during the first two years
and negative later (Fargione et al., 2007). This shift occurred because monoculture yields
changed with time as initially low yielding species became the highest yielding ones in later
years (Fargione et al., 2007). A negative selection effect has been observed in communities
with varying evenness and richness (2003) and in polycultures containing a grass
(Arrhenatherum elatius [L.] P.Beauv. ex J. Presl et C. Presl) with high monoculture
performance which reduced all other species in mixtures (Roscher et al., 2007). Species that
increase overyielding by increasing the relative yields of other species, due to improving
nitrogen availability for instance, can produce a positive selection effect, as observed for
Trifolium pratense L., T. repens L. (Roscher et al., 2007). Finally a recent meta-analyses of
86
plant experiments found that complementarity increased with time in experiments, while
selection effects remained constant (Cardinale et al., 2007). Overyielding and the probability
of transgressive overyielding (i.e., when the polyculture yield is greater than the highest
yielding monoculture) increased in experiments that ran for longer timeframes because
complementarity effects among species increased with time (Cardinale et al., 2007). Since
most experiments are short term and transgressive overyielding in plant communities may
take five years to be observed, the potential for transgressive overyielding has likely been
underestimated.
Stability, productivity, and adaptation
From an agricultural perspective stability must be evaluated together with productivity.
Three ways to define agricultural stability were considered: Type I stability refers to
constant yields across environments; Type II stability occurs when the entry performs
parallel to the mean of all other entries for the environments; and Type III stability refers to
the variability in yields measured as deviations to the regression line of entry means versus
environmental mean (Bernardo, 2002).
The ideal perennial polyculture would have at the Type I stability and maximum yields.
However, Type I stability in our experiment was usually expressed by entries with low yields
(Table 4.2), as is also the case in plant breeding (Bernardo, 2002). The two exceptions to this
general rule were the intermediate wheatgrass monoculture and the intermediate wheatgrass-
white clover mixture, which had yields above the average and expressed Type I stability
(Table 4.2). These entries may be worth considering for low productivity environments.
Polycultures of all richness levels had Type II stability because polycultures had linear
coefficients equal to one and more Type III stability than the average of monocultures
because of lower RMSE. Furthermore, polycultures with increasing richness had increasing
Type III stability as a trend (Fig 2a). Compared to the two top yielding monocultures (alfalfa
and intermediate wheatgrass), the more species rich polycultures (i.e., those comprising 4, 6,
or 8 species) had lower variability in yields (Type III stability) and they were more
productive in environment-years when the top monocultures did not perform well (Fig 2a).
87
Entries with linear regression coefficients greater than one are considered to be adapted
to high productivity environments, whereas entries with linear coefficients lower than one are
considered adapted to low productivity environments (Fig. 4.2a) (Finlay and Wilkinson,
1963). A specific polyculture is ecologically adapted to a certain environment if it shows
higher productivity in that environment relative to the other environments. Polycultures with
alfalfa, for instance, located in the top right corner of Fig. 4.2b, can respond to high
productivity environments better than other polycultures. The inclusion of wheatgrass in
polycultures either increased yield (in absence of alfalfa) or increased stability (in presence
of alfalfa). Species-rich polycultures that included alfalfa and intermediate wheatgrass
provided the best alternative for optimizing yields and stability across environment-years
(Figs. 2a, b). In fact, in high productivity environment-years, polycultures yielded as much as
alfalfa, and in low productivity environment-years polycultures yielded as much as
intermediate wheatgrass.
These analyses revealed that biomass productivity should not be the only variable
considered when comparing polycultures to monocultures, or polycultures across different
richness levels. Stability, productivity, and ecological adaptability to specific environments
are important criteria to consider, especially in those perennial polyculture systems designed
for marginal lands. The combined use of regression and stability diagrams as described here
may enhance the interpretation of results of other biodiversity – productivity experiments
across environments and years.
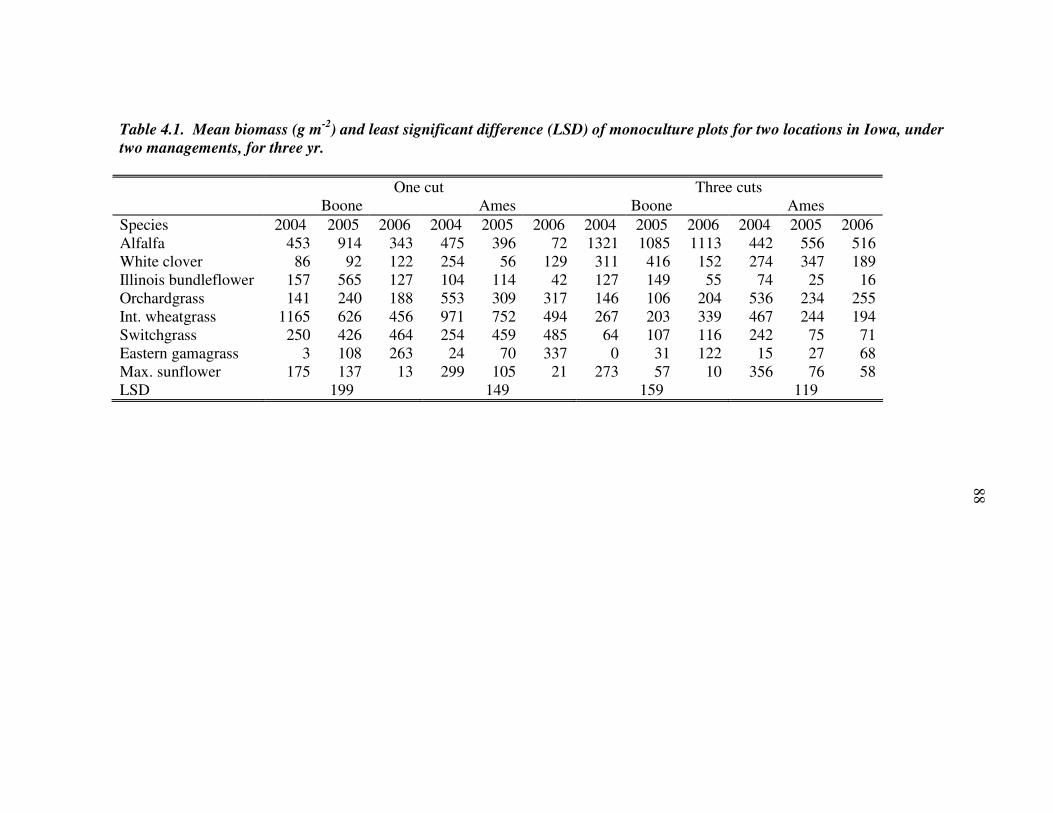
Table 4.1. Mean biomass (g m-2
) and least significant difference (LSD) of monoculture plots for two locations in Iowa, under
two managements, for three yr.
One cut Three cuts Boone Ames Boone Ames
Species 2004 2005 2006 2004 2005 2006 2004 2005 2006 2004 2005 2006 Alfalfa 453 914 343 475 396 72 1321 1085 1113 442 556 516 White clover 86 92 122 254 56 129 311 416 152 274 347 189 Illinois bundleflower 157 565 127 104 114 42 127 149 55 74 25 16 Orchardgrass 141 240 188 553 309 317 146 106 204 536 234 255 Int. wheatgrass 1165 626 456 971 752 494 267 203 339 467 244 194 Switchgrass 250 426 464 254 459 485 64 107 116 242 75 71 Eastern gamagrass 3 108 263 24 70 337 0 31 122 15 27 68 Max. sunflower 175 137 13 299 105 21 273 57 10 356 76 58 LSD 199 149 159 119
88
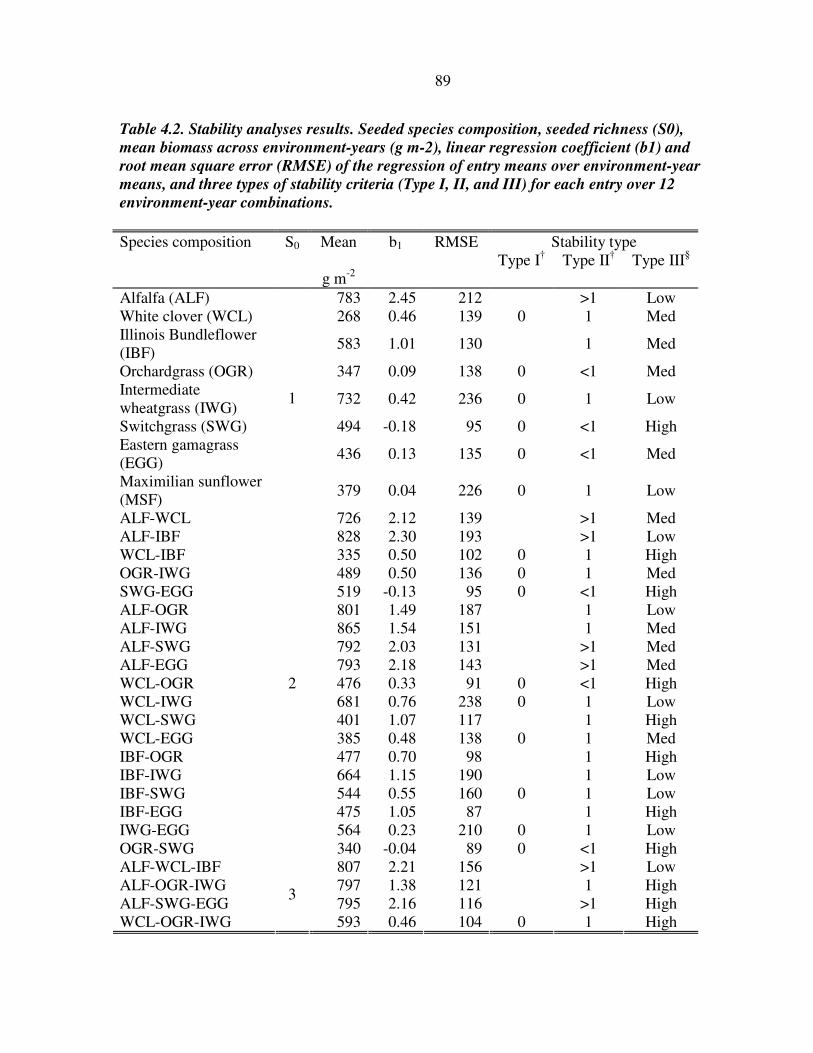
89
Table 4.2. Stability analyses results. Seeded species composition, seeded richness (S0),
mean biomass across environment-years (g m-2), linear regression coefficient (b1) and
root mean square error (RMSE) of the regression of entry means over environment-year
means, and three types of stability criteria (Type I, II, and III) for each entry over 12
environment-year combinations.
Species composition S0 Mean b1 RMSE Stability type Type I† Type II† Type III§ g m-2
Alfalfa (ALF) 783 2.45 212 >1 Low White clover (WCL) 268 0.46 139 0 1 Med Illinois Bundleflower (IBF)
583 1.01 130 1 Med
Orchardgrass (OGR) 347 0.09 138 0 <1 Med Intermediate wheatgrass (IWG)
732 0.42 236 0 1 Low
Switchgrass (SWG) 494 -0.18 95 0 <1 High Eastern gamagrass (EGG)
436 0.13 135 0 <1 Med
Maximilian sunflower (MSF)
1
379 0.04 226 0 1 Low
ALF-WCL 726 2.12 139 >1 Med ALF-IBF 828 2.30 193 >1 Low WCL-IBF 335 0.50 102 0 1 High OGR-IWG 489 0.50 136 0 1 Med SWG-EGG 519 -0.13 95 0 <1 High ALF-OGR 801 1.49 187 1 Low ALF-IWG 865 1.54 151 1 Med ALF-SWG 792 2.03 131 >1 Med ALF-EGG 793 2.18 143 >1 Med WCL-OGR 476 0.33 91 0 <1 High WCL-IWG 681 0.76 238 0 1 Low WCL-SWG 401 1.07 117 1 High WCL-EGG 385 0.48 138 0 1 Med IBF-OGR 477 0.70 98 1 High IBF-IWG 664 1.15 190 1 Low IBF-SWG 544 0.55 160 0 1 Low IBF-EGG 475 1.05 87 1 High IWG-EGG 564 0.23 210 0 1 Low OGR-SWG
2
340 -0.04 89 0 <1 High ALF-WCL-IBF 807 2.21 156 >1 Low ALF-OGR-IWG 797 1.38 121 1 High ALF-SWG-EGG 795 2.16 116 >1 High WCL-OGR-IWG
3
593 0.46 104 0 1 High
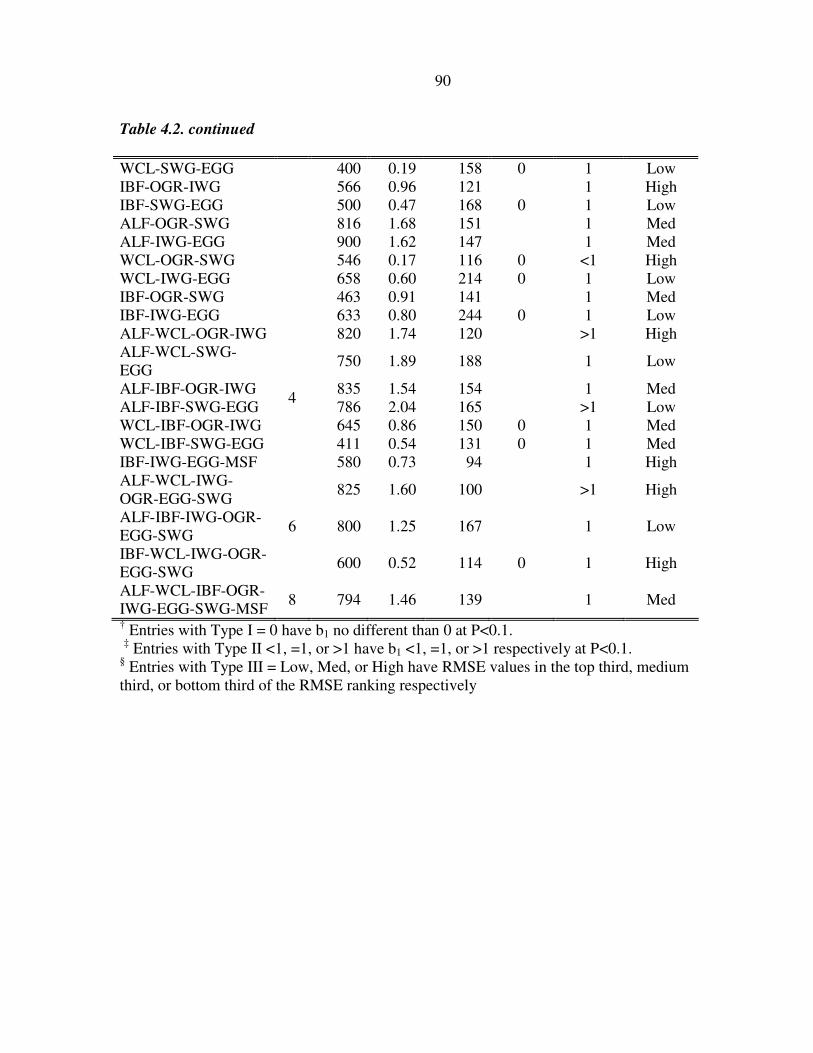
90
Table 4.2. continued
WCL-SWG-EGG 400 0.19 158 0 1 Low IBF-OGR-IWG 566 0.96 121 1 High IBF-SWG-EGG 500 0.47 168 0 1 Low ALF-OGR-SWG 816 1.68 151 1 Med ALF-IWG-EGG 900 1.62 147 1 Med WCL-OGR-SWG 546 0.17 116 0 <1 High WCL-IWG-EGG 658 0.60 214 0 1 Low IBF-OGR-SWG 463 0.91 141 1 Med IBF-IWG-EGG
633 0.80 244 0 1 Low ALF-WCL-OGR-IWG 820 1.74 120 >1 High ALF-WCL-SWG-EGG
750 1.89 188 1 Low
ALF-IBF-OGR-IWG 835 1.54 154 1 Med ALF-IBF-SWG-EGG 786 2.04 165 >1 Low WCL-IBF-OGR-IWG 645 0.86 150 0 1 Med WCL-IBF-SWG-EGG 411 0.54 131 0 1 Med IBF-IWG-EGG-MSF
4
580 0.73 94 1 High ALF-WCL-IWG-OGR-EGG-SWG
825 1.60 100 >1 High
ALF-IBF-IWG-OGR-EGG-SWG
800 1.25 167 1 Low
IBF-WCL-IWG-OGR-EGG-SWG
6
600 0.52 114 0 1 High
ALF-WCL-IBF-OGR-IWG-EGG-SWG-MSF
8 794 1.46 139 1 Med
† Entries with Type I = 0 have b1 no different than 0 at P<0.1. ‡ Entries with Type II <1, =1, or >1 have b1 <1, =1, or >1 respectively at P<0.1. § Entries with Type III = Low, Med, or High have RMSE values in the top third, medium third, or bottom third of the RMSE ranking respectively
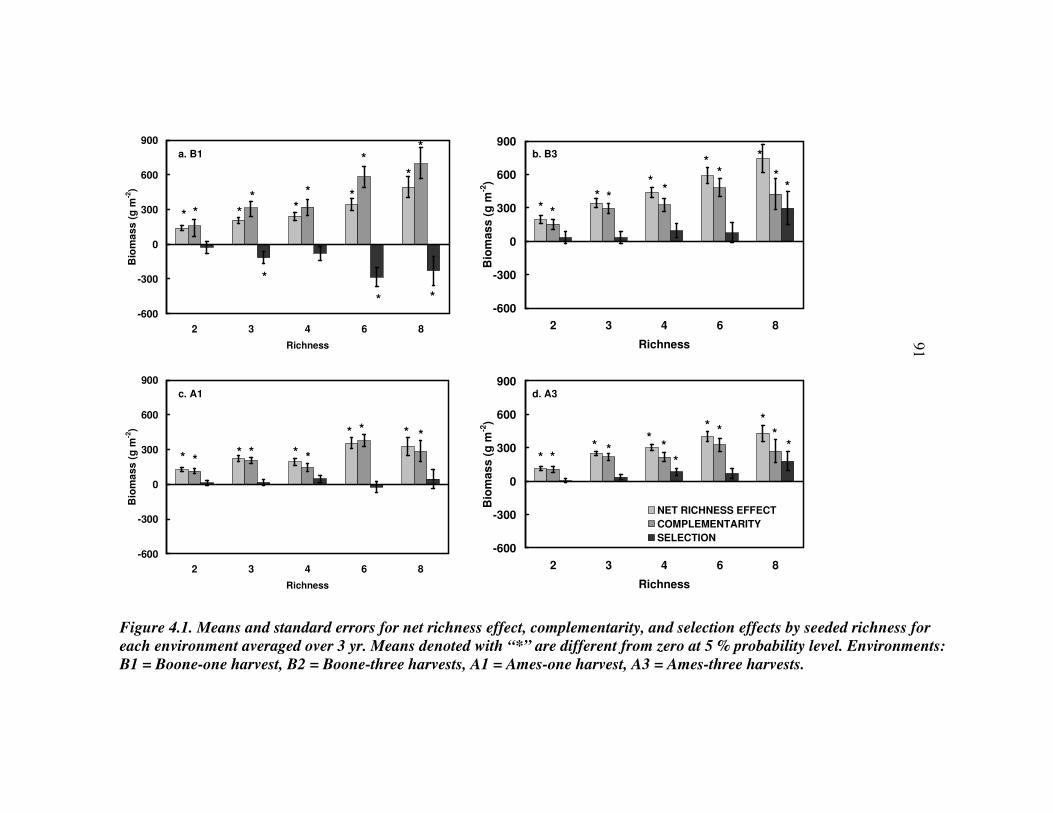
a. B1
-600
-300
0
300
600
900
2 3 4 6 8
Richness
Bio
ma
ss
(g
m-2
)
*
* * **
*
* *
* *
*
**
b. B3
-600
-300
0
300
600
900
2 3 4 6 8
Richness
Bio
mas
s (
g m
-2)
** *
*
**
**
*
**
c. A1
-600
-300
0
300
600
900
2 3 4 6 8
Richness
Bio
ma
ss
(g
m-2
)
* ** *
*
* *
* * *
d. A3
-600
-300
0
300
600
900
2 3 4 6 8
Richness
Bio
mas
s (
g m
-2)
NET RICHNESS EFFECT
COMPLEMENTARITY
SELECTION
* ***
**
*
* **
**
Figure 4.1. Means and standard errors for net richness effect, complementarity, and selection effects by seeded richness for
each environment averaged over 3 yr. Means denoted with “*” are different from zero at 5 % probability level. Environments:
B1 = Boone-one harvest, B2 = Boone-three harvests, A1 = Ames-one harvest, A3 = Ames-three harvests.
91
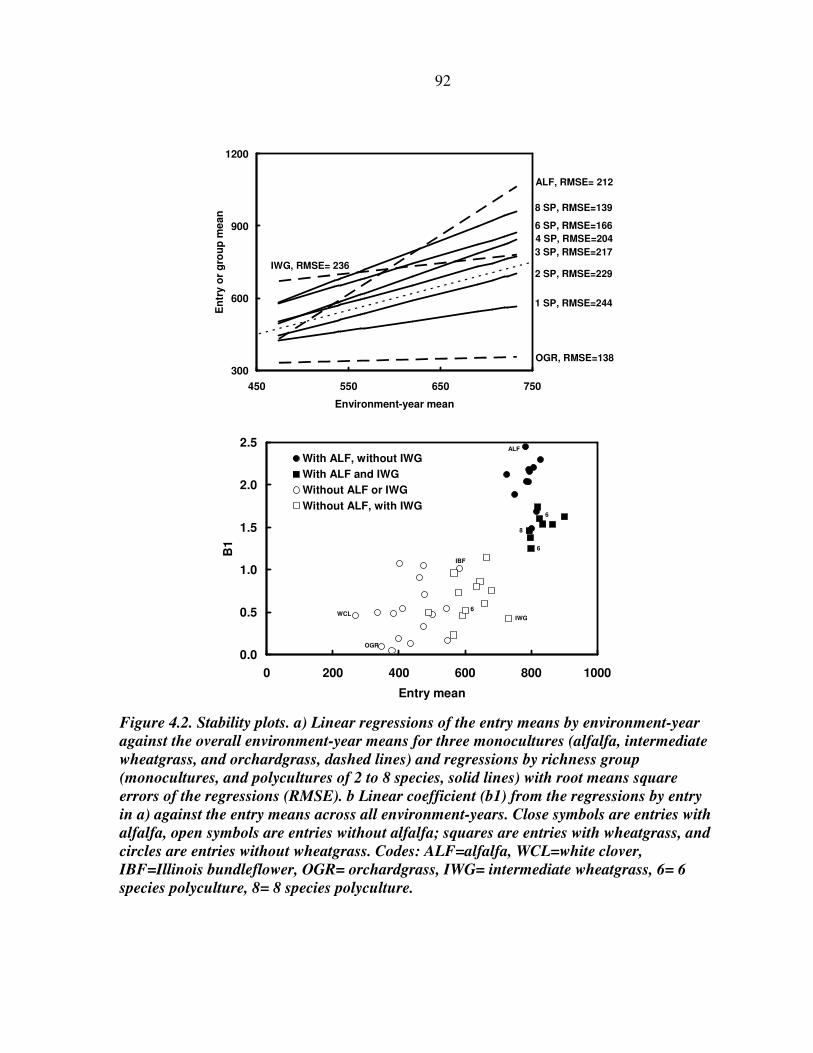
92
300
600
900
1200
450 550 650 750
Environment-year mean
En
try
or
gro
up
me
an
3 SP, RMSE=217
4 SP, RMSE=204
6 SP, RMSE=166
8 SP, RMSE=139
1 SP, RMSE=244
2 SP, RMSE=229
ALF, RMSE= 212
OGR, RMSE=138
IWG, RMSE= 236
0.0
0.5
1.0
1.5
2.0
2.5
0 200 400 600 800 1000
Entry mean
B1
With ALF, without IWG
With ALF and IWG
Without ALF or IWG
Without ALF, with IWG
8
6
6
6
ALF
IWGWCL
OGR
IBF
Figure 4.2. Stability plots. a) Linear regressions of the entry means by environment-year
against the overall environment-year means for three monocultures (alfalfa, intermediate
wheatgrass, and orchardgrass, dashed lines) and regressions by richness group
(monocultures, and polycultures of 2 to 8 species, solid lines) with root means square
errors of the regressions (RMSE). b Linear coefficient (b1) from the regressions by entry
in a) against the entry means across all environment-years. Close symbols are entries with
alfalfa, open symbols are entries without alfalfa; squares are entries with wheatgrass, and
circles are entries without wheatgrass. Codes: ALF=alfalfa, WCL=white clover,
IBF=Illinois bundleflower, OGR= orchardgrass, IWG= intermediate wheatgrass, 6= 6
species polyculture, 8= 8 species polyculture.
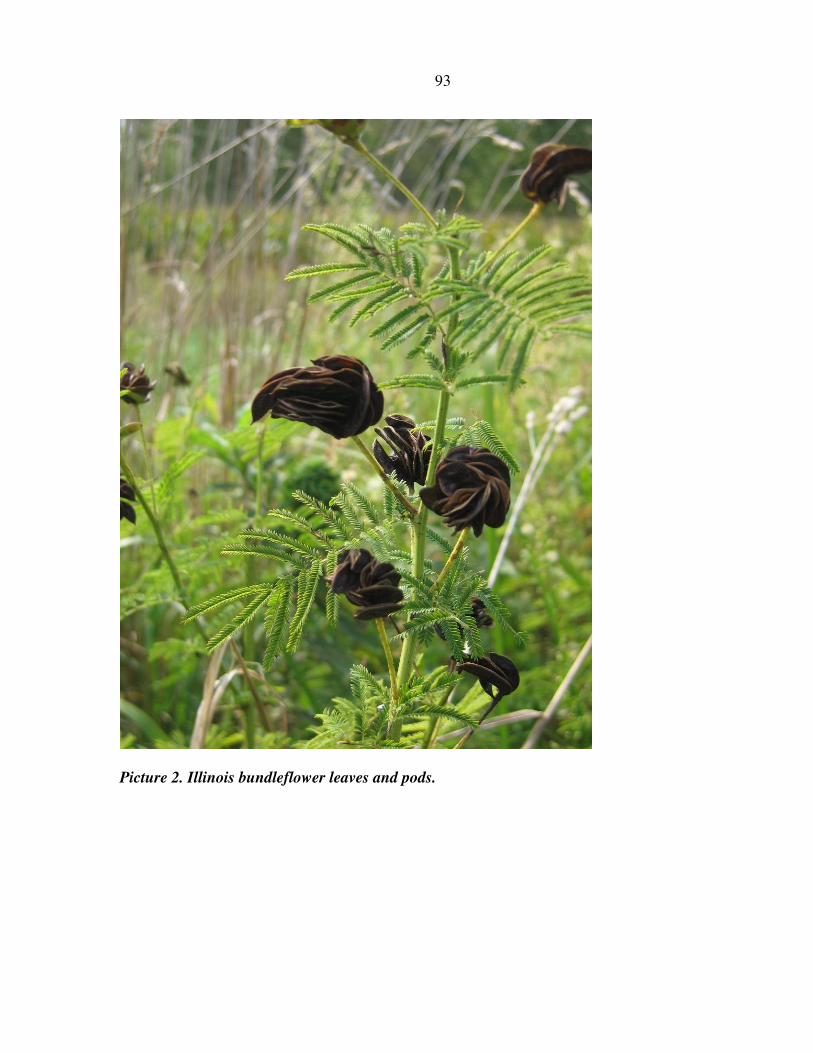
93
Picture 2. Illinois bundleflower leaves and pods.
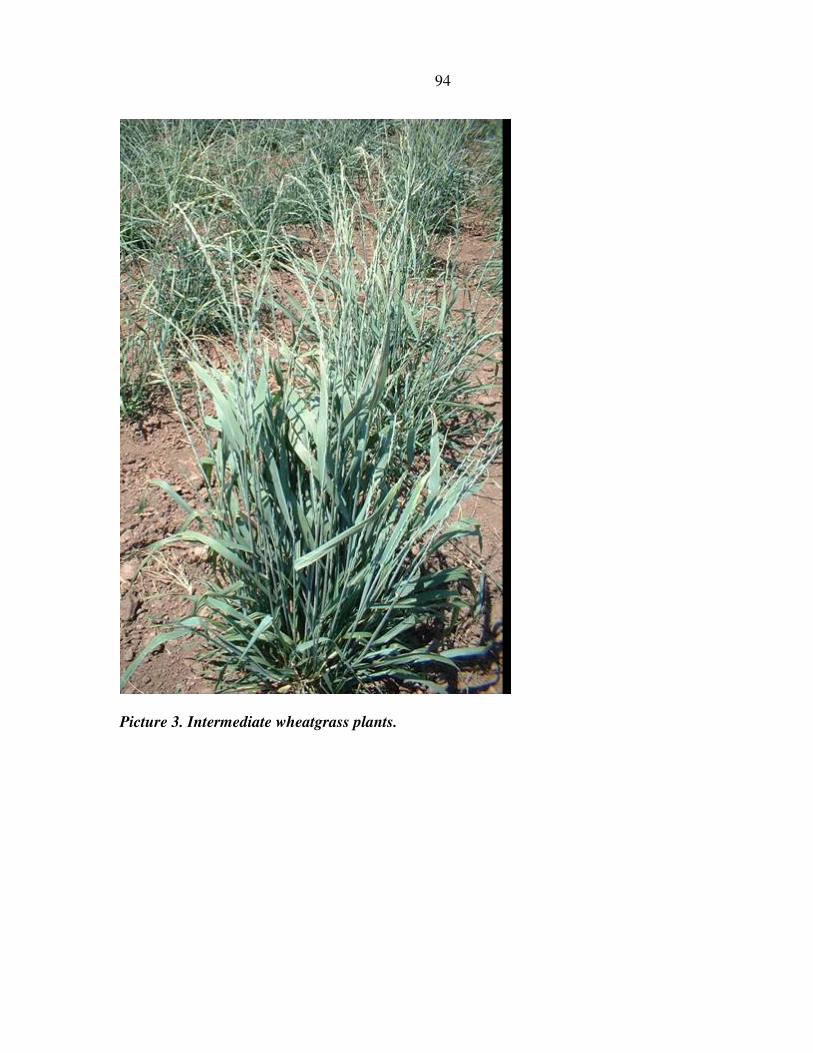
94
Picture 3. Intermediate wheatgrass plants.
95
CHAPTER V. SEED YIELD, FORAGE PRODUCTION, AND COMPETITIVE
ABILITY OF PERENNIAL CROPS IN POLYCULTURES
A paper to be submitted to Crop Science
Valentín D. Picasso1, E. Charles Brummer2, and Matt Liebman3
ABSTRACT
Perennial polycultures have ecological advantages over annual monocultures, but they
must also produce high grain or forage yields and suppress weeds effectively to be grown
profitably. In a replicated study at two sites in Iowa over three years, we measured seed and
forage yield, and weed suppression of two perennial grains (Illinois bundleflower
[Desmanthus illinoensis (Michx.) MacM. ex B.L. Robins. & Fern.] and intermediate
wheatgrass [Thinopyrum intermedium (Host) Barkworth & D.R. Dewey]) in monoculture and
polycultures. Wheatgrass produced its largest seed yield in the second year after seeding
(65.8 ± 6.5 g m-2), whereas bundleflower seed did so in the third year (55.0 ± 8.1 g m-2). The
mixture comprising both perennial grains produced as much seed as the best yielding
monoculture each year. Polycultures of bundleflower with C4 grasses and of wheatgrass with
legumes produced as much seed as the monocultures. Most polycultures produced more total
forage than did monocultures of bundleflower or wheatgrass. Wheatgrass demonstrated high
competitive ability by producing seed yields equal to or greater than expected based on its
proportion in the polyculture in all cases. Polycultures containing bundleflower or wheatgrass
with highly competitive companions exerted greater weed suppression than wheatgrass or
bundleflower monocultures but in most cases they had reduced seed yields. Future research
should focus on breeding and management of crop mixtures to minimize competition among
crops while maximizing weed suppression.
1 PhD candidate in Sustainable Agriculture, Iowa State University, senior author 2 Professor in Forage and Biomass Crop Breeding, Center for Applied Genetic Technologies, Crop and Soil Sciences Department, University of Georgia 3 Professor in Agronomy, Agronomy Department, Iowa State University
96
INTRODUCTION
Annual grain monoculture systems in the North Central USA are highly productive, but
they contribute to serious ecological problems, including soil erosion (Pimentel et al., 1987),
nutrient leaching (Dinnes et al., 2002), and hypoxia in the Gulf of Mexico (Rabalais et al.,
2002). The native prairies replaced by modern agriculture were diverse mixtures of
predominantly perennial species and they lacked these environmental problems, though they
produced no harvestable grain (Jackson, 2002). Perennial grain polycultures, i.e., mixtures of
herbaceous plants harvested for seed, have been proposed as food production systems with
the ecological advantages of perennial cover and diversity (Glover, 2005). Development of
perennial grain polycultures with adequate yield will require breeding of perennial grain
crops (Cox et al., 2006; DeHaan et al., 2005; Sacks et al., 2003) and agroecological studies to
develop best management practices (Cox et al., 2005; Crews, 2005). Perennial grain
polycultures have potential application in current low input systems on marginal lands
(Ploschuck et al., 2005; Scheinost et al., 2001; Weik et al., 2002a) and as double purpose
crops for forage (or biomass) or grain.
Illinois bundleflower (hereafter, referred to as bundleflower) and intermediate wheatgrass
(hereafter, wheatgrass) are two promising perennial grain species currently being bred for
forage and grain production (Cox et al., 2002; DeHaan et al., 2005; Fischbach et al., 2005b).
Bundleflower is a North American native perennial herbaceous warm-season (C4) legume,
found in the USA from Minnesota to Florida. Its forage biomass yield in weed-free
monocultures ranges from 4.9 Mg ha-1 in Iowa (DeHaan et al., 2003) to 23.8 Mg ha-1 in
Florida (Adjei and Pitman, 1993). Its seed yield in monoculture ranges from 1.7 Mg ha-1 in
Iowa (DeHaan et al., 2003) to 3.4 Mg ha-1 in Florida (Adjei and Pitman, 1993), with a seed
protein content of 380 g kg-1 (Kulakow, 1999). Bundleflower has shown compatibility for
forage production with various C4 grasses (Piper, 1998; Springer et al., 2001).
Wheatgrass is a cool season grass native to central Europe, the Balkans, and Asia Minor,
with wide adaptation and high forage productivity in the USA (Sleugh et al., 2000). It is
being bred to increase seed production and also being crossed with annual wheat (Triticum
aestivum L.) to obtain perennial wheat hybrids (Cox et al., 2002; Jones, 1999). Seed yields of
up to 1.0 Mg ha-1 have been reported in Canada (Kruger, 1997). Forage yields of 4.0 and 2.6
97
Mg ha-1 were reported for the second and third year after seeding in Iowa in fertilized
monoculture plots (Sleugh et al., 2000). In Kansas, forage yield up to 12.1 Mg ha-1 was also
reported (Harmoney, 2005)
Perennial polyculture systems need to include species that have the ability to yield well in
competition with other plants and that can suppress weeds given that tillage and broad
spectrum herbicides are not management options (Weik et al., 2002b). Plant spatial diversity
at the field scale (e.g., mixtures of genotypes with resistance to different disease races or
mixtures of species with contrasting resource use patterns) has been shown to suppress
weeds, pests, and diseases in agroecosystems (Cox et al., 2005; Knops et al., 1999; Liebman,
1995; Loreau et al., 2001; Wolfe and Barrett, 1980; Zhu et al., 2000). Functional differences
among species, usually summarized in terms of taxonomic functional groups (e.g., legumes,
C3 grasses, C4 grasses) can explain the positive effects of diversity on productivity and
suppression of invaders (Diaz and Cabido, 2001; Hooper and Dukes, 2004; Reich et al.,
2004)). Species in polycultures may interact in multiple ways (e.g., competition or
facilitation) resulting in positive or negative net outcomes, depending on the environment
and the species competitive abilities relative to each other and to weeds. Therefore the
species to include in the polyculture must be carefully chosen for each environment and their
competitive ability in mixtures evaluated. Optimal polycultures for each environment will be
those assemblies of species which maximize yield and suppression of weeds and pests. Some
agronomic benefits, such as weed suppression or nitrogen fixation, may need to be
contributed by species other than the perennial grains themselves.
The objective of this study was to determine seed yield, forage production, and
competitive ability of two perennial dual purpose crops (Illinois bundleflower and
intermediate wheatgrass) in monoculture and polycultures in order to detect optimal species
combinations for polyculture systems. We hypothesized that (1) the binary mixture of
bundleflower and wheatgrass would outperform the constituent monocultures in terms of
seed, forage, and protein yields and competitive ability with weeds; (2) companion species
from different functional groups would enhance production of the mixture compared to
companion species from the same functional group; (3) bundleflower and wheatgrass would
exhibit good competitive ability in polycultures with other perennial companions by
98
producing as much or more seed and forage than expected based on their proportion in the
mixture; and (4) perennial polycultures including highly competitive companion species
increase weed suppression without reducing yield compared to monocultures.
MATERIALS AND METHODS
Experimental design
We seeded the two perennial grains (Illinois bundleflower and intermediate wheatgrass)
in monoculture and polycultures of two and three species. Five other companion perennial
species represented three taxonomic functional groups: legumes (alfalfa, [Medicago sativa
L.], white clover [Trifolium repens L.]), C3 grasses (orchardgrass [Dactylis glomerata L.]),
and C4 grasses (switchgrass [Panicum virgatum L.] and eastern gamagrass [Tripsacum
dactyloides (L.) L.]). These companion species also represented a range of competitive
abilities with alfalfa and orchardgrass being highly competitive perennial forages,
switchgrass and eastern gamagrass slow establishing species, and white clover a low-growing
nitrogen source. These species were also considered proxies for species that may be
developed for future grain polycultures and thus could serve to provide an estimate of the
competitive ability of bundleflower and wheatgrass. A total of 21 species combinations
(hereafter, referred to as entries) were analyzed for this experiment.
Bundleflower seeds were obtained from the University of Minnesota and derive from two
collections in Iowa (PNL 545 at Dubuque, IA, and PNL 539 at Spirit Lake, IA). Wheatgrass
seeds were from the commercial forage cultivar Oahe. Companion species seeds were
commercial forage cultivars (alfalfa cv. 54H51, white clover cv. Alice, orchardgrass cv.
Duke, switchgrass cv. Cave-in-Rock, and eastern gamagrass cv. PMK-24). Seed density for
monocultures of bundleflower was 199 PLS m-2, and intermediate wheatgrass 239 PLS m-2.
Monoculture seed density for alfalfa was 838 PLS m-2, white clover 795 PLS m-2,
orchardgrass 1625 PLS m-2, switchgrass 621 PLS m-2, and eastern gamagrass 15 PLS m-2
based on standard agronomic recommendations for Iowa (Barnhart, 1999). Seed density for
each species in polyculture was reduced proportionately to the number of species (e.g., the
density of each species was half the monoculture rate for binary mixtures). Substitutive (i.e.,
99
replacement) designs like this one change simultaneously species richness and species
density, so these two effects are impossible to separate in the interpretation of results
(Connolly et al., 2001b). However, mixtures assembled in a substitutive design are more
typical of agronomic situations than additive ones since the interest is identifying the highest
yielding combination of species regardless of the causal mechanistic effects.
Each entry was replicated three times in an alpha-lattice design (Patterson and Williams,
1976) at two locations in Iowa, USA: the Iowa State University Agronomy and Agricultural
Engineering Research Farm, east of Boone, Boone Co., IA, with a Nicollet loam soil (fine-
loamy, mixed, superactive, mesic Aquic Hapludolls) and the ISU Hinds Research Farm,
north of Ames, Story Co., IA, with a Spillville loam soil (fine-loamy, mixed, superactive,
mesic Cumulic Hapludolls). Soil analyses for these sites were reported elsewhere (see
Picasso et al., 2008). The entire plot area was tilled before planting in spring 2003. The
experiment was planted on 18 May 2003 in Ames and 21 May 2003 in Boone. Seeds were
drilled into 4-m by 3-m plots with row spacing of 0.15-m. No fertilizer was applied. Plots
were mowed on 18 June and 12 Sept. 2003 in Boone, and on 20 June and 13 Sept. 2003 in
Ames, to a 0.15-m height to control weeds; biomass was not measured or removed. Eastern
gamagrass failed to establish in 2003 so it was reseeded by hand in April 2004. In the second
year of the experiment (2004), each plot was split into two 2-m x 3-m sub-plots: in one sub-
plot forage biomass was harvested three times (May, July, September each year) and
removed during the season, while in the other sub-plot seeds were harvested by hand and
removed, but total biomass was mowed in October and not removed. The same management
was used in the third year (2005). These two contrasting managements represent the two
extremes on a continuum of uses for double purpose crops in perennial polycultures, from
forage harvest only to seed harvest only.
For the forage management system, aboveground plant biomass was harvested on 26
May, 13 July, and 13 Sept. 2004 and 25 May, 8 July, and 22 Aug. 2005 in Boone, and on 28
May, 15 July, and 16 Sept. 2004 and 3 June, 27 July, and 15 Sept. 2005 in Ames. A single 1-
m wide by 3-m long strip was harvested for biomass through the center of each small sub-
plot with a flail-type harvester (Carter Mfg., Brookston, IN). Before the harvest, biomass was
sampled by clipping two 0.09-m2 quadrats per plot, species were sorted in the laboratory,
100
dried, and weighed. For each plot weed biomass was defined as the sum of biomass of
species not seeded in the experiment (e.g. Conyza canadensis [L.] Cronq.) as well as the
species seeded in the experiment but not seeded in that particular plot (e.g. alfalfa in the
bundleflower monoculture).
For the seed management system, the reproductive structures of bundleflower and
intermediate wheatgrass were hand harvested from the entire sub-plot area as each species
matured. Intermediate wheatgrass seeds were hand harvested on 19 July 2004 and 1 Aug
2005 in Boone and on 24 July 2004 and 3 Aug 2005 in Ames. Bundleflower seeds were hand
harvested on 8 Sept 2004 and between 22 Aug and 1 Sept 2005 in Boone, and on 10 Sept
2004 and 13-21 Sept 2005 in Ames. The harvested material was dried in forced-air drier at
room temperature (12-18 ºC) for 15 days and weighed dry. Seeds were then threshed using a
small plot thresher (Wintersteiger Inc, Salt Lake City, UT) and further cleaned with a Clipper
office tester and cleaner (Seedburo Equipment Co., Chicago, IL) and weighed. Because the
Ames site was adjacent to a woodland, deer grazing severely reduced the bundleflower seed
yield at this location both years, so only the Boone location was used for the bundleflower
seed analyses. Similar feeding effects were not noted for intermediate wheatgrass.
Bundleflower stem density was measured in October 2005 with two 0.5 m2 quadrats per plot
in Boone (stem density was not measured for bundleflower in Ames and was not measured
for wheatgrass at either site).
In order to determine crude protein concentration of seeds and forage, samples from
monoculture plots were ground to pass a 1-mm mesh screen (Cyclone Mill, UDY Mfg., Fort
Collins, CO) and analyzed for nitrogen concentration using micro-Kjeldahl procedure
(Bremner and Breitenbeck, 1983) in the Plant and Soil Analysis Laboratory, Iowa State
University. Crude protein concentration was calculated as nitrogen concentration x 6.25.
Total protein yields were calculated multiplying crude protein concentration by seed or
forage yield for each species. We assumed that protein concentration was characteristic of
each species regardless it was grown in monoculture or in mixture, which may underestimate
the protein concentration of the grass in the mixture (Jorgensen et al., 1999).
Climatic conditions, in particular rainfall, influence seed production. In our study rainfall
between April and September was 657, 576, and 706 mm in 2003, 2004, and 2005
101
respectively, with a 50 year average of 621 mm. Therefore, establishment year was average,
2004 was a dry year (but May was exceptionally wet), and 2005 was a wet year (especially
August and September).
Statistical analyses
The analysis of variance for seed yield, forage yield, and weed biomass was conducted
using a mixed linear model that included locations, replications within location, incomplete
blocks within replication, entry (main plot), and year (split-plot). All factors were considered
fixed effects except replications within locations and blocks within replications. When
significant interactions were found, data were analyzed by location and/or year as
appropriate. Least square means were computed across locations and/or year in the absence
of interactions or if the interactions were due to magnitude, rather than cross-over, effects.
Contrasts were used to compare monoculture means between years, entry means against each
monoculture, and means of polycultures with similar functional composition against
monocultures. A simple linear regression between seed yield and stems per m2 for
bundleflower was calculated using mean values for each entry.
In order to evaluate the relative performance of the binary mixture of bundleflower and
wheatgrass, contrasts for the means of the mixture against each monoculture and against the
average of the monocultures were calculated for seed yield, forage yield, protein content in
forage and seed, and weed biomass for each system. Transgressive overyielding (Trenbath,
1974) can occur when the contrast for the mixture against the highest yielding monoculture is
greater than zero; non transgressive overyielding occurs when the contrast against the
average of monocultures is greater than zero.
In order to evaluate the competitive ability of each perennial grain species against the
companion species in the polyculture, the proportion of expected yield of the target species in
each polyculture (PEYXp) was calculated as: PEYXp=YXp / (YXm * pX ), where YXp is the
yield of species X in polyculture, YXm is the yield of species X in monoculture (averaged
over replications), and pX is the proportion seeded of species X in the polyculture, i.e., pX = 1
/ number of species seeded in our case (adapted from Loreau, 1998). PEYXp is a useful index
to analyze the performance of a species in a polyculture in which only one target species was
harvested, as it was in our case for seed. In order to test whether the yield of a given species
102
in polyculture was different from that expected based on its proportion in the mixture, natural
logarithm transformed PEYXp values were compared with t-tests to the null hypothesis of
zero to avoid the statistical problems of bias of ratios. If ln(PEYXp) > 0 then PEYXp > 1,
meaning that species X yielded more than expected and inter-specific competition would be
less significant than intra-specific competition in the monoculture. If each species in a
polyculture has a PEYXp value greater than one, complementarity of resource use exists
between the species in the polyculture and non-transgressive overyielding is observed.
However, this is not a sufficient condition for transgressive overyielding because the yield
gain of the low yielding species compared to expected may be smaller than the yield loss of
the high yielding one compared to the monoculture yield, particularly when they have very
different monoculture yields (Loreau, 1998). Furthermore, overyielding can occur even if one
species has PEYXp smaller than one, and the other species have PEYXp larger than one,
because yield gain of one species may be larger than yield loss of the other(s). This lack of
ability to show overyielding has also been pointed out for common aggregate indices of
intercropping research, such as Land Equivalent Ratio (Vandermeer, 1989) or Relative Yield
Total (de Wit and van den Bergh, 1965) by Connolly et al. (2001a). The unique value of
PEYXp is that it provides insight into the ecological mechanisms behind the polyculture
performance.
All analyses of variance and contrasts were performed using PROC MIXED, t-tests were
calculated with PROC TTEST, and regression coefficients were calculated using PROC
REG, in the SAS statistical software package (SAS Institute Inc., 2003). Unless otherwise
indicated, statistical significance was assessed at the 5% probability level.
RESULTS AND DISCUSSION
Monocultures
In monoculture, bundleflower seed yield increased four-fold from 14 ± 3 g m-2 in the
second year after seeding to 55 ± 8 g m-2 in the third year in Boone. Wheatgrass produced its
largest seed yield in the second year after seeding of 66 ± 7 g m-2, which then dropped by
half to 27 ± 2 g m-2 in the third year averaged over the two locations (Fig. 5.1a). Wheatgrass
103
produced three times more forage than did bundleflower in monoculture averaged over
locations and years (Fig 1b).
Bundleflower stem density in monoculture plots averaged 43 ± 5 stems m-2 and was
highly correlated with seed yield in October 2005 (r = 0.94, P<0.0001, N=12). Monoculture
stem density was higher than for the mixtures with white clover, alfalfa, and wheatgrass at 9,
15, and 23 ± 5 stems m-2, respectively but no different from the mixtures with switchgrass,
eastern gamagrass, and orchardgrass at 35, 27, and 25 ± 5 stems m-2, respectively.
Crude protein concentration in seed was 411 ± 8 g kg-1 for bundleflower and 150 ± 3 g
kg-1 for wheatgrass. In the forage, crude protein concentration was 165 ± 5 g kg-1 for
bundleflower and 112 ± 5 g kg-1 for wheatgrass, averaged over all three forage harvests,
years, and locations. Protein yield of the mixture was no different than the monoculture with
the highest protein yield (Figure 1c).
Weed invasion was highest in the bundleflower monoculture under the seed management
during the second year after seeding (Fig 1d). Wheatgrass under the seed management was
more competitive with weeds than bundleflower in the second year, but no different in the
third year. Under the forage management, wheatgrass was more competitive than
bundleflower on average over two years and locations (Fig 1d).
Bundleflower – wheatgrass binary mixture
The total seed yield of the bundleflower – wheatgrass binary mixture was no different
than the highest yielding monoculture for each year (Fig. 5.1a). Also, the mixture was no
different than the average of the monocultures both years. The mixture was less variable than
each monoculture between years and provided a sort of insurance: while each monoculture
yielded well in one year and poorly in the other, the mixture always yielded as high as the
best monoculture each year. Total forage yield of the mixture was intermediate to the two
monocultures. Protein concentration in the mixture of seeds and of the combined forage was
also intermediate between both monocultures (Fig. 5.1c). Weed invasion of the mixture was
no different from that of the most competitive monoculture (wheatgrass, Fig. 5.1d), but lower
than the least competitive monoculture (bundleflower).
Considering all variables together, for the seed harvest system, the bundleflower–
wheatgrass mixture produced as much or more seed than either monoculture, and had similar
104
weed suppression, while producing more protein than the grass monoculture. For the forage
system, the mixture produced less forage, and suppressed the same amount of weeds, but
with higher protein content than the grass monoculture. While we rejected our hypothesis
that the mixture would outperform the monocultures in each individual variable, the
advantage of the mixture was evident in terms of reducing yearly variability and maximizing
all variables simultaneously, for the two years studied. Future measurements would be
needed to test this trend in the long term.
Polyculture performance
Yield of each individual species in polycultures is expected to decrease as the number of
species increases because species seeding density was reduced proportional to the number of
species. Therefore individual species performance in polyculture must be evaluated by the
PEY, which allows detecting complementarity among species. The functional group of the
companion species in the polyculture had major effects on bundleflower seed yield and PEY.
On average, polycultures including bundleflower with other legumes or C3 grasses had lower
seed yields than the bundleflower monoculture, as expected. However, polycultures
including bundleflower with C4 grasses were no different than the bundleflower monoculture
(Fig. 5.2a) and switchgrass did not reduce seed yield in bundleflower mixtures (Table 5.1a).
The PEY for bundleflower seed yield in polycultures with legumes or C3 grasses was lower
than one, thus the competitive ability of bundleflower is low relative to the companion
legumes and C3 grasses evaluated. In contrast, polycultures with C4 and both C3 and C4
grasses together had PEY no different from one (Fig 2a, Table 5.1a). Although some plots of
bundleflower with switchgrass had very high seed yields, variability was also high and thus
the observed PEY of 2.5 was no different than one (Table 5.1a). The higher competitive
ability of bundleflower with C4 grasses may be more apparent than real, because C4 grasses
were not fully established the first year. Data from future years are needed to confirm
whether complementarity exists between bundleflower and C4 grasses.
The functional group of the companion species in the polyculture also had important
effects on wheatgrass seed yield and PEY. Polycultures including legumes were no different
than monoculture, whereas polycultures including other grasses had lower seed yields than
the monoculture (Fig. 5.2b). Orchardgrass reduced seed yield and PEY in all mixtures with
105
wheatgrass (Table 5.2a), indicating that this C3 grass was more competitive than wheatgrass.
Polycultures of wheatgrass with the legumes white clover or bundleflower had PEY greater
than one (Table 5.2a), revealing complementarity among these species, likely due to the
effect of nitrogen facilitation from the legumes to wheatgrass.
All polycultures including bundleflower had higher total forage yields compared to the
monoculture, with the exception of the mixtures with C4 grasses, which were no different
than the monoculture (Fig 3a). Bundleflower forage yield was lower than monoculture when
mixed with other legumes, but no different in other polycultures (Fig 3a, Table 5.1b). The
PEY for bundleflower forage was lower than one for mixtures with legumes and no different
than one in all other polycultures (Table 5.1b). Thus, alfalfa and white clover outcompeted
bundleflower (i.e., inter-specific competition was greater than bundleflower intra-specific
competition).
All polycultures including wheatgrass had higher total forage yields compared to the
monoculture (Fig 3b). Wheatgrass forage yield was lower than monoculture when mixed
with orchardgrass but no different in other polycultures (Fig 3b). For forage production, PEY
was lower than one in polycultures including alfalfa or orchardgrass (Table 5.2b), indicating
that these two species were more competitive than wheatgrass.
Weed suppression in polycultures
An entry x year interaction with crossover was present for weed biomass in bundleflower
plots managed for seed, so data are presented by year (Table 5.1a). The identity of the
companion species in the polyculture had greater effects on weed suppression than did the
functional group. The bundleflower monoculture had the highest weed biomass in 2004 and
most polycultures had lower weed biomass than the monoculture, except for the mixtures
with C4 grasses (Table 5.1a) which were no different than the monoculture. In contrast, in
2005 there were no differences in weed biomass of polycultures versus the monoculture,
except the mixtures with alfalfa and orchardgrass (Table 5.1a), which were lower than the
monoculture. Similarly, for the forage harvest system, mixtures with alfalfa, white clover,
and orchardgrass had lower weed biomass than the monoculture (Table 5.1b). Weed biomass
in wheatgrass polycultures managed for seed was no different than that of the monoculture in
most cases (Table 5.2a) except for some polycultures including orchardgrass or alfalfa as
106
companions. For the forage system, all polycultures had lower weed biomass than the
monoculture with the exception of the mixtures comprising only bundleflower or eastern
gamagrass (Table 5.2b).
The weed community observed in the plots comprised both naturally occurring wild
weeds from the soil seed bank (the dominant being horseweed, Conyza canadensis [L.]
Cronq.; others were Chenopodium album [L.], Taraxacum officinale G.H. Weber ex
Wiggers, and Setaria spp.) and voluntary cultivated species from the seed bank or from
adjacent plots. These voluntary cultivated species (predominantly alfalfa and orchardgrass)
dominated the weed community in most plots, so weed suppression was correlated with our
treatments. We could not determine whether plots where alfalfa and orchardgrass were
seeded actually suppressed weeds or if the observed low weed biomass was due to the fact
that alfalfa and orchardgrass were not counted as weeds in those plots.
Monocultures of perennial grains had both high seed yields and high weed biomass
whereas many polycultures had low seed PEY and low weed biomass. This result can
probably be explained by the fact that other forage species are more competitive with
perennial grains than were the weed species.
Seed yields of perennial grains
Bundleflower seed yields increased from the second to the third year after establishment,
which is consistent with the observation that an establishment phase may be needed for
bundleflower at northern latitudes (DeHaan et al., 2003). Bundleflower seed yields averaged
72 g m-2 year-1 across 29 location-year environments from Minnesota to Kansas, in
experiments spanning 1-5 years (DeHaan et al., 2003; Kulakow, 1999; Piper, 1993; Piper,
1998), ranging from 3 to 155 g m-2 year-1 (Piper, 1993). Our results were lower than most
published studies but similar to monoculture yields in southern Minnesota (DeHaan et al.,
2003). We harvested all seeds at one time when the majority of pods were mature, simulating
the harvesting methods that would be done in commercial production. However,
bundleflower has a long period of fruiting and maturing, so many seeds that were lost in our
process were not in other studies in which seed was harvested seed several times. Two other
reasons that may have caused the difference in yields between our study and others are that
most other studies harvested seeds from individual spaced plants, which are unrepresentative
107
of a seeded environment and that most previous studies were weed free, which is not realistic
in low input agriculture systems.
Seed yields of wheatgrass comprising 7 locations with experiments spanning 1 to 15
years in Canada (Darwent et al., 1987; Elliott and Howe, 1977; Kruger, 1997), USA
(Cornforth et al., 2001; Gardner et al., 1990; Wagoner, 1990), and Germany (Weik et al.,
2002a) averaged 35 g m-2 year-1, ranging from 17 g m-2 year-1 in Pennsylvania, USA
(Wagoner, 1990) to 98 g m-2 year-1 in Saskatchewan, Canada (Kruger, 1997). Our wheatgrass
seed yields were within the high end of the range of previously published studies. Our results
are also consistent with literature that shows maximum wheatgrass yields during the fist two
years of establishment (Elliott and Howe, 1977; Wagoner, ; Weik et al., 2002a). However, a
severe storm occurred immediately before our wheatgrass harvest in 2005, which may
explain the lower seed yields in that year.
Bundleflower in the third year after establishment produced approximately 15% of the
average seed yields of commercial soybean in Iowa of 356 g m-2 (USDA, 2007) with greater
protein content (411 vs. 370 g kg-1). Seed yields for wheatgrass in the second year after
establishment were approximately 25% of the average seed yields of oats, 258 g m-2 (USDA,
2007) with higher seed protein concentration (150 vs. 110 g kg-1 (USDA, 2007). These
perennial grain seed yields are low compared to currently grown annual grains, necessitating
further breeding and agronomic management research to make them viable crops.
Promising perennial polycultures
The observed complementarity for seed yield (PEY>1) in some polycultures points out to
promising systems. The wheatgrass-white clover polyculture is promising because produced
highest wheatgrass seed yields, and low growing white clover would not interfere with
wheatgrass seed harvest, provides Nitrogen, and good soil cover. The wheatgrass–
bundleflower mixture already discussed is also promising for grain production.
Bundleflower-C4 grasses polycultures should be investigated in the future to assess the
observed complementarity when C4 grasses are better established. No polyculture in our
study simultaneously had higher seed yield and greater weed suppression than monocultures.
However, wheatgrass-alfalfa mixture and bundleflower-switchgrass-eastern gamagrass
polyculture (in 2004) were the few examples of increased weed suppression with no
108
significant reductions in seed yields. All polycultures had greater total forage yields than the
monocultures so perennial grain species are not promising forages per se, but can contribute
to mixtures with other high yielding forages. Bundleflower can contribute protein in summer
pastures in the Midwest (Fischbach et al., 2005a; Fischbach et al., 2005b) and wheatgrass can
improve provide fiber to reduce risk of bloat in ruminants grazing legume dominated
pastures. Perennial polyculture systems can be flexible management systems; for instance, in
years when weather is unfavorable to seed production, hay or grazing are alternatives to
consider.
Future research directions
More research is needed to overcome the challenges to developing successful perennial
grain polyculture systems. While protein content of perennial grains is high, seed yields need
to be improved in order to reach yields comparable with annual grains. However, these
improvements are within the range of yield gains already achieved with annual grains in the
last 50 years by agronomic management and plant breeding (see e.g., Duvick, 2005). Apart
from increasing yields, breeding efforts should be focused on developing compatible
mixtures, with high competitive ability against weeds. Long term trends of yields and species
composition of perennial grain polycultures over time may be different from those observed
during the establishment years measured in our study, and should be monitored. Also,
different results would be expected in situations with better weed control practices. In
general, best agronomic management practices for growing these species are needed (e.g.,
optimal seeding densities for seed, best seeding dates, fertility requirements, and so on).
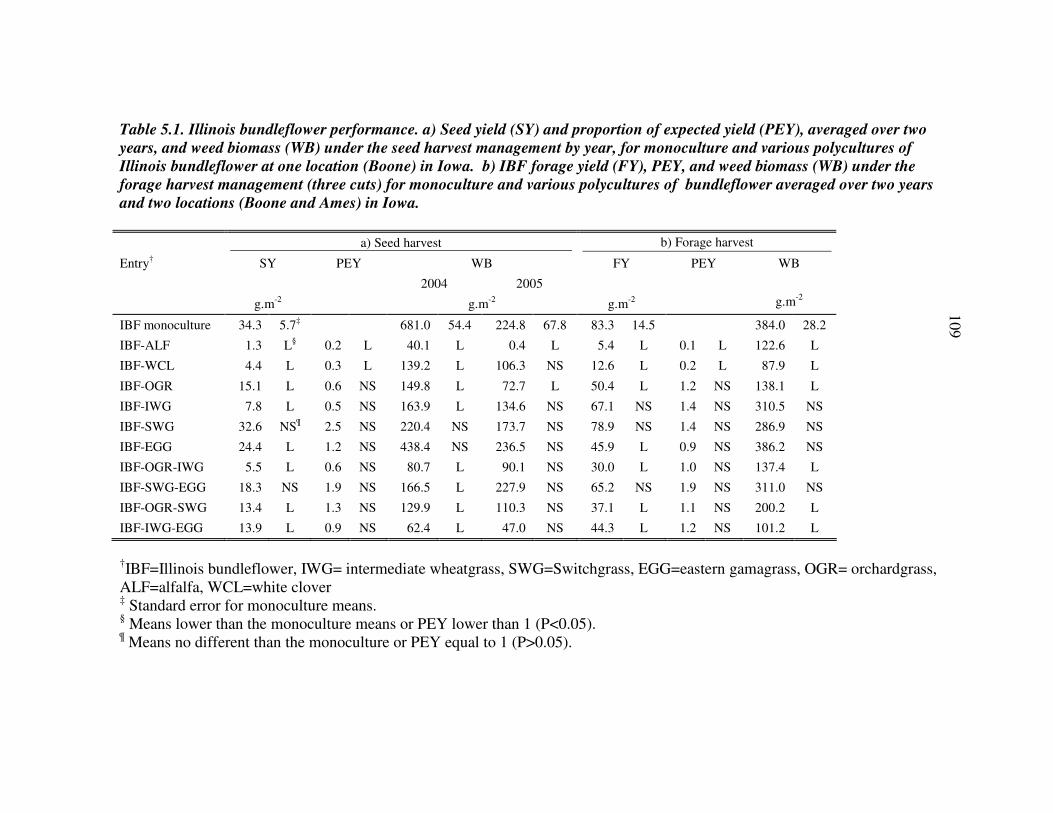
Table 5.1. Illinois bundleflower performance. a) Seed yield (SY) and proportion of expected yield (PEY), averaged over two
years, and weed biomass (WB) under the seed harvest management by year, for monoculture and various polycultures of
Illinois bundleflower at one location (Boone) in Iowa. b) IBF forage yield (FY), PEY, and weed biomass (WB) under the
forage harvest management (three cuts) for monoculture and various polycultures of bundleflower averaged over two years
and two locations (Boone and Ames) in Iowa.
a) Seed harvest b) Forage harvest
Entry† SY PEY WB FY PEY WB
2004 2005
g.m-2 g.m-2 g.m-2 g.m-2
IBF monoculture 34.3 5.7‡ 681.0 54.4 224.8 67.8 83.3 14.5 384.0 28.2
IBF-ALF 1.3 L§ 0.2 L 40.1 L 0.4 L 5.4 L 0.1 L 122.6 L
IBF-WCL 4.4 L 0.3 L 139.2 L 106.3 NS 12.6 L 0.2 L 87.9 L
IBF-OGR 15.1 L 0.6 NS 149.8 L 72.7 L 50.4 L 1.2 NS 138.1 L
IBF-IWG 7.8 L 0.5 NS 163.9 L 134.6 NS 67.1 NS 1.4 NS 310.5 NS
IBF-SWG 32.6 NS¶ 2.5 NS 220.4 NS 173.7 NS 78.9 NS 1.4 NS 286.9 NS
IBF-EGG 24.4 L 1.2 NS 438.4 NS 236.5 NS 45.9 L 0.9 NS 386.2 NS
IBF-OGR-IWG 5.5 L 0.6 NS 80.7 L 90.1 NS 30.0 L 1.0 NS 137.4 L
IBF-SWG-EGG 18.3 NS 1.9 NS 166.5 L 227.9 NS 65.2 NS 1.9 NS 311.0 NS
IBF-OGR-SWG 13.4 L 1.3 NS 129.9 L 110.3 NS 37.1 L 1.1 NS 200.2 L
IBF-IWG-EGG 13.9 L 0.9 NS 62.4 L 47.0 NS 44.3 L 1.2 NS 101.2 L
†IBF=Illinois bundleflower, IWG= intermediate wheatgrass, SWG=Switchgrass, EGG=eastern gamagrass, OGR= orchardgrass, ALF=alfalfa, WCL=white clover ‡ Standard error for monoculture means. § Means lower than the monoculture means or PEY lower than 1 (P<0.05). ¶ Means no different than the monoculture or PEY equal to 1 (P>0.05).
109
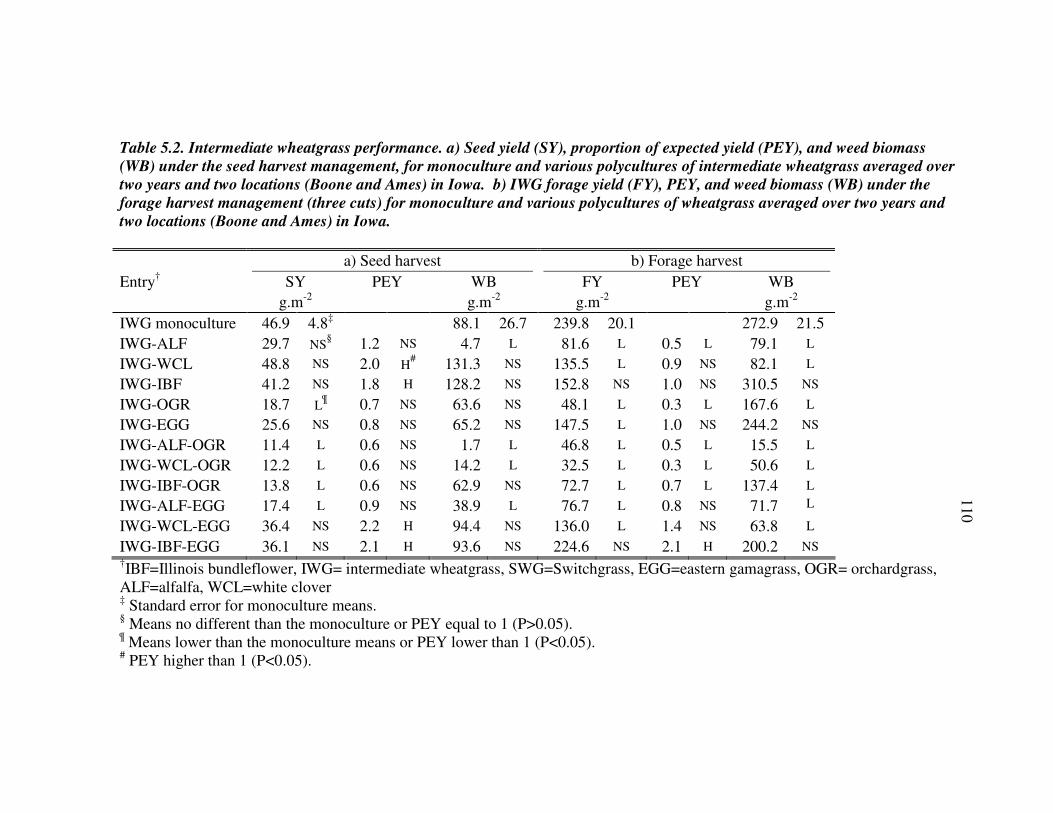
Table 5.2. Intermediate wheatgrass performance. a) Seed yield (SY), proportion of expected yield (PEY), and weed biomass
(WB) under the seed harvest management, for monoculture and various polycultures of intermediate wheatgrass averaged over
two years and two locations (Boone and Ames) in Iowa. b) IWG forage yield (FY), PEY, and weed biomass (WB) under the
forage harvest management (three cuts) for monoculture and various polycultures of wheatgrass averaged over two years and
two locations (Boone and Ames) in Iowa.
a) Seed harvest b) Forage harvest
Entry† SY PEY WB FY PEY WB
g.m-2 g.m-2 g.m-2 g.m-2
IWG monoculture 46.9 4.8‡ 88.1 26.7 239.8 20.1 272.9 21.5
IWG-ALF 29.7 NS§ 1.2 NS 4.7 L 81.6 L 0.5 L 79.1 L
IWG-WCL 48.8 NS 2.0 H# 131.3 NS 135.5 L 0.9 NS 82.1 L
IWG-IBF 41.2 NS 1.8 H 128.2 NS 152.8 NS 1.0 NS 310.5 NS
IWG-OGR 18.7 L¶ 0.7 NS 63.6 NS 48.1 L 0.3 L 167.6 L
IWG-EGG 25.6 NS 0.8 NS 65.2 NS 147.5 L 1.0 NS 244.2 NS
IWG-ALF-OGR 11.4 L 0.6 NS 1.7 L 46.8 L 0.5 L 15.5 L
IWG-WCL-OGR 12.2 L 0.6 NS 14.2 L 32.5 L 0.3 L 50.6 L
IWG-IBF-OGR 13.8 L 0.6 NS 62.9 NS 72.7 L 0.7 L 137.4 L
IWG-ALF-EGG 17.4 L 0.9 NS 38.9 L 76.7 L 0.8 NS 71.7 L
IWG-WCL-EGG 36.4 NS 2.2 H 94.4 NS 136.0 L 1.4 NS 63.8 L
IWG-IBF-EGG 36.1 NS 2.1 H 93.6 NS 224.6 NS 2.1 H 200.2 NS
†IBF=Illinois bundleflower, IWG= intermediate wheatgrass, SWG=Switchgrass, EGG=eastern gamagrass, OGR= orchardgrass, ALF=alfalfa, WCL=white clover ‡ Standard error for monoculture means. § Means no different than the monoculture or PEY equal to 1 (P>0.05). ¶ Means lower than the monoculture means or PEY lower than 1 (P<0.05). # PEY higher than 1 (P<0.05).
110
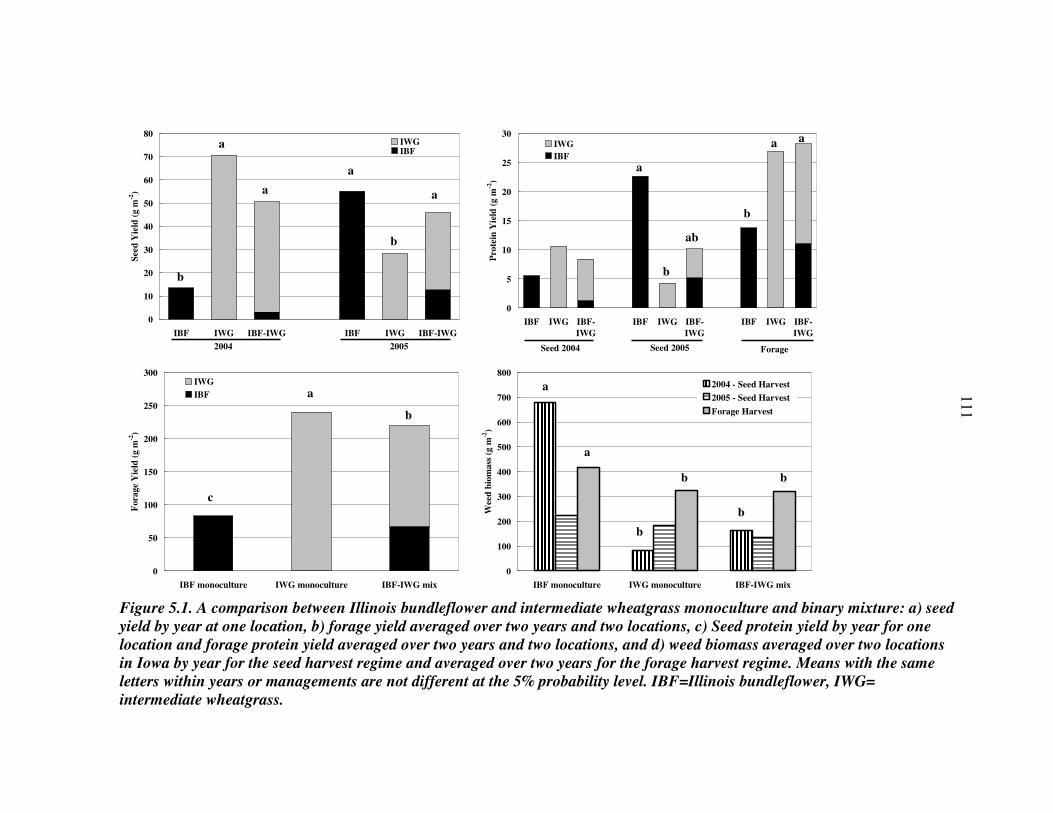
0
10
20
30
40
50
60
70
80
IBF IWG IBF-IWG IBF IWG IBF-IWG
See
d Y
ield
(g
m-2
)IWGIBF
2004 2005
a
a
b
a
a
b
0
5
10
15
20
25
30
IBF IWG IBF-
IWG
IBF IWG IBF-
IWG
IBF IWG IBF-
IWG
Pro
tein
Yie
ld (
g m
-2)
IWG
IBF
Seed 2004 Forage
a a
b
ab
a
b
Seed 2005
0
50
100
150
200
250
300
IBF monoculture IWG monoculture IBF-IWG mix
Fora
ge
Yie
ld (
g m
-2)
IWG
IBF a
b
c
0
100
200
300
400
500
600
700
800
IBF monoculture IWG monoculture IBF-IWG mix
Wee
d b
iom
ass
(g
m-2
)
2004 - Seed Harvest
2005 - Seed Harvest
Forage Harvest
a
b
b
a
b b
Figure 5.1. A comparison between Illinois bundleflower and intermediate wheatgrass monoculture and binary mixture: a) seed
yield by year at one location, b) forage yield averaged over two years and two locations, c) Seed protein yield by year for one
location and forage protein yield averaged over two years and two locations, and d) weed biomass averaged over two locations
in Iowa by year for the seed harvest regime and averaged over two years for the forage harvest regime. Means with the same
letters within years or managements are not different at the 5% probability level. IBF=Illinois bundleflower, IWG=
intermediate wheatgrass.
111
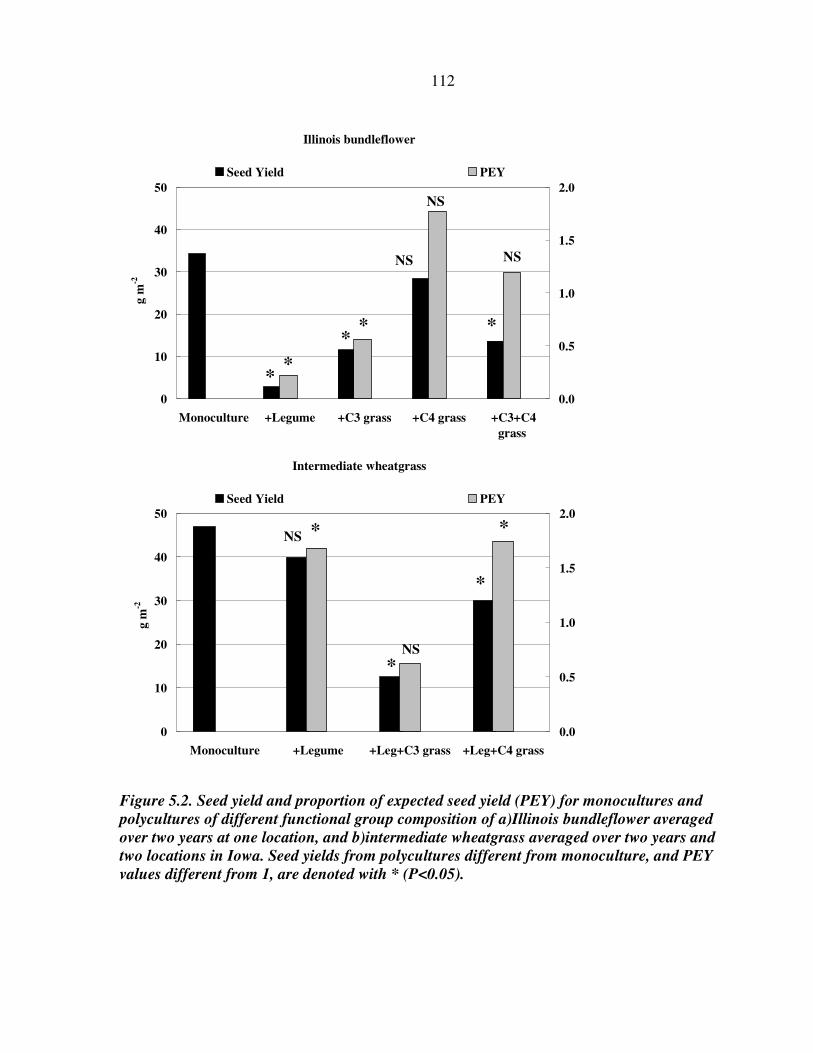
112
Illinois bundleflower
0
10
20
30
40
50
Monoculture +Legume +C3 grass +C4 grass +C3+C4
grass
g m
-2
0.0
0.5
1.0
1.5
2.0
Seed Yield PEY
*
**
NS
NS
NS
*
*
Intermediate wheatgrass
0
10
20
30
40
50
Monoculture +Legume +Leg+C3 grass +Leg+C4 grass
g m
-2
0.0
0.5
1.0
1.5
2.0
Seed Yield PEY
*
*
*
*NS
NS
Figure 5.2. Seed yield and proportion of expected seed yield (PEY) for monocultures and
polycultures of different functional group composition of a)Illinois bundleflower averaged
over two years at one location, and b)intermediate wheatgrass averaged over two years and
two locations in Iowa. Seed yields from polycultures different from monoculture, and PEY
values different from 1, are denoted with * (P<0.05).
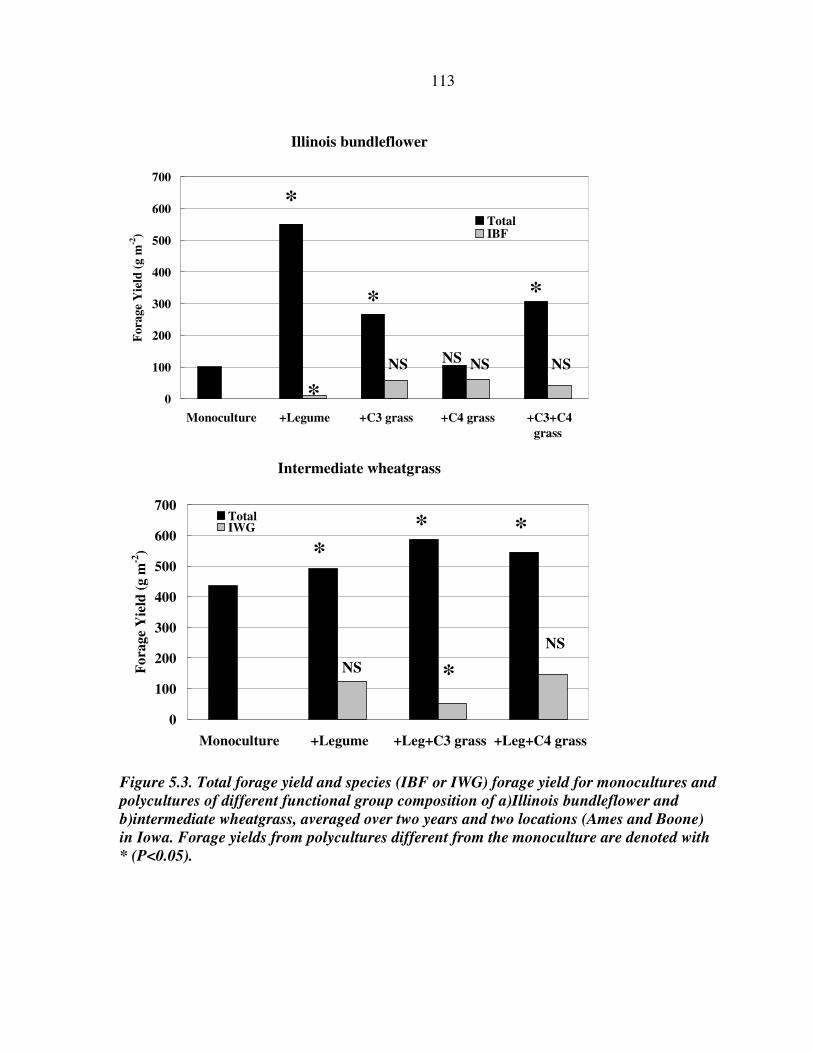
113
Illinois bundleflower
0
100
200
300
400
500
600
700
Monoculture +Legume +C3 grass +C4 grass +C3+C4
grass
Fora
ge
Yie
ld (
g m
-2)
TotalIBF
NS NS NSNS
*
* *
*
Intermediate wheatgrass
0
100
200
300
400
500
600
700
Monoculture +Legume +Leg+C3 grass +Leg+C4 grass
Fo
rage
Yie
ld (
g m
-2)
TotalIWG
*
** *
NS
NS
Figure 5.3. Total forage yield and species (IBF or IWG) forage yield for monocultures and
polycultures of different functional group composition of a)Illinois bundleflower and
b)intermediate wheatgrass, averaged over two years and two locations (Ames and Boone)
in Iowa. Forage yields from polycultures different from the monoculture are denoted with
* (P<0.05).
114
CHAPTER VI. GENERAL CONCLUSIONS
This research provided insight into the agronomic characteristics of perennial herbaceous
polycultures as alternatives for forage, grain, and biomass production. It also documented the
contribution of plant species richness to biomass and seed productivity, weed suppression,
and stability. The central contribution of this research was to begin merging Ecology and
Agriculture as a basis for better understanding and designing sustainable production systems.
The key findings of this research were:
1. Average biomass productivity consistently increased in establishing perennial
polyculture agroecosystems with increasing seeded plant species richness across two
locations, three years, and two harvest management regimes.
2. In most situations, polycultures were more productive than the average of
monocultures, but not more productive than the best adapted species in monoculture for each
environment; i.e., non transgressive overyielding was usually observed. Alfalfa under
multiple harvest management and intermediate wheatgrass under single harvest management
were the highest yielding species in monoculture.
3. The observed polyculture overyielding was due to complementarity among species in
the community rather than to selection effects of individual species at all richness levels
across environments and was likely explained by legume-grass facilitation.
4. Polycultures with high richness had lower variability in yield (i.e., greater stability)
than the highest yielding monocultures. Stability analyses used in plant breeding may help
interpret the results of polyculture experiments.
5. Intermediate wheatgrass produced up to 65.8 ± 6.5 g m-2 of seed and Illinois
bundleflower up to 55.0 ± 8.1 g m-2. With plant breeding and better agronomic management
these yields can likely be improved in the near future to be practical for production situations.
6. The mixture comprising both perennial grains (intermediate wheatgrass and Illinois
bundleflower) produced as much seed as the best yielding monoculture each year (non
transgressive overyielding was observed). Polycultures of Illinois bundleflower with C4
grasses and polycultures of intermediate wheatgrass with legumes produced as much seed as
115
the monocultures. If the companion species in the polyculture produced harvestable grain
transgressive overyielding may be achievable.
7. Weed biomass decreased exponentially with seeded species richness in all
environments. Most polycultures exerted greater weed suppression than perennial grain
monocultures but also they had reduced seed yields. Breeding and management of crop
mixtures to optimize the trade-off between seed yield and weed suppression is a central
challenge for the development of perennial polyculture systems.
This research was intended to test a number of hypotheses. We did it, and therefore this
work is completed. The main limitation of our conclusions is temporal: the four initial years
of perennial plant communities. Longer term studies could reveal different results, so
maintaining our perennial polyculture experiment could be valuable. Scientific inquiry
always opens new questions, and here are some of those that could be studied over the longer
term:
1. Do the richness effects measured during the first three years become stronger or
disappear in the long term (in terms of forage biomass, seed production, weed invasion)?
2. How do complementarity and selection effects change over time? Is transgressive
overyielding more frequent in the long term?
3. How does seed yield of perennial grain species in monoculture and polyculture
change over the long term?
4. Does plant species richness affect soil properties like organic matter content or
nutrient pools in perennial polycultures over the long term?
5. How does associated biodiversity respond to changes in planned diversity in
perennial polycultures (insects, pathogens, soil microorganisms)?
6. What is the relative importance of species composition, dominance, and diversity in
controlling invasions in perennial plant communities over time? Can spatial representation
and analyses techniques help understand the dispersal of weeds and seeded species in the
experimental polyculture plots?
7. How do different competition and overyielding indices correlate for the species
included in the experiment? How do they change over time in perennial plant communities?
116
Perennial herbaceous polycultures offer tremendous opportunities for the design of
sustainable agroecosystems but the research devoted to these is minimal compared to the
potential benefits. Future generations of ecologists, agronomists, and agroecologists are
needed to meet this research needs. Hopefully this dissertation will help engage other spirits
and minds to this important task.
117
REFERENCES
Adjei, M., and W. Pitman. 1993. Response of Desmanthus to Clipping on a Phosphatic Clay
Mine-Spoil. Tropical Grasslands 27:94-99. Altieri, M.A. 1987. Agroecology the Scientific Basis of Alternative Agriculture Westview
Press, Boulder, Colorado, USA. Balvanera, P., A.B. Pfisterer, N. Buchmann, J.-S. He, T. Nakashizuka, D. Raffaelli, and B.
Schmid. 2006. Quantifying the Evidence for Biodiversity Effects on Ecosystem Functioning and Services. Ecology Letters 9:1146-1156.
Barnes, R., and M. Collins. 2003. Forages: An Introduction to Grassland Agriculture. Iowa State Press, Ames, IA.
Barnhart, S. 1999. Selecting Forage Species. Extension Publication- Pm 1792. Iowa State University, Ames, IA.
Becker, H.C. 1981. Correlations among Some Statistical Measures of Phenotypic Stability. Euphytica 30:835-840.
Bernardo, R. 2002. Breeding for Quantitative Traits in Plants. Stemma Press, Woodbury, MN.
Botkin, D.B. 1990. Discordant Harmonies: A New Ecology for the Twenty-First Century Oxford University Press.
Bremner, J., and G. Breitenbeck. 1983. A Simple Method for Determination of Ammonium in Semimicro-Kjeldahl Analysis of Soils and Plant Materials Using a Block Digester. Communications in Soil Science and Plant Analysis 14:905-913.
Brummer, E. 1998. Diversity, Stability, and Sustainable American Agriculture. Agron. J. 90:1-2.
Cardinale, B., D. Srivastava, J. Emmett Duffy, J. Wright, A. Downing, M. Sankaran, and C. Jouseau. 2006. Effects of Biodiversity on the Functioning of Trophic Groups and Ecosystems. Nature 443:989-992.
Cardinale, B.J., J.P. Wright, M.W. Cadotte, I.T. Carroll, A. Hector, D.S. Srivastava, M. Loreau, and J.J. Weis. 2007. Impacts of Plant Diversity on Biomass Production Increase through Time Because of Species Complementarity. Proceedings of the National Academy of Sciences 104:18123-18128.
Clements, F.E. 1916. Plant Succession: An Analysis of the Development of Vegetation Carnegie Institution of Washington, Washington, D.C.
Connell, J.H. 1979. Intermediate-Disturbance Hypothesis. Science 204:1345-1345. Connolly, J., H.C. Goma, and K. Rahim. 2001a. The Information Content of Indicators in
Intercropping Research. Agriculture Ecosystems & Environment 87:191-207. Connolly, J., P. Wayne, and F.A. Bazzaz. 2001b. Interspecific Competition in Plants: How
Well Do Current Methods Answer Fundamental Questions? American Naturalist 157:107-125.
Cornforth, B., L. St. John, and D. Ogle. 2001. Seed Production Standards for Conservation Plants in the Intermountain West. Technical Notes - Plant Materials 14. USDA-Natural Resources Conservation Service - Aberdeen Plant Materials Center, Boise, Idaho.
118
Cox, C.M., K.A. Garrett, and W.W. Bockus. 2005. Meeting the Challenge of Disease Management in Perennial Grain Cropping Systems. Renewable Agriculture and Food Systems 20:15-24.
Cox, T.S., J.D. Glover, D.L. Van Tassel, C.M. Cox, and L.R. DeHaan. 2006. Prospects for Developing Perennial-Grain Crops. Bioscience 56:649-659.
Cox, T.S., M. Bender, C. Picone, D.L. Van Tassel, J.B. Holland, E.C. Brummer, B.E. Zoeller, A.H. Paterson, and W. Jackson. 2002. Breeding Perennial Grain Crops. Critical Reviews in Plant Sciences 21:59-91.
Crews, T.E. 2005. Perennial Crops and Endogenous Nutrient Supplies. Renewable Agriculture and Food Systems 20:25–37.
Crutsinger, G.M., M.D. Collins, J.A. Fordyce, Z. Gompert, C.C. Nice, and N.J. Sanders. 2006. Plant Genotypic Diversity Predicts Community Structure and Governs an Ecosystem Process. Science 313:966-968.
Darwent, A.L., H.G. Najda, J.C. Drabble, and C.R. Elliott. 1987. Effect of Row Spacing on Seed and Hay Production of Eleven Grass Species under a Peace River Region Management System. Canadian Journal of Plant Science 67:755-763.
Darwin, C. 1859. On the Origin of Species by Natural Selection. Murray, London. de Wit, C., and J. van den Bergh. 1965. Competition between Herbage Plants. Netherlands
Journal of Agricultural Science 13:212-221. DeHaan, L.R., D.L. Van Tassel, and T.S. Cox. 2005. Perennial Grain Crops: A Synthesis of
Ecology and Plant Breeding. Renewable Agriculture and Food Systems 20:5-14. DeHaan, L.R., N.J. Ehlke, C.C. Sheaffer, R.L. DeHaan, and D.L. Wyse. 2003. Evaluation of
Diversity among and within Accessions of Illinois Bundleflower. Crop Science 43:1528-1537.
Deutschman, D.H. 2001. Design and Analysis of Biodiversity Field Experiments. Ecological Research 16:833-843.
Diaz, S., and M. Cabido. 2001. Vive La Difference: Plant Functional Diversity Matters to Ecosystem Processes. Trends in Ecology & Evolution 16:646-655.
Dinnes, D.L., D.L. Karlen, D.B. Jaynes, T.C. Kaspar, J.L. Hatfield, T.S. Colvin, and C.A. Cambardella. 2002. Nitrogen Management Strategies to Reduce Nitrate Leaching in Tile-Drained Midwestern Soils. Agronomy Journal 94:153-171.
Dukes, J.S. 2002. Species Composition and Diversity Affect Grassland Susceptibility and Response to Invasion. Ecological Applications 12:602-617.
Duvick, D. 2005. The Contribution of Breeding to Yield Advances in Maize (Zea Mays L.). Advances in Agronomy 86:83-145.
Eberhart, S., and W. Russell. 1966. Stability Parameters for Comparing Varieties. Crop Science 6:36-40.
Egler, F.E. 1954. Vegetation Science Concepts: I: Initial Floristic Composition, a Factor in Old-Field Vegetation Development. Vegetatio 4.
Elliott, C.R., and M. Howe. 1977. Grass Seed Yield Data - 1969-1977. Northern Reserch Group - Agriculture Canada Research Station, Beaverlodge, AB Publ. #77-14.
Elton, C. 1958. The Ecology of Invasions by Plants and Animals. Chapman & Hall, London. Elton, C.S. 1966. The Pattern of Animal Communities Methuen, London.
119
Entz, M.H., V.S. Baron, P.M. Carr, D.W. Meyer, S.R. Smith, Jr., and W.P. McCaughey. 2002. Potential of Forages to Diversify Cropping Systems in the Northern Great Plains. Agronomy Journal 94:240-250.
Fargione, J., D. Tilman, R. Dybzinski, J.H.R. Lambers, C. Clark, W.S. Harpole, J.M.H. Knops, P.B. Reich, and M. Loreau. 2007. From Selection to Complementarity: Shifts in the Causes of Biodiversity-Productivity Relationships in a Long-Term Biodiversity Experiment. Proceedings of the Royal Society B-Biological Sciences 274:871-876.
Federer, W.T. 1993. Statistical Design and Analysis for Intercropping Experiments Springer-Verlag, New York.
Finlay, K., and G. Wilkinson. 1963. The Analysis of Adaptation in a Plant-Breeding Programme. Australian Journal of Agricultural Research 14:742-754.
Fischbach, J.A., P.R. Peterson, N.J. Ehlke, D.L. Wyse, and C.C. Sheaffer. 2005a. Illinois Bundleflower Forage Potential in the Upper Midwestern USA: Ii. Forage Quality. Agronomy Journal 97:895-903.
Fischbach, J.A., P.R. Peterson, C.C. Sheaffer, N.J. Ehlke, J. Byun, and D.L. Wyse. 2005b. Illinois Bundleflower Forage Potential in the Upper Midwestern USA: I. Yield, Regrowth, and Persistence. Agronomy Journal 97:886-894.
Fox, J.W. 2005. Interpreting the 'Selection Effect' of Biodiversity on Ecosystem Function. Ecology Letters 8:846-856.
Fox, J.W. 2006. Using the Price Equation to Partition the Effects of Biodiversity Loss on Ecosystem Function. Ecology 87:2687-2696.
Freibauer, A., M.D.A. Rounsevell, P. Smith, and J. Verhagen. 2004. Carbon Sequestration in the Agricultural Soils of Europe. Geoderma 122:1-23.
Gardner, J.C., B.G. Schatz, and P.M. Carr. 1990. New Crop Development, p. 7 Alternative Crops and Crop Production. North Dakota State University, Fargo.
Gardner, M.R., and W.R. Ashby. 1970. Connectance of Large Dynamical (Cybernetic) Systems: Critical Value of Stability. Nature:784.
Garnier, E., M. Navas, M. Austin, J. Lilley, and R. Gifford. 1997. A Problem for Biodiversity-Productivity Studies: How to Compare the Productivity of Multispecific Plant Mixtures to That of Monocultures? Acta Oecologica 18:657-670.
Gleason, H.A. 1939. The Individualistic Concept of the Plant Association. American Midland Naturalist:92-110.
Gliessman, S. 1998. Agroecology: Ecological Processes in Sustainable Agriculture CRC Press.
Glover, J.D. 2005. The Necessity and Possibility of Perennial Grain Production Systems. Renewable Agriculture and Food Systems 20:1-2.
Griffiths, B.S., K. Ritz, R.D. Bardgett, R. Cook, S. Christensen, F. Ekelund, S.J. Sorensen, E. Baath, J. Bloem, P.C. de Ruiter, J. Dolfing, and B. Nicolardot. 2000. Ecosystem Response of Pasture Soil Communities to Fumigation-Induced Microbial Diversity Reductions: An Examination of the Biodiversity-Ecosystem Function Relationship. Oikos 90:279-294.
Grime, J.P. 1973. Competitive Exclusion in Herbaceous Vegetation. Nature 242:344-347. Grime, J.P. 1997. Ecology - Biodiversity and Ecosystem Function: The Debate Deepens.
Science 277:1260-1261.
120
Gross, K., and B. Cardinale. 2007. Does Species Richness Drive Community Production or Vice Versa? Reconciling Historical and Contemporary Paradigms in Competitive Communities. The American Naturalist 170:207-220.
Harmoney, K.R. 2005. Growth Responses of Perennial Cool-Season Grasses Grazed Intermittently [Online] http://www.plantmanagementnetwork.org/pub/fg/research/2005/cool/.
Hector, A., and R. Hooper. 2002. Darwin and the First Ecological Experiment. Science 295:639-640.
Hector, A., J. Joshi, M. Scherer-Lorenzen, B. Schmid, E. Spehn, L. Wacker, M. Weilenmann, E. Bazeley-White, C. Beierkuhnlein, and M. Caldeira. 2007. Biodiversity and Ecosystem Functioning: Reconciling the Results of Experimental and Observational Studies. Functional Ecology 21:998-1002.
Hector, A., B. Schmid, C. Beierkuhnlein, M.C. Caldeira, M. Diemer, P.G. Dimitrakopoulos, J.A. Finn, H. Freitas, P.S. Giller, J. Good, R. Harris, P. Hogberg, K. Huss-Danell, J. Joshi, A. Jumpponen, C. Korner, P.W. Leadley, M. Loreau, A. Minns, C.P.H. Mulder, G. O'Donovan, S.J. Otway, J.S. Pereira, A. Prinz, D.J. Read, M. Scherer-Lorenzen, E.D. Schulze, A.S.D. Siamantziouras, E.M. Spehn, A.C. Terry, A.Y. Troumbis, F.I. Woodward, S. Yachi, and J.H. Lawton. 1999. Plant Diversity and Productivity Experiments in European Grasslands. Science 286:1123-1127.
Hempel, C.G. 1959. The Logic of Functional Analysis, p. 271-287, In L. Gross, ed. Symposium on Sociological Theory. Harper and Row, New York.
Holland, J., and E. Brummer. 1999. Cultivar Effects on Oat-Berseem Clover Intercrops. Agron. J. 91:321-329.
Hooper, D. 1997. The Effects of Plant Composition and Diversity on Ecosystem Processes. Science 277:1302-1305.
Hooper, D.U., and J.S. Dukes. 2004. Overyielding among Plant Functional Groups in a Long-Term Experiment. Ecology Letters 7:95-105.
Hooper, D.U., F.S. Chapin, J.J. Ewel, A. Hector, P. Inchausti, S. Lavorel, J.H. Lawton, D.M. Lodge, M. Loreau, S. Naeem, B. Schmid, H. Setala, A.J. Symstad, J. Vandermeer, and D.A. Wardle. 2005. Effects of Biodiversity on Ecosystem Functioning: A Consensus of Current Knowledge. Ecological Monographs 75:3-35.
Hughes, J., and O.L. Petchey. 2001. Merging Perspectives on Biodiversity and Ecosystem Functioning. Trends in Ecology and Evolution 16:222-223. Huston, M.A. 1997. Hidden Treatments in Ecological Experiments: Re-Evaluating the
Ecosystem Function of Biodiversity. Oecologia 110:449-460. Huston, M.A., and A.C. McBride. 2002. Evaluating the Relative Strengths of Biotic Versus
Abiotic Controls on Ecosystem Processes, p. 47-60 Biodiversity and Ecosystem Functioning: Synthesis and Perspectives. Oxford University Press.
Huston, M.A., L.W. Aarssen, M.P. Austin, B.S. Cade, J.D. Fridley, E. Garnier, J.P. Grime, J. Hodgson, W.K. Lauenroth, K. Thompson, J.H. Vandermeer, D.A. Wardle, A. Hector, B. Schmid, C. Beierkuhnlein, M.C. Caldeira, M. Diemer, P.G. Dimitrakopoulos, J.A. Finn, H. Freitas, P.S. Giller, J. Good, R. Harris, P. Hogberg, K. Huss-Danell, J. Joshi, A. Jumpponen, C. Korner, P.W. Leadley, M. Loreau, A. Minns, C.P.H. Mulder, G. O'Donovan, S.J. Otway, J.S. Pereira, A. Prinz, D.J. Read, M. Scherer-Lorenzen, E.-D. Schulze, A.-S.D. Siamantziouras, E. Spehn, A.C. Terry, A.Y. Troumbis, F.I.
121
Woodward, S. Yachi, and J.H. Lawton. 2000. No Consistent Effect of Plant Diversity on Productivity. Science 289:1255a-.
Ives, A.R. 2005. Community Diversity and Stability: Changing Perspectives and Changing Definitions, p. 159-182, In K. Cuddington and B. Beisner, eds. Ecological Paradigms Lost: Routes of Theory Change. Elsevier Academic Press, San Diego, CA.
Jackson, W. 1985. New Roots for Agriculture University of Nebraska Press. Jackson, W. 2002. Natural Systems Agriculture: A Truly Radical Alternative. Agriculture
Ecosystems and Environment 88:111-117. Jax, K. 2005. Function and "Functioning" in Ecology: What Does It Mean? Oikos 111:641-
648. Jolliffe, P.A. 2000. The Replacement Series. Journal of Ecology 88:371-385. Jones, T. 1999. Genome Characterization of Mt-2 Perennial and Ok-906 Annual Wheat×
Intermediate Wheatgrass Hybrids. Crop Science 39:1041-1043. Jorgensen, F., E. Jensen, and J. Schjoerring. 1999. Dinitrogen Fixation in White Clover
Grown in Pure Stand and Mixture with Ryegrass Estimated by the Immobilized 15n Isotope Dilution Method. Plant and Soil 208:293-305.
Kaiser, J. 2000. Rift over Species Diversity Divides Ecologists. Science 289:1282-1283. Kareiva, P. 1994. Diversity Begets Productivity 368:686-687. Kinzig, A.P., S. Pacala, and D. Tilman. 2001. The Functional Consequences of Biodiversity:
Empirical and Theoretical Extensions Princeton University Press. Kirschenmann, F.L. 2007. Potential for a New Generation of Biodiversity in Agroecosystems
of the Future. Agron J 99:373-376. Kirwan, L., A. Luscher, M.T. Sebastia, J.A. Finn, R.P. Collins, C. Porqueddu, A. Helgadottir,
O.H. Baadshaug, C. Brophy, C. Coran, S. Dalmannsdottir, I. Delgado, A. Elgersma, M. Fothergill, B.E. Frankow-Lindberg, P. Golinski, P. Grieu, A.M. Gustavsson, M. Hoglind, O. Huguenin-Elie, C. Iliadis, M. Jorgensen, Z. Kadziuliene, T. Karyotis, T. Lunnan, M. Malengier, S. Maltoni, V. Meyer, D. Nyfeler, P. Nykanen-Kurki, J. Parente, H.J. Smit, U. Thumm, and J. Connolly. 2007. Evenness Drives Consistent Diversity Effects in Intensive Grassland Systems across 28 European Sites. Journal of Ecology 95:530-539.
Knops, J.M.H., D. Tilman, N.M. Haddad, S. Naeem, C.E. Mitchell, J. Haarstad, M.E. Ritchie, K.M. Howe, P.B. Reich, E. Siemann, and J. Groth. 1999. Effects of Plant Species Richness on Invasion Dynamics, Disease Outbreaks, Insect Abundances and Diversity. Ecology Letters 2:286-293.
Krause, C. 1996. Life on Earth: Why Biodiversity Varies. Oak Ridge National Laboratory Review 29.
Kruger, G. 1997. Seed Production of Intermediate Wheatgrass Extension Publication. Saskatchewan Forage Council.
Kuhn, T. 1970. The Structure of Scientific Revolutions University of Chicago Press. Kulakow, P. 1999. Variation in Illinois Bundleflower (Desmanthus Illinoensis (Michaux)
Macmillan): A Potential Perennial Grain Legume. Euphytica 110:7-20. Lehman, C.L., and D. Tilman. 2000. Biodiversity, Stability, and Productivity in Competitive
Communities. American Naturalist 156:534-552. Liebman, M. 1995. Polyculture Cropping Systems., p. 205-218, In M. Altieri, ed.
Agroecology: The Science of Sustainable Agriculture, Second Edition.
122
Littell, R., G. Milliken, W. Stroup, and R. Wolfinger. 1996. Sas System for Mixed Models. Loehle, C. 1987. Hypothesis Testing in Ecology: Psychological Aspects and the Importance
of Theory Maturation. The Quarterly Review of Biology 62:397-409. Loomis, R.S., and D.J. Connor. 1992. Crop Ecology: Productivity and Management in
Agricultural Systems Cambridge University Press, New York, NY. Loreau, M. 1998. Separating Sampling and Other Effects in Biodiversity Experiments. Oikos
82:600-602. Loreau, M., and A. Hector. 2001. Partitioning Selection and Complementarity in Biodiversity
Experiments. Nature 412:72-76. Loreau, M., A. Downing, M. Emmerson, A. Gonzales, J. Hughes, P. Inchausti, J. Joshi, J.
Norberg, and O. Sala. 2002. A New Look at the Relationship between Diversity and Stability, p. 79-91 Biodiversity and Ecosystem Functioning: Synthesis and Perspectives. Oxford University Press.
Loreau, M., S. Naeem, P. Inchausti, J. Bengtsson, J.P. Grime, A. Hector, D.U. Hooper, M.A. Huston, D. Raffaelli, B. Schmid, D. Tilman, and D.A. Wardle. 2001. Biodiversity and Ecosystem Functioning: Current Knowledge and Future Challenges. Science 294:804-808.
Losure, D., B. Wilsey, and K. Moloney. 2007. Evenness–Invasibility Relationships Differ between Two Extinction Scenarios in Tallgrass Prairie.
MacArthur, R.H. 1955. Fluctuations of Animal Populations, and a Measure of Community Stability. Ecology:533-536.
May, R.M. 1973. Stability and Complexity of Model Ecosystems. Princeton, Princeton NJ. Mayhew, P. 2006. Discovering Evolutionary Ecology: Bringing Together Ecology and
Evolution Oxford University Press, New York. McCann, K. 2000. The Diversity–Stability Debate. Nature 405:228-233. McCann, K.S. 2005. Perspectives on Diversity, Structure, and Stability, p. 183-200, In K.
Cuddington and B. Beisner, eds. Ecological Paradigms Lost: Routes of Theory Change. Elsevier Academic Press, San Diego, CA.
Mikkelson, G.M. 1997. Methods and Metaphors in Community Ecology: The Problem of Defining Stability. Perspectives on Science 5:481-498.
Millikan, R.G. 1984. Language, Thought, and Other Biological Categories MIT Press, Cambridge.
Minns, A., J. Finn, A. Hector, M. Caldeira, J. Joshi, C. Palmborg, B. Schmid, M. Scherer-Lorenzen, E. Spehn, A. Troumbis, and B. project. 2001. The Functioning of European Grassland Ecosystems: Potential Benefits of Biodiversity to Agriculture. Outlook on Agriculture 30:179-185.
Mooney, H.A. 2002. The Debate on the Role of Biodiversity in Ecosystem Functioning, p. 12-17 Biodiversity and Ecosystem Functioning: Synthesis and Perspectives. Oxford University Press.
Mooney, H.A., J.H. Cushman, E. Medina, O.E. Sala, and E.-D. Schulze, (eds.) 1996a. Functional Roles of Biodiversity: A Global Perspective, Vol. 55, pp. 1-495. John Wiley &Sons Ltd, West Sussex, England.
Mooney, H.A., J.H. Cushman, E. Medina, O. Sala, and E.-D. Schulze. 1996b. The Scope Ecosystem Functioning of Biodiversity Program, In H. A. Mooney, et al., eds.
123
Functional Roles of Biodiversity: A Global Perspective, Vol. 55. John Wiley & Sons Ltd., West Sussex, England.
Naeem, S. 2000. Reply to Wardle Et Al. ESA Bulletin 81:241-246. Naeem, S. 2002. Ecosystem Consequences of Biodiversity Loss: The Evolution of a
Paradigm. Ecology 83:1537-1552. Naeem, S., M. Loreau, and P. Inchausti. 2002. Biodiversity and Ecosystem Functioning: The
Emergence of a Synthetic Ecological Framework, p. 3-11 Biodiversity and Ecosystem Functioning: Synthesis and Perspectives. Oxford University Press.
Naeem, S., L.J. Thompson, S.P. Lawler, J.H. Lawton, and R.M. Woodfin. 1994. Declining Biodiversity Can Alter the Performance of Ecosystems 368:734-737.
Naeem, S., F.S. Chapin III, P. Costanza, P.R. Ehrlich, F.B. Golley, D.U. Hooper, J.H. Lawton, R.V. O'Neill, H.A. Mooney, O. Sala, A. Symstad, and D. Tilman. 1999. Biodiversity and Ecosystem Functioning: Maintaining Life Support Processes. Issues in Ecology.
Nagel, E. 1961. The Structure of Science Routledge & Kegan Paul, London. Norton, B.G. 2001. Conservation Biology and Environmental Values: Can There Be a
Universal Earth Ethic?, In C. Potvin and e. al., eds. Protecting Biological Diversity: Roles and Responsibilities. McGill-Queen's University Press, Montreal.
Odum, E.P. 1953. Fundamental of Ecology. First ed. Saunders, Philadelphia. Odum, E.P. 1969. The Strategy of Ecosystem Development. Science:262-270. Patterson, H.D., and E.R. Williams. 1976. A New Class of Resolvable Incomplete Block
Designs. Biometrika 63:83-92. Petchey, O.L., and K.J. Gaston. 2006. Functional Diversity: Back to Basics and Looking
Forward. Ecology Letters 9:741-758. Pianka, E. 1999. Evolutionary Ecology, 6th ed. Benjamin Cummings. Picasso, V.D., E.C. Brummer, M. Liebman, P.M. Dixon, and B.J. Wilsey. 2008. Crop
Species Diversity Affects Productivity and Weed Suppression in Perennial Polycultures under Two Management Strategies. Crop Science 48.
Pimentel, D., J. Allen, A. Beers, L. Guinand, R. Linder, P. McLaughlin, B. Meer, D. Musonda, D. Perdue, and et al. 1987. World Agriculture and Soil Erosion. Bioscience 37:277-283.
Pimm, S.L. 1980. "Food Web Design and the Effect of Species Deletion". Oikos:139-49. Piper, J., and S. Pimm. 2002. The Creation of Diverse Prairie-Like Communities.
Community Ecology 3:205-216. Piper, J.K. 1993. Neighborhood Effects on Growth, Seed Yield, and Weed Biomass for 3
Perennial Grains in Polyculture. Journal of Sustainable Agriculture 4:11-31. Piper, J.K. 1998. Growth and Seed Yield of Three Perennial Grains within Monocultures and
Mixed Stands. Agriculture Ecosystems & Environment 68:1-11. Ploschuck, E., S. GA, and D. Ravetta. 2005. Reproductive Allocation of Biomass and
Nitrogen in Annual and Perennial Lesquerella Crops. Annals of Botany 96:127-135. Polley, H.W., B.J. Wilsey, and J.D. Derner. 2003. Do Species Evenness and Plant Density
Influence the Magnitude of Selection and Complementarity Effects in Annual Plant Species Mixtures? Ecology Letters 6:248-256.
Purvis, A., and A. Hector. 2000. Getting the Measure of Biodiversity. Nature 405:212-219.
124
Rabalais, N.N., R.E. Turner, Q. Dortch, D. Justic, V.J. Bierman Jr, and W. Wiseman Jr. 2002. Nutrient Enhanced Productivity in the Northern Gulf of Mexico: Past, Present and Future. Hydrobiologia 475/476:39-63.
Reich, P.B., D. Tilman, S. Naeem, D.S. Ellsworth, J. Knops, J. Craine, D. Wedin, and J. Trost. 2004. Species and Functional Group Diversity Independently Influence Biomass Accumulation and Its Response to Co2 and N. PNAS 101:10101-10106.
Roscher, C., J. Schumacher, W. Weisser, B. Schmid, and E.-D. Schulze. 2007. Detecting the Role of Individual Species for Overyielding in Experimental Grassland Communities Composed of Potentially Dominant Species. Oecologia 154:535-549.
Sacks, E.J., J.P. Roxas, and M.T.S. Cruz. 2003. Developing Perennial Upland Rice I: Field Performance of Oryza Sativa/O. Rufipogon F-1, F-4, and Bc1f4 Progeny. Crop Sci. 43:120-128.
Sanderson, M.A., R.H. Skinner, D.J. Barker, G.R. Edwards, B.F. Tracy, and D.A. Wedin. 2004. Plant Species Diversity and Management of Temperate Forage and Grazing Land Ecosystems. Crop Science 44:1132-1144.
Sanderson, M.A., K.J. Soder, L.D. Muller, K.D. Klement, R.H. Skinner, and S.C. Goslee. 2005. Forage Mixture Productivity and Botanical Composition in Pastures Grazed by Dairy Cattle. Agronomy Journal 97:1465-1471.
Sarkar, S. 2005. Biodiversity and Environmental Philosophy: An Introduction Cambridge University Press, New York.
SAS Institute Inc. 2003. Sas Software 9.1.3 for Windows SAS Inst., Cary, NC, USA. SAS-Institute-Inc. 2003. Sas Software 9.1.3 for Windows SAS Inst., Cary, NC, USA. Scheinost, P., D. Lammer, X. Cai, T. Murray, and S. Jones. 2001. Perennial Wheat: The
Development of a Sustainable Cropping System for the U. S. Pacific Northwest. American journal of alternative agriculture 16:147-151.
Scherer-Lorenzen, M., C. Potvin, J. Koricheva, Z. Bornik, A. Hector, G. Reynolds, and B. Schmid. 2005. The Design of Experimental Tree Plantations for Functional Biodiversity Research., In M. Scherer-Lorenzen, et al., eds. The Functional Significance of Forest Diversity. Springer, Berlin.
Schulte, L.A., M. Liebman, H. Asbjornsen, and T.R. Crow. 2006. Agroecosystem Restoration through Strategic Integration of Perennials., pp. 164A(6) Journal of Soil and Water Conservation, Vol. 61.
Schulze, D., and H.A. Mooney, (eds.) 1993. Biological Diversity and Ecosystem Function. Springer-Verlag.
Simberloff, D. 1980. A Succession of Paradigms in Ecology: Essentialism to Materialism and Probabilism. Synthese 43:3-39.
Sleugh, B., K.J. Moore, J.R. George, and E.C. Brummer. 2000. Binary Legume-Grass Mixtures Improve Forage Yield, Quality, and Seasonal Distribution. Agronomy Journal 92:24-29.
Soder, K.J., A.J. Rook, M.A. Sanderson, and S.C. Goslee. 2007. Interaction of Plant Species Diversity on Grazing Behavior and Performance of Livestock Grazing Temperate Region Pastures. Crop Science 47:416-425.
Soule, M.E. 1985. What Is Conservation Biology? BioScience 35:727-734. Spehn, E.M., M. Scherer-Lorenzen, B. Schmid, A. Hector, M.C. Caldeira, P.G.
Dimitrakopoulos, J.A. Finn, A. Jumpponen, G. O'Donnovan, J.S. Pereira, E.D.
125
Schulze, A.Y. Troumbis, and C. Korner. 2002. The Role of Legumes as a Component of Biodiversity in a Cross-European Study of Grassland Biomass Nitrogen. Oikos 98:205-218.
Springer, T.L., G.E. Aiken, and R.W. McNew. 2001. Combining Ability of Binary Mixtures of Native, Warm-Season Grasses and Legumes. Crop Science 41:818-823.
Srivastava, D.S., and M. Vellend. 2005. Biodiversity-Ecosystem Function Research: Is It Relevant to Conservation? Annual Review of Ecology Evolution and Systematics 36:267-294.
Stachowicz, J.J., J.F. Bruno, and J.E. Duffy. 2007. Understanding the Effects of Marine Biodiversity on Communities and Ecosystems. Annual Review of Ecology, Evolution, and Systematics 38:739-766.
Stohlgren, T.J., D.T. Barnett, and J.T. Kartesz. 2003. The Rich Get Richer: Patterns of Plant Invasions in the United States. Frontiers in Ecology and the Environment:11-14.
Stohlgren, T.J., D. Binkley, G.W. Chong, M.A. Kalkhan, L.D. Schell, K.A. Bull, Y. Otsuki, G. Newman, M. Bashkin, and Y. Son. 1999. Exotic Plant Species Invade Hot Spots of Native Plant Diversity. Ecological Monographs 69:25-46.
Temperton, V., P. Mwangi, M. Scherer-Lorenzen, B. Schmid, and N. Buchmann. 2007. Positive Interactions between Nitrogen-Fixing Legumes and Four Different Neighbouring Species in a Biodiversity Experiment. Oecologia 151:190-205.
Thompson, R., and B.M. Starzomski. 2007. What Does Biodiversity Actually Do? A Review for Managers and Policy Makers. Biodiversity and Conservation 16:1359-1378.
Tilman, D., and J.A. Downing. 1994. Biodiversity and Stability in Grasslands. Nature 367:363-365.
Tilman, D., D. Wedin, and J. Knops. 1996. Productivity and Sustainability Influenced by Biodiversity in Grassland Ecosystems. Nature 379:718-720.
Tilman, D., C.L. Lehman, and K.T. Thomson. 1997a. Plant Diversity and Ecosystem productivity: Theoretical Considerations. PNAS 94:1857-1861.
Tilman, D., J. Hill, and C. Lehman. 2006a. Carbon-Negative Biofuels from Low-Input High-Diversity Grassland Biomass. Science 314:1598-1600.
Tilman, D., P.B. Reich, and J.M.H. Knops. 2006b. Biodiversity and Ecosystem Stability in a Decade-Long Grassland Experiment. Nature 441:629-632.
Tilman, D., J. Knops, D. Wedin, P. Reich, M. Ritchie, and E. Siemann. 1997b. The Influence of Functional Diversity and Composition on Ecosystem Processes. Science 277:1300-1302.
Tracy, B.F., and M.A. Sanderson. 2004a. Productivity and Stability Relationships in Mowed Pasture Communities of Varying Species Composition. Crop Science 44:2180-2186.
Tracy, B.F., and M.A. Sanderson. 2004b. Forage Productivity, Species Evenness and Weed Invasion in Pasture Communities. Agriculture, Ecosystems & Environment 102:175-183.
Tracy, B.F., and D.B. Faulkner. 2006. Pasture and Cattle Responses in Rotationally Stocked Grazing Systems Sown with Differing Levels of Species Richness. Crop Science 46:2062-2068.
Trenbath, B. 1974. Biomass Productivity of Mixtures. Adv. Agron 26:210.
126
USDA. 2007. United States Department of Agriculture. National Agriculture Statistics Service. Crop (Corn, Soybeans, Oats, Wheat) Yields by State [Online] http://www.nass.usda.gov/.
van Ruijven, J., and F. Berendse. 2005. Diversity-Productivity Relationships: Initial Effects, Long-Term Patterns, and Underlying Mechanisms. Proceedings of the National Academy of Sciences of the United States of America 102:695-700.
Vandermeer, J. 1989. The Ecology of Intercropping Cambridge University Press. Vandermeer, J., D. Lawrence, A. Symstad, and S. Hobbie. 2002. Effect of Biodiversity on
Ecosystem Functioning in Managed Ecosystems, p. 221-233 Biodiversity and Ecosystem Functioning: Synthesis and Perspectives. Oxford University Press.
Vitousek, P.M., H.A. Mooney, J. Lubchenco, and J.M. Melillo. 1997. Human Domination of Earth's Ecosystems. Science 277:494-499.
Wagoner, P. Intermediate Wheatgrass (Thinopyrum Intermedium). Development of a Perennial Grain Crop.
Wagoner, P. 1990. Perennial Grain Development: Past Efforts and Potential for the Future. Crit. Rev. Plant Sci 9:381-408.
Wardle, D.A., O. Zackrisson, G. Hornberg, and C. Gallet. 1997. The Influence of Island Area on Ecosystem Properties. Science 277:1296-1299.
Wardle, D.A., M.A. Huston, J.P. Grime, F. Berendse, E. Garnier, W.K. Lauenroth, H. Setala, and S.D. Wilson. 2000. Biodiversity and Ecosystem Function: An Issue in Ecology. ESA Bulletin 81:235-239.
Weik, L., H.P. Kaul, E. Kubler, and W. Aufhammer. 2002a. Grain Yields of Perennial Grain Crops in Pure and Mixed Stands. Journal of Agronomy and Crop Science 188:342-349.
Weik, L., H.P. Kaul, E. Kubler, and W. Aufhammer. 2002b. Competitive Effects on the Dry Matter Accumulation of Perennial Grain Crops in Mixed Stands. Journal of Applied Botany-Angewandte Botanik 76:107-114.
Williams, G.C. 1966. Adaptation and Natural Selection. Princeton University Press, Princeton, N.J.
Wilsey, B.J., and H.W. Polley. 2004. Realistically Low Species Evenness Does Not Alter Grassland Species-Richness-Productivity Relationships. Ecology 85:2693-2700.
Wilsey, B.J., D.R. Chalcraft, C.M. Bowles, and M.R. Willig. 2005. Relationships among Indices Suggest That Richness Is an Incomplete Surrogate for Grassland Biodiversity. Ecology 86:1178-1184.
Wolfe, M.S., and J.A. Barrett. 1980. Can We Lead the Pathogen Astray? Plant Disease 64:148-155.
Wouters, A. 2005. The Function Debate in Philosophy. Acta Biotheoretica 53:123-151. Wynne-Edwards, V.C. 1962. Animal Dispersion in Relation to Social Behaviour Oliver &
Boyd, Edinburgh. Zhu, Y., H. Chen, J. Fan, Y. Wang, Y. Li, J. Chen, S. Yang, L. Hu, H. Leung, and T. Mew.
2000. Genetic Diversity and Disease Control in Rice. Nature 406:718-22.


![PRODUCTIVITY AND CYTOGENETIC STABILITY OF PROTOCORM … · 2014-12-17 · PRODUCTIVITY AND CYTOGENETIC STABILITY OF CYMBIDIUM PLBs 96 [GOGOI & al. 2012], hybrid Cymbidium Twilight](https://img.pdfslide.us/doc/110x75/5f23e5e348b1d45ec30cac2a/productivity-and-cytogenetic-stability-of-protocorm-2014-12-17-productivity-and.jpg)