Embed Size (px)
Citation preview

DIVERSITY OF BACTERIAL STRAINS
AND BACTERIOPHAGES IN
NORWEGIAN CHEESE PRODUCTION
HAILAY KIDANU GEBRESELASSIE
Master Thesis in Microbiology
June, 2014
II
ACKNOWLEDGEMENTS
I would like to thank my supervisor Professor Helge Holo for allowing me to work my thesis
in the Laboratory of Microbial Gene technology (LMG), The University of Life Sciences
(NMBU), in Ås. I am sincerely grateful for his overall guidance and constructive comments
throughout my thesis work. Special thanks to my co-supervisor Cyril Frantzen for his help to
train me new techniques and for his expertise throughout my laboratory work. I wish to
express my appreciation to Ibrahim Mehmeti for his technical support and statistical analysis
of my laboratory results. My gratitude extends to Linda Godager and May-Britt Hovet for
their unreserved technical support and providing me necessary materials, reagents and
chemicals. Many thanks to Hai Chi for his help in the laboratory and last but not least I am
thankful to all members of LMG group for all their help and support during my laboratory
work.
III
TABLE OF CONTENTS page
Acknowledgements-----------------------------------------------------------------------II
List of Abbreviations and Acronyms---------------------------------------------------V
List of Tables-----------------------------------------------------------------------------VI
List of Figures---------------------------------------------------------------------------VII
ABSTRACT----------------------------------------------------------------------------VIII
1. INTRODUCTION-----------------------------------------------------------------1
2. LITERATURE REVIEW--------------------------------------------------------4
2.1 The process of cheese making----------------------------------------------------------4
2.2 LAB as starter cultures in cheese production-----------------------------------------5
2.3 Types and methods for selection of suitable starter culture strain-----------------5
2.3.1 Mesophilic starter cultures---------------------------------------------------------------6
2.3.2 Thermophilic starter cultures-----------------------------------------------------------8
2.4 Phages of LAB and their effects-------------------------------------------------------8
2.5 Lactic acid bacteria phages- morphology and classification-----------------------9
2.6 Determination of host specificity in phage infection------------------------------10
3. MATERIALS AND METHODS-------------------------------------------------11
3.1 Origin of samples and bacterial strains---------------------------------------------11
3.2 Phage isolation and differentiation--------------------------------------------------11
3.2.1 Phage isolation by plaque assay method----------------------------------------------11
3.2.2 Propagation of phages--------------------------------------------------------------------12
3.2.3 Phage typing of strains ------------------------------------------------------------------13
3.2.4 Fermentation inhibition test-------------------------------------------------------------13
3.3 Differentiation of bacterial isolates -------------------------------------------------15
3.3.1 Growth inhibition test------------------------------------------------------------------------15
3.3.2 DNA preparation for genotypic differentiation of strains---------------------------15
3.3.3 Separation of bacterial strains by (GTG)5-PCR fingerprinting --------------------16
3.3.4 CWPS genes typing of strains by multiplex PCR -----------------------------------17
IV
4. STATISTICAL ANALYSIS-------------------------------------------19
5. RESULTS-----------------------------------------------------------------20
5.1 Detection of phages in bulk starters and whey samples -----------------------------20
5.2 Phage typing of bacterial strains with non-purified phages-------------------------21
5.3 Phage typing of the 96 strains with phages purified from plaques-----------------23
5.4 Differentiation of phages ----------------------------------------------------------------25
5.5 Fermentation inhibition test -------------------------------------------------------------26
5.6 Differentiation of strains by phage typing and PCR methods-----------------------27
5.6.1 Growth inhibition study in bacterial isolates---------------------------------------------27
5.6.2 Phage typing of strains----------------------------------------------------------------------30
5.6.3 Differentiation of bacterial isolates by (GTG)5-PCR fingerprint analysis ----------32
5.6.4 CWPS genes typing of strains by multiplex-PCR---------------------------------------35
5.6.5 Comparison of methods used for differentiation of strains-----------------------------36
5.7 Association between CWPS encoding genes and phage sensitivity of strains---- 38
6. DISCUSSION-------------------------------------------------------------------------40
7. CONCLUSIONS---------------------------------------------------------------------44
REFERENCES--------------------------------------------------------------------------45
APPENDIXES---------------------------------------------------------------------------51
Appendix 1. Phages used fermentation inhibition test----------------------------------------------51
Appendix 2. CWPS genes typing of LAB strains by Multiplex PCR------------------------------------52
Appendix 3. A scheme used during growth kinetics------------------------------------------------55
V
LIST OF ABBREVIATIONS AND ACRONYMS
Bp – base pair
BS – bulk starter
CaCL2 – Calcium chloride
CFU-Colony forming units
CO2 - Carbon dioxide
CWPS – Cell wall polysaccharides
DVI- Direct Vat Inoculation
dNTP -Deoxynucleotide triphosphates
dsDNA – double stranded deoxyribonucleic acid
ICTV - International Committee on Taxonomy of Viruses
g-gram
hr- hour
Kb-kilo base
LAB - lactic acid bacteria
MgCl2 – Magnesium chloride
mM – mili molar
NaOH – Sodium hydroxide
OD – Optical density
PCR - Polymerase chain reaction
Pp -page
RBPs - receptor-binding proteins
RNA - Ribonucleic acid
rRNA - Ribosomal ribonucleic acid
UPGMA - unweighted pair group method with arithmetic averages clustering algorithm
Ф - Phages
°C Degrees Celsius
µ - micro
VI
LIST OF TABLES
Table 1. Experimental set up for fermentation inhibition test--------------------------------------14
Table 2. Procedure for master mix preparation-------------------------------------------------------16
Table 3. Four primer pairs used for Multiplex PCR------------------------------------------------17
Table 4. List of 40 phages isolated from their respective bacterial strains-----------------------21
Table 5. Scheme on 96 well plate used during phage typing of strains---------------------------24
Table 6. Test score of fermentation inhibition tests-------------------------------------------------27
Table 7. Summary of phage attack study by growth kinetics--------------------------------------29
Table 8. Comparison of LAB strains based on genomic regions encoding their CWPS-------36
Table 9. Comparative analysis of bacterial strains using different methods---------------------37
Table 10. Classification of strains based on phage tying results-----------------------------------38
Table 11. Relationship between phage susceptibility of isolates and their CWPS types-------39
VII
LIST OF FIGURES
Figure 1. Schemes in plaque assay using bulk starter and whey samples------------------------20
Figure 2. Host ranges of 40 non-purified phages----------------------------------------------------22
Figure 3. Broad host ranges of phages and high sensitivity of strains----------------------------23
Figure 4. Host ranges of the 40 purified phage isolates---------------------------------------------25
Figure 5. Dendrogram of 40 purified phage isolates (Фs)------------------------------------------26
Figure 6. Phage attack of strains studied by growth kinetics---------------------------------------28
Figure 7. Differentiation ofl strains based on their susceptibility to 40 phage isolates---------31
Figure 8. Differentiation of strains by (GTG)5-PCR banding patterns---------------------------32
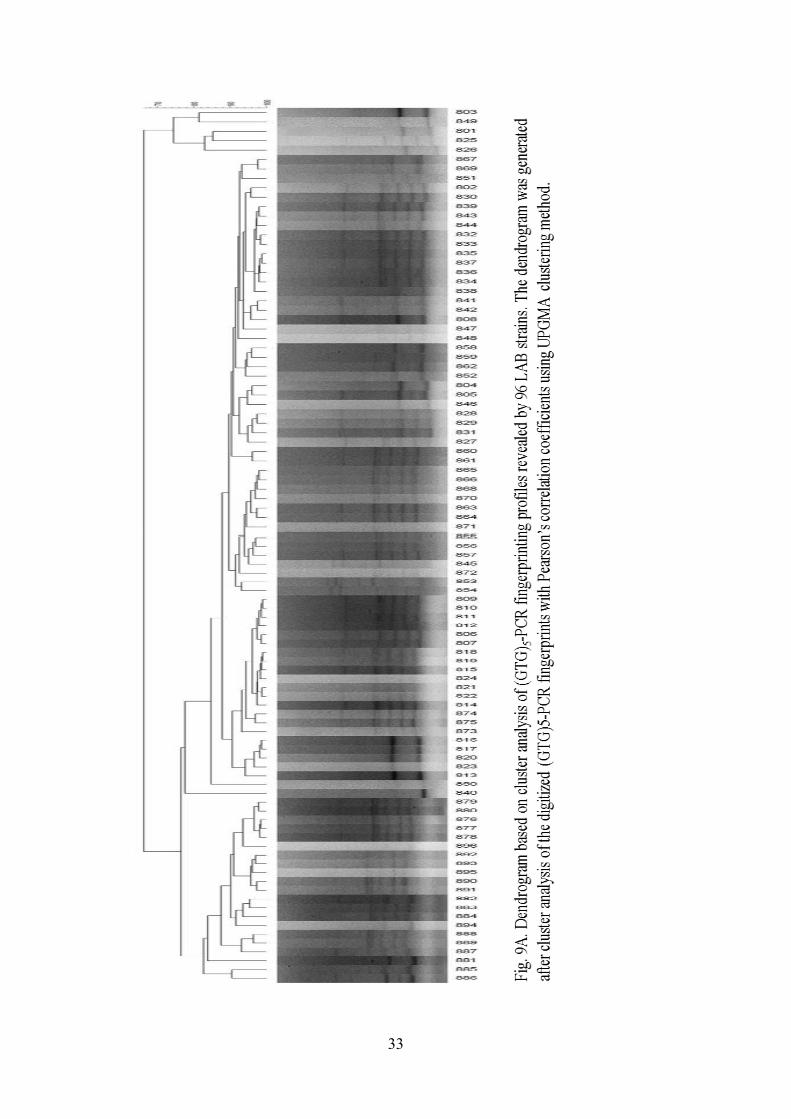
Figure 9A. Dendrogram based on cluster analysis of (GTG)5-PCR fingerprinting profiles
revealed by 96 strains.--------------------------------------------------------------------------33
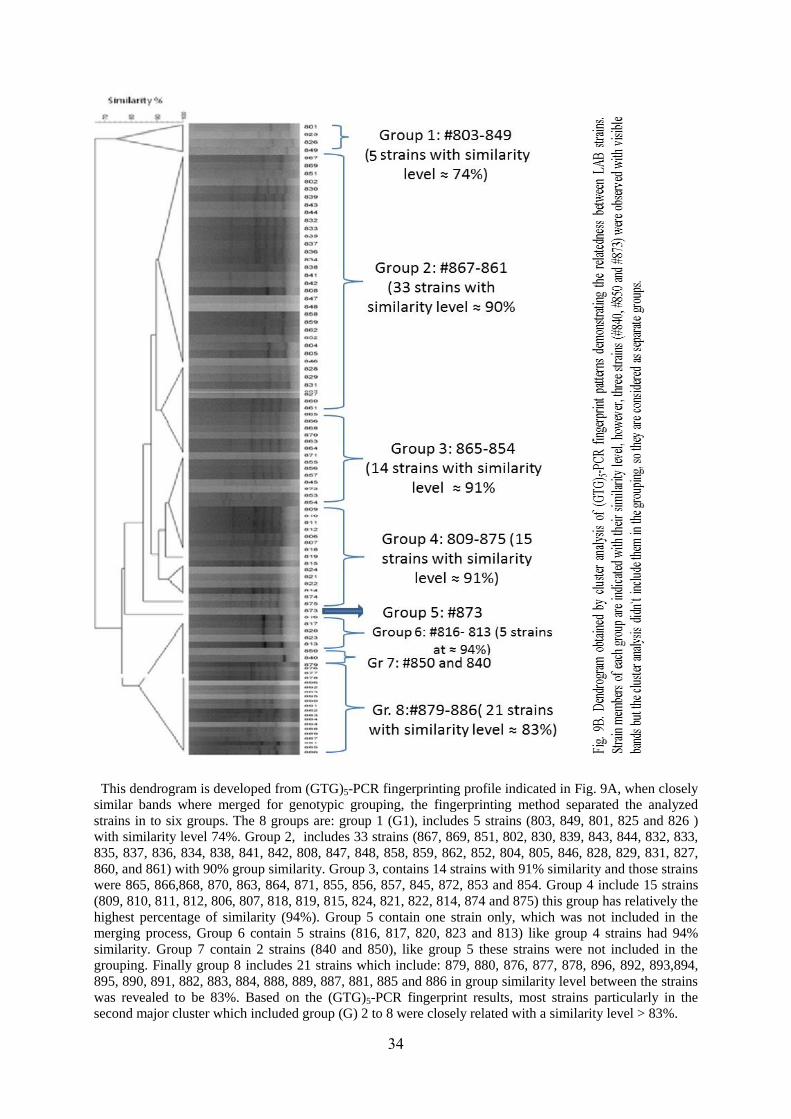
Figure 9B. Dendrogram obtained by cluster analysis of (GTG)5-PCR fingerprint patterns
demonstrating the relatedness between strains.------------------------------------------------------34
Figure 10. Products of PCR assays showing different target CWPS genes----------------------35
VIII
ABSTRACT
A study on diversity of bacterial strains and bacteriophages in Norwegian cheese production
was assessed on samples from TINE`s cheese production. Samples were obtained from a dairy
plant in Nærbø that was experienced fermentation problems. 96 bacterial strains were also
isolated from another TINE's dairy plant in Storsteinnes which was producing quality cheese.
Both dairies were using the same commercial starter cultures. For phage isolation bulk starter
and whey samples were used to infect 96 bacterial strains. Forty phages were isolated from
specific indicator strains. Using the isolated phages, phage typing of all the 96 strains was
performed, and plaque formation was obtained on 80 strains. The sensitivity of bacterial
strains was highly variable and isolated phages had a broad host range infecting between 4%
(Ф837) and 44% (Ф878) of the strains. In addition, (GTG)5-PCR enabling the differentiation of
all the bacterial strains in to 8 clusters. Furthermore, cell wall polysaccharide genes typing of
bacterial strains were also carried out and 91 strains were found to have genes encoding
different CWPS types, while five strains were suggested to have another type of cell surface.
Our results showed that Lactococcus lactis of CWPS group B were the predominant starter
culture used in the Norwegian cheese production. Finally, the effect of the isolated phages in
fermentation activity of mixed starter cultures was also assessed and results showed a change
in pH during milk fermentation. Though, pooled phage isolates caused inhibition in acid
production, our phage isolates alone were not shown to cause a severe effect in the activities
of the commercial starter culture. Therefore, further studies using single starter culture are
recommended to reveal the actual impact of the isolated phages on dairy fermentation
processes.
1
1. INTRODUCTION
The dairy industry is one of the most important food industries that involves growth and
metabolic activities of lactic acid bacteria (LAB). The uses of LAB as starter cultures have
also great industrial significance due to their crucial role in the manufacturing, flavor, and
texture development of fermented dairy foods (Cogan et al., 2007; Shiby and Mishra, 2013).
The production of lactic acid and other metabolites by LAB starter cultures in the food
industry are very important for ensuring high-quality products (del Rio et al., 2012; Marco et
al., 2012) and control of pathogenic and spoilage microorganisms (Carminati et al., 2010).
Several fermented food products, including cheese, fermented milks, and cream butter are
highly acceptable by consumers because of their flavor, aroma and high nutritive value
(Marco et al., 2012; Shiby and Mishra, 2013). Moreover, much research has been done on the
health benefits associated with the consumption of cultured dairy foods and probiotics,
particularly their role in modulating immune function (Cogan et al., 2007). Other health
benefits of fermented milk products include prevention of gastrointestinal infections, anti-
tumor activity, good for lactose intolerance cases, reduction of serum cholesterol levels and
anti-mutagenic activity (Shiby and Mishra, 2013).
According to Hati et al. (2013), a starter culture is defined as “an active microbial preparation,
deliberately added to initiate desirable changes during preparation of fermented products”. It
can be a single strain type or a combination of different strains, usually strains of Lactococcus
lactis (L. lactis), Streptococcus thermophilus (Str. Thermophilus), Leuconostoc, and/or
Lactobacillus species (Garneau and Moineau, 2011). Strains of L. lactis and Str.
thermophilus are commonly used starter cultures in the dairy industry (Deveau et al., 2006).
The genus Leuconostoc together with L. lactis subsp. lactis biovar diacetylactis are important
flavor producers (Kleppen et al., 2012). These bacterial strains produce diacetyl, the source of
aroma and flavor compounds in different dairy products, such as buttermilk, butter, and
various cheese types (Bjorkroth and Holzapfel, 2006).
Bacteriophage infections during dairy fermentation processes have been a major concern for
many years. Phages are obligate parasites of bacteria that attacks LAB starter cultures, and
become the major sources of fermentation failure (spoilage or delay) causing economic losses
on many dairy products (Moineau and Lévesque, 2005; Garneau and Moineau, 2011).
Though, the problem of phages is well known in the dairy industry, there are also reports in
the food, chemical, pharmaceutical, feed and pesticide industries (Emond and Moineau,
2007). Thus, understanding LAB phage-host interaction has paramount importance in finding
solution for huge losses (Hassan and Frank, 2001; Deveau et al., 2006).
2
Most known phages have dsDNA packaged into a capsid connected to a tail (Ackermann,
2007). All known phages infecting LAB members are classified under tailed phages (Marco et
al., 2012). The tail of a phage is an essential structure both for phage classification and for
host recognition. Although, tailed phages are classified in to ten species, the 936, c2, and P335
species are the most frequently isolated lactococcal phages from dairy environments (Deveau
et al., 2006).
Starter cultures contains gram positive LAB and the composition of their surface structure
contain cell wall polysaccharides (CWPS). The gene cluster encoding CWPS biosynthesis in
various L. lactis strains contain highly conserved regions but exhibits genetic diversity,
suggesting that CWPS structure could be a variable character between strains (Mahony et al.,
2013b). Although, the taxonomy of L. lactis has changed many times, currently it is based on
phenotypic methods (Schleifer et al., 1985; Rademaker et al., 2007) and includes two
subspecies L. lactis subsp. lactis and L. lactis subsp. cremoris, which correlate with its
genotype.
Lactococcal phage infections requires the recognition of receptors on the bacterial cell surface
by receptor-binding proteins (RBPs) that are part of the phage tail structure (Kleppen et al.,
2012; Kelly et al., 2013). However, binding of phage to the cell surface is a very specific
process (Holmfeldt et al., 2007). This specificity of RBPs can be partly due to the specific
CWPS that can serve as host receptor for phage particles (Ainsworth et al., 2014),
accessibility of bacterial receptor and physiochemical properties of the cell envelope (Ray and
Bhunia, 2013). Recent studies indicated that L. lactis has three distinct genetic loci for CWPS
biosynthesis termed the A, B, and C types (Mahony et al., 2013b; Ainsworth et al., 2014),
which can be linked to the RBP phylogeny of 936 phages (Mahony et al., 2013b).
Further knowledge on the nature of CWPS-types will allow selection of dairy starters and
design starters resistant to certain groups of phages with known RBPs, taking this into account
they can be used in strain rotation to prevent phage attacks (Ainsworth et al., 2014). Since,
rotation of various phage-unrelated starter cultures is helpful to avoid recurrent amplification
of the same phage over consecutive fermentation processes (Garneau and Moineau, 2011;
Kleppen et al., 2011). In dairy production, 'bulk starter' in liquid form was used to inoculate
the milk used in the manufacture of cheese, yoghurt, buttermilk and other fermented products
(Marco et al., 2012). However, the use of bulk starter in cheese making is an advantage for the
phages, since this procedure gives phage with an opportunity to multiply prior to fermentation
in the production vats (Kleppen et al., 2011). Furthermore, phages may remain in the whey
3
protein concentrate (liquid or dried) and contaminate the products to which it is added
(Chopin, 1980). Nowadays, the use of starter cell concentrates designated as Direct Vat
Inoculation (DVI) cultures have increasing being used in cheese manufacture, this can serve
as the only inoculum in fermentation vats and avoid fermentation problems caused by phages
in bulk starter (Kleppen et al., 2011).
To control phage infection, culture rotation is one of the methods used in dairy production
processes. However, culture rotation can`t eliminate phage growth in cheese milk in vats, but
if phage numbers are reduced to below 10,000 PFU/mL of cheese whey, acid production will
not be affected (Huggins, 1984). Thus, it is important to determine the sensitivity of starter
bacteria to the phages isolated from the dairy. This study was carried out with 96 bacterial
strains isolated from a BS obtained from TINE`s good dairy plant in Storsteinnes. Bulk
starters and whey samples were collected from another TINE`s dairy in Nærbø, that had
fermentation problem in the cheese making processes using the same starter culture.
Therefore, our objectives were to investigate the diversity of bacterial strains from the starter
culture that were producing quality products in Storsteinnes and to determine diversity of
phages in the samples from Nærbø. These samples were tested for the presence of phages
specific to the 96 strains. In this study plaque assays and PCR methods were used with the
following specific objectives:
- To isolate phages from bulk starter and whey samples
- To determine the phage susceptibility of start cultures strains
- To investigate relationship between phage host range and diversity of bacterial strains
- To compare PCR methods with phage typing for differentiation of LAB strains
- And possibly to identify phages affecting acidification process
4
2. LITERATURE REVIEW
2.1 The process of cheese making
Cheese making is a process in which the conversion of liquid milk into a solid mass of cheese
is done via coagulation (or precipitation) of milk protein. Milk, contains about 3.3% proteins.
Of the protein portion, about 80% is casein and the remaining 20% are known collectively as
whey proteins. According to Hutkins (2006), there are three ways of milk coagulation. First,
milk can be coagulated by acids produced by LAB. When the milk pH reaches 4.6, casein is at
its isoelectric point and its minimum solubility, and therefore it precipitates. It is important to
realize that casein coagulates at pH 4.6 whether acidification occurs via fermentation
generated acids or simply by addition of food grade acids direct into the milk. The second and
most common way to effect coagulation is by the addition of the enzyme chymosin (or
rennet). This enzyme hydrolyzes a specific peptide bond located between amino acid residues
105 (a methionine) and 106 (a phenylalanine) in casein proteins (Kosikowski and Mistry,
1997; Hutkins, 2006). Besides the protein separation, the fermentative action of specific LAB
stains may lead to an extended bacterial fermentation and removal of toxic or antinutritive
factors, such as lactose and galactose from fermented milks to prevent lactose intolerance
(Hati et al., 2013).
In contrast to acid-precipitated casein, the coagulated casein network formed by chymosin
treatment traps nearly all of the milk fat within the curd. Most of the cheeses manufactured
around the world rely on chymosin coagulation. However, it is worth emphasizing that even
though chymosin, alone, is sufficient to coagulate milk, lactic starter cultures are also
absolutely essential for successful manufacture of most hard cheeses (Hati et al., 2013). The
lactic acid bacteria that comprise cheese cultures not only produce acid and reduce the pH,
they also contribute to the relevant flavor, texture, and other properties of cheese (Hutkins,
2006). Finally, it is possible to form a precipitate by a combination of moderate acid addition
(pH 6.0), plus high heat (>85°C).Whey proteins are denatured under these conditions, thus the
precipitate that form consists not only of casein, but also whey proteins.
Another aspect of LAB that affects cheese production is autolysis (Lortal and Chapot-
Chartier, 2005). Autolysis of the starter cells is followed by the release of intracellular
peptidases in the curd. Bacterial autolysis is a result of the regular degradation of
peptidoglycan by autolysin activity paired with the cessation of peptidoglycan synthesis
induced by unfavourable environmental conditions and consequent cell lysis. Furthermore,
5
genetic strategies exist for the induction of phage holins and lysins to promote lysis of the
starter cells during maturation (Hati et al., 2013).
2.2 Lactic acid bacteria as starter cultures in cheese production
Commercial dairy starter cultures are generally composed of lactic acid-producing and citric
acid-fermenting lactic acid bacteria. Although commercial dairy starters are available as
cultures which can be added directly to milk without any intermediate transfer or propagation,
it is a common practice that cheese makers produce in-house bulk starters. A bulk starter is
defined as starter cultures contain carefully selected strains propagated at the dairy plant for
inoculation into milk (Elsborg et al., 2001). Such bulk starters are generally made by
inoculating heat treated milk with a volume of a previous bulk starter or with a freeze-dried or
frozen starter culture preparation, followed by incubating the inoculated milk under conditions
permitting the starter culture strain(s) to propagate for a sufficient period of time to provide a
desired cell number (Elsborg et al., 2001; Lortal and Chapot-Chartier, 2005).
During cheese maturation, several aromatic compounds are generated due to the action of
endogenous milk enzymes as well as the proteolytic and lipolytic activities of LAB present in
the cheese (Hati et al., 2013). They begin the process by degrading proteins in the starting
material. The proteases of the starter culture, as well as the rennet in curd and the plasmin in
milk, degrade proteins, namely casein, to produce free amino acids and peptides (Smit et al.,
2000). These amino acids are essential precursors to the volatile aroma compounds that are
responsible for the distinct cheese flavors (Yvon et al., 1997).
2.3 Types of starter cultures and selection criteria for suitable strains
The production of fermented dairy products such as cheese-making is based on LAB ability
to ferment lactose causing a speedy acidification of milk through lactic acid production, which
decrease the pH, consequently affecting cheese production process and eventually cheese
composition and quality (Briggiler-Marco et al., 2007). There are about 11 genera of LAB,
but in dairy starter cultures the commonly used are strains of four genera namely Lactococcus,
Leuconostoc, Lactobacillus and Streptococcus (Hassan and Frank, 2001; Hati et al., 2013).
Strains of L. lactis and Str. thermophilus are the most actively working starter culture bacteria
in the dairy fermentation industry globally (Deveau et al., 2006), whereas strains of
Lactobacillus and Leuconostoc species are commonly used as adjuncts (Nieto-Arribas et
al., 2010). Starter cultures can be used as single strain, mixed strain or multiple strains
depending upon the desire what type of products to be prepared (Fernandes, 2008). Mixed
6
starter cultures may be composed of different genera, species, and strains of LAB which
together form a complex culture (Hassan and Frank, 2001).
In selection of LAB starter culture strains, phenotypic methods based on physiological or
biochemical characteristics have been widely used (Kongo et al., 2007). These phenotypic
methods are very important in finding functional starter cultures which may lead to an
improved fermentation process and enhanced quality of the end products (Hati et al., 2013).
However, due to the presence of huge number of LAB strains with similar phenotypic
characteristics, in most cases these tests are insufficient for accurate strains identification
(Temmerman et al., 2004). Furthermore, the success of using functional starter cultures in a
particular food has been shown to be strongly strain dependent (Hati et al., 2013). On the
other hand, genotypic methods have much better discriminatory power in differentiation of all
individual strains (Prabhakar et al., 2011). Hence, combination of both phenotypic and
genotypic identification methods is preferred approach (Temmerman et al., 2004, Hati et al.,
2013).
Based on their physiology and growth characteristics starter culture can be classified as
mesophillic starter cultures (optimal growth temperature between 25-30°C) or those that have
optimal growth temperature between 37ºC - 45°C are known as thermophilic starter cultures
(Cogan, 1996; Fernandes, 2008). Similarly, their biochemical characteristics can also be
classified either as homofermentative or heterofermentative (Ray and Bhunia, 2013).
2.3.1 Mesophilic starter cultures
The microorganisms under this category include mainly strains of two genera Lactococci and
Leuconostoc (Fernandes, 2008). These mesophillic starter cultures are used in the production
of many cheese varieties mainly because of their acid producing activity, gas production, and
production of enzymatic activity for cheese ripening (McSweeney, 2004). In complex
cultures, the flavour-production is either exclusively by Leuconostoc spp. or by combination
of Leuconostoc and L. lactis subsp. lactis biovar diacetylactis strains (Parente and Cogan,
2004; Kleppen et al., 2012).
According to Lodics and Steenson, (1993), the nature of mixed- culture strain mesophilic
starter cultures can be grouped by their composition and are stated as:
O-type: starter cultures consist of Lactococcus spp., the main homofermentative LAB, which
do not ferment citrate; this type includes L. lactis subsp. lactis and L. lactis subsp. cremoris.
D-type: in addition to the O-type starter cultures, these cultures contain a flavour producing
LAB, called citrate-fermenting lactococcus known as L. lactis subsp. lactis biovar
diacetylactis (Kleppen et al., 2012; Tamara, 2013). In addition to production of diacetyl, it
7
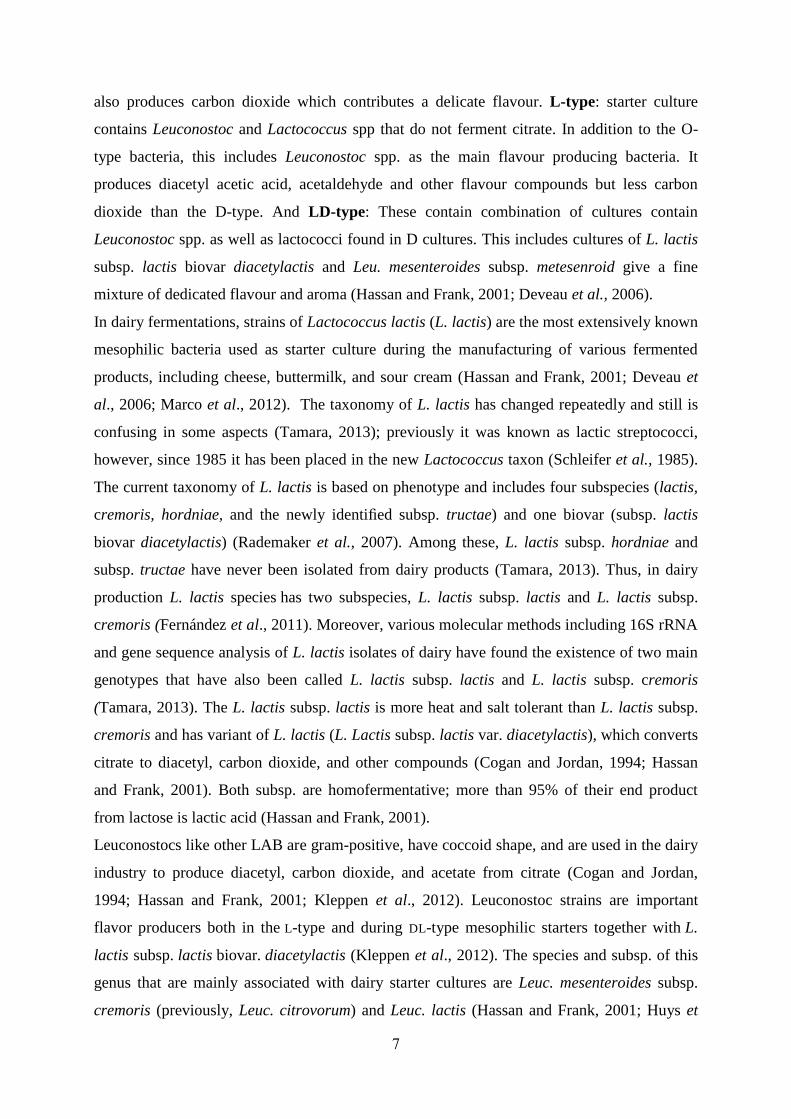
also produces carbon dioxide which contributes a delicate flavour. L-type: starter culture
contains Leuconostoc and Lactococcus spp that do not ferment citrate. In addition to the O-
type bacteria, this includes Leuconostoc spp. as the main flavour producing bacteria. It
produces diacetyl acetic acid, acetaldehyde and other flavour compounds but less carbon
dioxide than the D-type. And LD-type: These contain combination of cultures contain
Leuconostoc spp. as well as lactococci found in D cultures. This includes cultures of L. lactis
subsp. lactis biovar diacetylactis and Leu. mesenteroides subsp. metesenroid give a fine
mixture of dedicated flavour and aroma (Hassan and Frank, 2001; Deveau et al., 2006).
In dairy fermentations, strains of Lactococcus lactis (L. lactis) are the most extensively known
mesophilic bacteria used as starter culture during the manufacturing of various fermented
products, including cheese, buttermilk, and sour cream (Hassan and Frank, 2001; Deveau et
al., 2006; Marco et al., 2012). The taxonomy of L. lactis has changed repeatedly and still is
confusing in some aspects (Tamara, 2013); previously it was known as lactic streptococci,
however, since 1985 it has been placed in the new Lactococcus taxon (Schleifer et al., 1985).
The current taxonomy of L. lactis is based on phenotype and includes four subspecies (lactis,
cremoris, hordniae, and the newly identified subsp. tructae) and one biovar (subsp. lactis
biovar diacetylactis) (Rademaker et al., 2007). Among these, L. lactis subsp. hordniae and
subsp. tructae have never been isolated from dairy products (Tamara, 2013). Thus, in dairy
production L. lactis species has two subspecies, L. lactis subsp. lactis and L. lactis subsp.
cremoris (Fernández et al., 2011). Moreover, various molecular methods including 16S rRNA
and gene sequence analysis of L. lactis isolates of dairy have found the existence of two main
genotypes that have also been called L. lactis subsp. lactis and L. lactis subsp. cremoris
(Tamara, 2013). The L. lactis subsp. lactis is more heat and salt tolerant than L. lactis subsp.
cremoris and has variant of L. lactis (L. Lactis subsp. lactis var. diacetylactis), which converts
citrate to diacetyl, carbon dioxide, and other compounds (Cogan and Jordan, 1994; Hassan
and Frank, 2001). Both subsp. are homofermentative; more than 95% of their end product
from lactose is lactic acid (Hassan and Frank, 2001).
Leuconostocs like other LAB are gram-positive, have coccoid shape, and are used in the dairy
industry to produce diacetyl, carbon dioxide, and acetate from citrate (Cogan and Jordan,
1994; Hassan and Frank, 2001; Kleppen et al., 2012). Leuconostoc strains are important
flavor producers both in the L-type and during DL-type mesophilic starters together with L.
lactis subsp. lactis biovar. diacetylactis (Kleppen et al., 2012). The species and subsp. of this
genus that are mainly associated with dairy starter cultures are Leuc. mesenteroides subsp.
cremoris (previously, Leuc. citrovorum) and Leuc. lactis (Hassan and Frank, 2001; Huys et
8
al., 2011). These species are distinguished from other LAB by being mesophilic
heterofermentative cocci (Hassan and Frank, 2001). In addition, a significant amount of
CO2 is produced from their citrate metabolism and heterofermentative lactic acid fermentation
(Ali et al., 2013). This CO2 production is important for eye formation and the texture of semi-
hard cheeses (Hassan and Frank, 2001; Cantor et al., 2004); moreover, CO2 production is
crucial for the opening of the matrix of white- and blue-molded cheeses (Cantor et al., 2004).
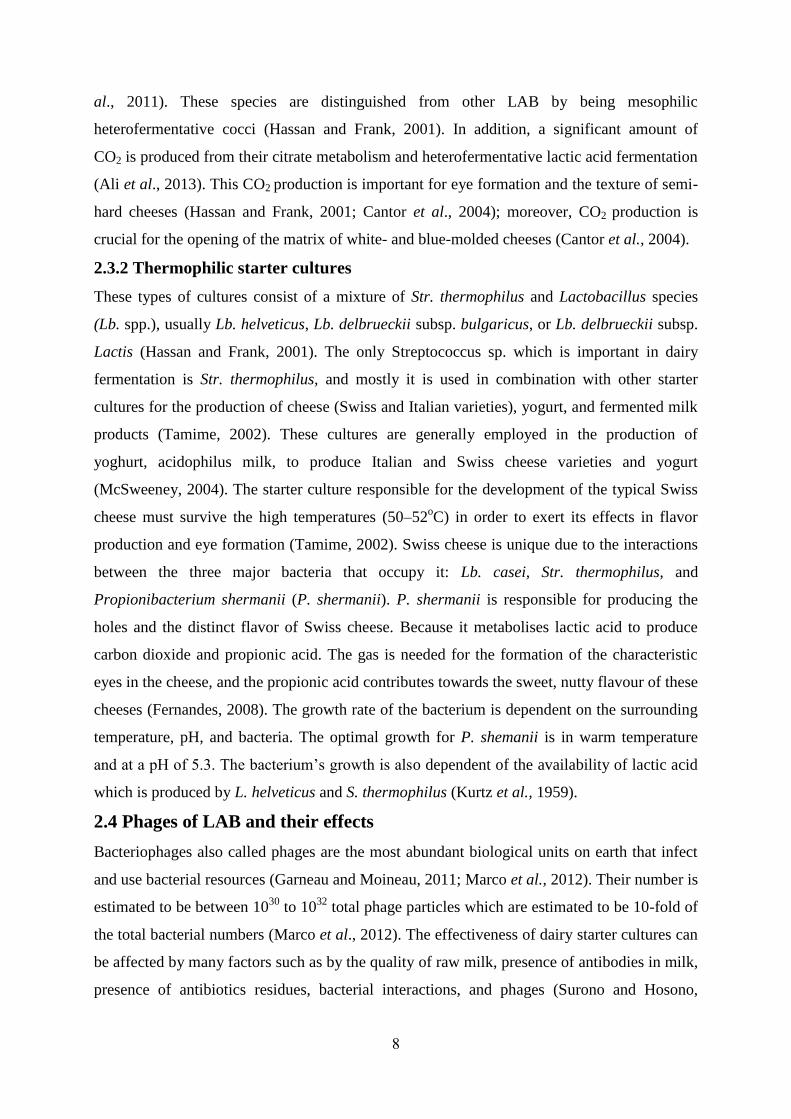
2.3.2 Thermophilic starter cultures
These types of cultures consist of a mixture of Str. thermophilus and Lactobacillus species
(Lb. spp.), usually Lb. helveticus, Lb. delbrueckii subsp. bulgaricus, or Lb. delbrueckii subsp.
Lactis (Hassan and Frank, 2001). The only Streptococcus sp. which is important in dairy
fermentation is Str. thermophilus, and mostly it is used in combination with other starter
cultures for the production of cheese (Swiss and Italian varieties), yogurt, and fermented milk
products (Tamime, 2002). These cultures are generally employed in the production of
yoghurt, acidophilus milk, to produce Italian and Swiss cheese varieties and yogurt
(McSweeney, 2004). The starter culture responsible for the development of the typical Swiss
cheese must survive the high temperatures (50–52oC) in order to exert its effects in flavor
production and eye formation (Tamime, 2002). Swiss cheese is unique due to the interactions
between the three major bacteria that occupy it: Lb. casei, Str. thermophilus, and
Propionibacterium shermanii (P. shermanii). P. shermanii is responsible for producing the
holes and the distinct flavor of Swiss cheese. Because it metabolises lactic acid to produce
carbon dioxide and propionic acid. The gas is needed for the formation of the characteristic
eyes in the cheese, and the propionic acid contributes towards the sweet, nutty flavour of these
cheeses (Fernandes, 2008). The growth rate of the bacterium is dependent on the surrounding
temperature, pH, and bacteria. The optimal growth for P. shemanii is in warm temperature
and at a pH of 5.3. The bacterium’s growth is also dependent of the availability of lactic acid
which is produced by L. helveticus and S. thermophilus (Kurtz et al., 1959).
2.4 Phages of LAB and their effects
Bacteriophages also called phages are the most abundant biological units on earth that infect
and use bacterial resources (Garneau and Moineau, 2011; Marco et al., 2012). Their number is
estimated to be between 1030
to 1032
total phage particles which are estimated to be 10-fold of
the total bacterial numbers (Marco et al., 2012). The effectiveness of dairy starter cultures can
be affected by many factors such as by the quality of raw milk, presence of antibodies in milk,
presence of antibiotics residues, bacterial interactions, and phages (Surono and Hosono,
9
2011). Moreover, Kleppen and his coworkers (2012) have been indicated that bulk cultures
infected with phages contamination in the Vat can disseminate phages during fermentation
process. Virulent phages of L. lactis strains are the most frequently encountered phages in dairies
during cheese and dairy beverages production. Thus, lactococcal phages have been the focus of
research interest over the past three decades, because they have been reported to cause economic
losses in dairy industry (Kelly et al., 2013). Many research findings confirmed that three lactococcal
phage species: 936 type, P335, and c2 are the most common isolated phages responsible for dairy
fermentation losses (Kleppen et al., 2011; Marco et al., 2012; Mahony et al., 2012a; Ray and Bhunia,
2013; Mahony and van Sinderen, 2014). However, the most globally prevalent lactococcal phages in
dairy industries is the 936-type, and those phages cause the highest threat to this industry (Mahony et
al., 2012a).
As Leuconostoc strains do not have significant role in lactic acid production in milk, phage infections
of this starter cultures may remain undetected during processing but will be detected in the final
products (Marco et al., 2012). Thus, the effect of phage infection in Leuconostoc spp. is directly
related with the poor qualities of dairy products, which are resulted from the reduction in the
concentration of aromatic compounds or in CO2 production (Hemme and Foucaud-Scheunemann,
2003).
2.5 Lactic acid bacteria phages- morphology and classification
Phages have double-stranded or single-stranded DNA or RNA. A phage contains several
proteins (that make the head, tail, tail fiber, and contractile sheath) and DNA, which can be
linear or circular (Ray and Bhunia, 2013). Most phages (96%) isolated so far belong to one
taxonomic order of Caudovirales (Ackermann and Kropinski, 2007; Marco et al., 2012).
Bacteriophages within this order contain tails and a linear dsDNA genome. They are further
classified into three phylogenetically linked families of: Myoviridae, Siphoviridae,
Podoviridae (Ackermann and Kropinski, 2007; Deasy et al., 2011). Myoviridae phages
contain a long and contractile tail, while Siphoviridae and Podoviridae are equipped with a
non-contractile tail, long and short, respectively (Ackermann, 2003; Mahony et al., 2012b;
Ray and Bhunia, 2013). The round (prolate) or hexagonal (isometric) dsDNA molecule is
packed in the head. Based on the nature and size of the phage head structure, phages of
different families can be grouped in to three morphotypes, namely morphotype type 1, which
has small isometric heads, morphotype type 2 with small prolate heads, and type 3
characterized with large prolate heads (Ackermann, 2007; Kleppen et al., 2012; Ray and
Bhunia, 2013).
10
Classification of lactococcal phages has been proposed in to diverse classification schemes
(Deveau et al., 2006; Marco et al., 2012). Phage DNA is enclosed by head proteins, while the
tail section has variable lengths and is used to attach to their host receptors, through which
DNA passes into bacteria (Hassan and Frank, 2001). Moreover, phages classification by the
International Committee on Taxonomy of Viruses (ICTV) is based on different parameters
including morphologies and their genome similarities (Deveau et al., 2006). Conversely, all
phages infecting Str. thermophilus show similar morphology with long, non-contractile tails
and isometric capsid arrangements of the Siphoviridae family (Mills et al., 2011). Such
classification of phage is very important in identification process of those abundant biological
natures, and is mainly based on their morphological, serological, and DNA-DNA homology
characteristics (Mahony and van Sinderen, 2014).
2.6 Determination of host specificity in phage infection
Phage infections are caused by either virulent or temperate phages. Infection with lytic
(virulent) phages results in release of infectious viral particles (virions) into the environment,
whereas temperate phages integrate their DNA into the host chromosome and do not
immediately produce new virions (Hassan and Frank, 2001). Phage infections initiates when
the RBPs located on the phage tail structure are recognized and make an attachment to
receptors sites on the bacterial cell surface (Kleppen et al., 2012; Kelly et al., 2013). This
can`t happen in every bacterium but bacteria with specific receptor sites can only serve as host
for phage particles. The presence of such sites determines the specificity of a particular phage
(Hassan and Frank, 2001), thus phages are host specific, but this can be between one specific
strains for a specific phage to several related strains for a phage (Holmfeldt et al., 2007). On
the other hand, a bacterial strain can also be the host of many different types of phages. On the
contrary, a bacterial strain can have restriction enzymes that can hydrolyze and destroy the
DNA of a phage. Furthermore, though phages can be lytic or temperate, most phages require
Ca2+
for their adsorption on the cell surface of starter cultures bacteria (Ray and Bhunia,
2013).
11
3. MATERIALS AND METHODS
3.1 Origin of samples and bacterial strains
96 bacterial strains isolated from cheese making process at TINE's dairy plant in Storsteinnes
(Northern Norway), which had no fermentation problem was kindly provided by Cyril
Frantzen. These strains were isolated from samples that were collected 1hr after BS of a
commercial starter culture S (hereafter, called Culture S), was added to the fermentation Vat,
and collected samples were diluted and grown on LM17, then 96 strains were isolated and
used in this study. The 96 isolated strains were named plate number 8; and were maintained
both at -80°C or -20°C. Three bulk starter samples and three whey samples were obtained
from another TINE's dairy plant in Nærbø, where a fermentation problem was reported. In
both sites, culture S was used for fermentation process. Thus every practical related to this
study was based on the same starter culture S. The samples were used to detect phage
diversity in that dairy.
3.2 Phage isolation and differentiation
3.2.1 Phage isolation by plaque assay method
Materials:
LM17-Agar LM17 broth Microtiter plate reader
Microbiological Agar Lactose Centrifuge
Balance Spatula Centrifuge
Measuring cylinders Petridishes water bath
250 ml size Bottles Distilled water Eppendorf tubes
5mM CaCl2 solution Culture tubes Microwave oven
Incubator 30ºc Test tube rack well-stamper
96% Ethanol 96 well microtiter plate
3 bulk starters and three whey samples collected from Tine`s cheese production in Nærbø; and this
center has been reported to have fermentation problems. The commercial starter culture in this dairy
was the `S` type which is the same as starter cultures used in Storsteinnes.
96 LAB strains isolated from a cheese making process at Storsteinnes
Procedures:
i. First, bulk starter and whey samples were centrifuged; supernatants were collected and
filtered using sterile 0.45 µm pore size filter.
ii. For phage detection from bulk starter and whey samples, a six fold dilution steps of
both samples was prepared to be used as a source of phages.
12
iii. Using sterile toothpicks bacterial strains from -20°C were transferred to 4 ml of LM17
broth (M17 broth supplemented with 0.5% lactose) and after overnight growth at
30°C, 10 µL of this was transferred to 3ml of another LM17 broth and incubated until
their exponential growth phase (OD-value ≈ 0.2) was reached.
iv. Then 2.5ml of LM17 molten soft agar (LM17 broth containing 0.8% agar)
supplemented with 5 mM CaCl2 was kept in water bath (46°C), this was used to mix
with 500 µL of host cells grown to high cell density (OD value ≈ 0.2).
v. The resulting suspension was then immediately poured on top of LM17 Agar to form a
thin layer which hardens and immobilizes the bacteria.
vi. Using 48 well stamper, approximately 5µL suspensions of six step serial dilutions of
all samples (from step 2): Whey K1 19/7, Whey K25, BS 19/7, BS 18/7, BS 17/7, and
Whey were plated on to LM17 Agar and incubated at 30°C.
vii. After overnight incubation, plates were examined for lysis zones/ plaque formation
against each producer, when bacterial growth was poor results were kept until 72
hours of incubation, before they discarded as negatives. After all 96 LAB strains were
exposed with six whey and bulk starter samples, 40 bacterial strains were found to
form least one plaque from the six samples.
3.2.2 Propagation of phages
When 40 out of the 96 bacterial strains gave plaque formation, the plates with plaques were
used to propagate and purify phages, by taking one isolated plaque per host strain and amplify
on their own respective bacterial hosts. The 56 `non-plaquing strains` meaning strains that
were stamped with bulk starter and whey samples but didn`t give plaques were also scratched
from the stamped surface and used to indicate the presence of phages.
Materials:
Sterile membrane filters 0.45 μm pore-sizes
40 plaque containing plates/strains
56 non-plaqueing strains
Procedures:
i. Isolated plaques (from 3.2.1) were picked and transferred to infect their respective hosts
while they were exponentially growing in tubes with 10mL of LM17 broth
supplemented with 5mM CaCl2 solution.
13
ii. From the 56 strains that were previously stamped with bulk starter and whey samples
but failed to form plaques, their surface spots were used to enrich culture of their
respective strains in 10mL of LM17 broth supplemented with 5mM CaCl2 solution.,
iii. Tubes were incubated overnight at 30ºC, and checked for growth inhibition by
comparison with tube which had only bacterial culture
iv. Phages propagated on their respective host strains were observed by the relative
clearness of the broth, and were sterilized by filtration through 0.45 μm pore-size
filters and stored at 4ºC for further assays.
3.2.3 Phage typing of strains
To determine phage host range and the bacterial susceptibility to specific phages, phage
typing was conducted using phages isolated from plaques and with non-purified phages
obtained from the non plaqueing strains. Similar to the previous (3.2.2) the same materials
were used but the forty purified phages were applied at a time on each indicator strain. In
addition, phage typing of the non-plaqueing strains was carried out using forty non-purified
phages. In both ways, using a well-stamper, phage suspensions were applied on a lawn of host
bacteria on top of LM17 agar, and plates were examined for cell lysis after overnight
incubation, and when the bacterial growth was slow follow up was continued up to 72 hrs.
Within this incubation periods, infection was considered severe if any sign of lysis (plaque
formation) was seen in those tests. Such tests were used to determine host susceptibility and
specificity of phages to their hosts.
3.2.4 Fermentation inhibition test
Acid production can be used to evaluate milk fermentation and is therefore an important
method to test the activity of starter cultures. Parallel experiments were done on an overnight
grown culture “S” using 10% skimmed milk. These cultures were treated with pooled phages.
The addition of phage samples to the overnight culture was to estimate the impact of the
isolated phages on fermentation activity of the starter cultures. Then various inhibition levels
of lactose fermentation by the starter culture was reflected by the reduction of acid production
measured over 4 hr incubation period at a temperature of 30ºC.
Materials:
10% Skimmed milk, Mixed starter culture Erlenmeyer flask.
Test tubes pH meter Sterile distilled water
Phages Sterile filter 0.45 μm pore-sizes
14
Procedures:
i. Preparation of 10% skimmed milk medium using powdered skim milk.
ii. In order to avoid other microbial contaminants in this skimmed milk, it was
pasteurized at 95oC for 30 minutes.
iii. This fermentation inhibition test was carried out in duplicates. The test scheme shown
(Table 1), duplicate experiments where each tested culture had 2 control tubes and 5
treatment test tubes.
iv. First each tube was filled with 10ml of the pasteurized 10% skimmed milk.
v. Then Culture S was inoculated in to test tubes 2 to 7 with a concentration of 0.1% and
strains were grown overnight at 22oC.
vi. Another corresponding tubes containing 5ml of the 10% skimmed milk were prepared
vii. Control tubes received 3% of overnight bulk starter culture, while the other respective
test samples (3-7) received 3% of same culture and 25µl of phage-lysates of each
mixture (Mix 1 to 5).
viii. All samples were incubated at 30oC for 4 hours and were determined by measurement
of pH value of all test samples using a pH meter.
ix. Analysis of fermentation activity was performed in all treatment groups and was
expressed as: pH of blank sample - pH of sample.
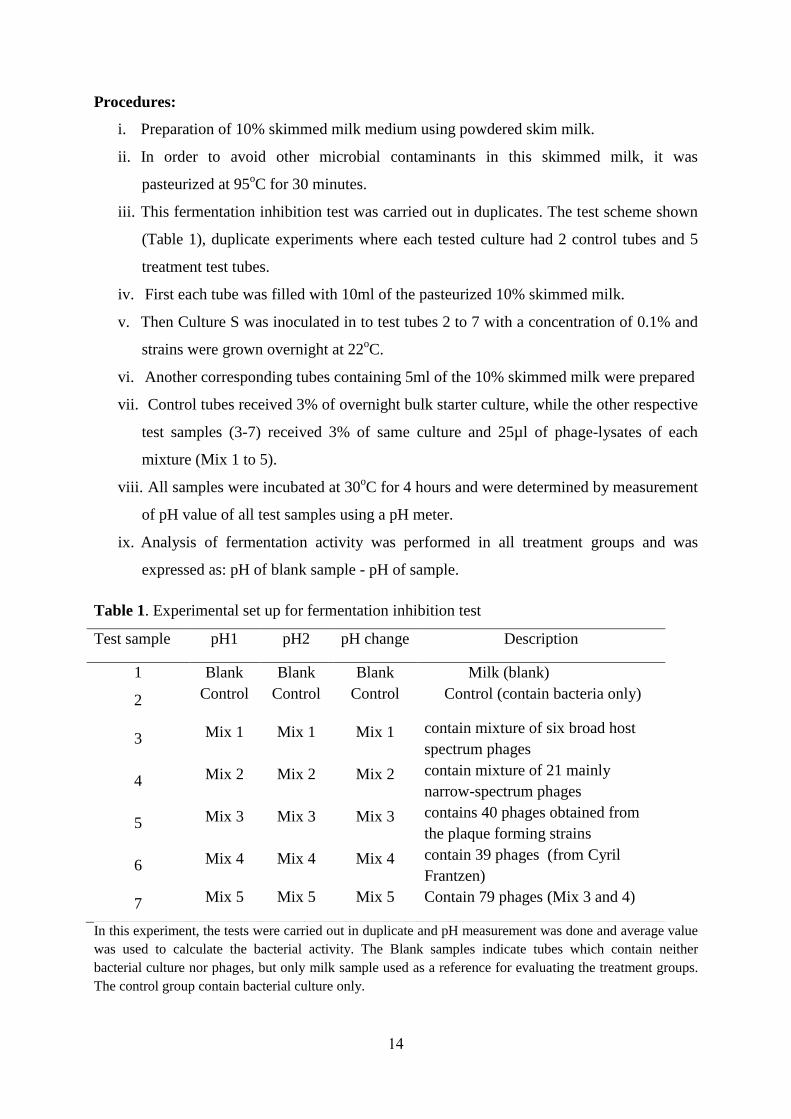
Table 1. Experimental set up for fermentation inhibition test
Test sample pH1 pH2 pH change Description
1 Blank Blank Blank Milk (blank)
2 Control Control Control Control (contain bacteria only)
3 Mix 1 Mix 1 Mix 1 contain mixture of six broad host
spectrum phages
4 Mix 2 Mix 2 Mix 2 contain mixture of 21 mainly
narrow-spectrum phages
5 Mix 3 Mix 3 Mix 3 contains 40 phages obtained from
the plaque forming strains
6 Mix 4 Mix 4 Mix 4 contain 39 phages (from Cyril
Frantzen)
7 Mix 5 Mix 5 Mix 5 Contain 79 phages (Mix 3 and 4)
In this experiment, the tests were carried out in duplicate and pH measurement was done and average value
was used to calculate the bacterial activity. The Blank samples indicate tubes which contain neither
bacterial culture nor phages, but only milk sample used as a reference for evaluating the treatment groups.
The control group contain bacterial culture only.
15
3.3 Differentiation of bacterial isolates
3.3.1 Growth inhibition test
To determine the phage sensitivity, all the 96 bacterial isolates that were kept at -80°C were
grown in LM17 broth. Cultures were reactivated by sub culturing in another fresh media; half
of the plate was left as negative control and the second half received approximately 5µL of
bulk starter as a source of phage. Growth was determined after 16 hr by microtiter plate
reader.
Materials:
96 microtiter plate Phage lysate
Microtiter plate reader 96 strains
5 mM CaCl2 solution
Procedures:
i. Using a 48 well stamper, 48 strains were transferred to new microtiter plate containing
180 µL LM17 broth and incubated at 30°C for two days.
ii. After appreciable growth was obtained, sub-culturing to another plate with the same
procedure was done; within 2-3 hours of incubation at 30°C, OD-value ≈ 0.2 was
reached.
iii. At this time one group of the 48 duplicated strains were exposed to bulk starter 19/7
(BS19/7) at 5% concentration of the BS19/7 and 5mM CaCl2 solution, and the other
half plate used as a control (Appendix 3).
iv. Then growth kinetics study was conducted using microplate reader through 16 hours
of incubation time.
v. With the same procedure the other 48 strains were also tested separately.
3.3.2 DNA preparation for genotypic differentiation of strains
Materials:
LM17 broth 30ºC Incubator
96 bacterial strains sterilize distilled water
Test tubes lysis buffer (0.25 % sodium dodecyl sulfate + 50 mmol/L and NaOH)
PCR tubes PCR Machine to incubate cell for DNA extraction
Eppendorf tubes Centrifuge for collection of bacterial cells
16
Procedures:
i. All strains were grown overnight at 30ºC in 5ml of LM17 broth and centrifuged twice
by washing at intervals, and then re-suspended in 100µL of sterilized distilled water
and kept at -20ºC.
ii. Bacterial DNA was isolated by alkaline extraction method with some modification to
the procedure described by Svec and Sedlacek,(2008). Briefly, 25µL of the 100µL
stored cells were centrifuged and 20µL of the supernatant part was removed.
iii. The remaining 5µL was resuspended with 20µL of lysis buffer (0.25 % sodium
dodecyl sulfate + 50 mmol/L and NaOH) and heated at 95ºC for 15 minutes.
iv. After extraction, the resulting cell lysate was diluted by adding 180µL of sterilized
distilled water and maintained at -20ºC to be used by PCR reactions.
3.3.3 Separation of bacterial strains by (GTG)5-PCR fingerprinting
The (GTG)5-PCR fingerprinting method was used to detect and differentiate bacterial isolates.
After genomic DNA of all strains was extracted, PCR amplification with broad specificity of
(GTG)5-primer (5´-GTGGTGGTG GTGGTG-3´) was performed. The PCR amplification was
carried out with slight modifications of Svec and Sedlacek (2008) protocol as described
below:
Materials:
1.5% Agarose gel 0.5x TAE buffer 1kb ladder
Gelred (2000 times diluted stock solution) 6x loading buffer Volt-meter
PCR machine (Thermal Cycler) Distilled water -20ºC Freezer
Gel-electrophoresis equipments NanoDrop ND-1000 +4ºC refrigerator
(rack, molding form, comb) 30ºC incubator
Used primer:-5`-GTGGTGGTGGTGGTG-3` Gel photo system with UV spectrum
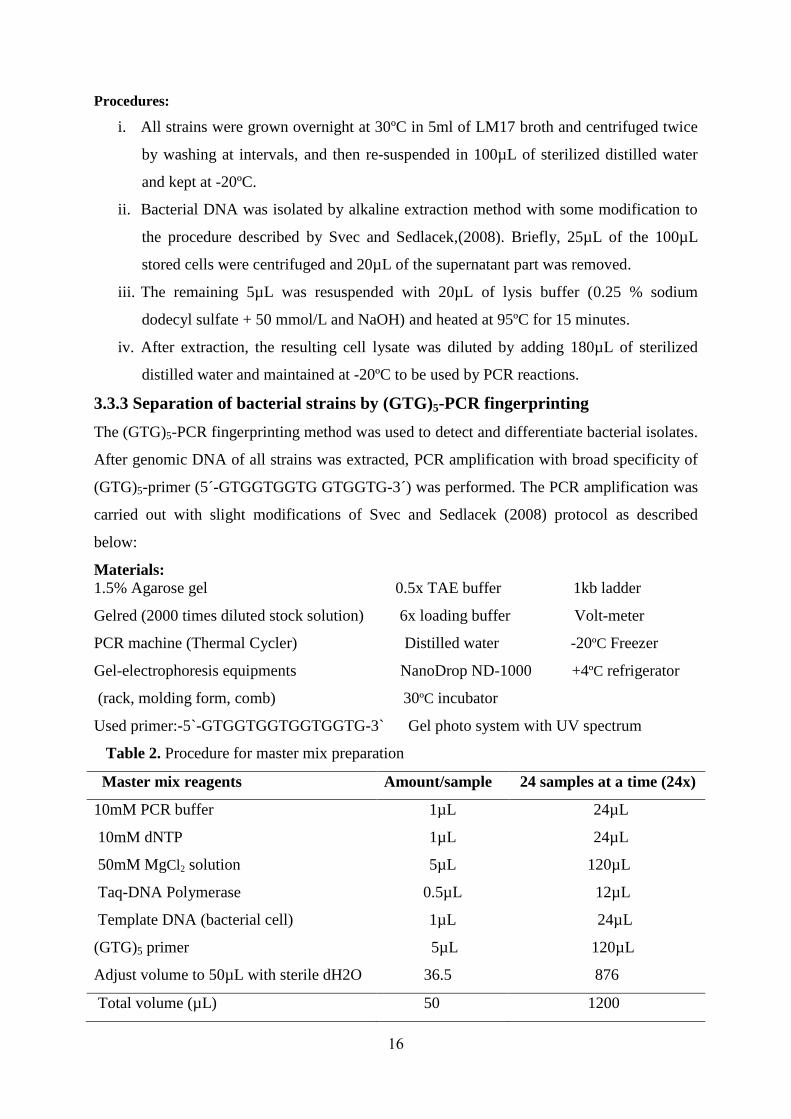
Table 2. Procedure for master mix preparation
Master mix reagents Amount/sample 24 samples at a time (24x)
10mM PCR buffer 1µL 24µL
10mM dNTP 1µL 24µL
50mM MgCl2 solution 5µL 120µL
Taq-DNA Polymerase 0.5µL 12µL
Template DNA (bacterial cell) 1µL 24µL
(GTG)5 primer 5µL 120µL
Adjust volume to 50µL with sterile dH2O 36.5 876
Total volume (µL) 50 1200
17
Procedures:
i. Based on table 2, the volume of the PCR mixture was adjusted to 50 μl with sterile
distilled water
ii. PCR amplification was performed in MyCyclerTM
, thermal cycler at the following
conditions; first denaturation step of 7 min at 95oC, followed by 30 cycles of 95
oC for 30
seconds, 45°C for 1 min, 65oC for 1min and a final elongation step has been programmed
at 72°C for 7 minutes.
iii. PCR products were separated by electrophoresis on 1.5 % agarose gels for 4 h at 100V in
0.5× TBA buffer. Using 1Kb DNA ladder (BILABS 1kb Ladder # 32325), PCR
fingerprints were digitized and analyzed with the band pattern analysis software package,
GelCompar II (Applied Maths, Kortrijk, Belgium).
3.3.4 CWPS genes typing of strains by multiplex PCR
Differentiation of bacterial strains based on detection of genes that encode different CWPS
types was performed by multiplex PCR. This PCR method using different four specific primer
pairs was carried out to differentiate and compare with other bacterial strain differential
methods. For instance, results of this PCR method was used to classify strains, which was
important in assessment of host range analysis (Table 9).
Materials:
All materials listed under 3.3.3 except the following changes in primers and ladders used, in
this CWPS typing: 100 bp DNA Ladder and four types of L. lactis specific primers were used
(Table 3).
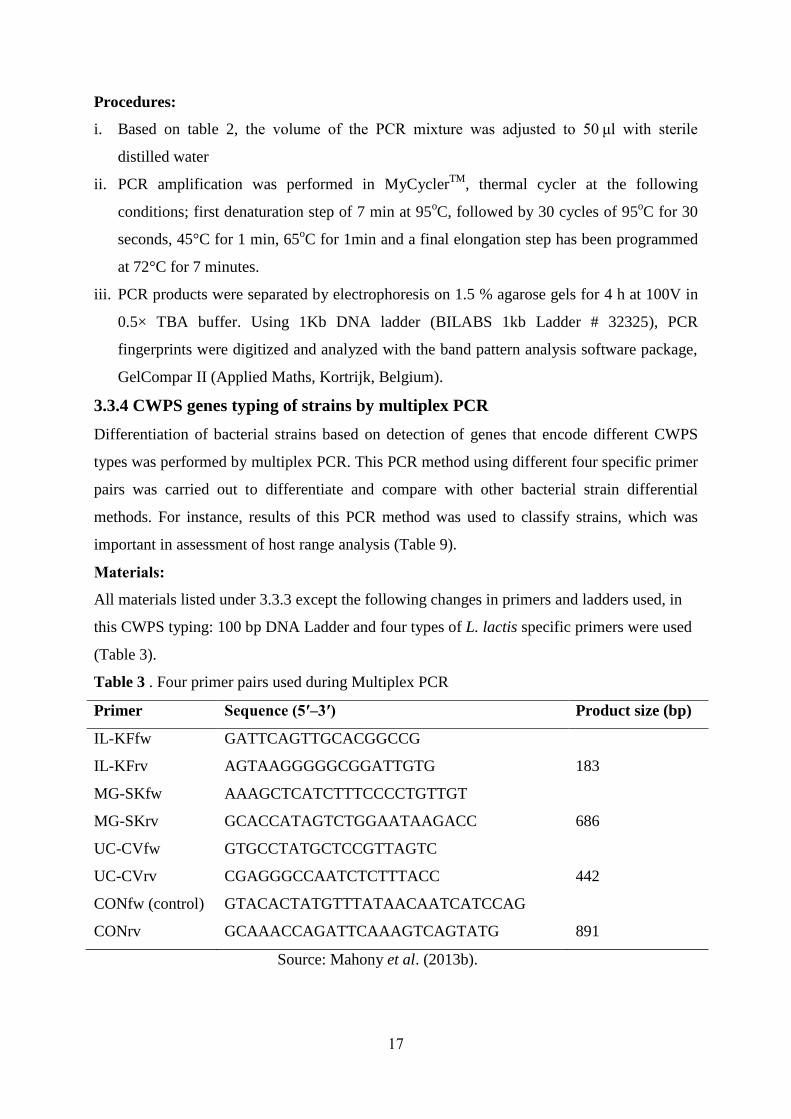
Table 3 . Four primer pairs used during Multiplex PCR
Primer Sequence (5′–3′) Product size (bp)
IL-KFfw GATTCAGTTGCACGGCCG
IL-KFrv AGTAAGGGGGCGGATTGTG 183
MG-SKfw AAAGCTCATCTTTCCCCTGTTGT
MG-SKrv GCACCATAGTCTGGAATAAGACC 686
UC-CVfw GTGCCTATGCTCCGTTAGTC
UC-CVrv CGAGGGCCAATCTCTTTACC 442
CONfw (control) GTACACTATGTTTATAACAATCATCCAG
CONrv GCAAACCAGATTCAAAGTCAGTATG 891
Source: Mahony et al. (2013b).
18
Procedures:
In this method 91 strains were differentiated by using four primer pairs as described by
Mahony et al. (2013b). Briefly three primer pairs including IL/KF, MG/SK and UC/CV were
applied in a single PCR reaction. A control was also included, where primers based on the
conserved rmlB gene were used to generate a product of 891 bp, so that to confirm the PCR
was working in all samples. For PCR amplification, the DNA template and master mix
preparation and reaction volume was the same as mentioned for (GTG)5-PCR, except 3 primer
pairs ad control primers were used in this PCR amplification.
The three primer pairs were composed of 1μL of each the following components IL/KF-F,
IL/KF-R, MG/SK-F, MG/SK-R, UC/CV-F, UC/CV-R, and control both forward and reverse
primers. The PCR amplifications of the three primer pairs were performed in a Thermal
Cycler, with an initial denaturation at 95°C for 1 min, 30 cycles of denaturation at 95°C foe
20 sec, annealing at 55°C for 20 sec, elongation at 72°C for 1 min, and final extension at
72°C for 5 min. The PCR products were visualized using a 100 bp DNA ladder and 1.5 %
Agarose gel at 90 Volt for about 30-40 minutes.
19
4. STATISTICAL ANALYSIS
The statistical analysis of our results was performed with the application of different software
programs and online statistical software and basic statistics.
i. The phenotypic data of both bacterial strains and phages were analyzed by
constructing a dendrogram by complete linkage Euclidean distance analysis using
Minitab software.
ii. The genomic data (GTG)5-PCR fingerprints were analysed by a computer Gel compare
II, using Pearson’s correlation coefficients with unweighted pair group method with
arithmetic averages clustering algorithm (UPGMA) analysis method.
iii. Online statistical software was used to analyse chai square test, to asses relationship
between CWPS genes type of strains and their phage susceptibility to phage groups
(http://www.physics.csbsju.edu/stats/contingency_NROW_NCOLUMN_form.html).
iv. Some basic statistics like percentage analysis was also used when necessary.
20
5. RESULTS
5.1 Detection of phages in bulk starters and whey samples
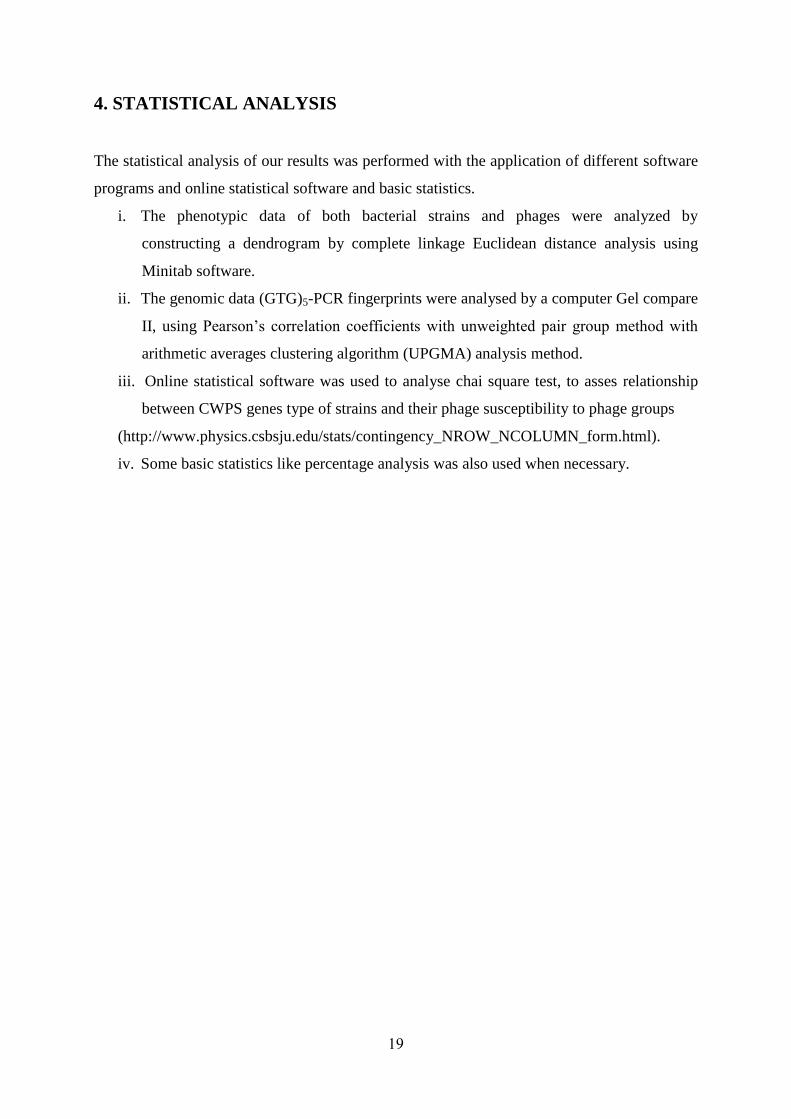
To detect the presence of infectious phages and determine susceptibility of bacterial isolates,
plaque assay in 10 fold dilution series was performed using three bulk starters and three whey
samples. As indicated below (Fig. 1), the first two whey samples (left side), followed by three
bulk starters collected, on July 17, 18 and 19/2013 (BS17/7, BS18/7 and BS19/7), and the
sixth one is another whey sample. Whey samples are indicated as wheyx, wheyy and wheyz,
this is only to show that they were different samples. Infection was considered positive when
plaque was seen in these tests. The same tests applied to all the 96 strains, and plaque
producing phages were obtained from 40 indicator strains. The highest phage concentration
was mostly observed in BS samples (Fig. 1. C11/#835, D12/#848).
Fig. 1. Schemes in plaque assay using bulk starter and whey samples. Before inoculation, bulk starter and
whey samples were diluted at 10 fold dilution series, the highest phage concentration was shown at zero or
lower dilutions.
Following the isolation of the forty plaque producing phages, they were propagated on their
respective hosts, supernatant of each strain was collected, filtered and maintained at 4ºC
(Table 4).
21
Table 4. List of 40 phages isolated from their respective bacterial strains
Φ811 Φ835 Φ839 Φ884
Φ813 Φ827 Φ840 Φ874
Φ822 Φ828 Φ861 Φ875
Φ815 Φ830 Φ870 Φ876
Φ816 Φ831 Φ862 Φ877
Φ817 Φ832 Φ863 Φ878
Φ818 Φ837 Φ864 Φ879
Φ819 Φ847 Φ867 Φ880
Φ820 Φ848 Φ868 Φ888
Φ834 Φ838 Φ873 Φ889
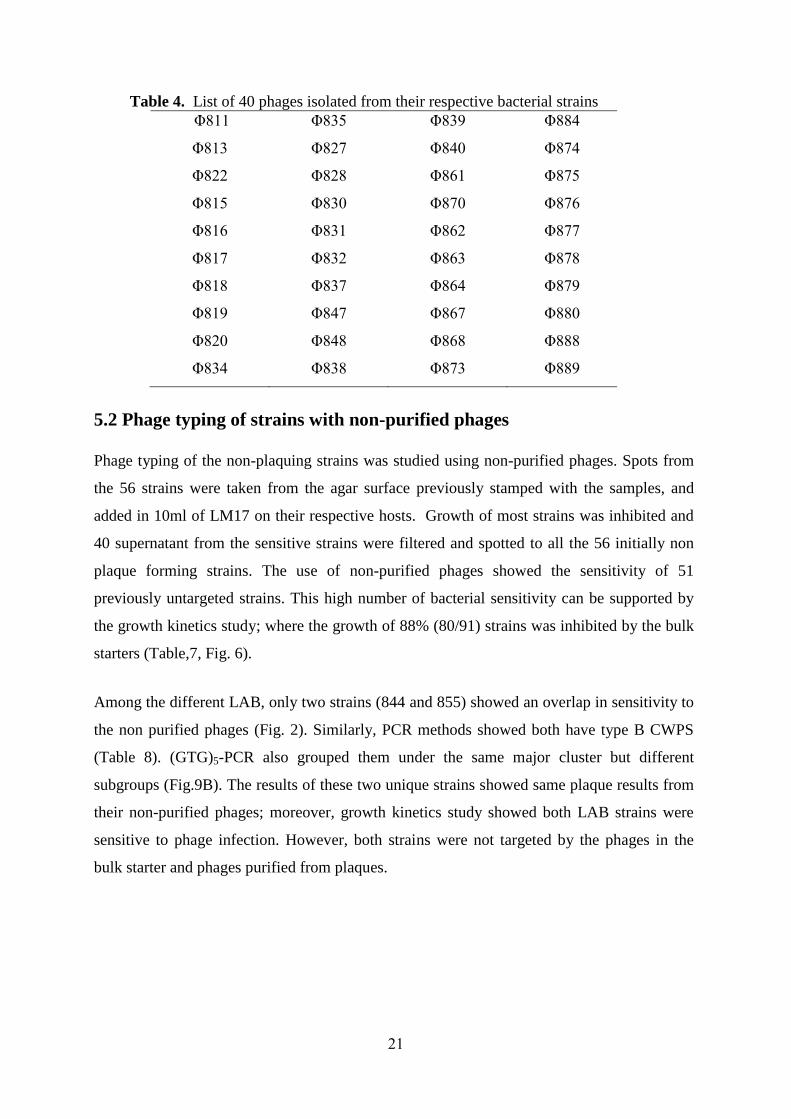
5.2 Phage typing of strains with non-purified phages
Phage typing of the non-plaquing strains was studied using non-purified phages. Spots from
the 56 strains were taken from the agar surface previously stamped with the samples, and
added in 10ml of LM17 on their respective hosts. Growth of most strains was inhibited and
40 supernatant from the sensitive strains were filtered and spotted to all the 56 initially non
plaque forming strains. The use of non-purified phages showed the sensitivity of 51
previously untargeted strains. This high number of bacterial sensitivity can be supported by
the growth kinetics study; where the growth of 88% (80/91) strains was inhibited by the bulk
starters (Table,7, Fig. 6).
Among the different LAB, only two strains (844 and 855) showed an overlap in sensitivity to
the non purified phages (Fig. 2). Similarly, PCR methods showed both have type B CWPS
(Table 8). (GTG)5-PCR also grouped them under the same major cluster but different
subgroups (Fig.9B). The results of these two unique strains showed same plaque results from
their non-purified phages; moreover, growth kinetics study showed both LAB strains were
sensitive to phage infection. However, both strains were not targeted by the phages in the
bulk starter and phages purified from plaques.
22
Fig. 2. Host ranges of 40 non-purified phages. Grey regions represent lysis zones and white regions
indicate no lysis.
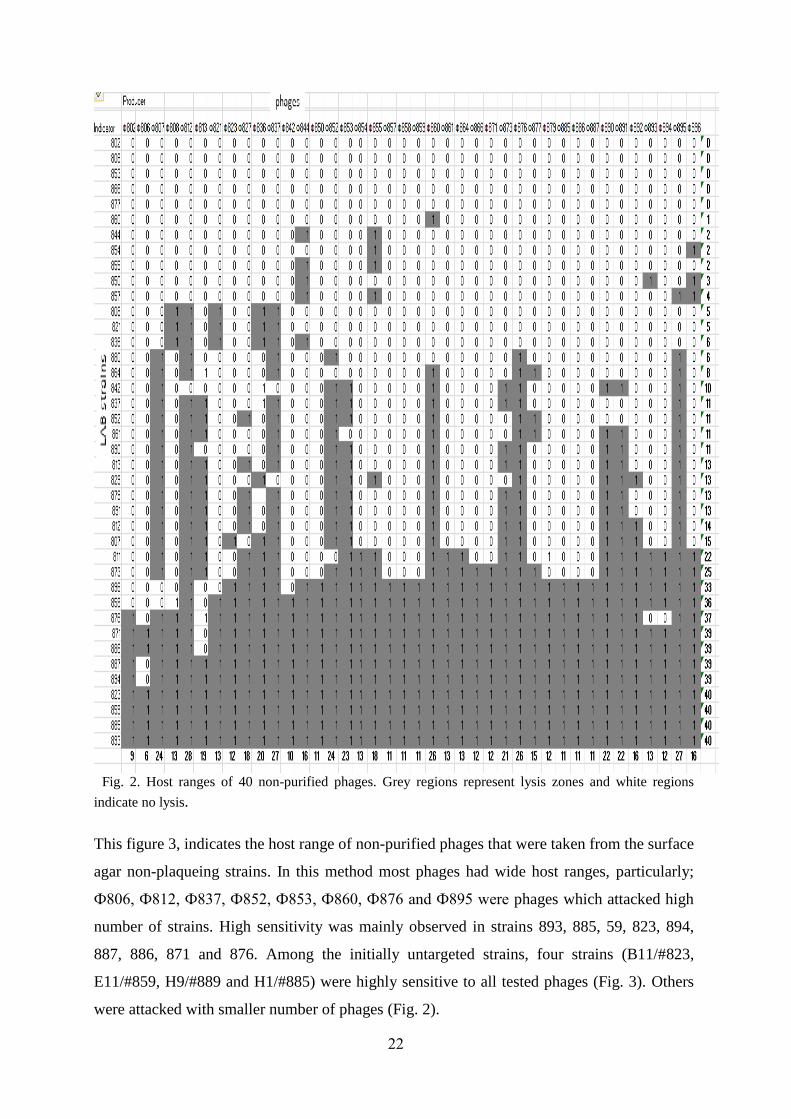
This figure 3, indicates the host range of non-purified phages that were taken from the surface
agar non-plaqueing strains. In this method most phages had wide host ranges, particularly;
Ф806, Ф812, Ф837, Ф852, Ф853, Ф860, Ф876 and Ф895 were phages which attacked high
number of strains. High sensitivity was mainly observed in strains 893, 885, 59, 823, 894,
887, 886, 871 and 876. Among the initially untargeted strains, four strains (B11/#823,
E11/#859, H9/#889 and H1/#885) were highly sensitive to all tested phages (Fig. 3). Others
were attacked with smaller number of phages (Fig. 2).
23
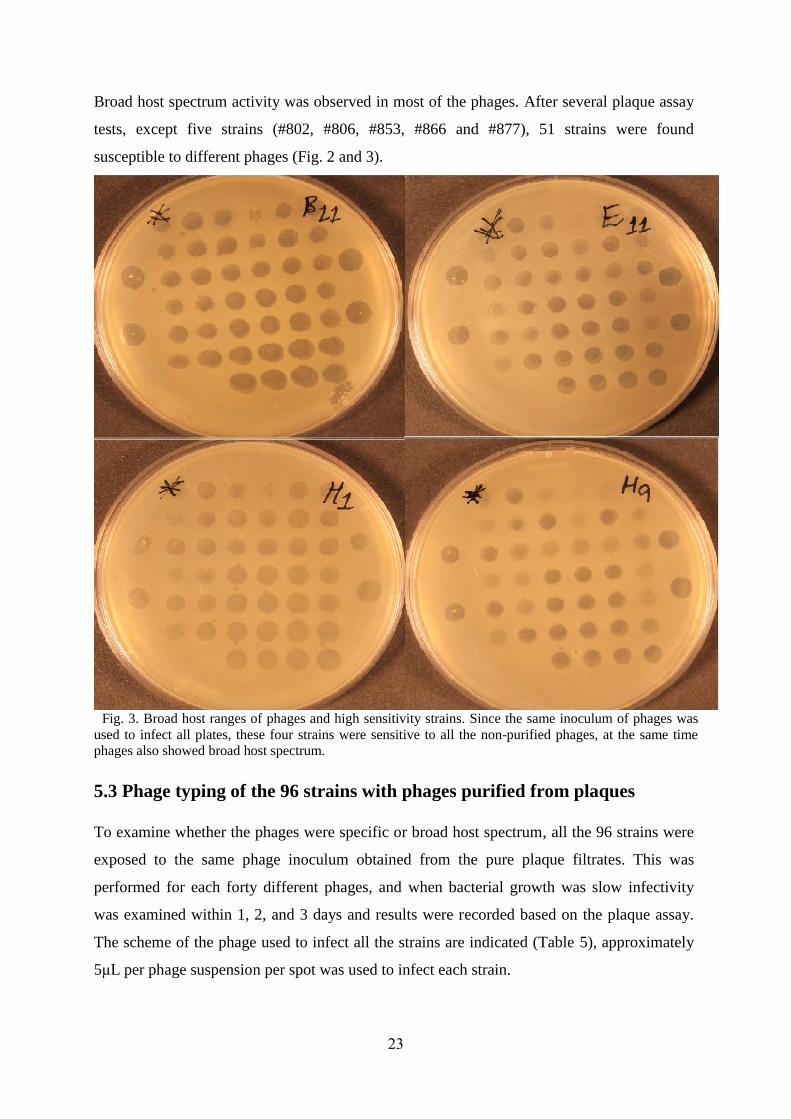
Broad host spectrum activity was observed in most of the phages. After several plaque assay
tests, except five strains (#802, #806, #853, #866 and #877), 51 strains were found
susceptible to different phages (Fig. 2 and 3).
Fig. 3. Broad host ranges of phages and high sensitivity strains. Since the same inoculum of phages was
used to infect all plates, these four strains were sensitive to all the non-purified phages, at the same time
phages also showed broad host spectrum.
5.3 Phage typing of the 96 strains with phages purified from plaques
To examine whether the phages were specific or broad host spectrum, all the 96 strains were
exposed to the same phage inoculum obtained from the pure plaque filtrates. This was
performed for each forty different phages, and when bacterial growth was slow infectivity
was examined within 1, 2, and 3 days and results were recorded based on the plaque assay.
The scheme of the phage used to infect all the strains are indicated (Table 5), approximately
5μL per phage suspension per spot was used to infect each strain.
24
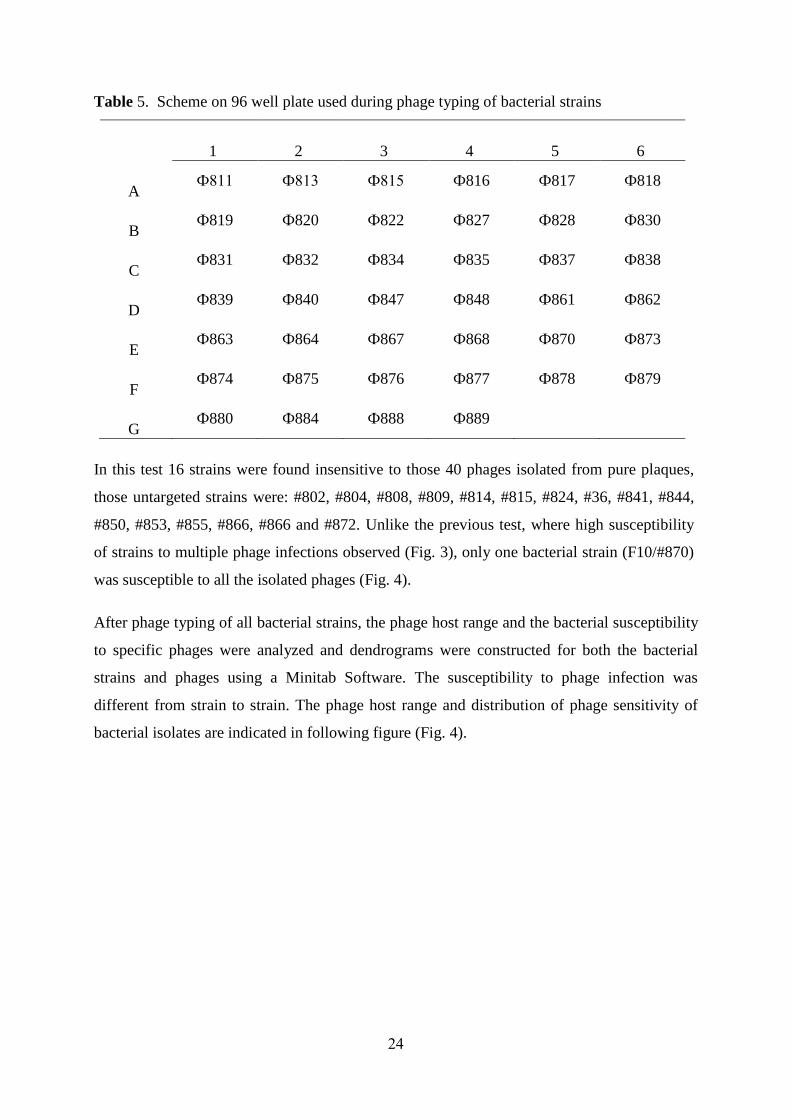
Table 5. Scheme on 96 well plate used during phage typing of bacterial strains
1 2 3 4 5 6
A Ф811 Ф813 Ф815 Ф816 Ф817 Ф818
B Ф819 Ф820 Ф822 Ф827 Ф828 Ф830
C Ф831 Ф832 Ф834 Ф835 Ф837 Ф838
D Ф839 Ф840 Ф847 Ф848 Ф861 Ф862
E Ф863 Ф864 Ф867 Ф868 Ф870 Ф873
F Ф874 Ф875 Ф876 Ф877 Ф878 Ф879
G Ф880 Ф884 Ф888 Ф889
In this test 16 strains were found insensitive to those 40 phages isolated from pure plaques,
those untargeted strains were: #802, #804, #808, #809, #814, #815, #824, #36, #841, #844,
#850, #853, #855, #866, #866 and #872. Unlike the previous test, where high susceptibility
of strains to multiple phage infections observed (Fig. 3), only one bacterial strain (F10/#870)
was susceptible to all the isolated phages (Fig. 4).
After phage typing of all bacterial strains, the phage host range and the bacterial susceptibility
to specific phages were analyzed and dendrograms were constructed for both the bacterial
strains and phages using a Minitab Software. The susceptibility to phage infection was
different from strain to strain. The phage host range and distribution of phage sensitivity of
bacterial isolates are indicated in following figure (Fig. 4).
25
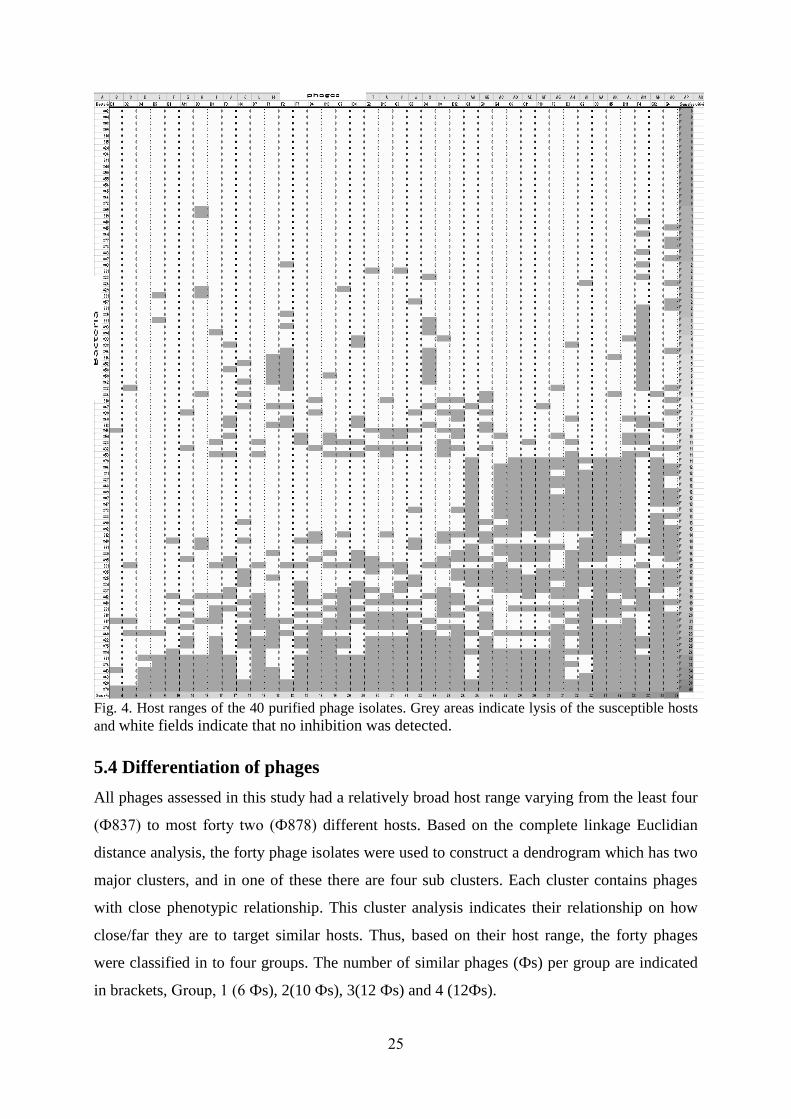
Fig. 4. Host ranges of the 40 purified phage isolates. Grey areas indicate lysis of the susceptible hosts
and white fields indicate that no inhibition was detected.
5.4 Differentiation of phages
All phages assessed in this study had a relatively broad host range varying from the least four
(Ф837) to most forty two (Ф878) different hosts. Based on the complete linkage Euclidian
distance analysis, the forty phage isolates were used to construct a dendrogram which has two
major clusters, and in one of these there are four sub clusters. Each cluster contains phages
with close phenotypic relationship. This cluster analysis indicates their relationship on how
close/far they are to target similar hosts. Thus, based on their host range, the forty phages
were classified in to four groups. The number of similar phages (Фs) per group are indicated
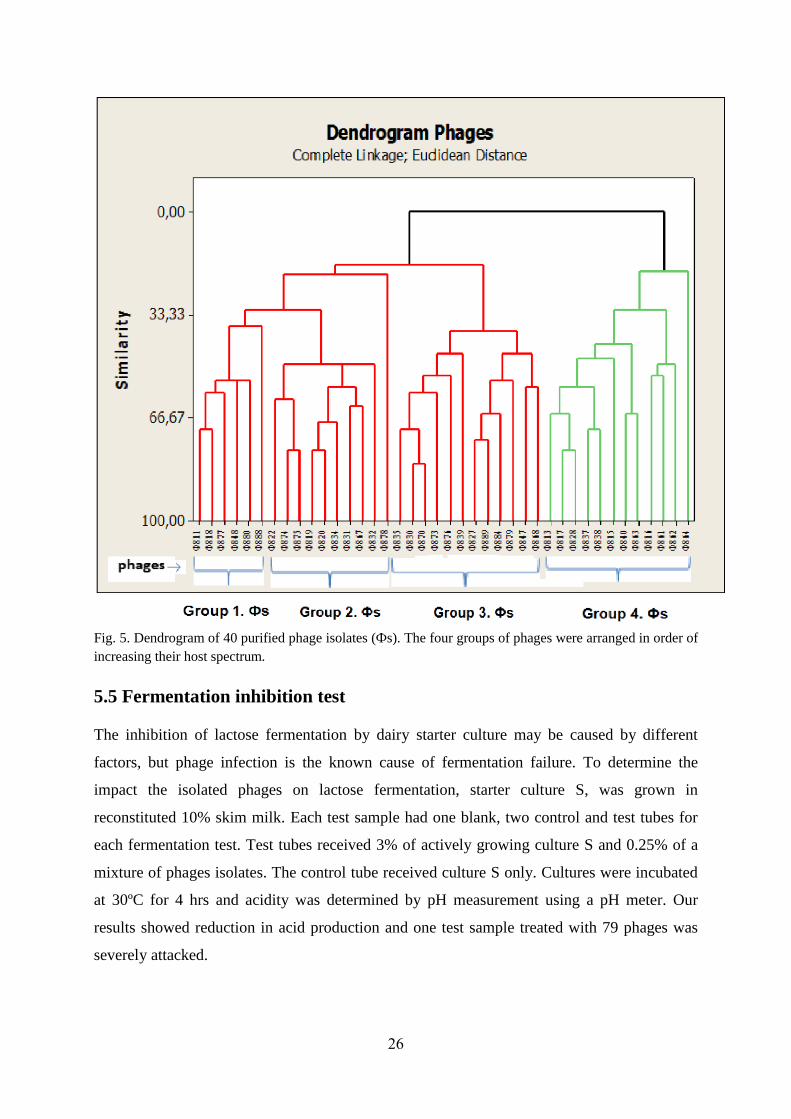
in brackets, Group, 1 (6 Фs), 2(10 Фs), 3(12 Фs) and 4 (12Фs).
26
Fig. 5. Dendrogram of 40 purified phage isolates (Фs). The four groups of phages were arranged in order of
increasing their host spectrum.
5.5 Fermentation inhibition test
The inhibition of lactose fermentation by dairy starter culture may be caused by different
factors, but phage infection is the known cause of fermentation failure. To determine the
impact the isolated phages on lactose fermentation, starter culture S, was grown in
reconstituted 10% skim milk. Each test sample had one blank, two control and test tubes for
each fermentation test. Test tubes received 3% of actively growing culture S and 0.25% of a
mixture of phages isolates. The control tube received culture S only. Cultures were incubated
at 30ºC for 4 hrs and acidity was determined by pH measurement using a pH meter. Our
results showed reduction in acid production and one test sample treated with 79 phages was
severely attacked.
27
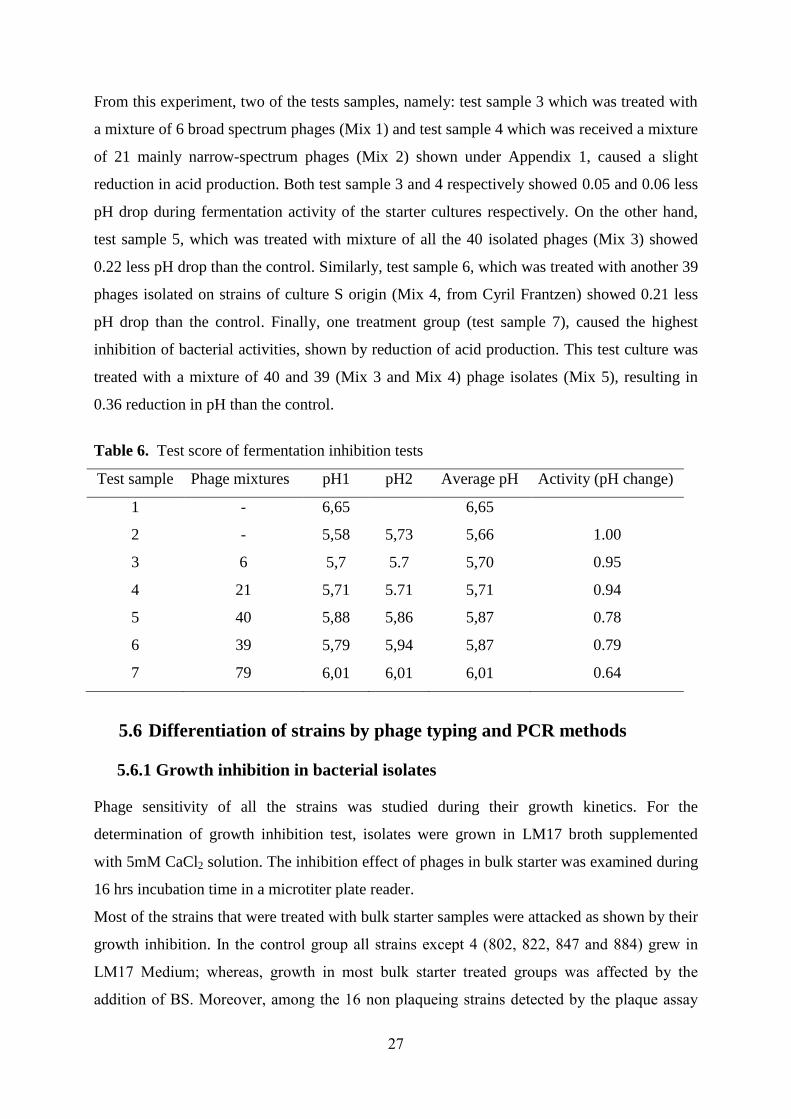
From this experiment, two of the tests samples, namely: test sample 3 which was treated with
a mixture of 6 broad spectrum phages (Mix 1) and test sample 4 which was received a mixture
of 21 mainly narrow-spectrum phages (Mix 2) shown under Appendix 1, caused a slight
reduction in acid production. Both test sample 3 and 4 respectively showed 0.05 and 0.06 less
pH drop during fermentation activity of the starter cultures respectively. On the other hand,
test sample 5, which was treated with mixture of all the 40 isolated phages (Mix 3) showed
0.22 less pH drop than the control. Similarly, test sample 6, which was treated with another 39
phages isolated on strains of culture S origin (Mix 4, from Cyril Frantzen) showed 0.21 less
pH drop than the control. Finally, one treatment group (test sample 7), caused the highest
inhibition of bacterial activities, shown by reduction of acid production. This test culture was
treated with a mixture of 40 and 39 (Mix 3 and Mix 4) phage isolates (Mix 5), resulting in
0.36 reduction in pH than the control.
Table 6. Test score of fermentation inhibition tests
Test sample Phage mixtures pH1 pH2 Average pH Activity (pH change)
1 - 6,65 6,65
2 - 5,58 5,73 5,66 1.00
3 6 5,7 5.7 5,70 0.95
4 21 5,71 5.71 5,71 0.94
5 40 5,88 5,86 5,87 0.78
6 39 5,79 5,94 5,87 0.79
7 79 6,01 6,01 6,01 0.64
5.6 Differentiation of strains by phage typing and PCR methods
5.6.1 Growth inhibition in bacterial isolates
Phage sensitivity of all the strains was studied during their growth kinetics. For the
determination of growth inhibition test, isolates were grown in LM17 broth supplemented
with 5mM CaCl2 solution. The inhibition effect of phages in bulk starter was examined during
16 hrs incubation time in a microtiter plate reader.
Most of the strains that were treated with bulk starter samples were attacked as shown by their
growth inhibition. In the control group all strains except 4 (802, 822, 847 and 884) grew in
LM17 Medium; whereas, growth in most bulk starter treated groups was affected by the
addition of BS. Moreover, among the 16 non plaqueing strains detected by the plaque assay
28
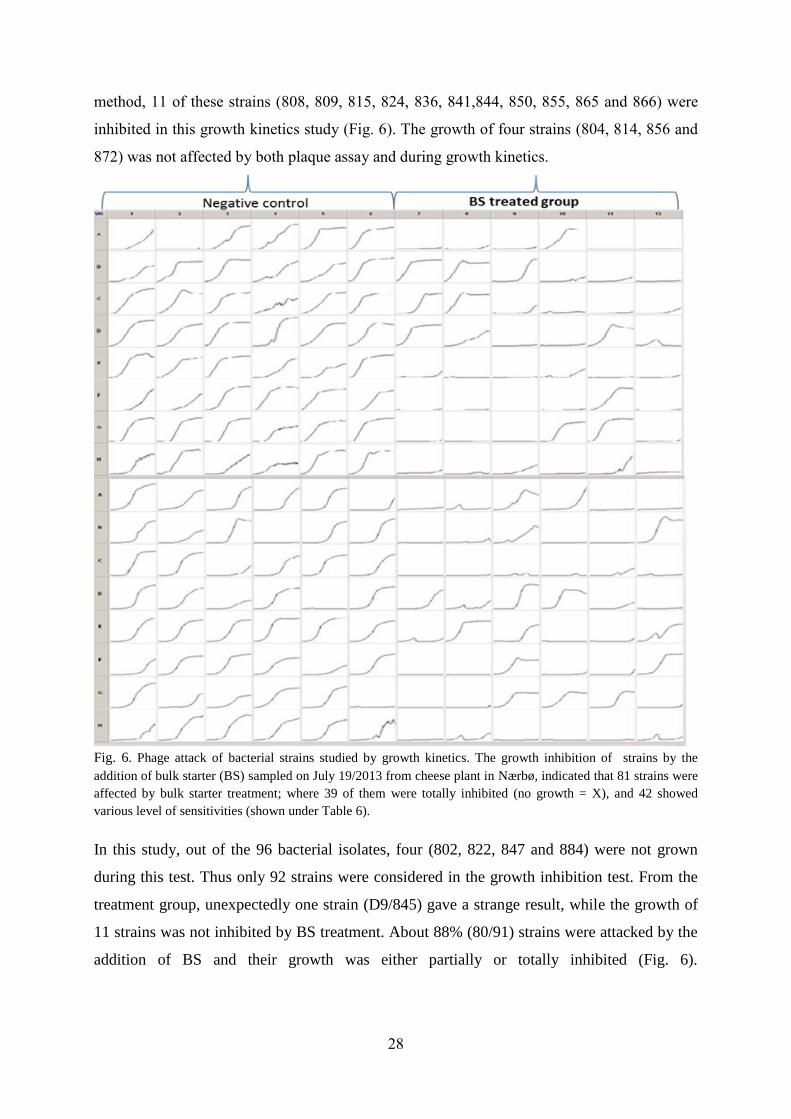
method, 11 of these strains (808, 809, 815, 824, 836, 841,844, 850, 855, 865 and 866) were
inhibited in this growth kinetics study (Fig. 6). The growth of four strains (804, 814, 856 and
872) was not affected by both plaque assay and during growth kinetics.
Fig. 6. Phage attack of bacterial strains studied by growth kinetics. The growth inhibition of strains by the
addition of bulk starter (BS) sampled on July 19/2013 from cheese plant in Nærbø, indicated that 81 strains were
affected by bulk starter treatment; where 39 of them were totally inhibited (no growth = X), and 42 showed
various level of sensitivities (shown under Table 6).
In this study, out of the 96 bacterial isolates, four (802, 822, 847 and 884) were not grown
during this test. Thus only 92 strains were considered in the growth inhibition test. From the
treatment group, unexpectedly one strain (D9/845) gave a strange result, while the growth of
11 strains was not inhibited by BS treatment. About 88% (80/91) strains were attacked by the
addition of BS and their growth was either partially or totally inhibited (Fig. 6).
29
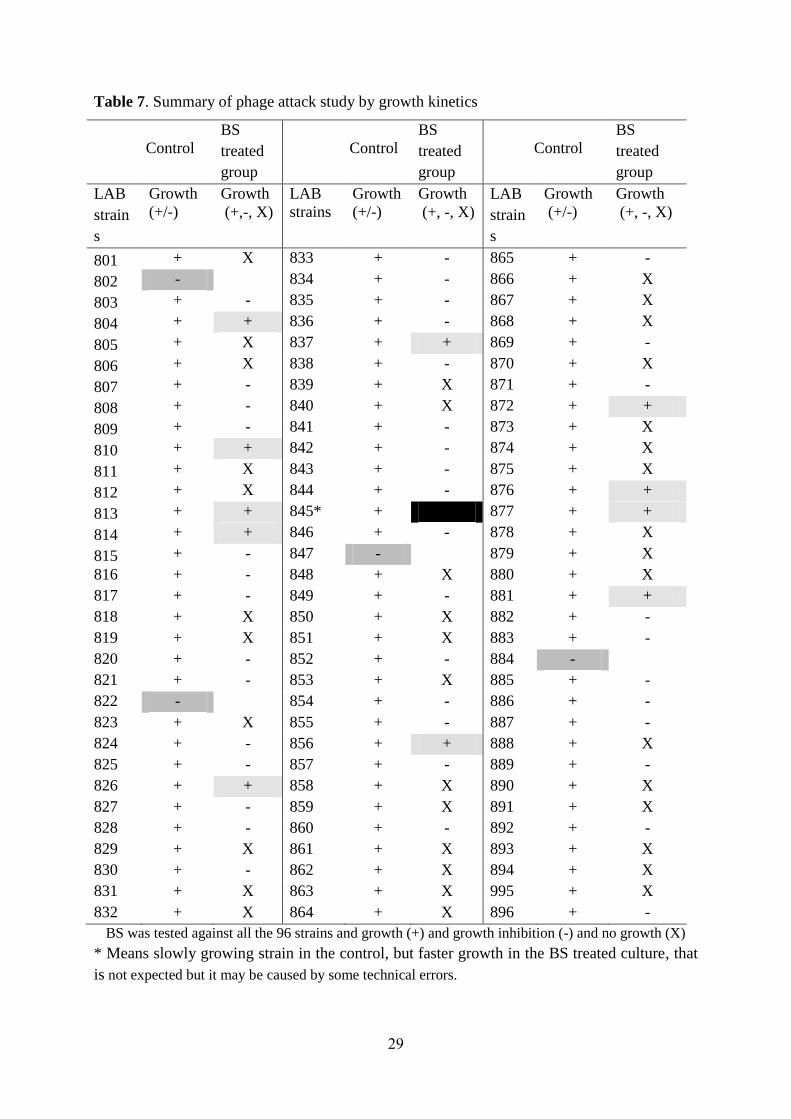
Table 7. Summary of phage attack study by growth kinetics
Control
BS
treated
group
Control
BS
treated
group
Control
BS
treated
group
LAB
strain
s
Growth
(+/-)
Growth
(+,-, X)
LAB
strains
Growth
(+/-)
Growth
(+, -, X)
LAB
strain
s
Growth
(+/-)
Growth
(+, -, X)
801 + X 833 + - 865 + -
802 - 834 + - 866 + X
803 + - 835 + - 867 + X
804 + + 836 + - 868 + X
805 + X 837 + + 869 + -
806 + X 838 + - 870 + X
807 + - 839 + X 871 + -
808 + - 840 + X 872 + +
809 + - 841 + - 873 + X
810 + + 842 + - 874 + X
811 + X 843 + - 875 + X
812 + X 844 + - 876 + +
813 + + 845* + 877 + +
814 + + 846 + - 878 + X
815 + - 847 - 879 + X
816 + - 848 + X 880 + X
817 + - 849 + - 881 + +
818 + X 850 + X 882 + -
819 + X 851 + X 883 + -
820 + - 852 + - 884 -
821 + - 853 + X 885 + -
822 - 854 + - 886 + -
823 + X 855 + - 887 + -
824 + - 856 + + 888 + X
825 + - 857 + - 889 + -
826 + + 858 + X 890 + X
827 + - 859 + X 891 + X
828 + - 860 + - 892 + -
829 + X 861 + X 893 + X
830 + - 862 + X 894 + X
831 + X 863 + X 995 + X
832 + X 864 + X 896 + -
BS was tested against all the 96 strains and growth (+) and growth inhibition (-) and no growth (X)
* Means slowly growing strain in the control, but faster growth in the BS treated culture, that
is not expected but it may be caused by some technical errors.
30
5.6.2 Phage typing of strains
A collection of 96 LAB strains isolated from cheese production process (1 hour after starter S
was added to the milk) were analyzed with both phage typing and PCR methods to assess
their susceptibility to phage infection and relatedness. Based on the results of these tests,
differentiation of bacterial strains was done. During a plaque assay method, results showed
that most strains were highly susceptible while others were resistance to phage infection. Thus
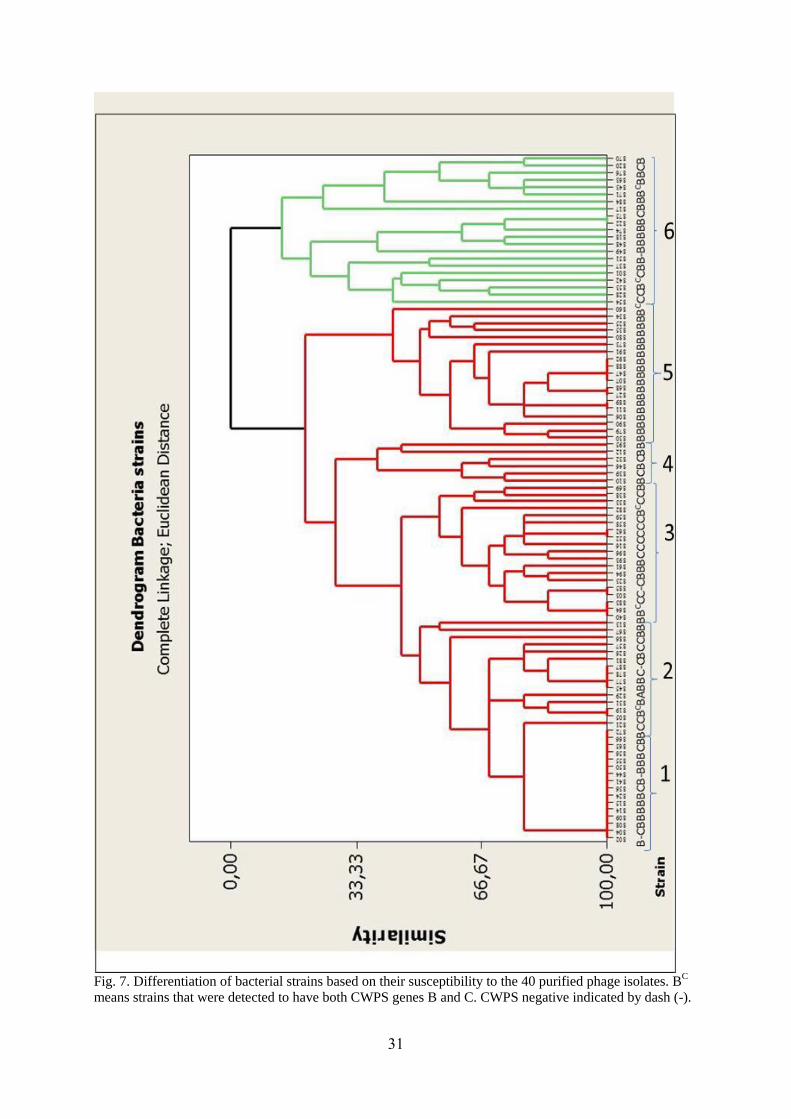
phage susceptibility of strains was highly variable. Based on the dendrogram developed from
the phage typing (Fig. 7), phenotypic relatedness between strains was differentiated in to 6
groups. This cluster analysis was used to evaluate the association between phage sensitivity of
the strains and the nature of their CWPS types. However, one of the clusters which contain 16
strains was not sensitive to the isolated phages, as a result we excluded from this assessment
study. Accordingly, strains of group 2 to 6 were used to test relationship between the two
factors (Table 11).
31
Fig. 7. Differentiation of bacterial strains based on their susceptibility to the 40 purified phage isolates. BC
means strains that were detected to have both CWPS genes B and C. CWPS negative indicated by dash (-).
32
5.6.3 Differentiation of bacterial isolates by (GTG)5-PCR fingerprint analysis
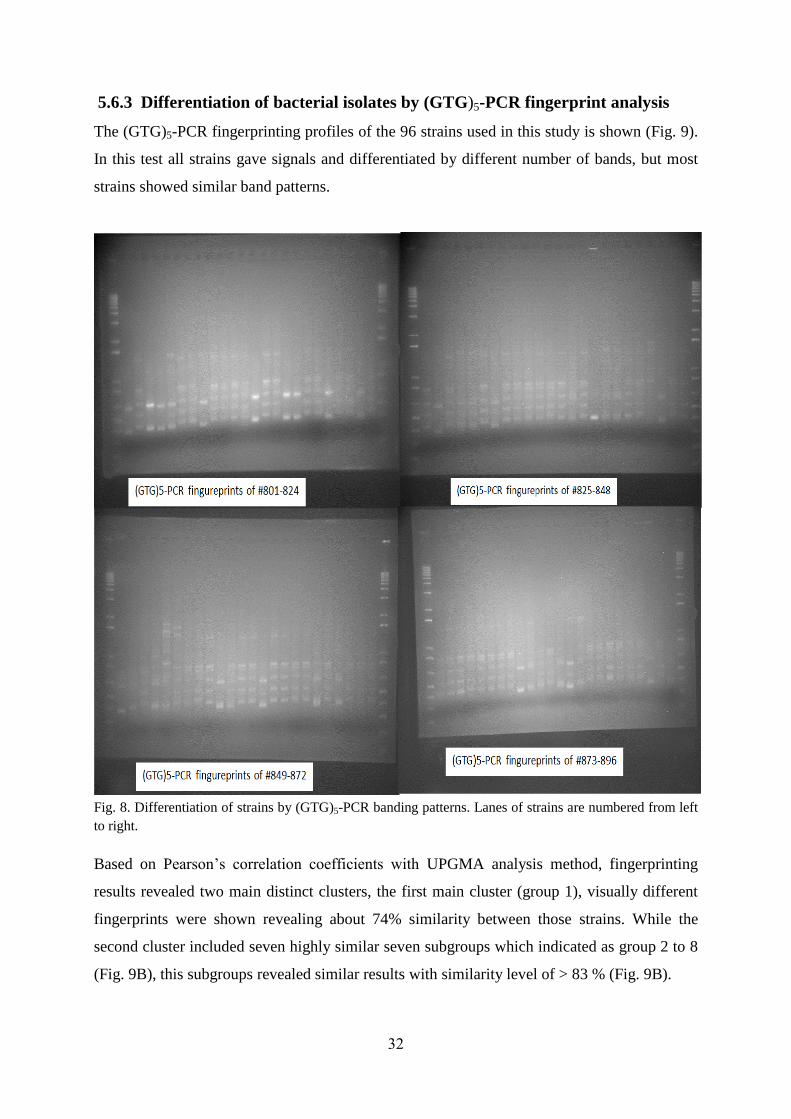
The (GTG)5-PCR fingerprinting profiles of the 96 strains used in this study is shown (Fig. 9).
In this test all strains gave signals and differentiated by different number of bands, but most
strains showed similar band patterns.
Fig. 8. Differentiation of strains by (GTG)5-PCR banding patterns. Lanes of strains are numbered from left
to right.
Based on Pearson’s correlation coefficients with UPGMA analysis method, fingerprinting
results revealed two main distinct clusters, the first main cluster (group 1), visually different
fingerprints were shown revealing about 74% similarity between those strains. While the
second cluster included seven highly similar seven subgroups which indicated as group 2 to 8
(Fig. 9B), this subgroups revealed similar results with similarity level of > 83 % (Fig. 9B).
33
34
This dendrogram is developed from (GTG)5-PCR fingerprinting profile indicated in Fig. 9A, when closely
similar bands where merged for genotypic grouping, the fingerprinting method separated the analyzed
strains in to six groups. The 8 groups are: group 1 (G1), includes 5 strains (803, 849, 801, 825 and 826 )
with similarity level 74%. Group 2, includes 33 strains (867, 869, 851, 802, 830, 839, 843, 844, 832, 833,
835, 837, 836, 834, 838, 841, 842, 808, 847, 848, 858, 859, 862, 852, 804, 805, 846, 828, 829, 831, 827,
860, and 861) with 90% group similarity. Group 3, contains 14 strains with 91% similarity and those strains
were 865, 866,868, 870, 863, 864, 871, 855, 856, 857, 845, 872, 853 and 854. Group 4 include 15 strains
(809, 810, 811, 812, 806, 807, 818, 819, 815, 824, 821, 822, 814, 874 and 875) this group has relatively the
highest percentage of similarity (94%). Group 5 contain one strain only, which was not included in the
merging process, Group 6 contain 5 strains (816, 817, 820, 823 and 813) like group 4 strains had 94%
similarity. Group 7 contain 2 strains (840 and 850), like group 5 these strains were not included in the
grouping. Finally group 8 includes 21 strains which include: 879, 880, 876, 877, 878, 896, 892, 893,894,
895, 890, 891, 882, 883, 884, 888, 889, 887, 881, 885 and 886 in group similarity level between the strains
was revealed to be 83%. Based on the (GTG)5-PCR fingerprint results, most strains particularly in the
second major cluster which included group (G) 2 to 8 were closely related with a similarity level > 83%.
35
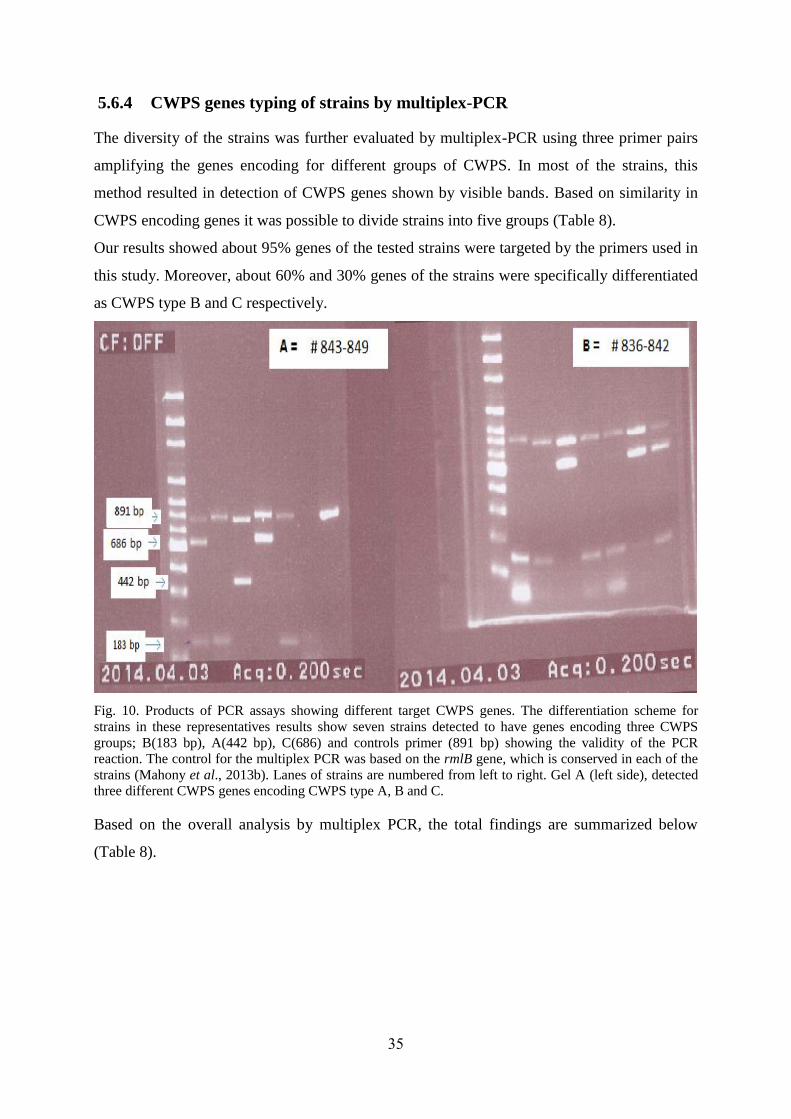
5.6.4 CWPS genes typing of strains by multiplex-PCR
The diversity of the strains was further evaluated by multiplex-PCR using three primer pairs
amplifying the genes encoding for different groups of CWPS. In most of the strains, this
method resulted in detection of CWPS genes shown by visible bands. Based on similarity in
CWPS encoding genes it was possible to divide strains into five groups (Table 8).
Our results showed about 95% genes of the tested strains were targeted by the primers used in
this study. Moreover, about 60% and 30% genes of the strains were specifically differentiated
as CWPS type B and C respectively.
Fig. 10. Products of PCR assays showing different target CWPS genes. The differentiation scheme for
strains in these representatives results show seven strains detected to have genes encoding three CWPS
groups; B(183 bp), A(442 bp), C(686) and controls primer (891 bp) showing the validity of the PCR
reaction. The control for the multiplex PCR was based on the rmlB gene, which is conserved in each of the
strains (Mahony et al., 2013b). Lanes of strains are numbered from left to right. Gel A (left side), detected
three different CWPS genes encoding CWPS type A, B and C.
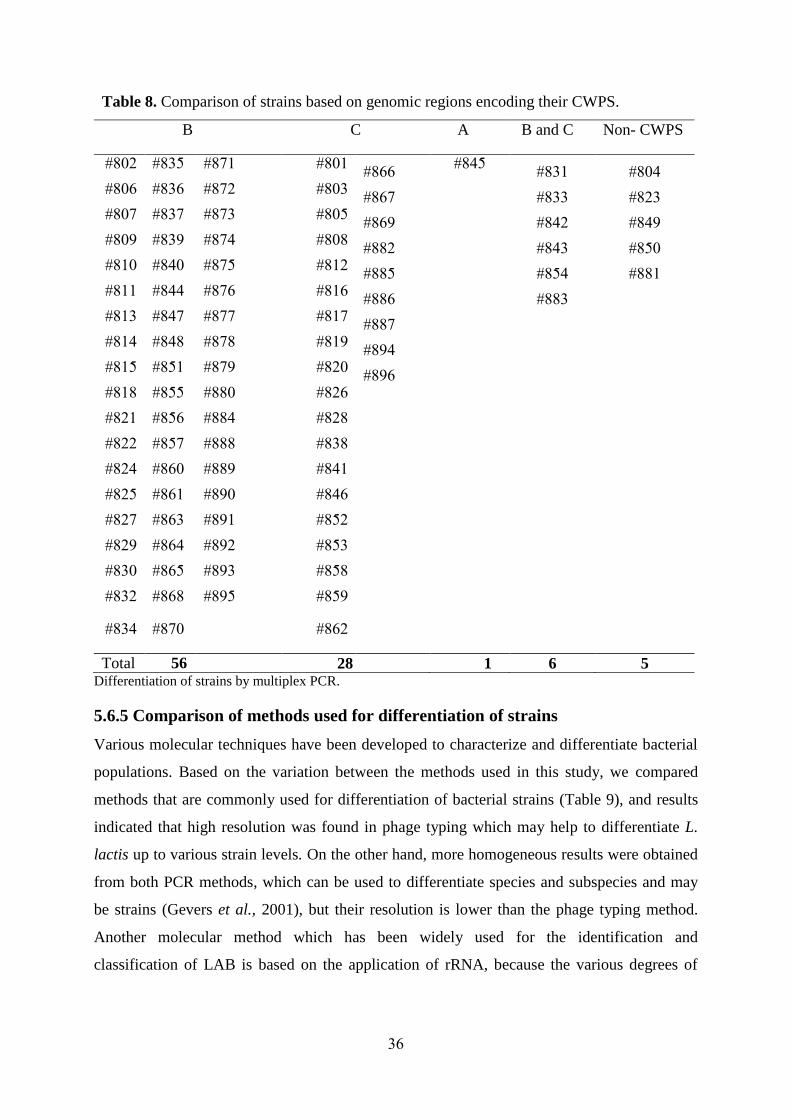
Based on the overall analysis by multiplex PCR, the total findings are summarized below
(Table 8).
36
Table 8. Comparison of strains based on genomic regions encoding their CWPS.
B C A B and C Non- CWPS
#802 #835 #871 #801 #866 #845 #831 #804
#806 #836 #872 #803 #867 #833 #823
#807 #837 #873 #805 #869 #842 #849
#809 #839 #874 #808 #882 #843 #850
#810 #840 #875 #812 #885 #854 #881
#811 #844 #876 #816 #886 #883
#813 #847 #877 #817 #887
#814 #848 #878 #819 #894
#815 #851 #879 #820 #896
#818 #855 #880 #826
#821 #856 #884 #828
#822 #857 #888 #838
#824 #860 #889 #841
#825 #861 #890 #846
#827 #863 #891 #852
#829 #864 #892 #853
#830 #865 #893 #858
#832 #868 #895 #859
#834 #870 #862
Total 56 28 1 6 5
Differentiation of strains by multiplex PCR.
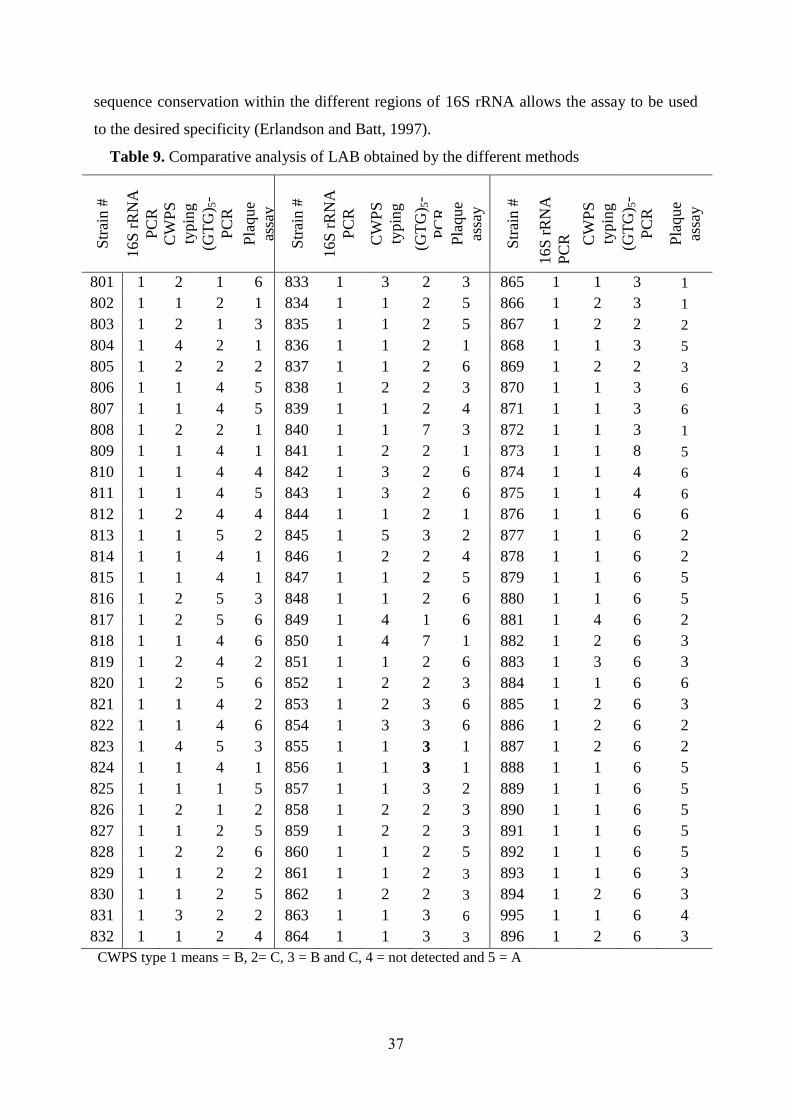
5.6.5 Comparison of methods used for differentiation of strains
Various molecular techniques have been developed to characterize and differentiate bacterial
populations. Based on the variation between the methods used in this study, we compared
methods that are commonly used for differentiation of bacterial strains (Table 9), and results
indicated that high resolution was found in phage typing which may help to differentiate L.
lactis up to various strain levels. On the other hand, more homogeneous results were obtained
from both PCR methods, which can be used to differentiate species and subspecies and may
be strains (Gevers et al., 2001), but their resolution is lower than the phage typing method.
Another molecular method which has been widely used for the identification and
classification of LAB is based on the application of rRNA, because the various degrees of
37
sequence conservation within the different regions of 16S rRNA allows the assay to be used
to the desired specificity (Erlandson and Batt, 1997).
Table 9. Comparative analysis of LAB obtained by the different methods
Str
ain #
16S
rR
NA
PC
R
CW
PS
typin
g
(GT
G) 5
-
PC
R
Pla
que
assa
y
Str
ain #
16S
rR
NA
PC
R
CW
PS
typin
g
(GT
G) 5
-
PC
R
Pla
que
assa
y
Str
ain #
16S
rR
NA
PC
R
CW
PS
typin
g
(GT
G) 5
-
PC
R
Pla
que
assa
y
801 1 2 1 6 833 1 3 2 3 865 1 1 3 1
802 1 1 2 1 834 1 1 2 5 866 1 2 3 1
803 1 2 1 3 835 1 1 2 5 867 1 2 2 2
804 1 4 2 1 836 1 1 2 1 868 1 1 3 5
805 1 2 2 2 837 1 1 2 6 869 1 2 2 3
806 1 1 4 5 838 1 2 2 3 870 1 1 3 6
807 1 1 4 5 839 1 1 2 4 871 1 1 3 6
808 1 2 2 1 840 1 1 7 3 872 1 1 3 1
809 1 1 4 1 841 1 2 2 1 873 1 1 8 5
810 1 1 4 4 842 1 3 2 6 874 1 1 4 6
811 1 1 4 5 843 1 3 2 6 875 1 1 4 6
812 1 2 4 4 844 1 1 2 1 876 1 1 6 6
813 1 1 5 2 845 1 5 3 2 877 1 1 6 2
814 1 1 4 1 846 1 2 2 4 878 1 1 6 2
815 1 1 4 1 847 1 1 2 5 879 1 1 6 5
816 1 2 5 3 848 1 1 2 6 880 1 1 6 5
817 1 2 5 6 849 1 4 1 6 881 1 4 6 2
818 1 1 4 6 850 1 4 7 1 882 1 2 6 3
819 1 2 4 2 851 1 1 2 6 883 1 3 6 3
820 1 2 5 6 852 1 2 2 3 884 1 1 6 6
821 1 1 4 2 853 1 2 3 6 885 1 2 6 3
822 1 1 4 6 854 1 3 3 6 886 1 2 6 2
823 1 4 5 3 855 1 1 3 1 887 1 2 6 2
824 1 1 4 1 856 1 1 3 1 888 1 1 6 5
825 1 1 1 5 857 1 1 3 2 889 1 1 6 5
826 1 2 1 2 858 1 2 2 3 890 1 1 6 5
827 1 1 2 5 859 1 2 2 3 891 1 1 6 5
828 1 2 2 6 860 1 1 2 5 892 1 1 6 5
829 1 1 2 2 861 1 1 2 3 893 1 1 6 3
830 1 1 2 5 862 1 2 2 3 894 1 2 6 3
831 1 3 2 2 863 1 1 3 6 995 1 1 6 4
832 1 1 2 4 864 1 1 3 3 896 1 2 6 3
CWPS type 1 means = B, 2= C, 3 = B and C, 4 = not detected and 5 = A
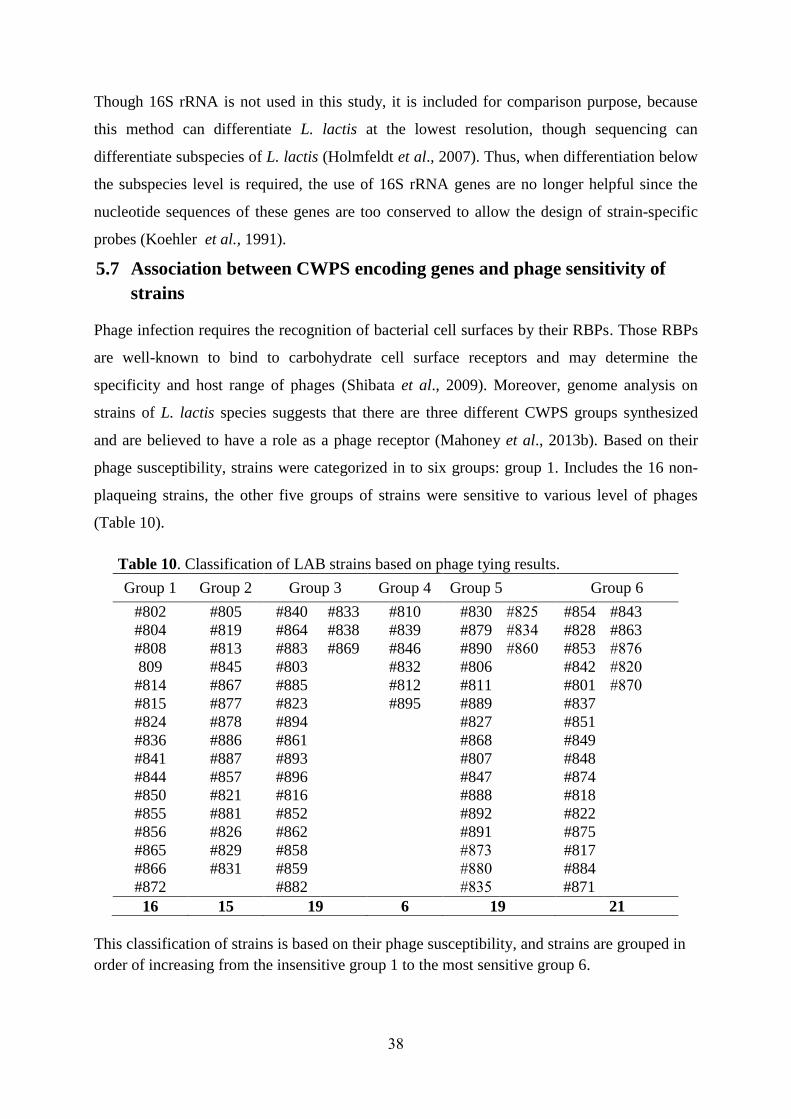
38
Though 16S rRNA is not used in this study, it is included for comparison purpose, because
this method can differentiate L. lactis at the lowest resolution, though sequencing can
differentiate subspecies of L. lactis (Holmfeldt et al., 2007). Thus, when differentiation below
the subspecies level is required, the use of 16S rRNA genes are no longer helpful since the
nucleotide sequences of these genes are too conserved to allow the design of strain-specific
probes (Koehler et al., 1991).
5.7 Association between CWPS encoding genes and phage sensitivity of
strains
Phage infection requires the recognition of bacterial cell surfaces by their RBPs. Those RBPs
are well-known to bind to carbohydrate cell surface receptors and may determine the
specificity and host range of phages (Shibata et al., 2009). Moreover, genome analysis on
strains of L. lactis species suggests that there are three different CWPS groups synthesized
and are believed to have a role as a phage receptor (Mahoney et al., 2013b). Based on their
phage susceptibility, strains were categorized in to six groups: group 1. Includes the 16 non-
plaqueing strains, the other five groups of strains were sensitive to various level of phages
(Table 10).
Table 10. Classification of LAB strains based on phage tying results.
Group 1 Group 2 Group 3 Group 4 Group 5 Group 6
#802 #805 #840 #833 #810 #830 #825 #854 #843
#804 #819 #864 #838 #839 #879 #834 #828 #863
#808 #813 #883 #869 #846 #890 #860 #853 #876
809 #845 #803 #832 #806 #842 #820
#814 #867 #885 #812 #811 #801 #870
#815 #877 #823 #895 #889 #837
#824 #878 #894 #827 #851
#836 #886 #861 #868 #849
#841 #887 #893 #807 #848
#844 #857 #896 #847 #874
#850 #821 #816 #888 #818
#855 #881 #852 #892 #822
#856 #826 #862 #891 #875
#865 #829 #858 #873 #817
#866 #831 #859 #880 #884
#872 #882 #835 #871
16 15 19 6 19 21
This classification of strains is based on their phage susceptibility, and strains are grouped in
order of increasing from the insensitive group 1 to the most sensitive group 6.

39
A statistical analysis was made to test if phage susceptibility of bacterial strains has any
relationship with genes encoding different CWPS type of L. lactis strains. Thus Table 8 and
10 are used for this test. And the statistical result is indicated in Table 11.
Table 11. Relationship between phage susceptibility isolates and their CWPS types
CWPS typing of
LAB Strains by
Multiplex-PCR
Phage susceptibility of LAB strain base on phage typing
Remark
Group2 Group3 Group4 Group5 Group6
Tota
l
IL/KF (B) 6 4 4 19 12 45
X2 = 27.0 MG/SK (C) 6 12 2 0 5 25
IL/KF, MG/SK
(B/C)
1 2 0 0 3 6 P-value <
0.05
Total 13 18 6 19 20 76
This table shows the relationship between CWPS encoding genes and phage susceptibility of
strains. After the common individual values were plotted into online statistical software
mentioned in the material and methods, the test statistic X2 = 27.0 was obtained at degree of
freedom (DF) 8 with probability value of 0.001. Moreover, analysis was done including the
CWPS negative results, the level of significance was shown to be reduced, but when they are
excluded from the analysis, level of significance increased. Moreover, analysis was done by
taking only two strains of L. lactis CWPS type B and C at a time and their sensitivity to
different phage groups was evaluated and statistical results showed that the two CWPS type B
and C are significantly associated (p < 0.000) with the different phages. However, no
correlation was found between host range and CWPS types.
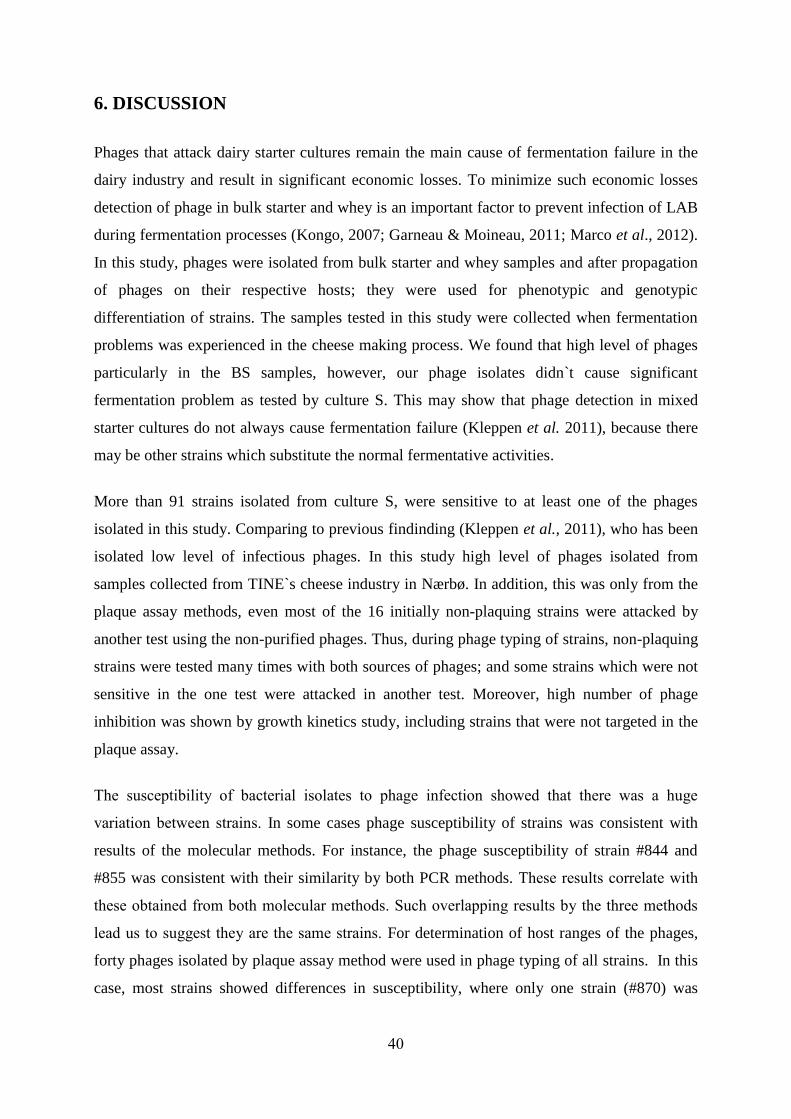
40
6. DISCUSSION
Phages that attack dairy starter cultures remain the main cause of fermentation failure in the
dairy industry and result in significant economic losses. To minimize such economic losses
detection of phage in bulk starter and whey is an important factor to prevent infection of LAB
during fermentation processes (Kongo, 2007; Garneau & Moineau, 2011; Marco et al., 2012).
In this study, phages were isolated from bulk starter and whey samples and after propagation
of phages on their respective hosts; they were used for phenotypic and genotypic
differentiation of strains. The samples tested in this study were collected when fermentation
problems was experienced in the cheese making process. We found that high level of phages
particularly in the BS samples, however, our phage isolates didn`t cause significant
fermentation problem as tested by culture S. This may show that phage detection in mixed
starter cultures do not always cause fermentation failure (Kleppen et al. 2011), because there
may be other strains which substitute the normal fermentative activities.
More than 91 strains isolated from culture S, were sensitive to at least one of the phages
isolated in this study. Comparing to previous findinding (Kleppen et al., 2011), who has been
isolated low level of infectious phages. In this study high level of phages isolated from
samples collected from TINE`s cheese industry in Nærbø. In addition, this was only from the
plaque assay methods, even most of the 16 initially non-plaquing strains were attacked by
another test using the non-purified phages. Thus, during phage typing of strains, non-plaquing
strains were tested many times with both sources of phages; and some strains which were not
sensitive in the one test were attacked in another test. Moreover, high number of phage
inhibition was shown by growth kinetics study, including strains that were not targeted in the
plaque assay.
The susceptibility of bacterial isolates to phage infection showed that there was a huge
variation between strains. In some cases phage susceptibility of strains was consistent with
results of the molecular methods. For instance, the phage susceptibility of strain #844 and
#855 was consistent with their similarity by both PCR methods. These results correlate with
these obtained from both molecular methods. Such overlapping results by the three methods
lead us to suggest they are the same strains. For determination of host ranges of the phages,
forty phages isolated by plaque assay method were used in phage typing of all strains. In this
case, most strains showed differences in susceptibility, where only one strain (#870) was
41
sensitive to all the phages, while about 16 strains were not sensitive to these phages. All
phages assessed in this study have a relatively broad host range infecting at least 4 (Ф837) at
most 42 (Ф878) different strain hosts. However, this result contradicts with previous report by
Rousseau and Moineau (2009), which stated that most LAB phages display a very narrow
individual host range. Only few phage isolates obtained from non-purified phages appeared to
have a narrow host range, infecting only the bacterial strains from which they were isolated
(Fig. 2). This may be explained by the principle of extreme host specificity of phages
(Holmfeldt et al., 2007). The variation in the phage sensitivity of bacterial strains was
different between the two the same methods. Infectivity of LAB strains by the non-purified
phages was higher than by the purified phages, this may be regardless of the phage
concentration non purified phages may contain more diversity of phage types.
Bacterial strains were further analyzed by (GTG)5-PCR fingerprinting and multiplex PCR.
(GTG)5-PCR fingerprinting cluster analysis revealed two major lineages (Fig. 9B). The first
lineage (shown as Group 1) contains 5 strains namely, #803, #849, #801, #825 and #826,
which have 74% similarity level. While the other second lineage included the rest 91 strains
which was differentiated in to 7 groups. However, the resolution by this method was lower
than by phage typing. Thus, phage typing method was shown to allow finer discrimination of
strains than using the molecular techniques. Our results can be supported by previous research
findings (Koehler et al., 1991), which explains for methods that depend on the use of the
nucleotide sequences of conserved genes are difficult to design strain-specific probes.
Moreover, this may be strengthened by another report (Rademaker et al., 2007), which stated
that phenotypic differences between lactococcus isolates does not apparently reflected by
(GTG)5-PCR. Furthermore, the close relationship between strains of L. lactis remained
indistinguishable using (GTG)5-PCR genomic fingerprinting analysis (Rademaker et al.,
2007).
The application of multiplex PCR using three L. lactis specific primer pairs targeting specific
genes used for diversity analysis and strains were grouped based on their molecular sizes
(Table 4). The three primer pairs used in multiplex-PCR were: UC/CV, IL/KF, and MG/SK,
they are assumed to detect specific genes encoding CWPS type A, CWPS type B and CWPS
type C respectively (Mahony et al., 2013b). Thus, the three specific primers indicates that the
cell surface of most L lactis strains have CWPS, which in turn determines phage sensitivity of
those strains (Ainsworth et al., 2014). This technique was efficient to detect 95% of the
42
strains. The ratio of strains with genes encoding the biosynthesis of CWPS group B and C was
2:1. The five strains that were not detected by the CWPS genes typing are supposed to be
changed in their structure or mutations in key biosynthetic genes are expected to cause
detrimental effects on growth as demonstrated by the formation of abnormally long-chained
lactococci carrying mutations in CWPS synthesis genes (Dupont et al., 2004). Although,
multiplex PCR separated majority of the bacterial isolates as strains of L. lactis, most of them
showed a unique pattern of susceptibility to the tested phages (Fig. 4). The CWPS negative
results were small in number, but their presence was shown to affect the association between
phage susceptibility and CWPS types, thus strong association was found between phage
susceptibility and CWPS types. Our results are also consistent with previous finding by
Shibata et al. (2009), which stated that most bacteriophages infecting LAB recognize cell wall
polysaccharides.
The primary source of phages which always appear in dairy plants is not clearly known.
However, various sources of phages in cheese production have been indicated (Garneau and
Moineau, 2011). Phages may persist in raw milk (Marco et al., 2012), and phage in remained
liquids such as whey and other in-house sources associated with inadequate sanitation
(Madera et al., 2004; Kleppen et al., 2011; Marco et al., 2012). In this study, we used two
methods of phage typing using 40 purified phages obtained from 40 plaques, and another 40
non-purified phages from the spots of the non-plaquing strains previously stamped with the
BS samples. After typing of bacterial strains with both types methods, it was found that the
two preparations have different spectrum of activity (Table 2 and 4). It may show that a BS
sample contains a large number of phage variants and more than 96 bacteria strains that may
be important for cheese making.
Since it is impossible to avoid phages from dairy environments, phage control strategies are
designed to reduce their impacts rather than eradicate them. Culture rotation, direct vat
inoculation of starters, avoiding production of bulk starter cultures, careful handling and
disposal of whey, use of phage-inhibitory media, and maintaining of optimized sanitation are
some of the recommended practices to minimize phage spreading in dairy plants (Coffey and
Ross, 2002; Moineau and Levesque, 2005; Kleppen et al., 2011).
Finally using a mixture of phages fermentation inhibition test was performed. In this
experiment, the effect of phages on fermentation activity of mixed starter cultures was studied
using a pool of phages prepared from the 40 phages isolated from this study and 39 phages
43
(from Cyril Frantez) inoculated in to culture S. The first two treatments groups (Mix 1 and
Mix 2), starter cultures showed a slight reduction in acid production lower than 10%, which
we suggested that this may not good indication for the effect of virulent phages in these
samples (Harrigan,1998; Oriani and Yokoya, 2004). On the other hand, Mix 3 and Mix 4
treated cultures showed 0.22 and 0.21 of loss in fermentative activity. Though, several factors
can affect starter cultures` ability to acid production (Oriani and Yokoya, 2004), except in one
treatment group, lytic activities of phages were not shown to cause significant reduction in pH
than the controls. The maximum reduction in fermentation activities of starter cultures was
shown by the highest number of phages. However; the virulence nature of phages isolated in
this study, which was shown on plaque assay, did not cause major fermentation failures. It
was suggested that, the effect of phages on mixed starter cultures may not be informative for
the virulence nature of the phages; this result may indicate the presence of phage-insensitive
strains continued to grow and acidify (Kleppen et al., 2011; Marco et al., 2012). Thus, at this
level we have not sufficient evidence to generalize about the real effect of phages on
carbohydrate fermentation. Therefore, further studies using single starter cultures are required
to reveal the actual impact of the isolated phages on dairy fermentation processes.
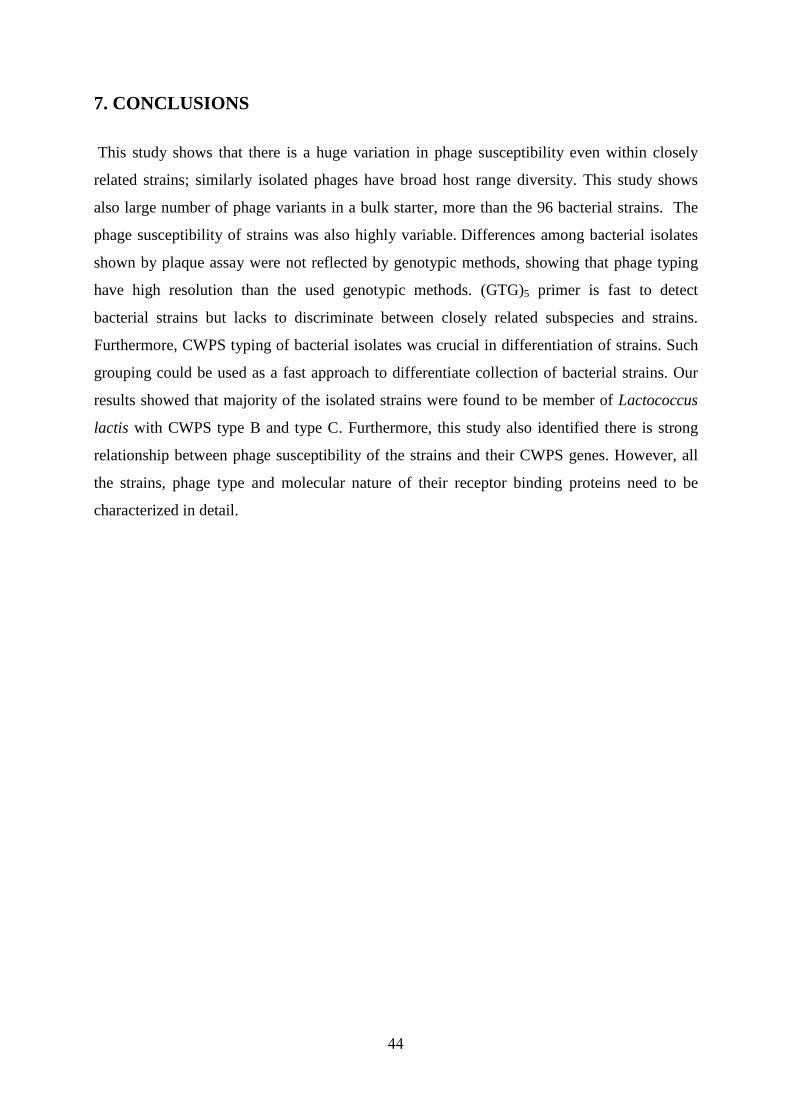
44
7. CONCLUSIONS
This study shows that there is a huge variation in phage susceptibility even within closely
related strains; similarly isolated phages have broad host range diversity. This study shows
also large number of phage variants in a bulk starter, more than the 96 bacterial strains. The
phage susceptibility of strains was also highly variable. Differences among bacterial isolates
shown by plaque assay were not reflected by genotypic methods, showing that phage typing
have high resolution than the used genotypic methods. (GTG)5 primer is fast to detect
bacterial strains but lacks to discriminate between closely related subspecies and strains.
Furthermore, CWPS typing of bacterial isolates was crucial in differentiation of strains. Such
grouping could be used as a fast approach to differentiate collection of bacterial strains. Our
results showed that majority of the isolated strains were found to be member of Lactococcus
lactis with CWPS type B and type C. Furthermore, this study also identified there is strong
relationship between phage susceptibility of the strains and their CWPS genes. However, all
the strains, phage type and molecular nature of their receptor binding proteins need to be
characterized in detail.
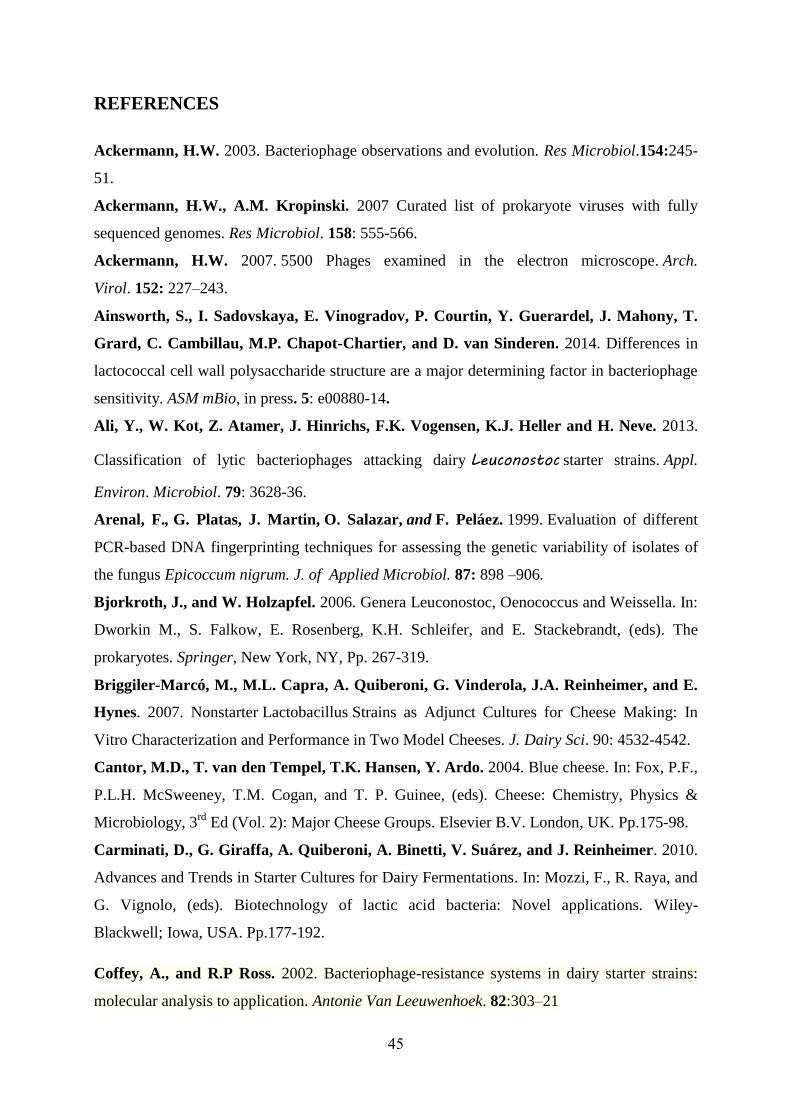
45
REFERENCES
Ackermann, H.W. 2003. Bacteriophage observations and evolution. Res Microbiol.154:245-
51.
Ackermann, H.W., A.M. Kropinski. 2007 Curated list of prokaryote viruses with fully
sequenced genomes. Res Microbiol. 158: 555-566.
Ackermann, H.W. 2007. 5500 Phages examined in the electron microscope. Arch.
Virol. 152: 227–243.
Ainsworth, S., I. Sadovskaya, E. Vinogradov, P. Courtin, Y. Guerardel, J. Mahony, T.
Grard, C. Cambillau, M.P. Chapot-Chartier, and D. van Sinderen. 2014. Differences in
lactococcal cell wall polysaccharide structure are a major determining factor in bacteriophage
sensitivity. ASM mBio, in press. 5: e00880-14.
Ali, Y., W. Kot, Z. Atamer, J. Hinrichs, F.K. Vogensen, K.J. Heller and H. Neve. 2013.
Classification of lytic bacteriophages attacking dairy Leuconostoc starter strains. Appl.
Environ. Microbiol. 79: 3628-36.
Arenal, F., G. Platas, J. Martin, O. Salazar, and F. Peláez. 1999. Evaluation of different
PCR-based DNA fingerprinting techniques for assessing the genetic variability of isolates of
the fungus Epicoccum nigrum. J. of Applied Microbiol. 87: 898 –906.
Bjorkroth, J., and W. Holzapfel. 2006. Genera Leuconostoc, Oenococcus and Weissella. In:
Dworkin M., S. Falkow, E. Rosenberg, K.H. Schleifer, and E. Stackebrandt, (eds). The
prokaryotes. Springer, New York, NY, Pp. 267-319.
Briggiler-Marcó, M., M.L. Capra, A. Quiberoni, G. Vinderola, J.A. Reinheimer, and E.
Hynes. 2007. Nonstarter Lactobacillus Strains as Adjunct Cultures for Cheese Making: In
Vitro Characterization and Performance in Two Model Cheeses. J. Dairy Sci. 90: 4532-4542.
Cantor, M.D., T. van den Tempel, T.K. Hansen, Y. Ardo. 2004. Blue cheese. In: Fox, P.F.,
P.L.H. McSweeney, T.M. Cogan, and T. P. Guinee, (eds). Cheese: Chemistry, Physics &
Microbiology, 3rd
Ed (Vol. 2): Major Cheese Groups. Elsevier B.V. London, UK. Pp.175-98.
Carminati, D., G. Giraffa, A. Quiberoni, A. Binetti, V. Suárez, and J. Reinheimer. 2010.
Advances and Trends in Starter Cultures for Dairy Fermentations. In: Mozzi, F., R. Raya, and
G. Vignolo, (eds). Biotechnology of lactic acid bacteria: Novel applications. Wiley-
Blackwell; Iowa, USA. Pp.177-192.
Coffey, A., and R.P Ross. 2002. Bacteriophage-resistance systems in dairy starter strains:
molecular analysis to application. Antonie Van Leeuwenhoek. 82:303–21
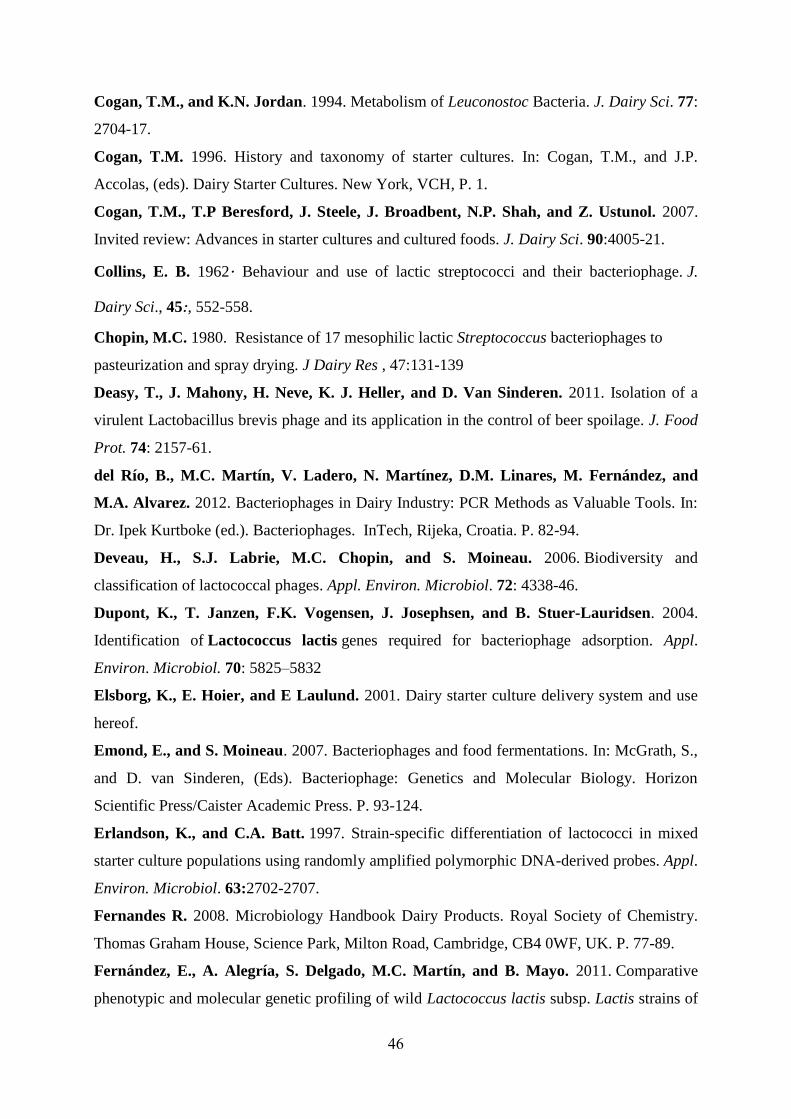
46
Cogan, T.M., and K.N. Jordan. 1994. Metabolism of Leuconostoc Bacteria. J. Dairy Sci. 77:
2704-17.
Cogan, T.M. 1996. History and taxonomy of starter cultures. In: Cogan, T.M., and J.P.
Accolas, (eds). Dairy Starter Cultures. New York, VCH, P. 1.
Cogan, T.M., T.P Beresford, J. Steele, J. Broadbent, N.P. Shah, and Z. Ustunol. 2007.
Invited review: Advances in starter cultures and cultured foods. J. Dairy Sci. 90:4005-21.
Collins, E. B. 1962. Behaviour and use of lactic streptococci and their bacteriophage. J.
Dairy Sci., 45:, 552-558.
Chopin, M.C. 1980. Resistance of 17 mesophilic lactic Streptococcus bacteriophages to
pasteurization and spray drying. J Dairy Res , 47:131-139
Deasy, T., J. Mahony, H. Neve, K. J. Heller, and D. Van Sinderen. 2011. Isolation of a
virulent Lactobacillus brevis phage and its application in the control of beer spoilage. J. Food
Prot. 74: 2157-61.
del Río, B., M.C. Martín, V. Ladero, N. Martínez, D.M. Linares, M. Fernández, and
M.A. Alvarez. 2012. Bacteriophages in Dairy Industry: PCR Methods as Valuable Tools. In:
Dr. Ipek Kurtboke (ed.). Bacteriophages. InTech, Rijeka, Croatia. P. 82-94.
Deveau, H., S.J. Labrie, M.C. Chopin, and S. Moineau. 2006. Biodiversity and
classification of lactococcal phages. Appl. Environ. Microbiol. 72: 4338-46.
Dupont, K., T. Janzen, F.K. Vogensen, J. Josephsen, and B. Stuer-Lauridsen. 2004.
Identification of Lactococcus lactis genes required for bacteriophage adsorption. Appl.
Environ. Microbiol. 70: 5825–5832
Elsborg, K., E. Hoier, and E Laulund. 2001. Dairy starter culture delivery system and use
hereof.
Emond, E., and S. Moineau. 2007. Bacteriophages and food fermentations. In: McGrath, S.,
and D. van Sinderen, (Eds). Bacteriophage: Genetics and Molecular Biology. Horizon
Scientific Press/Caister Academic Press. P. 93-124.
Erlandson, K., and C.A. Batt. 1997. Strain-specific differentiation of lactococci in mixed
starter culture populations using randomly amplified polymorphic DNA-derived probes. Appl.
Environ. Microbiol. 63:2702-2707.
Fernandes R. 2008. Microbiology Handbook Dairy Products. Royal Society of Chemistry.
Thomas Graham House, Science Park, Milton Road, Cambridge, CB4 0WF, UK. P. 77-89.
Fernández, E., A. Alegría, S. Delgado, M.C. Martín, and B. Mayo. 2011. Comparative
phenotypic and molecular genetic profiling of wild Lactococcus lactis subsp. Lactis strains of
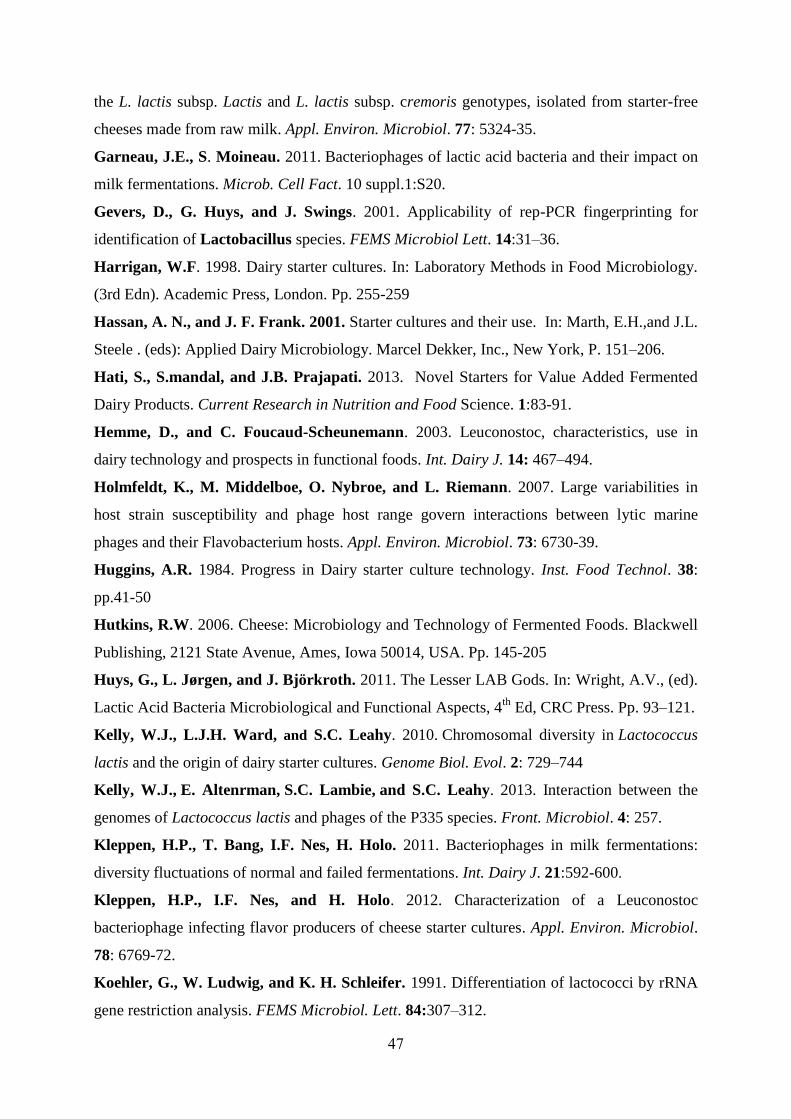
47
the L. lactis subsp. Lactis and L. lactis subsp. cremoris genotypes, isolated from starter-free
cheeses made from raw milk. Appl. Environ. Microbiol. 77: 5324-35.
Garneau, J.E., S. Moineau. 2011. Bacteriophages of lactic acid bacteria and their impact on
milk fermentations. Microb. Cell Fact. 10 suppl.1:S20.
Gevers, D., G. Huys, and J. Swings. 2001. Applicability of rep-PCR fingerprinting for
identification of Lactobacillus species. FEMS Microbiol Lett. 14:31–36.
Harrigan, W.F. 1998. Dairy starter cultures. In: Laboratory Methods in Food Microbiology.
(3rd Edn). Academic Press, London. Pp. 255-259
Hassan, A. N., and J. F. Frank. 2001. Starter cultures and their use. In: Marth, E.H.,and J.L.
Steele . (eds): Applied Dairy Microbiology. Marcel Dekker, Inc., New York, P. 151–206.
Hati, S., S.mandal, and J.B. Prajapati. 2013. Novel Starters for Value Added Fermented
Dairy Products. Current Research in Nutrition and Food Science. 1:83-91.
Hemme, D., and C. Foucaud-Scheunemann. 2003. Leuconostoc, characteristics, use in
dairy technology and prospects in functional foods. Int. Dairy J. 14: 467–494.
Holmfeldt, K., M. Middelboe, O. Nybroe, and L. Riemann. 2007. Large variabilities in
host strain susceptibility and phage host range govern interactions between lytic marine
phages and their Flavobacterium hosts. Appl. Environ. Microbiol. 73: 6730-39.
Huggins, A.R. 1984. Progress in Dairy starter culture technology. Inst. Food Technol. 38:
pp.41-50
Hutkins, R.W. 2006. Cheese: Microbiology and Technology of Fermented Foods. Blackwell
Publishing, 2121 State Avenue, Ames, Iowa 50014, USA. Pp. 145-205
Huys, G., L. Jørgen, and J. Björkroth. 2011. The Lesser LAB Gods. In: Wright, A.V., (ed).
Lactic Acid Bacteria Microbiological and Functional Aspects, 4th
Ed, CRC Press. Pp. 93–121.
Kelly, W.J., L.J.H. Ward, and S.C. Leahy. 2010. Chromosomal diversity in Lactococcus
lactis and the origin of dairy starter cultures. Genome Biol. Evol. 2: 729–744
Kelly, W.J., E. Altenrman, S.C. Lambie, and S.C. Leahy. 2013. Interaction between the
genomes of Lactococcus lactis and phages of the P335 species. Front. Microbiol. 4: 257.
Kleppen, H.P., T. Bang, I.F. Nes, H. Holo. 2011. Bacteriophages in milk fermentations:
diversity fluctuations of normal and failed fermentations. Int. Dairy J. 21:592-600.
Kleppen, H.P., I.F. Nes, and H. Holo. 2012. Characterization of a Leuconostoc
bacteriophage infecting flavor producers of cheese starter cultures. Appl. Environ. Microbiol.
78: 6769-72.
Koehler, G., W. Ludwig, and K. H. Schleifer. 1991. Differentiation of lactococci by rRNA
gene restriction analysis. FEMS Microbiol. Lett. 84:307–312.
48
Kongo, J.M., A.J. Ho, F.X. Malcata, and M Wiedmann. 2007. Characterization of
dominant lactic acid bacteria isolated from Sao Jorge cheese, using biochemical and
ribotyping methods. J. Appl. Microbio. 103:1838 ‒1844.
Kosikowski, F.V., and V.V. Mistry. 1997. Cheese and Fermented Milk Foods. Volume 1:
Origins and Principles. 3rd ed. Westport, USA.
Kurtz, F.E., J.A Hupfer, E.A. Corbin, R.E. Hargrove, and H.E. Walter. 1959.
Interrelationships between pH, populations of Propionibacterium Shermanii, Levels of Free
Fatty Acids, and the Flavor Ratings of Swiss Cheeses. J. Dairy Sci. 42: 1008-1019.
Lodics, T.A., and L.R. Steenson.1993. Phage-host interactions in commercial mixed-strain
dairy starter cultures: practical significance-a review. J. Dairy Sci. 76:2380.
Lortal, S., and M.P. Chapot-Chartier. 2005. Role, mechanisms and control of lactic acid
bacteria lysis in cheese. Int. Dairy J. 15: 857–871.
Madera, C., C. Monjardín, and J.E. Suárez. 2004. Milk contamination and resistance to
processing conditions determine the fate of Lactococcus lactis bacteriophages in dairies. Appl.
Environ. Microbiol. 70: 7365-71.
Mahony, J., and D. van Sinderen.2014. Current taxonomy of phages infecting lactic acid
bacteria. Front. Microbiol. 5:7.
Mahony, J., J. Murphy, and D. van Sinderen. 2012a. Lactococcal 936-type phages and
dairy fermentation problems: from detection to evolution and prevention. Front. Microbiol.
3:335.
Mahony, J., S. Ainsworth, S. Stockdale, and D. Van Sinderen. 2012b. Phages of lactic acid
bacteria: The role of genetics in understanding phage-host interactions and their co-
evolutionary processes. Virology. 434: 143–150.
Mahony, J., W. Kot, J. Murphy, S. Ainsworth, H. Neve, L.H. Hansen, K.J. Heller, S.J.
Sørensen, K. Hammer, C. Cambillau, F.K. Vogensen, and D. van Sinderen. 2013b.
Investigation of the relationship between lactococcal host cell wall polysaccharide genotype
and 936 phage receptor binding protein phylogeny. Appl. Environ. Microbiol. 79: 4385–4392
Marco, M.B., S. Moineau, and A. Quiberoni. 2012. Bacteriophages and dairy
fermentations. Bacteriophage. 2: 149-158.
Mcsweeney, P.L.H.2004. Biochemistry of cheese ripening. Int. J. of Dairy Tech. 57: 127-44.
Mills, S., C. Griffin, O. O'Sullivan, A. Coffey, O.E. McAuliffe, W.C. Meijer, L.M.
Serrano, and R.P. Ross. 2011. A new phage on the 'Mozzarella' block: bacteriophage 5093
shares a low level of homology with other Streptococcus thermophilus phages. Int. Dairy
J. 21: 963-69.
49
Moineau, S,, and C. Lévesque. 2005. Control of bacteriophages in industrial fermentations.
In: Kutter, E., and A. Sulakvelidze, (eds). Bacteriophages: biology and applications. CRC
Press, Boca Raton, FL. p. 285-296.
Nieto-Arribas, P., S.Sesena, J.M. Poveda, L. Palop, and L. Cabezas. 2010. Genotypic and
technological characterization of Leuconostoc isolates to be used as adjunct starters in
Manchego cheese manufacture. Food Microbiol. 27: 85-93.
Oriani, M.R.G., and F. Yokoya. 2004. Lactococcus bacteriophages isolated from whey and
their effects on commercial lactic starters. Braz. arch. biol. technol. 47: 559-568.
Parente, E., and T.M. Cogan. 2004. Starter cultures: General aspects. In: Fox, P.F., P.L.H.
McSweeney, T.M. Cogan, and T. P. Guinee, (eds). Cheese: Chemistry, Physics &
Microbiology, 3rd
ed (Vol. 2): Major Cheese Groups. Elsevier B.V. London, UK. P. 123-147.
Prabhakar, V., N. Kocaoglu-Vurma, J. Harper, L. Rodriguez-Saona. 2011. Classification
of Swiss cheese starter and adjunct cultures using Fourier transform infrared
microspectroscopy. J. Dairy Sci. 94: 4374-82.
Rademaker, J.L., H. Herbet, M.J. Starrenburg, S.M. Naser, D. Gevers, and W.J. Kelly.
2007 Diversity analysis of dairy and nondairy Lactococcus lactis isolates, using a novel
multilocus sequence analysis scheme and (GTG)5‐PCR fingerprinting. Appl Environ
Microbiol. 73:7128–7137
Ray, B., and Bhunia A. 2013. Starter culture and bacteriophages. In Fundamental Food
Microbiology, Fifth Edition. p. 159.
Rousseau, G.M., S. Moineau. 2009. Evolutionof Lactococcus lactis phages within a cheese
factory. Appl.Environ.Microbiol.75:5336-5344.
Schleifer, K.H., J. Kraus, C. Dvorak, R. Kilpper-Balz, M.D. Collins, and W. Fisher.
1985. Transfer of Streptococcus lactis and related streptococci to the genus Lactococcus gen.
nov. Syst. Appl. Microbiol. 6:183-195.
Schleifer, K.H., M. Ehrmann, C. Beimfohr, E. Brockmann, W. Ludwig, and R. Amann.
1995. Application of molecular methods for the classification and identification of lactic acid
bacteria. Int. Dairy J. 5:1081–1094.
Shibata, Y., Y. Yamashita, and J.R. van der Ploeg. 2009. The serotype-specific glucose
side chain of rhamnose-glucose polysaccharides is essential for adsorption of bacteriophage
M102 to Streptococcus mutans. FEMS Microbiol. Lett. 294:68-73.
Shiby, V.K. and H.N. Mishra. 2013. Fermented milks and milk products as functional foods-
-a review. Crit. Rev. Food Sci. Nutr. 53(5):482-96.
50
Smit, G., A. Verheul, R. Kranenburg, E. Ayad, R. Siezen, and W. Engels. 2000. “Cheese
flavour development by enzymatic conversions of peptides and amino acids.” Food Research
International. 33: 153-160.
Surono, S., and A. Hosono. 2011. Starter cultures. In: Fuquay, J., P. Fox, and P. McSweeney
(eds). Encyclopedia of dairy science 2nd
Edition (Vol. 2), Academic Press, Elsevier Science,
USA. p. 477-482.
Svec, P., and I. Sedlacek. 2008. Characterization of Lactococcus lactis subsp. lactis Isolated
from Surface Waters. Folia Microbiol. 53: 53-56.
Tamara A.P. 2013. Lactose and β-Glucosides Metabolism and Its Regulation in Lactococcus
lactis: A Review, Lactic Acid Bacteria - R & D for Food, Health and Livestock Purposes, Dr.
J. Marcelino Kongo (Ed.), ISBN: 978-953-51-0955-6, InTech, DOI: 10.5772/50889.
Tamime, A.Y. 2002. Microbiology of 'starter cultures. In: Robinson, R.K. (ed). Dairy
Microbiology Handbook: The Microbiology of Milk and Milk Products, 3rd Ed. Wiley-
Interscience Publishers, New York, NY. p. 261-366.
Temmerman, R., G. Huys, and J. Swings. 2004. Identification of lactic acid bacteria:
culture dependent and culture-independent methods. Trends Food Sci. Tech. 15: 348-359.
Yvon, M., S. Thirouin, L. Rijnen, D. Fromentier, and J.C. Gripon. 1997. “An
Aminotransferase from Lactococcus lactis Initiates Conversion of Amino Acids to Cheese
Flavor Compounds.” Appl. Environ Microbiol. 63: 414-419.
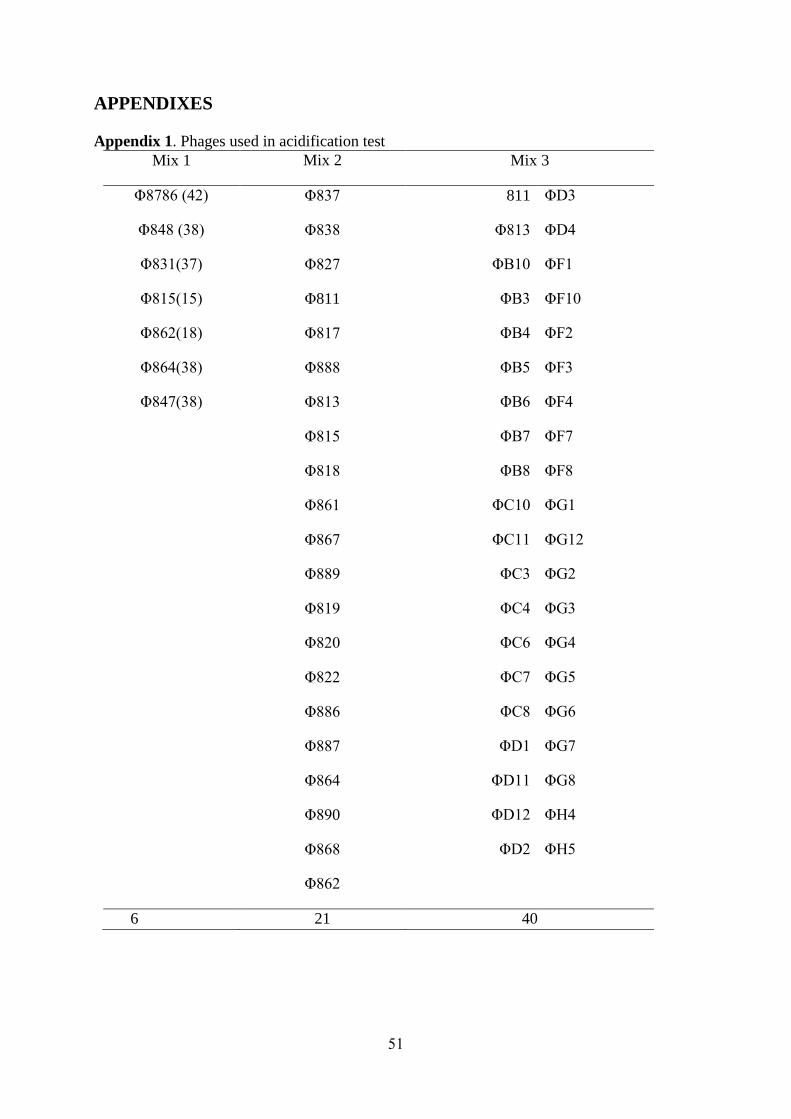
51
APPENDIXES
Appendix 1. Phages used in acidification test
Mix 1 Mix 2 Mix 3
Φ8786 (42) Φ837 811 ΦD3
Φ848 (38) Φ838 Φ813 ΦD4
Φ831(37) Φ827 ΦB10 ΦF1
Φ815(15) Φ811 ΦB3 ΦF10
Φ862(18) Φ817 ΦB4 ΦF2
Φ864(38) Φ888 ΦB5 ΦF3
Φ847(38) Φ813 ΦB6 ΦF4
Φ815 ΦB7 ΦF7
Φ818 ΦB8 ΦF8
Φ861 ΦC10 ΦG1
Φ867 ΦC11 ΦG12
Φ889 ΦC3 ΦG2
Φ819 ΦC4 ΦG3
Φ820 ΦC6 ΦG4
Φ822 ΦC7 ΦG5
Φ886 ΦC8 ΦG6
Φ887 ΦD1 ΦG7
Φ864 ΦD11 ΦG8
Φ890 ΦD12 ΦH4
Φ868 ΦD2 ΦH5
Φ862
6 21 40
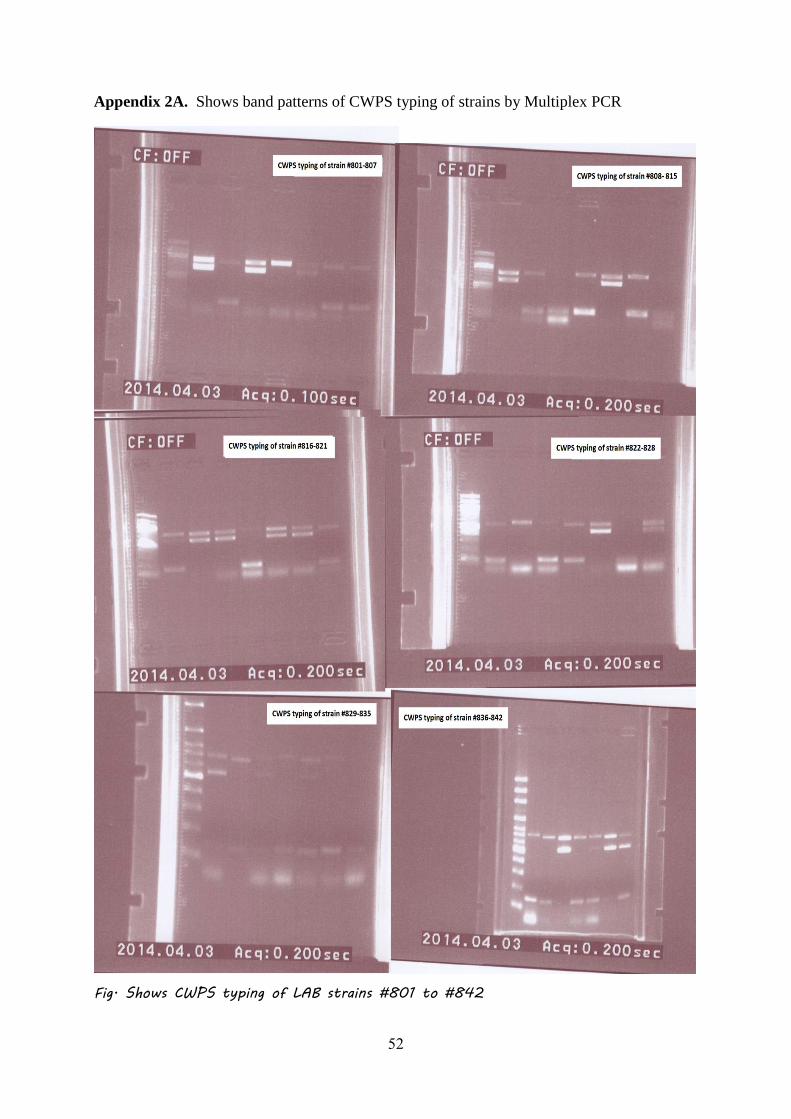
52
Appendix 2A. Shows band patterns of CWPS typing of strains by Multiplex PCR
Fig. Shows CWPS typing of LAB strains #801 to #842
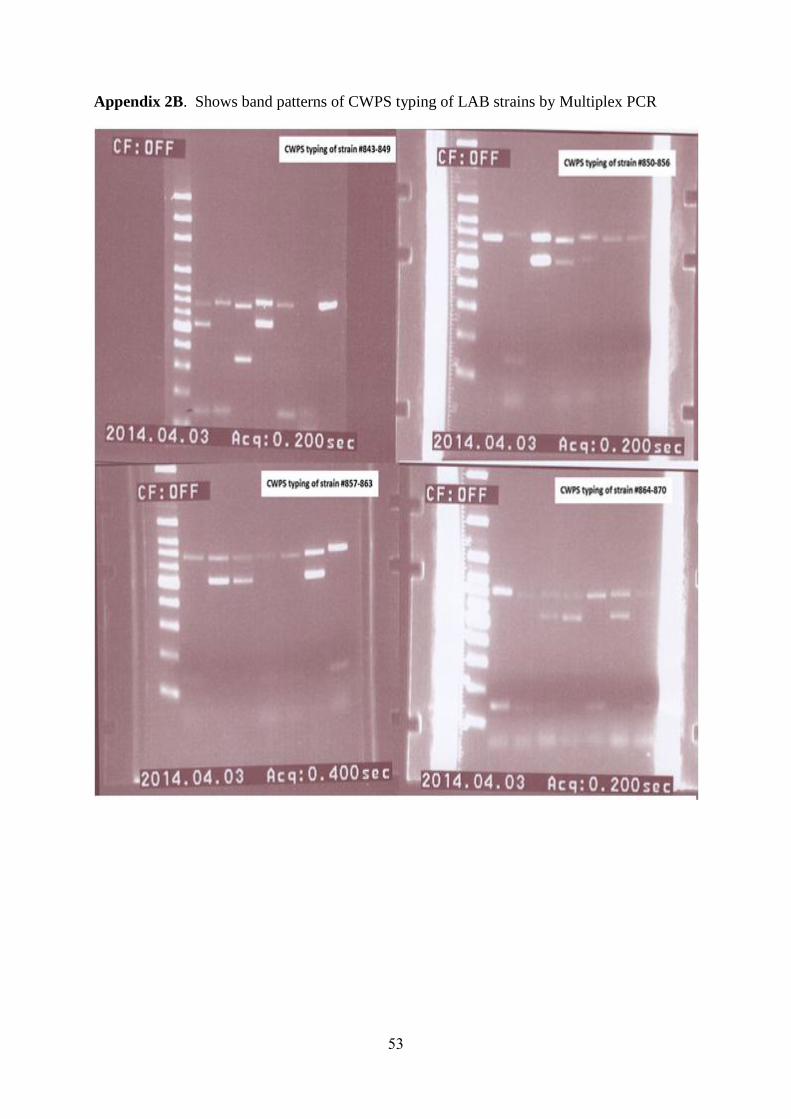
53
Appendix 2B. Shows band patterns of CWPS typing of LAB strains by Multiplex PCR
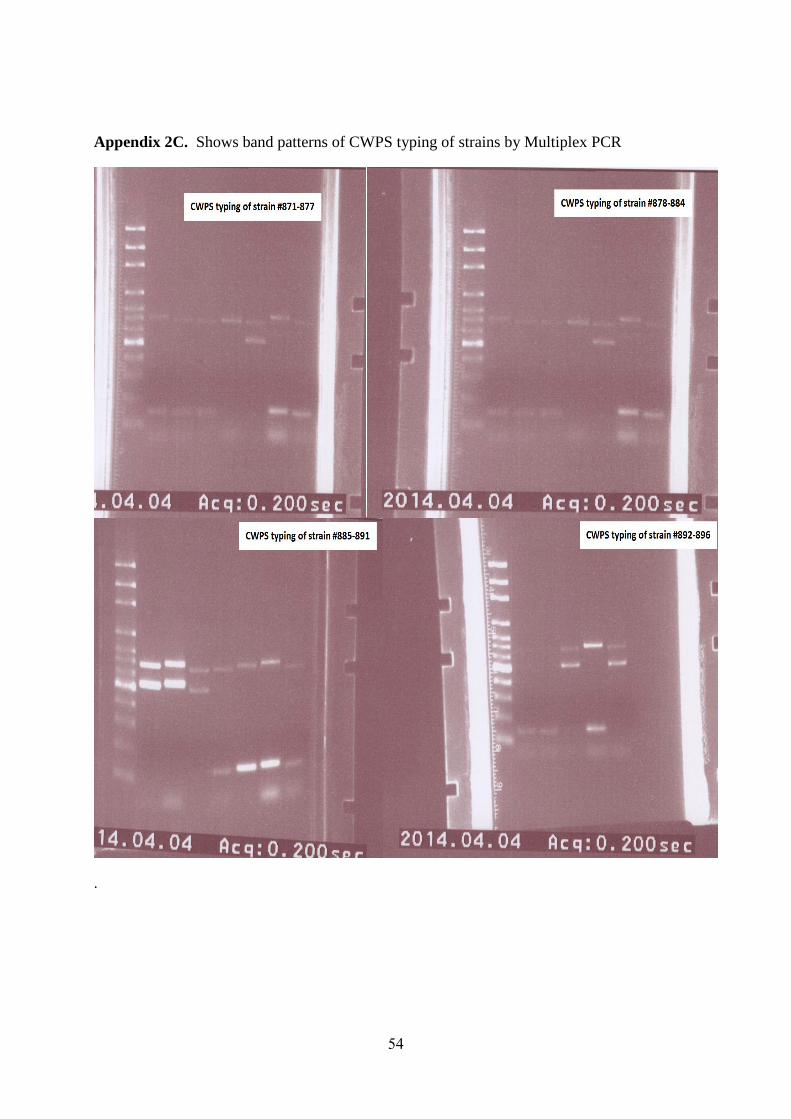
54
Appendix 2C. Shows band patterns of CWPS typing of strains by Multiplex PCR
.
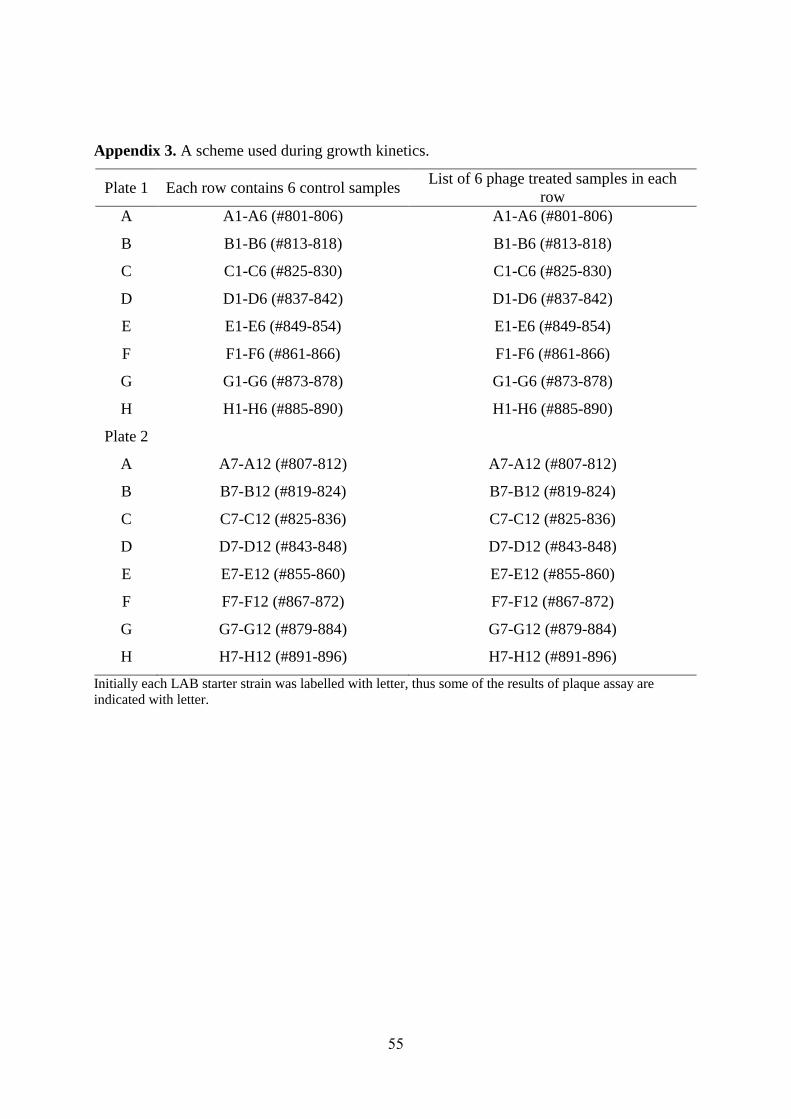
55
Appendix 3. A scheme used during growth kinetics.
Plate 1 Each row contains 6 control samples List of 6 phage treated samples in each
row
A A1-A6 (#801-806) A1-A6 (#801-806)
B B1-B6 (#813-818) B1-B6 (#813-818)
C C1-C6 (#825-830) C1-C6 (#825-830)
D D1-D6 (#837-842) D1-D6 (#837-842)
E E1-E6 (#849-854) E1-E6 (#849-854)
F F1-F6 (#861-866) F1-F6 (#861-866)
G G1-G6 (#873-878) G1-G6 (#873-878)
H H1-H6 (#885-890) H1-H6 (#885-890)
Plate 2
A A7-A12 (#807-812) A7-A12 (#807-812)
B B7-B12 (#819-824) B7-B12 (#819-824)
C C7-C12 (#825-836) C7-C12 (#825-836)
D D7-D12 (#843-848) D7-D12 (#843-848)
E E7-E12 (#855-860) E7-E12 (#855-860)
F F7-F12 (#867-872) F7-F12 (#867-872)
G G7-G12 (#879-884) G7-G12 (#879-884)
H H7-H12 (#891-896) H7-H12 (#891-896)
Initially each LAB starter strain was labelled with letter, thus some of the results of plaque assay are
indicated with letter.

Postboks 5003 NO-1432 Ås, Norway+47 67 23 00 00www.nmbu.no