Embed Size (px)
Citation preview
Diversity Committee Meeting
September 2014 Committee Members J. Molloy, Chairman F. Ferrer, MTA Vice Chairman S. Metzger J. Banks III R. Bickford
Diversity Committee Meeting347 Madison Ave. - 5th Floor Board Room
New York, NY 10017Monday, 9/22/20142:45 - 3:45 PM ET
1. PUBLIC COMMENT PERIOD Discussion
2. APPROVAL OF MINUTES – JULY 28, 2014 Approve
Minutes of the MTA Diversity Committee Meeting July 2014 - Page 3 3. 2014 DIVERSITY COMMITTEE WORK PLAN Review
DR July 2014 Work Plan - Page 10 4. BUSINESS AND DIVERSITY INITIATIVES Presentation
Business and Diversity Initiatives - September 2014 - Page 14 5. CERTIFICATION ACTIVITY REPORT Presentation
Certification - September 2014 - Page 16 6. SECOND QUARTER 2014 EEO ACTIVITIES Presentation
EEO Second Quarter Activity Report - September 2014 - Page 19 7. SMALL BUSINESS MENTORING PROGRAM UPDATE Presentation
Small Business Mentoring Program - September 2014 - Page 39 8. SMALL BUSINESS FEDERAL PROGRAM UPDATE Presentation
Small Business Federal Program - September 2014 - Page 41 9. M/W/DBE CONTRACT COMPLIANCE 2014 3RD QUARTER REPORT Presentation
MWDBE Contract Compliance - September 2014 - Page 43 10. FINANCIAL AND LEGAL SERVICES Presentation
Financial and Legal Services - September 2014 - Page 53 11. ASSET FUND MANAGERS Presentation
Asset Fund Managers - September 2014 - Page 57 12. M/W/DBE CAPITAL PROJECTS 2014 REPORT Presentation
Capital Projects - September 2014 - Page 62
�MTA�Diversity�Committee�Meeting�Minutes,�Monday,�July�28,�2014���
�������
MTA DIVERSITY COMMITTEE Meeting Minutes
347 Madison Avenue, Fifth Floor Board Room New York, NY 10017 Monday, July 28, 2014
1:00 p.m.
The following Committee members were present:
Hon. John Molloy, Chairman Hon. Fernando Ferrer Hon. Susan G. Metzger Hon. John Banks III
The following Committee member was absent:
Hon. Robert C. Bickford
The following were also present:
Carmen Bianco, President, MTA New York City (“NYC”) Transit Darryl Irick, President, MTA Bus Company (“MTA Bus”) Michael Horodniceanu, President, MTA Capital Construction (“CC”) Joseph Giulietti, President, MTA Metro-North Railroad (“MNR”) Patrick Nowakowski, President, MTA Long Island Rail Road (“LIRR”) James Ferrara, President, MTA Bridges and Tunnels (“B&T”) Barry Kluger, MTA Inspector General Robert Bergen, Executive Vice President, NYC Transit Michael J. Garner, Chief Diversity Officer, MTA Department of Diversity and Civil Rights (“DDCR”) Heidi Lemanski, Chief of Staff, MTA Bus James Henly, General Counsel, MNR Richard Gans, General Counsel, LIRR Kathy Meilick, Director, Human Resources, LIRR Sharon Gallo-Kotcher, Vice President, Staff Services, B&T Serafina Rutigliano, Director, Human Resources, B&T Joel Andrews, Chief Equal Employment Opportunity (“EEO”) Officer, Office of EEO, NYC Transit Vernessa Moses, Assistant Chief Officer, Office of EEO, NYC Transit Raymond Diaz, MTA Director of Security
Master Page # 3 of 64 - Diversity Committee Meeting 9/22/2014________________________________________________________________________________
�MTA�Diversity�Committee�Meeting�Minutes,�Monday,�July�28,�2014���
�������
Michael Coan, Chief of Police, MTA Police Department (“MTAPD”) Jessie Crawford, Deputy Director, MTA Human Resources and Retirement Programs Patrick Smith, Senior Director, Human Resources, NYC Transit Michael Fyffe, Director, Diversity Management, LIRR Shibu Jacob, Manager, Diversity Management, LIRR Dennis Mahon, Chief Procurement & Logistics Officer, LIRR Robert Rodriguez, Director, Office of Diversity & Equal Opportunity, MNR Anthony Gardner, Deputy Director, Operation Procurement, MNR Christine Norman, Manager, Procurement and Material Management, MNR Roberto Aguirre, Assistant Director, Office of Diversity & Equal Opportunity, MNR Nancy Cotto, Manager, Office of Diversity & Equal Opportunity, MNR Naeem U. Din, Deputy Director, DDCR Shawn Moore, Assistant Director, EEO and Title VI Compliance, DDCR David Cannon, Director, Procurement & Risk Management, CC Dennis Mahon, Chief Procurement and Logistics Officer, LIRR Steven Plochochi, Vice President, Materiel, NYC Transit Judith Giberstone, Assistant Manager, Staffing and Employee Relations, MTA Human Resources Lakeesha Kaufman, Senior Manager, MTA Human Resources Julia Christ, Deputy General Counsel, B&T Michael Wetherell, Director, MTA Office of Construction Oversight
1. Public Speakers: There were two public speakers. Debra Grief of Brooklyn Family Support Services’ Advisory Council said people with disabilities should be part of diversity. Murray Bodin said the elderly should be part of diversity. Mr. Bodin also spoke about change, referring to public agencies being able to solve transportation problems in a different way. He said change has taken place at other public transportation agencies, but change is not so obvious at the MTA. 2. Minutes Upon motion duly made and seconded, the committee unanimously approved the minutes of the meeting held on May 19, 2014. 3. Overview of Today’s Meeting
2014 Diversity Committee Work Plan
Chairman Molloy asked if there were any changes to the work plan. Mr. Din said updates of outreach events/diversity programs, certification activity, Small Business Mentoring Program (“SBMP”), Small
Master Page # 4 of 64 - Diversity Committee Meeting 9/22/2014________________________________________________________________________________

�MTA�Diversity�Committee�Meeting�Minutes,�Monday,�July�28,�2014���
�������
Business Federal Program (“SBFP”), and MWDBE contract compliance activities will not be presented at this meeting. Second quarter updates of these program activities will be presented at a committee meeting scheduled for September 2014. Third quarter 2014 updates of the above-mentioned program activities will be presented at the November 2014 committee meeting.
EEO Program Activities Ms. Moore reported on MTA-wide underutilization as of March 31, 2014. In general, females, Hispanics and employees classified as Others are underutilized. A majority of underutilization occurred within administrative support, skilled craft and service maintenance job categories. Ms. Moore also highlighted underutilization at MTA Headquarters (“MTAHQ”). Overall, females, blacks, Hispanics, and Native Hawaiian/Other Pacific Islanders (“NHOPIs”) are underutilized. At MTAPD, females, blacks, Hispanics and NHOPIs are underutilized. Ms. Moore also reported on MTA-wide new hires between January and March 2014. A total of 1,543 employees were hired, of which 19% are female and 70.5% are minority. Of the minorities hired, 38.1% are black and 19.4% are Hispanic. MTAHQ hired 40 employees, of whom 13 (32.5%) are females, and 19 (47.5%) are minorities. Ms. Moore also presented a comparison of new hires for the years 2011 through 2013 and for the first quarter of 2014. Mr. Garner added that DDCR is addressing challenges in outreach and hiring that would allow the MTA to move forward. Additionally, Ms. Moore reported that MTA-wide, 286 EEO complaints were handled between January and March 2014, citing 486 separate allegations. Of these complaints, 141 were filed with external agencies and 145 were filed internally. Of the external complaints, race/color discrimination (18%), disability discrimination (20%), and other or miscellaneous discrimination (25%) were most frequently alleged. Of the internal complaints, race/color discrimination (23%), sexual harassment (22%), and gender discrimination (16%) were most frequently alleged. Ms. Moore also reported on complaint disposition as of first quarter 2013. A total of 43 cases were closed: 18 external and 25 internal. Of the cases that were closed, two were decided in favor of the complainants, two were resolved or settled, one was withdrawn, and the rest were closed in favor of the MTA and its agencies. At MTAHQ, nine complaints were handled during the reporting period. Of these complaints, four were filed with external agencies and five were filed internally. A total of four cases were closed: one external and three internal. Of the cases that were closed, two were decided in favor of MTAHQ and two were settled. A total of 45 Title VI complaints were handled MTA-wide, of which 80% alleged race discrimination. With respect to complaint disposition, nine cases were closed, all in favor of MTA agencies. No Title VI complaints were filed at MTAHQ. Ms. Moore also provided a comparison of EEO and Title VI complaints handled for the period 2011 through 2013. Chairman Molloy asked why the number of complaints has increased. Ms. Metzger said more employees are aware of their rights to file a complaint. Ms. Moore said more employees are aware of the internal and external complaint procedures and are using them to file complaints; these complaints are taken seriously.
Master Page # 5 of 64 - Diversity Committee Meeting 9/22/2014________________________________________________________________________________
�MTA�Diversity�Committee�Meeting�Minutes,�Monday,�July�28,�2014���
�������
MTA Agency Presidents’ Reports on Recruitment Strategies The Agency presidents, Ms. Crawford, and Chief Coan each made presentations to the committee. The presentations are contained in the Committee book. Each presenter outlined challenges in female and minority recruitment and strategies to address underutilization at each Agency, at MTAHQ and at MTAPD, respectively. Ms. Crawford said that working closely with DDCR, MTA Human Resources is developing and implementing a number of strategies to improve underutilization at MTAHQ. MTA recently appointed a director for all-Agency veteran recruitment and staffing initiatives, who will organize attendance at job fairs, and who will assist veterans in learning about and applying for positions throughout the MTA agencies. Human Resources will work closely with DDCR to identify positions where female and minority groups are underutilized, and to find new sources for those job categories where underutilization exists. Human Resources is also working with DDCR to establish an outreach and recruitment budget. Mr. Garner added that another strategy is to create a paid college internship program. He has been having discussions with the Chairman and Board members about funding this program. Chief Coan said MTAPD works closely with MTA Human Resources in recruitment. MTAPD will also work with MTA’s director for all agency veteran recruitment and staffing initiatives. Mr. Ferrer asked how candidates are selected from the pool of applicants who have passed the entry level competitive examination for MTA police officer. Ms. Crawford said applicants who pass the examination are placed in a pool. Candidates from this pool are selected on a random basis by a computer. Mr. Ferrer asked how candidates are selected for ranks of sergeants and above. Ms. Crawford said police officers take the promotional examination for the position of sergeant, and sergeants take the promotional examination for the position of lieutenant. The examination is graded and a list is established. Mr. Ferrer asked if the applicants are ranked. Ms. Crawford replied that yes, they are ranked. Mr. Bianco reaffirmed NYC Transit’s commitment to diversity. He said that while NYC Transit has a very diverse workforce, females and Hispanics are underutilized in various job categories. NYC Transit has conducted focused outreach to address underutilization of these groups. Mr. Bianco added that based on the availability figures from the 2010 Census, Native Hawaiian and Other Pacific Islanders (“NHOPIs”) are also underutilized in various job categories. NYC Transit is exploring ways to address underutilization of NHOPIs. A steering committee has been established, coordinated by Mr. Bianco and Mr. Irick, to develop and implement a comprehensive diversity and inclusion plan at NYC Transit and MTA Bus. Mr. Bianco will provide future updates to the Committee about the development and implementation of this plan. Mr. Bianco said he and his leadership team continue to make efforts to increase inclusion and diversity. Mr. Irick shared Mr. Bianco’s commitment to diversity. MTA Bus workforce composition is as follows: 12% female, and 71% minority, including 43% black, 19% Hispanic, 6% Asian, and 4% other groups. Females, Hispanics, Asians and NHOPIs are underutilized in various job categories. MTA Bus has implemented a three-prong approach to increase diversity: executive management awareness, improved public outreach, and workforce development. MTA Bus works closely with senior
Master Page # 6 of 64 - Diversity Committee Meeting 9/22/2014________________________________________________________________________________

�MTA�Diversity�Committee�Meeting�Minutes,�Monday,�July�28,�2014���
�������
management to promote inclusion and diversity. In public outreach, MTA Bus partners with colleges and community organizations to ensure diversity of applicant pool. A workforce development team focuses on increasing skill levels to ensure employees achieve their full potential. MTA Bus is making progress in addressing underutilization of females and minorities within its workforce. Minorities are 87%, and females are 20% of new hires for the first quarter of 2014. Mr. Nowakowski also affirmed LIRR’s commitment to diversity. At LIRR, there is underutilization of females, blacks, Hispanics, American Indians/Alaskan Natives, NHOPIs and Others in various job categories. Improvements have been made in addressing underutilization. Outreach efforts have included attendance at community-based and veterans job fairs, posting vacancies at military websites, recruitment at colleges, and attending high school career events. LIRR is also making special efforts to higher veterans. Vacancies are announced through the social media and professional websites. Later this year, LIRR will post vacancies at stations and terminals. LIRR also conducts resume writing and interview skills workshops to prepare employees for career advancement. LIRR’s 2014 Summer Internship Program is quite diverse; over 80% of interns are females and/or minorities. Mr. Giulietti also reaffirmed MNR’s commitment to diversity. He said MNR hires the best candidates available from a diverse pool of applicants. He said that of MNR’s workforce, 13% are females, 27% are black, 9% are Hispanic, 3% are Asian, 2% are Other. There is underutilization of females, Hispanics, Asians, and Others in various job categories. MNR is currently in the process of hiring over 850 employees, and is engaged in aggressive outreach efforts to diversify its workforce. The three-year comparison of new hires from 2011 to 2013 shows an increase in the number of females and most minority groups. MNR has also increased the representation of females and Hispanics in its internship program. Through its Associate Engineer and mentoring programs, MNR has sought to diversify its workforce. MNR also seeks to promote employees from within its organization. It assists employees through career advisement, and resume writing and interview skills workshops. Mr. Garner said that he looks forward to working with MNR. Dr. Horodniceanu also reaffirmed CC’s commitment to diversity. Of CC’s workforce, 31% are females and 50% are minority. Hispanics, NHOPIs and Others are underutilized in various job categories. Although its hiring needs are limited, CC does engage in targeted recruitment and outreach to address underutilization. In order to address the underutilization of Hispanics, CC has acquired membership in Hispanic professional associations, i.e., Hispanic Latino Professional Association (“HLPA”) and LATCareers. CC posts its vacancies on these associations’ websites, and has access to their resume data base. Dr. Horodniceanu said CC will work with DDCR to identify positions where females and minorities are underutilized, and resources for addressing underutilization. Dr. Horodniceanu said he strongly supports paid internships for college students. Mr. Ferrara also reaffirmed B&T’s commitment to diversity. While B&T has made progress, some underutilization remains. Females, Hispanics, American Indians/Alaskan Natives, NHOPIs, and Others are underutilized in various categories. Mr. Ferrara said B&T’s Management Associates Program is a vehicle for addressing underutilization. The objective of this program is to select candidates from a diverse pool for entry level positions and mentor them for higher level positions. B&T expects to double the number of associates in the program from five to 10. B&T will also expand
Master Page # 7 of 64 - Diversity Committee Meeting 9/22/2014________________________________________________________________________________
�MTA�Diversity�Committee�Meeting�Minutes,�Monday,�July�28,�2014���
�������
its paid summer internship program. This summer B&T hired 62 interns, the most it has hired. Of this year’s summer interns, 66% are minority. The summer interns worked in all departments of B&T. In addition, B&T attends job fairs to target females, minorities and veterans. Its employees speak at colleges and technical schools. A Civil Service examination for B&T Officer will be offered in early 2015. B&T will engage in outreach to ensure a diverse applicant pool for this examination. Mr. Ferrer asked why availability numbers were different from agency to agency. Mr. Giulietti said the availability numbers are derived from the service area and where employees reside. He said Agencies are not measured against the same availability pool. Mr. Din said that the availability numbers are derived from each agency’s recruitment area; agencies have different recruitment areas. Mr. Ferrer said it is confusing to see different availability numbers for agencies that use the same recruitment area. Ms. Moore said availability is determined by looking at Census figures for particular job groups within job categories for a particular recruitment area. Ms. Metzger said a report describing each agency’s recruitment area would be helpful. MTA DBE Goal Plan Mr. Din presented MTA’s overall Goal Plan for Disadvantaged Business Enterprise (“DBE”) participation in Agency-wide federally funded contracts and procurements for the next three Federal Fiscal Years (“FFYs”), 2015-2017. The Goal Plan needs to be submitted to the Federal Transit Administration (“FTA”) by August 1, 2014. While the FTA does not approve MTA’s DBE goal, it approves the methodology used to determine the goal. MTA has established a goal of 17% DBE participation, which is the same as the goal for last three FFYs. Mr. Din said MTA’s DBE goal is at best an estimate, since MTA’s Five-Year Capital Program, covering calendar years 2015-2019, is pending approval. This Capital Program will cover MTA’s federally funded projects for FFYs 2015-2017. Upon approval of MTA’s Capital Program, DDCR will reassess MTA’s DBE goal and its rationale to determine if any adjustment is warranted. A two-step process is used to determine the expected level of DBE participation. First, a “Base Figure” of DBE availability is established. This entails dividing the number of available DBEs which can perform the types of contracts MTA Agencies anticipate awarding by the total number of all firms which can perform the types of contracts MTA Agencies anticipate awarding. The projected value of federally funded contracts subject to the goal is estimated to be approximately $5.7 billion. Contracting activity is broken down by the type of work involved, i.e., general construction, special trades, architectural and engineering services, and administrative support. Using this methodology, MTA arrived at the base figure of 17.09%. The second step is to determine if any adjustment to the Base Figure is needed. Factors considered are abilities of DBEs to undertake projects as primes, upcoming opportunities for DBE participation, level of past DBE participation, increased outreach and input from interested parties, and DBE participation in MTA’s SBFP. Considering these factors, MTA has determined that adjustment to the Base Figure is not necessary. Mr. Din said DBE participation in MTA’s federally funded projects has steadily increased from FFY 2011 through the first six months of FFY 2014. DBE participation in SBFP is at 33%, almost twice the overall DBE goal of 17%.
Master Page # 8 of 64 - Diversity Committee Meeting 9/22/2014________________________________________________________________________________
�MTA�Diversity�Committee�Meeting�Minutes,�Monday,�July�28,�2014���
�������
As required by Federal regulations, MTA engaged in a public participation process. Meetings were held with DBEs, non-DBEs, and advocacy groups. MTA received positive feedback from attendees on its goal of 17% DBE participation. Starting on June 12, 2014, MTA’s DBE goal was advertised in The New York Times, Newsday, El Diario, Minority Commerce Weekly, and The Journal News. Each publication announced a 45-day comment period. To date no comments have been received. The Committee unanimously approved MTA’s DBE goal and forwarded it to the full MTA Board for approval. Adjournment Chairman Molloy concluded the meeting and upon a motion duly made and seconded, the meeting was adjourned.
Respectfully submitted, Naeem Din Department of Diversity and Civil Rights
Master Page # 9 of 64 - Diversity Committee Meeting 9/22/2014________________________________________________________________________________
2014 Diversity Committee Work Plan
I. RECURRING AGENDA ITEMS Responsibility Approval of Minutes Committee Chair & Members Committee Work Plan Committee Chair & Members
MTA Agency-wide Business and Diversity Initiatives and EEO Programs Activities Dept. of Diversity/Civil Rights
MTA DBE Certification Program Activities Dept. of Diversity/Civil Rights M/W/DBE Contract Compliance Activities Dept. of Diversity/Civil Rights Action Items (if any) As listed
II. SPECIFIC AGENDA ITEMS Responsibility March 2014 Recommitment to EEO Policy Statements Dept. of Diversity/Civil Rights 2014 Departmental Goals 2013 Year-End Report on EEO May 2014 1st Quarter 2014 Report Dept. of Diversity/Civil Rights Approval of MTA’s Title VI Program Committee Chairs & Members July 2014 1st Quarter 2014 Report on EEO Dept. of Diversity/Civil Rights EEO Program Update Recruitment Strategies for MTAHQ and Dept. of Diversity/Civil Rights MTA Agencies and Agency Staff Approval of MTA’s Overall DBE Goal for Committee Chair & Members Federal Fiscal Years (“FFYs”) 2015-2017 September 2014 2nd Quarter 2014 Report November 2014 3rd Quarter 2014 Report Dept. of Diversity/Civil Rights Status Report on MTA Inter-Agency M/W/DBE Task Force Diversity Committee Charter Review Committee Chair & Members 2015 Diversity Committee Work Plan Dept. of Diversity & Civil Rights
Master Page # 10 of 64 - Diversity Committee Meeting 9/22/2014________________________________________________________________________________
2014 Diversity Committee Work Plan Detailed Summary I. RECURRING Approval of Minutes
Approval of the official proceedings of the previous month’s Committee meeting. Diversity Committee Work Plan
An update of any edits and/or changes in the work plan. MTA Agency-wide Business and Diversity Initiatives Program Activities
The MTA Department of Diversity and Civil Rights update of planned Agency-wide Business and Diversity Initiatives Programs activities. MTA Agency-wide EEO Program Activities The MTA Department of Diversity and Civil Rights update of agency-wide workforce analysis, new hires and EEO and Title VI complaints. MTA DBE Certification Program Activities
MTA Department of Diversity and Civil Rights update of DBE Certification Program activities. M/W/DBE Contract Compliance Activities MTA Department of Diversity and Civil Rights update of M/W/DBE contract activities and program initiatives. Action Items
Staff summary documents presented to the Board for approval of items affecting business standards and practices. II. SPECIFIC AGENDA ITEMS March 2014 Recommitment to EEO Policy Statements Each year, the MTA disseminates Policy Statements addressing the Americans with Disabilities Act, Sexual and Other Discriminatory Harassment Prevention and Equal Employment Opportunity. We disseminate these Policy Statements to all MTA employees to reaffirm MTA’s commitment to ensuring a work place environment free from illegal discrimination and to ensure continued compliance with all applicable laws. Overview of 2014 MTA Department of Diversity/Civil Rights Departmental Goals The MTA Department of Diversity and Civil Rights will present an overview of Departmental goals and objectives. 2013 Year-End Report on EEO
Master Page # 11 of 64 - Diversity Committee Meeting 9/22/2014________________________________________________________________________________
The Department of Diversity and Civil Rights will present an update on MTA Agency-wide EEO activities. May 2014 1st Quarter 2014 Report The Department of Diversity and Civil Rights will present an update on Business and Diversity Initiatives. The Department of Diversity and Civil Rights will also present an update on DBE Certification and M/W/DBE Contract Compliance Programs activities. Approval of MTA’s Title VI Program The Department of Diversity and Civil Rights will present MTA’s Title VI Program for approval of the Diversity Committee. July 2014 1st Quarter 2014 Report on EEO The Department of Diversity and Civil Rights will present an update on EEO Program activities. The Department of Diversity and Civil Rights, MTA Human Resources and agency staff will present a report on recruitment strategies for MTAHQ and MTA agencies. EEO Program Update The MTA Department of Diversity and Civil Rights will present an update on the EEO Program. Approval of MTA’s DBE Goal for FFY 2015-2017 In addition, the Department of Diversity and Civil Rights will present MTA’s overall DBE Goal for FFYs 2015-2017 for approval of the Diversity Committee. September 2014 2nd Quarter 2014 Report The Department of Diversity and Civil Rights will present an update on Business and Diversity Initiatives and EEO Programs activities. The Department of Diversity and Civil Rights will also present an update on the activities of DBE Certification and M/W/DBE Contract Compliance Programs activities. November 2014 3rd Quarter 2014 Report The Department of Diversity and Civil Rights will present an update on Business and Diversity Initiatives and EEO Programs activities. The Department of Diversity and Civil Rights will also present an update on the activities of DBE Certification and M/W/DBE Contract Compliance Programs activities.
Master Page # 12 of 64 - Diversity Committee Meeting 9/22/2014________________________________________________________________________________
Status Report on MTA Inter-Agency M/W/DBE Task Force The Department of Diversity and Civil Rights report will address progress made by the Task Force to improve M/W/DBE participation. Diversity Committee Charter Review The Diversity Committee will review and assess the adequacy of its charter and recommend changes as necessary. 2015 Diversity Committee Work Plan The Department of Diversity and Civil Rights will present an updated Diversity Committee Work Plan for 2015.
Master Page # 13 of 64 - Diversity Committee Meeting 9/22/2014________________________________________________________________________________
MTA DEPARTMENT OF DIVERSITY AND CIVIL RIGHTS
BUSINESS AND DIVERSITY INITIATIVES
September 22, 2014
Master Page # 14 of 64 - D
iversity Com
mittee M
eeting 9/22/2014________________________________________________________________________________
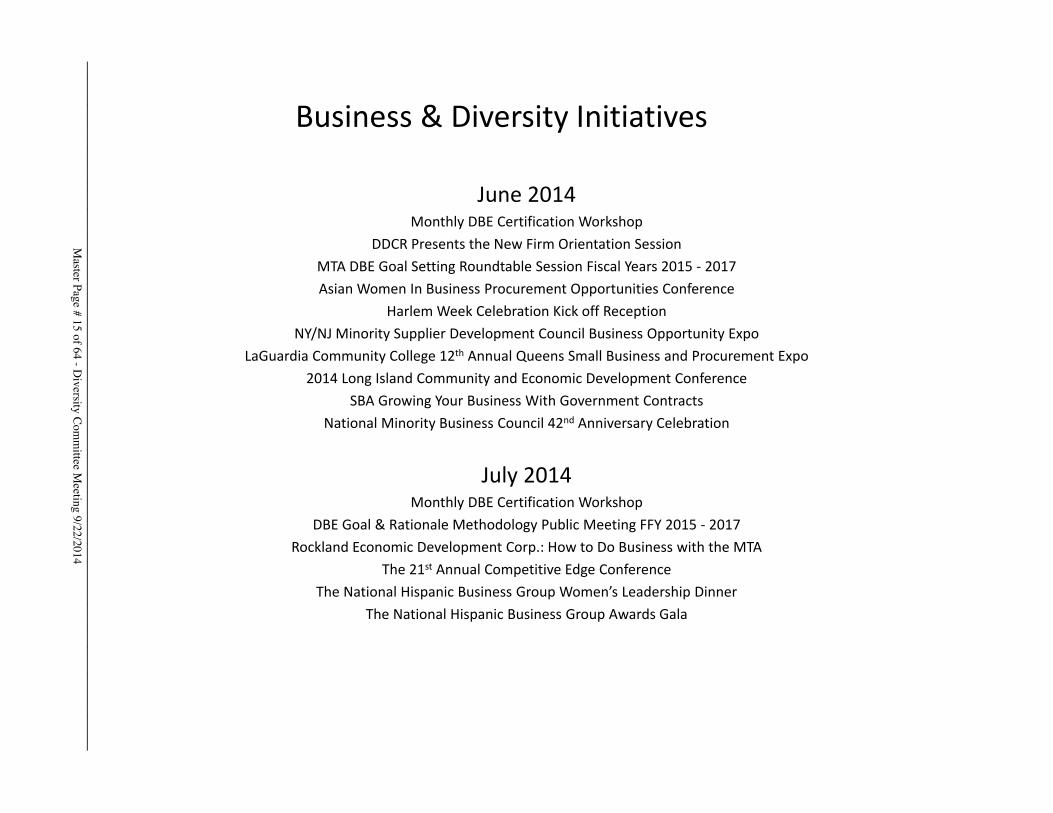
Business�&�Diversity�Initiatives
June�2014Monthly�DBE�Certification�Workshop
DDCR�Presents�the�New�Firm�Orientation�SessionMTA�DBE�Goal�Setting�Roundtable�Session�Fiscal�Years�2015�Ͳ 2017Asian�Women�In�Business�Procurement�Opportunities�Conference
Harlem�Week�Celebration�Kick�off�ReceptionNY/NJ�Minority�Supplier�Development�Council�Business�Opportunity�Expo
LaGuardia�Community�College�12th Annual�Queens�Small�Business�and�Procurement�Expo2014�Long�Island�Community�and�Economic�Development�Conference
SBA�Growing�Your�Business�With�Government�ContractsNational�Minority�Business�Council�42nd Anniversary�Celebration
July�2014Monthly�DBE�Certification�Workshop
DBE�Goal�&�Rationale�Methodology�Public�Meeting�FFY�2015�Ͳ 2017Rockland�Economic�Development�Corp.:�How�to�Do�Business�with�the�MTA
The�21st Annual�Competitive�Edge�ConferenceThe�National�Hispanic�Business�Group�Women’s�Leadership�Dinner
The�National�Hispanic�Business�Group�Awards�Gala
Master Page # 15 of 64 - D
iversity Com
mittee M
eeting 9/22/2014________________________________________________________________________________
MTA Department of Diversity/Civil RightsCertification Activity Report
September 22, 2014
Master Page # 16 of 64 - D
iversity Com
mittee M
eeting 9/22/2014________________________________________________________________________________
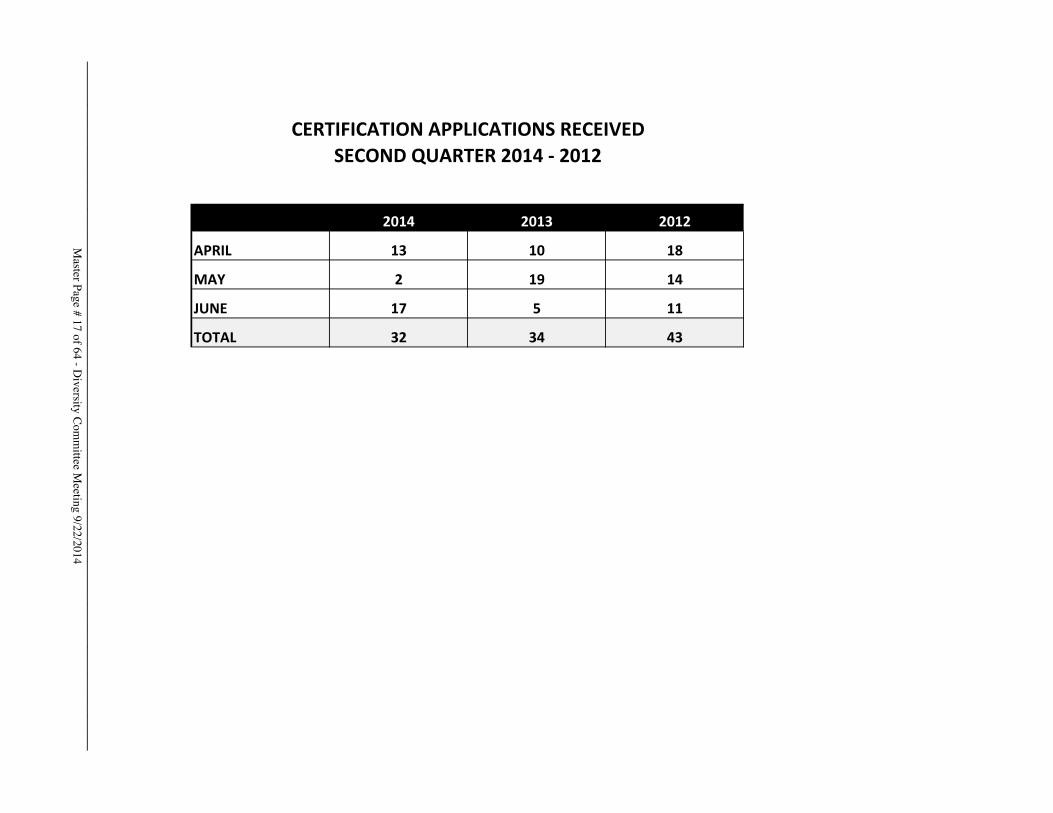
2014 2013 2012
APRIL 13 10 18
MAY 2 19 14
JUNE 17 5 11
TOTAL 32 34 43
SECOND�QUARTER�2014�Ͳ�2012CERTIFICATION�APPLICATIONS�RECEIVED
Master Page # 17 of 64 - D
iversity Com
mittee M
eeting 9/22/2014________________________________________________________________________________
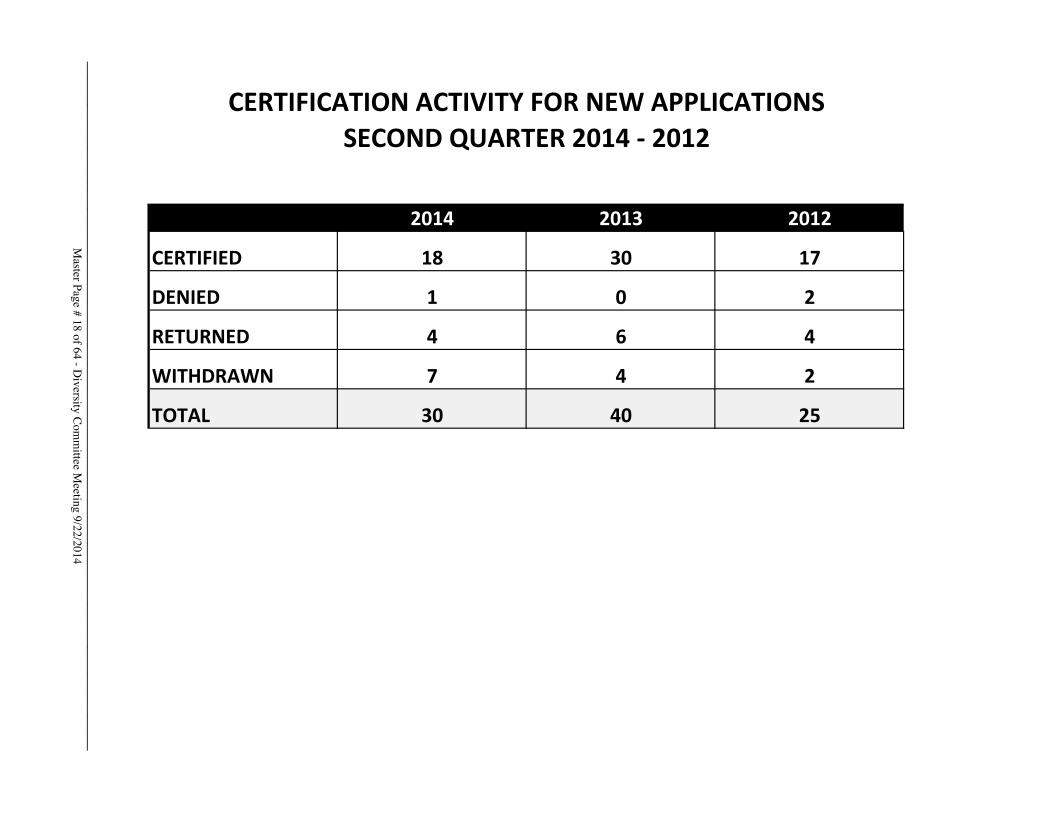
2014 2013 2012
CERTIFIED 18 30 17
DENIED 1 0 2
RETURNED 4 6 4
WITHDRAWN 7 4 2
TOTAL 30 40 25
CERTIFICATION�ACTIVITY�FOR�NEW�APPLICATIONSSECOND�QUARTER�2014�Ͳ�2012
Master Page # 18 of 64 - D
iversity Com
mittee M
eeting 9/22/2014________________________________________________________________________________
MTA DEPARTMENT OF DIVERSITY/ CIVIL RIGHTS EEO ACTIVITIES
SECOND QUARTER 2014
September 22, 2014
Master Page # 19 of 64 - D
iversity Com
mittee M
eeting 9/22/2014________________________________________________________________________________
MTA and its Agencies have conducted an availability analysis of females andminorities. The availability analysis consists of comparing each agency’s June30, 2014 workforce percentages for females and minorities to 80% of thefemales and minorities available for work within the relevant labor marketbased on the Census.
The following numbers and information do not reflect availability for specificjob groups. In addition, the numbers and information provided do not showstatistical disparities or explain the reasons or provide a root cause analysisfor any identified underutilization. Terms such as “exceed, at or below 80% ofCensus availability” or “underutilization” that may appear in this report donot constitute a finding or admission of unlawful discrimination. Although theMTA will use such terms in good faith in this report, it cautions that theseterms should not be applied outside the report’s narrow context.
OVERVIEW
Master Page # 20 of 64 - D
iversity Com
mittee M
eeting 9/22/2014________________________________________________________________________________
In general, as of June 30, 2014, females, Hispanics and employees classified asOthers were underrepresented in some of the job categories at the operatingagencies. A majority of the underrepresentation within these groups occurredwithin the Administrative Support, Skilled Craft and Service Maintenance jobcategories. These job categories have the highest number of employees at theoperating agencies.
The following charts provide: 1) the female and minority workforcepercentages for each agency; 2) 80% of the females and minorities availablefor work based on the 2010 Census by job category; and 3) whether or not theestimated availability percentages were met for females and minorities withineach of the job categories.
SUMMARY�OF�FINDINGS
Master Page # 21 of 64 - D
iversity Com
mittee M
eeting 9/22/2014________________________________________________________________________________
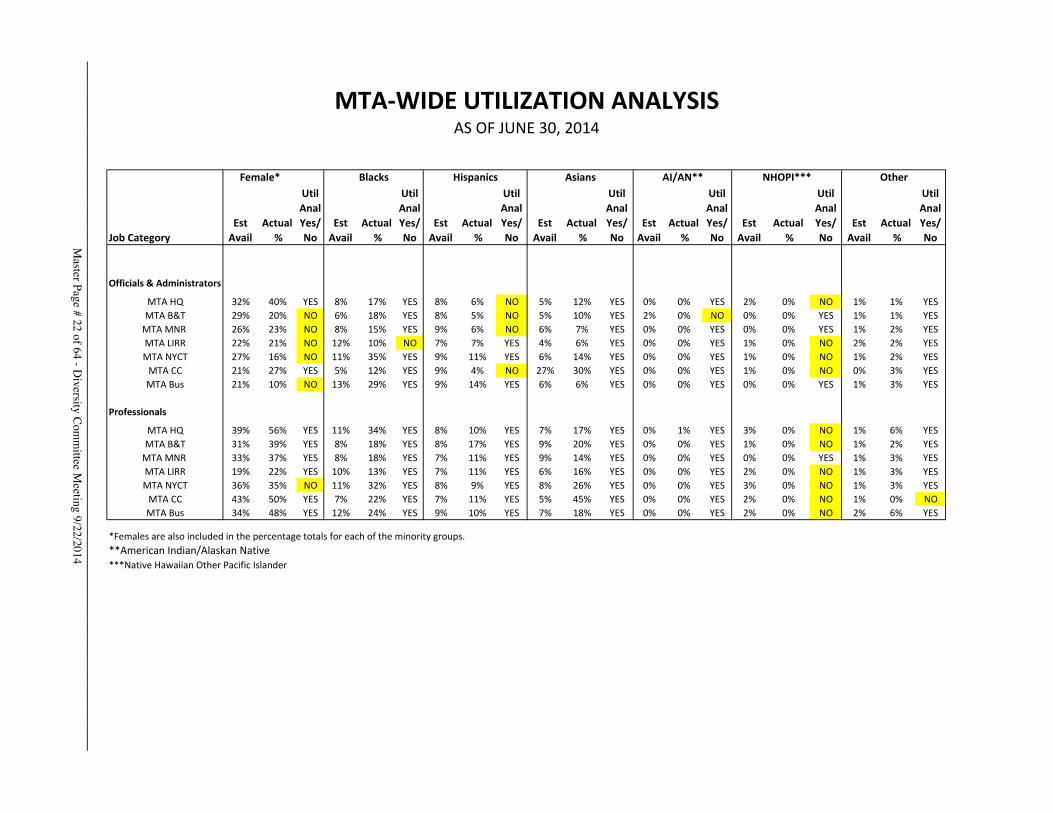
MTAͲWIDE�UTILIZATION�ANALYSISAS�OF�JUNE�30,�2014
Job�CategoryEst�Avail
Actual�%
Util�Anal�Yes/No
Est�Avail
Actual�%
Util�Anal�Yes/No
Est�Avail
Actual�%
Util�Anal��Yes/No
Est�Avail
Actual�%
Util�Anal��Yes/No
Est�Avail
Actual�%
Util�Anal��Yes/No
Est�Avail
Actual�%
Util�Anal��Yes/No
Est�Avail
Actual�%
Util�Anal��Yes/No
Officials�&�Administrators
MTA�HQ 32% 40% YES 8% 17% YES 8% 6% NO 5% 12% YES 0% 0% YES 2% 0% NO 1% 1% YES
MTA�B&T 29% 20% NO 6% 18% YES 8% 5% NO 5% 10% YES 2% 0% NO 0% 0% YES 1% 1% YES
MTA�MNR� 26% 23% NO 8% 15% YES 9% 6% NO 6% 7% YES 0% 0% YES 0% 0% YES 1% 2% YES
MTA�LIRR 22% 21% NO 12% 10% NO 7% 7% YES 4% 6% YES 0% 0% YES 1% 0% NO 2% 2% YES
MTA�NYCT 27% 16% NO 11% 35% YES 9% 11% YES 6% 14% YES 0% 0% YES 1% 0% NO 1% 2% YES
MTA�CC 21% 27% YES 5% 12% YES 9% 4% NO 27% 30% YES 0% 0% YES 1% 0% NO 0% 3% YES
MTA�Bus 21% 10% NO 13% 29% YES 9% 14% YES 6% 6% YES 0% 0% YES 0% 0% YES 1% 3% YES
Professionals
MTA�HQ 39% 56% YES 11% 34% YES 8% 10% YES 7% 17% YES 0% 1% YES 3% 0% NO 1% 6% YES
MTA�B&T 31% 39% YES 8% 18% YES 8% 17% YES 9% 20% YES 0% 0% YES 1% 0% NO 1% 2% YES
MTA�MNR� 33% 37% YES 8% 18% YES 7% 11% YES 9% 14% YES 0% 0% YES 0% 0% YES 1% 3% YES
MTA�LIRR 19% 22% YES 10% 13% YES 7% 11% YES 6% 16% YES 0% 0% YES 2% 0% NO 1% 3% YES
MTA�NYCT 36% 35% NO 11% 32% YES 8% 9% YES 8% 26% YES 0% 0% YES 3% 0% NO 1% 3% YES
MTA�CC 43% 50% YES 7% 22% YES 7% 11% YES 5% 45% YES 0% 0% YES 2% 0% NO 1% 0% NO
MTA�Bus 34% 48% YES 12% 24% YES 9% 10% YES 7% 18% YES 0% 0% YES 2% 0% NO 2% 6% YES
**American�Indian/Alaskan�Native***Native�Hawaiian�Other�Pacific�Islander
NHOPI*** Other
*Females�are�also�included�in�the�percentage�totals�for�each�of�the�minority�groups.
Female* Hispanics Asians AI/AN**Blacks
Master Page # 22 of 64 - D
iversity Com
mittee M
eeting 9/22/2014________________________________________________________________________________
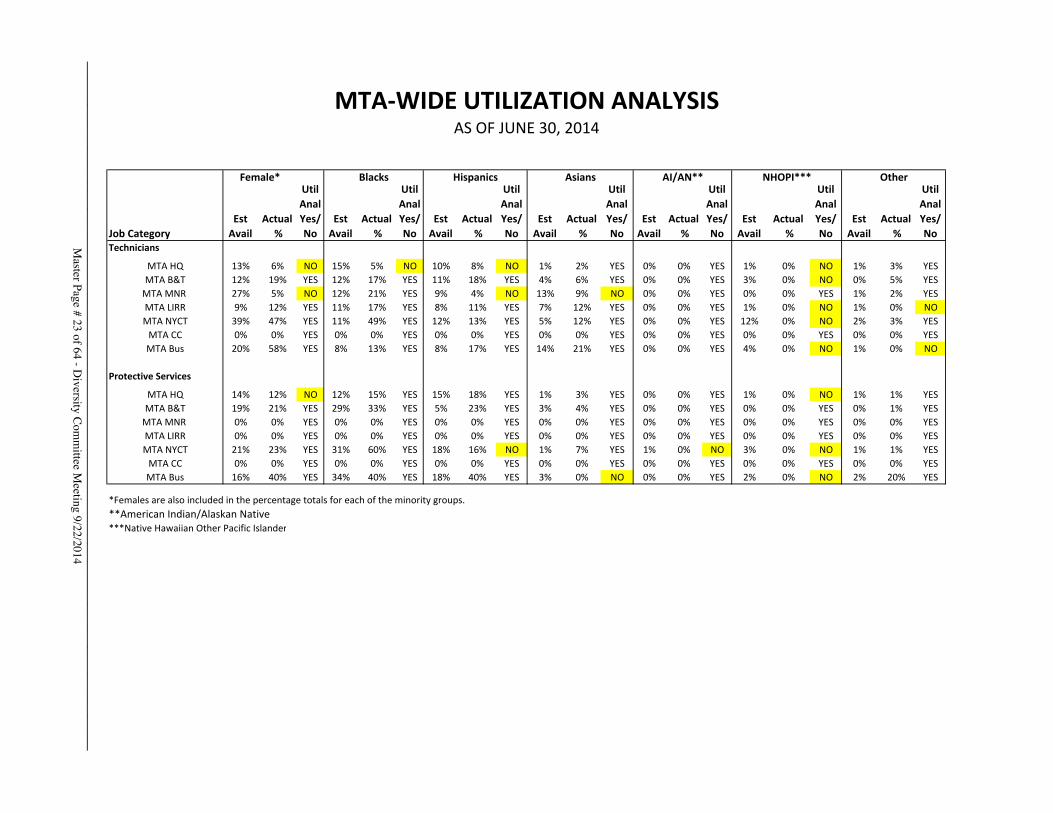
MTAͲWIDE�UTILIZATION�ANALYSISAS�OF�JUNE�30,�2014
Job�CategoryEst�Avail
Actual�%
Util�Anal�Yes/No
Est�Avail
Actual�%
Util�Anal�Yes/No
Est�Avail
Actual�%
Util�Anal��Yes/No
Est�Avail
Actual�%
Util�Anal��Yes/No
Est�Avail
Actual�%
Util�Anal��Yes/No
Est�Avail
Actual�%
Util�Anal��Yes/No
Est�Avail
Actual�%
Util�Anal��Yes/No
Technicians
MTA�HQ 13% 6% NO 15% 5% NO 10% 8% NO 1% 2% YES 0% 0% YES 1% 0% NO 1% 3% YES
MTA�B&T 12% 19% YES 12% 17% YES 11% 18% YES 4% 6% YES 0% 0% YES 3% 0% NO 0% 5% YES
MTA�MNR� 27% 5% NO 12% 21% YES 9% 4% NO 13% 9% NO 0% 0% YES 0% 0% YES 1% 2% YES
MTA�LIRR 9% 12% YES 11% 17% YES 8% 11% YES 7% 12% YES 0% 0% YES 1% 0% NO 1% 0% NO
MTA�NYCT 39% 47% YES 11% 49% YES 12% 13% YES 5% 12% YES 0% 0% YES 12% 0% NO 2% 3% YES
MTA�CC 0% 0% YES 0% 0% YES 0% 0% YES 0% 0% YES 0% 0% YES 0% 0% YES 0% 0% YES
MTA�Bus 20% 58% YES 8% 13% YES 8% 17% YES 14% 21% YES 0% 0% YES 4% 0% NO 1% 0% NO
Protective�Services
MTA�HQ 14% 12% NO 12% 15% YES 15% 18% YES 1% 3% YES 0% 0% YES 1% 0% NO 1% 1% YES
MTA�B&T 19% 21% YES 29% 33% YES 5% 23% YES 3% 4% YES 0% 0% YES 0% 0% YES 0% 1% YES
MTA�MNR� 0% 0% YES 0% 0% YES 0% 0% YES 0% 0% YES 0% 0% YES 0% 0% YES 0% 0% YES
MTA�LIRR 0% 0% YES 0% 0% YES 0% 0% YES 0% 0% YES 0% 0% YES 0% 0% YES 0% 0% YES
MTA�NYCT 21% 23% YES 31% 60% YES 18% 16% NO 1% 7% YES 1% 0% NO 3% 0% NO 1% 1% YES
MTA�CC 0% 0% YES 0% 0% YES 0% 0% YES 0% 0% YES 0% 0% YES 0% 0% YES 0% 0% YES
MTA�Bus 16% 40% YES 34% 40% YES 18% 40% YES 3% 0% NO 0% 0% YES 2% 0% NO 2% 20% YES
**American�Indian/Alaskan�Native***Native�Hawaiian�Other�Pacific�Islander
OtherNHOPI***Female*
*Females�are�also�included�in�the�percentage�totals�for�each�of�the�minority�groups.
Hispanics Asians AI/AN**Blacks
Master Page # 23 of 64 - D
iversity Com
mittee M
eeting 9/22/2014________________________________________________________________________________
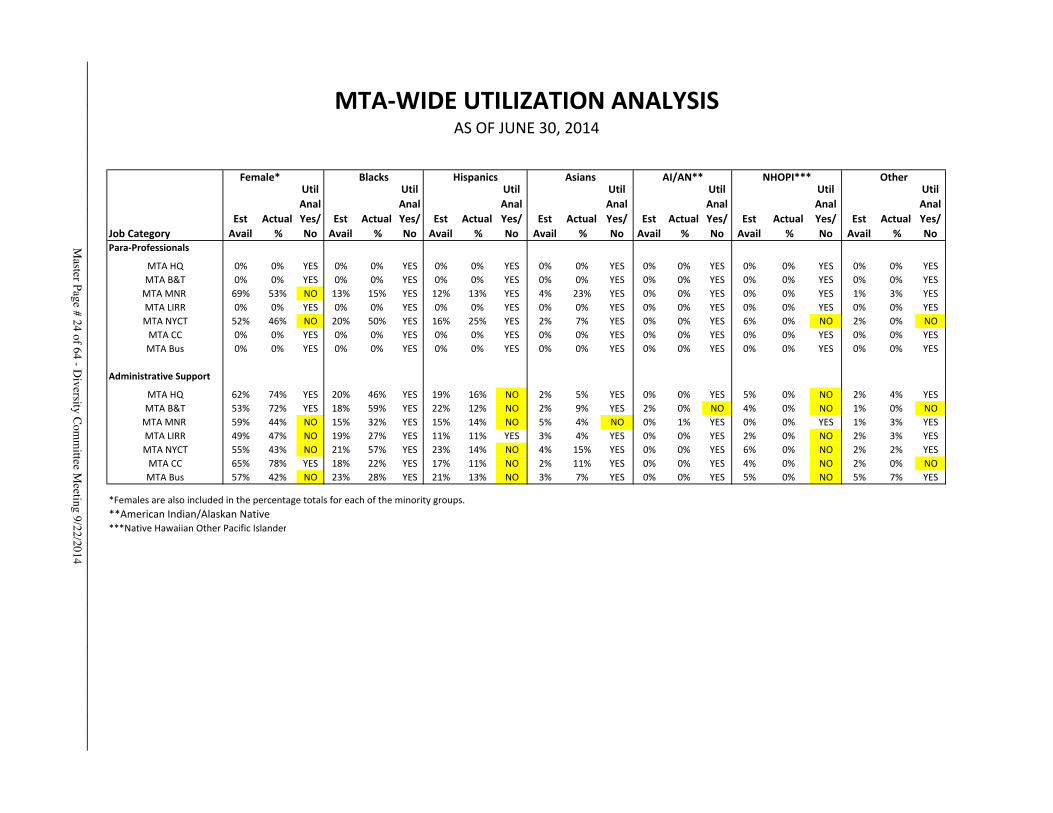
MTAͲWIDE�UTILIZATION�ANALYSISAS�OF�JUNE�30,�2014
Job�CategoryEst�Avail
Actual�%
Util�Anal�Yes/No
Est�Avail
Actual�%
Util�Anal�Yes/No
Est�Avail
Actual�%
Util�Anal��Yes/No
Est�Avail
Actual�%
Util�Anal��Yes/No
Est�Avail
Actual�%
Util�Anal��Yes/No
Est�Avail
Actual�%
Util�Anal��Yes/No
Est�Avail
Actual�%
Util�Anal��Yes/No
ParaͲProfessionals
MTA�HQ 0% 0% YES 0% 0% YES 0% 0% YES 0% 0% YES 0% 0% YES 0% 0% YES 0% 0% YES
MTA�B&T 0% 0% YES 0% 0% YES 0% 0% YES 0% 0% YES 0% 0% YES 0% 0% YES 0% 0% YES
MTA�MNR� 69% 53% NO 13% 15% YES 12% 13% YES 4% 23% YES 0% 0% YES 0% 0% YES 1% 3% YES
MTA�LIRR 0% 0% YES 0% 0% YES 0% 0% YES 0% 0% YES 0% 0% YES 0% 0% YES 0% 0% YES
MTA�NYCT 52% 46% NO 20% 50% YES 16% 25% YES 2% 7% YES 0% 0% YES 6% 0% NO 2% 0% NO
MTA�CC 0% 0% YES 0% 0% YES 0% 0% YES 0% 0% YES 0% 0% YES 0% 0% YES 0% 0% YES
MTA�Bus 0% 0% YES 0% 0% YES 0% 0% YES 0% 0% YES 0% 0% YES 0% 0% YES 0% 0% YES
Administrative�Support
MTA�HQ 62% 74% YES 20% 46% YES 19% 16% NO 2% 5% YES 0% 0% YES 5% 0% NO 2% 4% YES
MTA�B&T 53% 72% YES 18% 59% YES 22% 12% NO 2% 9% YES 2% 0% NO 4% 0% NO 1% 0% NO
MTA�MNR� 59% 44% NO 15% 32% YES 15% 14% NO 5% 4% NO 0% 1% YES 0% 0% YES 1% 3% YES
MTA�LIRR 49% 47% NO 19% 27% YES 11% 11% YES 3% 4% YES 0% 0% YES 2% 0% NO 2% 3% YES
MTA�NYCT 55% 43% NO 21% 57% YES 23% 14% NO 4% 15% YES 0% 0% YES 6% 0% NO 2% 2% YES
MTA�CC 65% 78% YES 18% 22% YES 17% 11% NO 2% 11% YES 0% 0% YES 4% 0% NO 2% 0% NO
MTA�Bus 57% 42% NO 23% 28% YES 21% 13% NO 3% 7% YES 0% 0% YES 5% 0% NO 5% 7% YES
**American�Indian/Alaskan�Native***Native�Hawaiian�Other�Pacific�Islander
NHOPI*** Other
*Females�are�also�included�in�the�percentage�totals�for�each�of�the�minority�groups.
Female* Hispanics Asians AI/AN**Blacks
Master Page # 24 of 64 - D
iversity Com
mittee M
eeting 9/22/2014________________________________________________________________________________
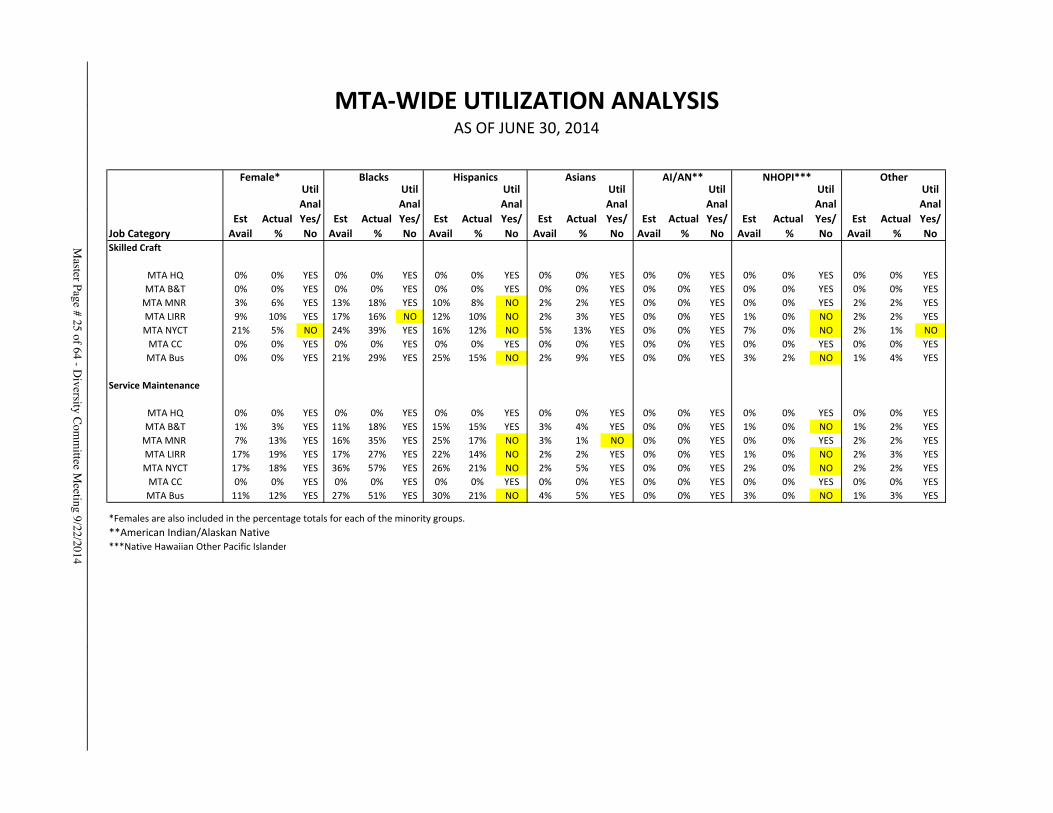
MTAͲWIDE�UTILIZATION�ANALYSISAS�OF�JUNE�30,�2014
Job�CategoryEst�Avail
Actual�%
Util�Anal�Yes/No
Est�Avail
Actual�%
Util�Anal�Yes/No
Est�Avail
Actual�%
Util�Anal��Yes/No
Est�Avail
Actual�%
Util�Anal��Yes/No
Est�Avail
Actual�%
Util�Anal��Yes/No
Est�Avail
Actual�%
Util�Anal��Yes/No
Est�Avail
Actual�%
Util�Anal��Yes/No
Skilled�Craft
MTA�HQ 0% 0% YES 0% 0% YES 0% 0% YES 0% 0% YES 0% 0% YES 0% 0% YES 0% 0% YES
MTA�B&T 0% 0% YES 0% 0% YES 0% 0% YES 0% 0% YES 0% 0% YES 0% 0% YES 0% 0% YES
MTA�MNR� 3% 6% YES 13% 18% YES 10% 8% NO 2% 2% YES 0% 0% YES 0% 0% YES 2% 2% YES
MTA�LIRR 9% 10% YES 17% 16% NO 12% 10% NO 2% 3% YES 0% 0% YES 1% 0% NO 2% 2% YES
MTA�NYCT 21% 5% NO 24% 39% YES 16% 12% NO 5% 13% YES 0% 0% YES 7% 0% NO 2% 1% NO
MTA�CC 0% 0% YES 0% 0% YES 0% 0% YES 0% 0% YES 0% 0% YES 0% 0% YES 0% 0% YES
MTA�Bus 0% 0% YES 21% 29% YES 25% 15% NO 2% 9% YES 0% 0% YES 3% 2% NO 1% 4% YES
Service�Maintenance
MTA�HQ 0% 0% YES 0% 0% YES 0% 0% YES 0% 0% YES 0% 0% YES 0% 0% YES 0% 0% YES
MTA�B&T 1% 3% YES 11% 18% YES 15% 15% YES 3% 4% YES 0% 0% YES 1% 0% NO 1% 2% YES
MTA�MNR� 7% 13% YES 16% 35% YES 25% 17% NO 3% 1% NO 0% 0% YES 0% 0% YES 2% 2% YES
MTA�LIRR 17% 19% YES 17% 27% YES 22% 14% NO 2% 2% YES 0% 0% YES 1% 0% NO 2% 3% YES
MTA�NYCT 17% 18% YES 36% 57% YES 26% 21% NO 2% 5% YES 0% 0% YES 2% 0% NO 2% 2% YES
MTA�CC 0% 0% YES 0% 0% YES 0% 0% YES 0% 0% YES 0% 0% YES 0% 0% YES 0% 0% YES
MTA�Bus 11% 12% YES 27% 51% YES 30% 21% NO 4% 5% YES 0% 0% YES 3% 0% NO 1% 3% YES
*Females�are�also�included�in�the�percentage�totals�for�each�of�the�minority�groups.**American�Indian/Alaskan�Native***Native�Hawaiian�Other�Pacific�Islander
OtherNHOPI***Female* Hispanics Asians AI/AN**Blacks
Master Page # 25 of 64 - D
iversity Com
mittee M
eeting 9/22/2014________________________________________________________________________________
MTAͲWide�New�HiresJanuary�1,�2014�to��June�30,�2014
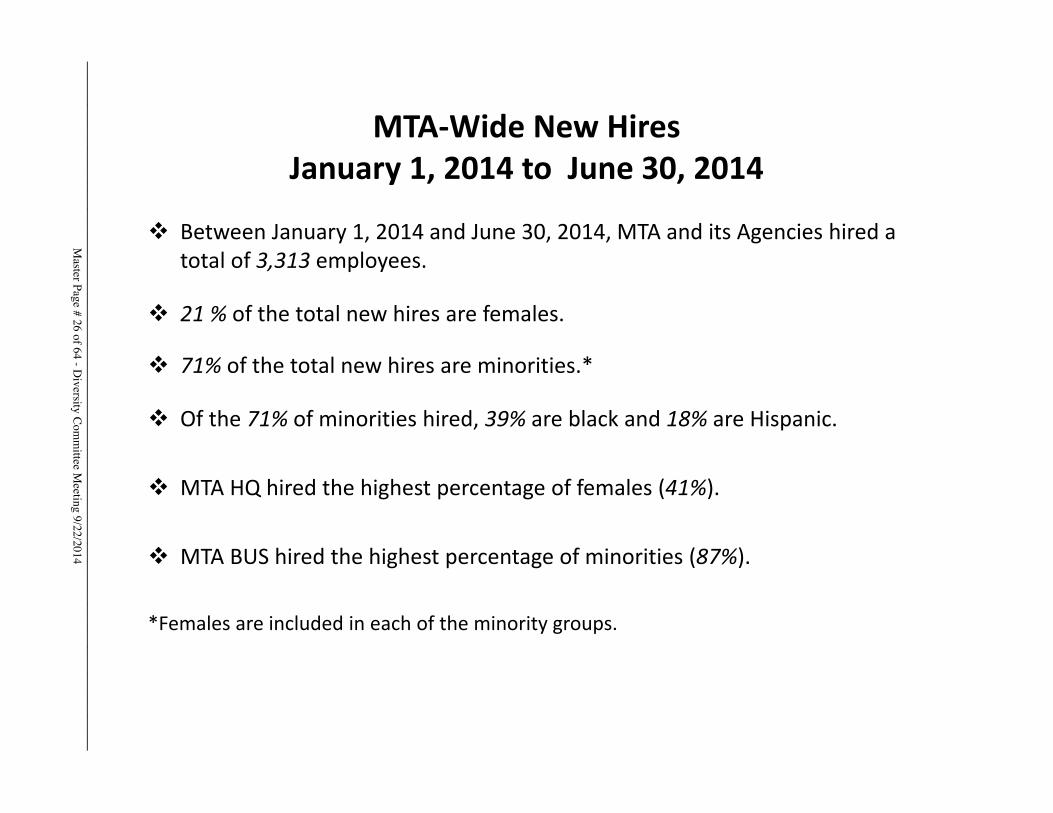
� Between�January�1,�2014�and�June�30,�2014,�MTA�and�its�Agencies�hired�a�total�of�3,313 employees.
� 21�% of�the�total�new�hires�are�females.
� 71% of�the�total�new�hires�are�minorities.*
� Of�the�71% of�minorities�hired,�39% are�black�and�18% are�Hispanic.
� MTA�HQ�hired�the�highest�percentage�of�females�(41%).
� MTA�BUS�hired�the�highest�percentage�of�minorities�(87%).
*Females�are�included�in�each�of�the�minority�groups.
Master Page # 26 of 64 - D
iversity Com
mittee M
eeting 9/22/2014________________________________________________________________________________
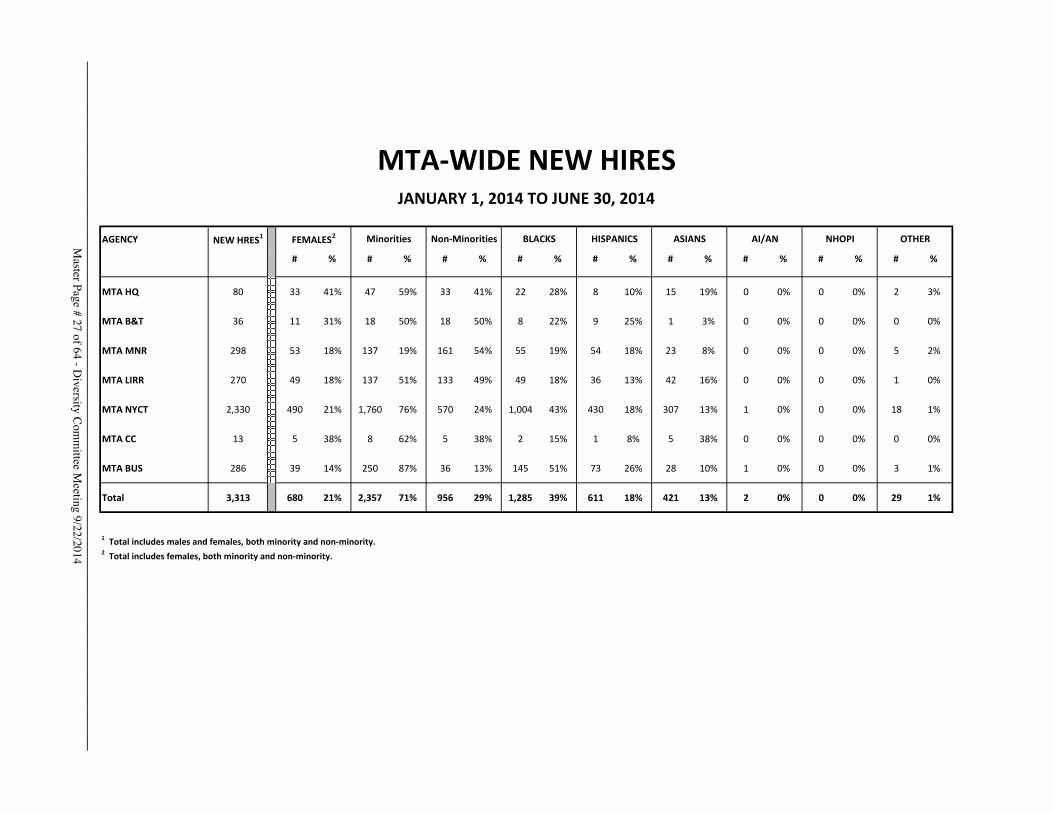
AGENCY NEW�HRES1
# % # % # % # % # % # % # % # % # %
MTA�HQ 80 33 41% 47 59% 33 41% 22 28% 8 10% 15 19% 0 0% 0 0% 2 3%
MTA�B&T 36 11 31% 18 50% 18 50% 8 22% 9 25% 1 3% 0 0% 0 0% 0 0%
MTA�MNR 298 53 18% 137 19% 161 54% 55 19% 54 18% 23 8% 0 0% 0 0% 5 2%
MTA�LIRR 270 49 18% 137 51% 133 49% 49 18% 36 13% 42 16% 0 0% 0 0% 1 0%
MTA�NYCT 2,330 490 21% 1,760 76% 570 24% 1,004 43% 430 18% 307 13% 1 0% 0 0% 18 1%
MTA�CC 13 5 38% 8 62% 5 38% 2 15% 1 8% 5 38% 0 0% 0 0% 0 0%
MTA�BUS 286 39 14% 250 87% 36 13% 145 51% 73 26% 28 10% 1 0% 0 0% 3 1%
Total 3,313 680 21% 2,357 71% 956 29% 1,285 39% 611 18% 421 13% 2 0% 0 0% 29 1%
1��Total�includes�males�and�females,�both�minority�and�nonͲminority.2��Total�includes�females,�both�minority�and�nonͲminority.
OTHER
MTAͲWIDE�NEW�HIRESJANUARY�1,�2014�TO�JUNE�30,�2014
FEMALES2 Minorities NonͲMinorities BLACKS HISPANICS ASIANS AI/AN NHOPIMaster Page # 27 of 64 - D
iversity Com
mittee M
eeting 9/22/2014________________________________________________________________________________
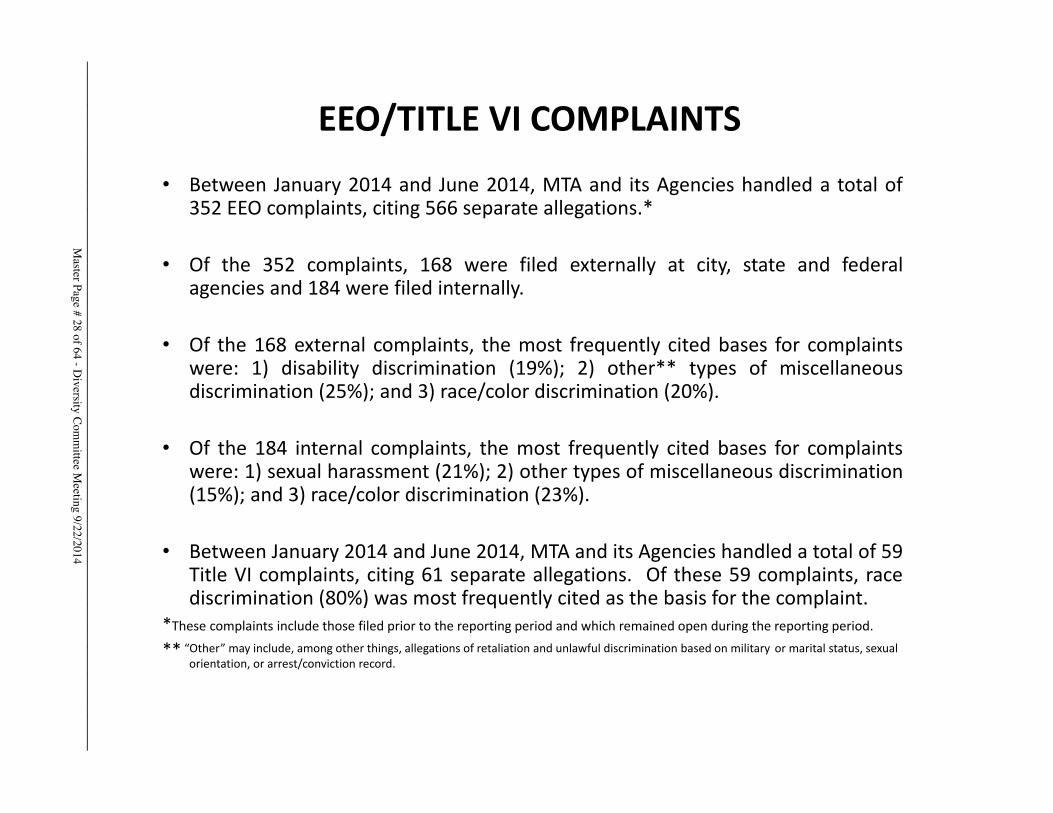
EEO/TITLE�VI�COMPLAINTS• Between January 2014 and June 2014, MTA and its Agencies handled a total of
352 EEO complaints, citing 566 separate allegations.*
• Of the 352 complaints, 168 were filed externally at city, state and federalagencies and 184 were filed internally.
• Of the 168 external complaints, the most frequently cited bases for complaintswere: 1) disability discrimination (19%); 2) other** types of miscellaneousdiscrimination (25%); and 3) race/color discrimination (20%).
• Of the 184 internal complaints, the most frequently cited bases for complaintswere: 1) sexual harassment (21%); 2) other types of miscellaneous discrimination(15%); and 3) race/color discrimination (23%).
• Between January 2014 and June 2014, MTA and its Agencies handled a total of 59Title VI complaints, citing 61 separate allegations. Of these 59 complaints, racediscrimination (80%) was most frequently cited as the basis for the complaint.
*These�complaints�include�those�filed�prior�to�the�reporting�period�and�which�remained�open�during�the�reporting�period.�
** “Other”�may�include,�among�other�things,�allegations�of�retaliation�and�unlawful�discrimination�based�on�military or�marital�status,�sexual�orientation,�or�arrest/conviction�record.�
Master Page # 28 of 64 - D
iversity Com
mittee M
eeting 9/22/2014________________________________________________________________________________
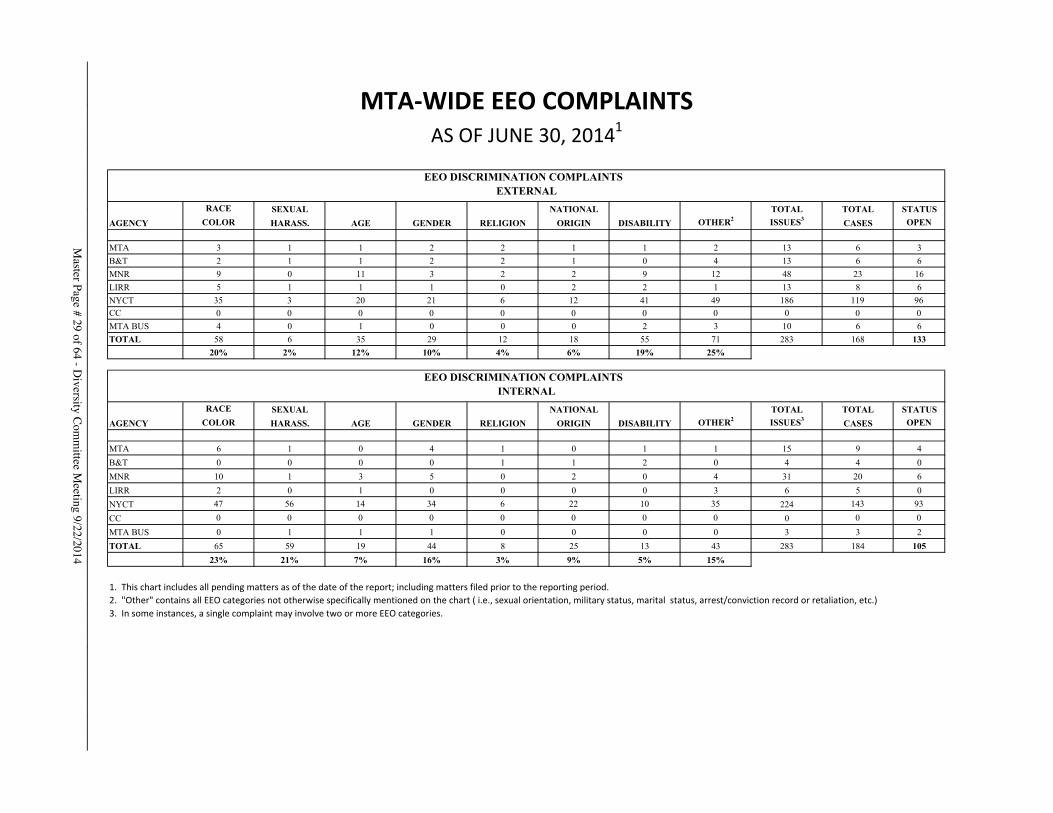
MTAͲWIDE�EEO�COMPLAINTS�AS�OF�JUNE�30,�20141
RACE SEXUAL NATIONAL TOTAL TOTAL STATUSAGENCY COLOR HARASS. AGE GENDER RELIGION ORIGIN DISABILITY OTHER2 ISSUES3 CASES OPEN
MTA 3 1 1 2 2 1 1 2 13 6 3B&T 2 1 1 2 2 1 0 4 13 6 6MNR 9 0 11 3 2 2 9 12 48 23 16LIRR 5 1 1 1 0 2 2 1 13 8 6NYCT 35 3 20 21 6 12 41 49 186 119 96CC 0 0 0 0 0 0 0 0 0 0 0MTA BUS 4 0 1 0 0 0 2 3 10 6 6TOTAL 58 6 35 29 12 18 55 71 283 168 133
20% 2% 12% 10% 4% 6% 19% 25%
RACE SEXUAL NATIONAL TOTAL TOTAL STATUSAGENCY COLOR HARASS. AGE GENDER RELIGION ORIGIN DISABILITY OTHER2 ISSUES3 CASES OPEN
MTA 6 1 0 4 1 0 1 1 15 9 4B&T 0 0 0 0 1 1 2 0 4 4 0MNR 10 1 3 5 0 2 0 4 31 20 6LIRR 2 0 1 0 0 0 0 3 6 5 0NYCT 47 56 14 34 6 22 10 35 224 143 93CC 0 0 0 0 0 0 0 0 0 0 0MTA BUS 0 1 1 1 0 0 0 0 3 3 2TOTAL 65 59 19 44 8 25 13 43 283 184 105
23% 21% 7% 16% 3% 9% 5% 15%
1.��This�chart�includes�all�pending�matters�as�of�the�date�of�the�report;�including�matters�filed�prior�to�the�reporting�period.�2.��"Other"�contains�all�EEO�categories�not�otherwise�specifically�mentioned�on�the�chart�(�i.e.,�sexual�orientation,�military�status,�marital��status,�arrest/conviction�record�or�retaliation,�etc.)3.��In�some�instances,�a�single�complaint�may�involve�two�or�more�EEO�categories.
EEO DISCRIMINATION COMPLAINTS EXTERNAL
EEO DISCRIMINATION COMPLAINTS INTERNAL
Master Page # 29 of 64 - D
iversity Com
mittee M
eeting 9/22/2014________________________________________________________________________________
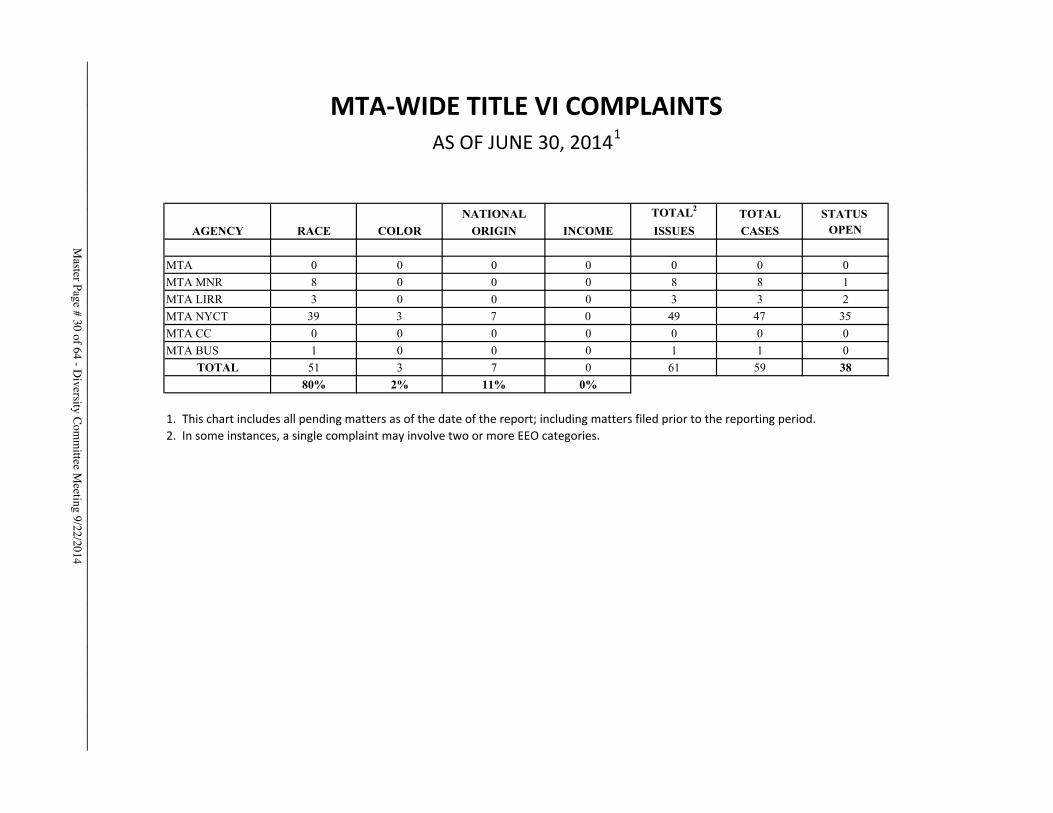
MTAͲWIDE�TITLE�VI�COMPLAINTS�AS�OF�JUNE�30,�20141
NATIONAL TOTAL2 TOTAL STATUS AGENCY RACE COLOR ORIGIN INCOME ISSUES CASES OPEN
MTA 0 0 0 0 0 0 0MTA MNR 8 0 0 0 8 8 1MTA LIRR 3 0 0 0 3 3 2MTA NYCT 39 3 7 0 49 47 35MTA CC 0 0 0 0 0 0 0MTA BUS 1 0 0 0 1 1 0
TOTAL 51 3 7 0 61 59 3880% 2% 11% 0%
1.��This�chart�includes�all�pending�matters�as�of�the�date�of�the�report;�including�matters�filed�prior�to�the�reporting�period.�2.��In�some�instances,�a�single�complaint�may�involve�two�or�more�EEO�categories.
Master Page # 30 of 64 - D
iversity Com
mittee M
eeting 9/22/2014________________________________________________________________________________
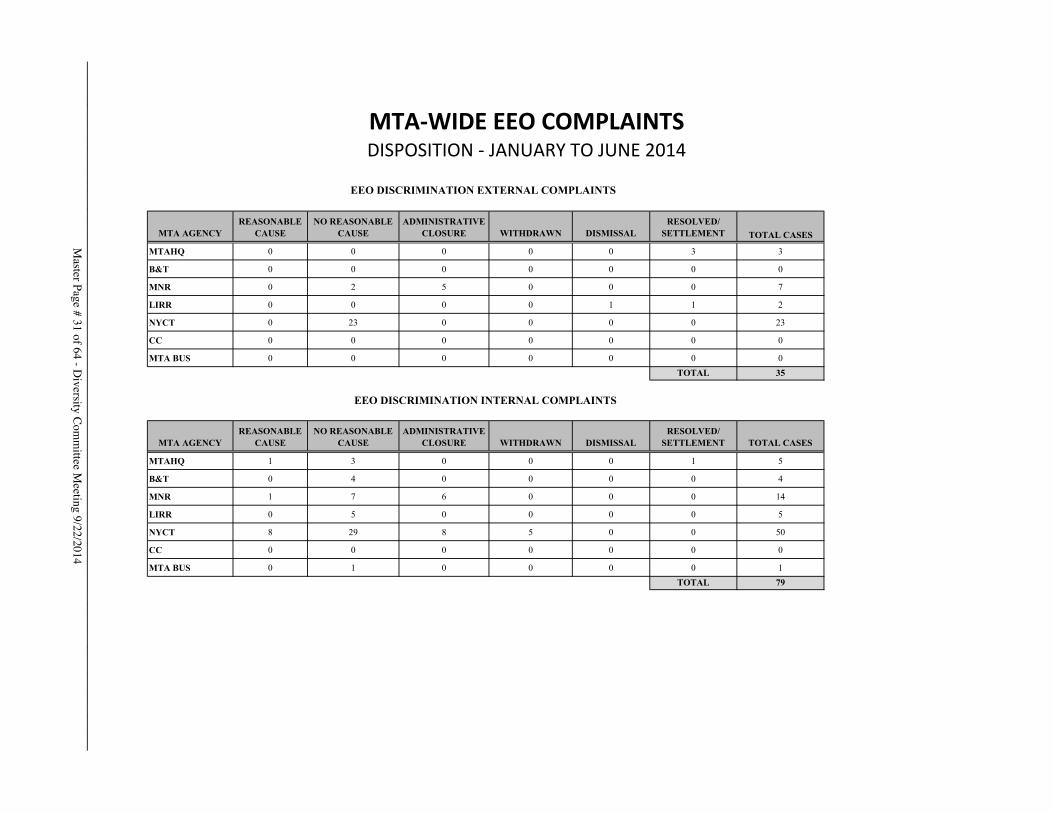
MTAͲWIDE�EEO�COMPLAINTSDISPOSITION�Ͳ�JANUARY�TO�JUNE�2014
MTA AGENCYREASONABLE
CAUSENO REASONABLE
CAUSEADMINISTRATIVE
CLOSURE WITHDRAWN DISMISSALRESOLVED/
SETTLEMENT TOTAL CASES
MTAHQ 0 0 0 0 0 3 3
B&T 0 0 0 0 0 0 0
MNR 0 2 5 0 0 0 7
LIRR 0 0 0 0 1 1 2
NYCT 0 23 0 0 0 0 23
CC 0 0 0 0 0 0 0
MTA BUS 0 0 0 0 0 0 0TOTAL 35
MTA AGENCYREASONABLE
CAUSENO REASONABLE
CAUSEADMINISTRATIVE
CLOSURE WITHDRAWN DISMISSALRESOLVED/
SETTLEMENT TOTAL CASES
MTAHQ 1 3 0 0 0 1 5
B&T 0 4 0 0 0 0 4
MNR 1 7 6 0 0 0 14
LIRR 0 5 0 0 0 0 5
NYCT 8 29 8 5 0 0 50
CC 0 0 0 0 0 0 0
MTA BUS 0 1 0 0 0 0 1TOTAL 79
EEO DISCRIMINATION EXTERNAL COMPLAINTS
EEO DISCRIMINATION INTERNAL COMPLAINTS
Master Page # 31 of 64 - D
iversity Com
mittee M
eeting 9/22/2014________________________________________________________________________________
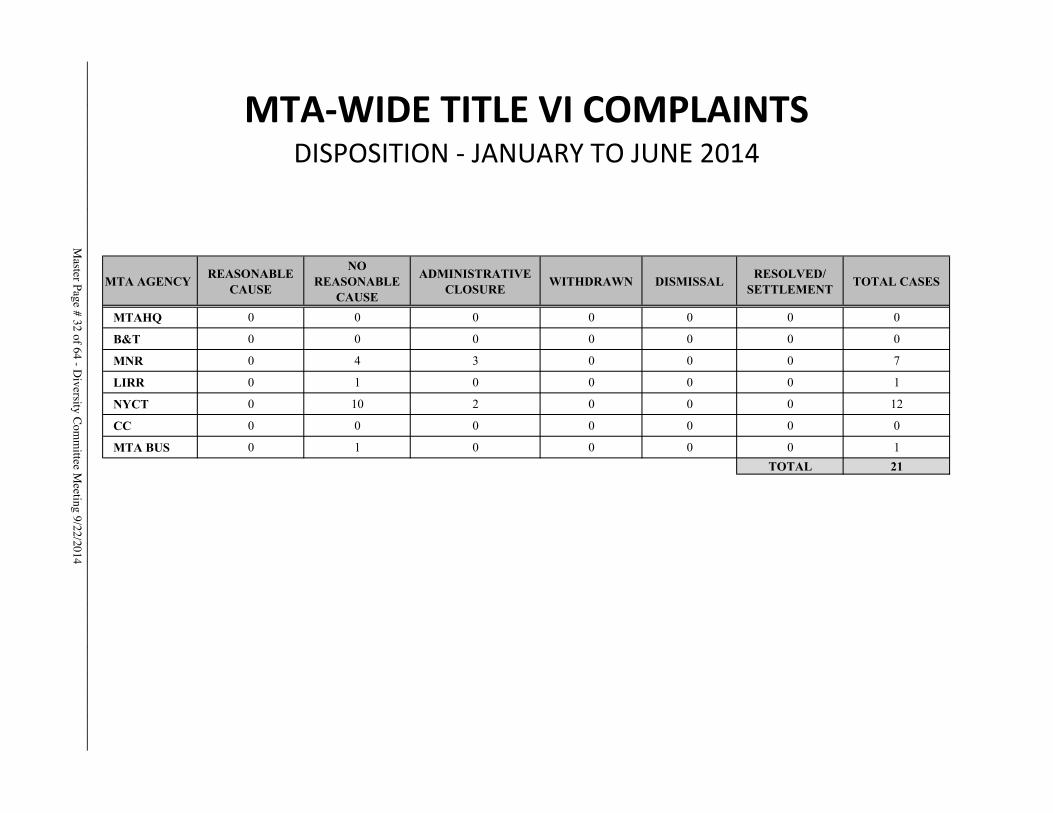
MTAͲWIDE�TITLE�VI�COMPLAINTSDISPOSITION�Ͳ�JANUARY�TO�JUNE�2014
MTA AGENCY REASONABLE CAUSE
NO REASONABLE
CAUSE
ADMINISTRATIVE CLOSURE WITHDRAWN DISMISSAL RESOLVED/
SETTLEMENT TOTAL CASES
MTAHQ 0 0 0 0 0 0 0
B&T 0 0 0 0 0 0 0
MNR 0 4 3 0 0 0 7
LIRR 0 1 0 0 0 0 1
NYCT 0 10 2 0 0 0 12
CC 0 0 0 0 0 0 0
MTA BUS 0 1 0 0 0 0 1TOTAL 21
Master Page # 32 of 64 - D
iversity Com
mittee M
eeting 9/22/2014________________________________________________________________________________
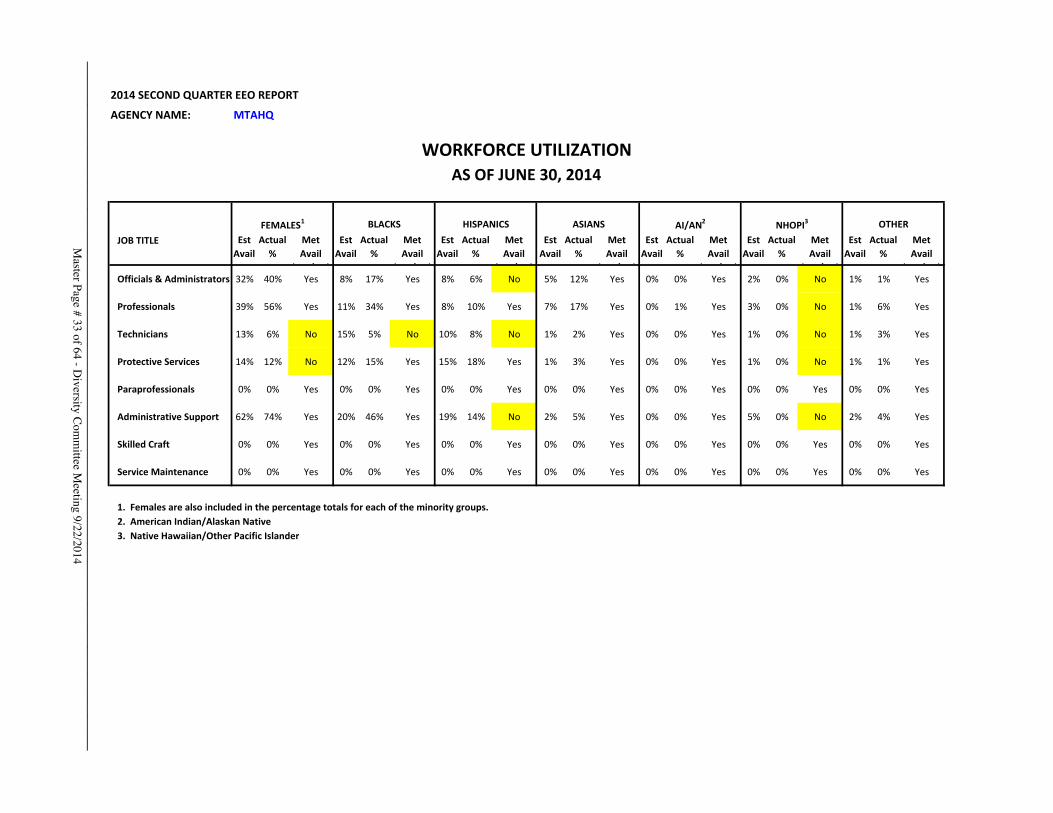
2014�SECOND�QUARTER�EEO�REPORT
AGENCY�NAME:�� MTAHQ
Est�Avail
Actual%
Met�Avail
(Y /N )
Est�Avail
Actual%
Met�Avail
(Y /N )
Est�Avail
Actual%
Met�Avail
(Y /N )
Est�Avail
Actual%
Met�Avail
(Y /N )
Est�Avail
Actual%
Met�Avail
(Y /N )
Est�Avail
Actual%
Met�Avail
(Y /N )
Est�Avail
Actual%
Met�Avail
(Y /N )Officials�&�Administrators 32% 40% Yes 8% 17% Yes 8% 6% No 5% 12% Yes 0% 0% Yes 2% 0% No 1% 1% Yes
Professionals 39% 56% Yes 11% 34% Yes 8% 10% Yes 7% 17% Yes 0% 1% Yes 3% 0% No 1% 6% Yes
Technicians 13% 6% No 15% 5% No 10% 8% No 1% 2% Yes 0% 0% Yes 1% 0% No 1% 3% Yes
Protective�Services 14% 12% No 12% 15% Yes 15% 18% Yes 1% 3% Yes 0% 0% Yes 1% 0% No 1% 1% Yes
Paraprofessionals 0% 0% Yes 0% 0% Yes 0% 0% Yes 0% 0% Yes 0% 0% Yes 0% 0% Yes 0% 0% Yes
Administrative�Support 62% 74% Yes 20% 46% Yes 19% 14% No 2% 5% Yes 0% 0% Yes 5% 0% No 2% 4% Yes
Skilled�Craft 0% 0% Yes 0% 0% Yes 0% 0% Yes 0% 0% Yes 0% 0% Yes 0% 0% Yes 0% 0% Yes
Service�Maintenance 0% 0% Yes 0% 0% Yes 0% 0% Yes 0% 0% Yes 0% 0% Yes 0% 0% Yes 0% 0% Yes
1.��Females�are�also�included�in�the�percentage�totals�for�each�of�the�minority�groups.2.��American�Indian/Alaskan�Native3.��Native�Hawaiian/Other�Pacific�Islander
OTHERASIANS AI/AN2
WORKFORCE�UTILIZATIONAS�OF�JUNE�30,�2014
NHOPI3
JOB�TITLEFEMALES1 BLACKS HISPANICS
Master Page # 33 of 64 - D
iversity Com
mittee M
eeting 9/22/2014________________________________________________________________________________
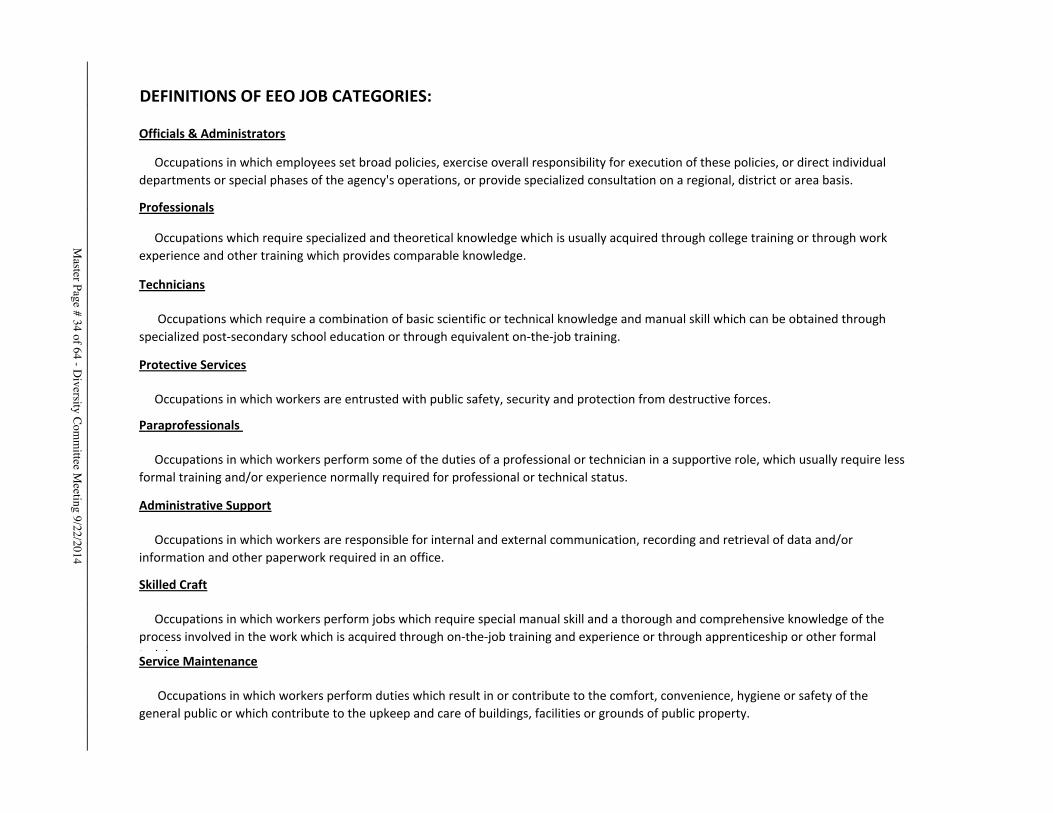
DEFINITIONS�OF�EEO�JOB�CATEGORIES:
Officials�&�Administrators
�����Occupations�in�which�employees�set�broad�policies,�exercise�overall�responsibility�for�execution�of�these�policies,�or�direct�individual�departments�or�special�phases�of�the�agency's�operations,�or�provide�specialized�consultation�on�a�regional,�district�or�area�basis.
Professionals
�����Occupations�which�require�specialized�and�theoretical�knowledge�which�is�usually�acquired�through�college�training�or�through�work�experience�and�other�training�which�provides�comparable�knowledge.
Technicians
������Occupations�which�require�a�combination�of�basic�scientific�or�technical�knowledge�and�manual�skill�which�can�be�obtained�through�specialized�postͲsecondary�school�education�or�through�equivalent�onͲtheͲjob�training.
Protective�Services
�����Occupations�in�which�workers�are�entrusted�with�public�safety,�security�and�protection�from�destructive�forces.
Paraprofessionals�
�����Occupations�in�which�workers�perform�some�of�the�duties�of�a�professional�or�technician�in�a�supportive�role,�which�usually�require�less�formal�training�and/or�experience�normally�required�for�professional�or�technical�status.
Administrative�Support
�����Occupations�in�which�workers�are�responsible�for�internal�and�external�communication,�recording�and�retrieval�of�data�and/or�information�and�other�paperwork�required�in�an�office.
Skilled�Craft
�����Occupations�in�which�workers�perform�jobs�which�require�special�manual�skill�and�a�thorough�and�comprehensive�knowledge�of�the�process�involved�in�the�work�which�is�acquired�through�onͲtheͲjob�training�and�experience�or�through�apprenticeship�or�other�formal�t i iService�Maintenance
������Occupations�in�which�workers�perform�duties�which�result�in�or�contribute�to�the�comfort,�convenience,�hygiene�or�safety�of�the�general�public�or�which�contribute�to�the�upkeep�and�care�of�buildings,�facilities�or�grounds�of�public�property.�
Master Page # 34 of 64 - D
iversity Com
mittee M
eeting 9/22/2014________________________________________________________________________________

Est�Avail
Estimated�#
Actual�����#
Met�Avail(Yes/No)
Est�Avail
Estimated�#
Actual�����#
Met�Avail(Yes/No)
Est�Avail
Estimated�#
Actual�����#
Met�Avail(Yes/No)
Inspector 16% 0 0 Yes 20% 1 0 No 12% 0 0 YesCaptains 16% 2 0 No 19% 3 0 No 11% 2 1 NoLieutenants 16% 4 1 No 20% 4 0 No 12% 3 2 NoSergeants/Detective�Sgts. 11% 9 6 No 11% 10 5 No 8% 7 6 NoDetectives 18% 5 5 Yes 13% 3 3 Yes 14% 4 6 YesPolice�Officers 13% 70 60 No 12% 60 80 Yes 15% 77 89 Yes
����������������������������������������������������������AI/AN 2��������������������������������������������������������������������� NHOPI3
Est�Avail
Estimated�#
Actual�����#
Met�Avail(Yes/No)
Est�Avail
Estimated�#
Actual�����#
Met�Avail(Yes/No)
Est�Avail
Estimated�#
Actual�����#
Met�Avail(Yes/No)
Inspector 1% 0 0 Yes 0% 0 0 Yes 1% 0 0 YesCaptains 1% 0 1 Yes 0% 0 0 Yes 1% 0 0 YesLieutenants 1% 0 0 Yes 0% 0 0 Yes 1% 0 0 YesSergeants/Detective�Sgts. 0% 0 2 Yes 0% 0 0 Yes 1% 0 0 YesDetectives 1% 0 0 Yes 0% 0 0 Yes 1% 0 0 YesPolice�Officers 1% 6 17 Yes 0% 0 0 Yes 1% 6 0 No
Est�Avail
Estimated�#
Actual�����#
Met�Avail(Yes/No)
Inspector 1% 0 1 YesCaptains 1% 0 0 YesLieutenants 1% 0 2 YesSergeants/Detective�Sgts. 0% 0 1 YesDetectives 1% 0 1 YesPolice�Officers 1% 6 6 Yes
1.���Females�are�also�included�in�the�percentage�totals�for�each�of�the�minority�groups.
2.��American�Indian/Alaskan�Native
3.��Native�Hawaiian�Other�Pacific�Islander
�������������������������OTHER
JOB�TITLE
SECOND�QUARTER�2014MTA�POLICE�WORKFORCE�UTILIZATION
JOB�TITLE
������������������������ASIANS
JOB�TITLE
FEMALES1 ������������������������BLACKS ��������������������������HISPANICS
Master Page # 35 of 64 - D
iversity Com
mittee M
eeting 9/22/2014________________________________________________________________________________
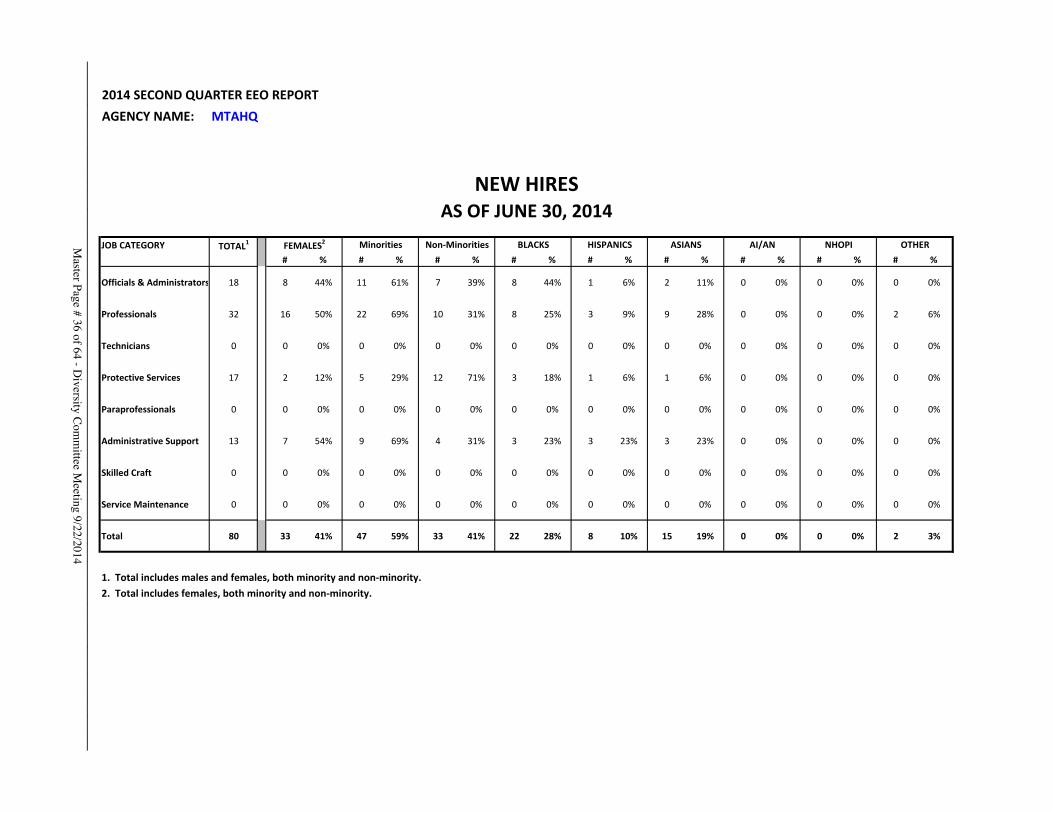
2014�SECOND�QUARTER�EEO�REPORTAGENCY�NAME:��� MTAHQ
JOB�CATEGORY TOTAL1
# % # % # % # % # % # % # % # % # %
Officials�&�Administrators 18 8 44% 11 61% 7 39% 8 44% 1 6% 2 11% 0 0% 0 0% 0 0%
Professionals 32 16 50% 22 69% 10 31% 8 25% 3 9% 9 28% 0 0% 0 0% 2 6%
Technicians 0 0 0% 0 0% 0 0% 0 0% 0 0% 0 0% 0 0% 0 0% 0 0%
Protective�Services 17 2 12% 5 29% 12 71% 3 18% 1 6% 1 6% 0 0% 0 0% 0 0%
Paraprofessionals 0 0 0% 0 0% 0 0% 0 0% 0 0% 0 0% 0 0% 0 0% 0 0%
Administrative�Support 13 7 54% 9 69% 4 31% 3 23% 3 23% 3 23% 0 0% 0 0% 0 0%
Skilled�Craft 0 0 0% 0 0% 0 0% 0 0% 0 0% 0 0% 0 0% 0 0% 0 0%
Service�Maintenance 0 0 0% 0 0% 0 0% 0 0% 0 0% 0 0% 0 0% 0 0% 0 0%
Total 80 33 41% 47 59% 33 41% 22 28% 8 10% 15 19% 0 0% 0 0% 2 3%
1.��Total�includes�males�and�females,�both�minority�and�nonͲminority.
2.��Total�includes�females,�both�minority�and�nonͲminority.
ASIANS AI/AN NHOPI OTHER
NEW�HIRESAS�OF�JUNE�30,�2014
FEMALES2 Minorities NonͲMinorities BLACKS HISPANICSMaster Page # 36 of 64 - D
iversity Com
mittee M
eeting 9/22/2014________________________________________________________________________________

2014�SECOND�QUARTER�EEO�REPORTAGENCY�NAME:��� MTAHQ
Category Race Disability GenderNational�Origin
AgeSexual�
HarassmentReligion Other2
Total�Issues3
Total�Cases
Status(#�Open)
EEO�TOTAL 9 2 6 1 2 2 3 3 28 15 7
External�Complaints 3 1 2 1 1 1 2 2 13 6 3
Internal�Complaints 6 1 4 0 1 1 1 1 15 9 4
Category RaceNational�Origin
ColorTotal�Issues3
Total�Cases
Status(#�Open)
Title�VI 0 0 0 0 0 0
1.��This�chart�includes�all�pending�matters�as�of�the�date�of�the�report;�including�matters�filed�prior�to�the�reporting�period.
2.��“Other”�contains�all�EEO�categories�not�otherwise�specifically�mentioned�on�the�chart.3.���In�some�instances�a�single�complaint�may�involve�two�or�more�EEO�categories.
EEO�AND�TITLE�VI�COMPLAINTSJANUARY�1,�2014�to�JUNE�30,�20141M
aster Page # 37 of 64 - Diversity C
omm
ittee Meeting 9/22/2014
________________________________________________________________________________
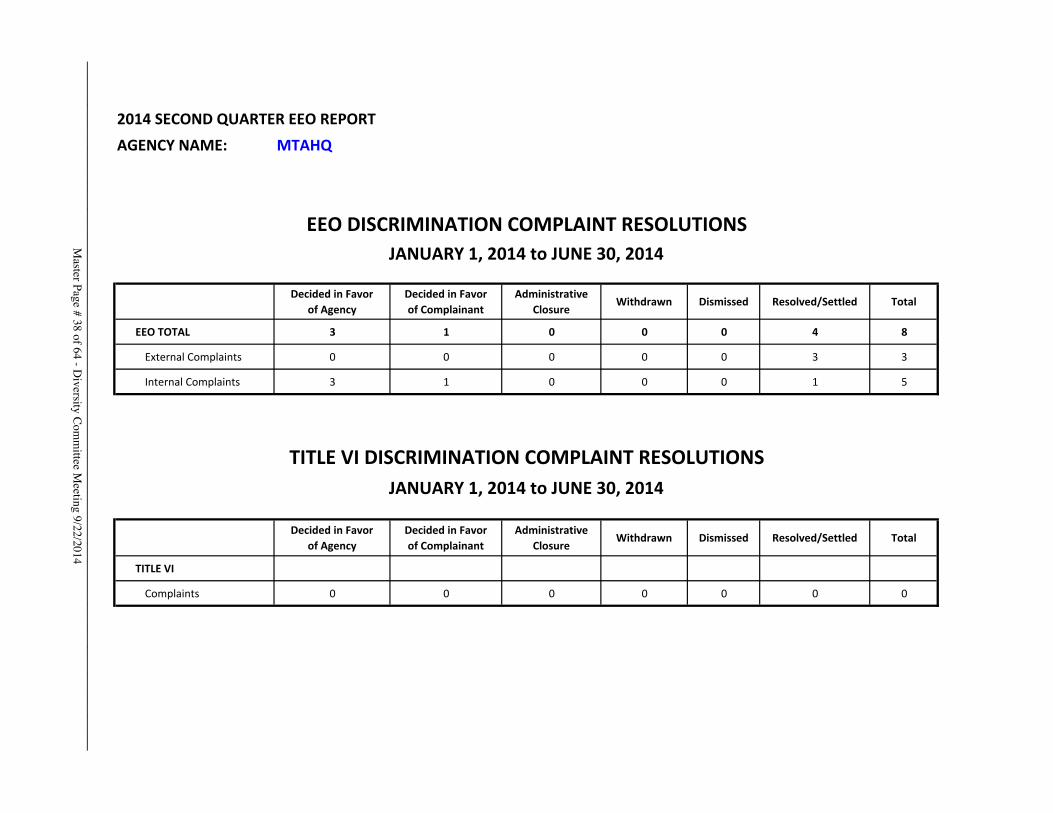
2014�SECOND�QUARTER�EEO�REPORTAGENCY�NAME:��� MTAHQ
Decided�in�Favorof�Agency
Decided�in�Favorof�Complainant
AdministrativeClosure
Withdrawn Dismissed Resolved/Settled Total
EEO�TOTAL 3 1 0 0 0 4 8
External�Complaints 0 0 0 0 0 3 3
Internal�Complaints 3 1 0 0 0 1 5
Decided�in�Favorof�Agency
Decided�in�Favorof�Complainant
AdministrativeClosure
Withdrawn Dismissed Resolved/Settled Total
TITLE�VI
Complaints 0 0 0 0 0 0 0
EEO�DISCRIMINATION�COMPLAINT�RESOLUTIONSJANUARY�1,�2014�to�JUNE�30,�2014
TITLE�VI�DISCRIMINATION�COMPLAINT�RESOLUTIONSJANUARY�1,�2014�to�JUNE�30,�2014
Master Page # 38 of 64 - D
iversity Com
mittee M
eeting 9/22/2014________________________________________________________________________________
MTA SMALL BUSINESS MENTORING PROGRAM UPDATE
September 22, 2014
Master Page # 39 of 64 - D
iversity Com
mittee M
eeting 9/22/2014________________________________________________________________________________
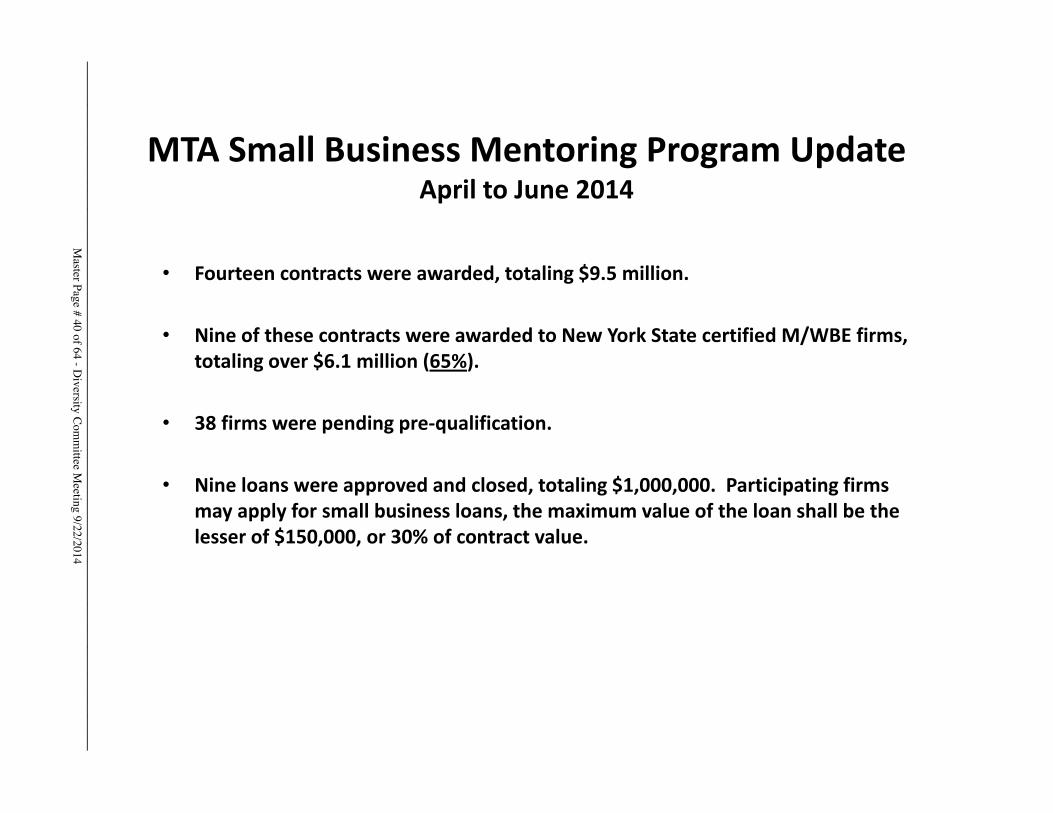
MTA�Small�Business�Mentoring�Program�Update�April�to�June�2014
• Fourteen�contracts�were�awarded,�totaling�$9.5�million.
• Nine�of�these�contracts�were�awarded�to�New�York�State�certified�M/WBE�firms,�totaling�over�$6.1�million�(65%).
• 38�firms�were�pending�preͲqualification.
• Nine�loans�were�approved�and�closed,�totaling�$1,000,000.��Participating�firms�may�apply�for�small�business�loans,�the�maximum�value�of�the�loan�shall�be�the�lesser�of�$150,000,�or�30%�of�contract�value.
Master Page # 40 of 64 - D
iversity Com
mittee M
eeting 9/22/2014________________________________________________________________________________
MTA SMALL BUSINESS FEDERAL PROGRAM UPDATE
September 22, 2014
Master Page # 41 of 64 - D
iversity Com
mittee M
eeting 9/22/2014________________________________________________________________________________
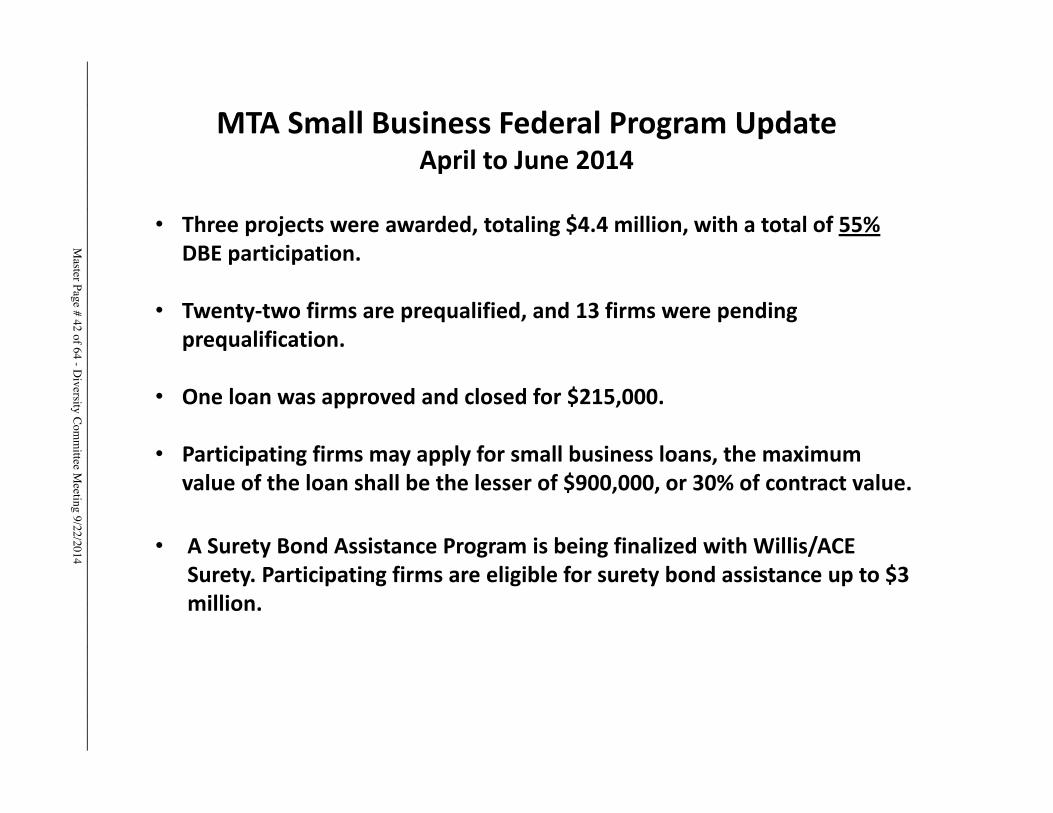
MTA�Small�Business�Federal�Program�Update�April�to�June�2014
• Three�projects�were�awarded,�totaling�$4.4�million,�with�a�total�of�55%�DBE�participation.
• TwentyͲtwo�firms�are�prequalified,�and�13�firms�were�pending�prequalification.
• One�loan�was�approved�and�closed�for�$215,000.
• Participating�firms�may�apply�for�small�business�loans,�the�maximum�value�of�the�loan�shall�be�the�lesser�of�$900,000,�or�30%�of�contract�value.
• A�Surety�Bond�Assistance�Program�is�being�finalized�with�Willis/ACE�Surety.�Participating�firms�are�eligible�for�surety�bond�assistance�up�to�$3�million.�
Master Page # 42 of 64 - D
iversity Com
mittee M
eeting 9/22/2014________________________________________________________________________________
M/W/DBE CONTRACT COMPLIANCEThird Quarter 2014 Update
September 22, 2014
Master Page # 43 of 64 - D
iversity Com
mittee M
eeting 9/22/2014________________________________________________________________________________

DBE�Participation�in�Federally�Funded�Contracts
�Federal�Fiscal�Year�2014*
(October�1,�2013�to�June�30,�2014)�
• Each�year,�MTA�reports�to�the�Federal�Transit�Administration�on�a�semiͲannual�basis�DBE�participation�in�federally�funded�contracts.
• Reports�are�submitted�on�June�1st�ͲͲ�covering�October�through�March,�and�December�1st�ͲͲ�covering�April�through�September.�The�December�report�also�summarizes�data�for�the�entire�federal�fiscal�year�(“FFY”).
• Reports�include�data�on�DBE�participation�in�new�awards�and�payments�on�completed�contracts.
• For�FFY�2014,�MTA�set�an�overall�DBE�goal�of�17%.
• From�October�2013�through�June�2014,�approximately�$848�million�was�awarded�as�the�federally�funded�portion�of�contracts,�with�over�$144�million�(17%)�being�awarded�to�certified�DBEs.
From�October�2013�through�June�2014,�approximately�$956�million�was�paid�to�prime�contractors,�with�payments�to�certified�DBEs�totaling�over�$137�million�(14%).�
*The�Federal�Fiscal�Year�runs�from�October�1st�through�September�30th.�
Master Page # 44 of 64 - D
iversity Com
mittee M
eeting 9/22/2014________________________________________________________________________________
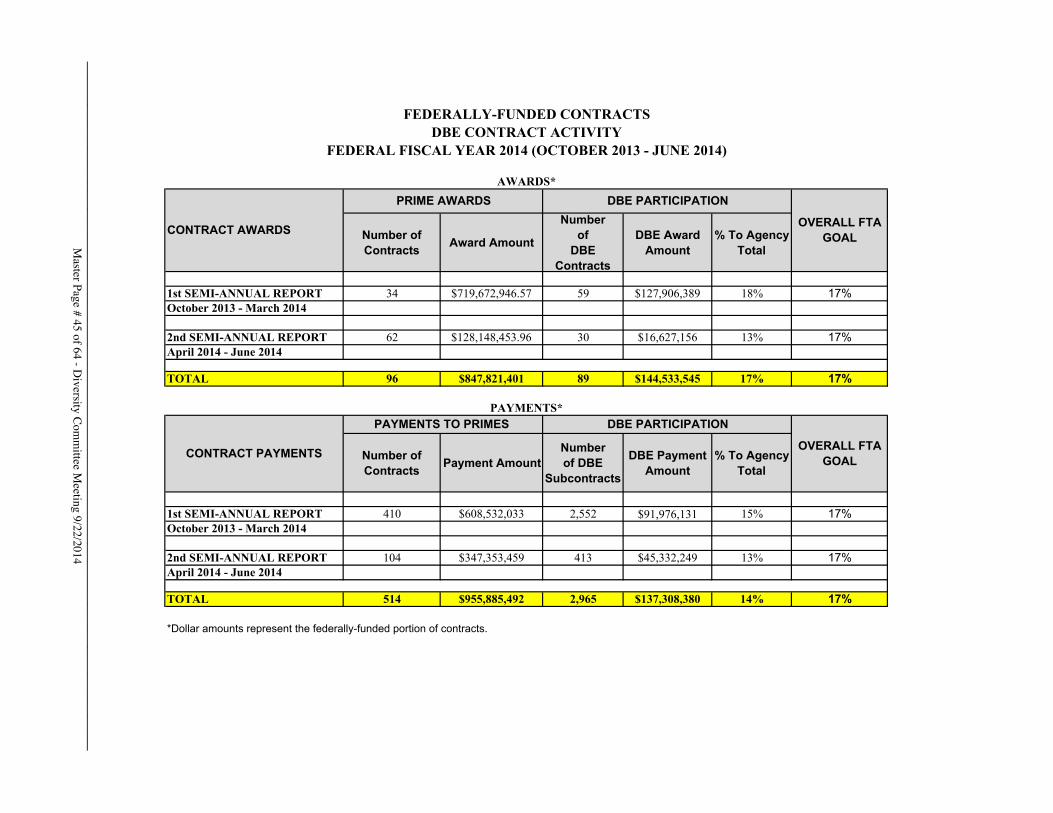
Number of Contracts Award Amount
Numberof
DBE Contracts
DBE Award Amount
% To Agency Total
1st SEMI-ANNUAL REPORT 34 $719,672,946.57 59 $127,906,389 18% 17%October 2013 - March 2014
2nd SEMI-ANNUAL REPORT 62 $128,148,453.96 30 $16,627,156 13% 17%April 2014 - June 2014
TOTAL 96 $847,821,401 89 $144,533,545 17% 17%
Number of Contracts Payment Amount
Numberof DBE
Subcontracts
DBE Payment Amount
% To Agency Total
1st SEMI-ANNUAL REPORT 410 $608,532,033 2,552 $91,976,131 15% 17%October 2013 - March 2014
2nd SEMI-ANNUAL REPORT 104 $347,353,459 413 $45,332,249 13% 17%April 2014 - June 2014
TOTAL 514 $955,885,492 2,965 $137,308,380 14% 17%
*Dollar amounts represent the federally-funded portion of contracts.
FEDERALLY-FUNDED CONTRACTSDBE CONTRACT ACTIVITY
FEDERAL FISCAL YEAR 2014 (OCTOBER 2013 - JUNE 2014)
AWARDS*
CONTRACT AWARDS
PRIME AWARDS DBE PARTICIPATION
OVERALL FTA GOAL
PAYMENTS*
CONTRACT PAYMENTS
PAYMENTS TO PRIMES DBE PARTICIPATION
OVERALL FTA GOAL
Master Page # 45 of 64 - D
iversity Com
mittee M
eeting 9/22/2014________________________________________________________________________________
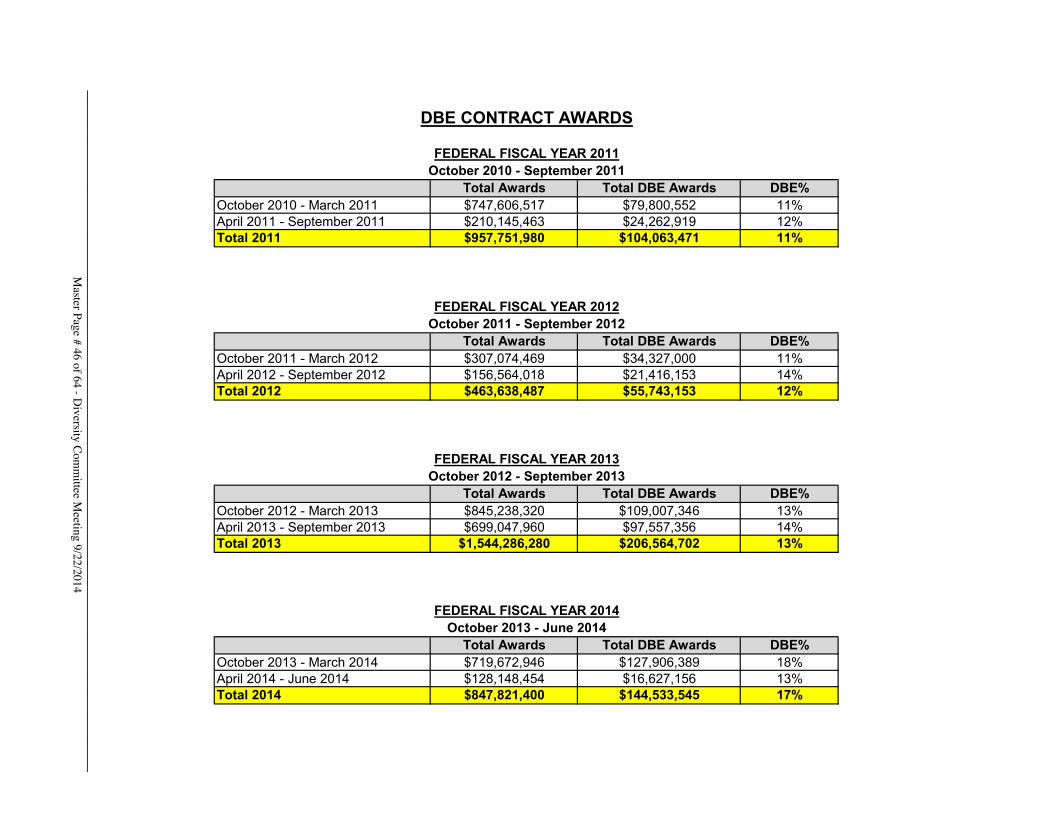
Total Awards Total DBE Awards DBE%October 2010 - March 2011 $747,606,517 $79,800,552 11%April 2011 - September 2011 $210,145,463 $24,262,919 12%Total 2011 $957,751,980 $104,063,471 11%
Total Awards Total DBE Awards DBE%October 2011 - March 2012 $307,074,469 $34,327,000 11%April 2012 - September 2012 $156,564,018 $21,416,153 14%Total 2012 $463,638,487 $55,743,153 12%
Total Awards Total DBE Awards DBE%October 2012 - March 2013 $845,238,320 $109,007,346 13%April 2013 - September 2013 $699,047,960 $97,557,356 14%Total 2013 $1,544,286,280 $206,564,702 13%
Total Awards Total DBE Awards DBE%October 2013 - March 2014 $719,672,946 $127,906,389 18%April 2014 - June 2014 $128,148,454 $16,627,156 13%Total 2014 $847,821,400 $144,533,545 17%
October 2013 - June 2014
FEDERAL FISCAL YEAR 2013October 2012 - September 2013
FEDERAL FISCAL YEAR 2014
DBE CONTRACT AWARDS
October 2010 - September 2011FEDERAL FISCAL YEAR 2011
October 2011 - September 2012FEDERAL FISCAL YEAR 2012
Master Page # 46 of 64 - D
iversity Com
mittee M
eeting 9/22/2014________________________________________________________________________________
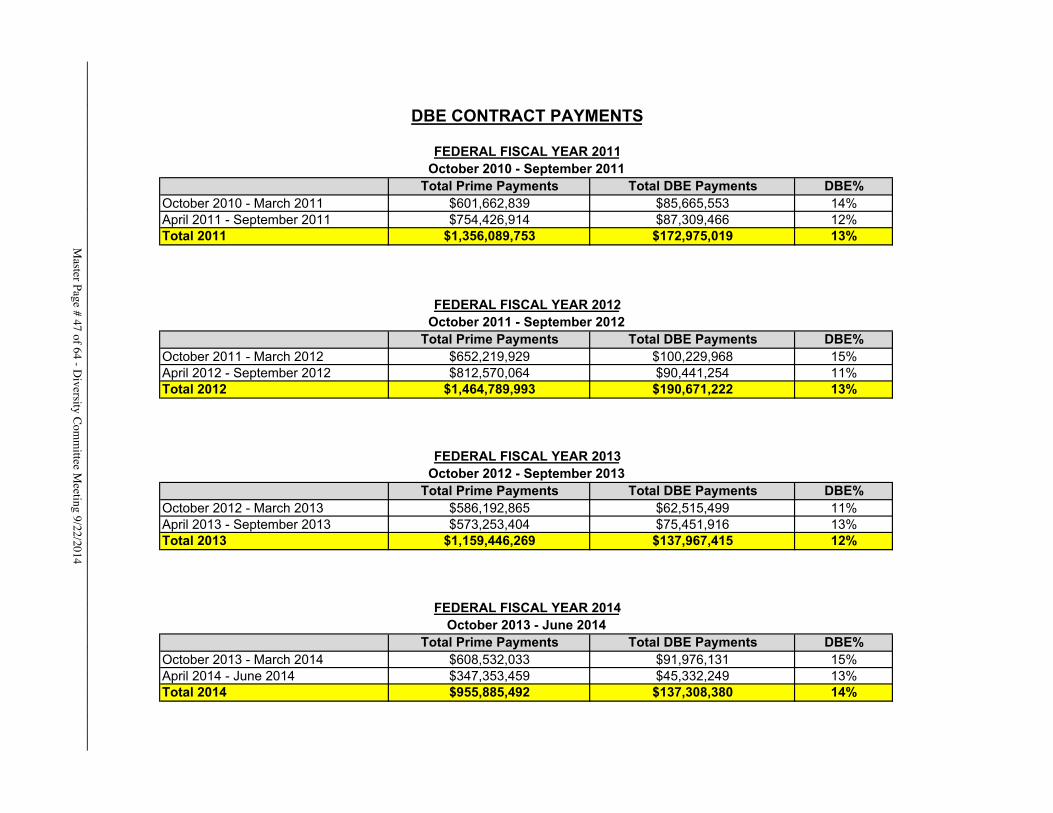
Total Prime Payments Total DBE Payments DBE%October 2010 - March 2011 $601,662,839 $85,665,553 14%April 2011 - September 2011 $754,426,914 $87,309,466 12%Total 2011 $1,356,089,753 $172,975,019 13%
Total Prime Payments Total DBE Payments DBE%October 2011 - March 2012 $652,219,929 $100,229,968 15%April 2012 - September 2012 $812,570,064 $90,441,254 11%Total 2012 $1,464,789,993 $190,671,222 13%
Total Prime Payments Total DBE Payments DBE%October 2012 - March 2013 $586,192,865 $62,515,499 11%April 2013 - September 2013 $573,253,404 $75,451,916 13%Total 2013 $1,159,446,269 $137,967,415 12%
Total Prime Payments Total DBE Payments DBE%October 2013 - March 2014 $608,532,033 $91,976,131 15%April 2014 - June 2014 $347,353,459 $45,332,249 13%Total 2014 $955,885,492 $137,308,380 14%
FEDERAL FISCAL YEAR 2014October 2013 - June 2014
FEDERAL FISCAL YEAR 2013October 2012 - September 2013
October 2011 - September 2012
DBE CONTRACT PAYMENTS
FEDERAL FISCAL YEAR 2011October 2010 - September 2011
FEDERAL FISCAL YEAR 2012
Master Page # 47 of 64 - D
iversity Com
mittee M
eeting 9/22/2014________________________________________________________________________________
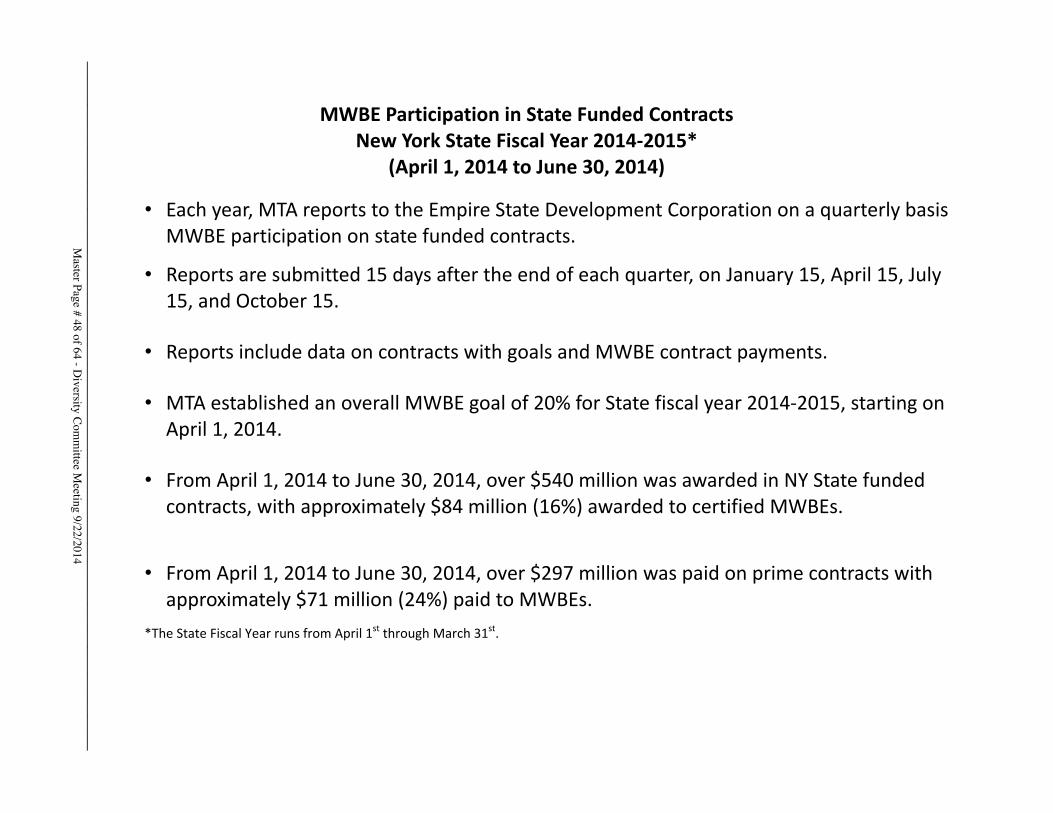
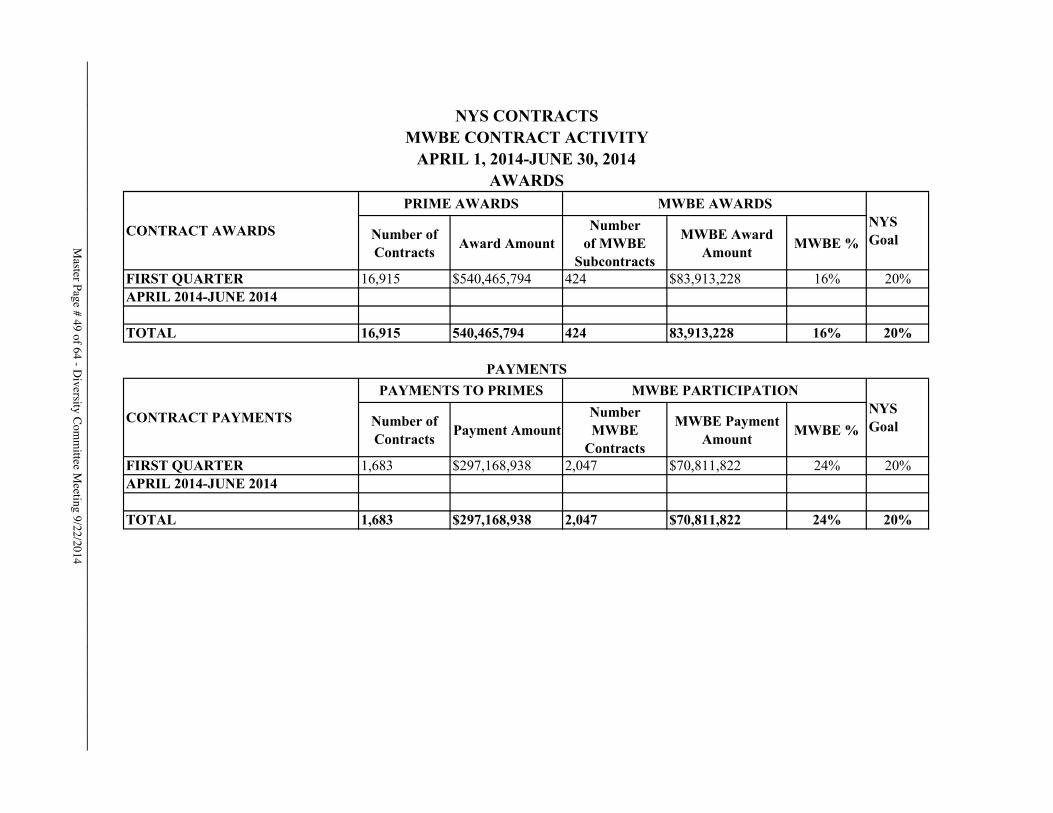
MWBE�Participation�in�State�Funded�Contracts
New�York�State�Fiscal�Year�2014Ͳ2015*
(April�1,�2014�to�June�30,�2014)�
• Each�year,�MTA�reports�to�the�Empire�State�Development�Corporation�on�a�quarterly�basis�MWBE�participation�on�state�funded�contracts.
• Reports�are�submitted�15�days�after�the�end�of�each�quarter,�on�January�15,�April�15,�July�15,�and�October�15.
• Reports�include�data�on�contracts�with�goals�and�MWBE�contract�payments.
• MTA�established�an�overall�MWBE�goal�of�20%�for�State�fiscal�year�2014Ͳ2015,�starting�on�April�1,�2014.
• From�April�1,�2014�to�June�30,�2014,�over�$540�million�was�awarded�in�NY�State�funded�contracts,�with�approximately�$84�million�(16%)�awarded�to�certified�MWBEs.
• From�April�1,�2014�to�June�30,�2014,�over�$297�million�was�paid�on�prime�contracts�with�approximately�$71�million�(24%)�paid�to�MWBEs.
*The�State�Fiscal�Year�runs�from�April�1st�through�March�31st.�
Master Page # 48 of 64 - D
iversity Com
mittee M
eeting 9/22/2014________________________________________________________________________________
Number of Contracts Award Amount
Numberof MWBE
Subcontracts
MWBE Award Amount MWBE %
FIRST QUARTER 16,915 $540,465,794 424 $83,913,228 16% 20%APRIL 2014-JUNE 2014
TOTAL 16,915 540,465,794 424 83,913,228 16% 20%
Number of Contracts Payment Amount
Number MWBE
Contracts
MWBE Payment Amount MWBE %
FIRST QUARTER 1,683 $297,168,938 2,047 $70,811,822 24% 20%APRIL 2014-JUNE 2014
TOTAL 1,683 $297,168,938 2,047 $70,811,822 24% 20%
NYS CONTRACTSMWBE CONTRACT ACTIVITY
APRIL 1, 2014-JUNE 30, 2014
PAYMENTS
CONTRACT PAYMENTS
PAYMENTS TO PRIMES MWBE PARTICIPATIONNYS Goal
AWARDS
CONTRACT AWARDS
PRIME AWARDS MWBE AWARDSNYS GoalM
aster Page # 49 of 64 - Diversity C
omm
ittee Meeting 9/22/2014
________________________________________________________________________________
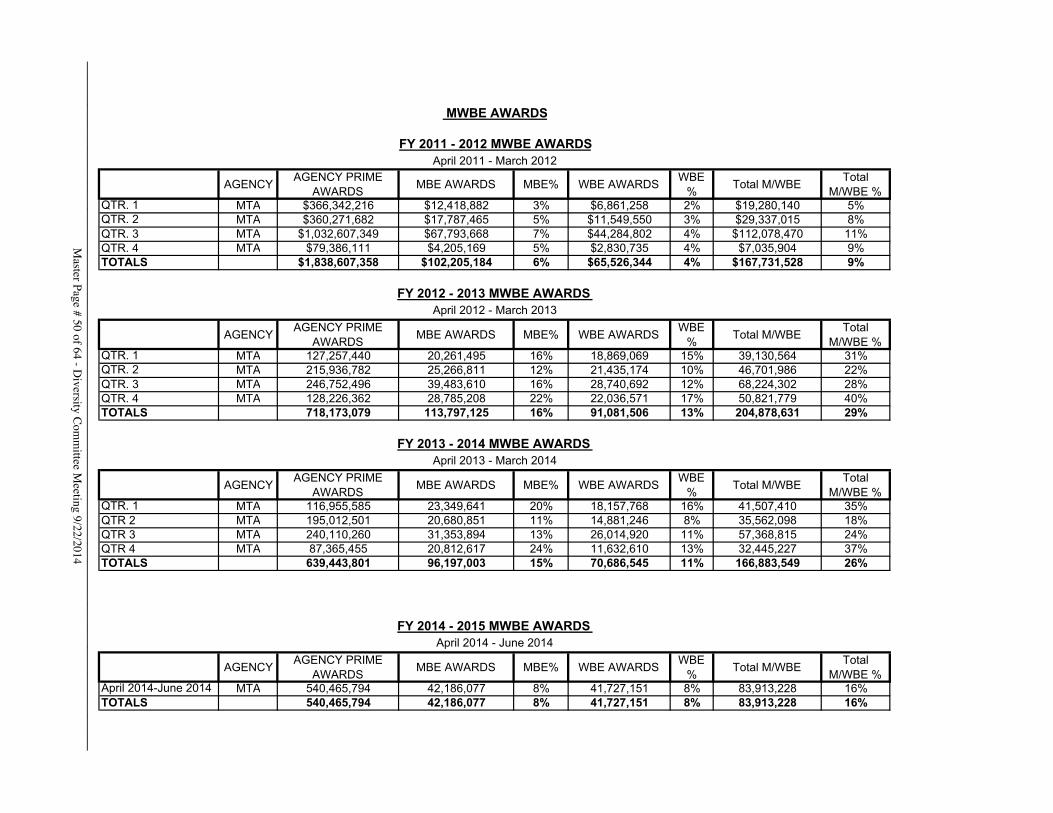
AGENCYAGENCY PRIME
AWARDSMBE AWARDS MBE% WBE AWARDS
WBE %
Total M/WBE Total
M/WBE %QTR. 1 MTA $366,342,216 $12,418,882 3% $6,861,258 2% $19,280,140 5%QTR. 2 MTA $360,271,682 $17,787,465 5% $11,549,550 3% $29,337,015 8%QTR. 3 MTA $1,032,607,349 $67,793,668 7% $44,284,802 4% $112,078,470 11%QTR. 4 MTA $79,386,111 $4,205,169 5% $2,830,735 4% $7,035,904 9%TOTALS $1,838,607,358 $102,205,184 6% $65,526,344 4% $167,731,528 9%
AGENCYAGENCY PRIME
AWARDSMBE AWARDS MBE% WBE AWARDS
WBE %
Total M/WBE Total
M/WBE %QTR. 1 MTA 127,257,440 20,261,495 16% 18,869,069 15% 39,130,564 31%QTR. 2 MTA 215,936,782 25,266,811 12% 21,435,174 10% 46,701,986 22%QTR. 3 MTA 246,752,496 39,483,610 16% 28,740,692 12% 68,224,302 28%QTR. 4 MTA 128,226,362 28,785,208 22% 22,036,571 17% 50,821,779 40%TOTALS 718,173,079 113,797,125 16% 91,081,506 13% 204,878,631 29%
AGENCYAGENCY PRIME
AWARDSMBE AWARDS MBE% WBE AWARDS
WBE %
Total M/WBE Total
M/WBE %QTR. 1 MTA 116,955,585 23,349,641 20% 18,157,768 16% 41,507,410 35%QTR 2 MTA 195,012,501 20,680,851 11% 14,881,246 8% 35,562,098 18%QTR 3 MTA 240,110,260 31,353,894 13% 26,014,920 11% 57,368,815 24%QTR 4 MTA 87,365,455 20,812,617 24% 11,632,610 13% 32,445,227 37%TOTALS 639,443,801 96,197,003 15% 70,686,545 11% 166,883,549 26%
AGENCYAGENCY PRIME
AWARDSMBE AWARDS MBE% WBE AWARDS
WBE %
Total M/WBE Total
M/WBE %April 2014-June 2014 MTA 540,465,794 42,186,077 8% 41,727,151 8% 83,913,228 16%TOTALS 540,465,794 42,186,077 8% 41,727,151 8% 83,913,228 16%
MWBE AWARDS
FY 2011 - 2012 MWBE AWARDSApril 2011 - March 2012
FY 2014 - 2015 MWBE AWARDS April 2014 - June 2014
FY 2013 - 2014 MWBE AWARDS April 2013 - March 2014
FY 2012 - 2013 MWBE AWARDS April 2012 - March 2013
Master Page # 50 of 64 - D
iversity Com
mittee M
eeting 9/22/2014________________________________________________________________________________
AGENCY EXPENDITURE
MBE Utilization MBE% WBE Utilization WBE %
Total M/WBE Total M/WBE %
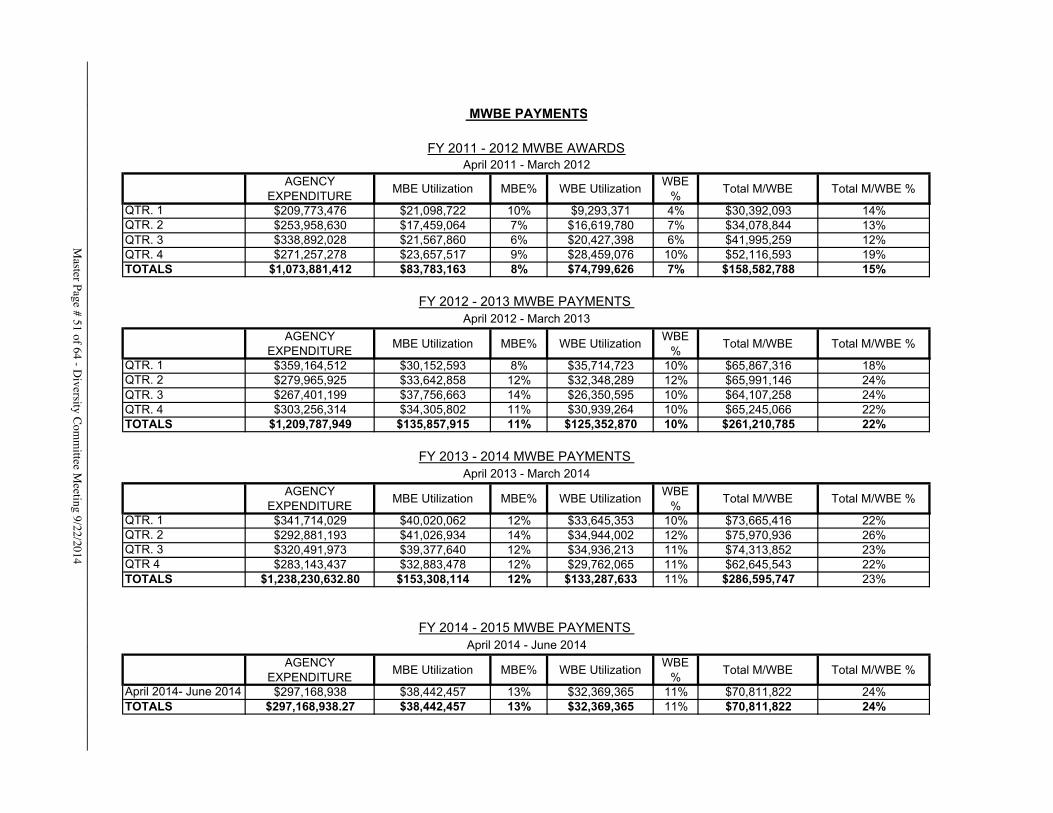
QTR. 1 $209,773,476 $21,098,722 10% $9,293,371 4% $30,392,093 14%QTR. 2 $253,958,630 $17,459,064 7% $16,619,780 7% $34,078,844 13%QTR. 3 $338,892,028 $21,567,860 6% $20,427,398 6% $41,995,259 12%QTR. 4 $271,257,278 $23,657,517 9% $28,459,076 10% $52,116,593 19%TOTALS $1,073,881,412 $83,783,163 8% $74,799,626 7% $158,582,788 15%
AGENCY EXPENDITURE
MBE Utilization MBE% WBE Utilization WBE %
Total M/WBE Total M/WBE %
QTR. 1 $359,164,512 $30,152,593 8% $35,714,723 10% $65,867,316 18%QTR. 2 $279,965,925 $33,642,858 12% $32,348,289 12% $65,991,146 24%QTR. 3 $267,401,199 $37,756,663 14% $26,350,595 10% $64,107,258 24%QTR. 4 $303,256,314 $34,305,802 11% $30,939,264 10% $65,245,066 22%TOTALS $1,209,787,949 $135,857,915 11% $125,352,870 10% $261,210,785 22%
AGENCY EXPENDITURE
MBE Utilization MBE% WBE Utilization WBE %
Total M/WBE Total M/WBE %
QTR. 1 $341,714,029 $40,020,062 12% $33,645,353 10% $73,665,416 22%QTR. 2 $292,881,193 $41,026,934 14% $34,944,002 12% $75,970,936 26%QTR. 3 $320,491,973 $39,377,640 12% $34,936,213 11% $74,313,852 23%QTR 4 $283,143,437 $32,883,478 12% $29,762,065 11% $62,645,543 22%TOTALS $1,238,230,632.80 $153,308,114 12% $133,287,633 11% $286,595,747 23%
AGENCY EXPENDITURE
MBE Utilization MBE% WBE Utilization WBE %
Total M/WBE Total M/WBE %
April 2014- June 2014 $297,168,938 $38,442,457 13% $32,369,365 11% $70,811,822 24%TOTALS $297,168,938.27 $38,442,457 13% $32,369,365 11% $70,811,822 24%
MWBE PAYMENTS
FY 2014 - 2015 MWBE PAYMENTS
FY 2011 - 2012 MWBE AWARDSApril 2011 - March 2012
April 2014 - June 2014
FY 2012 - 2013 MWBE PAYMENTS
FY 2013 - 2014 MWBE PAYMENTS
April 2012 - March 2013
April 2013 - March 2014
Master Page # 51 of 64 - D
iversity Com
mittee M
eeting 9/22/2014________________________________________________________________________________
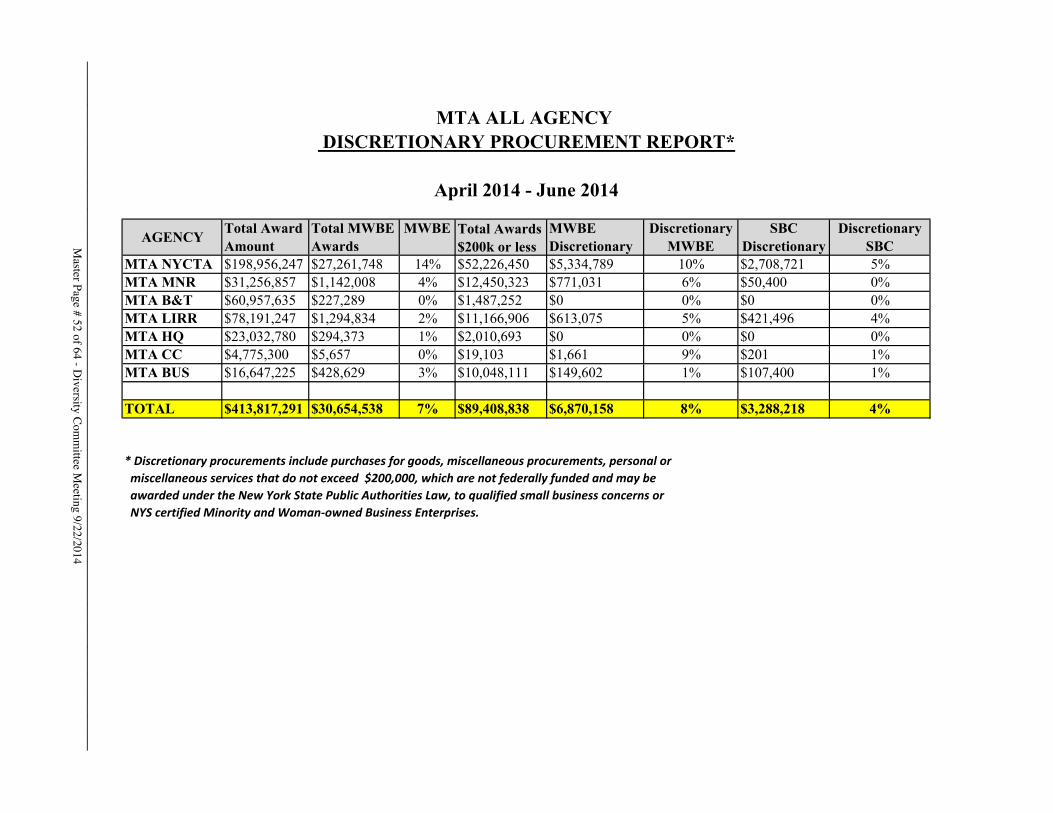
Total Awards$200k or less
MTA NYCTA $198,956,247 $27,261,748 14% $52,226,450 $5,334,789 10% $2,708,721 5%MTA MNR $31,256,857 $1,142,008 4% $12,450,323 $771,031 6% $50,400 0%MTA B&T $60,957,635 $227,289 0% $1,487,252 $0 0% $0 0%MTA LIRR $78,191,247 $1,294,834 2% $11,166,906 $613,075 5% $421,496 4%MTA HQ $23,032,780 $294,373 1% $2,010,693 $0 0% $0 0%MTA CC $4,775,300 $5,657 0% $19,103 $1,661 9% $201 1%MTA BUS $16,647,225 $428,629 3% $10,048,111 $149,602 1% $107,400 1%
TOTAL $413,817,291 $30,654,538 7% $89,408,838 $6,870,158 8% $3,288,218 4%
*�Discretionary�procurements�include�purchases�for�goods,�miscellaneous�procurements,�personal�or��miscellaneous�services�that�do�not�exceed��$200,000,�which�are�not�federally�funded�and�may�be����awarded�under�the�New�York�State�Public�Authorities�Law,�to�qualified�small�business�concerns�or��NYS�certified�Minority�and�WomanͲowned�Business�Enterprises.
Discretionary SBC
MTA ALL AGENCY DISCRETIONARY PROCUREMENT REPORT*
April 2014 - June 2014
AGENCY Total Award Amount
Total MWBE Awards
MWBE MWBE Discretionary
Discretionary MWBE
SBC DiscretionaryM
aster Page # 52 of 64 - Diversity C
omm
ittee Meeting 9/22/2014
________________________________________________________________________________
FINANCIAL AND LEGALSERVICES
September 22, 2014
Master Page # 53 of 64 - D
iversity Com
mittee M
eeting 9/22/2014________________________________________________________________________________
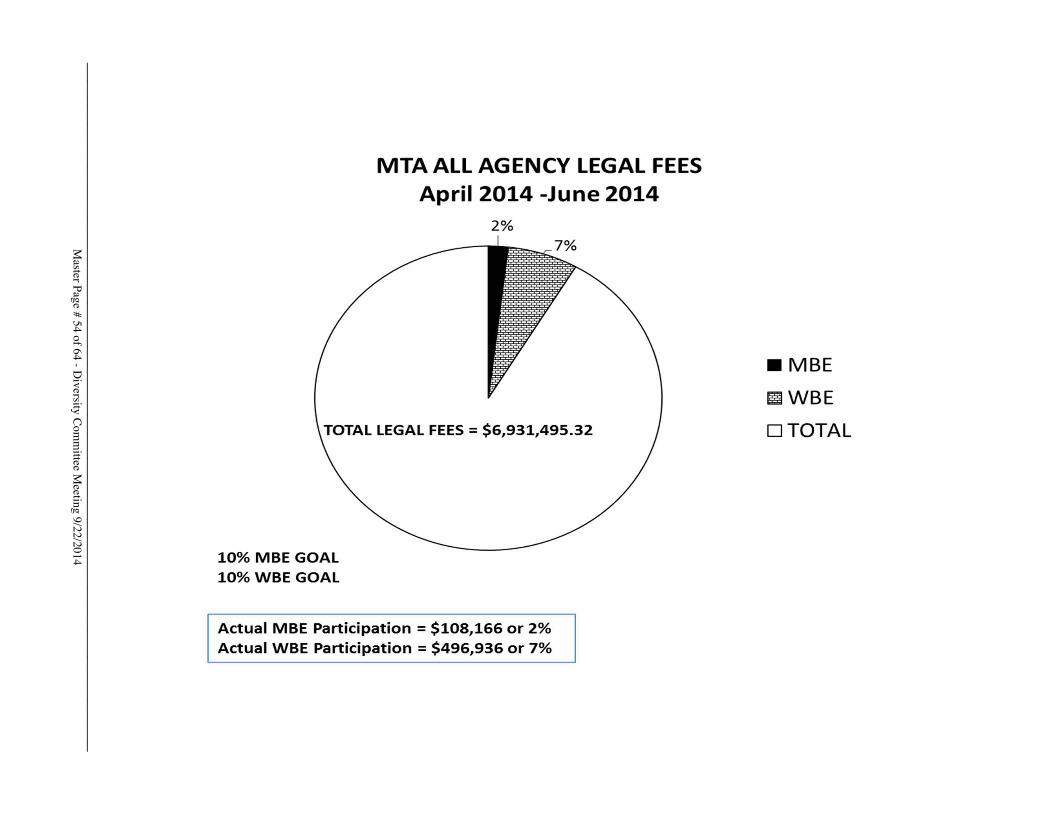
MTA All AGENCY LEGAL FEES April 2014 -June 2014
2%
TOTAL LEGAL FEES = $6,931,495.32
10% MBE GOAL 10%WBE GOAL
Actual MBE Participation = $108,166 or 2% Actual WBE Participation = $496,936 or 7%
•MBE
DTOTAL
Master Page # 54 of 64 - D
iversity Com
mittee M
eeting 9/22/2014________________________________________________________________________________
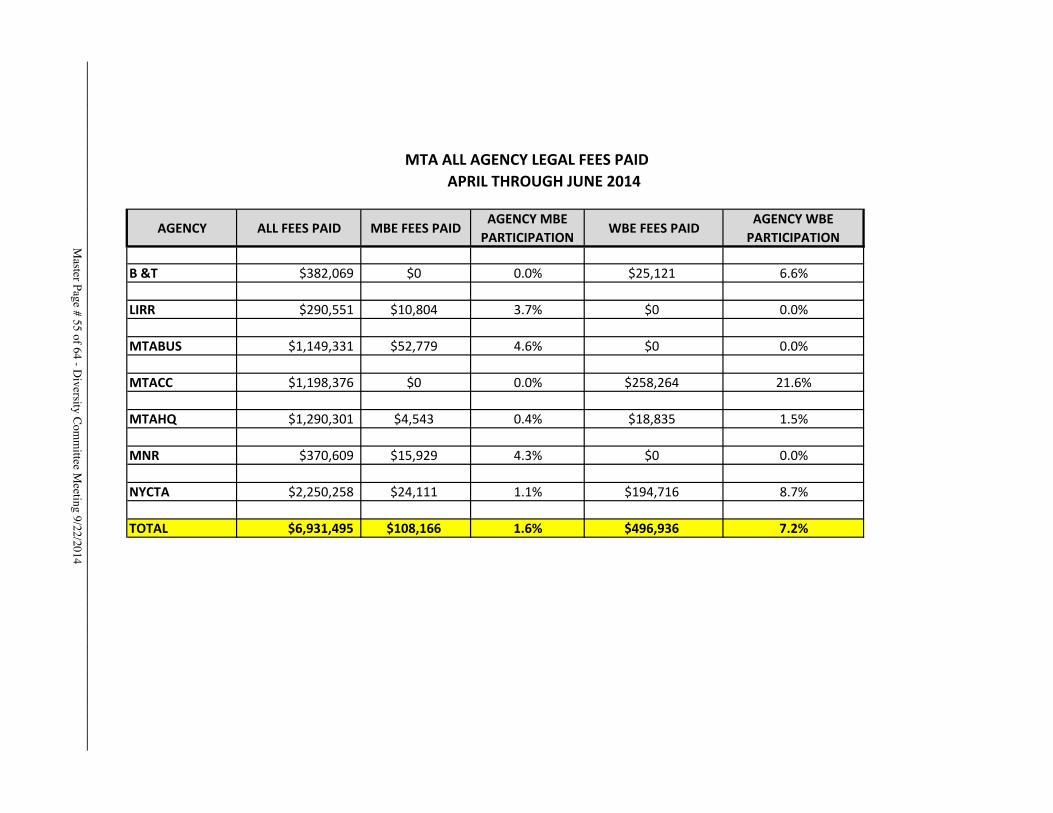
AGENCY ALL�FEES�PAID MBE�FEES�PAIDAGENCY�MBE�PARTICIPATION
WBE�FEES�PAIDAGENCY�WBE�PARTICIPATION
B�&T $382,069 $0 0.0% $25,121 6.6%
LIRR $290,551 $10,804 3.7% $0 0.0%
MTABUS $1,149,331 $52,779 4.6% $0 0.0%
MTACC $1,198,376 $0 0.0% $258,264 21.6%
MTAHQ $1,290,301 $4,543 0.4% $18,835 1.5%
MNR $370,609 $15,929 4.3% $0 0.0%
NYCTA $2,250,258 $24,111 1.1% $194,716 8.7%
TOTAL $6,931,495 $108,166 1.6% $496,936 7.2%
MTA�ALL�AGENCY�LEGAL�FEES�PAID���������APRIL�THROUGH�JUNE�2014
Master Page # 55 of 64 - D
iversity Com
mittee M
eeting 9/22/2014________________________________________________________________________________
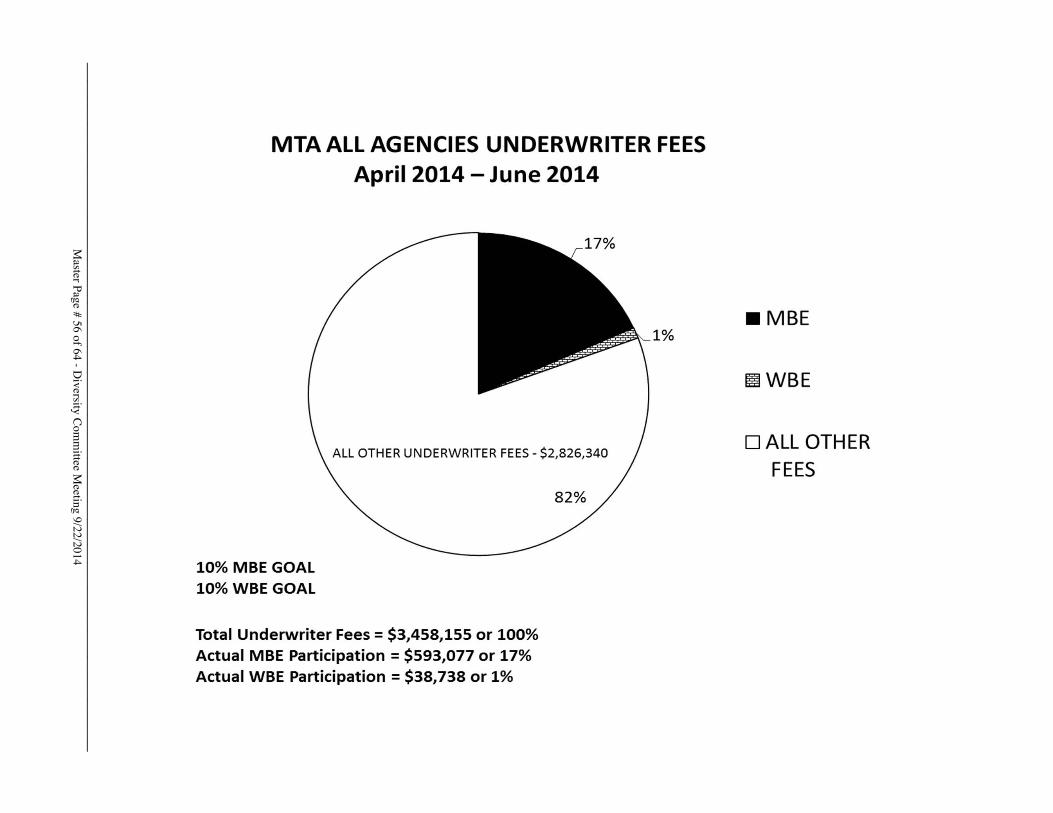
MTAALL AGENCIES UNDERWRITER FEES April 2014- June 2014
10% MBE GOAL 10% WBE GOAL
ALL OTHER UNDERWRITER FEES- $2,826,340
Total Underwriter Fees= $3,458,155 or 100% Actual MBE Participation = $593,077 or 17% Actual WBE Participation = $38,738 or 1%
1% •MBE
Iii WBE
DALL OTHER FEES
Master Page # 56 of 64 - D
iversity Com
mittee M
eeting 9/22/2014________________________________________________________________________________
MTA ASSET FUND MANAGERS
September 22, 2014
Master Page # 57 of 64 - D
iversity Com
mittee M
eeting 9/22/2014________________________________________________________________________________
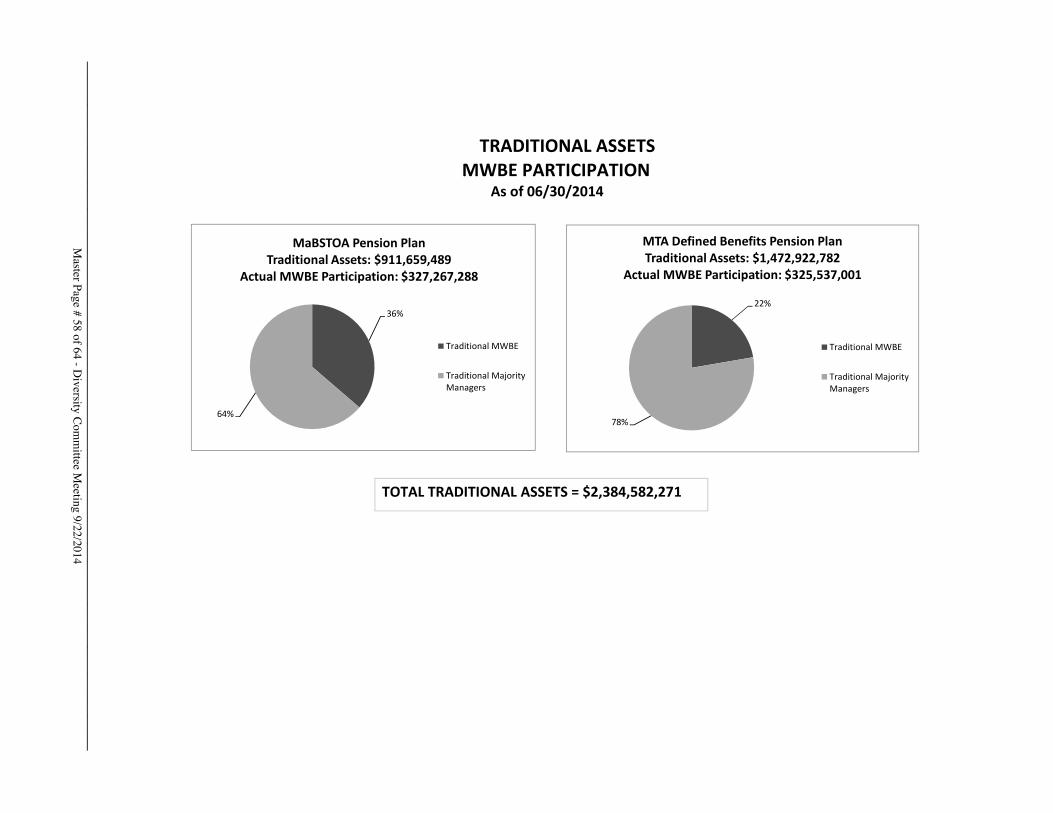
���������������������������TRADITIONAL�ASSETS��������������������������������������������������������������������������������MWBE�PARTICIPATION
�������������������������������������As�of�06/30/2014
22%
78%
MTA�Defined�Benefits�Pension�PlanTraditional�Assets:�$1,472,922,782
Actual�MWBE�Participation:�$325,537,001
Traditional�MWBE
Traditional�MajorityManagers
36%
64%
MaBSTOA�Pension�PlanTraditional�Assets:�$911,659,489
Actual�MWBE�Participation:�$327,267,288
Traditional�MWBE
Traditional�MajorityManagers
TOTAL�TRADITIONAL�ASSETS�=�$2,384,582,271
Master Page # 58 of 64 - D
iversity Com
mittee M
eeting 9/22/2014________________________________________________________________________________
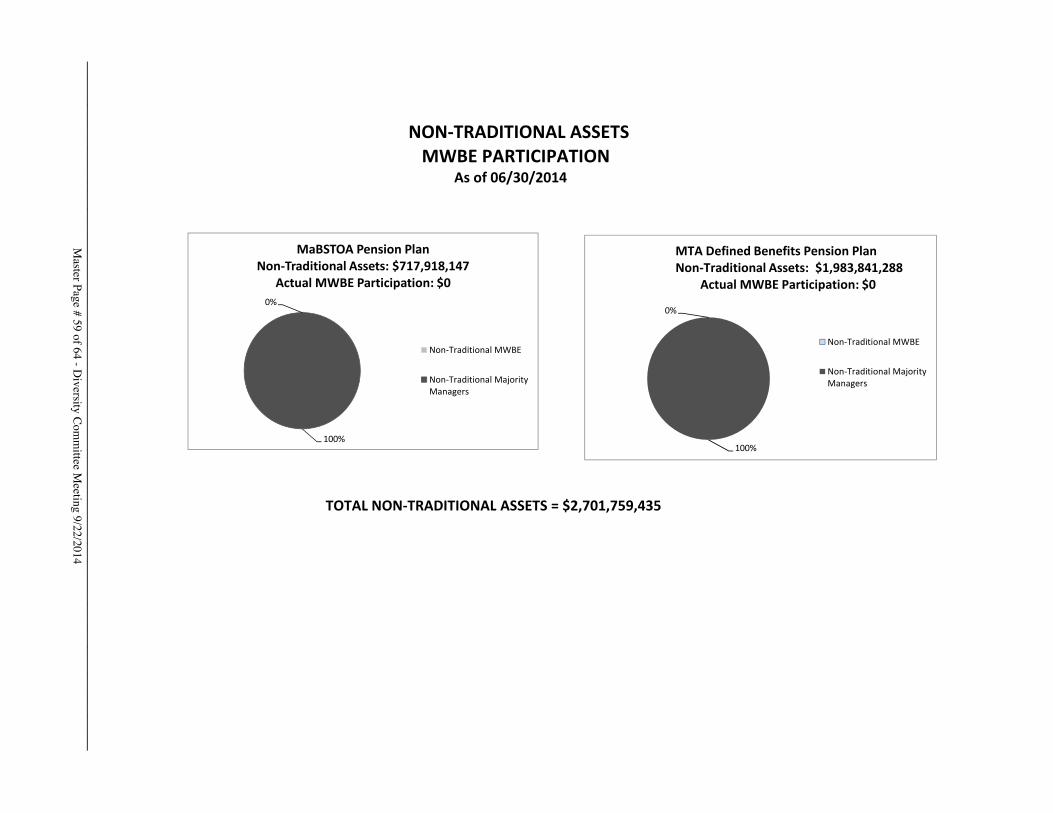
�������������������������������������������������������������������NONͲTRADITIONAL�ASSETS����������������������������������������������������������������������MWBE�PARTICIPATION������������������������������������������������������������������������������������������������As�of�06/30/2014
0%
100%
MaBSTOA�Pension�PlanNonͲTraditional�Assets:�$717,918,147
Actual�MWBE�Participation:�$0
NonͲTraditional�MWBE
NonͲTraditional�MajorityManagers
0%
100%
NonͲTraditional�MWBE
NonͲTraditional�MajorityManagers
MTA�Defined�Benefits�Pension�PlanNonͲTraditional�Assets:��$1,983,841,288
Actual�MWBE�Participation:�$0
TOTAL NONͲTRADITIONAL�ASSETS�=�$2,701,759,435
Master Page # 59 of 64 - D
iversity Com
mittee M
eeting 9/22/2014________________________________________________________________________________
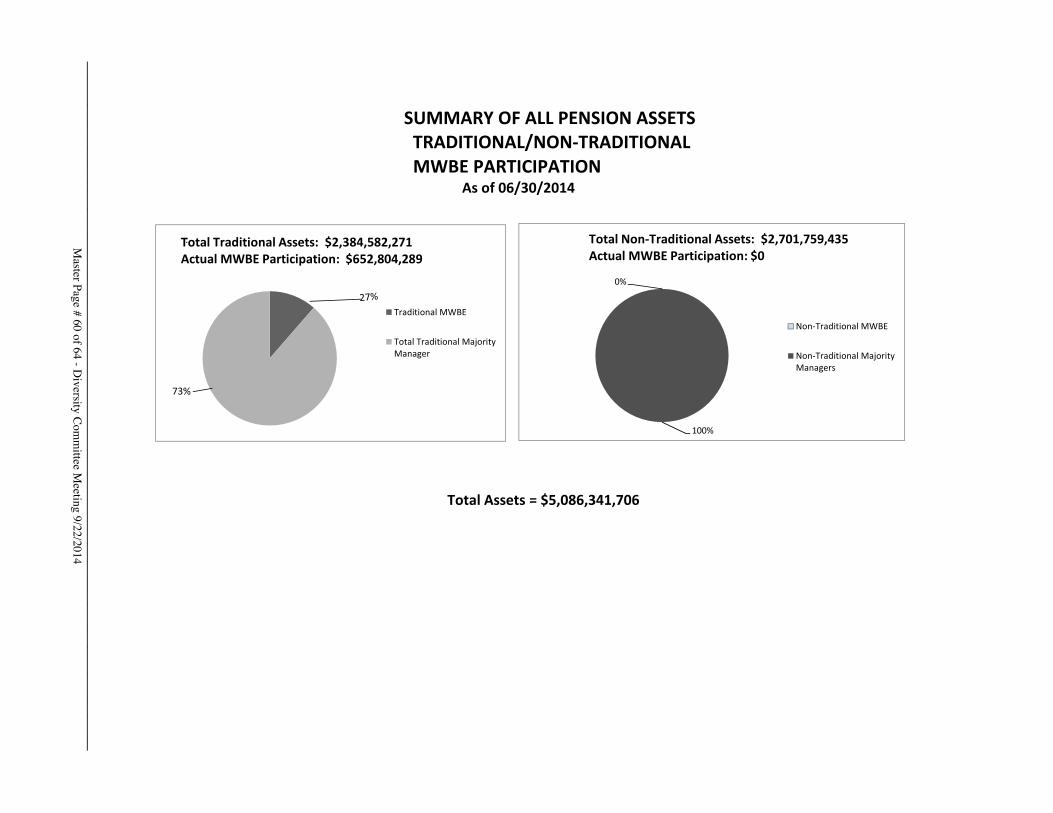
����������SUMMARY�OF�ALL�PENSION�ASSETS
���������������������������������������������������������������������MWBE�PARTICIPATION�����������������������������As�of�06/30/2014
TRADITIONAL/NONͲTRADITIONAL
Traditional�MWBE
Total�Traditional�MajorityManager
Total�Traditional�Assets:��$2,384,582,271Actual�MWBE�Participation:��$652,804,289
73%
:
0%
100%
NonͲTraditional�MWBE
NonͲTraditional�MajorityManagers
Total�NonͲTraditional�Assets:��$2,701,759,435Actual�MWBE�Participation:�$0
Total Assets�=�$5,086,341,706
Master Page # 60 of 64 - D
iversity Com
mittee M
eeting 9/22/2014________________________________________________________________________________
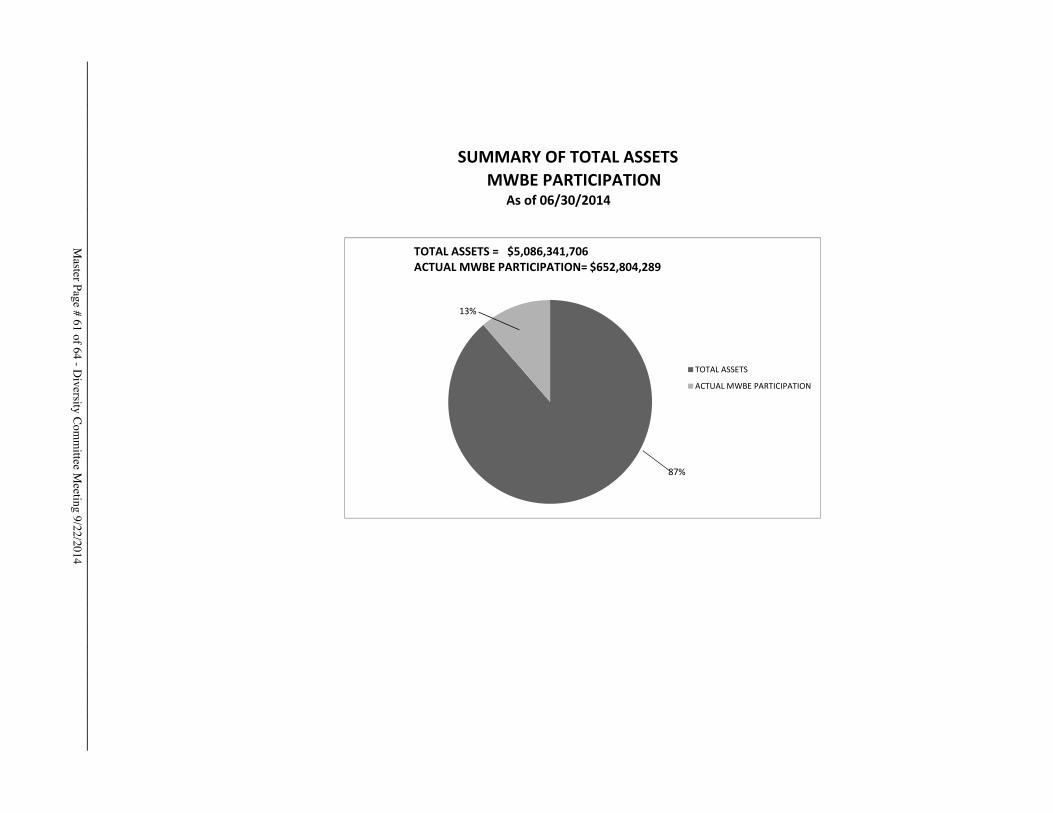
���������������SUMMARY�OF�TOTAL�ASSETS����������������������MWBE�PARTICIPATION����������������������������������As�of�06/30/2014
TOTAL�ASSETS
ACTUAL�MWBE�PARTICIPATION
13%
87%
TOTAL ASSETS�= $5,086,341,706ACTUAL MWBE�PARTICIPATION=�$652,804,289
Master Page # 61 of 64 - D
iversity Com
mittee M
eeting 9/22/2014________________________________________________________________________________
MTA CAPITAL PROJECTSMTA CAPITAL PROJECTSM/W/DBE AWARDS
JANUARY- JUNE 2014JANUARY- JUNE 2014
S t b 22 2014September 22, 2014
Master Page # 62 of 64 - D
iversity Com
mittee M
eeting 9/22/2014________________________________________________________________________________
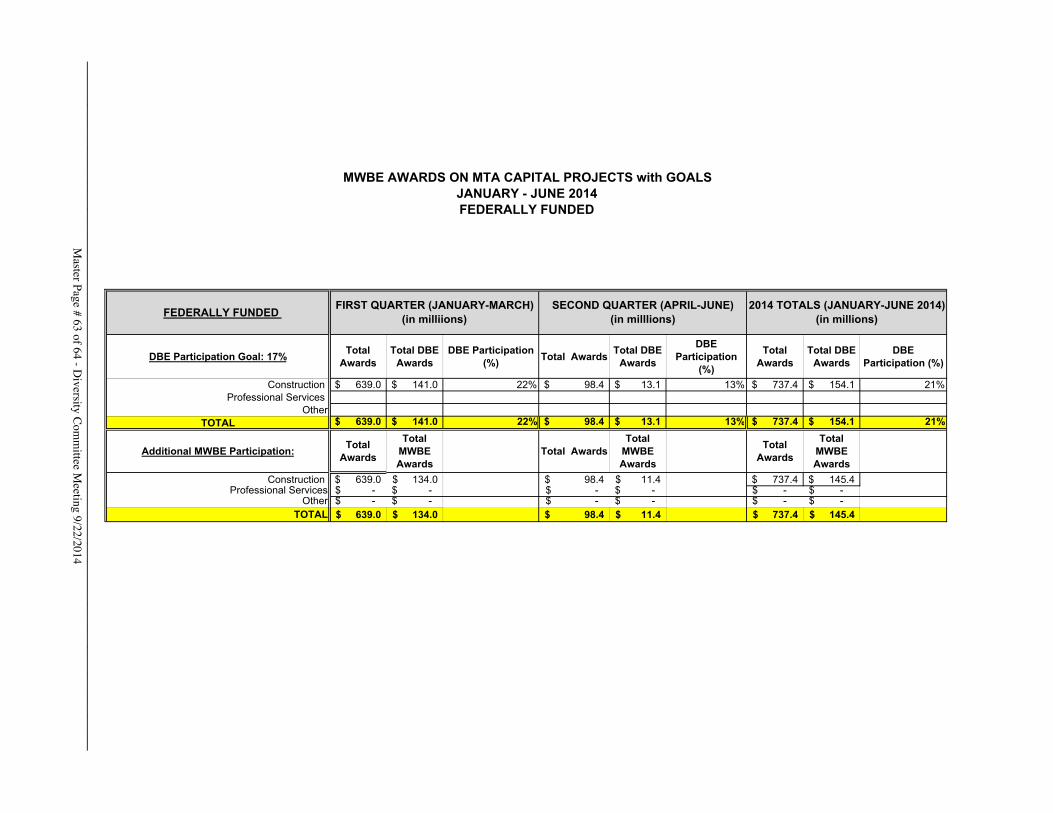
MWBE AWARDS ON MTA CAPITAL PROJECTS with GOALSJANUARY - JUNE 2014FEDERALLY FUNDED
FEDERALLY FUNDED
DBE Participation Goal: 17% Total Awards
Total DBE Awards
DBE Participation (%) Total Awards Total DBE
Awards
DBE Participation
(%)
Total Awards
Total DBE Awards
DBE Participation (%)
Construction 639.0$ 141.0$ 22% 98.4$ 13.1$ 13% 737.4$ 154.1$ 21%Professional Services
OtherTOTAL 639.0$ 141.0$ 22% 98.4$ 13.1$ 13% 737.4$ 154.1$ 21%
Additional MWBE Participation: Total Awards
Total MWBE Awards
Total AwardsTotal
MWBE Awards
Total Awards
Total MWBE Awards
Construction 639.0$ 134.0$ 98.4$ 11.4$ 737.4$ 145.4$ Professional Services -$ -$ -$ -$ -$ -$
Other -$ -$ -$ -$ -$ -$ TOTAL 639.0$ 134.0$ 98.4$ 11.4$ 737.4$ 145.4$
2014 TOTALS (JANUARY-JUNE 2014) (in millions)
FIRST QUARTER (JANUARY-MARCH) (in milliions)
SECOND QUARTER (APRIL-JUNE) (in milllions)
Master Page # 63 of 64 - D
iversity Com
mittee M
eeting 9/22/2014________________________________________________________________________________
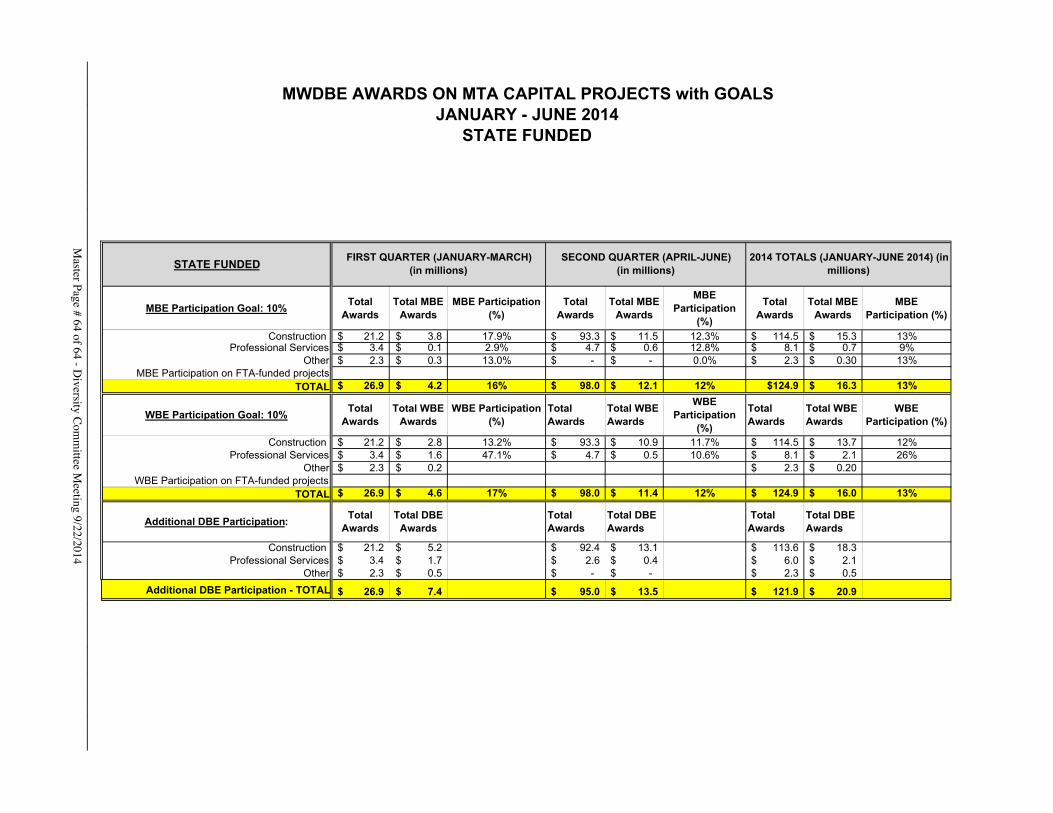
MWDBE AWARDS ON MTA CAPITAL PROJECTS with GOALSJANUARY - JUNE 2014
STATE FUNDED
STATE FUNDED
MBE Participation Goal: 10% Total Awards
Total MBE Awards
MBE Participation (%)
Total Awards
Total MBE Awards
MBE Participation
(%)
Total Awards
Total MBE Awards
MBE Participation (%)
Construction 21.2$ 3.8$ 17.9% 93.3$ 11.5$ 12.3% 114.5$ 15.3$ 13%Professional Services 3.4$ 0.1$ 2.9% 4.7$ 0.6$ 12.8% 8.1$ 0.7$ 9%
Other 2.3$ 0.3$ 13.0% -$ -$ 0.0% 2.3$ 0.30$ 13%MBE Participation on FTA-funded projects
TOTAL 26.9$ 4.2$ 16% 98.0$ 12.1$ 12% $124.9 16.3$ 13%
WBE Participation Goal: 10% Total Awards
Total WBE Awards
WBE Participation (%)
Total Awards
Total WBE Awards
WBE Participation
(%)
Total Awards
Total WBE Awards
WBE Participation (%)
Construction 21.2$ 2.8$ 13.2% 93.3$ 10.9$ 11.7% 114.5$ 13.7$ 12%Professional Services 3.4$ 1.6$ 47.1% 4.7$ 0.5$ 10.6% 8.1$ 2.1$ 26%
Other 2.3$ 0.2$ 2.3$ 0.20$ WBE Participation on FTA-funded projects
TOTAL 26.9$ 4.6$ 17% 98.0$ 11.4$ 12% 124.9$ 16.0$ 13%
Additional DBE Participation: Total Awards
Total DBE Awards
Total Awards
Total DBE Awards
Total Awards
Total DBE Awards
Construction 21.2$ 5.2$ 92.4$ 13.1$ 113.6$ 18.3$ Professional Services 3.4$ 1.7$ 2.6$ 0.4$ 6.0$ 2.1$
Other 2.3$ 0.5$ -$ -$ 2.3$ 0.5$ Additional DBE Participation - TOTAL 26.9$ 7.4$ 95.0$ 13.5$ 121.9$ 20.9$
FIRST QUARTER (JANUARY-MARCH) (in millions)
SECOND QUARTER (APRIL-JUNE) (in millions)
2014 TOTALS (JANUARY-JUNE 2014) (in millions)
Master Page # 64 of 64 - D
iversity Com
mittee M
eeting 9/22/2014________________________________________________________________________________