Embed Size (px)
Citation preview
APPLIED AND ENVIRONMENTAL MICROBIOLOGY, Jan. 2009, p. 135–146 Vol. 75, No. 10099-2240/09/$08.00�0 doi:10.1128/AEM.02894-07Copyright © 2009, American Society for Microbiology. All Rights Reserved.
Diversity and Seasonality of Bioluminescent Vibrio choleraePopulations in Chesapeake Bay�
Young-Gun Zo,1,2† Nipa Chokesajjawatee,1,3 Christopher Grim,1,2 Eiji Arakawa,4Haruo Watanabe,4 and Rita R. Colwell1,2*
Center of Marine Biotechnology, University of Maryland Biotechnology Institute, 701 E. Pratt St., Baltimore, Maryland 212021;Center of Bioinformatics and Computational Biology, University of Maryland Institute of Advanced Computer Studies,University of Maryland—College Park, College Park, Maryland 207422; National Center for Genetic Engineering and
Biotechnology, 113 Phahonyothin Rd., Klong 1, Klong Luang, Pathumthani 12120, Thailand3; and Department ofBacteriology, National Institute of Infectious Diseases, Toyama 1-23-1, Shinjuku-ku, Tokyo 162-8640, Japan4
Received 21 December 2007/Accepted 6 November 2008
Association of luminescence with phenotypic and genotypic traits and with environmental parameters wasdetermined for 278 strains of Vibrio cholerae isolated from the Chesapeake Bay during 1998 to 2000. Threeclusters of luminescent strains (A, B, and C) and two nonluminescent clusters (X and Y) were identified among180 clonal types. V. cholerae O1 strains isolated during pandemics and endemic cholera in the Ganges Deltawere related to cluster Y. Heat-stable enterotoxin (encoded by stn) and the membrane protein associated withbile resistance (encoded by ompU) were found to be linked to luminescence in strains of cluster A. Successionfrom nonluminescent to luminescent populations of V. cholerae occurred during spring to midsummer. Oc-currence of cluster A strains in water with neutral pH was contrasted with that of cluster Y strains in waterwith a pH of >8. Cluster A was found to be associated with a specific calanoid population cooccurring withcyclopoids. Cluster B was related to cluster Y, with its maximal prevalence at pH 8. Occurrence of cluster Bstrains was more frequent with warmer water temperatures and negatively correlated with maturity of thecopepod community. It is concluded that each cluster of luminescent V. cholerae strains occupies a distinctecological niche. Since the dynamics of these niche-specific subpopulations are associated with zooplanktoncommunity composition, the ecology of luminescent V. cholerae is concluded to be related to its interaction withcopepods and related crustacean species.
Historically, Vibrio cholerae has been recognized solely as ahuman pathogen, causing severe watery diarrhea in humansthat leads to either serious morbidity or death. Regardless ofthe severity of the symptoms in individual cases, however, themost harmful characteristic of the bacterium is its capacity tocause pandemic cholera, so that the number of individualswithin a human population affected by this bacterium can risequickly, causing a severe impact on the daily lives of a popu-lation, unless proper preventive measures are swiftly enacted(39). Based on a growing understanding of the ecology of V.cholerae, the pandemic capacity of pathogenic strains can beunderstood to result from its characteristic life cycle within itsnatural habitat (39). V. cholerae occurs naturally in aquaticenvironments throughout all seasons, even under conditionsunfavorable for its growth and multiplication. It proliferateswhen conditions become favorable (10). The ecology of thisspecies derives from its being an indigenous, natural inhabitantof the aquatic environment (10, 54). Therefore, an improvedunderstanding of the ecology of V. cholerae will give greater
possibilities for modeling and accurate prediction of the dy-namics of cholera epidemics.
V. cholerae has been suggested to be moderately clonal (5),comprising diverse and distinctive subpopulations. Each sub-population is furnished with unique genetic resources so thatits ecological niches are diverse (28). Indeed, only a subpopu-lation of V. cholerae, mainly those strains producing a heat-labile cholera toxin, causes pandemic cholera, whereas othersubpopulations can cause illness by producing a heat-stableenterotoxin (3, 29). The ecological niches of V. cholerae, there-fore, may well be related to many other traits that vary amongthese distinctive subpopulations.
Bioluminescence occurs in some strains of V. cholerae (32,53), and this observation prompts various hypotheses re-lated to ecological function and a potential role in patho-genesis or symbiosis (19, 30, 51). The enzyme responsiblefor luminescence, luciferase, can account for as much as 5%of cellular protein and 20% of total oxygen consumption. Insome strains, the energy committed to luminescence is 10%of the total metabolism (30). Yet luminescence is widelydistributed among marine and estuarine bacteria (51). There-fore, luminescence must be an important ecological character-istic for an aquatic bacterium, since it carries a high energycost. It is a trait expressed via quorum sensing and occurs insymbiosis, both of which are specialized responses for alterna-tive life cycles (27, 55). In the case of V. cholerae, luminescencehas been reported to occur frequently in a variety of nontoxi-genic environmental isolates. However, luminescence is lessfrequent among cholera-causing strains and their relatives. Nu-
* Corresponding author. Mailing address: Center for Bioinformaticsand Computational Biology, University of Maryland Institute of Ad-vanced Computer Studies, University of Maryland—College Park,College Park, MD 20742. Phone: (301) 405-9550. Fax: (301) 314-6654.E-mail: [email protected].
† Present address: Department of Environmental Science, KangwonNational University, Chuncheon 200-701, Republic of Korea.
� Published ahead of print on 14 November 2008.
135
Dow
nloa
ded
from
http
s://j
ourn
als.
asm
.org
/jour
nal/a
em o
n 06
Jan
uary
202
2 by
86.
206.
84.2
7.
merical taxonomy studies have determined the frequency to beapproximately 10% of strains tested (25, 53). Bioluminescencein V. cholerae, therefore, poses an ecological question withrespect to cholera epidemics, that is, whether it is a key prop-erty distinguishing survival strategies of cholera epidemic ver-sus nonepidemic strains. In any case, the ecological role ofluminescence in V. cholerae is intriguing.
In this study, we investigated the ecological significance ofluminescence in V. cholerae strains isolated from a brackishwater ecosystem by analyzing the incidence of luminescenceamong diverse V. cholerae lineages. By examining the couplingof luminescence with other bacterial traits, we found that lu-minescence is distributed differentially by phylogenetic lineage,showing a significant association with heat-stable enterotoxinin luminescent strains. Furthermore, the occurrence of lumi-nescent V. cholerae strains was found to be highly seasonal, andcertain environmental variables were found to be associatedwith presence/absence for specific luminescence lineages of V.cholerae.
MATERIALS AND METHODS
Ecological survey. Strains of V. cholerae were isolated during field surveyscarried out in the Chesapeake Bay from 1998 to 2000. Details of samplingstations and methods used to isolate the strains were reported previously(24). In brief, V. cholerae was isolated at five shore stations (B [BaltimoreInner Harbor], F [Susquehanna river flat], S [subestuary of the Rhode River],K [Kent Island], and H [Horn Point]) in the upper Chesapeake Bay(39°17.00�N to 38°58.84�N, 76°02.20�W to 76°36.32�W) and nine mid-bay,north-south transect stations. Shore sampling was done biweekly during thesummer and monthly during other seasons of the year. Samplings at thenorth-south transect stations were conducted aboard the research vessel CapeHenlopen on four occasions: once in each month of August and September1999 and in June and August 2000. The transect stations were named asfollows: 908 (39°/08.00�N, 76°/20.00�W); 858 (38°/58�N, 76°/23�W); 845 (38°/45.00�N, 76°/26.00�W); 834 (38°/34.00�N, 76°/26.00�W); 818 (38°/18.00�N, 76°/17.00�W); 804 (38°/04.00�N, 76°/13.00�W); 744 (37°/44.00�N, 76°/11.00�W);724 (37°/24.00�N, 76°/05.00�W); 707 (37°/07.00�N, 76°/07.00�W).
Station F is a freshwater site, based on salinity measurements. At the 13 otherstations, a salinity gradient was observed, increasing from north to south in theChesapeake Bay. Mean salinity ranged from 7 to 20‰. For purposes of dataanalysis, each sample collected was labeled using a string of characters made upof a one-letter site name, followed by the last digit of the year, the last digit ofthe month, and two digits for the day of sampling.
Suspended particulates, including planktonic organisms, in the surface water(0- to 1-m depth) were collected by filtering 250-ml water samples through0.2-�m-pore membrane filters or by sieving or towing ca. 150 liters of surfacewater sequentially through two nylon nets (64-�m and 20-�m mesh sizes, re-spectively), resulting in three size-fractionated samples (W � particles of �0.02�m; P � 20- to 64-�m particles; Z � particles of �64 �m). Particulate matterretained on the filters was inoculated into alkaline peptone water enrichmentflasks, from which presumptive V. cholerae strains were isolated by streaking onthiosulfate-citrate-bile salts-sucrose agar plates after incubation for 6 to 8 h.Presumptive colonies were identified as V. cholerae using a simple biochemicaltest method (8) and PCR to target a phylogenetic signature in the intergenictranscribed sequence (ITS) region between 16S rRNA and 23S rRNA (8, 9). In1999 and 2000, samples of particulate matter were also used as inocula in directplating on alkaline-peptone agar plates (1% peptone, 1% NaCl, pH 8.6, 1.5%agar). For the latter, a 32P-labeled oligonucleotide probe with the ITS sequencewas hybridized to colony lift blots to identify presumptive V. cholerae (8). Fromthis survey, a collection of 278 V. cholerae isolates was established.
Characterization of V. cholerae isolates. The Sakazaki O serotype (40) for eachisolate was determined using a pool of 210 standard polyclonal antibodies de-veloped and maintained in the Department of Bacteriology, National Institute ofInfectious Diseases, Tokyo, Japan. In addition to serotyping, 24 phenotypic and8 genotypic characteristics were employed: growth in nutrient broth (Difco,Detroit, MI) containing 0%, 1%, 3%, 6%, or 8% of NaCl and at 42°C; acidproduction from sucrose, arabinose, mannose (Mns), and mannitol (Mnt); pro-duction of enzymes, i.e., ornithine decarboxylase, lysine decarboxylase, arginine
dihydrolase, oxidase, gelatinase, amylase, lipase, and chitinase; response to themethyl red test (MR) and Voges-Proskauer test; hydrolysis of esculin; andsensitivity to 10 and 150 mg of vibriostatin agent O/129 (V150) and 50 U ofpolymyxin B.
Isolates were also tested for the presence/absence of six toxin-related genesand two outer membrane protein genes, using dot blot hybridization. The toxingenes included those encoding cholera toxin subunit A (ctxA), toxin coregulatedpilus subunit A (tcpA), zonular occludens toxin (zot), heat-stable enterotoxin(stn), and hemolysin subunit A (hlyA). The genes for the inner membranetransmembrane protein, ToxR, an important regulatory gene for cholera toxin,and the genes encoding two outer membrane proteins (OmpU and OmpW) weretargeted.
For dot blotting, genomic DNA was extracted using the DNeasy tissue kit(Qiagen Inc., Valencia, CA) and eluted in 200 �l elution buffer AE (10 mMTris-HCl [pH 9.0], 0.5 mM EDTA). Genomic DNA (500 ng) was denatured in0.4 M NaOH–10 mM EDTA and heated to 100°C for 10 min to ensure completedenaturation. DNA dots were blotted onto a MagnaCharge nylon membrane(MSI [Micron Separations Inc.], Massachusetts), using the Bio-Dot microfiltra-tion apparatus (Bio-Rad Laboratories, Hercules, CA). After blotting, the DNAwas immobilized on nylon membranes by UV cross-linking (UV cross-linker;Fisher Scientific, Pittsburgh, PA) at 120 mJ cm�2 for 30 s. Genomic DNA fromV. cholerae strains (ATCC 14035T, O1 classical biotype; N16961, O1 El Torbiotype; RC4, O139 El Tor biotype; and RC66, O14 stn�), Vibrio mimicus ATCC33653T, and Aeropyrum pernix K1, an archaebacterium, were included on theblots, serving as positive or negative controls.
Hybridization probes were generated using a PCR digoxigenin (DIG) probesynthesis kit (Roche Diagnostics, GmbH, Mannheim, Germany). Primer se-quences for amplification of each gene probe are listed elsewhere (56). Allprobes were amplified using 40 ng of template genomic DNA in 50-�l reactionvolumes. V. cholerae N16961 ctx� tcpA� zot� hlyA� ompU� ompW� �stn, where“�” denotes the absence of a trait, was used as the template to generate geneprobes, except for the stn probe, in which case V. cholerae RC66 stn� was used.Hybridization and detection were done using DIG hybridization and the CSPDprotocol (Roche Diagnostics, GmbH, Germany), respectively. In brief, the mem-branes were prehybridized at 42°C in DIG-EasyHyb solution for 30 min andhybridized in the presence of each gene probe (1 �l ml�1) at 42°C overnight.Membranes were subjected to a low-stringency wash with 2� SSC (1� SSC is0.15 M NaCl plus 0.015 M sodium citrate)–0.1% sodium dodecyl sulfate for 5min twice at room temperature and a high-stringency wash with 0.5� SSC–0.1%sodium dodecyl sulfate for 15 min twice at 65°C. Signals were detected using theCSPD chemiluminescent substrate, followed by autoradiography at room tem-perature for 5 to 30 min.
Determination of luminescent V. cholerae. Luminescence was determined bytwo methods: detection of the luxA gene directly and detection of luminescencein broth cultures. The luxA� strains were identified by dot blot hybridization. The650-bp-long, DIG-labeled DNA fragment was generated via PCR on genomicDNA of V. cholerae ATCC 14547 luxA�, using the PCR primer pair VCluxA108Fand 757R, the sequences of which are reported elsewhere (15). Dot blot hybrid-ization of the luxA probe was performed with the same protocol used for theother genes listed above. Expression of luminescence (Lum) by each strain wasdetermined using the luminescence assay method of Grim et al. (15). Test strainswere subcultured on marine agar 2216e (Difco, Detroit, MI) plates and incu-bated overnight at 30°C. Single colonies were inoculated into marine broth 2216e(Difco) medium and cultured overnight at 30°C with shaking at 200 rpm, afterwhich the broth cultures were diluted 1:500 or 1:1,000 using fresh broth. Lumi-nescence was measured at incremental time points using an LB96P luminometer(EG&G Berthold, Germany).
Phylogenetic analyses. Results of the phenotypic and genotypic tests werecoded as binary or multistate characters for each given trait of interest. In thecase of O serotyping, an isolate was assigned to one of 212 O serogroups,determined by adding the two untypeable cases, i.e., rough strain and newserogroup, not recognized in the existing 210 Sakazaki serogroups. For genotypesassayed by dot blot hybridization, five states were established, namely, absence(e.g., �hlyA) and four allele groups (hlyA1�, hlyA2�, hlyA3�, or hlyA4�), deter-mined as four levels of signal intensity. We interpreted the absence of targetedgenes from insignificant difference (one-way analysis of variance [ANOVA]; P �
0.05) of hybridization signals from the negative control, i.e., A. pernix K1, anarchaebacterium lacking homologues for any of the assayed genes. Four groupsof alleles were determined for an isolate when hybridization signals were signif-icantly higher than that for A. pernix K1. The groups were determined by recod-ing the signal intensity semiquantitatively on a scale of 1 to 4, in steps of 0 to25%, 25 to 50%, 50 to 75%, and 75 to 100% of signal intensity of the positivecontrol. Two alleles in a different allele groups were interpreted as displaying
136 ZO ET AL. APPL. ENVIRON. MICROBIOL.
Dow
nloa
ded
from
http
s://j
ourn
als.
asm
.org
/jour
nal/a
em o
n 06
Jan
uary
202
2 by
86.
206.
84.2
7.
phenotypic differences. An exception to this five-state recoding of genotype datawas luxA. Because luxA produced either 0% or �90% signal intensity, binarycoding was used. For luminescence, we created a three-state variable (state 0 ��luxA; state 1 � luxA� �Lum; state 2 � luxA� Lum�) by merging Lum and luxAinto one character variable. For all other phenotypic tests, binary coding wasused for presence or absence of responses.
Using the entire set of traits for each isolate, an operational taxonomic unit(OTU) was established. Isolates sharing an identical set of characters wererecorded as belonging to the same OTU and were treated as identical clones.Distances between OTU pairs were expressed as numbers of different phenotypiccharacteristics, or gene loci, and hierarchal cluster analysis was performed, usingthe complete linkage method. This method was determined to be appropriate formaximizing homogeneity within a cluster while minimizing the influence ofinequality of phylogenetic signals in three kinds of traits, i.e., phenotypic, geno-typic, and serotypic. To test a cluster for the presence of significant phylogeneticsignals, the permutation tail probability (PTP) test was used (2, 14). To comparesupport for two different tree topologies, the topology-dependent permutationtail probability (T-PTP) test (13), implemented as the “compare-2” method inthe PAUP* version 4.0b10 software program (44), was used. For both PTP tests,the minimum tree length of the maximum-parsimony (MP) trees under theWagner model was used as the test statistic for probability calculation. To testthe significance of a split in a phylogenetic tree, Sokal and Rohlf’s randomizationtest for distinctness (12, 42) and T-PTP test for monophyly were performed foreach bifurcating split. For the former, 20,000 permutations by the Monte Carlosimulation method were used, and significance was assessed by using a one-tailedtest.
Genomic DNA-DNA hybridization. As a measure of relatedness among iso-lates, genomic DNA of isolates randomly selected to represent phylogeneticclusters were dot blotted and hybridized with alkaline phosphatase-labeledgenomic DNA of V. cholerae O1 El Tor N16961 and V. cholerae O43 RC395.
The genomic DNA (500 ng) was dot blotted onto nylon membranes, as de-scribed above. The DNA of the probe genome was sheared to an approximatesize of 400 to 600 bp by sonication and labeled using thermostable alkalinephosphatase (GeneImages AlkPhos Direct labeling kit; Amersham BiosciencesLtd., United Kingdom). The hybridization buffer and washing solution wereprepared following the manufacturer’s protocol. The membrane was prehybrid-ized at 60°C for 30 min and hybridized (10 ng ml�1 probe) at 60°C overnight ina rotary hybridization tube. Each membrane was subjected to a high-stringencywash twice with primary wash buffer for 10 min at 70°C, followed by a low-stringency wash twice with secondary wash buffer for 5 min at room temperature.Chemifluorescent signals were generated using the ECF substrate (AmershamBiosciences). The fluorescent signals were recorded using a Storm 840 instru-ment (Molecular Dynamics Inc., Sunnyvale, CA), and the signal intensity wasquantified by ImageQuant software, version 5.1 (Molecular Dynamics, Inc.). Theresults are expressed in relative binding units (relative binding ratio [RBR]),giving the ratio of signal from the target DNA to that from the probe DNA itself(i.e., positive control) as the target DNA. Mean RBR from duplicated blottingand probing was used to infer similarity of genomes of isolates to the probestrains.
Environmental variables. Water temperature, salinity, pH, chlorophyll a con-centration, and total bacterial number (TBN) for the 31 water samples thatyielded at least one V. cholerae isolate in the survey reported by Louis et al. (24)were included in the analysis. Normality in the distribution of each variable wastested by using the Shapiro-Wilk’s W statistic after appropriate transformation.For TBN, logarithmic transformation was used, with pH values normalized bytaking the negative power of 10, yielding values of acidity of water in H� ionconcentration (20).
The zooplankton community structure of each water sample (24) was consid-ered to comprise a separate set of environmental variables explaining variationin the V. cholerae population structure. Zooplankton composition data wereavailable in units of relative abundance for 15 taxa. Taxonomic levels of the 15taxa ranged from phylum to suborder. While adult copepods were identified ascalanoid, cyclopoid, or harpacticoid (order-level taxa), copepods in the prema-ture instar stages were pooled as subclass Copepoda, without further identifica-tion. Instar stages were classified to two levels: copepod nauplii and copepodites.According to conventional taxonomic schemes (4, 7), other crustaceans enumer-ated at the level of order were amphipods and cumaceans, within the classMalacostraca. Crustaceans enumerated and identified to the class level wereostracods. Barnacles (cirripedes), the subclass Cirripedia, were also enumeratedas their nauplii: therefore as barnacle larvae. Cladocerans, i.e., suborder Clado-cera, were the only members identified and enumerated within the class Bran-chiopoda. Insect larvae comprised noncrustacean arthropods, while oligochaetes,polychaetes, nematodes, and rotifers were included in the nonarthropod taxa.
Zooplankton taxonomic composition was converted to prevalence in a sample bydividing by the total number of zooplankton in a sample.
Statistical analyses. In the statistical analyses and tests, significance was de-termined at the 5% type I error level. To explore relationships between variationof the V. cholerae OTUs and environmental variables, the ANOVA framework,implemented by redundancy analysis (RDA) (36) with the F-ratio-based permu-tation test (6), was used by employing the software program CANOCO forWindows, version 4.5 (48). This multivariate analysis is more sensitive thanperforming a set of bivariate analyses for each of pairs of a response variable andexplanatory variable because it can anticipate interactions among response vari-ables, which is typical in a community of mixed populations with ecologicalsimilarity.
RDA was performed on the prevalence of V. cholerae subpopulations as themultivariate response variable. The prevalence of each subpopulation was de-fined as the ratio of the number of OTUs to the number of all OTUs in the V.cholerae population isolated from a given enrichment flask or sample. Prevalencevalues were transformed by the square root to calculate the Hellinger distanceduring ordination analyses (23). Explanatory variables were either the five envi-ronmental variables or the relative prevalence of zooplankton taxa. The signif-icance of the canonical environmental axes was tested using the permutation teston F-ratio values by generating 499 data sets permuted with toroidal shift,keeping the temporal order of sampling at a site.
When a significant association was identified by RDA, bivariate analyses foreach pair of a response variable and significant explanatory variable were per-formed for the purposes of validating the RDA result and finding an explanationfor the significance of RDA. Correlation analysis, linear regressions, and logisticregressions were performed on prevalence and presence/absence of OTUs or onRDA residuals by employing appropriate packages in the statistical computingsoftware environment R version 2.4.1 (35).
RESULTS AND DISCUSSION
Bioluminescence. Of 278 strains, 149 possessed the luxAgene, and the luminescence assay detected expression of theluminescence gene in 136 of these strains. Thus, 13 strains inwhich the luxA gene was present did not express luminescencein this assay. Of 32 bacterial traits, excluding serotyping,luminescence was the most variable. Approximately half ofthe strains (54% and 49%) were positive by the luxA probeand the luminescence assay, respectively. The next-most-variable traits were Mnt and Mns, for which 58% and 62%were positive, respectively. In the case of the serotypingresults, 49 Sakazaki O-serogroup antigen types were found,together with two strains carrying an O-serogroup antigen thatwas not typeable by the existing pool of polyclonal antibodies.Ten rough strains were detected, and these were not typeable.Within the 49 serogroups, O135 was predominant, with 35strains belonging to this serogroup. Because serotyping yieldedthe largest number of alleles, it was judged the most variabletrait of those tested in this study.
The collection of strains included redundant clones, that is,more than one presumed identical strain was present, mostlikely a result of the enrichment culture method used to isolateV. cholerae. In subsequent analyses, clonal redundancy wasremoved by defining those clones as OTUs that had a uniquecombination of the traits tested in this study. Of 278 strains,180 combinations of traits were found, indicating a clonal re-dundancy of 1.5. That is, there were two kinds of clones forevery three strains. Of 180 types, 80 were luxA�. Therefore,luminescence was concluded to be a phylogenetically and eco-logically important characteristic of environmental isolates ofV. cholerae, based on its wide distribution among the differentOTUs. This observation also implies the presence of a positivenatural selection for luminescence trait for some V. choleraepopulations, since this energetically demanding trait is widely
VOL. 75, 2009 ECOLOGY OF BIOLUMINESCENT VIBRIO CHOLERAE 137
Dow
nloa
ded
from
http
s://j
ourn
als.
asm
.org
/jour
nal/a
em o
n 06
Jan
uary
202
2 by
86.
206.
84.2
7.
distributed among environmental V. cholerae strains. Consid-ering that expression of the bioluminescence trait is unlikely tobe neutral due to the high energy demand, together with thefact that most of the other species in the family Vibrionaceaeare luxA� by vertical inheritance (50), the observation thatdistribution of the luminescence trait was limited to only someV. cholerae subpopulations may also imply the presence of anegative natural selection against some V. cholerae subpopu-lations being luxA�. Therefore, understanding the diversity ofluminescent V. cholerae in the context of overall diversity of thespecies is a prerequisite for the study of the ecological role ofthe luminescence trait in the species.
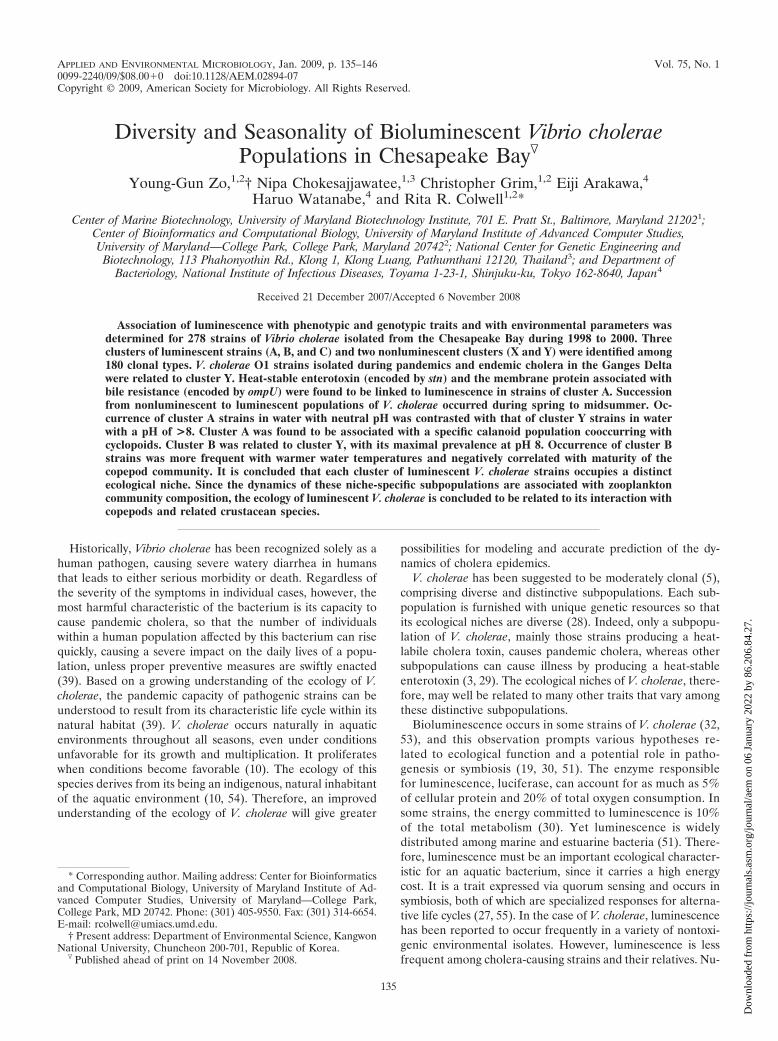
Diversity of luminescent V. cholerae. Diversity was deter-mined by complete linkage cluster analysis, based on the num-ber of different characteristics between a pair of OTUs. Weused several distance-based methods and the MP method incluster analysis and found the complete linkage method pro-duced clusters in best agreement with the ABY�XC split, de-scribed in the legend to Fig. 1a and c. The cholera toxin-relatedgenes (ctxA, tcpA, and zot) were absent in all isolates of V.cholerae. Phenotypic traits that were invariable among the iso-lates were growth in nutrient broth containing 0%, 1%, 3%,and 8% NaCl, acid production from arabinose, production ofenzymes such as arginine dihydrolase, oxidase, and gelatinase,hydrolysis of esculin, and sensitivity to 10 mg of vibriostaticagent O/129. Based on variability in serogrouping (Fig. 1a) andthe 21 variable traits (Fig. 1b), the diversity of the V. choleraeisolates was analyzed. The PTP test was used to determine theterminal cluster in which no significant phylogenetic structurecould be inferred, and 17 such clusters (P � 0.10) were found(Fig. 1a). Luminescent V. cholerae OTUs tended to form ho-mogenous clusters, but these are better understood as threedistinct clusters (cluster A, comprised of terminal clusters A1to -6, cluster B, and cluster C) rather than a single cluster. Thenonluminescent cluster Y, comprised of terminal clusters Y1to Y4, was present as a sister cluster to cluster A or B. ClusterX (terminal clusters X1 to X5) was distinguished from theothers mainly by low signal strength in DNA-probe hybridiza-tion with toxR and ompU (Fig. 1b).
When these clusters were compared with clusters formed onthe basis of genome similarity estimates by k-means clustering,support for the split between clusters ABY and XC wasstrongly reinforced (Fig. 1c). The V. cholerae O1 El TorN16961 strain, used as a probe strain in the analysis, is arepresentative of the seventh cholera pandemic strains (18),and cluster Y1 is determined to be the closest relative ofN16961 in cluster analysis. Cluster Y1 harbored two otherOTUs with the phenotypic and genotypic profiles identical tothose of V. cholerae N16961, except for serotype, namely, O28and R, and pathogenesis traits encoded by the two mobileelements CTX prophage and the toxin coregulated pilus is-land. The other probe strain, V. cholerae O43 RC395, wasselected as a random pick from the most abundant serotype ofcluster X, belonging to cluster X1. Thus, the RBR valuesshown in Fig. 1c provide the relative similarities of the ge-nomes of the OTU to those of clusters X1 and Y1. Six strainsof 22 cluster X isolates showed a higher RBR to N16961 thanto the RC395 probe. The genomic similarity of the 85 otherisolates indicated a split between clusters ABY and XC withrespect to a higher similarity to probe strains representing
clusters X and Y. However, the RBR data did not resolve theinternal structure of cluster ABY.
Without the Lum and luxA traits, 140 out of 180 OTUsmaintained the A, B, C, X, and Y cluster while 40 OTUschanged cluster membership. Among these were four OTUs ofcluster X that moved to cluster A, violating the empiricallydetermined split between clusters ABY and XC in Fig. 1c. Asdemonstrated by a recent lux operon phylogenetics study (50),lux genes are nearly entirely vertically inherited in Vibrionaceaeand thus have strong phylogenetic signals. Therefore, the phy-logenetic signals in the lux operon contributed to delineationof the 40 OTUs in Fig. 1a, yielding clusters congruent with thesplit shown in Fig. 1c.
Since the results of cluster analysis indicated that cluster Ycomprised a nonluminescent counterpart to clusters A and B,the branching order of clusters A, B, and Y became of partic-ular interest, notably to provide an understanding of whetherluminescent V. cholerae strains comprise a monophyletic clus-ter or multiple phylogenetic groups. According to results of thecluster analyses, Y4 was the nonluminescent cluster mostclosely related to the luminescent clusters. Subtle differences inphenotypic traits (amylase and MR) and genotypic traits (hlyAand ompU) were noted between clusters B and Y4 (Fig. 1b),while the strongest contrast was observed in luminescence andserogroup (Fig. 1a). According to results of the PTP tests,these differences provided sufficient evidence of heterogeneitybetween the two clusters. The compare-2 T-PTP test was ap-plied to compare the three possible branching orders involvingcluster Y4 (Fig. 1d). The phylogenetic standing of cluster B isbest supported as a sister cluster of Y4, and this result sup-ported a significant phylogenetic split and gradient betweenclusters A and Y. When the same set of hypotheses was testedwith each terminal cluster, A1 to A6, instead of the entire setof OTUs of cluster A, the hypothesis of cluster Y4 being closerto cluster B than cluster A1 to A6 was generally accepted (datanot shown). Notable was the absence of any evidence for re-latedness of terminal clusters of cluster A to cluster B, whilesignificant evidence supporting relatedness between cluster Band cluster Y4 was found. Therefore, it is concluded thatluminescence occurs within many phylogenetic subsets of V.cholerae. Furthermore, cluster B of this study represents anintermediate luminescent cluster between clusters A and Y,with a higher similarity to the nonluminescent cluster Y. Thisis further supported by the observation that 1 OTU in clusterB lacked the luxA gene and 8 of 18 luxA� OTUs in cluster Bdid not express luminescence (Fig. 1b). Thus, it is suggestedthat regulation for lux gene expression in cluster B strainsdiffers from that of the cluster A strains.
The presence of multiple luminescent clades also providesan interpretation of the evolution of luminescence in V. chol-erae. With respect to distribution of luminescence in clusters A,B, and Y, two competing hypotheses can be proposed, thatluminescent OTUs in cluster B are relatives of OTUs of clusterY, having acquired luminescence by gene transfer, or thatluminescence was lost in the OTUs of cluster Y via divergencefrom a common luminescent ancestor of clusters A, B, and Y,arising from counterselective pressure in the ecological nicheof cluster Y. The relatively low rate of expression of lumines-cence by cluster B isolates (Fig. 1b) supports both hypothesesin different ways. For the hypothesis of selective acquisition,
138 ZO ET AL. APPL. ENVIRON. MICROBIOL.
Dow
nloa
ded
from
http
s://j
ourn
als.
asm
.org
/jour
nal/a
em o
n 06
Jan
uary
202
2 by
86.
206.
84.2
7.
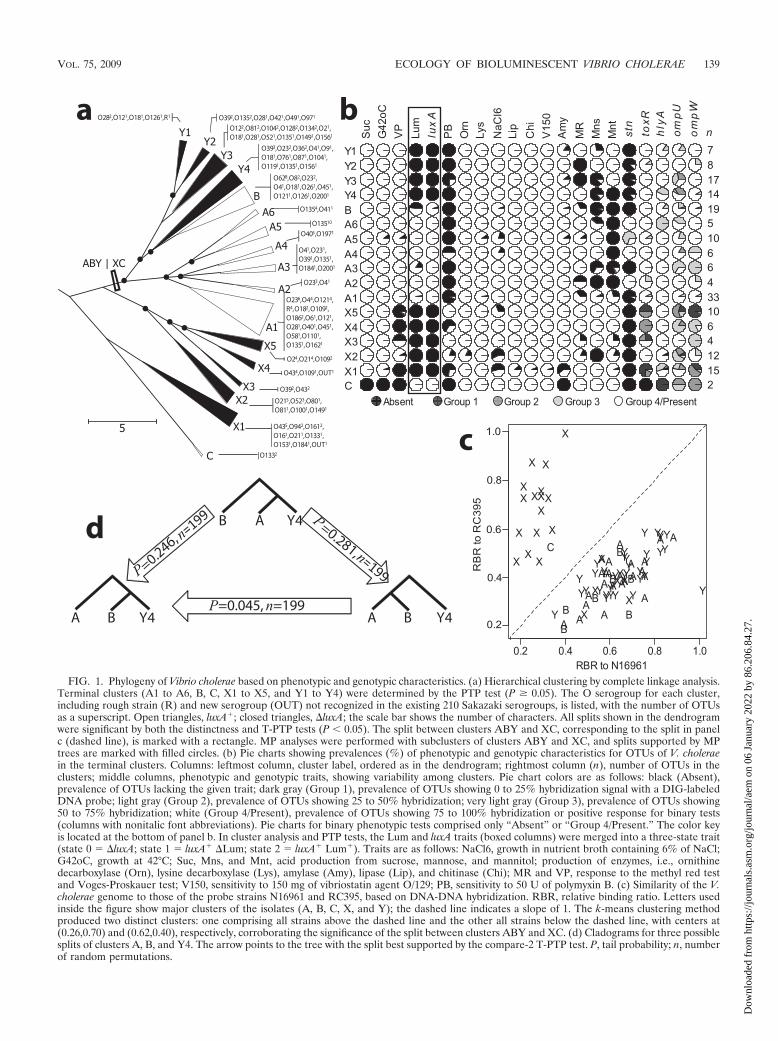
FIG. 1. Phylogeny of Vibrio cholerae based on phenotypic and genotypic characteristics. (a) Hierarchical clustering by complete linkage analysis.Terminal clusters (A1 to A6, B, C, X1 to X5, and Y1 to Y4) were determined by the PTP test (P � 0.05). The O serogroup for each cluster,including rough strain (R) and new serogroup (OUT) not recognized in the existing 210 Sakazaki serogroups, is listed, with the number of OTUsas a superscript. Open triangles, luxA�; closed triangles, �luxA; the scale bar shows the number of characters. All splits shown in the dendrogramwere significant by both the distinctness and T-PTP tests (P 0.05). The split between clusters ABY and XC, corresponding to the split in panelc (dashed line), is marked with a rectangle. MP analyses were performed with subclusters of clusters ABY and XC, and splits supported by MPtrees are marked with filled circles. (b) Pie charts showing prevalences (%) of phenotypic and genotypic characteristics for OTUs of V. choleraein the terminal clusters. Columns: leftmost column, cluster label, ordered as in the dendrogram; rightmost column (n), number of OTUs in theclusters; middle columns, phenotypic and genotypic traits, showing variability among clusters. Pie chart colors are as follows: black (Absent),prevalence of OTUs lacking the given trait; dark gray (Group 1), prevalence of OTUs showing 0 to 25% hybridization signal with a DIG-labeledDNA probe; light gray (Group 2), prevalence of OTUs showing 25 to 50% hybridization; very light gray (Group 3), prevalence of OTUs showing50 to 75% hybridization; white (Group 4/Present), prevalence of OTUs showing 75 to 100% hybridization or positive response for binary tests(columns with nonitalic font abbreviations). Pie charts for binary phenotypic tests comprised only “Absent” or “Group 4/Present.” The color keyis located at the bottom of panel b. In cluster analysis and PTP tests, the Lum and luxA traits (boxed columns) were merged into a three-state trait(state 0 � �luxA; state 1 � luxA� �Lum; state 2 � luxA� Lum�). Traits are as follows: NaCl6, growth in nutrient broth containing 6% of NaCl;G42oC, growth at 42°C; Suc, Mns, and Mnt, acid production from sucrose, mannose, and mannitol; production of enzymes, i.e., ornithinedecarboxylase (Orn), lysine decarboxylase (Lys), amylase (Amy), lipase (Lip), and chitinase (Chi); MR and VP, response to the methyl red testand Voges-Proskauer test; V150, sensitivity to 150 mg of vibriostatin agent O/129; PB, sensitivity to 50 U of polymyxin B. (c) Similarity of the V.cholerae genome to those of the probe strains N16961 and RC395, based on DNA-DNA hybridization. RBR, relative binding ratio. Letters usedinside the figure show major clusters of the isolates (A, B, C, X, and Y); the dashed line indicates a slope of 1. The k-means clustering methodproduced two distinct clusters: one comprising all strains above the dashed line and the other all strains below the dashed line, with centers at(0.26,0.70) and (0.62,0.40), respectively, corroborating the significance of the split between clusters ABY and XC. (d) Cladograms for three possiblesplits of clusters A, B, and Y4. The arrow points to the tree with the split best supported by the compare-2 T-PTP test. P, tail probability; n, numberof random permutations.
VOL. 75, 2009 ECOLOGY OF BIOLUMINESCENT VIBRIO CHOLERAE 139
Dow
nloa
ded
from
http
s://j
ourn
als.
asm
.org
/jour
nal/a
em o
n 06
Jan
uary
202
2 by
86.
206.
84.2
7.

the observation implies a difference in the regulatory systemfor the luminescence gene expression. For the hypothesis of acounterselective loss, the observation can be interpreted as arelatively high prevalence of a nonfunctional lux operon con-sisting of one or more pseudogenes. Comparative studies ofthe structure and regulation of the lux operon of cluster A andB strains should be able to determine which of the two alter-native evolutionary pathways occurs within V. cholerae popu-lations in nature.
Another important question in the evolutionary populationbiology of V. cholerae is whether the cholera-pathogenic cladecan carry the luminescence trait or whether the trait is notcompatible with the ecological niche of this V. cholerae clade.Previous studies showed that V. cholerae forms clonal subpopu-lations and that cholera epidemic clades are highly clonal (5,57). The V. cholerae O1 El Tor N16961 strain, a representativeof the V. cholerae El Tor lineage responsible for the current,seventh pandemic of cholera, revealed 21 genotypic and phe-notypic traits identical to those of two OTUs of cluster Y1.Differences of the cluster Y1 strains from the O1 El Tor ref-erence strain were serogroup (O28 and rough type versus O1and O139) and pathogenicity. When the presence/absence ofthe pathogenicity genes was included in the cluster analysis, V.cholerae N16961 formed a long branch within cluster Y1, sug-gesting phylogenetic separation between the closest relatives ofepidemic lineages and luminescent clades (clusters A, B, andC) of V. cholerae.
Traits linked to bioluminescence. After all trait data werecoded in binary format, the association coefficient � (42) wascalculated and a chi-square test of independence was per-formed between luxA and other traits (Table 1). To distinguisha luxA-specific association of traits from a general phylogeneticcohesion of traits arising from fixation of traits in large phylo-genetic clusters, we analyzed the association of luxA with othertraits by comparing a pair of sister clusters: one cluster withluminescent strains and its sister cluster without luminescentstrains. Since clusters A, B, and Y were monophyletic, com-parisons of cluster A versus cluster Y and cluster B versuscluster Y met the criterion. In cluster AY, the luminescencetrait was positively associated with Mns�, �Mnt, MR�,ompU4�, stn3�, and stn4�, where “�” denotes the absence of atrait in an OTU. Since ompU4� genes of toxigenic strains,including V. cholerae N16961, are known to code for bile re-sistance (34), intestinal adherence (43), and acid tolerance (26)and stn4� is the gene encoding enterotoxin (31), the pattern ofcohesion of traits in cluster AY suggested an association ofluminescence with enteropathogenic properties for environ-mental V. cholerae strains. In cluster BY, luxA� was linked with�Mns and �Mnt, suggesting cohesion of luminescencewith limited sugar utilization. Thus, the single trait in commonwith luxA in strains of both clusters A and B was a lack of theability to utilize mannitol (�Mnt). The two OTU types incluster C (Fig. 1b) were based on only three isolates from theITS oligonucleotide hybridization on colonies from the S9830water sample; therefore, association analysis was not statisti-cally meaningful. However, since all three cluster C strainsutilized mannitol, it is concluded that none of the traits ana-lyzed in this study were linked to luxA across the three lumi-nescent clusters.
In conclusion, several traits were found to be significant in
distinguishing a luminescent cluster from its nonluminescentsister cluster. However, none of the traits were linked to luxAacross all of the luminescent clusters, indicating lineage-spe-cific cohesion of the lux operon with other traits. One mecha-nism for this lineage specificity is that bioluminescence in eachluminescent cluster plays a different ecological role, i.e., adifferent ecological niche for each of the luminescent clusters.The microhabitat and genomic composition of the three clus-ters are different. For cluster A, with luxA cohesion to ompU4�
and stn4�, interaction with eukaryotic organisms may be animportant characteristic, since OmpU in pathogenic V. chol-erae strains encodes bile resistance, intestinal adherence, andacid tolerance and stn4� encodes enterotoxin. Significant as-sociation with specific O serogroups (Table 1) suggests lumi-nescent subpopulations of V. cholerae are determined by theirinteraction with eukaryotic hosts. Understanding the dynamicsand ecological role of luminescent V. cholerae can be achievedby studying subpopulations of luminescent V. cholerae, not inthe aggregated set of entire subpopulations.
Spatial and temporal variation. Since it was recognized,from the results described above, that the population of lumi-nescent V. cholerae strains comprises phenotypic, genotypic,and possibly ecological subpopulations, localization of lumi-
TABLE 1. Prevalence and association coefficients (�) of luxA withother traitsa
Set Traitb
% Positive fortrait among:
� value P value�luxA
isolatesluxA�
isolates
Cluster AY Mns 35 81 0.47 0.001Mnt 69 39 �0.29 0.002MR 48 77 0.30 0.002
ompU2� 21 2 �0.32 0.001ompU4� 58 83 0.27 0.007
stn3� 0 11 0.22 0.039stn4� 8 31 0.28 0.004
Serogroup O23 4 16 0.18 0.029Serogroup O40 0 9 0.21 0.037Serogroup O135 8 25 0.22 0.028
Cluster BY Mns 35 6 �0.29 0.026Mnt 67 0 �0.60 0.001
Serogroup O62 2 39 0.50 0.001
a A set is the collection of all OTUs in the designated cluster for whichfrequencies were calculated; each percent-positive value is the ratio of the num-ber of OTUs with a given trait to the number of total OTUs with/without luxA;P is the probability from a chi-square test of independence by 20,000-timesMonte Carlo simulation on the 2 � 2 table of frequencies of isolates, where thepresence/absence of the given trait and the presence/absence of luxA were as-signed as rows and columns, respectively. A P value of �0.05 indicates validity ofthe null hypothesis, i.e., incidences of a given trait and that of the luxA� trait areindependently distributed, just as in the case of random tossing of a number ofballs into a 2 � 2 lattice, and these cases were omitted in the table, e.g., ompU1�
and ompU3�. A P value of 0.05 indicates the null hypothesis is rejected,allowing the conclusion that occurrences of given traits are not independent butare associated with the luxA� trait, at a 5% type I error; � is the associationcoefficient, calculated as the square root of X2/n, where X2 is the test statisticfrom a chi-square test and n is the total sample size, i.e., 112 or 67 for set AY orBY, respectively, and increasing from 0 to �1 along the strength of a positiveassociation between rows and columns of the 2 � 2 table or from 0 to �1 alonga negative association.
b For variables with multiple levels (genotypic traits and Sakazaki serogroup),a multinomial chi-square test was also performed: P values were 0.001 forompU and stn in cluster AY, and P values were 0.001 for the Sakazaki sero-group in both clusters AY and BY.
140 ZO ET AL. APPL. ENVIRON. MICROBIOL.
Dow
nloa
ded
from
http
s://j
ourn
als.
asm
.org
/jour
nal/a
em o
n 06
Jan
uary
202
2 by
86.
206.
84.2
7.
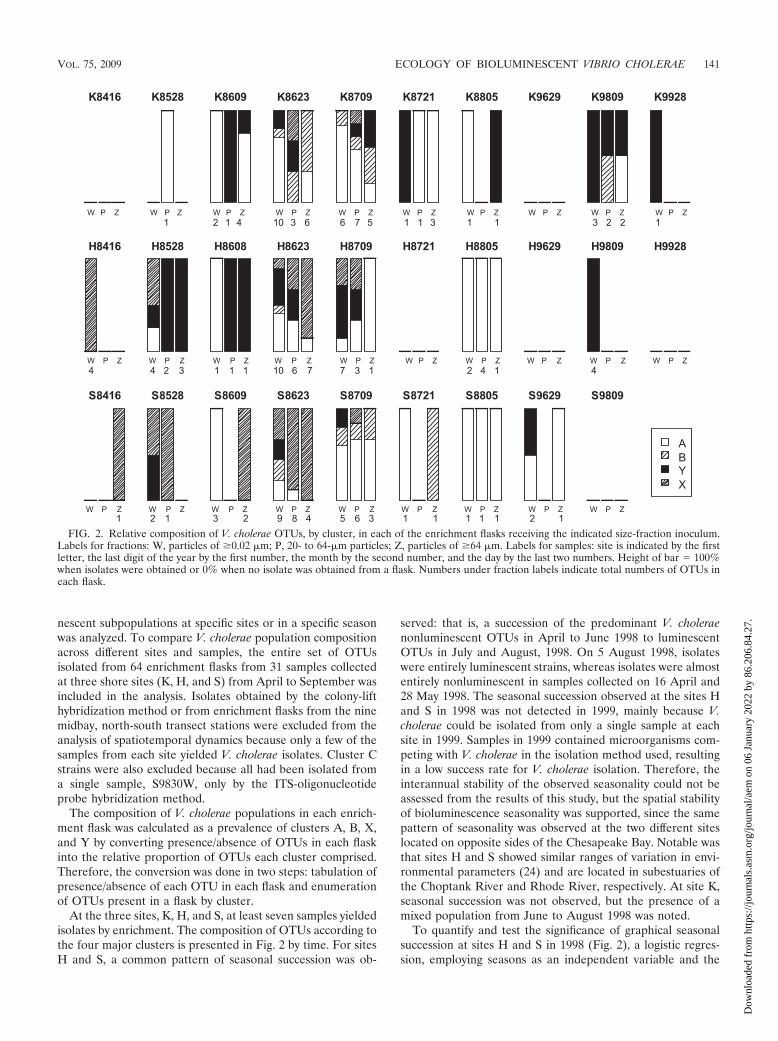
nescent subpopulations at specific sites or in a specific seasonwas analyzed. To compare V. cholerae population compositionacross different sites and samples, the entire set of OTUsisolated from 64 enrichment flasks from 31 samples collectedat three shore sites (K, H, and S) from April to September wasincluded in the analysis. Isolates obtained by the colony-lifthybridization method or from enrichment flasks from the ninemidbay, north-south transect stations were excluded from theanalysis of spatiotemporal dynamics because only a few of thesamples from each site yielded V. cholerae isolates. Cluster Cstrains were also excluded because all had been isolated froma single sample, S9830W, only by the ITS-oligonucleotideprobe hybridization method.
The composition of V. cholerae populations in each enrich-ment flask was calculated as a prevalence of clusters A, B, X,and Y by converting presence/absence of OTUs in each flaskinto the relative proportion of OTUs each cluster comprised.Therefore, the conversion was done in two steps: tabulation ofpresence/absence of each OTU in each flask and enumerationof OTUs present in a flask by cluster.
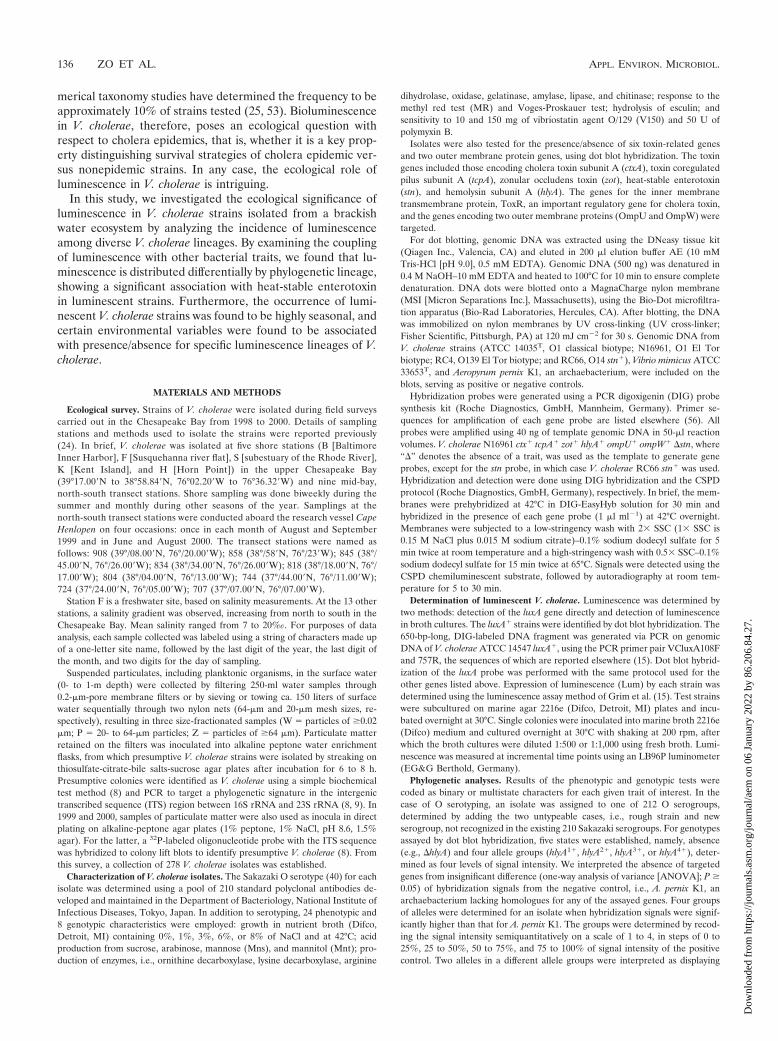
At the three sites, K, H, and S, at least seven samples yieldedisolates by enrichment. The composition of OTUs according tothe four major clusters is presented in Fig. 2 by time. For sitesH and S, a common pattern of seasonal succession was ob-
served: that is, a succession of the predominant V. choleraenonluminescent OTUs in April to June 1998 to luminescentOTUs in July and August, 1998. On 5 August 1998, isolateswere entirely luminescent strains, whereas isolates were almostentirely nonluminescent in samples collected on 16 April and28 May 1998. The seasonal succession observed at the sites Hand S in 1998 was not detected in 1999, mainly because V.cholerae could be isolated from only a single sample at eachsite in 1999. Samples in 1999 contained microorganisms com-peting with V. cholerae in the isolation method used, resultingin a low success rate for V. cholerae isolation. Therefore, theinterannual stability of the observed seasonality could not beassessed from the results of this study, but the spatial stabilityof bioluminescence seasonality was supported, since the samepattern of seasonality was observed at the two different siteslocated on opposite sides of the Chesapeake Bay. Notable wasthat sites H and S showed similar ranges of variation in envi-ronmental parameters (24) and are located in subestuaries ofthe Choptank River and Rhode River, respectively. At site K,seasonal succession was not observed, but the presence of amixed population from June to August 1998 was noted.
To quantify and test the significance of graphical seasonalsuccession at sites H and S in 1998 (Fig. 2), a logistic regres-sion, employing seasons as an independent variable and the
FIG. 2. Relative composition of V. cholerae OTUs, by cluster, in each of the enrichment flasks receiving the indicated size-fraction inoculum.Labels for fractions: W, particles of �0.02 �m; P, 20- to 64-�m particles; Z, particles of �64 �m. Labels for samples: site is indicated by the firstletter, the last digit of the year by the first number, the month by the second number, and the day by the last two numbers. Height of bar � 100%when isolates were obtained or 0% when no isolate was obtained from a flask. Numbers under fraction labels indicate total numbers of OTUs ineach flask.
VOL. 75, 2009 ECOLOGY OF BIOLUMINESCENT VIBRIO CHOLERAE 141
Dow
nloa
ded
from
http
s://j
ourn
als.
asm
.org
/jour
nal/a
em o
n 06
Jan
uary
202
2 by
86.
206.
84.2
7.

presence of luminescent OTUs as a response variable, wasperformed. Sampling dates were divided into two seasons:spring (April to June) and summer (July to August). Thelog-odd ratio of the summer population being luminescent was2.8 � 1.1 (standard error) and 3.5 � 1.2 at sites H and S,respectively, implying that the odds for V. cholerae being lumi-nescent during the summer was 17 and 34 times higher, onaverage, than that for its being nonluminescent (P 0.01;likelihood ratio test). For site K, the regression coefficient of0.16 � 0.2 was not significant (P � 0.85), implying the absenceof seasonal succession at this site.
The significance of a pattern of site-specific seasonal succes-sion of the V. cholerae populations was also tested for the fourgroups (clusters A, B, X, and Y) as response variables, em-ploying RDA with the permutation test. The prevalences forthe four groups were square root transformed and used asresponse variables in the RDA, while site, date, and inoculumfraction were used as explanatory factors in a three-way facto-rial design. V. cholerae compositions of samples collected atsite K were significantly different from those for the other sites(P � 0.04; permutation test on F ratio; n � 499). The effects ofsampling date were significant for sites H and S (P 0.03) butnot for site K (P � 0.45). The effect of the three-kind inoculumsize fractions (W, P, and Z) was not significant, either for allsites or for each site. The interaction term between the dateand the fraction was not significant (P � 0.42). Since theinoculum fraction was not a significant factor, the three frac-tions of each sample were treated as replicates from the samesample, a logical interpretation for the P and Z fractions be-cause they were from the same volume of water sample andwere sequentially filtered. The reason that fraction W and theother fractions were comparable is that the effect by differencein volume and particle size was not large enough to cause asignificant difference in the bacterial composition detected byenrichment, which is believed to have a relatively high sam-pling error. Another explanation is that the high success ratefor the W fraction compared to the others overcame the vol-ume difference between W and the other two inoculum prep-arations. Even though sample volumes for the W fraction weresmaller, enrichment flasks receiving W fraction inocula yieldeda larger number of isolates and more frequently than the otherfractions, as shown by Q statistics in the work of Louis et al.(24), by having smaller numbers of competitors.
In conclusion, seasonal succession from nonluminescent toluminescent populations was observed for shore site samplescollected at H and S, and luminescent V. cholerae were moreprevalent during midsummer (June to August) than in thespring. However, this seasonal pattern differed according tosite, exemplified by site K. Therefore, significant spatial andtemporal variation was observed in the dynamics of lumines-cent V. cholerae populations, with site-specific seasonal succes-sion. The possibility of an association of luminescence withselected parameters of the estuarine environment undergoingsite-specific seasonal changes was therefore analyzed.
Association of environmental parameters with biolumines-cence. The relationship of environmental parameters to thedynamics of luminescent V. cholerae subpopulations was ana-lyzed by RDA. Environmental parameters recorded for theshore survey sites were water temperature, salinity, pH, chlo-rophyll a concentration, and TBN. Results for the midbay
transect sampling stations were not included in this analysisbecause only a few of the environmental parameters wererecorded and only for a limited number of samples. The com-position of V. cholerae populations in each shore sample wasexpressed as the prevalence of clusters A, B, and Y among theentire set of unique OTUs detected in the three enrichmentflasks (W, P, and Z) for each shore sample. The prevalence ofcluster X was excluded in this analysis to avoid artificial colin-earity among the response variables and to take its substantialphylogenetic distinction into account.
When the data for all five shore sites were analyzed, the onlysignificant factor accounting for the distribution of the threeclusters was the interaction term for salinity and pH, whichexplained 25% of the total variance in V. cholerae composition(P 0.01; permutation test on F ratio; n � 499). The signifi-cant interaction originated from the fact that site F was essen-tially freshwater throughout the year and the other environ-mental parameters of site F varied in concert with theirvariations at the other brackish water sites. In other words, pHand salinity were coupled at the brackish water sites but not atthe freshwater site. To analyze relationships between the V.cholerae population structure and environmental parameterswithout the effect of pH and salinity, site F was excluded fromsubsequent analyses.
For sites B, K, H, and S, forward selection in multiple re-gressions in the RDA framework of CANOCO identified threesignificant explanatory factors: pH, TBN, and interaction be-tween temperature and TBN. The pH explained the first 29%of the total variance in the prevalence of A, B, and Y clusters,with high significance (P 0.01). The interaction of tem-perature and TBN explained the next 17% of the totalvariance (P � 0.03), whereas TBN alone explained 7% ofthe total variance (P � 0.03).
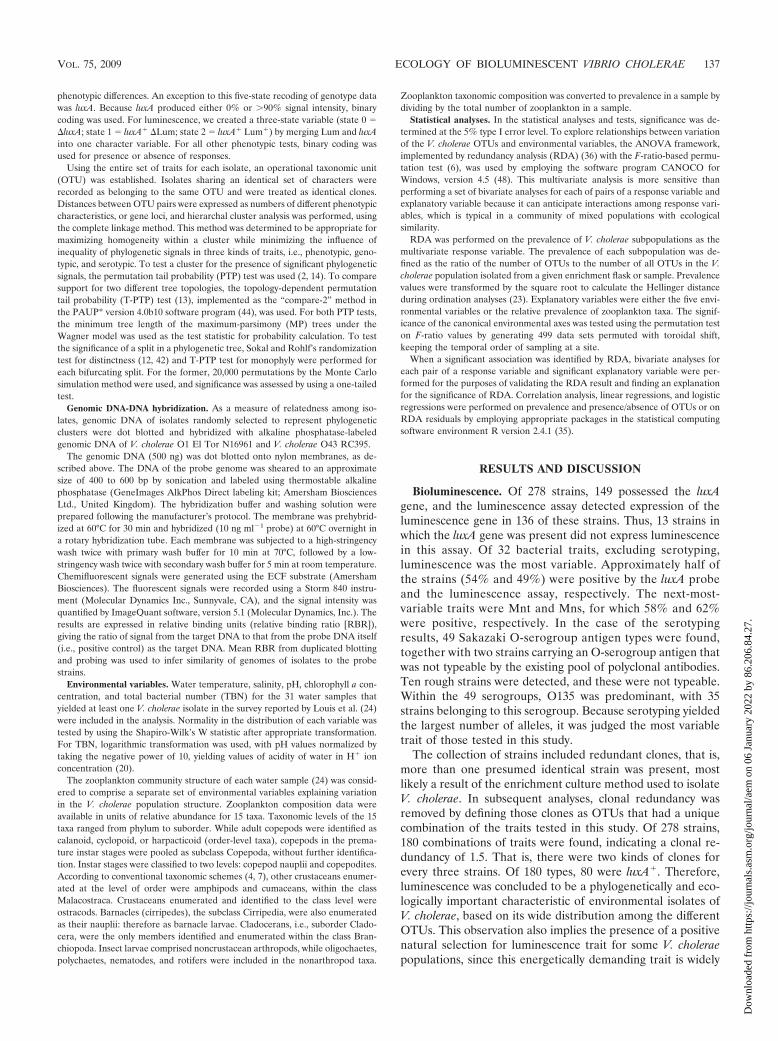
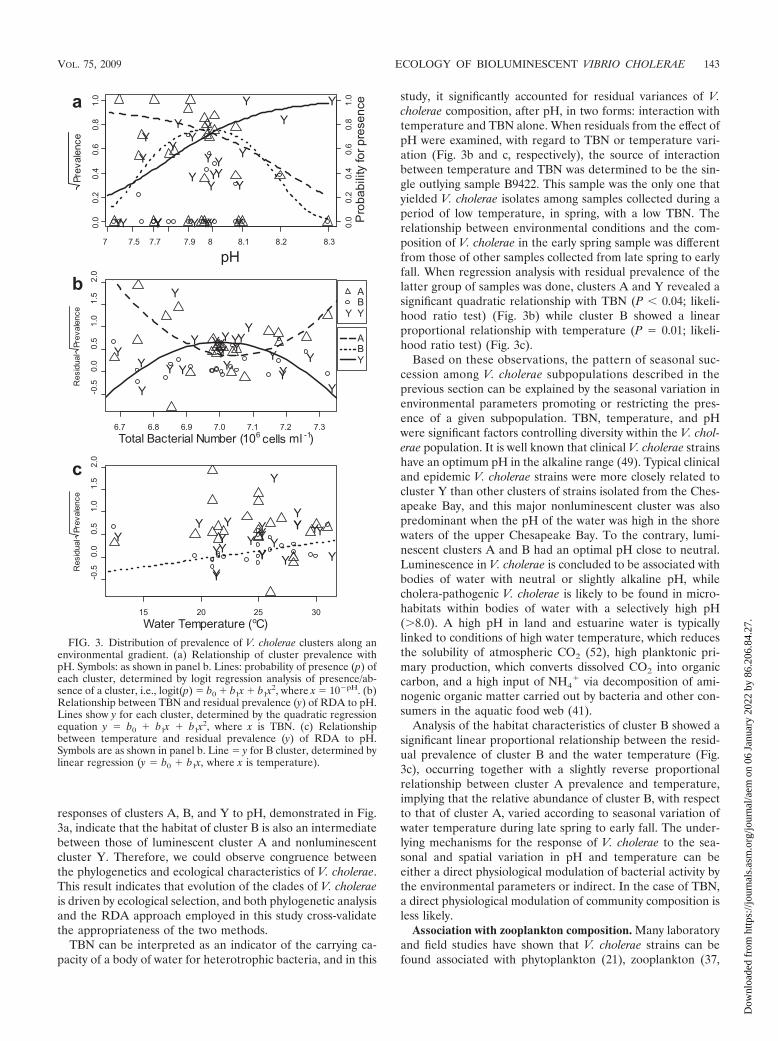
Based on the RDA results, the relationship of V. choleraecomposition with pH was examined in detail by bivariate re-gression analyses. As shown in Fig. 3a, the prevalences ofclusters A and Y showed a monotonic relationship with pHwhile being antagonistic to each other. In contrast, cluster Bshowed unimodal distribution with an optimum range inter-mediate to those of the other clusters. This relationship wasalso confirmed by results of logistic regression employing thepresence/absence of each cluster in each sample as the re-sponse variables (Fig. 3a). The probability of occurrence ofclusters A and Y was related to pH as half-sections of theGaussian response curve (P � 0.31 and P � 0.72, respectively;goodness-of-fit test). The probability of occurrence of cluster Bappeared as a typical Gaussian logit distribution, with the op-timum pH 8.0 (P � 0.29; goodness-of-fit test). A Gaussian logitdistribution of a species along an environmental gradient is themost general form of an environment-species relationship (47).Prevalence values of each cluster showed a good fit to theGaussian logit distribution of probability along a pH gradient(Fig. 3a), validating the view of a unimodal distribution ofbacterial subpopulations along an environmental gradient, e.g.,the pH gradient.
Based on phylogenetic analyses, cluster B is more closelyrelated to cluster Y than to cluster A (Fig. 1a and d). However,cluster B was luminescent, a characteristic absent in cluster Y.Cluster B can be thought of as an OTU that was added, withluminescence, to the genomic foundation of cluster Y. The
142 ZO ET AL. APPL. ENVIRON. MICROBIOL.
Dow
nloa
ded
from
http
s://j
ourn
als.
asm
.org
/jour
nal/a
em o
n 06
Jan
uary
202
2 by
86.
206.
84.2
7.
responses of clusters A, B, and Y to pH, demonstrated in Fig.3a, indicate that the habitat of cluster B is also an intermediatebetween those of luminescent cluster A and nonluminescentcluster Y. Therefore, we could observe congruence betweenthe phylogenetics and ecological characteristics of V. cholerae.This result indicates that evolution of the clades of V. choleraeis driven by ecological selection, and both phylogenetic analysisand the RDA approach employed in this study cross-validatethe appropriateness of the two methods.
TBN can be interpreted as an indicator of the carrying ca-pacity of a body of water for heterotrophic bacteria, and in this
study, it significantly accounted for residual variances of V.cholerae composition, after pH, in two forms: interaction withtemperature and TBN alone. When residuals from the effect ofpH were examined, with regard to TBN or temperature vari-ation (Fig. 3b and c, respectively), the source of interactionbetween temperature and TBN was determined to be the sin-gle outlying sample B9422. This sample was the only one thatyielded V. cholerae isolates among samples collected during aperiod of low temperature, in spring, with a low TBN. Therelationship between environmental conditions and the com-position of V. cholerae in the early spring sample was differentfrom those of other samples collected from late spring to earlyfall. When regression analysis with residual prevalence of thelatter group of samples was done, clusters A and Y revealed asignificant quadratic relationship with TBN (P 0.04; likeli-hood ratio test) (Fig. 3b) while cluster B showed a linearproportional relationship with temperature (P � 0.01; likeli-hood ratio test) (Fig. 3c).
Based on these observations, the pattern of seasonal suc-cession among V. cholerae subpopulations described in theprevious section can be explained by the seasonal variation inenvironmental parameters promoting or restricting the pres-ence of a given subpopulation. TBN, temperature, and pHwere significant factors controlling diversity within the V. chol-erae population. It is well known that clinical V. cholerae strainshave an optimum pH in the alkaline range (49). Typical clinicaland epidemic V. cholerae strains were more closely related tocluster Y than other clusters of strains isolated from the Ches-apeake Bay, and this major nonluminescent cluster was alsopredominant when the pH of the water was high in the shorewaters of the upper Chesapeake Bay. To the contrary, lumi-nescent clusters A and B had an optimal pH close to neutral.Luminescence in V. cholerae is concluded to be associated withbodies of water with neutral or slightly alkaline pH, whilecholera-pathogenic V. cholerae is likely to be found in micro-habitats within bodies of water with a selectively high pH(�8.0). A high pH in land and estuarine water is typicallylinked to conditions of high water temperature, which reducesthe solubility of atmospheric CO2 (52), high planktonic pri-mary production, which converts dissolved CO2 into organiccarbon, and a high input of NH4
� via decomposition of ami-nogenic organic matter carried out by bacteria and other con-sumers in the aquatic food web (41).
Analysis of the habitat characteristics of cluster B showed asignificant linear proportional relationship between the resid-ual prevalence of cluster B and the water temperature (Fig.3c), occurring together with a slightly reverse proportionalrelationship between cluster A prevalence and temperature,implying that the relative abundance of cluster B, with respectto that of cluster A, varied according to seasonal variation ofwater temperature during late spring to early fall. The under-lying mechanisms for the response of V. cholerae to the sea-sonal and spatial variation in pH and temperature can beeither a direct physiological modulation of bacterial activity bythe environmental parameters or indirect. In the case of TBN,a direct physiological modulation of community composition isless likely.
Association with zooplankton composition. Many laboratoryand field studies have shown that V. cholerae strains can befound associated with phytoplankton (21), zooplankton (37,
FIG. 3. Distribution of prevalence of V. cholerae clusters along anenvironmental gradient. (a) Relationship of cluster prevalence withpH. Symbols: as shown in panel b. Lines: probability of presence (p) ofeach cluster, determined by logit regression analysis of presence/ab-sence of a cluster, i.e., logit(p) � b0 � b1x � b1x2, where x � 10�pH. (b)Relationship between TBN and residual prevalence (y) of RDA to pH.Lines show y for each cluster, determined by the quadratic regressionequation y � b0 � b1x � b1x2, where x is TBN. (c) Relationshipbetween temperature and residual prevalence (y) of RDA to pH.Symbols are as shown in panel b. Line � y for B cluster, determined bylinear regression (y � b0 � b1x, where x is temperature).
VOL. 75, 2009 ECOLOGY OF BIOLUMINESCENT VIBRIO CHOLERAE 143
Dow
nloa
ded
from
http
s://j
ourn
als.
asm
.org
/jour
nal/a
em o
n 06
Jan
uary
202
2 by
86.
206.
84.2
7.
46), and insects (16). Based on these established facts, theassociation of the prevalences of luminescent V. cholerae sub-populations with pH, TBN, and temperature suggests the pos-sibility that aquatic fauna and flora might provide or functionas microhabitats for V. cholerae and variation in the abundanceof the flora and fauna of the estuary is an indirect mechanismof this association. Since the aquatic fauna and flora also un-dergo seasonal succession, a specific association of a planktontaxon with a specific V. cholerae subpopulation can also explainthe seasonal shifts in prevalence of luminescent V. cholerae.From the previous study of Louis et al. (24), the zooplanktoncommunity composition, in terms of relative abundance, wasavailable. Thus, we analyzed the taxon-specific association ofzooplankton taxa and luminescent V. cholerae subpopulationsby RDA.
For samples from sites B, K, H, and S, both V. choleraesubpopulation prevalences and zooplankton by taxon preva-lences were available for 22 samples. Based on the mean prev-alence of each taxon, the two crustacean nauplii (copepodnauplii and cirripede nauplii) were judged predominant(62% � 27% [standard deviation] and 11% � 12%, respec-tively), followed by calanoids at a mean prevalence of 8% �20%. In general, adult copepods (calanoids, cyclopoids, andharpacticoids) ranked within the top nine predominant taxawith �1% mean prevalence. Rotifers ranked as the fourthpredominant group and cladocerans as the eighth, with meanprevalences of 5% � 10% and 2% � 5%, respectively. Basedon these statistics, the predominant taxa were determined asthe taxonomic hierarchy of the crustacean class, the copepodsubclass, and the calanoid order. Rotifers and cladoceranswere also recognized as exceptions to this pattern since theywere abundant groups depending on the season. From thesedata, the a priori hypothesis developed was that crustaceanprevalence is a determinant of luminescent V. cholerae distri-bution, and this was tested.
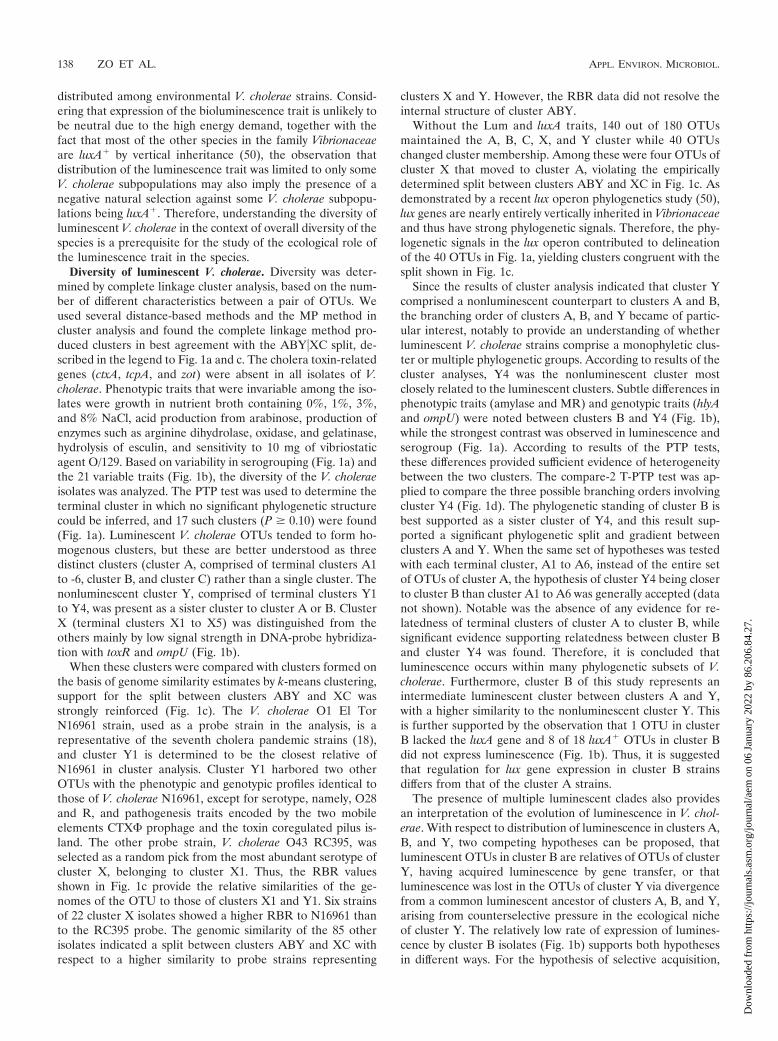
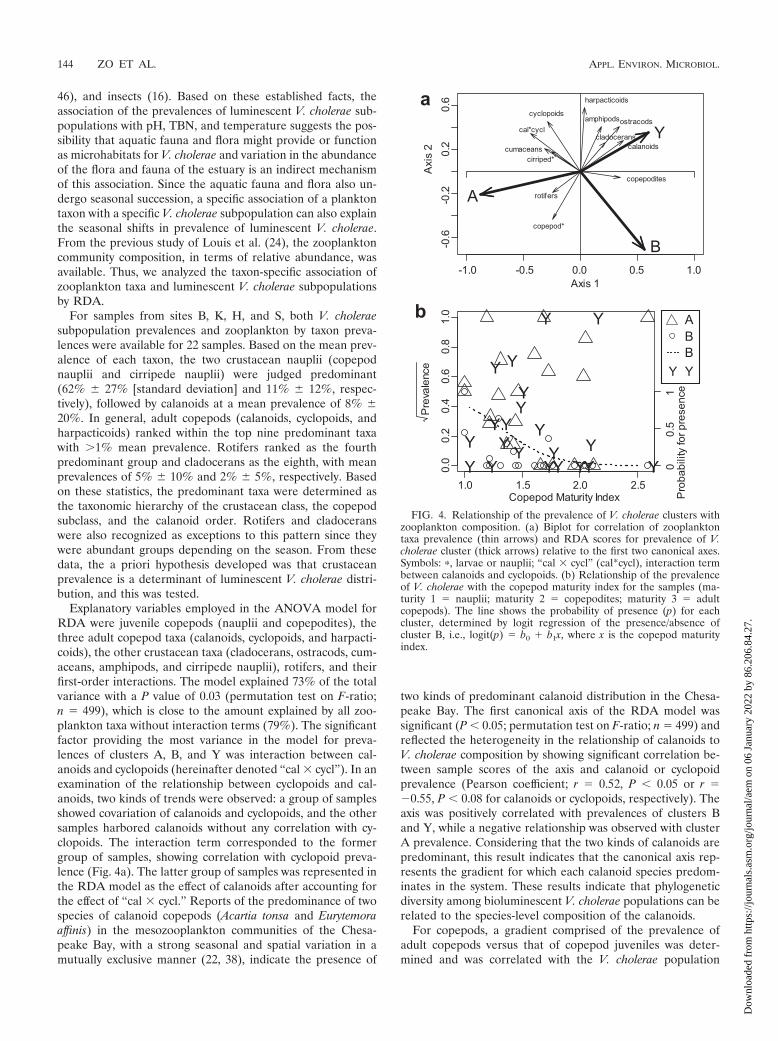
Explanatory variables employed in the ANOVA model forRDA were juvenile copepods (nauplii and copepodites), thethree adult copepod taxa (calanoids, cyclopoids, and harpacti-coids), the other crustacean taxa (cladocerans, ostracods, cum-aceans, amphipods, and cirripede nauplii), rotifers, and theirfirst-order interactions. The model explained 73% of the totalvariance with a P value of 0.03 (permutation test on F-ratio;n � 499), which is close to the amount explained by all zoo-plankton taxa without interaction terms (79%). The significantfactor providing the most variance in the model for preva-lences of clusters A, B, and Y was interaction between cal-anoids and cyclopoids (hereinafter denoted “cal � cycl”). In anexamination of the relationship between cyclopoids and cal-anoids, two kinds of trends were observed: a group of samplesshowed covariation of calanoids and cyclopoids, and the othersamples harbored calanoids without any correlation with cy-clopoids. The interaction term corresponded to the formergroup of samples, showing correlation with cyclopoid preva-lence (Fig. 4a). The latter group of samples was represented inthe RDA model as the effect of calanoids after accounting forthe effect of “cal � cycl.” Reports of the predominance of twospecies of calanoid copepods (Acartia tonsa and Eurytemoraaffinis) in the mesozooplankton communities of the Chesa-peake Bay, with a strong seasonal and spatial variation in amutually exclusive manner (22, 38), indicate the presence of
two kinds of predominant calanoid distribution in the Chesa-peake Bay. The first canonical axis of the RDA model wassignificant (P 0.05; permutation test on F-ratio; n � 499) andreflected the heterogeneity in the relationship of calanoids toV. cholerae composition by showing significant correlation be-tween sample scores of the axis and calanoid or cyclopoidprevalence (Pearson coefficient; r � 0.52, P 0.05 or r ��0.55, P 0.08 for calanoids or cyclopoids, respectively). Theaxis was positively correlated with prevalences of clusters Band Y, while a negative relationship was observed with clusterA prevalence. Considering that the two kinds of calanoids arepredominant, this result indicates that the canonical axis rep-resents the gradient for which each calanoid species predom-inates in the system. These results indicate that phylogeneticdiversity among bioluminescent V. cholerae populations can berelated to the species-level composition of the calanoids.
For copepods, a gradient comprised of the prevalence ofadult copepods versus that of copepod juveniles was deter-mined and was correlated with the V. cholerae population
FIG. 4. Relationship of the prevalence of V. cholerae clusters withzooplankton composition. (a) Biplot for correlation of zooplanktontaxa prevalence (thin arrows) and RDA scores for prevalence of V.cholerae cluster (thick arrows) relative to the first two canonical axes.Symbols: �, larvae or nauplii; “cal � cycl” (cal*cycl), interaction termbetween calanoids and cyclopoids. (b) Relationship of the prevalenceof V. cholerae with the copepod maturity index for the samples (ma-turity 1 � nauplii; maturity 2 � copepodites; maturity 3 � adultcopepods). The line shows the probability of presence (p) for eachcluster, determined by logit regression of the presence/absence ofcluster B, i.e., logit(p) � b0 � b1x, where x is the copepod maturityindex.
144 ZO ET AL. APPL. ENVIRON. MICROBIOL.
Dow
nloa
ded
from
http
s://j
ourn
als.
asm
.org
/jour
nal/a
em o
n 06
Jan
uary
202
2 by
86.
206.
84.2
7.

structure. A copepod maturity index for each sample was cal-culated by taking the mean of the maturity value for eachcopepod in each sample (Fig. 4b) and computing the bivariaterelationship as presence/absence or prevalence of each V. chol-erae cluster. By using logistic regression, a significant negativetrend for the cluster B copepod maturity index was determined(log-odd ratio � �4.9 � 2.4 [standard error] [P � 0.04]; like-lihood ratio test). Cluster B included strains isolated from asample in which adult copepods were predominant. Thus, adistinctive ecological niche for V. cholerae subpopulations ap-pears to be related to the age distribution of the copepodpopulation with which it is associated.
Role of luminescence in V. cholerae. In the case of transpar-ent planktonic animals, the luminescence of bacterial prey canmake them an easy target for carnivorous predators. Lumines-cent bacterial populations can be protected by having theirpredator numbers reduced by the next consumer in the foodweb or by their own pathogenicity. Therefore, luminescence inbacterial cells can function as an important modulator of eco-logical relationships among consumers in an aquatic food web.
In this study, a numerical correspondence of V. choleraesubpopulations and zooplankton community composition wasdemonstrated. The distinction of cluster A versus cluster Y inassociation with the dynamics of calanoid copepods is notable.A specificity of the cluster A strains toward a calanoid copepodthat covaries with cyclopoids was observed, while cluster Ystrains showed specificity toward other calanoid species. Thistaxon-to-taxon specific association between bacterial clonesand aquatic plankton can moderate the food web structure ofthe ecosystem by affecting predation behaviors of plankton andanimals. The best-documented cases of taxon-specific associa-tions are symbioses with animals possessing light organs. In thecase of copepod zooplankton, attachment of luminescent V.cholerae to zooplankton or their detritus is sufficient to cause achange in the food web structure by discouraging predation bytranslucent predators (e.g., planktonic crustaceans) or by pro-moting predation by nontranslucent predators (e.g., fish). Theage-specific association of cluster B with the juvenile copepodcommunity suggests such a taxon-specific association can befine-tuned, depending on the chemical and nutritional compo-sition of the organisms or the ecological standing of the hostorganisms in a specific season.
The association of luminescent V. cholerae clusters with theenterotoxin gene stn suggests another hypothesis for the eco-logical role of bioluminescence: a parasitic life cycle of lumi-nescent V. cholerae. As in the case of a bioluminescence-in-duced increase in predatory mortality of copepods grazing ondinoflagellates (1), luminous plankton biomass or particles aremore likely to be eaten by fish, namely trout, herring, mackerel,and others with visually selective predation, using vision tunedto 480-nm-wavelength light (1, 33). By making a substrate towhich it is attached luminous, the bacterium can be morerapidly transported into a nutrient-rich environment of theanimal gut and initiate a new cycle of parasitic growth. Thequorum sensing of V. cholerae (17), in which high cell density,as in biofilms, permits expression of the lux operon, also sup-ports this life cycle.
Considering results of this study together with the observa-tion that bioluminescence in vibrios functions as an intracellu-lar light source to stimulate light-induced DNA damage repair
mechanisms (11) and to detoxify deleterious oxygen derivatives(45), it is concluded that luminescence in V. cholerae can haveseveral effects, ranging from the physiology of individual cellsto food-web-wide ecology. Taxon-specific and age-specific as-sociation of the life histories (i.e., seasonal dynamics) betweena luminescent subpopulation of V. cholerae and zooplanktonand linkage of luminescence with the enterotoxin (stn) and cellsurface (O-serotype) genes suggest that an essential role ofluminescence in V. cholerae is to moderate interactions of V.cholerae with aquatic animals, including both plankton andnekton.
ACKNOWLEDGMENTS
This research was supported by National Institutes of Health grantno. 1R01A139129-01 and National Science Foundation grant no.01200677. Young-Gun Zo was supported by the second-phase BrainKorea 21 Project in 2008.
We gratefully acknowledge helpful comments provided by Petr Smi-lauer concerning the permutation methods employed in this research.
REFERENCES
1. Abrahams, M. V., and L. D. Townsend. 1993. Bioluminescence in dinoflagel-lates: a test of the burglar alarm hypothesis. Ecology 74:258–260.
2. Archie, J. W. 1989. A randomization test for phylogenetic information insystematic data. Syst. Zool. 38:239–252.
3. Arita, M., T. Takeda, T. Honda, and T. Miwatani. 1986. Purification andcharacterization of Vibrio cholerae non-O1 heat-stable enterotoxin. Infect.Immun. 52:45–49.
4. Barnes, R. D. 1987. Invertebrate zoology, 5th ed. Saunders College Publish-ing, Philadelphia, PA.
5. Beltran, P., G. Delgado, A. Navarro, F. Trujilto, R. K. Selander, and A.Cravioto. 1999. Genetic diversity and population structure of Vibrio cholerae.J. Clin. Microbiol. 37:581–590.
6. Besag, J., and P. Clifford. 1989. Generalized Monte Carlo significance tests.Biometrika 76:633–642.
7. Bisby, F., Y. Roskov, M. Ruggiero, T. Orrell, L. Paglinawan, P. Brewer, N.Bailly, and J. van Hertum. 2007. Species 2000 & ITIS catalogue of life: 2007annual checklist taxonomic classification CD-ROM. Species 2000, Reading,United Kingdom.
8. Choopun, N., V. Louis, A. Huq, and R. R. Colwell. 2002. Simple procedurefor rapid identification of Vibrio cholerae from the aquatic environment.Appl. Environ. Microbiol. 68:995–998.
9. Chun, J., A. Huq, and R. R. Colwell. 1999. Analysis of 16S-23S rRNAintergenic spacer regions of Vibrio cholerae and Vibrio mimicus. Appl. Envi-ron. Microbiol. 65:2202–2208.
10. Colwell, R. R., and W. M. Spira. 1992. The ecology of V. cholerae, p. 107–127.In D. Barua and W. B. Grennough III (ed.), Cholera. Plenum Medical BookCo., New York, NY.
11. Czyz, A., K. Plata, and G. Wegrzyn. 2003. Stimulation of DNA repair as anevolutionary drive for bacterial luminescence. Luminescence 18:140–144.
12. Deutsch, R., M. Cherner, and I. Grant. 2006. Significance testing of a clusterof multivariate binary variables: comparison of the tripartite T index to threecommon similarity measures. Stat. Methods Med. Res. 15:285–299.
13. Faith, D. P. 1991. Cladistic permutation tests for monophyly and nonmono-phyly. Syst. Zool. 40:366–375.
14. Faith, D. P., and P. S. Cranston. 1991. Could a cladogram this short havearisen by chance alone? On permutation tests for cladistic structure. Cladis-tics 7:1–28.
15. Grim, C. J., E. Taviani, M. Alam, A. Huq, R. B. Sack, and R. R. Colwell.2008. Occurrence and expression of luminescence in Vibrio cholerae. Appl.Environ. Microbiol. 74:708–715.
16. Halpern, M., Y. B. Broza, S. Mittler, E. Arakawa, and M. Broza. 2004.Chironomid egg masses as a natural reservoir of Vibrio cholerae non-O1 andnon-O139 in freshwater habitats. Microb. Ecol. 47:341–349.
17. Hammer, B. K., and B. L. Bassler. 2007. Regulatory small RNAs circumventthe conventional quorum sensing pathway in pandemic Vibrio cholerae. Proc.Natl. Acad. Sci. USA 104:11145–11149.
18. Heidelberg, J. F., J. A. Eisen, W. C. Nelson, R. A. Clayton, M. L. Gwinn, R. J.Dodson, D. H. Haft, E. K. Hickey, J. D. Peterson, L. Umayam, S. R. Gill,K. E. Nelson, T. D. Read, H. Tettelin, D. Richardson, M. D. Ermolaeva, J.Vamathevan, S. Bass, H. Qin, I. Dragoi, P. Sellers, L. McDonald, T. Utter-back, R. D. Fleishmann, W. C. Nierman, O. White, S. L. Salzberg, H. O.Smith, R. R. Colwell, J. J. Mekalanos, J. C. Venter, and C. M. Fraser. 2000.DNA sequence of both chromosomes of the cholera pathogen Vibrio chol-erae. Nature 406:477–483.
VOL. 75, 2009 ECOLOGY OF BIOLUMINESCENT VIBRIO CHOLERAE 145
Dow
nloa
ded
from
http
s://j
ourn
als.
asm
.org
/jour
nal/a
em o
n 06
Jan
uary
202
2 by
86.
206.
84.2
7.
19. Herring, P. 2002. Marine microlights: the luminous marine bacteria. Micro-biol. Today 29:174–176.
20. International Union of Pure and Applied Chemistry. 1985. Definitions of pHscales, standard reference values, measurement of pH, and related termi-nology. Pure Appl. Chem. 57:531–542.
21. Islam, M. S., Z. Rahim, M. J. Alam, S. Begum, S. M. Moniruzzaman, A.Umeda, K. Amako, M. J. Albert, R. B. Sack, A. Huq, and R. R. Colwell. 1999.Association of Vibrio cholerae O1 with the cyanobacterium, Anabaena sp.,elucidated by polymerase chain reaction and transmission electron micros-copy. Trans. R. Soc. Trop. Med. Hyg. 93:36–40.
22. Kimmel, D. G., and M. R. Roman. 2004. Long-term trends in mesozoop-lankton abundance in Chesapeake Bay, USA: influence of freshwater input.Mar. Ecol. Prog. Ser. 267:71–83.
23. Legendre, P., and E. D. Gallagher. 2001. Ecologically meaningful transfor-mation for ordination of species data. Oecologia 129:271–280.
24. Louis, V. R., E. Russek-Cohen, N. Choopun, I. N. G. Rivera, B. Gangle, S. C.Jiang, A. Rubin, J. A. Patz, A. Huq, and R. R. Colwell. 2003. Predictability ofVibrio cholerae in Chesapeake Bay. Appl. Environ. Microbiol. 69:2773–2785.
25. McNicol, L. A., S. P. De, J. B. Kaper, P. A. West, and R. R. Colwell. 1983.Numerical taxonomy of Vibrio cholerae and related species isolated fromareas that are endemic and nonendemic for cholera. J. Clin. Microbiol.17:1102–1113.
26. Merrell, D. S., C. Bailey, J. B. Kaper, and A. Camilli. 2001. The ToxR-mediated organic acid tolerance response of Vibrio cholerae requires OmpU.J. Bacteriol. 183:2746–2754.
27. Miller, M. B., K. Skorupski, D. H. Lenz, R. K. Taylor, and B. L. Bassler.2002. Parallel quorum sensing systems converge to regulate virulence inVibrio cholerae. Cell 110:303–314.
28. Miller, M. C., D. P. Keymer, A. Avelar, A. B. Boehm, and G. K. Schoolnik.2007. Detection and transformation of genome segments that differ within acoastal population of Vibrio cholerae strains. Appl. Environ. Microbiol. 73:3695–3704.
29. Morris, J. G., T. Takeda, B. D. Tall, G. A. Losonsky, S. K. Bhattacharya,B. D. Forrest, B. A. Kay, and M. Nishibuchi. 1990. Experimental non-Ogroup 1 Vibrio cholerae gastroenteritis in humans. J. Clin. Investig. 85:697–705.
30. Nealson, K. H., and J. W. Hastings. 1979. Bacterial bioluminescence: itscontrol and ecological significance. Microbiol. Rev. 43:496–518.
31. Ogawa, A., J. Kato, H. Watanabe, B. G. Nair, and T. Takeda. 1990. Cloningand nucleotide sequence of a heat-stable enterotoxin gene from Vibrio chol-erae non-O1 isolated from a patient with traveler’s diarrhea. Infect. Immun.58:3325–3329.
32. Palmer, L. M., and R. R. Colwell. 1991. Detection of luciferase gene se-quence in nonluminescent Vibrio cholerae by colony hybridization and poly-merase chain reaction. Appl. Environ. Microbiol. 57:1286–1293.
33. Porter, K. G., and J. W. Porter. 1979. Bioluminescence in marine plankton:a coevolved antipredation system. Am. Nat. 114:458.
34. Provenzano, D., and K. E. Klose. 2000. Altered expression of the ToxR-regulated porins OmpU and OmpT diminishes Vibrio cholerae bile resis-tance, virulence factor expression, and intestinal colonization. Proc. Natl.Acad. Sci. USA 97:10220–10224.
35. R Development Core Team. 2006. R: a language and environment for sta-tistical computing. R Foundation for Statistical Computing, Vienna, Austria.
36. Rao, C. 1964. The use and interpretation of principal component analysis inapplied research. Sankhyaa Ser. A 26:329–358.
37. Rawlings, T. K., G. M. Ruiz, and R. R. Colwell. 2007. Association of Vibriocholerae O1 El Tor and O139 Bengal with the copepods Acartia tonsa andEurytemora affinis. Appl. Environ. Microbiol. 73:7926–7933.
38. Roman, M., X. Zhang, C. McGilliard, and W. Boicourt. 2005. Seasonal andannual variability in the spatial patterns of plankton biomass in ChesapeakeBay. Limnol. Oceanogr. 50:480–492.
39. Sack, D. A., R. B. Sack, G. B. Nair, and A. K. Siddique. 2004. Cholera.Lancet 363:223–233.
40. Shimada, T., E. Arakawa, K. Itoh, T. Okitsu, A. Matsushima, Y. Asai, S.Yamai, T. Nakazato, G. B. Nair, M. J. Albert, and Y. Takeda. 1994. Extendedserotyping scheme for Vibrio cholerae. Curr. Microbiol. 28:175–178.
41. Soetaert, K., A. F. Hofmann, J. J. Middelburg, F. J. R. Meysman, and J.Greenwood. 2007. The effect of biogeochemical processes on pH. Mar.Chem. 105:30–51.
42. Sokal, R. R., and F. J. Rohlf. 1995. Biometry: the principles and practiceof statistics in biological research, 3rd ed. W. H. Freeman & Co., NewYork, NY.
43. Sperandio, V., J. A. Giron, W. D. Silveira, and J. B. Kaper. 1995. The OmpUouter membrane protein, a potential adherence factor of Vibrio cholerae.Infect. Immun. 63:4433–4438.
44. Swofford, D. L. 1998. PAUP*. Phylogenetic analysis using parsimony (*andother methods). 4.0 ed. Sinauer Associates, Sunderland, MA.
45. Szpilewska, H., A. Czyz, and G. Wegrzyn. 2003. Experimental evidence forthe physiological role of bacterial luciferase in the protection of cells againstoxidative stress. Curr. Microbiol. 47:379–382.
46. Tamplin, M. L., A. L. Gauzens, A. Huq, D. A. Sack, and R. R. Colwell. 1990.Attachment of Vibrio cholerae serogroup O1 to zooplankton and phytoplank-ton of Bangladesh waters. Appl. Environ. Microbiol. 56:1977–1980.
47. ter Braak, C. J. F., and C. W. N. Looman. 1986. Weighted averaging, logisticregression and the Gaussian response model. Vegetatio 65:3–11.
48. ter Braak, C. J. F., and P. Smilauer. 2002. CANOCO reference manual andCanoDraw for Windows user’s guide: software for canonical communityordination (version 4.5). Microcomputer Power, Ithaca, NY.
49. Tison, D. L. 1999. Vibrio, p. 497–504. In P. R. Murray, E. J. Baron, M. A.Pfaller, F. C. Tenover, and R. H. Yolken (ed.), Manual of clinical microbi-ology, 7th ed. American Society for Microbiology, Washington, DC.
50. Urbanczyk, H., J. C. Ast, A. J. Kaeding, J. D. Oliver, and P. V. Dunlap. 2008.Phylogenetic analysis of the incidence of lux gene horizontal transfer inVibrionaceae. J. Bacteriol. 190:3494–3504.
51. Wegrzyn, G., and A. Czyz. 2002. How do marine bacteria produce light, whyare they luminescent, and can we employ bacterial bioluminescence inaquatic biotechnology? Oceanologia 44:291–305.
52. Weiss, R. F. 1974. Carbon dioxide in water and seawater: the solubility of anon-ideal gas. Mar. Chem. 2:203–215.
53. West, P. A., P. R. Brayton, T. N. Bryant, and R. R. Colwell. 1986. Numericaltaxonomy of Vibrios isolated from aquatic environment. Int. J. Syst. Bacte-riol. 36:531–543.
54. West, P. A., and J. V. Lee. 1982. Ecology of Vibrio spp. including V. choleraein natural waters of Kent, England. J. Appl. Bacteriol. 52:435–448.
55. Zhu, J., M. B. Miller, R. E. Vance, M. Dziejman, B. L. Bassler, and J. J.Mekalanos. 2002. Quorum-sensing regulators control virulence gene expres-sion in Vibrio cholerae. Proc. Natl. Acad. Sci. USA 99:3129–3134.
56. Zo, Y.-G., N. Chokesajjawatee, E. Arakawa, H. Watanabe, A. Huq, and R. R.Colwell. 2008. Covariability of Vibrio cholerae microdiversity and environ-mental parameters. Appl. Environ. Microbiol. 74:2915–2920.
57. Zo, Y. G., I. N. G. Rivera, E. Russek-Cohen, M. S. Islam, A. K. Siddique, M.Yunus, R. B. Sack, A. Huq, and R. R. Colwell. 2002. Genomic profiles ofclinical and environmental isolates of Vibrio cholerae O1 in cholera-endemicareas of Bangladesh. Proc. Natl. Acad. Sci. USA 99:12409–12414.
146 ZO ET AL. APPL. ENVIRON. MICROBIOL.
Dow
nloa
ded
from
http
s://j
ourn
als.
asm
.org
/jour
nal/a
em o
n 06
Jan
uary
202
2 by
86.
206.
84.2
7.