Embed Size (px)
Citation preview
SGEC Webinar: Diversity and Dementia 2/16/2012
This work is licensed under a Creative Commons Attribution 3.0 Unported License.
1
Diversity and Dementia
Kala M. Mehta, DSc, MPH
January 17, 2012
Overview
Background
Incidence and Prevalence of Dementia
Why are these differences found?
What’s important for diverse dementia patients
Treatment and Survival
SGEC Webinar: Diversity and Dementia 2/16/2012
This work is licensed under a Creative Commons Attribution 3.0 Unported License.
2
Overview
Background
Incidence and Prevalence of Dementia
Why are these differences found?
What’s important for diverse dementia patients
Treatment and Survival
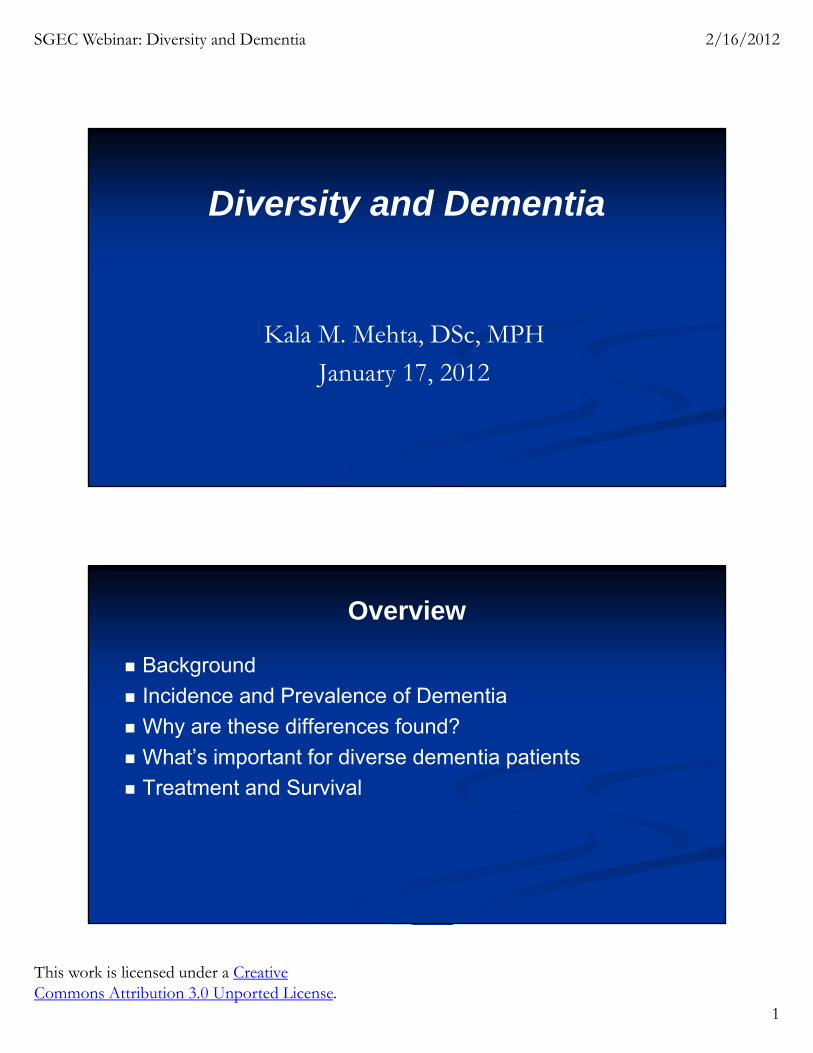
Cost of Dementia
Total cost of dementia worldwide in 2010 604 billion dollars
70% of global cost North America and Western
Europe
Annual cost of caring for people with AD is at least $172 billion (NIA)
World Alzheimer’s Report 2010
SGEC Webinar: Diversity and Dementia 2/16/2012
This work is licensed under a Creative Commons Attribution 3.0 Unported License.
3
SGEC Webinar: Diversity and Dementia 2/16/2012
This work is licensed under a Creative Commons Attribution 3.0 Unported License.
4
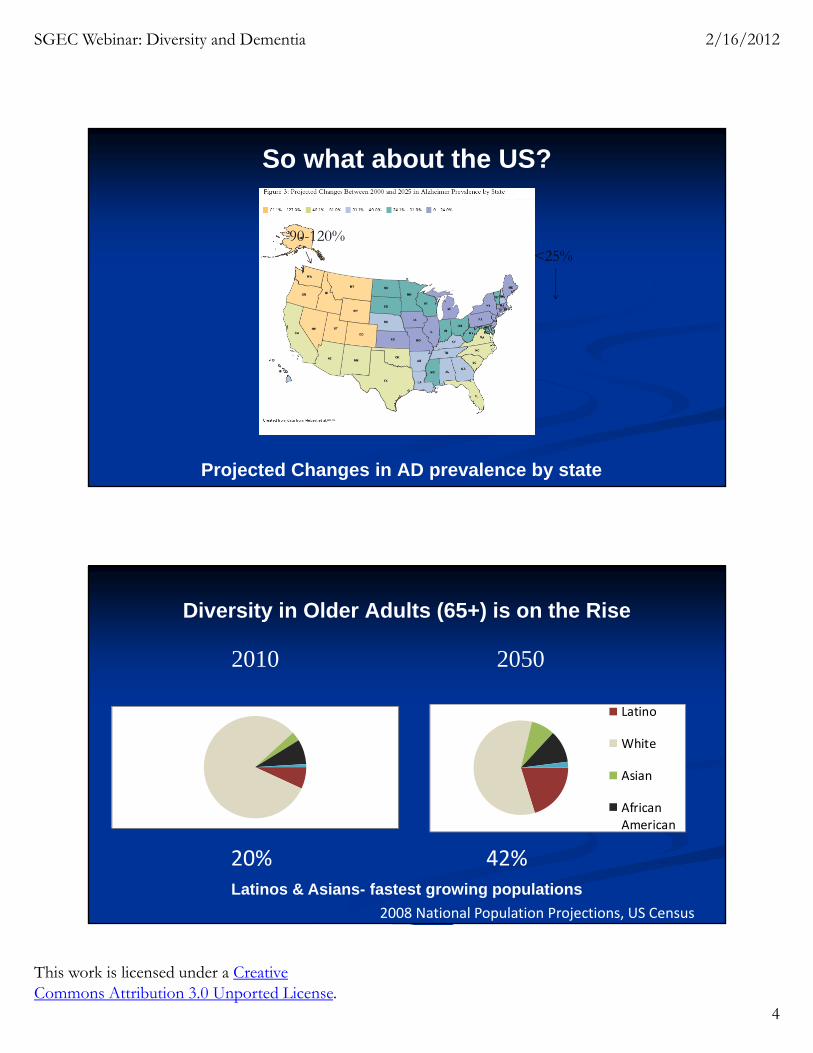
So what about the US?
Projected Changes in AD prevalence by state
90-120%<25%
Diversity in Older Adults (65+) is on the Rise
Latino
White
Asian
AfricanAmerican
2010 2050
20% 42%Latinos & Asians- fastest growing populations
2008 National Population Projections, US Census
SGEC Webinar: Diversity and Dementia 2/16/2012
This work is licensed under a Creative Commons Attribution 3.0 Unported License.
5
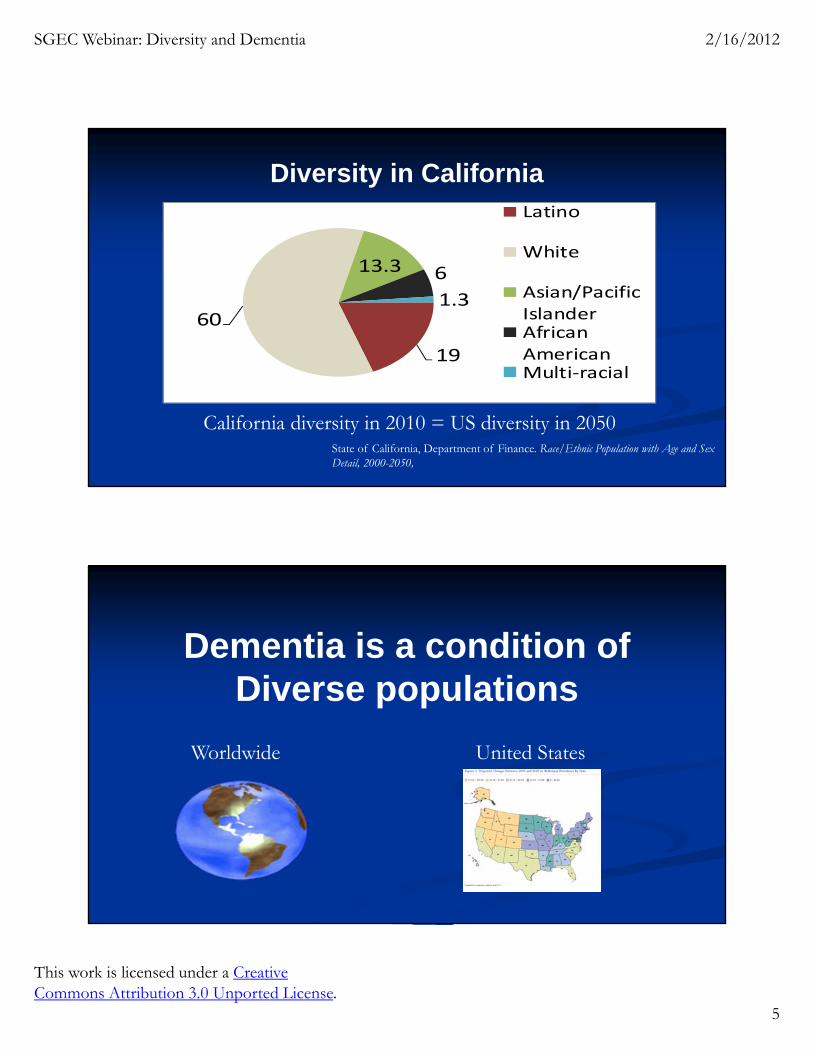
Diversity in California
19
60
13.3 6
1.3
Latino
White
Asian/PacificIslanderAfricanAmericanMulti‐racial
California diversity in 2010 = US diversity in 2050State of California, Department of Finance. Race/Ethnic Population with Age and Sex Detail, 2000-2050,
Dementia is a condition of Diverse populations
United StatesWorldwide
SGEC Webinar: Diversity and Dementia 2/16/2012
This work is licensed under a Creative Commons Attribution 3.0 Unported License.
6
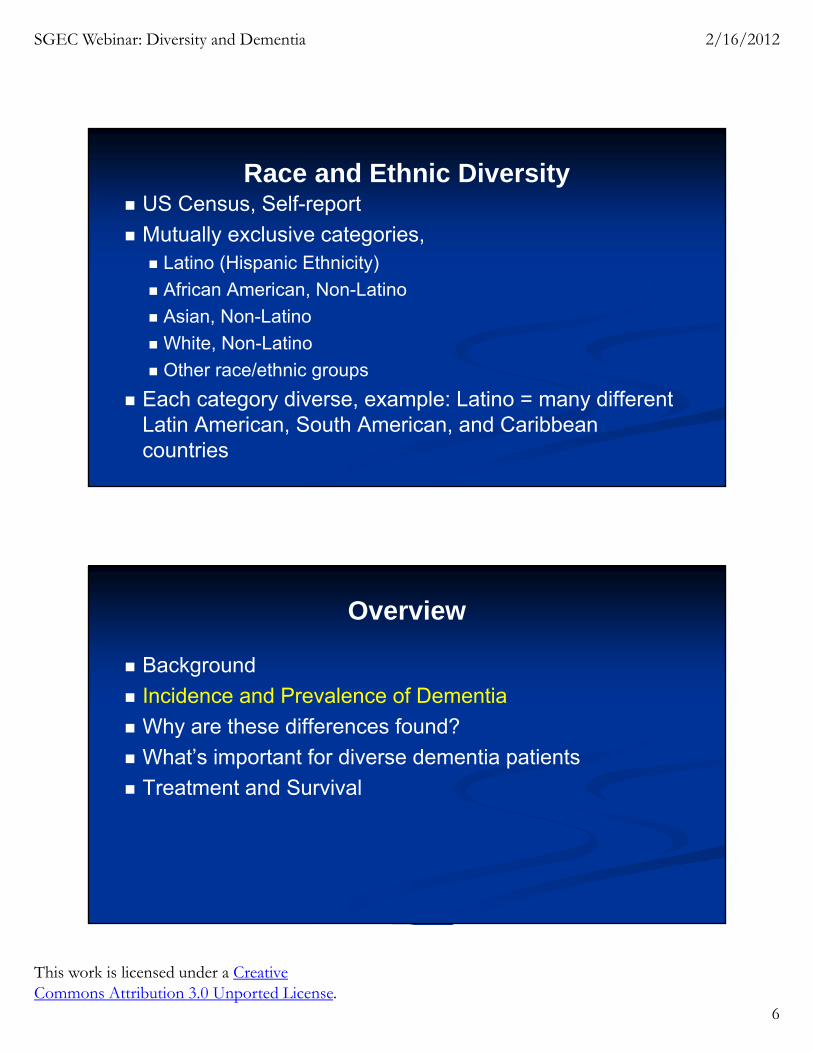
Race and Ethnic Diversity US Census, Self-report
Mutually exclusive categories, Latino (Hispanic Ethnicity)
African American, Non-Latino
Asian, Non-Latino
White, Non-Latino
Other race/ethnic groups
Each category diverse, example: Latino = many different Latin American, South American, and Caribbean countries
Overview
Background
Incidence and Prevalence of Dementia
Why are these differences found?
What’s important for diverse dementia patients
Treatment and Survival
SGEC Webinar: Diversity and Dementia 2/16/2012
This work is licensed under a Creative Commons Attribution 3.0 Unported License.
7
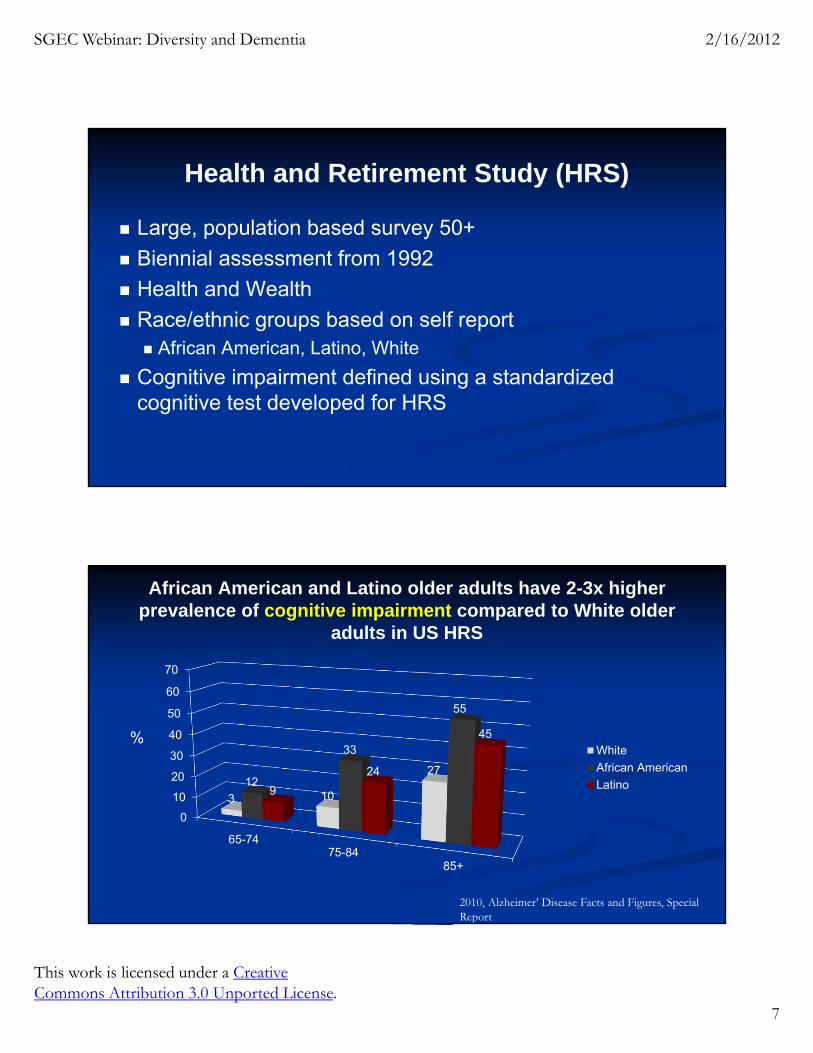
Health and Retirement Study (HRS)
Large, population based survey 50+
Biennial assessment from 1992
Health and Wealth
Race/ethnic groups based on self report African American, Latino, White
Cognitive impairment defined using a standardized cognitive test developed for HRS
African American and Latino older adults have 2-3x higher prevalence of cognitive impairment compared to White older
adults in US HRS
0
10
20
30
40
50
60
70
65-7475-84
85+
3 10
2712
33
55
9
24
45White
African American
Latino
%
2010, Alzheimer’ Disease Facts and Figures, Special Report
SGEC Webinar: Diversity and Dementia 2/16/2012
This work is licensed under a Creative Commons Attribution 3.0 Unported License.
8
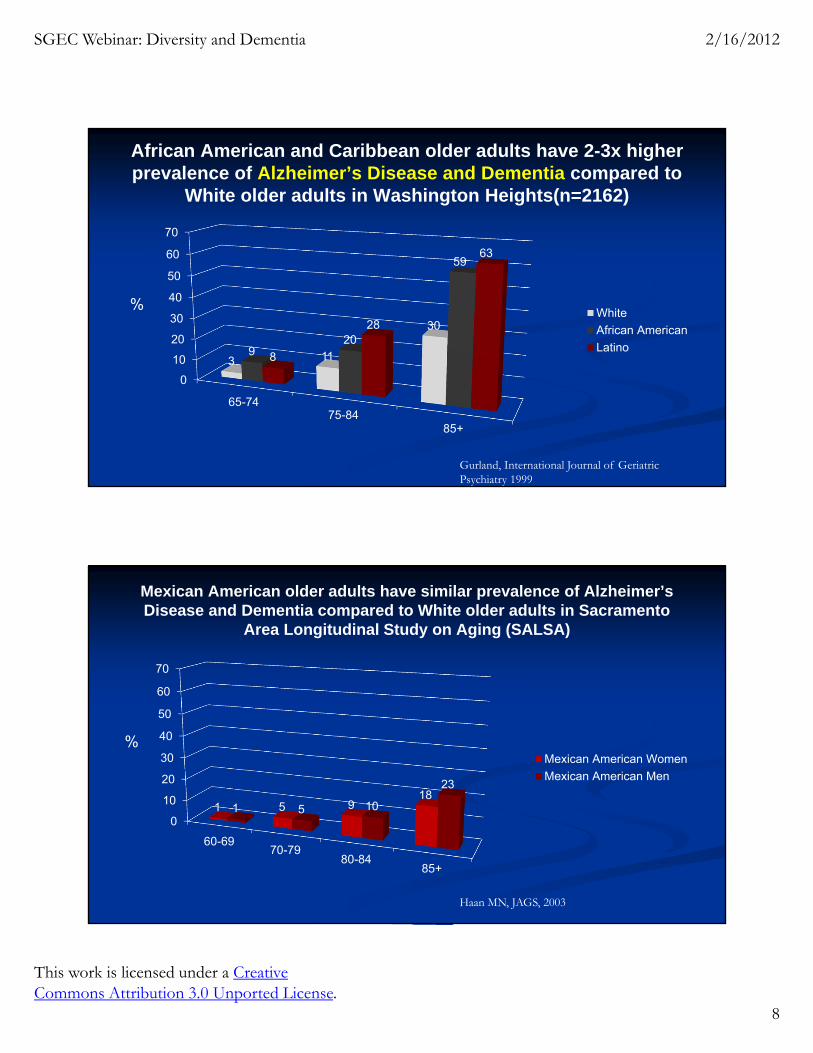
African American and Caribbean older adults have 2-3x higher prevalence of Alzheimer’s Disease and Dementia compared to
White older adults in Washington Heights(n=2162)
0
10
20
30
40
50
60
70
65-7475-84
85+
3 11
30
920
59
8
28
63
White
African American
Latino
Gurland, International Journal of Geriatric Psychiatry 1999
%
Mexican American older adults have similar prevalence of Alzheimer’s Disease and Dementia compared to White older adults in Sacramento
Area Longitudinal Study on Aging (SALSA)
0
10
20
30
40
50
60
70
60-6970-79
80-8485+
1 5 918
1 5 10
23
Mexican American Women
Mexican American Men
Haan MN, JAGS, 2003
%
SGEC Webinar: Diversity and Dementia 2/16/2012
This work is licensed under a Creative Commons Attribution 3.0 Unported License.
9
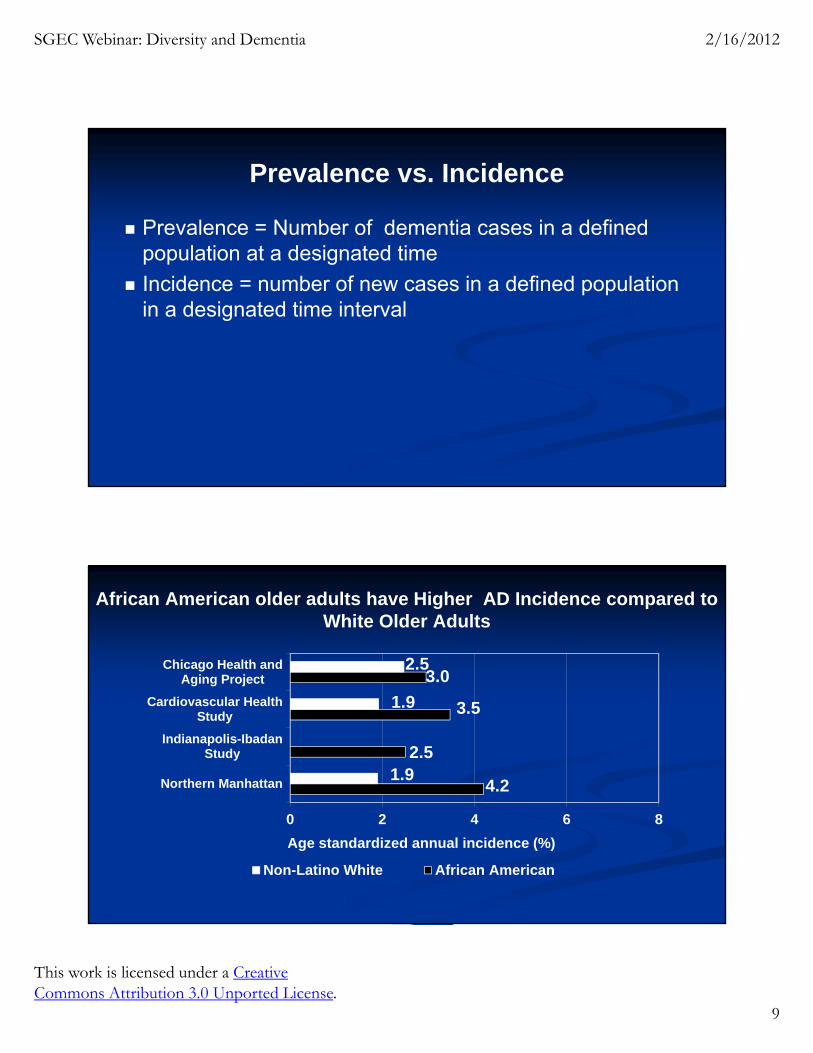
Prevalence vs. Incidence
Prevalence = Number of dementia cases in a defined population at a designated time
Incidence = number of new cases in a defined population in a designated time interval
African American older adults have Higher AD Incidence compared to White Older Adults
4.2
2.5
3.5
3.0
1.9
1.9
2.5
0 2 4 6 8
Northern Manhattan
Indianapolis-IbadanStudy
Cardiovascular HealthStudy
Chicago Health andAging Project
Age standardized annual incidence (%)
Non-Latino White African American
SGEC Webinar: Diversity and Dementia 2/16/2012
This work is licensed under a Creative Commons Attribution 3.0 Unported License.
10
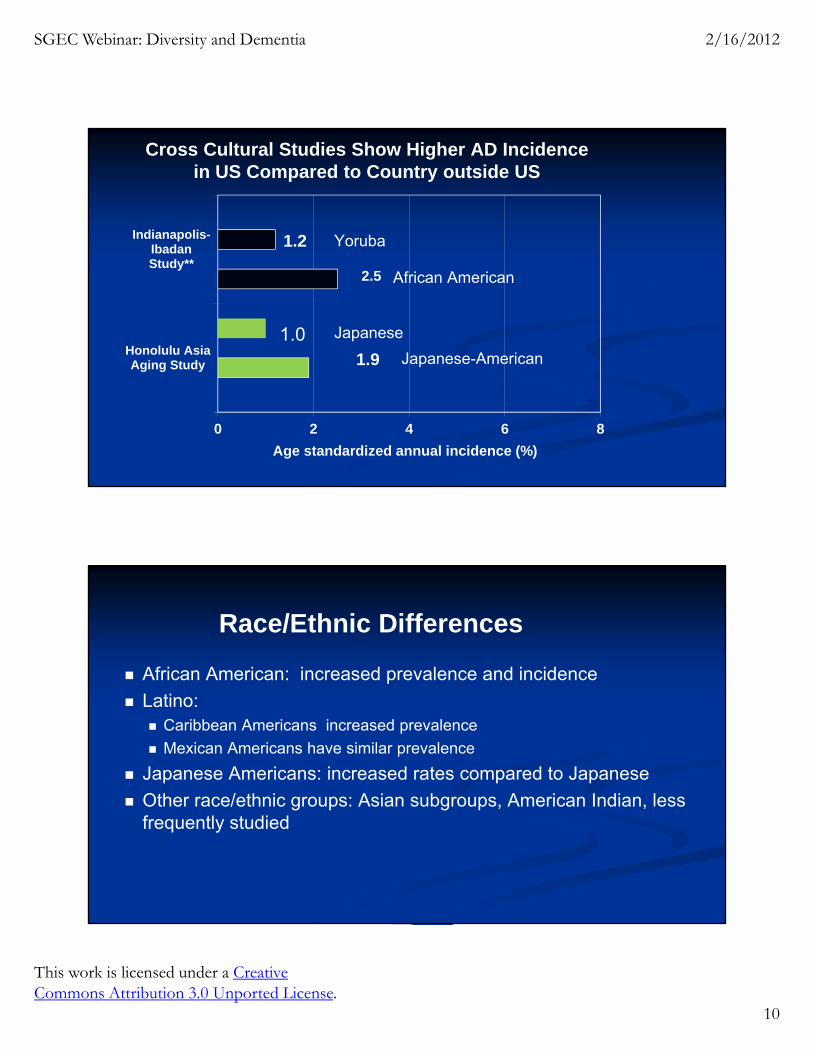
Cross Cultural Studies Show Higher AD Incidence in US Compared to Country outside US
2.5
1.9
1.2
0 2 4 6 8
Honolulu AsiaAging Study
Indianapolis-IbadanStudy**
Age standardized annual incidence (%)
1.0
Yoruba
African American
Japanese
Japanese-American
Race/Ethnic Differences
African American: increased prevalence and incidence
Latino: Caribbean Americans increased prevalence
Mexican Americans have similar prevalence
Japanese Americans: increased rates compared to Japanese
Other race/ethnic groups: Asian subgroups, American Indian, less frequently studied
SGEC Webinar: Diversity and Dementia 2/16/2012
This work is licensed under a Creative Commons Attribution 3.0 Unported License.
11
Overview
Background
Incidence and Prevalence of Dementia
Why are these differences found?
What’s important for diverse dementia patients
Treatment and Survival
Socioeconomic factors underlying race/ethnic
differences
SGEC Webinar: Diversity and Dementia 2/16/2012
This work is licensed under a Creative Commons Attribution 3.0 Unported License.
12
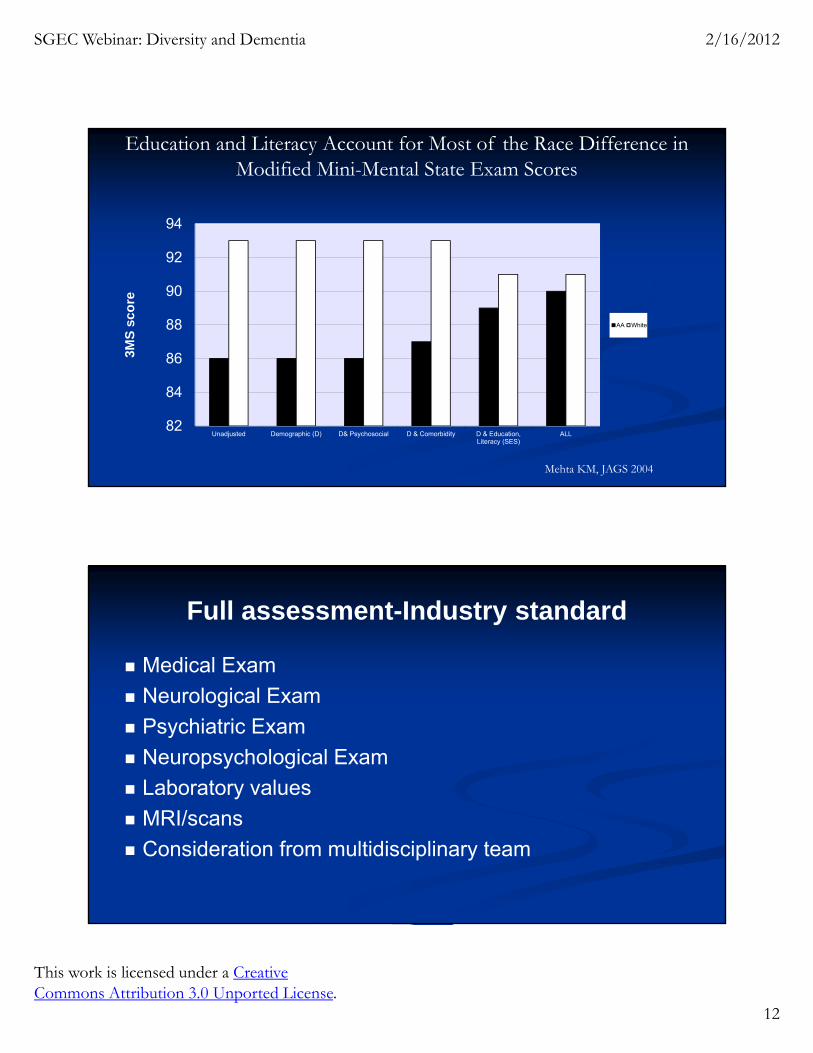
82
84
86
88
90
92
94
Unadjusted Demographic (D) D& Psychosocial D & Comorbidity D & Education,Literacy (SES)
ALL
3MS
sco
re
AA White
Education and Literacy Account for Most of the Race Difference in Modified Mini-Mental State Exam Scores
Mehta KM, JAGS 2004
Full assessment-Industry standard
Medical Exam
Neurological Exam
Psychiatric Exam
Neuropsychological Exam
Laboratory values
MRI/scans
Consideration from multidisciplinary team
SGEC Webinar: Diversity and Dementia 2/16/2012
This work is licensed under a Creative Commons Attribution 3.0 Unported License.
13
Screens understood differently by race/ethnic groups
Mini-Mental State Exam
Modified Mini-Mental State Exam
Telephone Interview for Cognitive Status
All show differential item functioning by race
How does this affect assessment?
↓ specificity of cognitive measures in diverse older adults
↓ specificity can lead to misdiagnosis of cognitive impairment
Racial/ethnic differences occur across cognitive domains
SGEC Webinar: Diversity and Dementia 2/16/2012
This work is licensed under a Creative Commons Attribution 3.0 Unported License.
14
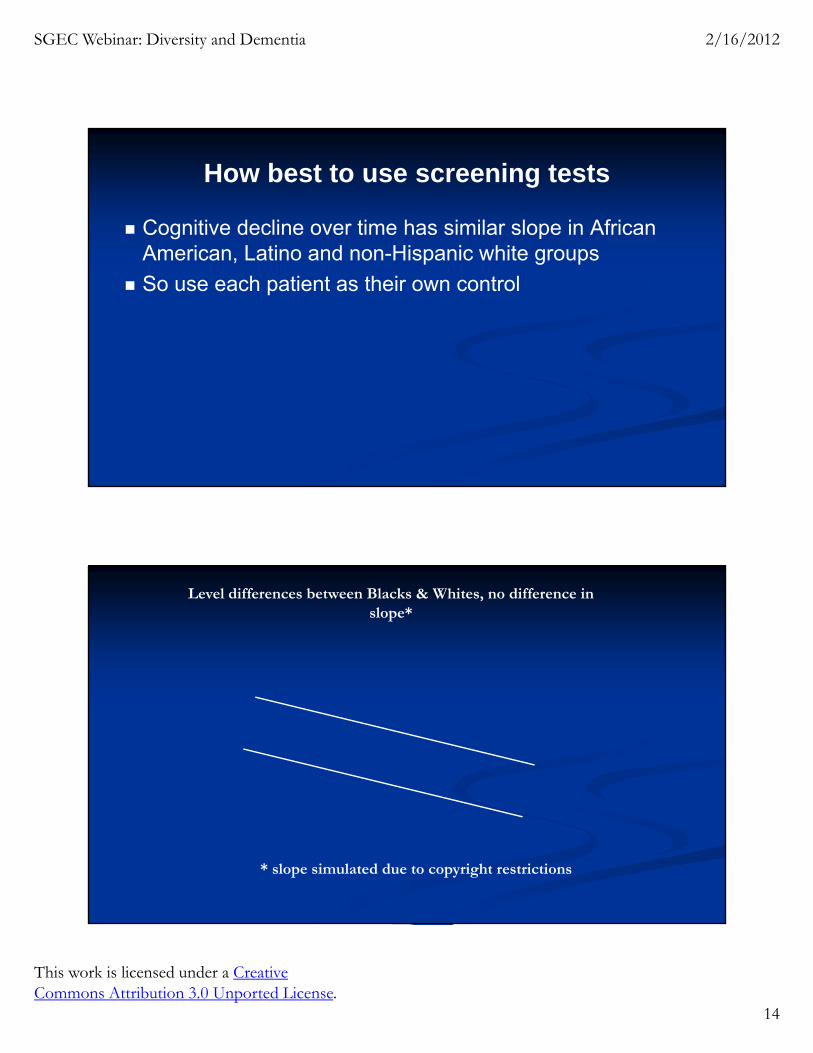
How best to use screening tests
Cognitive decline over time has similar slope in African American, Latino and non-Hispanic white groups
So use each patient as their own control
….. White
___ Black
Level differences between Blacks & Whites, no difference in slope*
* slope simulated due to copyright restrictions
SGEC Webinar: Diversity and Dementia 2/16/2012
This work is licensed under a Creative Commons Attribution 3.0 Unported License.
15
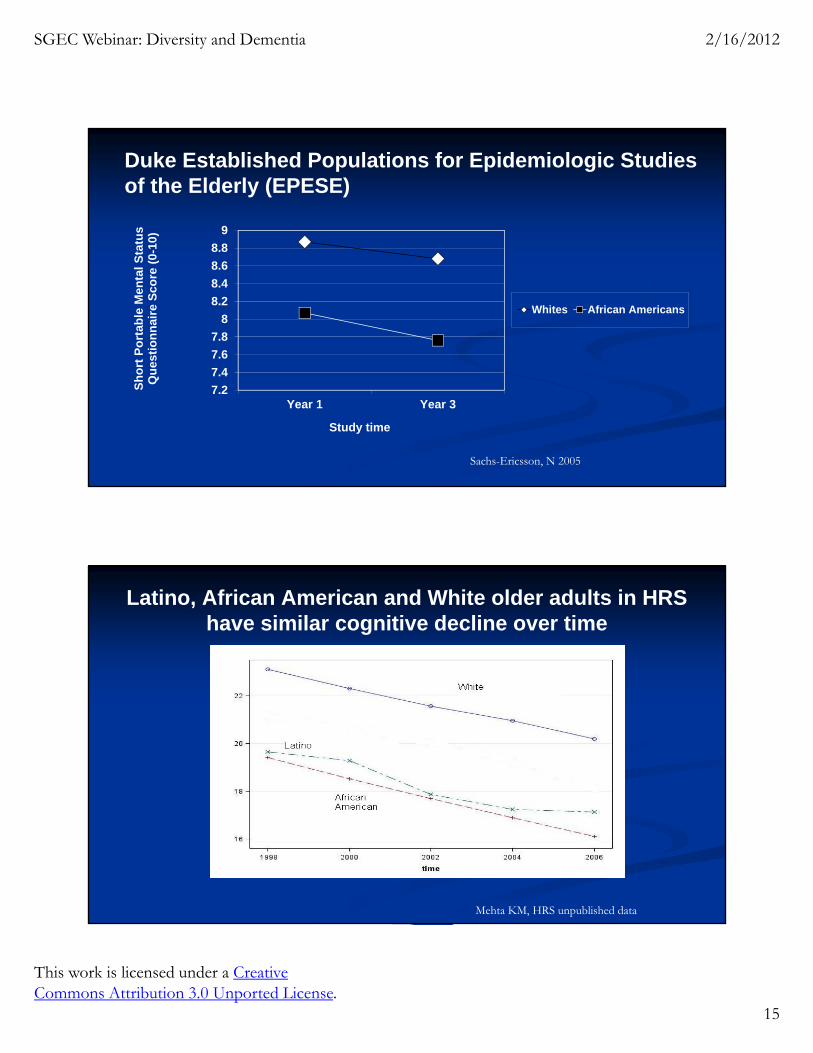
Duke Established Populations for Epidemiologic Studies of the Elderly (EPESE)
7.2
7.4
7.6
7.8
8
8.2
8.4
8.6
8.8
9
Year 1 Year 3
Sh
ort
Po
rtab
le M
enta
l S
tatu
s Q
ues
tio
nn
aire
Sco
re (
0-10
)
Study time
Whites African Americans
Sachs-Ericsson, N 2005
Latino, African American and White older adults in HRS have similar cognitive decline over time
Mehta KM, HRS unpublished data
SGEC Webinar: Diversity and Dementia 2/16/2012
This work is licensed under a Creative Commons Attribution 3.0 Unported License.
16
What do you do if you only have a few minutes?
For low literacy populations in community settings, items that are more ‘culture fair’
Immediate and Delayed word recall The change between how many words recalled immediately
and the number recalled after a delay is highly predictive-across populations
Animal naming (people can do it, it is quick and informative)
Vascular risk factors underlying race/ethnic
differences
SGEC Webinar: Diversity and Dementia 2/16/2012
This work is licensed under a Creative Commons Attribution 3.0 Unported License.
17
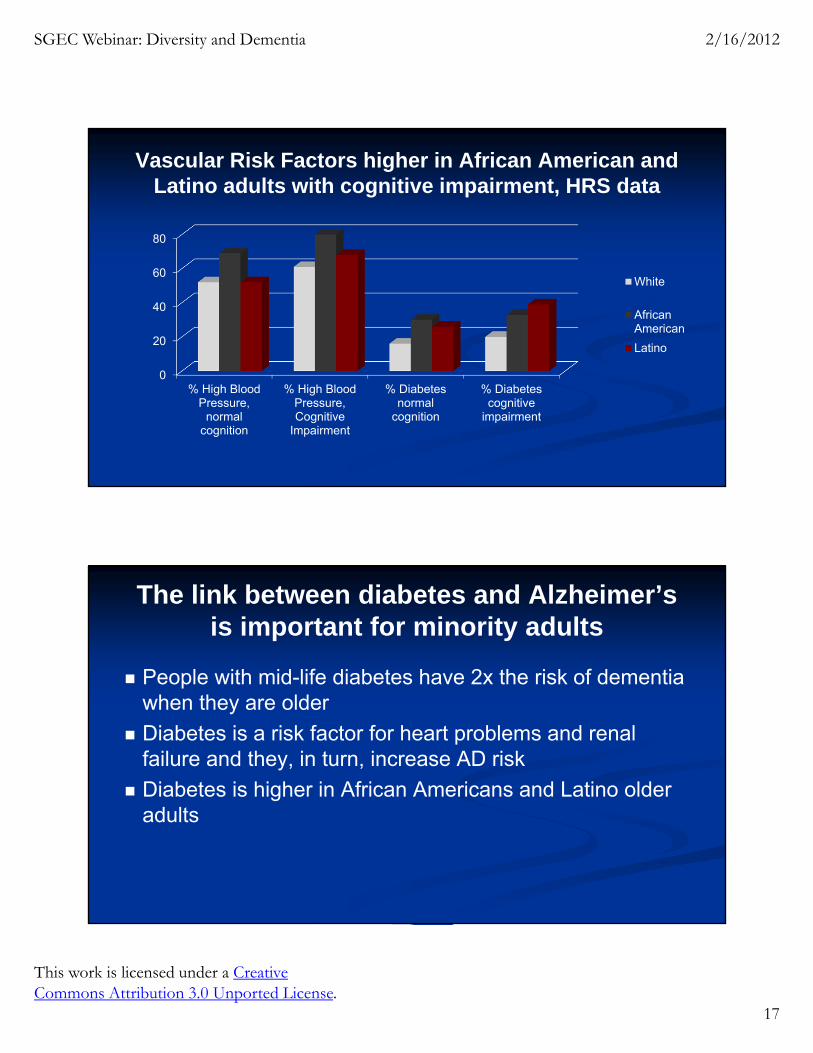
Vascular Risk Factors higher in African American and Latino adults with cognitive impairment, HRS data
0
20
40
60
80
% High BloodPressure,
normalcognition
% High BloodPressure,Cognitive
Impairment
% Diabetesnormal
cognition
% Diabetescognitive
impairment
White
AfricanAmerican
Latino
The link between diabetes and Alzheimer’s is important for minority adults
People with mid-life diabetes have 2x the risk of dementia when they are older
Diabetes is a risk factor for heart problems and renal failure and they, in turn, increase AD risk
Diabetes is higher in African Americans and Latino older adults
SGEC Webinar: Diversity and Dementia 2/16/2012
This work is licensed under a Creative Commons Attribution 3.0 Unported License.
18
Overview
Background
Incidence and Prevalence of Dementia
Why are these differences found?
What’s important for diverse dementia patients
Treatment and Survival
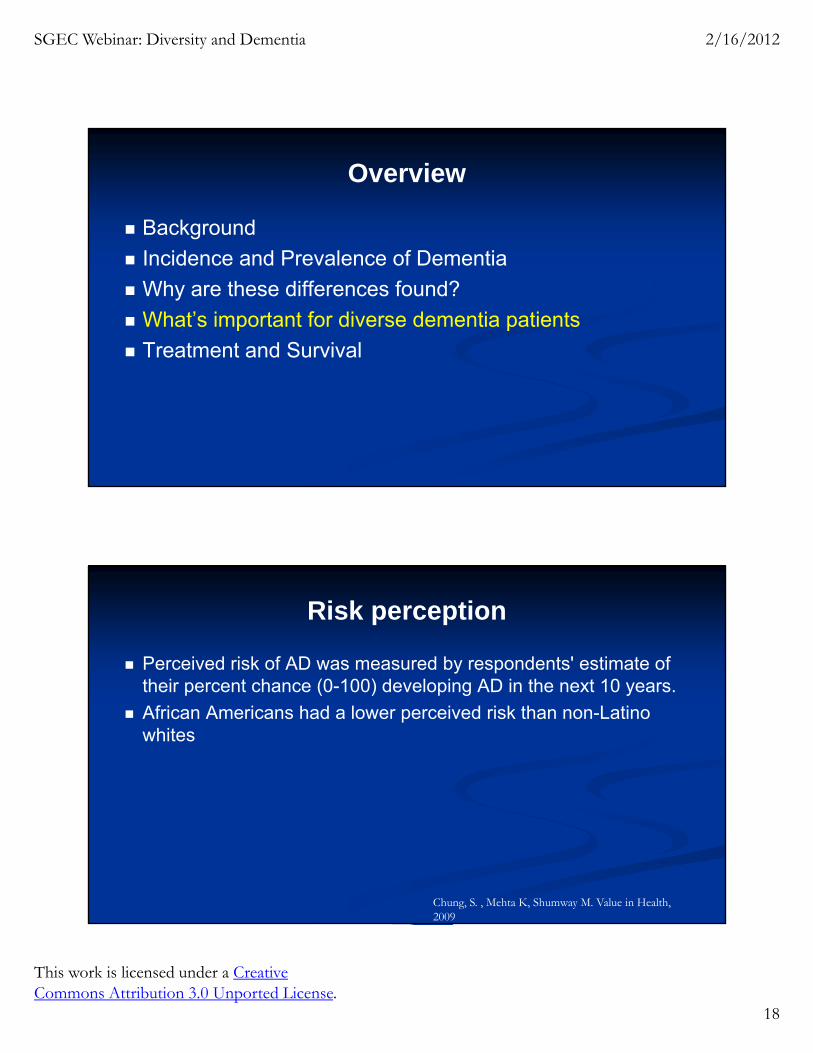
Risk perception
Perceived risk of AD was measured by respondents' estimate of their percent chance (0-100) developing AD in the next 10 years.
African Americans had a lower perceived risk than non-Latino whites
Chung, S. , Mehta K, Shumway M. Value in Health, 2009
SGEC Webinar: Diversity and Dementia 2/16/2012
This work is licensed under a Creative Commons Attribution 3.0 Unported License.
19
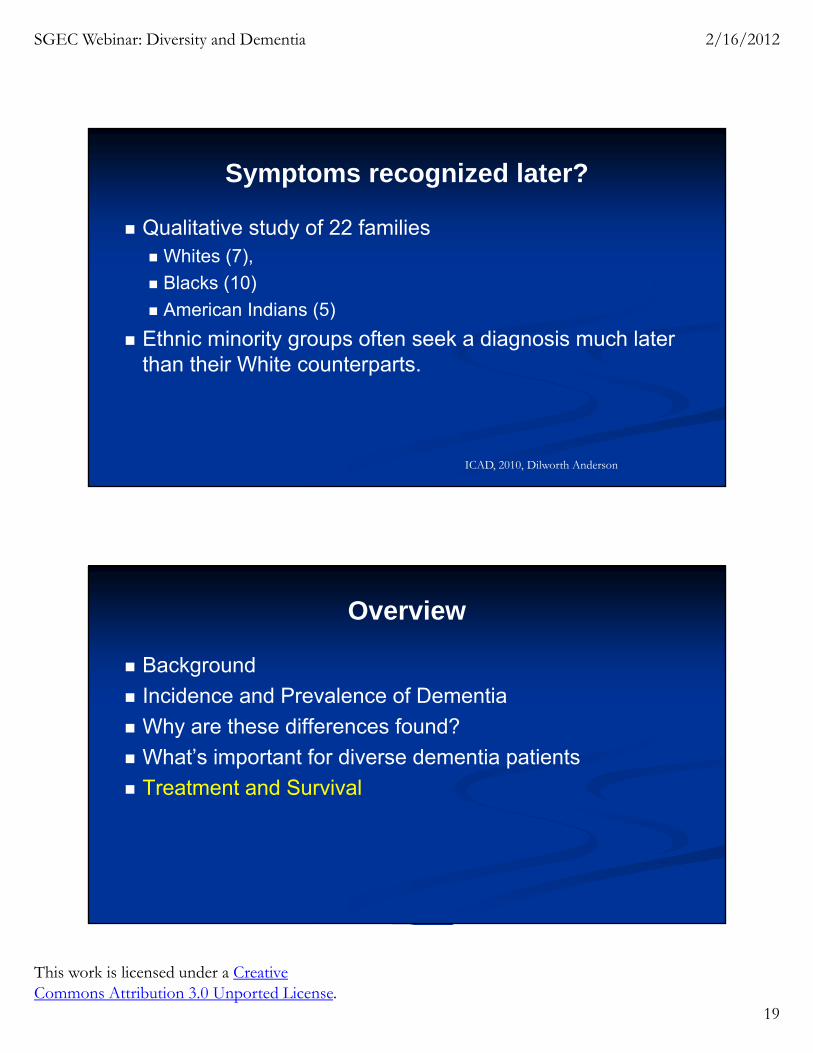
Symptoms recognized later?
Qualitative study of 22 families Whites (7),
Blacks (10)
American Indians (5)
Ethnic minority groups often seek a diagnosis much later than their White counterparts.
ICAD, 2010, Dilworth Anderson
Overview
Background
Incidence and Prevalence of Dementia
Why are these differences found?
What’s important for diverse dementia patients
Treatment and Survival
SGEC Webinar: Diversity and Dementia 2/16/2012
This work is licensed under a Creative Commons Attribution 3.0 Unported License.
20
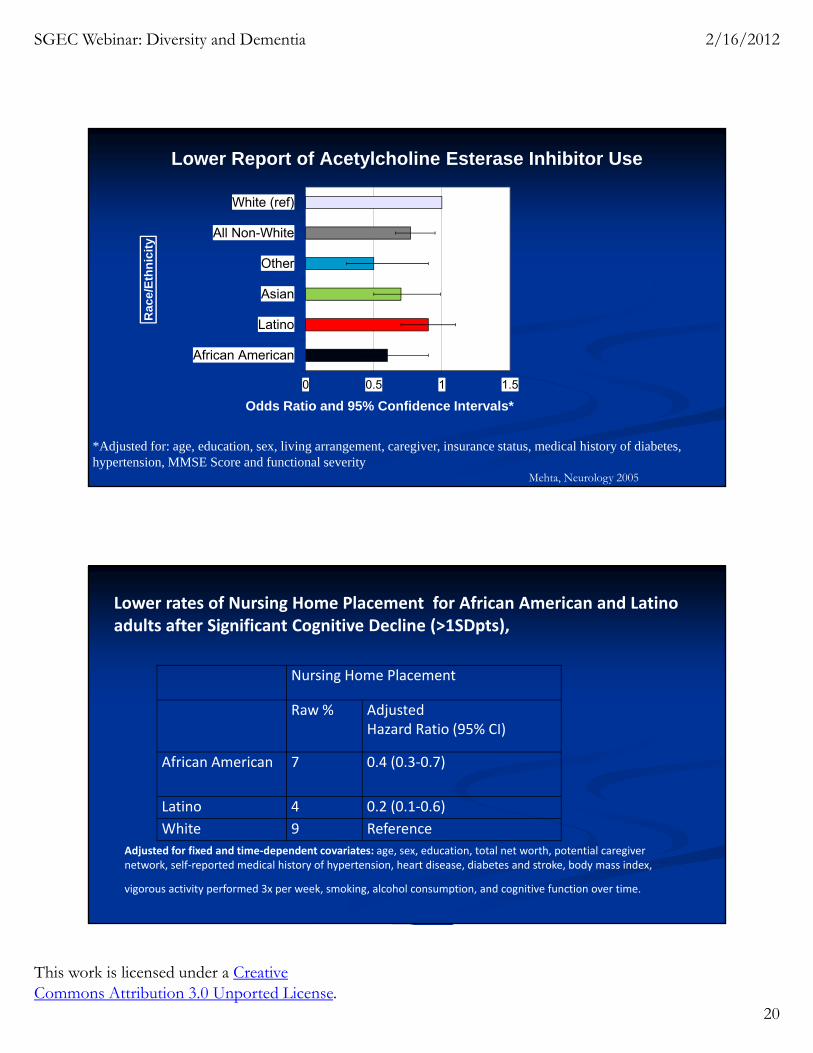
Lower Report of Acetylcholine Esterase Inhibitor Use
0 0.5 1 1.5
African American
Latino
Asian
Other
All Non-White
White (ref)
Odds Ratio and 95% Confidence Intervals*
Rac
e/E
thn
icit
y
*Adjusted for: age, education, sex, living arrangement, caregiver, insurance status, medical history of diabetes, hypertension, MMSE Score and functional severity
Mehta, Neurology 2005
Nursing Home Placement
Raw % AdjustedHazard Ratio (95% CI)
African American 7 0.4 (0.3‐0.7)
Latino 4 0.2 (0.1‐0.6)
White 9 Reference
Lower rates of Nursing Home Placement for African American and Latino adults after Significant Cognitive Decline (>1SDpts),
Adjusted for fixed and time‐dependent covariates: age, sex, education, total net worth, potential caregiver network, self‐reported medical history of hypertension, heart disease, diabetes and stroke, body mass index,
vigorous activity performed 3x per week, smoking, alcohol consumption, and cognitive function over time.
SGEC Webinar: Diversity and Dementia 2/16/2012
This work is licensed under a Creative Commons Attribution 3.0 Unported License.
21
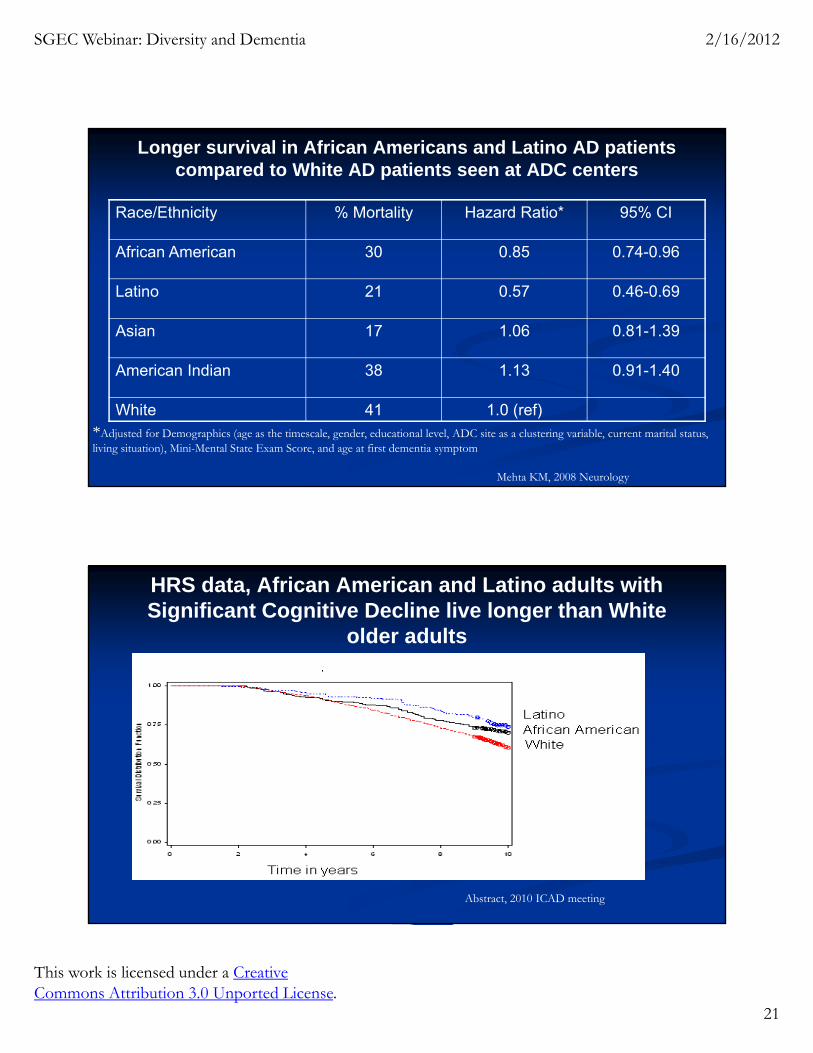
Longer survival in African Americans and Latino AD patients compared to White AD patients seen at ADC centers
Race/Ethnicity % Mortality Hazard Ratio* 95% CI
African American 30 0.85 0.74-0.96
Latino 21 0.57 0.46-0.69
Asian 17 1.06 0.81-1.39
American Indian 38 1.13 0.91-1.40
White 41 1.0 (ref)*Adjusted for Demographics (age as the timescale, gender, educational level, ADC site as a clustering variable, current marital status, living situation), Mini-Mental State Exam Score, and age at first dementia symptom
Mehta KM, 2008 Neurology
HRS data, African American and Latino adults with Significant Cognitive Decline live longer than White
older adults
Abstract, 2010 ICAD meeting
SGEC Webinar: Diversity and Dementia 2/16/2012
This work is licensed under a Creative Commons Attribution 3.0 Unported License.
22
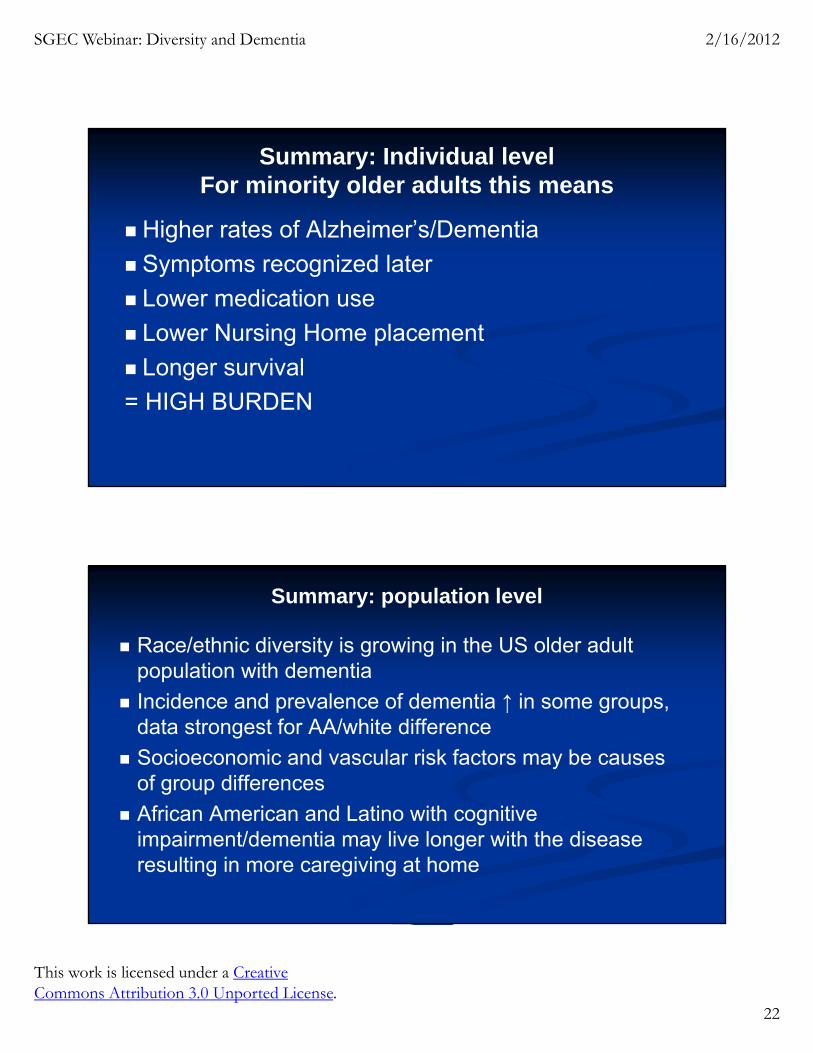
Summary: Individual levelFor minority older adults this means
Higher rates of Alzheimer’s/Dementia
Symptoms recognized later
Lower medication use
Lower Nursing Home placement
Longer survival
= HIGH BURDEN
Summary: population level
Race/ethnic diversity is growing in the US older adult population with dementia
Incidence and prevalence of dementia ↑ in some groups, data strongest for AA/white difference
Socioeconomic and vascular risk factors may be causes of group differences
African American and Latino with cognitive impairment/dementia may live longer with the disease resulting in more caregiving at home
SGEC Webinar: Diversity and Dementia 2/16/2012
This work is licensed under a Creative Commons Attribution 3.0 Unported License.
23
AcknowledgementsUCSF
Geriatrics Kenneth E. Covinsky C. Seth Landefeld Carolyn Peterson
Psychiatry Kristine Yaffe Deborah Barnes
Neurology Bruce Miller
SALSA Mary N. Haan
MAP/MARS Lisa Barnes
HRSKenneth Langa M. Kabeto
Columbia University Jeanne Teresi
CADC
• Eliseo Pérez-Stable• Anita Stewart• Sukyung Chung
Dementia and Diversity
SGEC Webinar: Diversity and Dementia 2/16/2012
This work is licensed under a Creative Commons Attribution 3.0 Unported License.
24
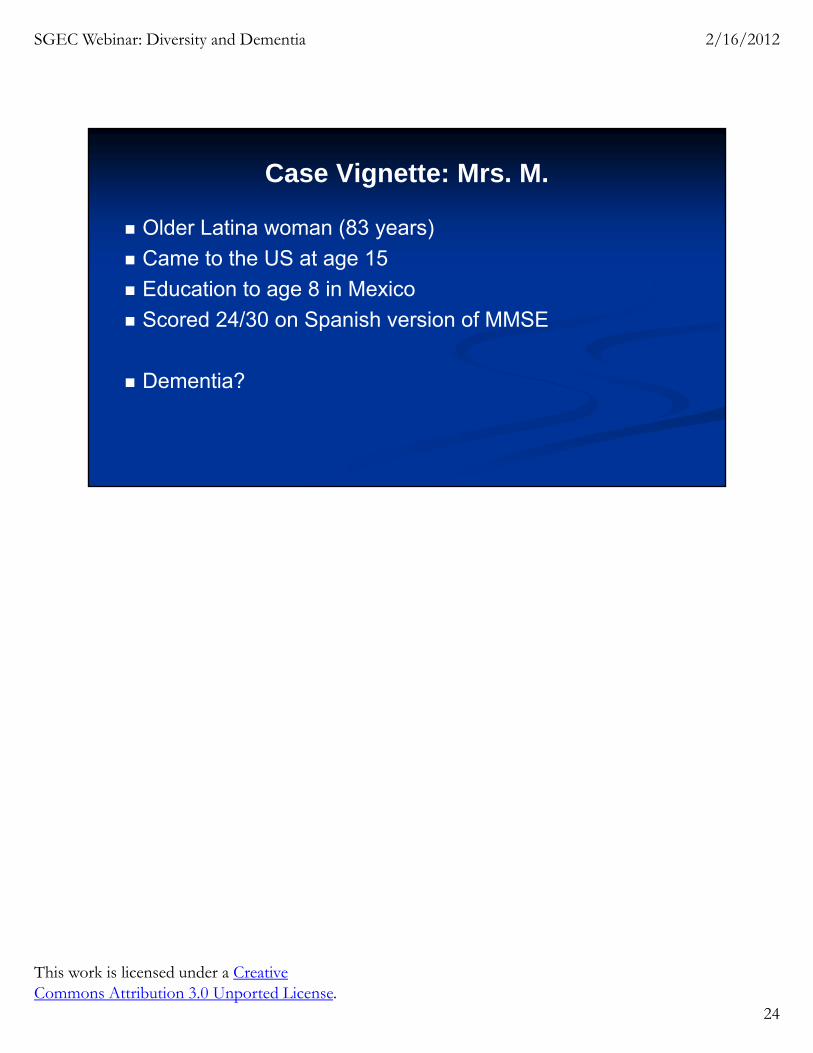
Case Vignette: Mrs. M.
Older Latina woman (83 years)
Came to the US at age 15
Education to age 8 in Mexico
Scored 24/30 on Spanish version of MMSE
Dementia?