Embed Size (px)
Citation preview
Diversifying livestock promotes multidiversity andmultifunctionality in managed grasslandsLing Wanga, Manuel Delgado-Baquerizob,c, Deli Wanga,1, Forest Isbelld, Jun Liua, Chao Fenga, Jushan Liua,Zhiwei Zhonga, Hui Zhua, Xia Yuana, Qing Changa, and Chen Liua
aKey Laboratory of Vegetation Ecology of Ministry of Education, Institute of Grassland Science, School of Environment, Northeast Normal University,Changchun, 130024 Jilin, China; bCooperative Institute for Research in Environmental Sciences, University of Colorado, Boulder, CO 80309; cDepartamentode Biología y Geología, Física y Química Inorgánica, Escuela Superior de Ciencias Experimentales y Tecnología, Universidad Rey Juan Carlos, 28933 Móstoles,Spain; and dDepartment of Ecology, Evolution, and Behavior, University of Minnesota, Saint Paul, MN 55108
Edited by Robin S. Reid, Colorado State University, Fort Collins, CO, and accepted by Editorial Board Member Ruth S. DeFries January 26, 2019 (received forreview April 27, 2018)
Increasing plant diversity can increase ecosystem functioning,stability, and services in both natural and managed grasslands,but the effects of herbivore diversity, and especially of livestockdiversity, remain underexplored. Given that managed grazing isthe most extensive land use worldwide, and that land managerscan readily change livestock diversity, we experimentally testedhow livestock diversification (sheep, cattle, or both) influencedmultidiversity (the diversity of plants, insects, soil microbes, andnematodes) and ecosystem multifunctionality (including plantbiomass production, plant leaf N and P, above-ground insectabundance, nutrient cycling, soil C stocks, water regulation, andplant–microbe symbiosis) in the world’s largest remaining grass-land. We also considered the potential dependence of ecosystemmultifunctionality on multidiversity. We found that livestock di-versification substantially increased ecosystem multifunctionalityby increasing multidiversity. The link between multidiversity andecosystem multifunctionality was always stronger than the linkbetween single diversity components and functions. Our workprovides insights into the importance of multitrophic diversity tomaintain multifunctionality in managed ecosystems and suggeststhat diversifying livestock could promote both multidiversity andecosystem multifunctionality in an increasingly managed world.
multiple trophic diversity | ecosystem multifunctionality | grassland grazingmanagement | livestock diversity | mixed grazing
The strong reduction in biodiversity resulting from habitat lossand climate change has prompted a large body of research to
examine the effects of biodiversity loss on ecosystem functioning(1). Most studies have found a strong positive effect of increasingplant diversity on ecosystem functions in terrestrial ecosystems (2–11). However, the role of biodiversity, if any, in driving ecosystemfunctions in managed ecosystems remains much less explored (butsee refs. 12–17). Furthermore, although it is now clear that eco-system functioning depends even more on herbivore than on plantdiversity in aquatic ecosystems (6, 10), the potential importance ofherbivore diversity remains unclear in terrestrial ecosystems.Livestock grazing is the most widespread land use on Earth
(18), including in northern China (19), which is part of one of thelargest remaining grasslands on Earth (i.e., the Eurasian steppe)where grassland is largely used to support livestock grazing forfood production. Livestock grazing can alter both biodiversityand ecosystem functioning (20–22). For example, livestockgrazing can directly disturb soils physically (e.g., via soil com-paction) and chemically (e.g., altering nutrient cycling via animaldung), thereby affecting plant productivity and ecosystem func-tion. Furthermore, livestock grazing, as an important driver ofgrassland biodiversity change, not only exerts important and di-rect effects on plant diversity (23), but also on the diversity ofother above-ground and below-ground organisms such as insects(24) and soil animals (25). The increasing human population andper capita demand for the production of meat and animalproducts (26) has placed tremendous pressures on grassland
ecosystems worldwide, including in China. Theory predicts that in-creasing herbivore diversity could increase the production of herbi-vores (27) and there is some evidence that mixed grazing canincrease livestock production (28, 29). However, the wider impacts ofmixed grazing on multitrophic diversity (multidiversity of above-ground and below-ground organisms) and multiple ecosystem func-tions (multifunctionality) remain completely unexplored. Evaluatingthe importance of biodiversity in regulating ecosystem function inmanaged ecosystems is of paramount importance to predict the fu-ture dynamics of terrestrial ecosystems in a highly managed world.Here, we used a 5-y field-manipulated grazing experiment,
including livestock grazing by single species (cattle or sheep) andmixed species (sheep and cattle) to evaluate the role of diversifyinglivestock (single vs. mixed livestock species) in regulating multi-diversity, including above-ground (e.g., plants and insects) andbelow-ground (e.g., microbes and microinvertebrates) organisms,and multifunctionality, including variables related to productivity,nutrient cycling, soil C stocks, water regulation, and plant–microbesymbiosis, and to assess the importance of multidiversity in regulatingecosystem multifunctionality in highly managed ecosystems (SIAppendix, Fig. S1).
Significance
The potential importance of herbivore diversity in maintainingecosystem functioning remains unclear in terrestrial ecosys-tems. This is a critical knowledge gap because the global hu-man population increasingly relies on grasslands to supplymeat and dairy products. As the global human populationcontinues to grow, and as per capita consumption of meat anddairy products continues to increase, livestock grazing willplace unprecedented pressures on grasslands worldwide. Weshow that diversifying livestock could promote grassland bio-diversity and ecosystem multifunctionality in an increasinglymanaged world, and also provide insights into the importance ofmultitrophic diversity to maintain ecosystem multifunctionality inmanaged ecosystems. Grassland grazing management by live-stock diversification increases nature’s benefits to people, partlyby maintaining a diverse array of grassland species.
Author contributions: L.W. and D.W. designed research; Jun Liu, C.F., Jushan Liu, Z.Z., H.Z.,X.Y., Q.C., and C.L. performed research; M.D.-B. and F.I. analyzed data; and L.W., M.D.-B.,D.W., and F.I. wrote the paper.
The authors declare no conflict of interest.
This article is a PNAS Direct Submission. R.S.R. is a guest editor invited by theEditorial Board.
This open access article is distributed under Creative Commons Attribution License 4.0 (CC BY).
Data deposition: Data reported in this paper have been deposited in the Dryad DigitalRepository database, datadryad.org/ (doi: 10.5061/dryad.dv44mg0).1To whom correspondence should be addressed. Email: [email protected].
This article contains supporting information online at www.pnas.org/lookup/suppl/doi:10.1073/pnas.1807354116/-/DCSupplemental.
Published online March 8, 2019.
www.pnas.org/cgi/doi/10.1073/pnas.1807354116 PNAS | March 26, 2019 | vol. 116 | no. 13 | 6187–6192
ECOLO
GY
SUST
AINABILITY
SCIENCE
Dow
nloa
ded
by g
uest
on
Oct
ober
17,
202
1
To obtain a single index reflecting multitrophic diversity (multi-diversity), we combined the biodiversity characteristics by averagingthe standardized scores [minimum-maximum (min-max) normali-zation] of species richness across six groups of above-ground andbelow-ground organisms: plants, herbivorous insects, predatory in-sects, soil bacteria, fungi, and nematodes (30). We then quantified amultifunctionality index comprising information for 12 above- andbelow-ground processes, including plant production (plant above-and below-ground biomass), plant nutrient content, and a nutrientsource for livestock herbivores (community leaf N and P content),above-ground insect biomass (herbivorous insect and predatoryinsect abundance), nutrient cycling (in situ measurements of soil Navailability, and soil total N and total P), soil C stocks (total organiccarbon controlled by bulk density), water regulation (soil moisture),and plant–microbe symbiosis (abundance of soil ectomycorrhizalfungi; see SI Appendix, Table S1 for further rationale on the se-lected functions). These variables constitute a good proxy for pro-ductivity, nutrient cycling, and build-up of nutrient pools, which areimportant determinants of ecosystem functioning in grazing grass-land. They also provide information on mycorrhizal colonization (4,15). Moreover, some of these functions (e.g., plant biomass and leafnutrient content) are essential for livestock herbivore nutrition (e.g.,protein and energy) and are critical for their fitness. The singleindex of ecosystem multifunctionality (EMF) was quantified byaveraging the standardized scores (min-max normalization) of 12ecosystem functions. We also conducted analyses using a multi-threshold multifunctionality approach (7).
Results and DiscussionOur results provide experimental evidence that diversifyinglivestock has the potential to increase multidiversity and multi-functionality in managed ecosystems. Here, we show that in-creasing from one to two species of livestock significantly andsubstantially increases above-ground diversity, multidiversity,multifunctionality (Fig. 1), and also the weighted EMF (SI Ap-pendix, Fig. S12). Cattle and sheep exhibit distinctive feedingmodes and preferences (31), and therefore could have a syner-gistic and complementary effect on vegetation structure (32).Furthermore, diversifying livestock may provide a wider varietyof niches for insects and soil organisms compared with singlelivestock, for example, by increasing the types of animal dungsand plant litter. This result suggests that mixing livestock species,at a given animal density, could be potentially used as a tool formanaging grasslands to conserve biodiversity, to regulate multi-ple ecosystem services, and to promote and sustain human well-being. As such, we argue that slight changes in grazing man-agement (e.g., increasing diversity of herbivores, under a similargrazing intensity level) could favor biodiversity and multi-functionality in an increasingly managed world. Here, we focusedon two of the most abundant livestock herbivores on Earth, andin China: cattle and sheep (33). Future studies will be needed toevaluate the potential contribution of further increasing livestockdiversity beyond these two species or of mixing other livestockspecies (e.g., goats and horses) and varieties (e.g., differentbreeds of cattle or sheep) for increasing multidiversity andmultifunctionality in China and elsewhere. Our results suggestthat it may be possible to indirectly manage grassland bio-diversity through livestock management, which would likely beless difficult and costly than directly managing the diversity ofplants, insects, and microbes. Such livestock management couldhelp to conserve multiple ecosystem functions and types of or-ganisms, which threaten the sustainability of terrestrial ecosys-tems worldwide, especially in developing countries. Our findingssuggest that diversifying livestock grazing might not only directlyprovide livestock products and increase the amount of biomassand the nutrient content of forage for livestock, but also, moreimportantly, help improve the biodiversity and ecosystem func-tioning of these economically and ecologically important regions.Critically, we also found a strong positive relationship between
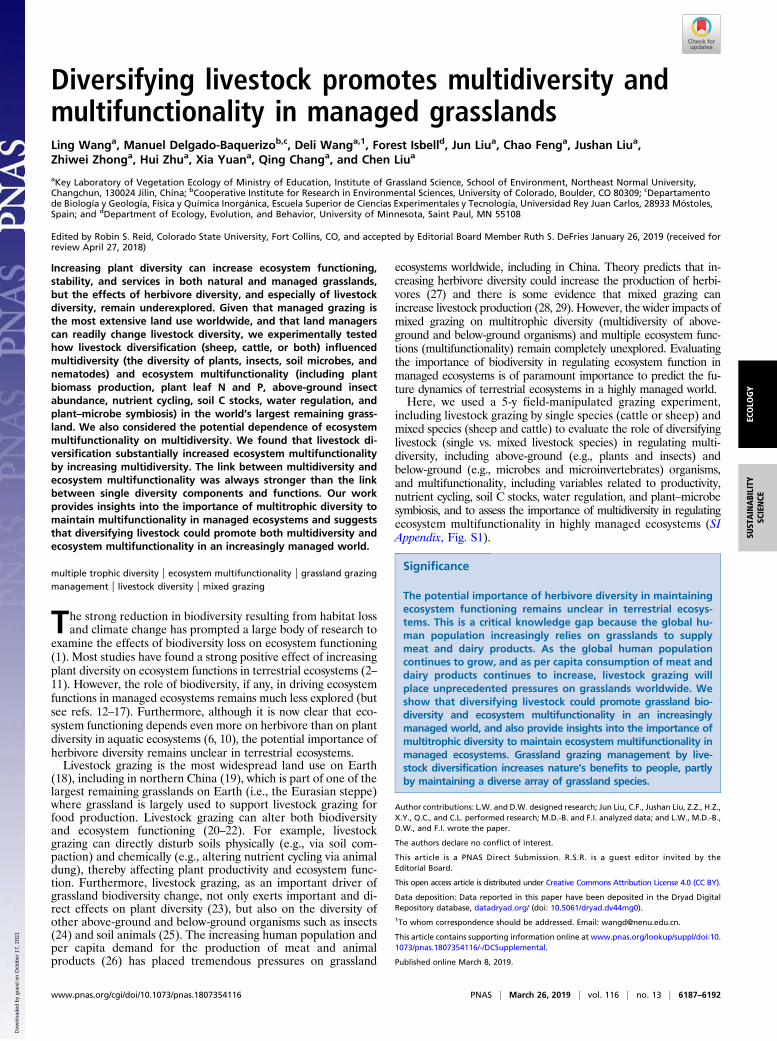
multidiversity and multifunctionality in this managed ecosystem(Fig. 2A). Similar positive and significant relationships between
multidiversity and the number of functions over different thresh-olds were observed here for the 25%, 50%, 75%, and 90%thresholds when we used a multithreshold multifunctionality ap-proach (SI Appendix, Fig. S2). This positive relationship was alsoobserved when we recalculated our multifunctionality index todown-weight highly correlated functions as described in Manninget al. (34) (SI Appendix, Figs. S9–S11), suggesting that our resultsare robust to the choice of multifunctionality index. In addition,the association between multidiversity and multifunctionality wasstronger than the correlations between above- or below-grounddiversity and multifunctionality (Fig. 2 B and C). The significanteffects of multidiversity and above- or below-ground diversity indriving multifunctionality were also maintained after accountingfor soil environmental conditions (soil pH, electrical conductivity,and bulk density), and grazing management types (livestock di-versity) using random forest modeling (Materials and Methods) (SIAppendix, Fig. S3).We then conducted structural equation modeling (SEM) to
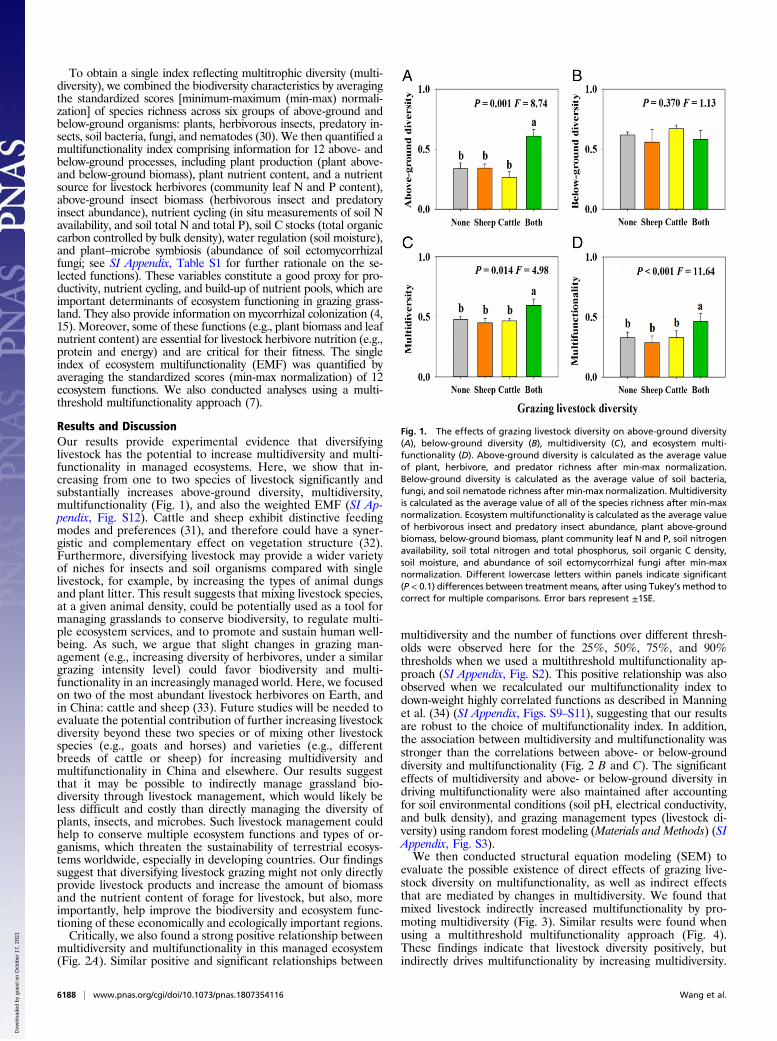
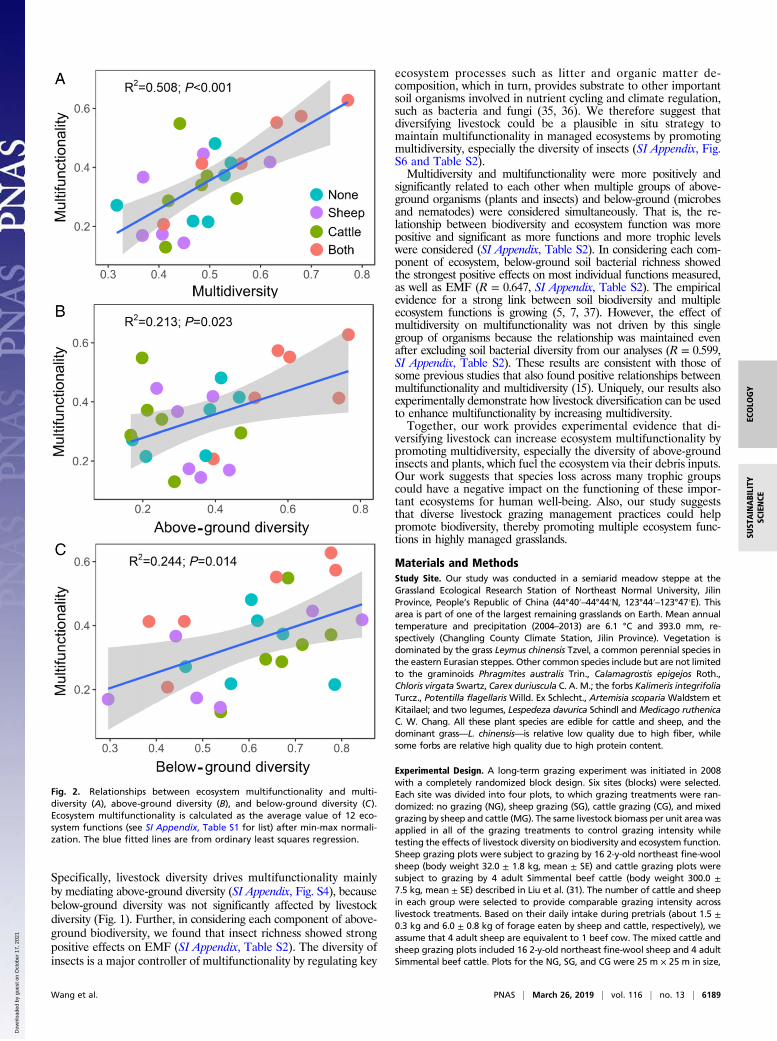
evaluate the possible existence of direct effects of grazing live-stock diversity on multifunctionality, as well as indirect effectsthat are mediated by changes in multidiversity. We found thatmixed livestock indirectly increased multifunctionality by pro-moting multidiversity (Fig. 3). Similar results were found whenusing a multithreshold multifunctionality approach (Fig. 4).These findings indicate that livestock diversity positively, butindirectly drives multifunctionality by increasing multidiversity.
Fig. 1. The effects of grazing livestock diversity on above-ground diversity(A), below-ground diversity (B), multidiversity (C), and ecosystem multi-functionality (D). Above-ground diversity is calculated as the average valueof plant, herbivore, and predator richness after min-max normalization.Below-ground diversity is calculated as the average value of soil bacteria,fungi, and soil nematode richness after min-max normalization. Multidiversityis calculated as the average value of all of the species richness after min-maxnormalization. Ecosystem multifunctionality is calculated as the average valueof herbivorous insect and predatory insect abundance, plant above-groundbiomass, below-ground biomass, plant community leaf N and P, soil nitrogenavailability, soil total nitrogen and total phosphorus, soil organic C density,soil moisture, and abundance of soil ectomycorrhizal fungi after min-maxnormalization. Different lowercase letters within panels indicate significant(P < 0.1) differences between treatment means, after using Tukey’s method tocorrect for multiple comparisons. Error bars represent ±1SE.
6188 | www.pnas.org/cgi/doi/10.1073/pnas.1807354116 Wang et al.
Dow
nloa
ded
by g
uest
on
Oct
ober
17,
202
1
Specifically, livestock diversity drives multifunctionality mainlyby mediating above-ground diversity (SI Appendix, Fig. S4), becausebelow-ground diversity was not significantly affected by livestockdiversity (Fig. 1). Further, in considering each component of above-ground biodiversity, we found that insect richness showed strongpositive effects on EMF (SI Appendix, Table S2). The diversity ofinsects is a major controller of multifunctionality by regulating key
ecosystem processes such as litter and organic matter de-composition, which in turn, provides substrate to other importantsoil organisms involved in nutrient cycling and climate regulation,such as bacteria and fungi (35, 36). We therefore suggest thatdiversifying livestock could be a plausible in situ strategy tomaintain multifunctionality in managed ecosystems by promotingmultidiversity, especially the diversity of insects (SI Appendix, Fig.S6 and Table S2).Multidiversity and multifunctionality were more positively and
significantly related to each other when multiple groups of above-ground organisms (plants and insects) and below-ground (microbesand nematodes) were considered simultaneously. That is, the re-lationship between biodiversity and ecosystem function was morepositive and significant as more functions and more trophic levelswere considered (SI Appendix, Table S2). In considering each com-ponent of ecosystem, below-ground soil bacterial richness showedthe strongest positive effects on most individual functions measured,as well as EMF (R = 0.647, SI Appendix, Table S2). The empiricalevidence for a strong link between soil biodiversity and multipleecosystem functions is growing (5, 7, 37). However, the effect ofmultidiversity on multifunctionality was not driven by this singlegroup of organisms because the relationship was maintained evenafter excluding soil bacterial diversity from our analyses (R = 0.599,SI Appendix, Table S2). These results are consistent with those ofsome previous studies that also found positive relationships betweenmultifunctionality and multidiversity (15). Uniquely, our results alsoexperimentally demonstrate how livestock diversification can be usedto enhance multifunctionality by increasing multidiversity.Together, our work provides experimental evidence that di-
versifying livestock can increase ecosystem multifunctionality bypromoting multidiversity, especially the diversity of above-groundinsects and plants, which fuel the ecosystem via their debris inputs.Our work suggests that species loss across many trophic groupscould have a negative impact on the functioning of these impor-tant ecosystems for human well-being. Also, our study suggeststhat diverse livestock grazing management practices could helppromote biodiversity, thereby promoting multiple ecosystem func-tions in highly managed grasslands.
Materials and MethodsStudy Site. Our study was conducted in a semiarid meadow steppe at theGrassland Ecological Research Station of Northeast Normal University, JilinProvince, People’s Republic of China (44°40′–44°44′N, 123°44′–123°47′E). Thisarea is part of one of the largest remaining grasslands on Earth. Mean annualtemperature and precipitation (2004–2013) are 6.1 °C and 393.0 mm, re-spectively (Changling County Climate Station, Jilin Province). Vegetation isdominated by the grass Leymus chinensis Tzvel, a common perennial species inthe eastern Eurasian steppes. Other common species include but are not limitedto the graminoids Phragmites australis Trin., Calamagrostis epigejos Roth.,Chloris virgata Swartz, Carex duriuscula C. A. M.; the forbs Kalimeris integrifoliaTurcz., Potentilla flagellaris Willd. Ex Schlecht., Artemisia scoparia Waldstem etKitailael; and two legumes, Lespedeza davurica Schindl and Medicago ruthenicaC. W. Chang. All these plant species are edible for cattle and sheep, and thedominant grass—L. chinensis—is relative low quality due to high fiber, whilesome forbs are relative high quality due to high protein content.
Experimental Design. A long-term grazing experiment was initiated in 2008with a completely randomized block design. Six sites (blocks) were selected.Each site was divided into four plots, to which grazing treatments were ran-domized: no grazing (NG), sheep grazing (SG), cattle grazing (CG), and mixedgrazing by sheep and cattle (MG). The same livestock biomass per unit areawasapplied in all of the grazing treatments to control grazing intensity whiletesting the effects of livestock diversity on biodiversity and ecosystem function.Sheep grazing plots were subject to grazing by 16 2-y-old northeast fine-woolsheep (body weight 32.0 ± 1.8 kg, mean ± SE) and cattle grazing plots weresubject to grazing by 4 adult Simmental beef cattle (body weight 300.0 ±7.5 kg, mean ± SE) described in Liu et al. (31). The number of cattle and sheepin each group were selected to provide comparable grazing intensity acrosslivestock treatments. Based on their daily intake during pretrials (about 1.5 ±0.3 kg and 6.0 ± 0.8 kg of forage eaten by sheep and cattle, respectively), weassume that 4 adult sheep are equivalent to 1 beef cow. The mixed cattle andsheep grazing plots included 16 2-y-old northeast fine-wool sheep and 4 adultSimmental beef cattle. Plots for the NG, SG, and CG were 25 m × 25 m in size,
Fig. 2. Relationships between ecosystem multifunctionality and multi-diversity (A), above-ground diversity (B), and below-ground diversity (C).Ecosystem multifunctionality is calculated as the average value of 12 eco-system functions (see SI Appendix, Table S1 for list) after min-max normali-zation. The blue fitted lines are from ordinary least squares regression.
Wang et al. PNAS | March 26, 2019 | vol. 116 | no. 13 | 6189
ECOLO
GY
SUST
AINABILITY
SCIENCE
Dow
nloa
ded
by g
uest
on
Oct
ober
17,
202
1

while plots for MG were 25 m × 50 m. Mixed grazing plots were twice as largeas other plots to ensure equal grazing intensity between single and mixedgrazing treatments, while also maintaining herd size for each livestock species.We used a 25 m × 50 m plot including 16 sheep and 4 cattle for the mixedgrazing treatment (i.e., instead of 8 sheep and 2 cattle in 25 m × 25 m plots) asherd size is known to strongly influence livestock behavior (38). For example, ithas been shown that in small groups, animals interrupt their foraging to scanthe environment more frequently, which thus reduces time spent foraging,i.e., animal foraging efficiency (38). Overall, grazing was maintained at amoderate intensity (i.e., 6.67 sheep units per ha−1) in each livestock treatment.We used the same set of cattle and sheep in all of the grazing treatments, i.e.,rotational grazing treatment to avoid effects of using different individualanimals in different treatments on diversity and functions. Each year, grazingoccurred from June to September. To ensure that these differences in plot size(between MG and other treatments) had no direct effect on the mean orvariance of samples collected, all sampling was conducted at the same spatialscales and within the same total area in each of the four livestock treatments.
Biodiversity.Above ground: Vegetation investigation. We conducted vegetation sampling inmid-August 2012. We established three 25-m parallel transects at 6.25-mintervals within each plot. Then, we located 50 cm × 50 cm quadrats alongeach transect at 5-m intervals. We used these 15 quadrates to measure plantdiversity (richness) in each plot.Above ground: Insect sampling and identification. Insect sampling was carried outfour times from early July to late September in 2012, using two complementarysamplingmethods: sweep netting and suctions (39, 40).We used sweep nettingto sample insects by using a light muslin net along two 2-m wide and 25-mlong parallel transects within each plot (41, 42). Each sampling was composedof 15 sweeps in each transect, and two samplings were carried out in each plotto ensure that those samples were representative on each sampling date.In addition, we used a “D-Vac” suction sampler (John W. Hock Company)equipped with a circular nozzle of 15.6-cm diameter to sample insects. A totalof 16 sampling points were placed at the intersections of a grid formed bysquares of 5 m-length sides that was superimposed upon a map of each ex-perimental plot. The precise coordinates of each sampling point (intersection)was located in each plot using a geographical positioning system (GPS)handset. The area of each sampling point was 1 m × 1 m. Each sample con-sisted of three pooled subsamples taken for each sampling point. Each sub-sample was taken with a 50-s suction time. Insect specimens were collectedunder favorable monitoring conditions (sunny days with minimal cloud coverand calm or no wind), from 9:00 AM to 15:00 PM. All plots were visited on the
same day and in random order on each sampling date. The contents of thesweep net were preserved in bottles containing ethyl acetate. All individualswere identified to species level (morphospecies), and specimens that could notbe identified to species were separated into recognizable taxonomic units.Nymphs, larvae, and other immature insects were not considered due to
Fig. 3. Direct and indirect effects of livestock di-versity on EMF. (A) Hypothesis model, (B) structuralequation model describing the effects of grazinglivestock diversity and biodiversity on ecosystemmultifunctionality, and (C) standardized total effects(direct plus indirect effects) derived from the struc-tural equation model depicted. Numbers adjacent toarrows are indicative of the effect size of the re-lationship. R2 denotes the proportion of varianceexplained. Significance levels of each predictor are*P < 0.05, **P < 0.01. STE, standardized total ef-fects. There was a nonsignificant deviation of thedata from the model [χ2 = 2.71, df = 1; P = 0.10;root mean square error of approximation (RMSEA)P = 0.11].
Fig. 4. Structural equation model describing the effects of grazing livestockdiversity and biodiversity on the number of functions beyond different thresholdsof 25% (A), 50% (B), 75% (C), and 90% (D), calculated following the multi-threshold approach. Numbers adjacent to arrows are indicative of the effect sizeof the relationship. R2 denotes the proportion of variance explained. Significancelevels of each predictor are aP< 0.10, *P< 0.05, **P< 0.01. STE, standardized totaleffects (sum of direct and indirect effects). In all cases, there was a nonsignificantdeviation of the data from themodel (χ2= 2.71, df= 1; P = 0.10; RMSEA P = 0.11).
6190 | www.pnas.org/cgi/doi/10.1073/pnas.1807354116 Wang et al.
Dow
nloa
ded
by g
uest
on
Oct
ober
17,
202
1
problems of species identification (3.72% of samples). All herbivorous andpredatory insect specimens were recognized based on mouth parts, knowl-edge of their natural histories, and consultation with the literature. Speciesrichness of herbivores and predators for each experimental plot included allspecies sampled throughout the sampling period in a given experimental year.Below ground: Soil bacteria and fungi. Nine of the 15 quadrats (explained abovefor plant richness) were randomly selected in each plot for soil sampling inmid-August 2012. A composite sample (that is, from five soil samples; top15 cm)was taken per quadrat. Each samplewas separated into three portions.The first portion was air dried for edaphic properties analysis (i.e., soil organicC, total N, total P, and soil moisture). The second portion was archivedat −80 °C for microbial diversity and composition analysis. The thirdportion was directly used for soil nematode extraction.
Genomic DNAwas extracted from 500 mg of soil for each sample using theE.Z.N.A. Soil DNA Kit (Omega Bio-Tek, Inc.) according to the manufacturer’sinstructions (43). Subsequently, all extracted DNA samples were stored at−20 °C before PCR amplification.
Targeted amplification of bacterial 16S rRNA and fungal ITS sequenceswere performed to characterize soil microbial community diversity. The V1–V3 region of the 16S rRNA genes was amplified with 27F (44) and 533Rprimers containing A and B sequencing adapters (454 Life Science). Theforward primer (B-27F) was 5′-CCTATCCCCTGTGTGCCTTGGCAGTCGACTA-GAGTTTGATCCTGGCTCAG-3′, with the sequence of the B adapter in italics.The reverse primer (A-533R) was 5′-CCATCTCATCCCTGCGTGTCTCCGACGA-CTNNNNNNNNNNNNTTACCGCGGCTGCTGGCAC-3′, with the sequence ofthe A adapter in italics and Ns denoting a unique 12-bp error-correctingGolay barcode used to tag each PCR product. For each sample, PCR reac-tions for bacteria were carried out in triplicate 20-μL reactions with 0.4 μL ofeach primer at 5 μmol·L−1, 10 ng template DNA, 2 μL dNTPs at 2.5 mmol·L−1,0.4 μL FastPfu Polymerase (TransGen AP221-02: TransStart FastPfu DNA Po-lymerase; TransGen Biotech), 4 μL 5× FastPfu buffer, and certified DNA-freePCR water, according to the following procedures: 95 °C for 2 min; 25 cyclesof 95 °C for 30 s, 55 °C for 30 s, 72 °C for 30 s, and 72 °C for 5 min. PrimersITS1 and ITS4 amplified the ITS region (45), also containing A and B se-quencing adapters (454 Life Science). The forward primer (B-ITS4) was 5′-CCTATCCCCTGTGTGCCTTGGCAGTCGACTTCCTCCGCTTATTGATATGC-3′. Thereverse primer (A-ITS1) was 5′- CCATCTCATCCCTGCGTGTCTCCGACGAC-TNNNNNNNNNNNNTCCGTAGGTGAACCTGCGG-3′. PCR reactions for eachsample were carried out in triplicate 20-μL reactions with 0.8 μL of each primerat 5 μmol·L−1, 10 ng template DNA, 2 μL dNTPs at 2.5 mmol·L−1, 0.4 μL FastPfuPolymerase (TransGen AP221-02; TransStart FastPfu DNA Polymerase; Trans-Gen Biotech), 4 μL 5× FastPfu buffer, and certified DNA-free PCR water,according to the following procedures: 95 °C for 2 min, 32 cycles of 95 °C for30 s, 53 °C for 30 s and 72 °C for 30 s, and 72 °C for 5 min. Bacterial and fungalPCR amplifications were all performed on the ABI GeneAmp 9700 PCR system(Applied Biosystems). Then, replicated amplicons were pooled and visualizedon 2% agarose gels using SYBR Safe DNA gel stain in 0.5× TBE. Subsequently,amplicons were cleaned using the AxyPrep DNA Gel Extraction Kit (AxygenBiosciences), quantified by PicoGreen dsDNA Quantitation Reagent andQuantiFluor-ST Fluorometer (Promega Corp.), and combined with equimolarratios into a single tube. The barcoded pyrosequencing for bacteria and fungiwas performed on a 454 GS FLX System platform (Roche 454 Life Science) atthe Shanghai Majorbio Bio-Pharm Technology Co., Ltd., Shanghai, China.
The pyrosequencing reads were analyzed using Quantitative Insights IntoMicrobial Ecology (QIIME, qiime.org/), and the details of the analysis pipelineused followed the procedure described in Hamady et al. (46). In our study,sequences more than 200 bp in length with an average quality score >25 andwithout ambiguous base calls were included in the subsequent analyses. The12-bp barcode was examined to assign sequences to soil samples. Usearch(version 7.1, qiime.org/) was used to check for chimeras and to cluster thetrimmed and unique sequences into operational taxonomic units (OTUs) atthe 97% similarity level (47, 48). Phylotype richness (number of unique OTUs)across all samples of the microbial community diversity was calculated. Forcalculations for the diversity metrics, samples were rarified to 3,000 se-quences for bacteria and 2,438 sequences for fungi per soil sample.Below ground: Soil nematode extraction and identification. Nematodes wereextracted for 48 h from 50 g fresh soil using the Baermann funnel method(49). After extraction, nematodes were heat killed with 80 °C hot water toachieve elongation of the nematodes and fixed in 4% formaldehyde. Aminimum of 100 individuals (or all if below) were identified to genus levelusing 100× magnification (50).
Ecosystem Functions.Plant biomass and community leaf N and P. Five of the 15quadrats (explained above)were randomly selected in each plot for quantifying plant biomass. To do so, we
harvested all of the above-ground biomass (>2.5 cm above soil surface) in thesefive quadrats. The live plant samples were separated into leaf and shoot, and ovendried at 65 °C for 48 h and weighed. Then, we ground the above-ground leafmaterials to a fine powder on a ball mill and analyzed for plant nitrogen andphosphorus. Leaf N content was analyzed using the Kjeldahl method (A 2300Kjeltec Analyzer Unit; Foss Tecator), and leaf P content was analyzed using fullyautomated high technology discrete analyzer (Smartchem 450; AMS) after H2SO4-H2O2 digestion. We then collected below-ground root biomass to a depth of 30 cmusing soil cores (diameter 7 cm) in each of these five quadrats as well. Roots werecollected by rinsing the samples using sieves (mesh size 0.25 mm) on the same day,and then oven dried at 65 °C for 48 h and weighed.Insect abundance. We recorded the accumulative abundance of insect herbi-vores and predators throughout sampling periods (explained above for insectsampling and identification).Soil variables. Soil samples for themeasurement of soil organic C, total N, total P,and soil moisture were collected in mid-August 2012 (explained above). Soilorganic C was determined with the K2Cr2O7 titration method after digestion(51). Soil N was determined by Kjeltec 2300 Analyzer Unit (FOSS) after wetdigestion with H2SO4 plus catalyzer CuSO4 and K2SO4 (52). Soil P was measuredby the HClO4-H2SO4 digestion method (53). Soil moisture was determinedgravimetrically using 10 g of fresh soil samples dried at 105 °C for 24 h to aconstant weight. Soil N availability was determined in July–August 2013 usingion-exchange resin membranes (Ionics), which were made from anion andcation sheets that were cut into 2.5 cm × 10 cm strips described in Liu et al. (54).Membrane strips were pretreated using 0.5M HCl and 0.5 M NaHCO3 toremove existing nutrient ions. We inserted one anion and one cation strip ineach sampling quadrat to absorb nitrate ions (NO3
−) and ammonium ions(NH4
+), respectively. After 15 d, we collectedmembranes and then immediatelyrinsed each with deionized water to remove soil. Membranes were placed inpolyethylene bags with ∼20 mL deionized water, then transported to thelaboratory in an ice-filled cooler and stored at 4 °C until analysis. To extractNH4
+ and NO3− from the membranes, each pair of membranes was placed in a
250-mL conical flask with 70 mL 2N KCl and shaken at 40 rpm for 1 h using areciprocal shaker before being filtered through a 1-μm Whatman glass filter.NH4
+ and NO3−were analyzed with an Alliance Flow Analyzer (Futura). Soil
NH4+ and NO3
− were calculated by the formula: [(conc in μg N per mL) × 70 mLKCl)]/(50 cm2 area of the strip × days in the ground). Soil N availability wasdetermined as the sum of ammonium and nitrate extracted from the mem-brane pair. Information on ectomycorrhizal fungi was obtained from theonline application FUNGuild described in Nguyen et al. (55). The relativeabundance of ectomycorrhizal fungi was calculated as the sum of the relativeabundance of all taxa (OTUs) sharing that particular functional group.Assessing ecosystem multifunctionality and biodiversity. We used 12 variablesreflecting ecosystemmultifunctionality including above-ground herbivorous insectabundance and predatory insect abundance, above-ground plant biomass, plantcommunity leaf N and P, and below-ground root biomass, soil total N and P, andsoil N availability, soil organic C density, soil moisture, and abundance of soilectomycorrhizal fungi (SI Appendix, Fig. S1 and Table S1). We then calculated theaverage multifunctionality index. This index is widely used in the multi-functionality literature (6, 7, 56–58). Moreover, we also calculated the number offunctions beyond a given threshold (25%, 50%, 75%, and 90%) using the mul-tithreshold approach described in Byrnes et al. (57), as explained in Delgado-Baquerizo et al. (7). Before analyses, all individual ecosystem function (EF) vari-ables were standardized by transformation as follows: EF = [rawEF −min(rawEF)]/[max(rawEF) − min(rawEF)], with EF indicating the final (transformed) ecosystemfunction value and raw EF indicating raw (untransformed) ecosystem functionvalues. This way each transformed EF variable had aminimum value of zero and amaximum of 1. Theses standardized ecosystem functions were then averaged toobtain a multifunctionality index (4). Moreover, we calculated the weighted EMFto down-weight highly correlated functions as described in Manning et al. (34).We combined the biodiversity characteristics (plant richness, herbivorous andpredatory insect richness, soil bacterial richness and fungal richness, and nema-tode richness) in the same manner to obtain a single index reflecting a syntheticwhole-ecosystem biodiversity measure multidiversity, which integrated informa-tion on a wide diversity of groups of organisms. Moreover, we calculated above-ground multidiversity and below-ground multidiversity, respectively, but also re-peated some of our analyses for single functions (SI Appendix, Table S2).Statistical analyses. The effects of grazing livestock diversity on above- andbelow-ground diversity, multidiversity, ecosystem functions, and EMF wereanalyzed with a two-way ANOVA, with livestock diversity as the main factor,and block as the random factor. Tukey’s multiple comparisons were used as apost hoc analysis to test for significant differences among all treatments. Theanalyses were carried out in SPSS software version 17.0.
Wang et al. PNAS | March 26, 2019 | vol. 116 | no. 13 | 6191
ECOLO
GY
SUST
AINABILITY
SCIENCE
Dow
nloa
ded
by g
uest
on
Oct
ober
17,
202
1
Random Forest. Using the rfPermute R package, we conducted a classificationrandom forest analysis to identify which factors were the main predictors ofmultifunctionality among the following variables: grazing management(livestock diversity), soil bulk density, soil pH, electrical conductivity, andmultidiversity (or above- or below-ground diversity) (59). This random forestanalysis has been used to identify the major predictors of multifunctionalityin Delgado-Baquerizo et al. (7).
Structural Equation Modeling. We used SEM to evaluate the direct and indirecteffects of grazing livestock diversity on multifunctionality and number of func-tions beyond a given threshold (25%, 50%, 75%, and 90%) using the multi-threshold approach. In all cases the livestock diversity were categorical variableswith two levels: 1 (a particular management type: cattle, sheep, and cattle +sheep) and 0 (remaining management types + control). The goodness of fit ofSEM models was checked using the following: the χ2 test and the Bollen–Stine
bootstrap test as done in Delgado-Baquerizo et al. (7). We also repeated ouranalyses using as a response variable the residuals from an ANOVA using aver-aging EMF as our response variable and block as a predictor. The aim for thisanalysis is to ensure that block design is not influencing our results on the effectsof grazing livestock diversity and biodiversity on EMF (SI Appendix, Fig. S5). SEMmodels were conducted with the software AMOS 20 (IBM SPSS, Inc.).
ACKNOWLEDGMENTS.We thank B. Schmid for comments on earlier versionsof the manuscript; and G. Zhang, X. Liu, Y. Zhang, and C. Cui for help withthe field work. This work was supported by the National Key Research andDevelopment Program of China (2016YFC0500602), National Natural ScienceFoundation of China (31230012, 31772652, and 31770520), and the Programfor Introducing Talents to Universities (B16011). M.D.-B. also acknowledgessupport from the Marie Sklodowska-Curie Actions of the Horizon 2020Framework Program H2020-MSCA-IF-2016 under Grant Agreement 702057.
1. Balvanera P, et al. (2006) Quantifying the evidence for biodiversity effects on eco-system functioning and services. Ecol Lett 9:1146–1156.
2. Cardinale BJ, et al. (2011) The functional role of producer diversity in ecosystems. Am JBot 98:572–592.
3. Isbell F, et al. (2011) High plant diversity is needed to maintain ecosystem services.Nature 477:199–202.
4. Maestre FT, et al. (2012) Plant species richness and ecosystem multifunctionality inglobal drylands. Science 335:214–218.
5. Jing X, et al. (2015) The links between ecosystem multifunctionality and above- andbelowground biodiversity are mediated by climate. Nat Commun 6:8159.
6. Lefcheck JS, et al. (2015) Biodiversity enhances ecosystem multifunctionality acrosstrophic levels and habitats. Nat Commun 6:6936.
7. Delgado-Baquerizo M, et al. (2016) Microbial diversity drives multifunctionality interrestrial ecosystems. Nat Commun 7:10541.
8. Grace JB, et al. (2016) Integrative modelling reveals mechanisms linking productivityand plant species richness. Nature 529:390–393.
9. Liang J, et al. (2016) Positive biodiversity-productivity relationship predominant inglobal forests. Science 354:aaf8957.
10. O’Connor MI, et al. (2017) A general biodiversity-function relationship is mediated bytrophic level. Oikos 126:18–31.
11. Zavaleta ES, Pasari JR, Hulvey KB, Tilman GD (2010) Sustaining multiple ecosystemfunctions in grassland communities requires higher biodiversity. Proc Natl Acad SciUSA 107:1443–1446.
12. Bullock JM, Pywell RF, Walker KJ (2007) Long-term enhancement of agriculturalproduction by restoration of biodiversity. J Appl Ecol 44:6–12.
13. Finn JA, et al. (2013) Ecosystem function enhanced by combining four functionaltypes of plant species in intensively managed grassland mixtures: A 3-yearcontinental-scale field experiment. J Appl Ecol 50:365–375.
14. Allan E, et al. (2015) Land use intensification alters ecosystem multifunctionality vialoss of biodiversity and changes to functional composition. Ecol Lett 18:834–843.
15. Soliveres S, et al. (2016) Biodiversity at multiple trophic levels is needed for ecosystemmultifunctionality. Nature 536:456–459.
16. Hallett LM, Stein C, Suding KN (2017) Functional diversity increases ecological stabilityin a grazed grassland. Oecologia 183:831–840.
17. Isbell F, et al. (2017) Benefits of increasing plant diversity in sustainable agro-ecosystems. J Ecol 105:871–879.
18. Asner GP, Elmore AJ, Olander LP, Martin RE, Harris AT (2004) Grazing systems, eco-system responses, and global change. Annu Rev Environ Resour 29:261–299.
19. Kemp DR, et al. (2013) Innovative grassland management systems for environmentaland livelihood benefits. Proc Natl Acad Sci USA 110:8369–8374.
20. Milchunas DG, Lauenroth WK (1993) Quantitative effects of grazing on vegetationand soils over a global range of environments. Ecol Monogr 63:327–366.
21. Charles GK, Porensky LM, Riginos C, Veblen KE, Young TP (2017) Herbivore effects onproductivity vary by guild: Cattle increase mean productivity while wildlife reducevariability. Ecol Appl 27:143–155.
22. Eldridge DJ, Poore AGB, Ruiz-Colmenero M, Letnic M, Soliveres S (2016) Ecosystemstructure, function, and composition in rangelands are negatively affected by live-stock grazing. Ecol Appl 26:1273–1283.
23. Milchunas DG, Sala OE, Lauenroth W (1988) A generalized model of the effects ofgrazing by large herbivores on grassland community structure. Am Nat 132:87–106.
24. Zhu H, et al. (2012) The effects of large herbivore grazing on meadow steppe plantand insect diversity. J Appl Ecol 49:1075–1083.
25. van Klink R, van der Plas F, van Noordwijk CGE, WallisDeVries MF, Olff H (2015) Effects oflarge herbivores on grassland arthropod diversity. Biol Rev Camb Philos Soc 90:347–366.
26. Tilman D, Balzer C, Hill J, Befort BL (2011) Global food demand and the sustainableintensification of agriculture. Proc Natl Acad Sci USA 108:20260–20264.
27. Thébault E, Loreau M (2003) Food-web constraints on biodiversity-ecosystem func-tioning relationships. Proc Natl Acad Sci USA 100:14949–14954.
28. Connolly J, Nolan T (1976) Design and analysis of mixed grazing experiments. AnimSci 23:63–71.
29. Nolan T, Connolly J (1989) Mixed v. mono-grazing by steers and sheep. Anim Sci 48:519–533.30. Allan E, et al. (2014) Interannual variation in land-use intensity enhances grassland
multidiversity. Proc Natl Acad Sci USA 111:308–313.31. Liu J, et al. (2015) Impacts of grazing by different large herbivores in grassland de-
pend on plant species diversity. J Appl Ecol 52:1053–1062.
32. Ritchie ME, Olff H (1999) Herbivore diversity and plant dynamics: Compensatory vs.additive effects. Herbivores: Between Plants and Predators, eds Olff H, Brown VK,Dent R (Blackwell, Oxford), pp 175–204.
33. Wang D, Ba L (2008) Ecology of meadow steppe in northeast China. Rangeland J 30:247–254.
34. Manning P, et al. (2018) Redefining ecosystem multifunctionality. Nat Ecol Evol 2:427–436.
35. Belovsky GE, Slade JB (2000) Insect herbivory accelerates nutrient cycling and in-creases plant production. Proc Natl Acad Sci USA 97:14412–14417.
36. Schmitz OJ, Hambäck PA, Beckerman AP (2000) Trophic cascades in terrestrial systems:A review of the effects of carnivore removals on plants. Am Nat 155:141–153.
37. Bardgett RD, van der Putten WH (2014) Belowground biodiversity and ecosystemfunctioning. Nature 515:505–511.
38. Berger J (1978) Group size, foraging, and antipredator ploys: An analysis of bighornsheep decisions. Behav Ecol Sociobiol 4:91–99.
39. Haddad NM, et al. (2009) Plant species loss decreases arthropod diversity and shiftstrophic structure. Ecol Lett 12:1029–1039.
40. Cook-Patton SC, Agrawal AA (2014) Exotic plants contribute positively to biodiversityfunctions but reduce native seed production and arthropod richness. Ecology 95:1642–1650.
41. Evans EW, Rogers RA, Opfermann DJ (1983) Sampling grasshoppers (Orthoptera:Acrididae) on burned and unburned tallgrass prairie: Night trapping vs. sweeping.Environ Entomol 12:1449–1454.
42. Schaffers AP, Raemakers IP, Sýkora KV, Ter Braak CJ (2008) Arthropod assemblagesare best predicted by plant species composition. Ecology 89:782–794.
43. Dineen SM, Aranda R, 4th, Anders DL, Robertson JM (2010) An evaluation of com-mercial DNA extraction kits for the isolation of bacterial spore DNA from soil. J ApplMicrobiol 109:1886–1896.
44. Frank JA, et al. (2008) Critical evaluation of two primers commonly used for ampli-fication of bacterial 16S rRNA genes. Appl Environ Microbiol 74:2461–2470.
45. White TJ, Bruns T, Lee S, Taylor J (1990) Amplification and direct sequencing of fungalribosomal RNA genes for phylogenetics. PCR Protocols. A Guide to Methods andApplications, eds Innis MA, Gelfaud DH, Sninsky JJ, White TJ (Academic, New York),pp 315–322.
46. Hamady M, Walker JJ, Harris JK, Gold NJ, Knight R (2008) Error-correcting barcodedprimers for pyrosequencing hundreds of samples in multiplex. Nat Methods 5:235–237.
47. Edgar RC (2010) Search and clustering orders of magnitude faster than BLAST.Bioinformatics 26:2460–2461.
48. Handley KM, et al. (2013) Biostimulation induces syntrophic interactions that impactC, S and N cycling in a sediment microbial community. ISME J 7:800–816.
49. Barker KR (1985) Nematode extractions and bioassays. An Advanced Treatise onMeloidogyne, Methodology, eds Barker KR, Carter CC, Sasser JN (North CarolinaState University, Raleigh, North Carolina), Vol 2, pp 19–35.
50. Bongers AMT (1988) De Nematoden van Nederland (Pirola, Schoorl, The Netherlands).51. Nelson DW, Sommers LE (1975) A rapid and accurate method for estimating organic
carbon in soil. Proc Indiana Acad Sci 84:456–462.52. Gallaher RN, Weldon CO, Boswell FC (1976) A semiautomated procedure for total
nitrogen in plant and soil samples. Soil Sci Soc Am J 40:887–889.53. Sommers LE, Nelson DW (1972) Determination of total phosphorus in soils: A rapid
perchloric acid digestion procedure 1. Soil Sci Soc Am J 36:902–904.54. Liu C, et al. (2018) Towards a mechanistic understanding of the effect that different
species of large grazers have on grassland soil N availability. J Ecol 106:357–366.55. Nguyen NH, et al. (2015) FUNGuild: An open annotation tool for parsing fungal
community datasets by ecological guild. Fungal Ecol 20:241–248.56. Wagg C, Bender SF, Widmer F, van der Heijden MG (2014) Soil biodiversity and soil
community composition determine ecosystem multifunctionality. Proc Natl Acad SciUSA 111:5266–5270.
57. Byrnes JEK, et al. (2014) Investigating the relationship between biodiversity andecosystem multifunctionality: Challenges and solutions. Methods Ecol Evol 5:111–124.
58. Bradford MA, et al. (2014) Discontinuity in the responses of ecosystem processes andmultifunctionality to altered soil community composition. Proc Natl Acad Sci USA 111:14478–14483.
59. Breiman L (2001) Random forest. Mach Learn 45:5–32.
6192 | www.pnas.org/cgi/doi/10.1073/pnas.1807354116 Wang et al.
Dow
nloa
ded
by g
uest
on
Oct
ober
17,
202
1