Embed Size (px)
Citation preview
Diversification strategies
and adaptation deficit Evidence from rural communities
in Niger
ESA Working Paper No. 16-02
April 2016
Agricultural Development Economics Division
Food and Agriculture Organization of the United Nations
www.fao.org/economic/esa

Diversification strategies and adaptation deficit Evidence from rural communities in Niger
Solomon Asfaw, Alessandro Palma and Leslie Lipper
Food and Agriculture Organization of the United Nations Rome, 2016
Recommended citation FAO, 2016. Diversification Strategies and Adaptation Deficit: Evidence from Rural Communities in Niger, by Solomon Asfaw, Alessandro Palma and Leslie Lipper. ESA Working Paper No. 16-02. Rome, FAO.
The designations employed and the presentation of material in this information product do not imply the expression of any opinion whatsoever on the part of the Food and Agriculture Organization of the United Nations (FAO) concerning the legal or development status of any country, territory, city or area or of its authorities, or concerning the delimitation of its frontiers or boundaries. The mention of specific companies or products of manufacturers, whether or not these have been patented, does not imply that these have been endorsed or recommended by FAO in preference to others of a similar nature that are not mentioned.
The views expressed in this information product are those of the authors and do not necessarily reflect the views or policies of FAO.
© FAO, 2016
FAO encourages the use, reproduction and dissemination of material in this information product. Except where otherwise indicated, material may be copied, downloaded and printed for private study, research and teaching purposes, or for use in non-commercial products or services, provided that appropriate acknowledgement of FAO as the source and copyright holder is given and that FAO’s endorsement of users’ views, products or services is not implied in any way.
All requests for translation and adaptation rights, and for resale and other commercial use rights should be made via www.fao.org/contact-us/licence-request or addressed to [email protected].
FAO information products are available on the FAO website (www.fao.org/publications) and can be purchased through [email protected].
v
Diversification strategies and adaptation deficit: Evidence from rural communities in Niger
Solomon Asfaw*, Alessandro Palma** and Leslie Lipper*
**Food and Agriculture Organization (FAO) of the United Nations, Agricultural Development Economics Division,
Viale delle Terme di Caracalla, 00153 Rome (Italy). E-mail: [email protected] ** Università Commerciale Luigi Bocconi, Centre for Research on Energy and Environmental Economics
and Policy (IEFE). Via Roentgen 1, 20136 Milano (Italy)
Abstract
This paper provides fresh empirical evidence on the adaptation process to face climate changes through the analysis of original cross-sectional data collected at household-level in Niger. In particular, we identify the main drivers and barriers of crop and labour diversification, which constitute two livelihood strategies in mitigating the adaptation deficit. Secondly, the effectiveness of diversification practices is assessed by means of three complementary welfare measures, namely income changes, food security and the poverty gap. We find that, aside from climate shocks, the diversification level varies in response to the educational level of household members and spatial location as well as the adoption of information communication technologies. The impacts of diversification appear differentiated. While labour diversification is always positively associated with all the three welfare measures, positive coefficients of crop diversification are significant only when associated to food security. Robust causal inference confirms that anomalies in rainfall patterns and droughts in particular, induce adaptation responses, which result in welfare gains limited by a richer calorie intake, while the effects on income and severity of poverty appear detrimental.
Keywords: diversification, adaptation process, livelihood strategy, food security, climate change, Niger.
JEL codes: Q01, Q12, Q16, Q18
vi
Contents
List of figures ...................................................................................................................................................... vii List of tables ....................................................................................................................................................... viii 1. Introduction ..................................................................................................................................................... 92. Diversification as a livelihood strategy is sub-Saharan Africa ....................................................................... 10
2.1 Niger as a case study ......................................................................................................................... 12
3. Data and empirical strategy .......................................................................................................................... 143.1 Determinants of diversification ......................................................................................................... 15
3.2 Effects of diversification .................................................................................................................... 22
4. Results ........................................................................................................................................................... 244.1 Determinants of diversification ......................................................................................................... 24
4.2 Determinants of diversification ......................................................................................................... 28
4.3 Endogeneity ....................................................................................................................................... 30
4.4 Results with instrumental variables .................................................................................................. 30
5. Conclusions .................................................................................................................................................... 31References ......................................................................................................................................................... 33
Appendix ............................................................................................................................................................ 41
vii
List of figures
Figure 1 – Density functions on average precipitations in growing season, 1983-2000…………………………………13 Figure 2 – Density functions on average precipitations in growing season, 2001-2012…………………………………14 Figure 3 – Spatial distribution of precipitations in the growing season (May-September) over the period
1983-2012…………………………………………………………………………………………………………………..………………14 Figure 4 – Diversification degree (with Margalef index) vs. per-capita income……………………………………………..22 Figure 5 – Diversification degree (with Shannon-Weaver index) vs. per-capita income..………………………….…..22
viii
List of tables
Table 1 - Calculation of diversification indices and summary statistics………………………………………………………...17 Table 2 - Summary statistics and data sources……………………………………………………………………………………………..20 Table 3 - Drivers of diversification (Comparison across indices) - SUR estimations….……………………………………25 Table 4 - Effects of diversification (Shannon-Weaver index) on income, DES and SP…………………………………….27 Table 5 - Welfare effects of crop diversification on three different diversification indices (Shannon-Weaver, Margalef and Berger-Parker)………………………………………………………………………………………………………………………..30
9
1 Introduction
There is overwhelming consensus on the fact that global climate change is altering the variability of rainfall, temperature and other climatic parameters and that such modifications will likely lead to an increase in the incidence of environmental disasters (IPCC, 2007; IPCC, 2012; Olson et al., 2014; Parry et al., 2004; Kahn, 2005; Toya and Skidmore, 2007 among others). It has been estimated that up to 40 per cent of the world's land surface will develop novel climates (Williams et al., 2007), and that ‘’climate change, variability, and extreme events [will] make the poor even poorer’’ (Noble et al., 2014). And, the hypothesis that the consequences of extreme events and climate anomalies will affect poorer countries more powerfully compared to richer ones is also confirmed by World Bank (2013). Besides exogenous factors, such as geographical position and concentration of populations in hazard zones, the reason lies in the so-called 'adaptation deficit' (Yohe and Tol, 2002; Tol and Yohe, 2007; Brooks et al., 2005; Barr et al., 2010), a situation in which a country experiences a lack of institutional, economic and technological means to facilitate the adaptation process. The literature identifies a set of additional individual factors that can raise the vulnerability level, such as gender, age, health, social status, ethnicity, and class (Smit et al., 2001, Adger et al., 2009). It is thus clear that households and communities in the poorest countries, where many livelihoods, such as rainfed smallholder agriculture, seasonal employment, pastoralism, and tourism, are directly climate sensitive, have a weaker resilience capacity to climate change impacts and a reduced ability to deal with adaptation measures (Fankhauser and McDermott, 2014).
According to Pearce et al. (1996) and McCarthy (2001), sub-Saharan Africa (SSA) represents the major source of concern for future climate change impacts as a result of its strong dependence on subsistence agriculture (Mendelsohn and Dinar, 2009; Seo et al., 2009). The latter is affected both by weather changes and by long-run climate variability, which can severely reduce yields, undermining the availability of both food and feed (Challinor et al., 2010; IPCC, 2014) and increasing the vulnerability for the affected households. In the last decade adaptation processes for extreme weather events have often been found to be effective strategies for the most exposed communities (Adger et al., 2003; Kurukulasuriya and Mendelsohn, 2008), both at the national level and at the local level (Thornton et al., 2010). The experience with local adaptation processes have given rise to a flourishing empirical literature aimed at measuring the impact of these processes in developing countries exposed to climate risks (for a recent review, see Asfaw et al., 2015). However, the growing concerns for rapidly expanding population dynamics and the increasing risks due to climate variability call for additional evidence to inform policy makers and to provide effective livelihood options to the most vulnerable communities. Since climate variability interacts with non-climatic stressors (e.g. market volatility, deforestation, rapid urbanization or infectious diseases), context-specific conditions of marginalization develop multidimensional vulnerability and differential impacts. Thus, vulnerable communities living in rural areas characterized by low income and education levels, lack of technical knowledge as well as insufficient policy responses and safety nets, are those affected the most by the consequences of this interaction1.
Among the different contributions that have analysed the impact of climate change on adaptation strategies in SSA countries, Niger - one of the most vulnerable countries - has received surprisingly
1 Adaptation measures include, for instance, national government programs to re-create employment options after droughts, capacity building of local authorities, assistance to small subsistence farmers to increase crop production, building of shelter-belts and wind-breaks to improve resilience of rangelands, monitoring of the number of grazing animals and cut trees, and the set-up of revolving credit funds. See, for instance, the case of Botswana in FAO (2004) or Sudan in Osman-Elasha et al. (2006).
10
little attention. The country constitutes an interesting case for analysis, since it represents a critical area for climate variation and, at the same time, a highly vulnerable country in terms of potential capabilities to face climatic events and economic shocks (IPCC, 2014). Different factors can potentially make Nigerien communities particularly reluctant to implement effective adaptation measures, including low migration levels, widespread nomadism, extensive rain-fed subsistence agriculture, very low education rates and a lack of policy supports. Such elements constitute tangible and intangible barriers to adopt adaptation practices, generating adaptation lock-in which may lead to 'wait and see' or reactive approaches, low cognitive learning, misperception, and insufficient awareness of climate risks with inefficient individual response to face extreme events (Le Dang et al., 2014; Baird et al., 2014). In some cases, such barriers can also lead to competing behaviours of indigenous traditions versus modern and more effective adaptation strategies (Baird and Gray, 2014).
In light of this, our contribution to the existing literature is threefold. Firstly, our analysis uses a nationally representative household level survey with rich socio-economic information, merged with detailed geo-referenced climatic information. The combination of these data allows us to assess the role of weather in determining farmers' diversification decisions, and consequently, the impact on welfare. We explicitly consider the possibility of farmers' choosing a mix of diversification options using a seemingly unrelated regression (SUR) model, which accounts for potential interdependence among different diversification practices. The impact of the latter is estimated through different welfare indicators and conditioned to different levels of the welfare distribution by means of quantile regression. Secondly, we also estimate the causal impact of crop diversification on different measures of welfare using instrumental variables techniques (IV). Thirdly, given the limited evidence on the use and impact of diversification practices from the Sahel area at large, and from Niger in particular, largely attributed to the lack of reliable data from this country, our analysis adds great value in filling this gap in the existing literature, since, to the best of our knowledge, there are no studies that have looked at this issue in a rigorous manner.
The remainder of the paper is as follows. Section 2 introduces the theoretical and empirical contributions on diversification practices as a livelihood strategy in sub-Saharan countries and presents the case of Niger. In Section 3, we describe the dataset and the empirical strategy, while Section 4 presents the model results. Section 5 concludes the paper with some policy implications and further research issues.
2 Diversification as a livelihood strategy is sub-Saharan Africa
Given the high dependence on the agricultural sector and the influence of climate variability, SSA is expected to be one of the most vulnerable areas in the next decades. The reasons for such negative expectations are many. First, in the sub-Saharan region, agriculture represents the main economic activity in terms of employment and 98 per cent of agriculture exploits rain-fed lands (Wani et al., 2009). Stagnant agricultural yields and high population growth have led to a fall in per-capita food availability since the 1970s, although this was reversed due to an improved performance of the agricultural sector during 2000-2010 period (Nin-Pratt et al., 2012). However, recent increases in global food prices and climate variability have aggravated food insecurity, with consequent risks of malnutrition (MDGAfrica Steering Group, 2008). In addition, SSA is expected to be strongly affected by climate changes: future projections based on observed climate trends indicate that temperatures in SSA are consistently projected to rise faster than the global average increase during the 21st century (Christensen et al., 2007; Joshi et al., 2011; Sanderson et al., 2011; James and Washington,
11
2013). Although most areas of the African continent lack sufficient observational data to draw conclusions about trends in annual precipitation, rainfall patterns are also expected to change. In particular, rains in SSA experienced an overall reduction over the course of the 20th century, especially over the Sahel region2, and such a trend is expected to continue in coming years (Niang et al., 2014). With particular regard to agriculture, recent evidence suggests that climate change will affect both biotic (pest, pathogens) and abiotic (solar radiation, water, temperature) factors in crop systems, with an increasing threat for crop sustainability and production. Hence, the development of resilient agricultural systems represents an important asset for sub-Saharan regions (Niang et al., 2014).
Several studies have investigated the effects of adaptation strategies in order to stabilize the livelihoods of rural communities. Among these, diversification emerges as an effective strategy to mitigate the impact of extreme events and climate variability and to deal with uncertain agricultural production while maintaining ecosystem functions and income benefits for smallholder farming communities (Newsham and Thomas, 2009; Ellis, 1998; 2004; Ersado, 2003; Babatunde and Qaim, 2009; Asmah, 2011). In this respect, the contributions of empirical literature identify a variety of diversification drivers and describe a number of examples of diversification practices. Some studies tend to interpret the diversification process as a deliberate strategy aimed at producing income gains by enriching the portfolio of economic activities (Ellis, 1999). In the case of sub-Saharan Africa, this argument is supported by the increased shares of rural household’s income from non-farm activities (Ellis, 2009; Barrett et al., 2001; Davis et al., 2010; Dixon et al., 2001). In the case of labour, households with larger initial endowments, more educated members and shorter distances from main markets, are more likely to allocate the labour force into different sectors and seasons with the aim of benefiting from non-agricultural incomes, thus offsetting eventual low returns in traditional core activities (Barrett et al., 2001; Block and Webb, 2001). In addition, agricultural diversification to cash crops can produce productivity gains and allow farmers to move from subsistence agriculture to trade-based agriculture with net income and welfare gains (Pingali and Rosengrant, 1995; Bandyopadhyay and Skoufias, 2013; Di Falco and Chavas, 2009). On the other hand, diversification can also take place as a deliberate ex-ante strategy, as well as an involuntary response to climate extreme events and other shocks (i.e., crop disease, unexpected price increase etc.). Such a response also depends on the household characteristics that determine the perception and awareness of involuntary anomalies (Barrett et al., 2001; Ellis, 2004; Reardon et al., 2006). In this framework, diversification acts as a safety-net able to provide effective livelihood responses to extreme events, in particular for the poorest households (Reardon and Taylor, 1996; Reardon and Vosti, 1995).
While there is empirical consensus on the fact that urban households or households living close to densely populated areas are more prone to adopt labour and income diversification strategies (Newman and Canagarajah, 2000; Barrett et al., 2001; Canagarajah et al., 2001; Lanjouw, 2001; Babatunde and Qaim, 2009; Dimova and Sen, 2010; Asmah, 2011), rural households, who represent the most vulnerable, are only marginally investigated. With specific regard to Niger, considering the scarce empirical evidence existing in the literature and the high vulnerability of the country, the present study sheds light on the determinants of diversification practices and their impacts in
2 The occurrence of a large number of droughts in the Sahel during the 1970s and 1980s is well documented (Biasutti and Giannini, 2006; Biasutti et al., 2008; Greene et al., 2009). The pattern of rainfall over the past 20 years may be due to natural variability (Mohino et al., 2011), a response to increased greenhouse gases (Haarsma et al., 2005; Biasutti, 2013), or due to reduced aerosols (Ackerley et al., 2011).
12
Nigerien rural communities, with particular emphasis on the role of climate anomalies as a factor influencing households’ diversification behaviour.
2.1 Niger as a case study Niger is a SSA country, divided into eight main administrative regions3. Four-fifths of Nigerien northern territory is desert, while the southern area is savannah, suitable for livestock and limited agriculture. The social pattern is characterized by a variety of ethnicities, with a prevalence of Haoussa, Djerma Sonrai and Tuareg. At the political level, Niger is facing increased security concerns from various threats including insecurity in Libya, spillover from the conflict in Mali, and violent extremism in north-eastern Nigeria (CIA, 2015). Demographic dynamics is governed by one of the highest birth rates in the world (4.6 per cent), with a median age of population of 15.1 years (CIA, 2015). At the present pace, in the next fifteen years Niger's population is expected to double. Considering that Niger is a landlocked country that depends on agricultural, agro-pastoral, and pastoral livelihoods (agriculture and livestock production represents 45 per cent of Niger's GDP, involving more than 80 per cent of the population (FAO, 2015)), the rapid population expansion will likely affect the natural resources available given the increasing food needs. Some concerns date back to the 1990-2000 period, in which farmland increased by 20 per cent whereas the population increased by more than 40 per cent, resulting in a net decrease in food availability (FAO, 2015). The geographical context is mainly responsible for this negative performance, as only 15 per cent of Niger's land is arable and located in a region mainly along its southern border with Nigeria. Millet, sorghum, and cowpea constitute the principal rainfed subsistence crops and the principal sources of energy for the rural population.
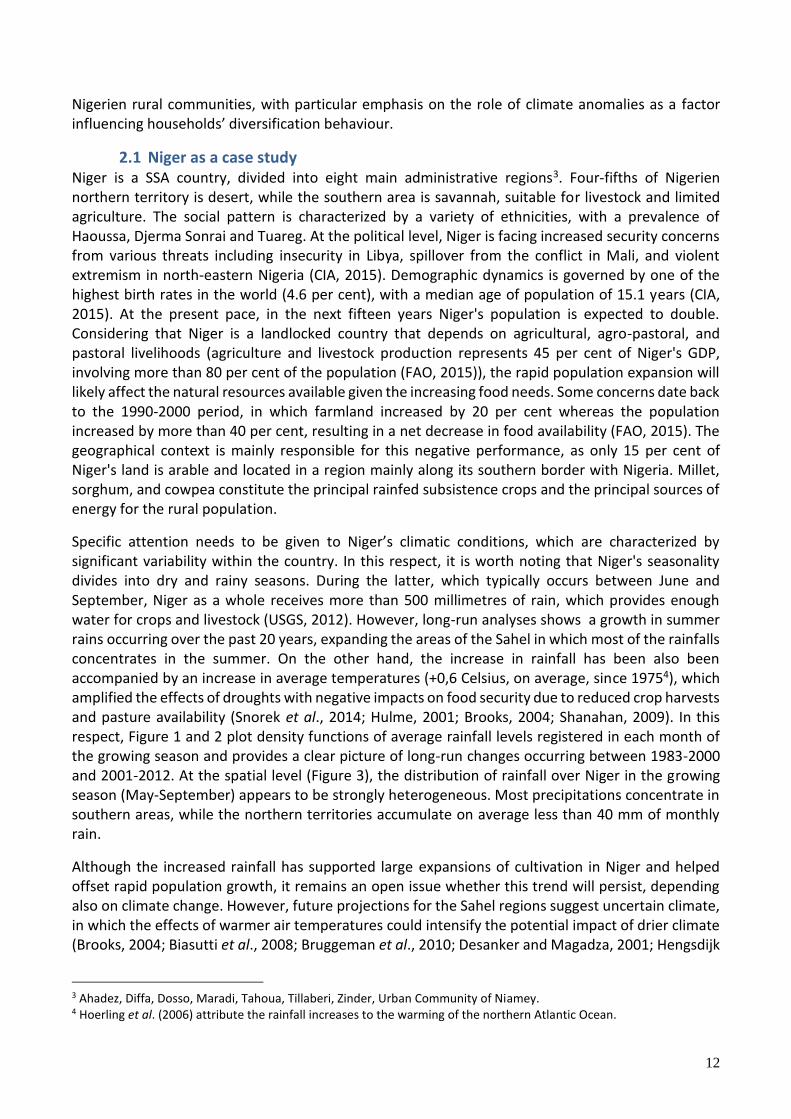
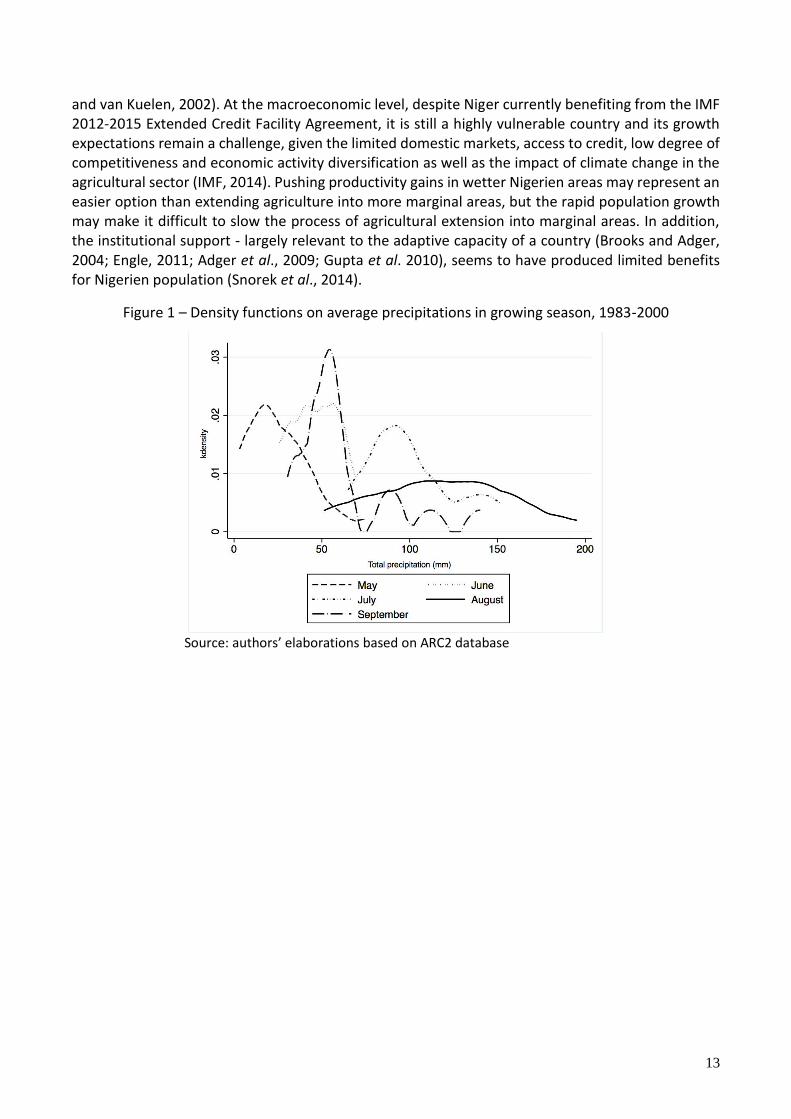
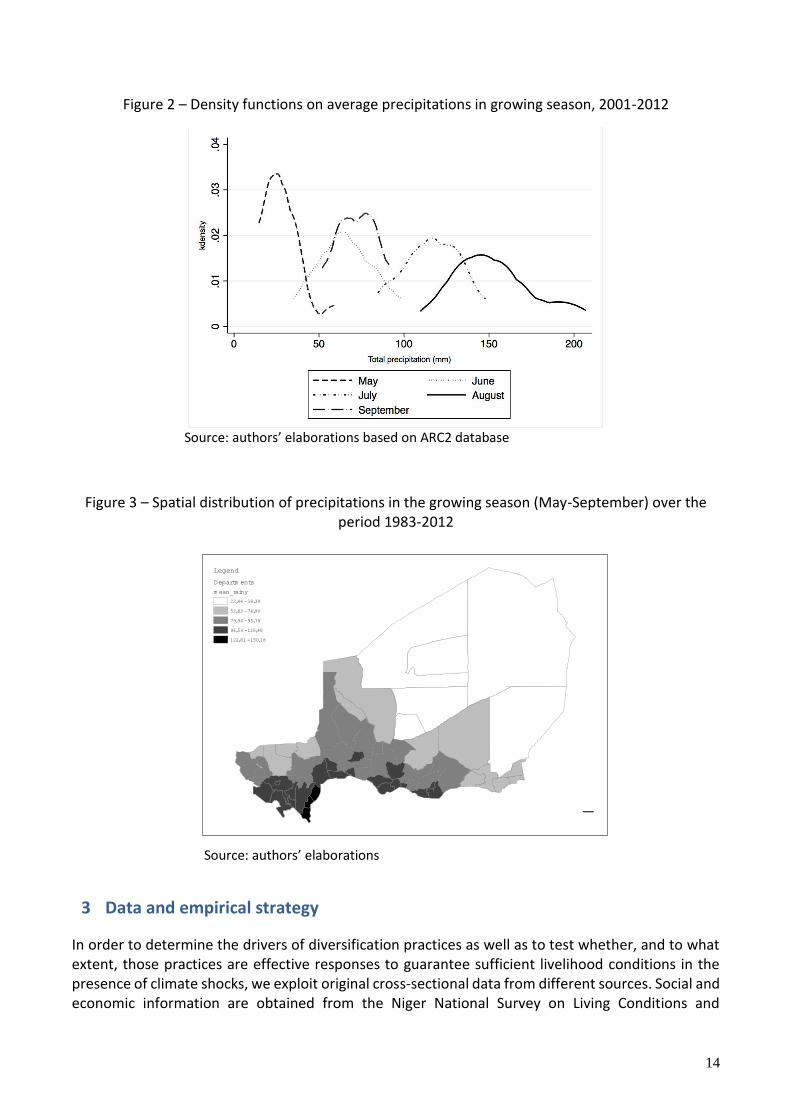
Specific attention needs to be given to Niger’s climatic conditions, which are characterized by significant variability within the country. In this respect, it is worth noting that Niger's seasonality divides into dry and rainy seasons. During the latter, which typically occurs between June and September, Niger as a whole receives more than 500 millimetres of rain, which provides enough water for crops and livestock (USGS, 2012). However, long-run analyses shows a growth in summer rains occurring over the past 20 years, expanding the areas of the Sahel in which most of the rainfalls concentrates in the summer. On the other hand, the increase in rainfall has been also been accompanied by an increase in average temperatures (+0,6 Celsius, on average, since 19754), which amplified the effects of droughts with negative impacts on food security due to reduced crop harvests and pasture availability (Snorek et al., 2014; Hulme, 2001; Brooks, 2004; Shanahan, 2009). In this respect, Figure 1 and 2 plot density functions of average rainfall levels registered in each month of the growing season and provides a clear picture of long-run changes occurring between 1983-2000 and 2001-2012. At the spatial level (Figure 3), the distribution of rainfall over Niger in the growing season (May-September) appears to be strongly heterogeneous. Most precipitations concentrate in southern areas, while the northern territories accumulate on average less than 40 mm of monthly rain.
Although the increased rainfall has supported large expansions of cultivation in Niger and helped offset rapid population growth, it remains an open issue whether this trend will persist, depending also on climate change. However, future projections for the Sahel regions suggest uncertain climate, in which the effects of warmer air temperatures could intensify the potential impact of drier climate (Brooks, 2004; Biasutti et al., 2008; Bruggeman et al., 2010; Desanker and Magadza, 2001; Hengsdijk
3 Ahadez, Diffa, Dosso, Maradi, Tahoua, Tillaberi, Zinder, Urban Community of Niamey. 4 Hoerling et al. (2006) attribute the rainfall increases to the warming of the northern Atlantic Ocean.
13
and van Kuelen, 2002). At the macroeconomic level, despite Niger currently benefiting from the IMF 2012-2015 Extended Credit Facility Agreement, it is still a highly vulnerable country and its growth expectations remain a challenge, given the limited domestic markets, access to credit, low degree of competitiveness and economic activity diversification as well as the impact of climate change in the agricultural sector (IMF, 2014). Pushing productivity gains in wetter Nigerien areas may represent an easier option than extending agriculture into more marginal areas, but the rapid population growth may make it difficult to slow the process of agricultural extension into marginal areas. In addition, the institutional support - largely relevant to the adaptive capacity of a country (Brooks and Adger, 2004; Engle, 2011; Adger et al., 2009; Gupta et al. 2010), seems to have produced limited benefits for Nigerien population (Snorek et al., 2014).
Figure 1 – Density functions on average precipitations in growing season, 1983-2000
Source: authors’ elaborations based on ARC2 database
14
Figure 2 – Density functions on average precipitations in growing season, 2001-2012
Source: authors’ elaborations based on ARC2 database
Figure 3 – Spatial distribution of precipitations in the growing season (May-September) over the period 1983-2012
Source: authors’ elaborations
3 Data and empirical strategy
In order to determine the drivers of diversification practices as well as to test whether, and to what extent, those practices are effective responses to guarantee sufficient livelihood conditions in the presence of climate shocks, we exploit original cross-sectional data from different sources. Social and economic information are obtained from the Niger National Survey on Living Conditions and
–
Legend
Departm ents
m ean_rainy
22,44 - 38,39
52,83 - 76,90
79,94 - 95,79
96,53 - 116,46
122,81 - 150,18
15
Agriculture 2011 (ECVM/A, 2011)5, an integrated multi-topic household survey which provides rich information to evaluate poverty and living conditions in Niger. The survey was implemented by the Niger National Institute of Statistics with technical and financial assistance from the World Bank. The ECVM/A envisages two visits, the first one during the planting season, and the second one during the harvest season. A total of 25,116 individuals grouped in 3,968 households, with information from either the first or second visit or both visits, characterized the final dataset. The household and agriculture/livestock questionnaires, as well as the community/price questionnaire, are administered during the first visit, while during the second visit, only the household and agriculture/livestock questionnaires are administered. The ECVM/A has been designed to have national coverage, including both urban and rural areas all the regions of the country, with a fine spatial breakdown (270 enumerator areas divided by urban areas, rural areas, and within the rural areas, agricultural zones, agro-pastoral zones and pastoral zones). We combine this valuable socio-economic dataset with detailed information on precipitation collected at enumerator area level, every ten days (decadal), from 1983 to 2012. Weather data derive from the Africa Rainfall Climatology Version 2 (ARC2) database and cover the 1983-2012 period6. Given the specific focus of this paper on the diversification practices as a possible livelihood strategy for the most vulnerable communities, the final dataset only includes 2396 rural Nigerien households, observed in 2011 and distributed across 139 enumerator areas7 and eight administrative regions. In testing the drivers of diversification and their effect on household welfare, we apply a sequential empirical procedure. The first step aims at determining the most important diversification drivers (Section 3.1), with a stronger emphasis on climate factors. Once such drivers are identified, in the second step we estimate the impact of diversification on a set of three welfare measure conditioned to different levels of welfare of rural Nigerien households (Section 3.2). In addition, we also address potential endogeneity deriving from the reverse causality of crop diversification and welfare conditions by estimating a similar model through instrumental variable techniques (Section 4.3).
3.1 Determinants of diversification Our econometric modelling of the determinants of diversification takes into account a series of issues. First, given that the diversification strategies result in a variety of practices affecting different income sources, we first distinguish between diversification in crop species and labour diversification. However, despite excluding income diversification and focusing the analysis on rural households, the two diversifications considered can still be linked in some cases8. For instance, once the degree of agricultural diversification is saturated, numerous households can enlarge their portfolio of activities and adopt labour diversification practices by inducing more educated members to move toward off-farm jobs. In addition, it is likely that the ownership of more expensive mechanical assets may result in agricultural intensification practices and a reduced level of crop diversification (Narloch et al., 2011). At the same time, higher degrees of education and technical knowledge in some family
5 Enquéte National sur les Conditions de Vie des Ménages et Agriculture. 6 The ARC2, an improved version of the ARC1, combines inputs from two sources: i) 3-hourly geostationary infrared (IR) data centred over Africa from the European Organisation for the Exploitation of Meteorological Satellites (EUMETSAT) and ii) quality controlled Global Telecommunication System (GTS) gauge observations reporting 24-h rainfall accumulations over Africa. For further details, see Novella and Thiaw (2013). 7 More than 40% per cent of the sample lies in desert regions. 8 Livestock activities are included in labour diversification. We intentionally do not consider income diversification in our analysis since this implies the availability of relevant capital stocks in heterogeneous activities, a situation unlikely to be found in rural households. However, even when income diversification takes place from capital accumulation due to other activities, such as agriculture or services or from the diversification of these households, how this extra income is allocated represents a subsequent process with respect to the strict livelihood need.
16
members may imply job specialization or, alternatively, may increase the household's competence level in order to obtain effective diversification strategies in the agricultural sector. Thus, when investigating the drivers of diversification, it is important to take into account both specific and common factors which can affect at the same time and in different directions the two types of diversification, depending on the degree of their complementarity or substitutability.
In terms of econometric modelling, separate estimations would not capture this correlation and would not exploit the information deriving from the entire set of common regressors. In order to address the previous issues, for the analysis of diversification determinants we employ a Seemingly-Unrelated Regression model (SUR) (Zellner, 1962; Zellner, 1963). In particular, the iterative two-stage generalized least square estimator allows the SUR model to provide efficient estimations by combining information on different equations and accounts for potential correlation in the error terms. According to the theoretical framework previously discussed and considering the data limitations, we specify a two-equation SUR model, in which the dependent variables measuring the degree of diversification are regressed over a set of common predictors, while the error terms are assumed to be correlated. More formally, for each 𝑖=1,..,𝑁 household, the two-equation model in compact notation is given by:
𝑫𝑖,𝑗 = 𝜷0 +𝚿𝑖,𝑗𝛽𝑖 + 𝜺𝑖,𝑗
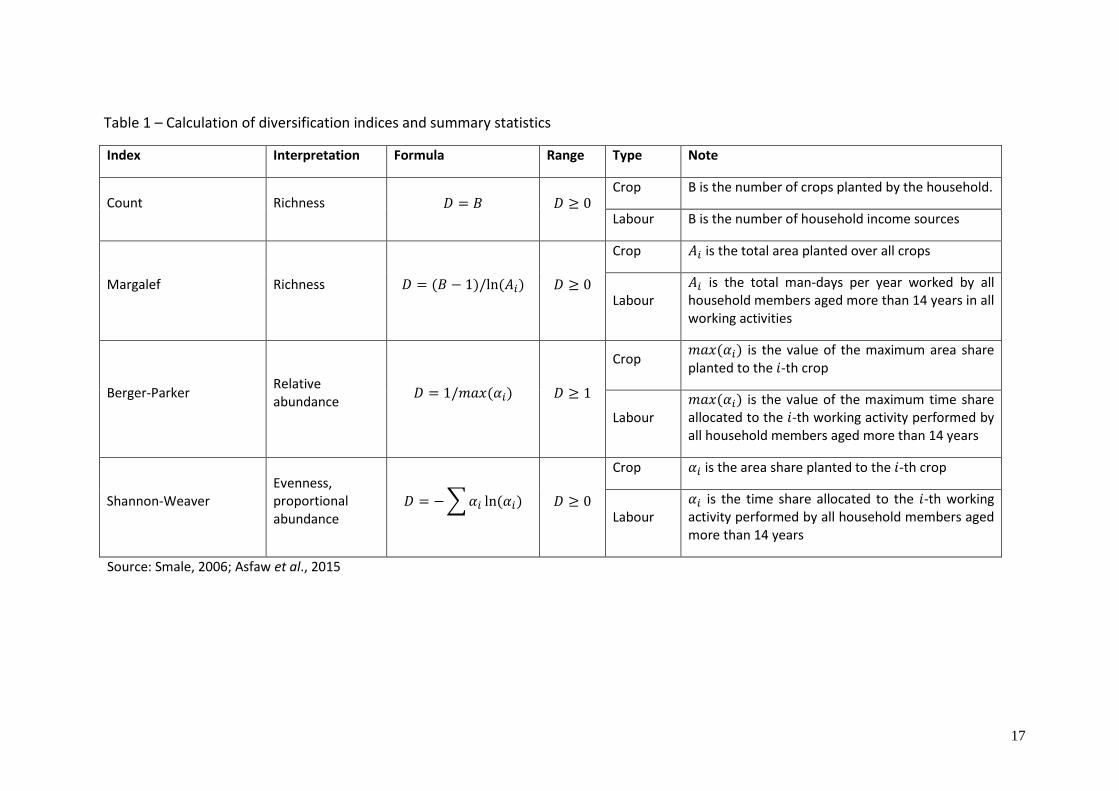
where 𝑁=2396 and 𝑗=1,2 indexes, respectively, the equation for crop and labour diversification. The errors 𝜺 are assumed to be correlated within individuals and uncorrelated across individuals, with the overall variance-covariance matrix given by Ω = 𝐸(휀휀′) = ∑⊗ 𝐼𝑁. The vector of dependent variable 𝑫 measures the degree of diversification, whose metrics deserves some explanation. A common method for assessing the degree of diversification is the calculation of a vector of income shares related to different income sources (Lay et al., 2008 and Davis et al., 2010 among others). While this approach puts diversification and income changes directly into the relationship, a relevant part of information related to different aspects of diversification is neglected. Other studies rely on a multidimensional perspective by employing a set of different statistical indices, which allow for a multidimensional analysis of diversification behaviour (Asfaw et al., 2015; Barrett and Reardon, 2000). Accordingly, our first diversification measure is the Shannon-Weaver index as suggested by Duelli and Obrist (2003). In addition, robust directions on the impacts of diversification determinants are derived by testing in our model the Margalef index (measuring the simple richness) and the Berger-Parker index (measuring the relative abundance). For agricultural diversification, the indices consider the number of cultivated crop species adjusted by land size at plot level, and for labour diversification, we calculated the number of different work activities by distinguishing from 11 different jobs, divided by skilled and unskilled workers9 aged between 14 and 65 and resulting in 22 labour differentiations. Table 1 provides information on the indices calculation and their interpretation.
9 We assume that household members can choose between investing in skilled or unskilled activities.
17
Table 1 – Calculation of diversification indices and summary statistics
Index Interpretation Formula Range Type Note
Count Richness 𝐷 = 𝐵 𝐷 ≥ 0 Crop B is the number of crops planted by the household.
Labour B is the number of household income sources
Margalef Richness 𝐷 = (𝐵 − 1)/ln(𝐴𝑖) 𝐷 ≥ 0
Crop 𝐴𝑖 is the total area planted over all crops
Labour 𝐴𝑖 is the total man-days per year worked by all household members aged more than 14 years in all working activities
Berger-Parker Relative abundance
𝐷 = 1/𝑚𝑎𝑥(𝛼𝑖) 𝐷 ≥ 1
Crop 𝑚𝑎𝑥(𝛼𝑖) is the value of the maximum area share planted to the 𝑖-th crop
Labour 𝑚𝑎𝑥(𝛼𝑖) is the value of the maximum time share allocated to the 𝑖-th working activity performed by all household members aged more than 14 years
Shannon-Weaver Evenness, proportional abundance
𝐷 = −∑𝛼𝑖 ln(𝛼𝑖) 𝐷 ≥ 0
Crop 𝛼𝑖 is the area share planted to the 𝑖-th crop
Labour 𝛼𝑖 is the time share allocated to the 𝑖-th working activity performed by all household members aged more than 14 years
Source: Smale, 2006; Asfaw et al., 2015
18
The set of independent variables, common to the two equations and represented by the vector 𝚿 include:
- Climate shocks: our data allows us to map long-run weather anomalies in order to identify climate shocks in the single period of interest, i.e. 2011, with finer spatial and temporal breakdown than in previous studies (Ersado, 2003; Nhemachena and Hassan, 2007; Dimova and Sen, 2010). In order to identify long-run climate anomalies based on the available data, we rely on the Standard Precipitation Index (SPI). The SPI is a widely used indicator1, which allows detection of significant variations in precipitations with respect to the long-run mean. For this purpose, raw precipitation data are fitted to a gamma or Pearson Type III distribution, which is then transformed to a normal distribution (see Guttman, 1999 for further details). The use of the SPI presents some advantages over other methods. First, in order to identify climate anomalies such as drought or excessive rainfalls, only time-series data on precipitation are required. Moreover, the SPI is an index based on the probability of recording a given amount of precipitation. Since the probabilities are standardized, a value of zero indicates the median precipitation amount (half of the historical precipitation amounts are below the median, and half are above the median), thus the index is negative for drought, and positive for wet conditions. As the dry or wet conditions become more severe, the index becomes more negative or positive, ranging within a commonly-used scale from -2.5 and +2.5 (WMO, 2012). This standardization provides a straightforward interpretation and allows for a fully indexed comparison over time and space. In addition, the SPI can be computed for several time scales, ranging from one to 24 months, capturing various scales of both short-term and long-term anomalies. In order to compute our climate shock variables, we first calculate the SPI at 12 months for the reference year 20112. Once the long-run climate anomalies are detected by using the interpretation table provided in WMO (2012), we identify drought and rainfall shocks with dummy variables corresponding to SPI values ranging from less than -2 to more than +2, respectively. Thus, a SPI value of -2.0 or less signals a drought shock while values of +2.0 or more indicates extremely wet conditions3.
- Spatial position, access to markets and infrastructures: there is robust empirical evidence which suggests that urban proximity and good infrastructures favour the market access and facilitate the diversification process (Escobal, 2001; Lanjouw et al., 2001; Fafchamps and Shilpi, 2003, 2005; Deichmann et al., 2008; Babatunde and Qaim, 2009; Davis et al., 2010; Losch et al. 2011). To account for access to main infrastructures, our dataset is augmented with information on the road density within a radius of 15 km and with the average distance to main infrastructures calculated as the simple mean of the distance from the household and the nearest postal office, bank and hospital4 as a proxy of market and credit access. Moreover, given the particular geographical distribution of Niger, a dummy indicating whether the household lives in regions belonging to the desert area is also
1 The SPI was recommended through the Lincoln Declaration on Drought as the internationally preferred index for meteorological drought (see Hayes et al., 2011). 2 The SPI calculated at 12 months captures long-term precipitation patterns. This can be interpreted as a comparison of the precipitation for 12 consecutive months with the one recorded in the same 12 consecutive months in all previous years of available data (the number of standard deviations by which the observed anomaly deviates from the long-term mean). A limitation of the SPI is that it does not account for evapotranspiration, limiting its ability to capture the effect of increased temperatures (associated with climate change) on moisture demand and availability. 3 In order to capture the specific impact of long-run weather anomalies on the rural households, the SPI is calculated by including only the months falling in the growing season (i.e. from May to September). 4 Such an approximation is necessary, as the dataset does not contain distance information on the nearest market.
19
included. This may signal the presence of nomadism and pastoralism, which characterize the poorest and most vulnerable sectors of Nigerien population.
- Technology, knowledge and education level: Technology endowment, ICTs in particular, represent important assets to diversification strategies. Mobile ICT devices and the Internet have had a rapid diffusion, accelerating the pace at which the information is produced and shared among individuals. ICTs provide opportunities for top-down dissemination of precious pieces of knowledge such as weather forecasts, hazard warnings, market information, job opportunities and advisory services (Noble et al., 2014). However, particularly in rural communities, behavioural and social barriers can impede the acquisition of knowledge, resulting in low educational levels, climate change misperceptions, `wait and see' strategies as well as the conservation of inefficient indigenous practices. In this respect, given the relevant role of mediating perceptual factors in deciding the adaptation process in individuals subject to climate shocks (Hisali et al., 2011, Rogers, 1975, 1983), ICT devices allow for a better understanding of the environment as well as higher awareness levels of climate risks. Early studies found a positive correlation between higher education levels and income gains deriving from diversification activities (Quisumbing, 1995; Reardon, 1997; Ellis, 1999 among others) and this evidence is also confirmed in more recent analyses focusing on SSA countries (Abdulaia and CroleRees, 2001; Barrett, Reardon and Webb, 2001). In light of this, we include the average household educational level over all the family members and, as a proxy of knowledge absorption capacity, we include the level of technology endowment by calculating the count of ICT assets as the total number of mobile phones, TVs, radios, cameras, video cameras and computers owned by each household.
- Gender and behavioural issues: The empirical literature does not provide clear-cut information on heterogeneous diversification behaviours when considering gender differentiations (Whitehead and Kabeer, 2001). Some authors point out that income inequality can clearly play a negative role when women decide to adopt diversification practices, as this may imply less money to be invested in order to cover start-up costs (Reardon, 1997) and lower bargaining power in the case of labour diversification (Evans, 1992). Further differences in diversification behaviour can derive from inequalities in education and skills (Collier et al., 1986; Glick and Sahn, 1997), although these studies do not focus on sub-Saharan territories where women often offer their work within their family as unpaid activity (Whitehead and Kabeer, 2001). Such evidence suggests to control for gender differences, which is here addressed by including a dummy variable which equals 1 when the household heads are female (Bezabih, 2008).
- Household endowments: Household endowments also represent important diversification drivers (Benin et al., 2004 among others). The presence of an abundant livestock endowment can generate a variety of different activities that are in competition with mere crop cultivation (e.g. dairy and butchery) and that often coexist in the farm sector. We take into consideration this mechanism by calculating and including the Tropical Livestock Unit (TLU) as a measure of resource constraints (Teklewold et al., 2013; Shiferaw et al., 2013). Given that our diversification measures allow one to capture such differentiations, we expect a negative influence from higher values of TLU on crop diversification, while on labour diversification the impact is expected to be positive in consequence of the different activities that farmers can exploit having rich livestock stocks. Besides these factors, we also consider a set of covariates that test the role of agricultural intensification and vulnerability (Drucker and Rodriguez, 2007). The intensification, in a broad sense, should enhance the ability of farmers to sustain modern agricultural practices instead of relying on a pure risk minimization strategy. This strategy is implemented by marginalized and risk-adverse households that, by enlarging
20
their crop portfolio, can minimize the adverse impact of unexpected agro-climatic shocks and existing market constraints (Di Falco et al., 2011). The role of intensification and vulnerability is tested by including the following endowment variables: the effect of non-technological agricultural and technological assets that are, respectively, indicators of traditional and intensive agriculture (Omer et al., 2007); the extension of irrigated land that is a basic asset for the adoption of modern agricultural technologies (Carter and Barrett, 2006) as well as extension of rainfed land, which characterizes the northern Nigerien territory where intensification is not likely to take place.
Other factors included inside 𝚿 are: - a dummy equal to one for the presence of shocks due to crop diseases, as declared in the questionnaire, which is demonstrated to motivate households at diversifying their production, especially for those that are subsistence-based (Di Falco and Chavas, 2009);
- a dummy variable equal to one which signals the presence of market shocks due to high input prices that, by preventing farmers from enhancing the level of intensification, enlarge their `distance' from market and incentivize diversification (Ellis, 1998); - adoption of modern varieties (MVs) that perform equally well under extreme climate conditions and that can enhance farmers' flexibility in the adaptation process. Accordingly, our model includes a dummy variable, which signals whether or not households adopt MVs. However, MVs are often associated to intensification processes characterized by large land endowments (Pascual and Perrings, 2007; Kundulu et al., 2012; Coromaldi et al., 2015). Hence, the adoption of MVs can be both complementary (if coupled, in additional land, with traditional crop species) or in the substitution of traditional crops, the impact of this variable is expected to be not univocal. In order to disentangle the trade-off between intensification and the degree of crop varieties, we introduce an interaction term including the amount of cultivated land and a dummy variable indicating the adoption of MVs with the hypothesis that a larger land endowment, coupled with MV adoption, limit the options for crop diversification in favour of intensification practices (Pascual and Perrings, 2007; Kandulu et al., 2012).
21
Table 2 – Summary statistics and data sources
Variable mean min max N
Total household income in USD 1793.43 0 18607.4 2396
Niger National Survey on Living Conditions and Agriculture 2011 (ECVM/A, 2011)
Dietary Energy Supply (DES) 2637.55 307.26 5399.63 2396
Severity of Poverty Index (SP) 0.13 0 0.72 2396
Crop diversification (Shannon) 1.70 1 7.17 2396
Crop diversification (Margalef) 0.14 0 0.64 2396
Crop diversification (Berger-Parker) 2.05 1 6.30 2396
Labour diversification (Shannon) 1.24 1 3.95 2396
Labour diversification (Margalef) 0.41 0 3.09 2395 Labour diversification (Berger-Parker) 1.15 1 3.19 2396
Education level (years) 2.93 0 19 2396
Age of household age 44.59 17 95 2396 Household with female head (dummy=1) 0.11 0 1 2396
Household size 6.36 1 30 2396
Distance to main facilities (km) 30.88 0.42 129.28 2396
Road density (within a 15 km radius) 66.04 0 146.92 2396
Desert region (dummy=1) 0.43 0 1 2396
Tropical Livestock Unit (TLU) 1.97 0 80 2396
N° of durable technology assets 0.94 0 9 2396
N° of durable non-technology assets 3.33 0 22 2396 N° of agricultural non-technology assets 0.04 0 4 2396
N° of agricultural technology assets 6.80 0 25 2396
Irrigated cultivated land (ha) 0.09 0 6.5 2396
Rainfed land (ha) 3.36 0 23 2396
Crop disease shock (dummy=1) 0.12 0 1 2396
Input prices shock (dummy=1) 0.05 0 1 2396
Adoption of MV (dummy=1) 0.12 0 1 2396
MV interacted with cultivated land 0.59 0 21 2396
SPI (≤2) (dummy=1) 0.02 0 1 2396 ARC 2
SPI (≥2) (dummy=1) 0.15 0 1 2396
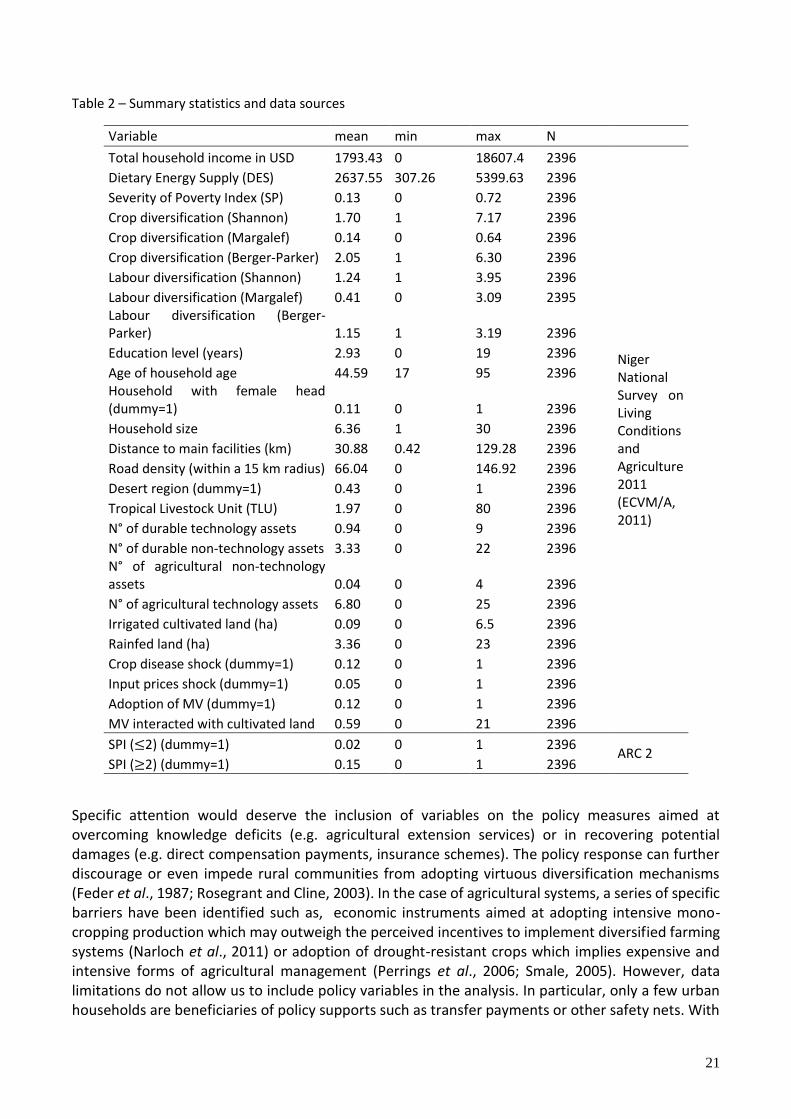
Specific attention would deserve the inclusion of variables on the policy measures aimed at overcoming knowledge deficits (e.g. agricultural extension services) or in recovering potential damages (e.g. direct compensation payments, insurance schemes). The policy response can further discourage or even impede rural communities from adopting virtuous diversification mechanisms (Feder et al., 1987; Rosegrant and Cline, 2003). In the case of agricultural systems, a series of specific barriers have been identified such as, economic instruments aimed at adopting intensive mono-cropping production which may outweigh the perceived incentives to implement diversified farming systems (Narloch et al., 2011) or adoption of drought-resistant crops which implies expensive and intensive forms of agricultural management (Perrings et al., 2006; Smale, 2005). However, data limitations do not allow us to include policy variables in the analysis. In particular, only a few urban households are beneficiaries of policy supports such as transfer payments or other safety nets. With
22
respect to the agricultural extension services, the share of rural households involved is less than one per cent, thus making insignificant the statistical analysis of potential benefits from existing extension services. Summary statistics of explanatory and outcome variables are reported in Table 2.
3.2 Effects of diversification Our multidimensional picture of households' welfare relies on a set of three indicators, which capture different aspects and issues to take into account when the analysis of wellbeing is under scrutiny. Namely, our dependent variables consider the total household income expressed in US dollars as a basic measure of welfare. In addition, the Dietary Energy Supply (DES) expressed in per-capita calories per day, as well as the Severity of Poverty (SP) calculated as the squared of the poverty gap index5, also provides information on food security and inequality among the poor, respectively.
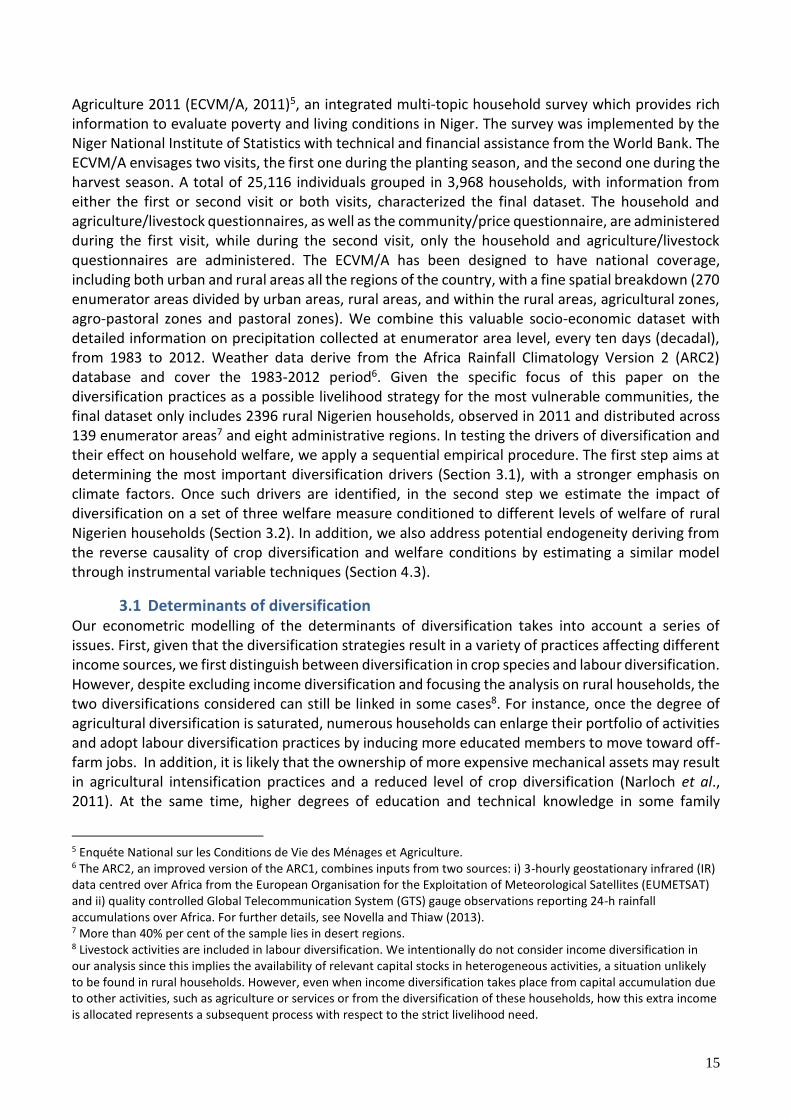
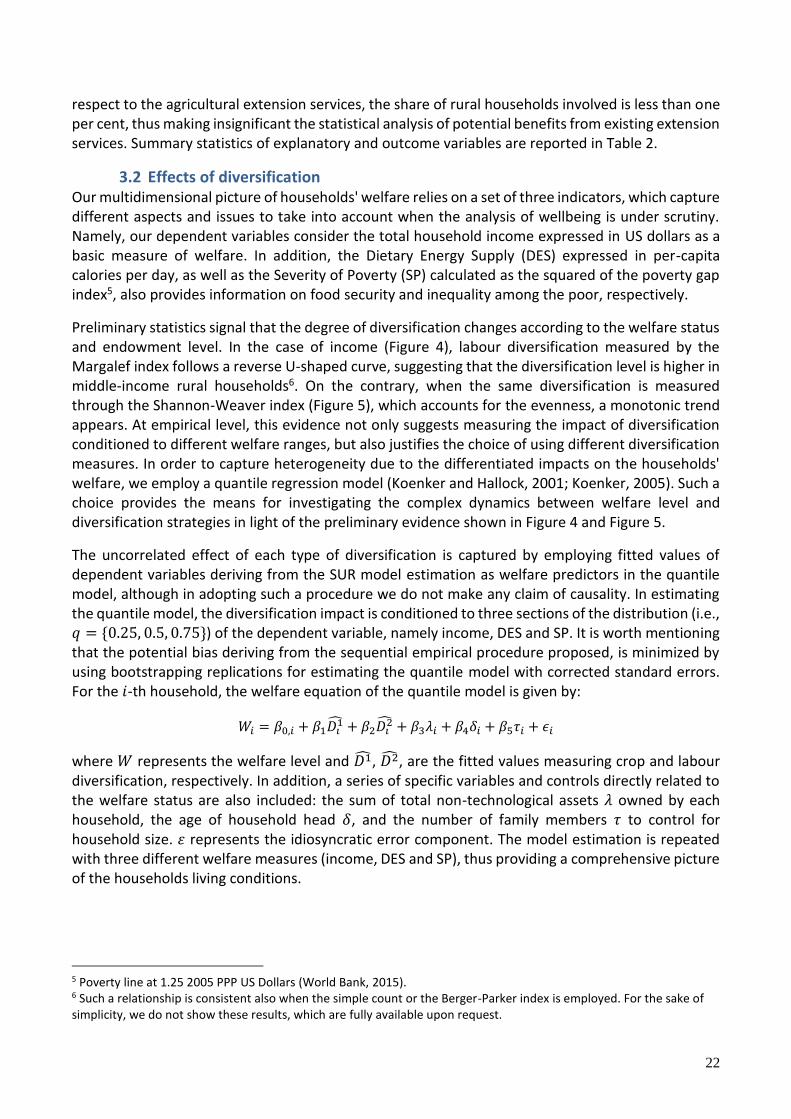
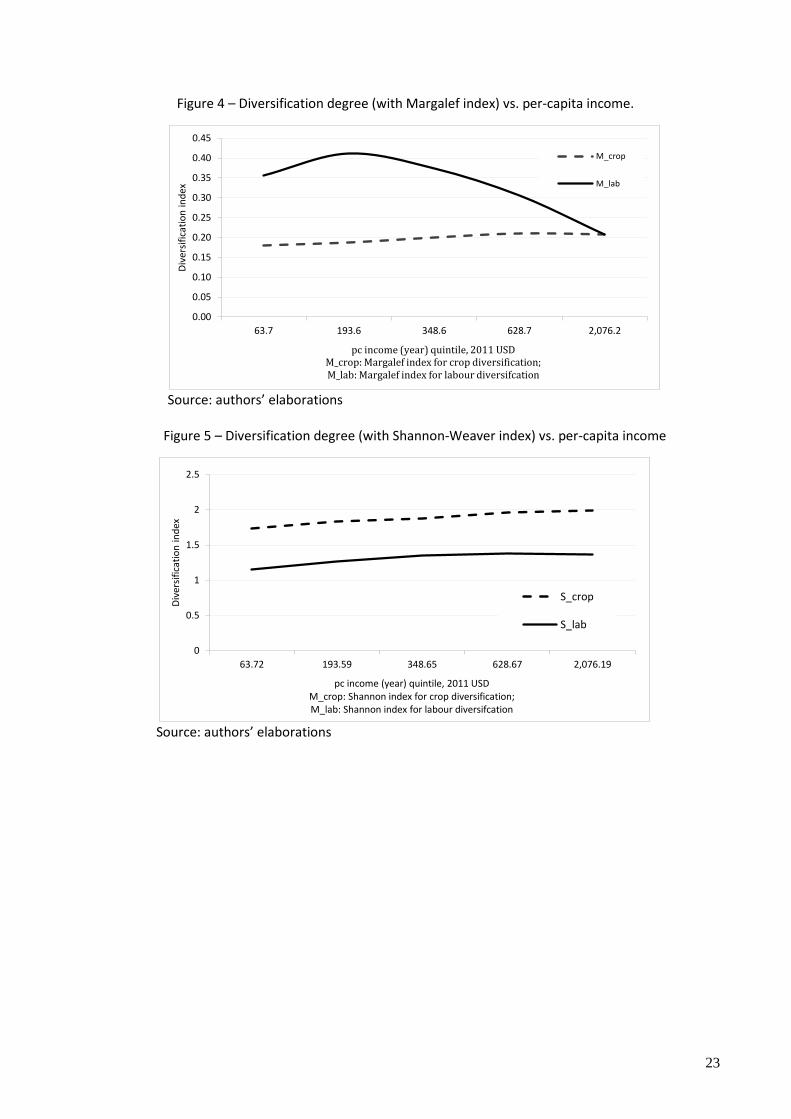
Preliminary statistics signal that the degree of diversification changes according to the welfare status and endowment level. In the case of income (Figure 4), labour diversification measured by the Margalef index follows a reverse U-shaped curve, suggesting that the diversification level is higher in middle-income rural households6. On the contrary, when the same diversification is measured through the Shannon-Weaver index (Figure 5), which accounts for the evenness, a monotonic trend appears. At empirical level, this evidence not only suggests measuring the impact of diversification conditioned to different welfare ranges, but also justifies the choice of using different diversification measures. In order to capture heterogeneity due to the differentiated impacts on the households' welfare, we employ a quantile regression model (Koenker and Hallock, 2001; Koenker, 2005). Such a choice provides the means for investigating the complex dynamics between welfare level and diversification strategies in light of the preliminary evidence shown in Figure 4 and Figure 5.
The uncorrelated effect of each type of diversification is captured by employing fitted values of dependent variables deriving from the SUR model estimation as welfare predictors in the quantile model, although in adopting such a procedure we do not make any claim of causality. In estimating the quantile model, the diversification impact is conditioned to three sections of the distribution (i.e., 𝑞 = {0.25, 0.5, 0.75}) of the dependent variable, namely income, DES and SP. It is worth mentioning that the potential bias deriving from the sequential empirical procedure proposed, is minimized by using bootstrapping replications for estimating the quantile model with corrected standard errors. For the 𝑖-th household, the welfare equation of the quantile model is given by:
𝑊𝑖 = 𝛽0,𝑖 + 𝛽1𝐷𝑖1 + 𝛽2𝐷𝑖
2 + 𝛽3𝜆𝑖 + 𝛽4𝛿𝑖 + 𝛽5𝜏𝑖 + 𝜖𝑖
where 𝑊 represents the welfare level and 𝐷1, 𝐷2, are the fitted values measuring crop and labour diversification, respectively. In addition, a series of specific variables and controls directly related to the welfare status are also included: the sum of total non-technological assets 𝜆 owned by each household, the age of household head 𝛿, and the number of family members 𝜏 to control for household size. 휀 represents the idiosyncratic error component. The model estimation is repeated with three different welfare measures (income, DES and SP), thus providing a comprehensive picture of the households living conditions.
5 Poverty line at 1.25 2005 PPP US Dollars (World Bank, 2015). 6 Such a relationship is consistent also when the simple count or the Berger-Parker index is employed. For the sake of simplicity, we do not show these results, which are fully available upon request.
23
Figure 4 – Diversification degree (with Margalef index) vs. per-capita income.
Source: authors’ elaborations
Figure 5 – Diversification degree (with Shannon-Weaver index) vs. per-capita income
Source: authors’ elaborations
0.00
0.05
0.10
0.15
0.20
0.25
0.30
0.35
0.40
0.45
63.7 193.6 348.6 628.7 2,076.2
Div
ersi
fica
tio
n in
dex
pc income (year) quintile, 2011 USDM_crop: Margalef index for crop diversification; M_lab: Margalef index for labour diversifcation
M_crop
M_lab
0
0.5
1
1.5
2
2.5
63.72 193.59 348.65 628.67 2,076.19
Div
ersi
fica
tio
n in
dex
pc income (year) quintile, 2011 USDM_crop: Shannon index for crop diversification; M_lab: Shannon index for labour diversifcation
S_crop
S_lab
24
4 Results
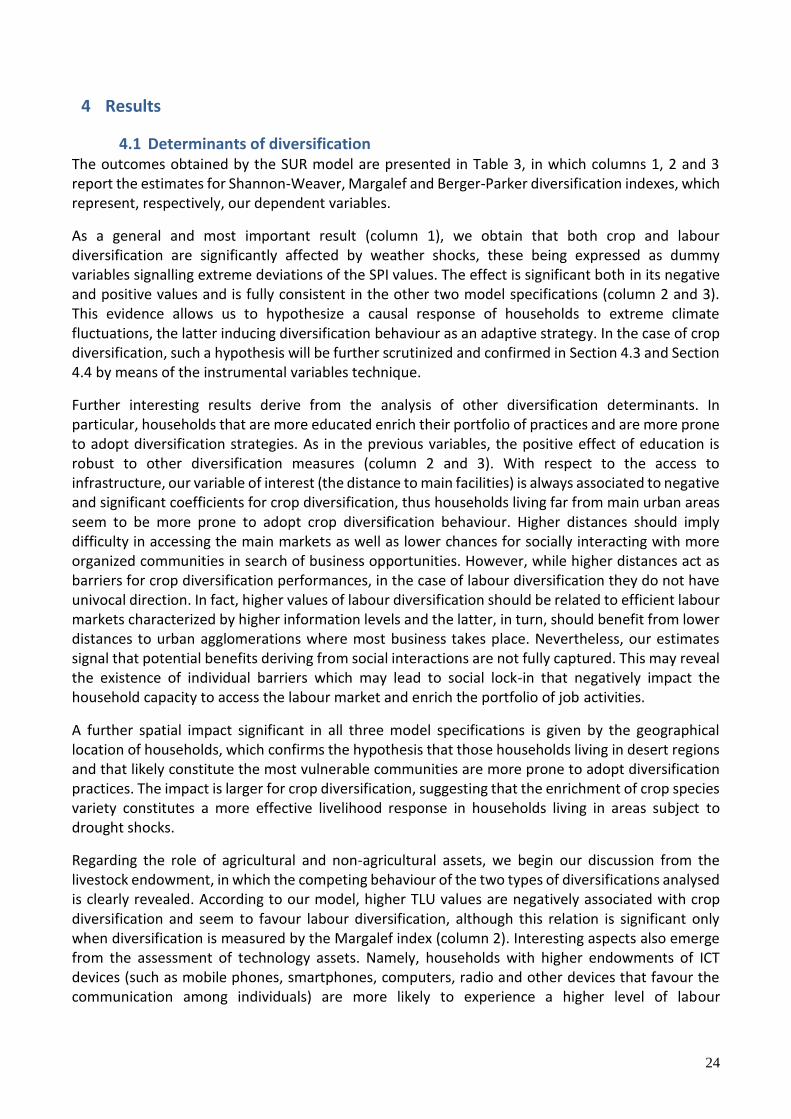
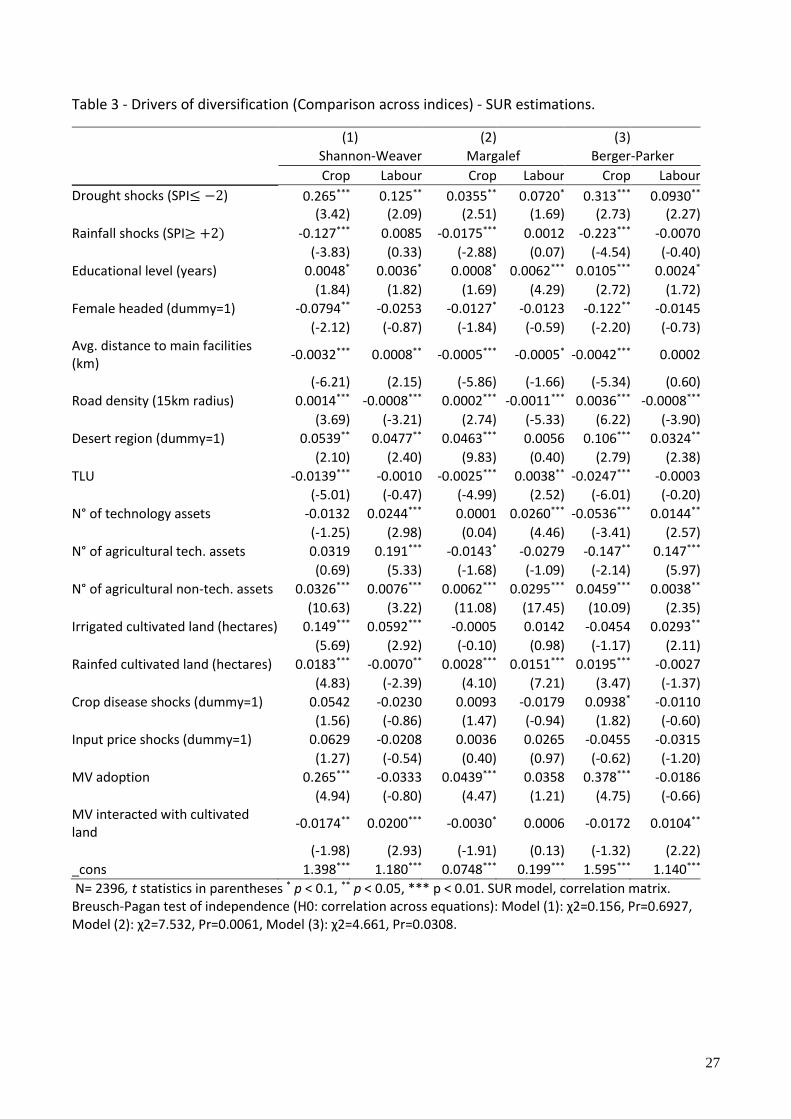
4.1 Determinants of diversification The outcomes obtained by the SUR model are presented in Table 3, in which columns 1, 2 and 3 report the estimates for Shannon-Weaver, Margalef and Berger-Parker diversification indexes, which represent, respectively, our dependent variables.
As a general and most important result (column 1), we obtain that both crop and labour diversification are significantly affected by weather shocks, these being expressed as dummy variables signalling extreme deviations of the SPI values. The effect is significant both in its negative and positive values and is fully consistent in the other two model specifications (column 2 and 3). This evidence allows us to hypothesize a causal response of households to extreme climate fluctuations, the latter inducing diversification behaviour as an adaptive strategy. In the case of crop diversification, such a hypothesis will be further scrutinized and confirmed in Section 4.3 and Section 4.4 by means of the instrumental variables technique.
Further interesting results derive from the analysis of other diversification determinants. In particular, households that are more educated enrich their portfolio of practices and are more prone to adopt diversification strategies. As in the previous variables, the positive effect of education is robust to other diversification measures (column 2 and 3). With respect to the access to infrastructure, our variable of interest (the distance to main facilities) is always associated to negative and significant coefficients for crop diversification, thus households living far from main urban areas seem to be more prone to adopt crop diversification behaviour. Higher distances should imply difficulty in accessing the main markets as well as lower chances for socially interacting with more organized communities in search of business opportunities. However, while higher distances act as barriers for crop diversification performances, in the case of labour diversification they do not have univocal direction. In fact, higher values of labour diversification should be related to efficient labour markets characterized by higher information levels and the latter, in turn, should benefit from lower distances to urban agglomerations where most business takes place. Nevertheless, our estimates signal that potential benefits deriving from social interactions are not fully captured. This may reveal the existence of individual barriers which may lead to social lock-in that negatively impact the household capacity to access the labour market and enrich the portfolio of job activities.
A further spatial impact significant in all three model specifications is given by the geographical location of households, which confirms the hypothesis that those households living in desert regions and that likely constitute the most vulnerable communities are more prone to adopt diversification practices. The impact is larger for crop diversification, suggesting that the enrichment of crop species variety constitutes a more effective livelihood response in households living in areas subject to drought shocks.
Regarding the role of agricultural and non-agricultural assets, we begin our discussion from the livestock endowment, in which the competing behaviour of the two types of diversifications analysed is clearly revealed. According to our model, higher TLU values are negatively associated with crop diversification and seem to favour labour diversification, although this relation is significant only when diversification is measured by the Margalef index (column 2). Interesting aspects also emerge from the assessment of technology assets. Namely, households with higher endowments of ICT devices (such as mobile phones, smartphones, computers, radio and other devices that favour the communication among individuals) are more likely to experience a higher level of labour
25
diversification, and this relation is consistent across the three diversification measures. On the other hand, the correlation between ICT endowment and crop diversification is negative and significantly differs from zero only when measured through the Berger-Parker index (column 3). Moreover, ICTs enhance the communication process and facilitate social interaction, thus allowing households to capture pieces of knowledge such as job offers and other opportunities, which are functional to higher levels of labour diversification. On the other hand, the hypothesis that ICTs would play an effective role in informing people on local weather forecasts, thus enhancing the awareness on the risks due to extreme weather events, cannot be confirmed in our analysis of diversification determinants.
Concerning the agricultural assets, we find a positive and significant correlation between the amount of irrigated cultivated land and the level of labour diversification, while the relation is so far significant in the case of crop diversification (column 2 and 3). This result is coherent with the geography of Niger, since the extent of lands that benefit from irrigation systems is very little7. It is also likely that such a small amount of land is devoted to hosting crop species associated with intensification practices. On the other hand, the effects on crop diversification conditioned to the amount of rainfed land are characterized by significantly positive relationships, which is also consistent across the three diversification measures (column 2 and 3). However, the relation is not univocal for labour diversification, whose positive and significant sign associated with the Shannon-Weaver index (column 1) turns out to be negative and weaker when diversification is measured by the Margalef index (column 2). This signals that when rainfed cultivation, households prefer to adopt crop diversification instead of labour diversification. In line with the empirical agronomic literature, farmers utilize rainfed land for subsistence purposes and there are local landraces that have been shown to be more resistant to water and climatic stressors. Traditionally, landraces are cultivated in a rich mixed cropping system so as the rainfed land is per se an asset linked with the strategy of crop diversification. On the contrary, on irrigated land, modern agricultural technologies may be applied in order to cultivate cash crops, which require higher levels of water, and in an optimal intensification approach, as mono-cropping farming may result in reduced diversity (Bellon, 2004; Lipper and Cooper, 2008). Such a hypothesis is first tested by including a dummy variable indicating the presence of modern varieties (MV). In addition, we interact the MV-dummy with the amount of irrigated cultivated land. The variable of adoption of modern varieties (MV) seems to be negatively correlated to both crop and labour diversification practices, and this result also holds when diversification is measured both with the Margalef and Berger-Parker index. From the negative and significant coefficient of the interacted variable, we can infer that when land is allocated to cultivate modern varieties, the intensification process takes place at the expense of the variety of crop species, although this result shows less significance in the estimations using the Margalef and Berger-Parker indices (column 2 and 3).
With respect to the gender issue, our results show significantly less intense diversification associated to households with female heads (column 1). The significance of this relationship only holds for crop diversification and it is consistent across the other diversification measures (column 2 and 3). On the other hand, we find no significant association between labour diversification and gender. This result leads us to hypothesize that women in rural communities may be more involved in subsistence agriculture and under-employed in non-routine activities, which may result in limited capacity in more complex diversification choices such as in the case of off-farm labour. Our self-reported variables indicating the presence of exogenous shocks do not signal any significant evidence, neither
7 The share of irrigated cultivated land over the total cultivated land is 6.8%.
26
on the effects of shocks on input prices nor on those signalling crop diseases, with the only exception through using the Berger-Parker index (column 3). Even though weak, the significance of the coefficient associated with shocks due to crop disease does not allow us to exclude a possible influence of this factor.
27
Table 3 - Drivers of diversification (Comparison across indices) - SUR estimations.
(1) (2) (3)
Shannon-Weaver Margalef Berger-Parker
Crop Labour Crop Labour Crop Labour
Drought shocks (SPI≤ −2) 0.265*** (3.42)
0.125** (2.09)
0.0355** (2.51)
0.0720* (1.69)
0.313*** (2.73)
0.0930** (2.27)
Rainfall shocks (SPI≥ +2) -0.127*** 0.0085 -0.0175*** 0.0012 -0.223*** -0.0070
(-3.83) (0.33) (-2.88) (0.07) (-4.54) (-0.40)
Educational level (years) 0.0048* 0.0036* 0.0008* 0.0062*** 0.0105*** 0.0024*
(1.84) (1.82) (1.69) (4.29) (2.72) (1.72)
Female headed (dummy=1) -0.0794** -0.0253 -0.0127* -0.0123 -0.122** -0.0145
(-2.12) (-0.87) (-1.84) (-0.59) (-2.20) (-0.73) Avg. distance to main facilities (km)
-0.0032*** 0.0008** -0.0005*** -0.0005* -0.0042*** 0.0002
(-6.21) (2.15) (-5.86) (-1.66) (-5.34) (0.60)
Road density (15km radius) 0.0014*** -0.0008*** 0.0002*** -0.0011*** 0.0036*** -0.0008***
(3.69) (-3.21) (2.74) (-5.33) (6.22) (-3.90)
Desert region (dummy=1) 0.0539** 0.0477** 0.0463*** 0.0056 0.106*** 0.0324**
(2.10) (2.40) (9.83) (0.40) (2.79) (2.38)
TLU -0.0139*** -0.0010 -0.0025*** 0.0038** -0.0247*** -0.0003
(-5.01) (-0.47) (-4.99) (2.52) (-6.01) (-0.20)
N° of technology assets -0.0132 0.0244*** 0.0001 0.0260*** -0.0536*** 0.0144**
(-1.25) (2.98) (0.04) (4.46) (-3.41) (2.57)
N° of agricultural tech. assets 0.0319 0.191*** -0.0143* -0.0279 -0.147** 0.147***
(0.69) (5.33) (-1.68) (-1.09) (-2.14) (5.97)
N° of agricultural non-tech. assets 0.0326*** 0.0076*** 0.0062*** 0.0295*** 0.0459*** 0.0038**
(10.63) (3.22) (11.08) (17.45) (10.09) (2.35)
Irrigated cultivated land (hectares) 0.149*** 0.0592*** -0.0005 0.0142 -0.0454 0.0293**
(5.69) (2.92) (-0.10) (0.98) (-1.17) (2.11)
Rainfed cultivated land (hectares) 0.0183*** -0.0070** 0.0028*** 0.0151*** 0.0195*** -0.0027
(4.83) (-2.39) (4.10) (7.21) (3.47) (-1.37)
Crop disease shocks (dummy=1) 0.0542 -0.0230 0.0093 -0.0179 0.0938* -0.0110
(1.56) (-0.86) (1.47) (-0.94) (1.82) (-0.60)
Input price shocks (dummy=1) 0.0629 -0.0208 0.0036 0.0265 -0.0455 -0.0315
(1.27) (-0.54) (0.40) (0.97) (-0.62) (-1.20)
MV adoption 0.265*** -0.0333 0.0439*** 0.0358 0.378*** -0.0186
(4.94) (-0.80) (4.47) (1.21) (4.75) (-0.66)
MV interacted with cultivated land
-0.0174** 0.0200*** -0.0030* 0.0006 -0.0172 0.0104**
(-1.98) (2.93) (-1.91) (0.13) (-1.32) (2.22)
_cons 1.398*** 1.180*** 0.0748*** 0.199*** 1.595*** 1.140***
N= 2396, t statistics in parentheses * p < 0.1, ** p < 0.05, *** p < 0.01. SUR model, correlation matrix. Breusch-Pagan test of independence (H0: correlation across equations): Model (1): χ2=0.156, Pr=0.6927, Model (2): χ2=7.532, Pr=0.0061, Model (3): χ2=4.661, Pr=0.0308.
28
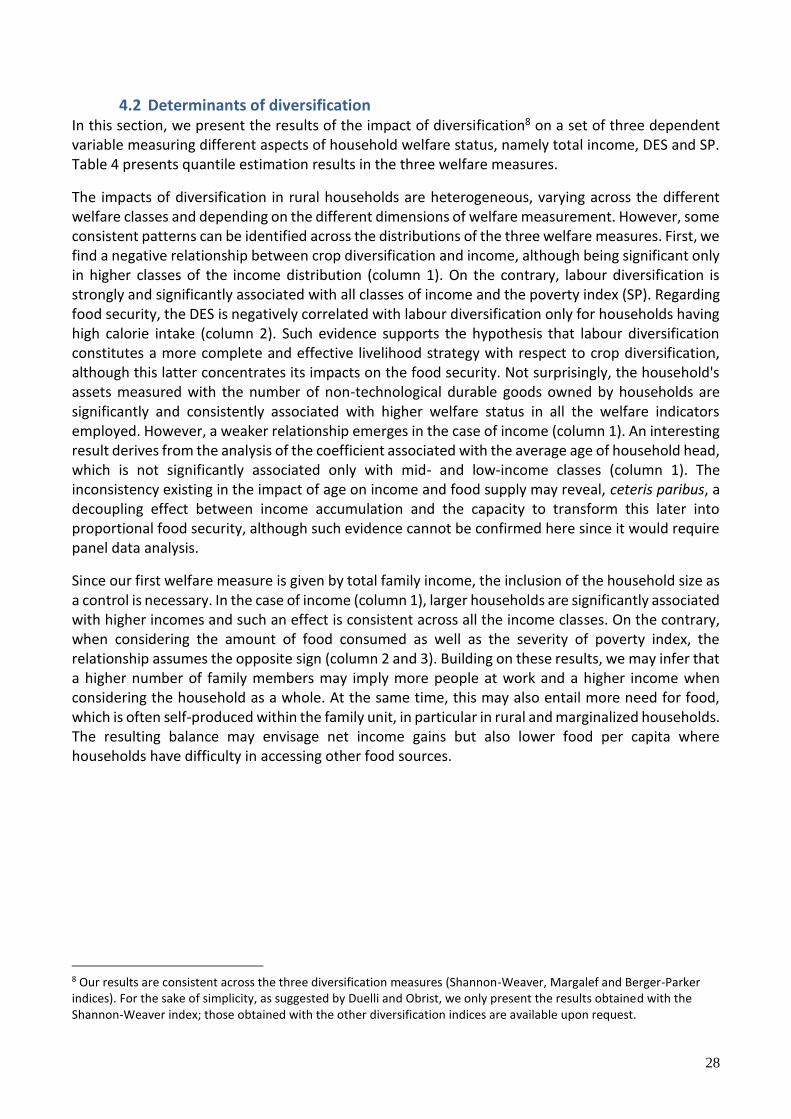
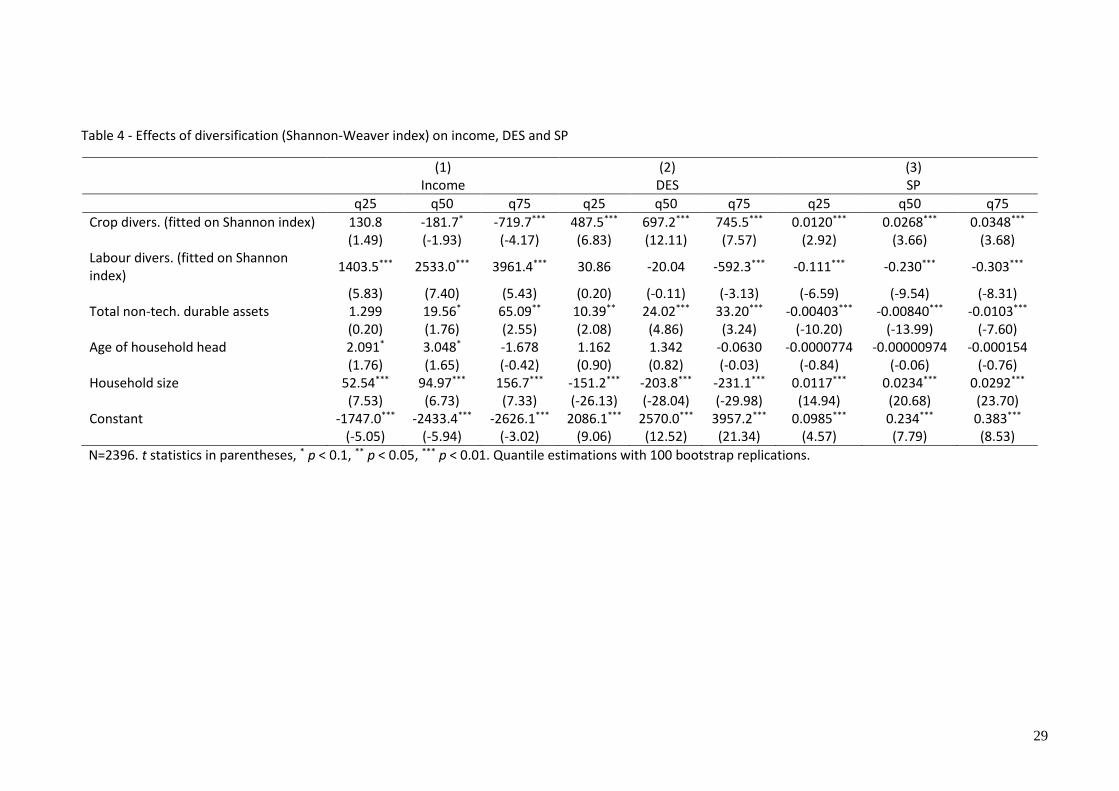
4.2 Determinants of diversification In this section, we present the results of the impact of diversification8 on a set of three dependent variable measuring different aspects of household welfare status, namely total income, DES and SP. Table 4 presents quantile estimation results in the three welfare measures.
The impacts of diversification in rural households are heterogeneous, varying across the different welfare classes and depending on the different dimensions of welfare measurement. However, some consistent patterns can be identified across the distributions of the three welfare measures. First, we find a negative relationship between crop diversification and income, although being significant only in higher classes of the income distribution (column 1). On the contrary, labour diversification is strongly and significantly associated with all classes of income and the poverty index (SP). Regarding food security, the DES is negatively correlated with labour diversification only for households having high calorie intake (column 2). Such evidence supports the hypothesis that labour diversification constitutes a more complete and effective livelihood strategy with respect to crop diversification, although this latter concentrates its impacts on the food security. Not surprisingly, the household's assets measured with the number of non-technological durable goods owned by households are significantly and consistently associated with higher welfare status in all the welfare indicators employed. However, a weaker relationship emerges in the case of income (column 1). An interesting result derives from the analysis of the coefficient associated with the average age of household head, which is not significantly associated only with mid- and low-income classes (column 1). The inconsistency existing in the impact of age on income and food supply may reveal, ceteris paribus, a decoupling effect between income accumulation and the capacity to transform this later into proportional food security, although such evidence cannot be confirmed here since it would require panel data analysis.
Since our first welfare measure is given by total family income, the inclusion of the household size as a control is necessary. In the case of income (column 1), larger households are significantly associated with higher incomes and such an effect is consistent across all the income classes. On the contrary, when considering the amount of food consumed as well as the severity of poverty index, the relationship assumes the opposite sign (column 2 and 3). Building on these results, we may infer that a higher number of family members may imply more people at work and a higher income when considering the household as a whole. At the same time, this may also entail more need for food, which is often self-produced within the family unit, in particular in rural and marginalized households. The resulting balance may envisage net income gains but also lower food per capita where households have difficulty in accessing other food sources.
8 Our results are consistent across the three diversification measures (Shannon-Weaver, Margalef and Berger-Parker indices). For the sake of simplicity, as suggested by Duelli and Obrist, we only present the results obtained with the Shannon-Weaver index; those obtained with the other diversification indices are available upon request.
29
Table 4 - Effects of diversification (Shannon-Weaver index) on income, DES and SP
(1) (2) (3) Income DES SP
q25 q50 q75 q25 q50 q75 q25 q50 q75
Crop divers. (fitted on Shannon index) 130.8 -181.7* -719.7*** 487.5*** 697.2*** 745.5*** 0.0120*** 0.0268*** 0.0348*** (1.49) (-1.93) (-4.17) (6.83) (12.11) (7.57) (2.92) (3.66) (3.68) Labour divers. (fitted on Shannon index)
1403.5*** 2533.0*** 3961.4*** 30.86 -20.04 -592.3*** -0.111*** -0.230*** -0.303***
(5.83) (7.40) (5.43) (0.20) (-0.11) (-3.13) (-6.59) (-9.54) (-8.31) Total non-tech. durable assets 1.299 19.56* 65.09** 10.39** 24.02*** 33.20*** -0.00403*** -0.00840*** -0.0103*** (0.20) (1.76) (2.55) (2.08) (4.86) (3.24) (-10.20) (-13.99) (-7.60) Age of household head 2.091* 3.048* -1.678 1.162 1.342 -0.0630 -0.0000774 -0.00000974 -0.000154 (1.76) (1.65) (-0.42) (0.90) (0.82) (-0.03) (-0.84) (-0.06) (-0.76) Household size 52.54*** 94.97*** 156.7*** -151.2*** -203.8*** -231.1*** 0.0117*** 0.0234*** 0.0292*** (7.53) (6.73) (7.33) (-26.13) (-28.04) (-29.98) (14.94) (20.68) (23.70) Constant -1747.0*** -2433.4*** -2626.1*** 2086.1*** 2570.0*** 3957.2*** 0.0985*** 0.234*** 0.383*** (-5.05) (-5.94) (-3.02) (9.06) (12.52) (21.34) (4.57) (7.79) (8.53)
N=2396. t statistics in parentheses, * p < 0.1, ** p < 0.05, *** p < 0.01. Quantile estimations with 100 bootstrap replications.
30
4.3 Endogeneity From the empirical standpoint, the choice of accounting for potential correlation in different diversification practices with the SUR model, as well as the assessment of the diversification effects across different classes of the welfare distribution, comes at the expense of considering potential endogeneity. The latter arises if mutual causality exists between the welfare outcome variable and the diversification variable (Ersado, 2003, Babatunde and Qaim, 2009; Asmah, 2011). In this section, we specifically address this limitation by controlling for endogeneity. In doing so, we rely on the Instrumental Variable (IV) regression model18, estimated by implementing a two-stage least square (2SLS) estimator19.
At the theoretical level, if farmers form expectations about the climatic conditions of their area, we might expect that they plant crops and use farm practices that are suited to their expectations. Any deviation from this optimal cropping decision in terms of more or less rainfall may not be welfare improving. The formation of these expectations is key for production and livelihood strategies such as the diversification of crop species. Thus, for households living in rural areas, weather variation across space and time should generate corresponding variation in household response or behaviour in terms of change in farm practices that will in turn create variation in household welfare. For this reason, we focus on weather fluctuations, which, we argue, generate uncertainty about expected climatic conditions and induce households to adopt diversification strategies. Additionally, we assume that the level of urban infrastructures characterizing the household living area is a fixed factor, which may induce diversification while not directly affecting household welfare. In this respect, Di Falco and Bulte (2013) use the geographical distance between the household and the village to explain the adoption of risk-mitigating strategies in Ethiopia. In our case, we employ an infrastructural index given by road density within a radius of 15 km. A higher road density is functional to labour seeking market exchanges and input purchasing in a given area. It also favours social interaction and the diffusion of information on common practices and events among households. Given the complexity in choosing a valid set of instruments, we focus the analysis on crop diversification and we are quick to point out that our candidate variables may not be perfect. Nevertheless, we will try to demonstrate that the test statistics support the idea that our instruments are valid20.
4.4 Results with instrumental variables The results deriving from IV estimations and presented in Table 5 appear, largely, to be consistent with those obtained by relying on the quantile model21. Most importantly, the negative impact of crop diversification on household income (column 1-3) is robust to different measures of diversification and to different model specifications (e.g., with results presented in Table 4), with a
18 We estimate the models with the ivreg2 command using the Stata software, v. 13.1. 19 Our results are robust to the use of alternative estimators such as GMM and are available upon request. It is worth noting that if the model is exactly identified, the efficient GMM and traditional IV/2SLS estimators coincide. Moreover, under the assumptions of conditional homoskedasticity and independence, the efficient GMM estimator is the traditional IV/2SLS estimator. For further details, see Hayashi (2000). 20 We assess the quality of our instruments by using an 𝐹-test of the joint significance of the excluded instruments. According to Stock and Staiger (1997), the weak instrument hypothesis will be rejected if the 𝐹-test is significantly greater than 10. We also perform overidentification tests of the model. All the results are shown in Table 3. Additionally, as part of a robustness check, we conduct sensitivity analysis by varying our infrastructural index calculating the road density within a radius of 10 and 20 km. The results obtained are robust to our sensitivity analysis and are fully available from the authors upon request. 21 Given the aim of the IV model, only the impact of crop diversification can be compared to the results obtained from the quantile model reported in Table 2.
31
stronger effect when the Margalef index is employed (column 4-6). On the contrary and consistent with the results presented in Table 4, crop diversification represents a very good means to increase the food security of rural households, with the DES being positively and strongly significantly associated with crop diversification in all the three indices (column 4-6). In addition, crop diversification also assumes an effective role in reducing the poverty gap, although this effect is less significant than that on income and DES (column 7-9). By combining the previous results with those obtained through IVs, we find robust evidence of the negative role of crop diversification in terms of income gains and limited capacity to mitigate the severity of poverty. If adapted to our context, such evidence is in line with previous studies, which relate production performances to the degree of crop diversification (Di Falco et al., 2010; Di Falco and Chavas, 2009). In our case, rural households represent the most marginalized communities, which rely on crop diversification as a mere adaptation strategy. In support of this hypothesis, it is worth considering that Niger is characterized by imperfect markets and weak policy support, which make difficult access to complementary agricultural inputs and food purchasing. Thus, diversifying households cannot capture complementary welfare benefits such as income gains, deriving from richer crop diversity; they rely on diversification mainly as an adaptive response able to guarantee sufficient food supply.
Regarding the variables related to specific households' characteristics, we observe that higher educational level correspond to slightly higher incomes (column 1-3) and lower values of severity of poverty (column 7-9). We also find confirmation on the negative performances of female-headed households both in terms of income changes (column 1-3), while no significant impact is found with respect to food security and severity of poverty (columns 4-6 and 7-9). The size of family is significantly and positively associated with higher incomes (column 1-3), but also implies more need for food and more income allocated to the latter (column 4-6 and 7-9). Hence, the size of family produces a differentiated impact across the three welfare dimensions analysed, a result consistent with the previous results reported in Table 4. With respect to the spatial factors, we observe that the average distance to main facilities shows no significant effects on welfare status. Living in desert regions represents a significant welfare reduction factor, since such a negative impact holds across the three welfare dimensions on all diversification measures. Interesting results can also be observed when the household assets are analysed22. One relevant and interesting effect is due to the role of ICT devices, which allow households to capture a higher level of technical knowledge, more accurate weather forecasts and other pieces of knowledge that are key for implementing effective crop diversification strategies. ICTs produce strongly significant and positive impacts not only in terms of income (column 1-3) but also in the amount of food calories (columns 4-7) as well as in reducing the poverty gap (columns 7-9). Moreover, such effects are robust to the three diversification measures. Regarding the importance of agricultural assets, a significant role is assumed by the non-technology ones which, together to the amount of irrigated cultivated land, are functional to producing higher incomes (columns 1-3) and also to mitigating the severity of poverty (columns 7-9). On the other hand, households that own rain-fed lands are not significantly affected by any welfare variations.
When testing the impact of exogenous shocks on welfare, our model returns consistently negative but differentiated effects, changing according to the dimension of welfare considered. In detail, the shocks signalling the presence of crop diseases have negative impacts both on income (columns 1-3) and SP (columns 7-9). On the contrary, the impact of input price shocks, concentrates its negative effects only by reducing caloric intake (columns 4-6), while we do not find any significant variations
22 The correlation between durable technology and non-technology assets owned by households is 0.75 and to avoid collinearity we only include in the IV estimations the variable of technology assets (see Table A1 in the annex).
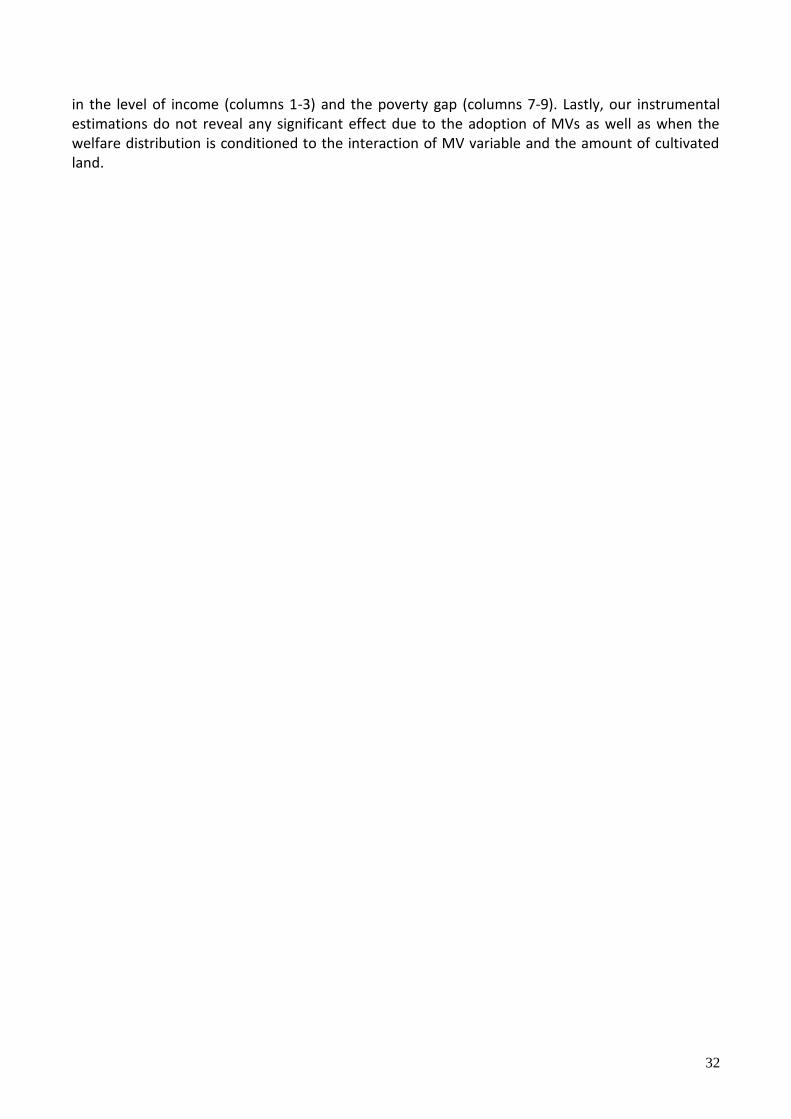
32
in the level of income (columns 1-3) and the poverty gap (columns 7-9). Lastly, our instrumental estimations do not reveal any significant effect due to the adoption of MVs as well as when the welfare distribution is conditioned to the interaction of MV variable and the amount of cultivated land.
33
Table 5 - Welfare effects of crop diversification on three different diversification indices (Shannon-Weaver, Margalef and Berger-Parker)
(1) (2) (3) (4) (5) (6) (7) (8) (9) Income Income Income DES DES DES SP SP SP
Crop diversification (Shannon) -874.1* 597.6*** 0.0928*** (-1.83) (3.07) (2.96) Crop diversification (Margalef) -6396.1* 4471.3*** 0.673*** (-1.80) (3.02) (2.78) Crop diversification (Berger-Parker) -494.3** 235.3** 0.0638*** (-2.01) (2.46) (3.88) Educational level (years) 23.03** 24.37** 24.17** 2.122 1.106 2.672 -0.00130* -0.00143** -0.00156** (1.97) (2.03) (2.13) (0.51) (0.25) (0.68) (-1.91) (-1.98) (-2.32) Age of household head -0.368 -0.249 0.532 2.959** 2.909** 2.075* -0.0000723 -0.0000869 -0.000138 (-0.13) (-0.08) (0.19) (2.19) (2.06) (1.67) (-0.36) (-0.41) (-0.73) Female headed (dummy=1) -336.2*** -350.3*** -335.4*** -9.611 1.168 -23.14 0.00759 0.00901 0.00893 (-2.89) (-2.83) (-2.95) (-0.16) (0.02) (-0.41) (0.81) (0.89) (0.94) Household size 49.46*** 48.55*** 51.71*** -204.9*** -204.1*** -208.1*** 0.0236*** 0.0237*** 0.0236*** (2.69) (2.63) (2.97) (-30.66) (-28.53) (-33.79) (20.95) (19.96) (21.70) Avg. distance to main facilities (km) 0.830 0.0499 1.343 -1.383 -0.788 -2.302*** 0.0000601 0.000139 0.0000680 (0.31) (0.02) (0.58) (-1.35) (-0.66) (-2.61) (0.38) (0.73) (0.48) Desert region (dummy=1) -260.4*** -10.20 -255.2*** -183.9*** -359.4*** -178.1*** 0.0364*** 0.0101 0.0348*** (-2.58) (-0.06) (-2.60) (-4.63) (-4.54) (-4.67) (5.48) (0.79) (5.31) TLU 85.98*** 81.88*** 85.31*** 7.670 10.70* 5.776 -0.00232*** -0.00190** -0.00199** (3.96) (3.76) (4.00) (1.46) (1.77) (1.19) (-2.66) (-2.05) (-2.37) N. of technology assets 163.9*** 180.5*** 154.5*** 30.43* 18.79 34.71** -0.0215*** -0.0233*** -0.0203*** (3.43) (3.65) (3.22) (1.84) (1.01) (2.20) (-7.63) (-7.86) (-7.46) Total non-tech. durable assets 65.69*** 61.71*** 60.65*** 21.54*** 24.35*** 23.52*** -0.00733*** -0.00691*** -0.00663*** (3.54) (3.25) (3.30) (3.22) (3.35) (3.70) (-6.84) (-6.00) (-6.14) N. of agricultural tech. assets 528.3** 410.1 418.6* -63.25 19.07 -7.399 -0.0404*** -0.0279** -0.0266*** (2.12) (1.63) (1.80) (-0.83) (0.24) (-0.13) (-3.76) (-2.45) (-2.81) N. of agricultural non-tech. assets 103.4*** 114.9*** 97.09*** 17.43* 8.883 27.47*** -0.00676*** -0.00794*** -0.00672*** (4.10) (3.79) (4.61) (1.94) (0.75) (3.96) (-4.66) (-4.16) (-5.56) Irrigated cultivated land (ha) 318.3* 186.0 162.5 -103.0** -12.41 -2.809 -0.0362*** -0.0222*** -0.0190*** (1.90) (1.31) (1.21) (-2.25) (-0.38) (-0.09) (-3.98) (-3.09) (-2.86) Rainfed cultivated land (ha) -14.76 -12.22 -20.66 -6.183 -8.257 0.677 -0.000108 -0.000357 0.000207 (-0.91) (-0.70) (-1.49) (-0.86) (-1.02) (0.11) (-0.09) (-0.26) (0.19) Crop disease shocks (dummy=1) -202.4* -190.1 -203.4* -43.19 -52.62 -31.29 0.0261*** 0.0248** 0.0249*** (-1.81) (-1.61) (-1.87) (-0.87) (-0.96) (-0.68) (2.73) (2.45) (2.66) Input price shocks (dummy=1) -137.7 -169.9 -220.0 -173.3*** -151.5** -125.1** -0.0162 -0.0128 -0.00658 (-0.90) (-1.07) (-1.49) (-2.66) (-2.29) (-2.00) (-1.23) (-0.95) (-0.51) MV adoption 156.1 203.8 114.9 -47.43 -84.62 23.22 -0.0207 -0.0255 -0.0210 (0.67) (0.80) (0.54) (-0.48) (-0.77) (0.27) (-1.25) (-1.39) (-1.36) MV interacted with cultivated land 14.34 10.07 20.81 5.089 8.337 -1.542 0.000792 0.00123 0.000349 (0.49) (0.32) (0.73) (0.40) (0.57) (-0.13) (0.34) (0.49) (0.15) Constant 1791.0** 1053.2*** 1360.2*** 2729.2*** 3223.3*** 3228.1*** -0.0789 0.000117 -0.0556* (2.31) (2.67) (2.74) (8.50) (18.76) (16.04) (-1.54) (0.00) (-1.65)
r2 0.0467 0.0188 0.0929 0.353 0.276 0.407 0.169 0.0842 0.185
N=2396. Robust t statistics in parentheses, ∗ p < 0.1, ∗∗ p < 0.05, ∗∗∗ p < 0.01. F-test of excluded instruments: Model (1), (2), (3): F=19.32; Model (4), (5), (6): F=11.16; Model (6), (7), (8): F=37.51. Overidentification test of all instruments (Hansen J statistics): Model (1): χ2 = 0.87, p = 0.641, Model (2): χ2 = 8.82, p = 0.022; Model (3) χ2 = 18.52, p = 0.001; Model (4): χ2 = 0.897, p = 0.638; Model (5): χ2 = 8.17,p = 0.016; Model (6): χ2 = 17.17,p = 0.000; Model (7): χ2 = o.26,p = 0.876; Model (8): χ2 = 14.179,p = 0.000; Model (9): χ2 = 12.576,p = 0.001. Endogeneity test (H0: regressors tested are exogenous): Model (1): χ2 = 7.26, p = 0.007; Model (2): χ2 = 8.16, p = 0.004; Model (3): χ2 = 7.55, p = 0.006; Model (4): χ2 = 4.97, p = 0.025; Model (5): χ2 = 9.44, p = 0.002; Model (6): χ2 = 6.85, p = 0.008; Model (7): χ2 = 7.16, p = 0.007; Model (8): χ2 = 4.39, p = 0.036; Model (9): χ2 = 12.663, p = 0.000.
5 Conclusions
In this paper, we aim to identify the drivers and effects of two diversification activities, namely crop and labour diversification, in rural Nigerien households. In doing so, we stress the role of climate anomalies, identified through the Standardized Precipitation Index, which allows for detecting both long- and mid-run change in the pattern of precipitation. A Seemingly Unrelated Regression model is used to address potential correlation in identifying common drivers of the two diversifications considered here. In addition, the effects of diversification on household living conditions are scrutinized across a set of three different welfare indicators, namely total household income, Dietary Energy Supply and Severity of Poverty index. Repeated quantile model estimations on each of these indicators provide a multidimensional picture of the poorly explored welfare status of rural Nigerien communities along different sections of the distribution of the welfare outcome variables.
Our analysis of diversification determinants confirms the hypothesis that anomalies in rainfall patterns result in adaptation responses measured through the adoption of diversification practices. The inducement effect of climate factors is consistent for both crop and labour diversification and across the three indices of diversification employed, namely Shannon-Weaver, Margalef and Berger-Parker.
Besides, the main ‘push' factors given by the drought shocks, the level of crop diversification is positively associated with other significant catalysts such as the educational level of household members, the spatial location, and different sets of household endowments. On the other hand, main limitations to crop diversification derive from the amount of livestock owned, from the presence of female-headed households and from excessive rainfalls. The combined effect of adopting MVs with cultivated irrigated land signals the potential presence of agricultural intensification processes which is detrimental to higher degrees of crop diversification.
Regarding labour diversification, the infrastructural level and the distance from main facilities imply opposite diversification behaviour. While crop diversification benefits from longer distances and from a denser road pattern, labour diversification seems to be negatively affected by these factors. On the other hand, labour diversification positively responds to higher levels of household ability to capture pieces of knowledge and information from ICT devices. In addition, in line with the results obtained for crop diversification, living in desert areas induces households to allocate labour in a richer way. Additional beneficial effects for labour diversification are signalled by the interaction of the MV variable with the one indicating the amount of irrigated cultivated land as well as by the amount of both technological and non-technological agricultural assets owned by households.
The second part of our analysis focuses on the impacts of diversification, which are scrutinized on a set of three welfare indicators: the total household income, caloric intake (measured by the dietary energy supply indicator) and the poverty gap (measured by the severity of poverty index). Our preliminary descriptive analysis signals that the level of diversification varies according to the welfare level. Thus, we first test the diversification impact by using a quantile model in which our main predictors are the fitted values of diversification deriving from the previous SUR estimations. Even though we make no causality claims, we account for uncorrelated diversification values and explore their impact conditioning to three distribution classes of the welfare distribution. Largely the quantile model confirms our descriptive evidence of differentiated effects across different classes of the different welfare indicators. Specifically, labour diversification is significantly and positively associated with income and negatively with the severity of poverty, particularly in the higher welfare
32
classes. However, a weakly significant correlation is also found in the case of higher classes of DES. On the contrary, a richer calorie intake is always and strongly significantly associated with crop diversification, while the latter is negatively correlated with income and more severe poverty.
Next, we enrich the analysis of diversification impacts by implementing a two-stage estimator, in which we use the variables for climate shocks and the degree of urban infrastructures (road density) to instrument for crop diversification. This part of analysis allows us to derive some indications on the casual direction between welfare level and diversification behaviour. As in the previous estimations, the impacts of diversification significantly affect the level of welfare with differentiated impacts. Namely, crop diversification is confirmed to reduce the income level and to increase the severity of poverty, but its role is key for sustaining households with larger caloric intake. This supports the hypothesis that most marginalized farmers are more responsive to crop-diversification as a risk-minimization strategy and that such a strategy is actually effective in increasing their food security.
Given the absence of data related with possible in-force government interventions and other safety-net mechanisms, we do not provide evidence on the effectiveness of policy measures. However, several policy implications can be drawn from the empirical analysis presented. First, rural households, which are the most exposed to climate risks, do not benefit from any policy support mechanisms or from extension services able to provide households with useful information. Such a lack intensifies the adaptation deficit particularly for most vulnerable communities that live in marginal areas of the country. Given the multiple benefits that labour diversification produce in these sectors of the population, policies aimed at strengthening the most important diversification drivers, as identified in our analysis, would constitute valid and efficient instruments to further increase the household welfare. This also would limit direct compensation mechanisms such as lump-sum payments that may generate reduced incentives to adopt virtuous autonomous strategies by less-responsive households with minimum government support. However, considering the high effectiveness of crop diversification in producing higher levels of food supply and its limited impact on income and on the capacity to reduce the severity of poverty, monetary compensation measures should not be completely excluded. Further desirable interventions aimed at reducing the adaptation deficit via diversification constitute more accessible infrastructures, diffusion of information on climate change risks and other pieces of knowledge which allow households to be more autonomous in undertaking diversification activities, thus reducing potential diversification lock-in due to climate change misperception and insufficient risk awareness.
Although the present study attempts to fill the gap in understanding the determinants and effects of diversification in rural Niger communities, several research issues remain unaddressed. Among these, the role of social networks in raising household awareness of potential diversification benefits requires further research. In addition, it is worth noting that our analysis is limited by the use of cross-sectional data in which the longitudinal component - relevant in the assessment of adaptation processes - is not taken into account. Thus, some caveats exist in interpreting the causal dynamics of weather shocks. In this respect, new available panel data will help researchers to consolidate and enrich the results presented here.
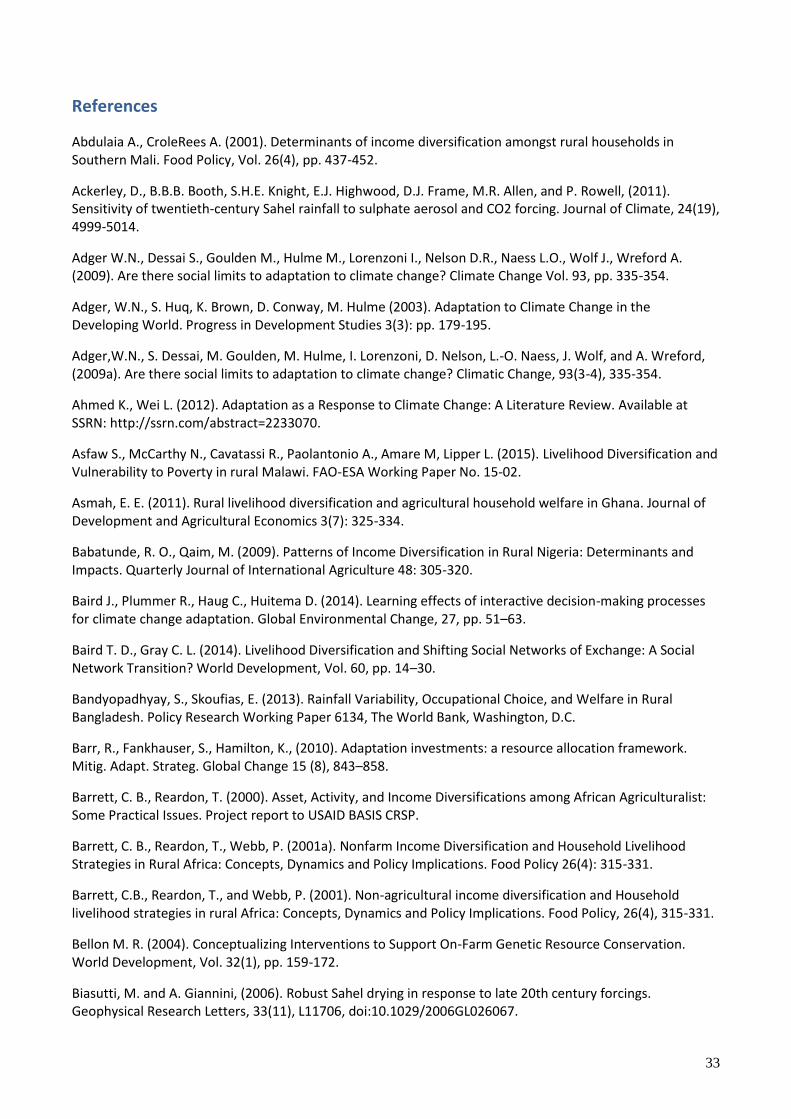
33
References
Abdulaia A., CroleRees A. (2001). Determinants of income diversification amongst rural households in Southern Mali. Food Policy, Vol. 26(4), pp. 437-452.
Ackerley, D., B.B.B. Booth, S.H.E. Knight, E.J. Highwood, D.J. Frame, M.R. Allen, and P. Rowell, (2011). Sensitivity of twentieth-century Sahel rainfall to sulphate aerosol and CO2 forcing. Journal of Climate, 24(19), 4999-5014.
Adger W.N., Dessai S., Goulden M., Hulme M., Lorenzoni I., Nelson D.R., Naess L.O., Wolf J., Wreford A. (2009). Are there social limits to adaptation to climate change? Climate Change Vol. 93, pp. 335-354.
Adger, W.N., S. Huq, K. Brown, D. Conway, M. Hulme (2003). Adaptation to Climate Change in the Developing World. Progress in Development Studies 3(3): pp. 179-195.
Adger,W.N., S. Dessai, M. Goulden, M. Hulme, I. Lorenzoni, D. Nelson, L.-O. Naess, J. Wolf, and A. Wreford, (2009a). Are there social limits to adaptation to climate change? Climatic Change, 93(3-4), 335-354.
Ahmed K., Wei L. (2012). Adaptation as a Response to Climate Change: A Literature Review. Available at SSRN: http://ssrn.com/abstract=2233070.
Asfaw S., McCarthy N., Cavatassi R., Paolantonio A., Amare M, Lipper L. (2015). Livelihood Diversification and Vulnerability to Poverty in rural Malawi. FAO-ESA Working Paper No. 15-02.
Asmah, E. E. (2011). Rural livelihood diversification and agricultural household welfare in Ghana. Journal of Development and Agricultural Economics 3(7): 325-334.
Babatunde, R. O., Qaim, M. (2009). Patterns of Income Diversification in Rural Nigeria: Determinants and Impacts. Quarterly Journal of International Agriculture 48: 305-320.
Baird J., Plummer R., Haug C., Huitema D. (2014). Learning effects of interactive decision-making processes for climate change adaptation. Global Environmental Change, 27, pp. 51–63.
Baird T. D., Gray C. L. (2014). Livelihood Diversification and Shifting Social Networks of Exchange: A Social Network Transition? World Development, Vol. 60, pp. 14–30.
Bandyopadhyay, S., Skoufias, E. (2013). Rainfall Variability, Occupational Choice, and Welfare in Rural Bangladesh. Policy Research Working Paper 6134, The World Bank, Washington, D.C.
Barr, R., Fankhauser, S., Hamilton, K., (2010). Adaptation investments: a resource allocation framework. Mitig. Adapt. Strateg. Global Change 15 (8), 843–858.
Barrett, C. B., Reardon, T. (2000). Asset, Activity, and Income Diversifications among African Agriculturalist: Some Practical Issues. Project report to USAID BASIS CRSP.
Barrett, C. B., Reardon, T., Webb, P. (2001a). Nonfarm Income Diversification and Household Livelihood Strategies in Rural Africa: Concepts, Dynamics and Policy Implications. Food Policy 26(4): 315-331.
Barrett, C.B., Reardon, T., and Webb, P. (2001). Non-agricultural income diversification and Household livelihood strategies in rural Africa: Concepts, Dynamics and Policy Implications. Food Policy, 26(4), 315-331.
Bellon M. R. (2004). Conceptualizing Interventions to Support On-Farm Genetic Resource Conservation. World Development, Vol. 32(1), pp. 159-172.
Biasutti, M. and A. Giannini, (2006). Robust Sahel drying in response to late 20th century forcings. Geophysical Research Letters, 33(11), L11706, doi:10.1029/2006GL026067.
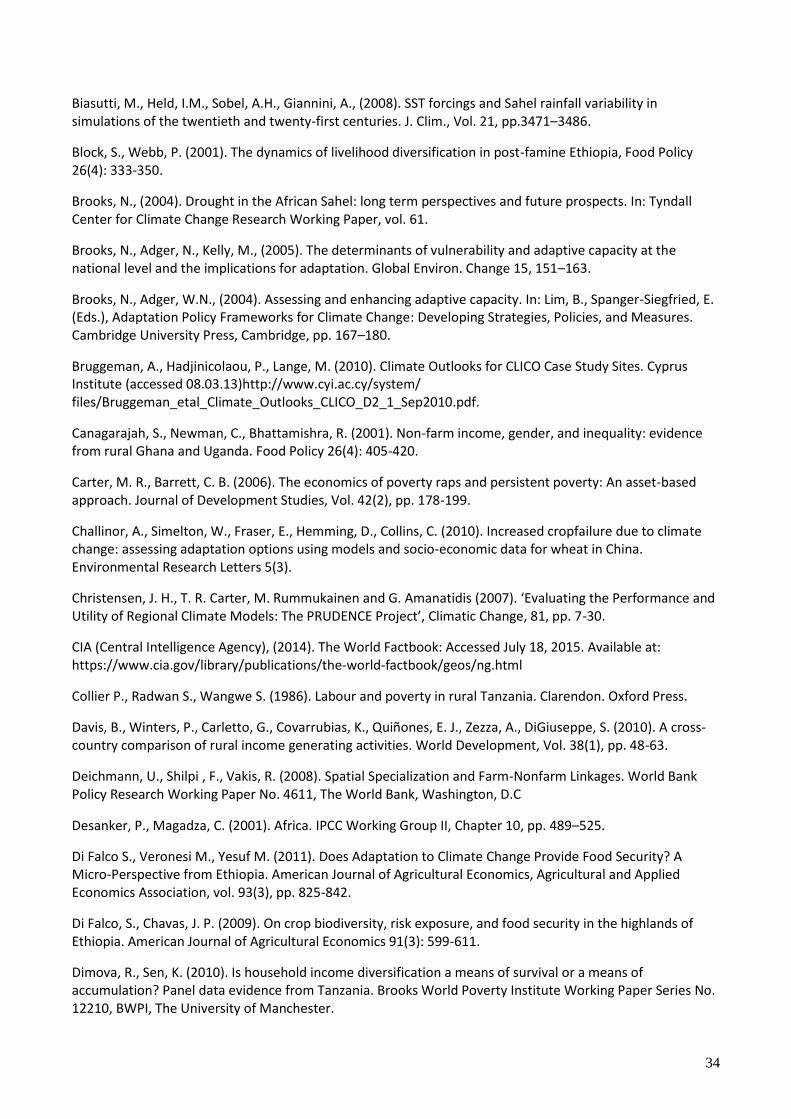
34
Biasutti, M., Held, I.M., Sobel, A.H., Giannini, A., (2008). SST forcings and Sahel rainfall variability in simulations of the twentieth and twenty-first centuries. J. Clim., Vol. 21, pp.3471–3486.
Block, S., Webb, P. (2001). The dynamics of livelihood diversification in post-famine Ethiopia, Food Policy 26(4): 333-350.
Brooks, N., (2004). Drought in the African Sahel: long term perspectives and future prospects. In: Tyndall Center for Climate Change Research Working Paper, vol. 61.
Brooks, N., Adger, N., Kelly, M., (2005). The determinants of vulnerability and adaptive capacity at the national level and the implications for adaptation. Global Environ. Change 15, 151–163.
Brooks, N., Adger, W.N., (2004). Assessing and enhancing adaptive capacity. In: Lim, B., Spanger-Siegfried, E. (Eds.), Adaptation Policy Frameworks for Climate Change: Developing Strategies, Policies, and Measures. Cambridge University Press, Cambridge, pp. 167–180.
Bruggeman, A., Hadjinicolaou, P., Lange, M. (2010). Climate Outlooks for CLICO Case Study Sites. Cyprus Institute (accessed 08.03.13)http://www.cyi.ac.cy/system/ files/Bruggeman_etal_Climate_Outlooks_CLICO_D2_1_Sep2010.pdf.
Canagarajah, S., Newman, C., Bhattamishra, R. (2001). Non-farm income, gender, and inequality: evidence from rural Ghana and Uganda. Food Policy 26(4): 405-420.
Carter, M. R., Barrett, C. B. (2006). The economics of poverty raps and persistent poverty: An asset-based approach. Journal of Development Studies, Vol. 42(2), pp. 178-199.
Challinor, A., Simelton, W., Fraser, E., Hemming, D., Collins, C. (2010). Increased cropfailure due to climate change: assessing adaptation options using models and socio-economic data for wheat in China. Environmental Research Letters 5(3).
Christensen, J. H., T. R. Carter, M. Rummukainen and G. Amanatidis (2007). ‘Evaluating the Performance and Utility of Regional Climate Models: The PRUDENCE Project’, Climatic Change, 81, pp. 7-30.
CIA (Central Intelligence Agency), (2014). The World Factbook: Accessed July 18, 2015. Available at: https://www.cia.gov/library/publications/the-world-factbook/geos/ng.html
Collier P., Radwan S., Wangwe S. (1986). Labour and poverty in rural Tanzania. Clarendon. Oxford Press.
Davis, B., Winters, P., Carletto, G., Covarrubias, K., Quinones, E. J., Zezza, A., DiGiuseppe, S. (2010). A cross-country comparison of rural income generating activities. World Development, Vol. 38(1), pp. 48-63.
Deichmann, U., Shilpi , F., Vakis, R. (2008). Spatial Specialization and Farm-Nonfarm Linkages. World Bank Policy Research Working Paper No. 4611, The World Bank, Washington, D.C
Desanker, P., Magadza, C. (2001). Africa. IPCC Working Group II, Chapter 10, pp. 489–525.
Di Falco S., Veronesi M., Yesuf M. (2011). Does Adaptation to Climate Change Provide Food Security? A Micro-Perspective from Ethiopia. American Journal of Agricultural Economics, Agricultural and Applied Economics Association, vol. 93(3), pp. 825-842.
Di Falco, S., Chavas, J. P. (2009). On crop biodiversity, risk exposure, and food security in the highlands of Ethiopia. American Journal of Agricultural Economics 91(3): 599-611.
Dimova, R., Sen, K. (2010). Is household income diversification a means of survival or a means of accumulation? Panel data evidence from Tanzania. Brooks World Poverty Institute Working Paper Series No. 12210, BWPI, The University of Manchester.
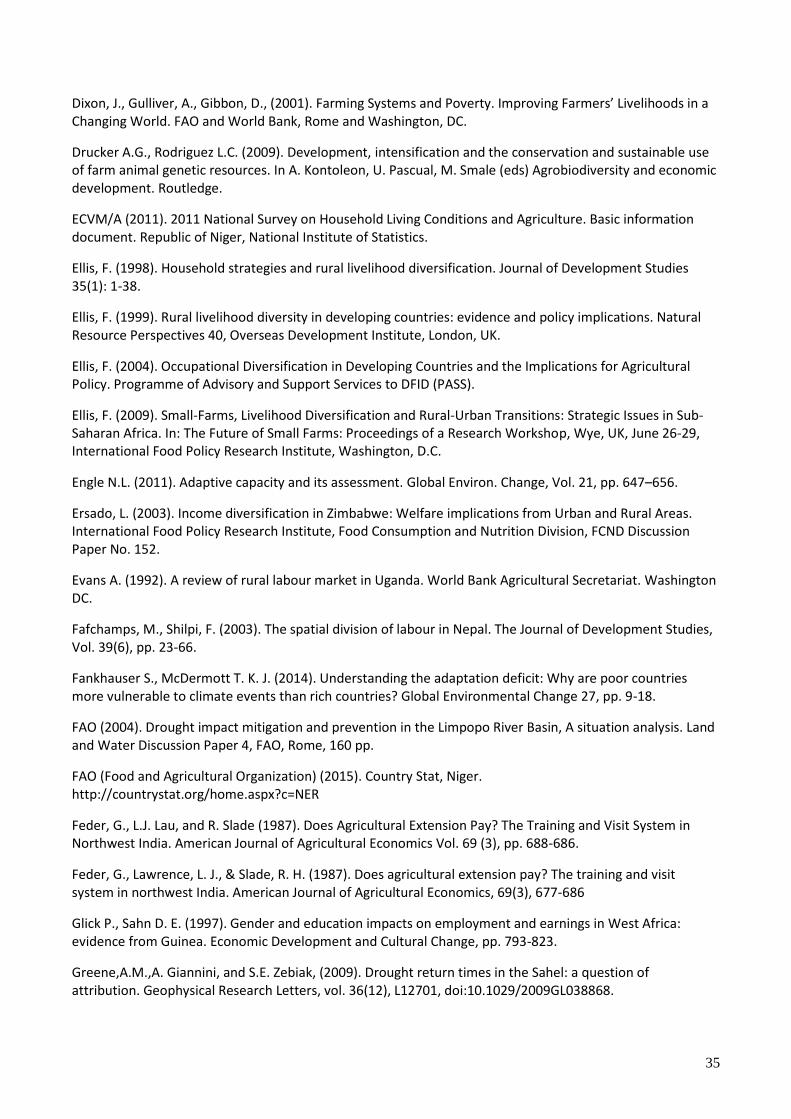
35
Dixon, J., Gulliver, A., Gibbon, D., (2001). Farming Systems and Poverty. Improving Farmers’ Livelihoods in a Changing World. FAO and World Bank, Rome and Washington, DC.
Drucker A.G., Rodriguez L.C. (2009). Development, intensification and the conservation and sustainable use of farm animal genetic resources. In A. Kontoleon, U. Pascual, M. Smale (eds) Agrobiodiversity and economic development. Routledge.
ECVM/A (2011). 2011 National Survey on Household Living Conditions and Agriculture. Basic information document. Republic of Niger, National Institute of Statistics.
Ellis, F. (1998). Household strategies and rural livelihood diversification. Journal of Development Studies 35(1): 1-38.
Ellis, F. (1999). Rural livelihood diversity in developing countries: evidence and policy implications. Natural Resource Perspectives 40, Overseas Development Institute, London, UK.
Ellis, F. (2004). Occupational Diversification in Developing Countries and the Implications for Agricultural Policy. Programme of Advisory and Support Services to DFID (PASS).
Ellis, F. (2009). Small-Farms, Livelihood Diversification and Rural-Urban Transitions: Strategic Issues in Sub-Saharan Africa. In: The Future of Small Farms: Proceedings of a Research Workshop, Wye, UK, June 26-29, International Food Policy Research Institute, Washington, D.C.
Engle N.L. (2011). Adaptive capacity and its assessment. Global Environ. Change, Vol. 21, pp. 647–656.
Ersado, L. (2003). Income diversification in Zimbabwe: Welfare implications from Urban and Rural Areas. International Food Policy Research Institute, Food Consumption and Nutrition Division, FCND Discussion Paper No. 152.
Evans A. (1992). A review of rural labour market in Uganda. World Bank Agricultural Secretariat. Washington DC.
Fafchamps, M., Shilpi, F. (2003). The spatial division of labour in Nepal. The Journal of Development Studies, Vol. 39(6), pp. 23-66.
Fankhauser S., McDermott T. K. J. (2014). Understanding the adaptation deficit: Why are poor countries more vulnerable to climate events than rich countries? Global Environmental Change 27, pp. 9-18.
FAO (2004). Drought impact mitigation and prevention in the Limpopo River Basin, A situation analysis. Land and Water Discussion Paper 4, FAO, Rome, 160 pp.
FAO (Food and Agricultural Organization) (2015). Country Stat, Niger. http://countrystat.org/home.aspx?c=NER
Feder, G., L.J. Lau, and R. Slade (1987). Does Agricultural Extension Pay? The Training and Visit System in Northwest India. American Journal of Agricultural Economics Vol. 69 (3), pp. 688-686.
Feder, G., Lawrence, L. J., & Slade, R. H. (1987). Does agricultural extension pay? The training and visit system in northwest India. American Journal of Agricultural Economics, 69(3), 677-686
Glick P., Sahn D. E. (1997). Gender and education impacts on employment and earnings in West Africa: evidence from Guinea. Economic Development and Cultural Change, pp. 793-823.
Greene,A.M.,A. Giannini, and S.E. Zebiak, (2009). Drought return times in the Sahel: a question of attribution. Geophysical Research Letters, vol. 36(12), L12701, doi:10.1029/2009GL038868.
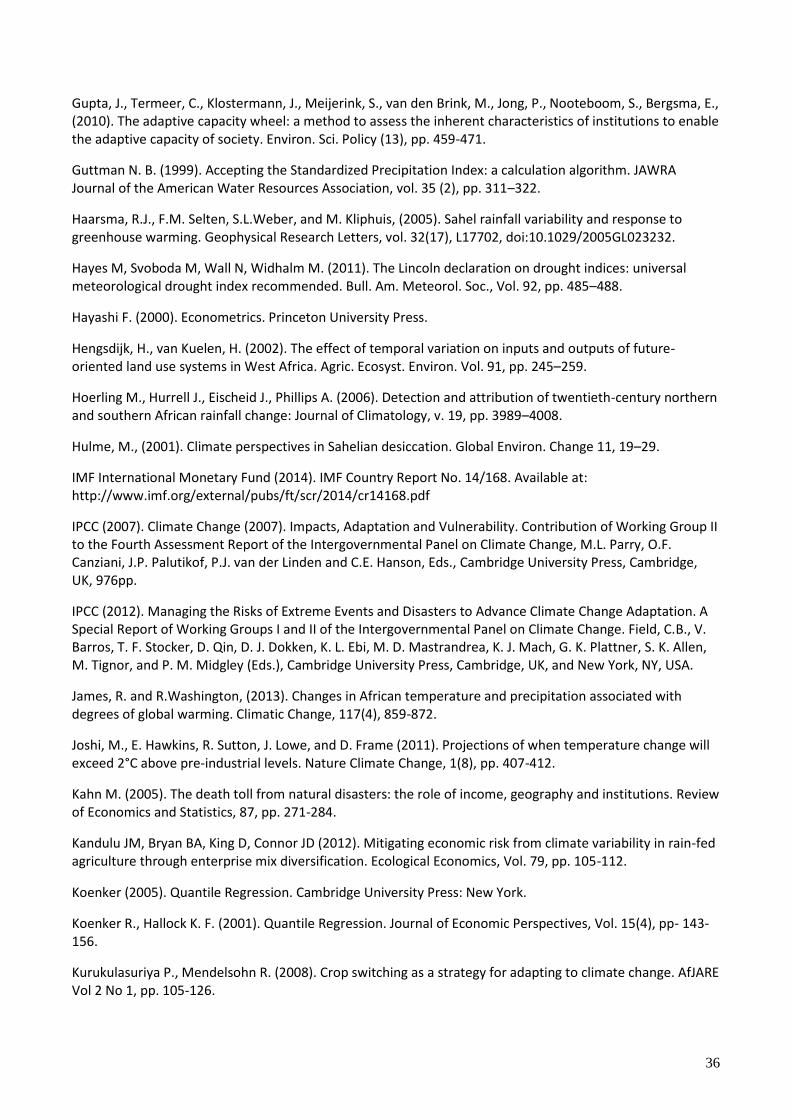
36
Gupta, J., Termeer, C., Klostermann, J., Meijerink, S., van den Brink, M., Jong, P., Nooteboom, S., Bergsma, E., (2010). The adaptive capacity wheel: a method to assess the inherent characteristics of institutions to enable the adaptive capacity of society. Environ. Sci. Policy (13), pp. 459-471.
Guttman N. B. (1999). Accepting the Standardized Precipitation Index: a calculation algorithm. JAWRA Journal of the American Water Resources Association, vol. 35 (2), pp. 311–322.
Haarsma, R.J., F.M. Selten, S.L.Weber, and M. Kliphuis, (2005). Sahel rainfall variability and response to greenhouse warming. Geophysical Research Letters, vol. 32(17), L17702, doi:10.1029/2005GL023232.
Hayes M, Svoboda M, Wall N, Widhalm M. (2011). The Lincoln declaration on drought indices: universal meteorological drought index recommended. Bull. Am. Meteorol. Soc., Vol. 92, pp. 485–488.
Hayashi F. (2000). Econometrics. Princeton University Press.
Hengsdijk, H., van Kuelen, H. (2002). The effect of temporal variation on inputs and outputs of future-oriented land use systems in West Africa. Agric. Ecosyst. Environ. Vol. 91, pp. 245–259.
Hoerling M., Hurrell J., Eischeid J., Phillips A. (2006). Detection and attribution of twentieth-century northern and southern African rainfall change: Journal of Climatology, v. 19, pp. 3989–4008.
Hulme, M., (2001). Climate perspectives in Sahelian desiccation. Global Environ. Change 11, 19–29.
IMF International Monetary Fund (2014). IMF Country Report No. 14/168. Available at: http://www.imf.org/external/pubs/ft/scr/2014/cr14168.pdf
IPCC (2007). Climate Change (2007). Impacts, Adaptation and Vulnerability. Contribution of Working Group II to the Fourth Assessment Report of the Intergovernmental Panel on Climate Change, M.L. Parry, O.F. Canziani, J.P. Palutikof, P.J. van der Linden and C.E. Hanson, Eds., Cambridge University Press, Cambridge, UK, 976pp.
IPCC (2012). Managing the Risks of Extreme Events and Disasters to Advance Climate Change Adaptation. A Special Report of Working Groups I and II of the Intergovernmental Panel on Climate Change. Field, C.B., V. Barros, T. F. Stocker, D. Qin, D. J. Dokken, K. L. Ebi, M. D. Mastrandrea, K. J. Mach, G. K. Plattner, S. K. Allen, M. Tignor, and P. M. Midgley (Eds.), Cambridge University Press, Cambridge, UK, and New York, NY, USA.
James, R. and R.Washington, (2013). Changes in African temperature and precipitation associated with degrees of global warming. Climatic Change, 117(4), 859-872.
Joshi, M., E. Hawkins, R. Sutton, J. Lowe, and D. Frame (2011). Projections of when temperature change will exceed 2°C above pre-industrial levels. Nature Climate Change, 1(8), pp. 407-412.
Kahn M. (2005). The death toll from natural disasters: the role of income, geography and institutions. Review of Economics and Statistics, 87, pp. 271-284.
Kandulu JM, Bryan BA, King D, Connor JD (2012). Mitigating economic risk from climate variability in rain-fed agriculture through enterprise mix diversification. Ecological Economics, Vol. 79, pp. 105-112.
Koenker (2005). Quantile Regression. Cambridge University Press: New York.
Koenker R., Hallock K. F. (2001). Quantile Regression. Journal of Economic Perspectives, Vol. 15(4), pp- 143-156.
Kurukulasuriya P., Mendelsohn R. (2008). Crop switching as a strategy for adapting to climate change. AfJARE Vol 2 No 1, pp. 105-126.
37
Lanjouw, P., Quizon, J., Sparrow, R. (2001). Non-agricultural earnings in peri-urban areas of Tanzania: evidence from household survey data. Food Policy 26(4): 385-403.
Lay, J., Mahmood, T.O., M’mukaria, G. M. (2008). Few Opportunities, Much desperation: The dichotomy of Non-Agricultural Activities and Inequality in Western Kenya. World Development 36(12): 2713-2732.
Le Dang H., Elton L., Nuberg I., Bruwer J. (2014). Understanding farmers’ adaptation intention to climate change: A structural equation modelling study in the Mekong Delta, Vietnam. Environmental Science & Policy, 41, pp. 11–22.
Lipper L., Cooper D. (2008). Managing Agricultural Biodiversity for Sustainable Use: Balancing the Benefits in the Field in Kontoleon, A., Pascual, U., and Smale, M., (eds) Agrobiodiversity Conservation and Economic Development, Routledge Explorations in Environmental Economics Series.
Losch, B., Freguingresh, S., White, E. (2011). Rural Transformation and Late Developing Countries in a Globalizing World: A Comparative Analysis of Rural Change. Final Report of the RuralStruc Program, Revised Version, The World Bank, Washington, D.C.
Mendelsohn R. O., Dinar A. (2009). Climate Change and Agriculture: An Economic Analysis of Global Impacts, Adaptation and Distributional Effects. Edward Elgar Publishing.
Mohino, E., S. Janicot, and J. Bader, (2011). Sahel rainfall and decadal to multi-decadal sea surface temperature variability. Climate Dynamics, 37(3), 419-440.
Narloch, U., Drucker, A. G., Pascual, U. (2011). Payments for agrobiodiversity conservation services for sustained on-farm utilization of plant and animal genetic resources. Ecological Economics, 70(11), pp. 1837-1845.
Newman, C., Canagarajah, S. (2000). Non-farm employment, poverty, and gender linkages: evidence from Ghana and Uganda. Policy Research Working Paper 2367, The World Bank, Washington, D.C.
Newsham, A., Thomas, D. (2009). Agricultural Adaptation, Local Knowledge and Livelihoods Diversification in North-Central Namibia. Tyndall Working Paper 140.
Nhemachena C., Hassan R. (2007). Micro-level analysis of farmers’ adaptation to climate change in Southern Africa. IFPRI Discussion Paper No. 00714. International Food Policy Research Institute, Washington, DC.
Niang, I., O.C. Ruppel, M.A. Abdrabo, A. Essel, C. Lennard, J. Padgham, and P. Urquhart (2014). Africa. In: Climate Change 2014: Impacts, Adaptation, and Vulnerability. Part B: Regional Aspects. Contribution of Working Group II to the Fifth Assessment Report of the Intergovernmental Panel on Climate Change [Barros, V.R., C.B. Field, D.J. Dokken, M.D. Mastrandrea, K.J. Mach, T.E. Bilir, M. Chatterjee, K.L. Ebi, Y.O. Estrada, R.C. Genova, B. Girma, E.S. Kissel, A.N. Levy, S. MacCracken, P.R. Mastrandrea, and L.L.White (eds.)]. Cambridge University Press, Cambridge, United Kingdom and New York, NY, USA, pp. 1199-1265.
Nin-Pratt A, Johnson M. E., Yu B. (2012). Improved performance of agriculture in Africa South of the Sahara: Taking off or bouncing back? IFPRI discussion papers 1224, International Food Policy Research Institute (IFPRI).
Noble, I.R., S. Huq, Y.A. Anokhin, J. Carmin, D. Goudou, F.P. Lansigan, B. Osman-Elasha, and A. Villamizar (2014). Adaptation needs and options. In: Climate Change 2014: Impacts, Adaptation, and Vulnerability. Part A: Global and Sectoral Aspects. Contribution of Working Group II to the Fifth Assessment Report of the Intergovernmental Panel on Climate Change [Field, C.B., V.R. Barros, D.J. Dokken, K.J. Mach, M.D. Mastrandrea, T.E. Bilir, M. Chatterjee, K.L. Ebi, Y.O. Estrada, R.C. Genova, B. Girma, E.S. Kissel, A.N. Levy, S. MacCracken, P.R. Mastrandrea, and L.L.White (eds.)]. Cambridge University Press, Cambridge, United Kingdom and New York, NY, USA, pp. 833-868.
38
Noble, I.R., S. Huq, Y.A. Anokhin, J. Carmin, D. Goudou, F.P. Lansigan, B. Osman-Elasha, and A. Villamizar (2014). Adaptation needs and options. In: Climate Change 2014: Impacts, Adaptation, and Vulnerability. Part A: Global and Sectoral Aspects. Contribution of Working Group II to the Fifth Assessment Report of the Intergovernmental Panel on Climate Change [Field, C.B., V.R. Barros, D.J. Dokken, K.J. Mach, M.D. Mastrandrea, T.E. Bilir, M. Chatterjee, K.L. Ebi, Y.O. Estrada, R.C. Genova, B. Girma, E.S. Kissel, A.N. Levy, S. MacCracken, P.R. Mastrandrea, and L.L.White (eds.)]. Cambridge University Press, Cambridge, United Kingdom and New York, NY, USA, pp. 833-868.
Novella N. S., Thiaw W. M. (2013). African Rainfall Climatology Version 2 for Famine Early Warning Systems. Journal of Applied Meteorology and Climatology, vol. 52, pp. 588-606.
Olsson, L., M. Opondo, P. Tschakert, A. Agrawal, S.H. Eriksen, S. Ma, L.N. Perch, and S.A. Zakieldeen (2014). Livelihoods and poverty. In: Climate Change 2014: Impacts, Adaptation, and Vulnerability. Part A: Global and Sectoral Aspects. Contribution of Working Group II to the Fifth Assessment Report of the Intergovernmental Panel on Climate Change [Field, C.B., V.R. Barros, D.J. Dokken, K.J. Mach, M.D. Mastrandrea, T.E. Bilir, M. Chatterjee, K.L. Ebi, Y.O. Estrada, R.C. Genova, B. Girma, E.S. Kissel, A.N. Levy, S. MacCracken, P.R. Mastrandrea, and L.L.White (eds.)]. Cambridge University Press, Cambridge, United Kingdom and New York, NY, USA, pp. 793-832
Olsson, L., M. Opondo, P. Tschakert, A. Agrawal, S.H. Eriksen, S. Ma, L.N. Perch, and S.A. Zakieldeen (2014). Livelihoods and poverty. In: Climate Change 2014: Impacts, Adaptation, and Vulnerability. Part A: Global and Sectoral Aspects. Contribution of Working Group II to the Fifth Assessment Report of the Intergovernmental Panel on Climate Change [Field, C.B., V.R. Barros, D.J. Dokken, K.J. Mach, M.D. Mastrandrea, T.E. Bilir, M. Chatterjee, K.L. Ebi, Y.O. Estrada, R.C. Genova, B. Girma, E.S. Kissel, A.N. Levy, S. MacCracken, P.R. Mastrandrea, and L.L.White (eds.)]. Cambridge University Press, Cambridge, United Kingdom and New York, NY, USA, pp. 793-832.
Omer A., Pascual U. Russell N. P. (2007). Biodiversity Conservation and Productivity in Intensive Agricultural Systems. Journal of Agricultural Economics, Vol. 58, No. 2, pp. 308–329
Osman-Elasha, B., N. Goutbi, E. Spanger-Siegfried, B. Dougherty , A. Hanafi , S. Zakieldeen, A. Sanjak, H. Atti and H. Elhassan (2006). Adaptation strategies to increase human resilience against climate variability and change: Lessons from the arid regions of Sudan. AIACC Working Paper 42, International START Secretariat, Washington, District of Columbia, 42 pp.
Parry M.L., Rosenzweig C., Iglesias A., Livermore M., Fischer G. (2004). Effects of climate change on global food production under SRES emissions and socio- economic scenarios. Global Environmental Change , vol. 14, pp. 53–67.
Pascual U., Perrings C. (2007). Developing incentives and economic mechanisms for in situ biodiversity conservation in agricultural landscapes. Agriculture, Ecosystems & Environment, Vol. 121(3), pp. 256–268.
Pingali, P., Rosegrant, M. (1995). Agricultural commercialization and diversification: processes and polices. Food Policy 20(3): 171-185.
Quisumbing A. R. (1996). Male-female differences in agricultural productivity: Methodological issues and empirical evidence. World Development, Vol. 24(10), pp. 1579-1595.
Perrings C., Jackson L., Bawa K., Brussaard L., Brush S., Gavin T., Papa R., Pascual U., De Ruiter P. (2006). Biodiversity in agricultural landscapes: saving natural capital without losing interest. Conservation Biology, vol. 20(2), pp. 263-264.
Reardon T. (1997). Using evidence of household income diversification to inform study of the rural nonfarm labor market in Africa. World Development, Vol. 25(5), pp. 735-747.
39
Reardon T., Taylor J. E. (1996). Agroclimatic shock, income inequality, and poverty: Evidence from Burkina Faso. World Development, Vol. 24(5), pp. 901-914.
Reardon T., Vosti S. (1995). Links between rural poverty and the environment in developing countries: Asset categories and investment poverty. World Development, Vol. 23(9), pp. 1495-1506.
Reardon T., Berdegue J., Barrett C. B., Stamoulis K. (2006). Household Income diversication into rural non-farm activities. In: S. Haggblade, P. Hazell and T. Reardon (Eds.) Transforming the Rural Nonfarm Economy, Johns Hopkins University Press, Baltimore.
Rosegrant MW, Cline SA (2003). Global food security: challenges and policies. Science Vol. 302, pp. 1917-1919.
Rosegrant, M., Cline, S. (2003). Global food security: Challenges and policies. Science, pp. 1917-1919.
Sanderson, M.G., D.L. Hemming, and R.A. Betts, (2011). Regional temperature and precipitation changes under warming. Philosophical Transactions of the Royal Society A, 369(1934), 85-98.
Seo S., Mendelsohn R., Dinar A., Hassan R., Kurukulasuriya P. (2009). A Ricardian analysis of the distribution of climate change impacts on agriculture across agro- ecological zones in Africa. Environmental and Resource Economics 43(3): 313-332.
Shanahan T.M. (2009). Atlantic forcing of persistent drought in West Africa. Science, Vol. 324, pp. 377–380.
Shiferaw B., Menale K., Moti J., Chilot Y. (2013). Adoption of improved wheat varieties and impacts on household food security in Ethiopia. Food Policy.
Smit, B., O. Pilifosova, I. Burton, B. Challenger, S. Huq, R.J.T. Klein, and G. Yohe, (2001). Adaptation to climate change in the context of sustainable development and equity. In: Climate Change 2001: Impacts, Adaptation, and Vulnerability. Contribution of Working Group II to the Third Assessment Report of the Intergovernmental Panel on Climate Change [McCarthy, J.J., O.F. Canziani, N.A. Leary, D.J. Dokken, and K.S. White (eds.)]. Cambridge University Press, Cambridge, UK and New York, NY, USA, pp. 877-912.
Snorek J, Renaud F. G., Kloos J. (2014). Divergent adaptation to climate variability: A case study of pastoral and agricultural societies in Niger. Global Environmental Change 29, pp. 371–386.
Teklewold H., Kassie M. Shiferaw B., Köhlin G. (2013). Cropping system diversification, conservation tillage and modern seed adoption in Ethiopia: Impacts on household income, agrochemical use and demand for labour. Ecological Economics, Vol. 93(C), pp. 85-93.
Tol, R., Yohe, G., (2007). The weakest link hypothesis for adaptive capacity: an empirical test. Global Environ. Change 17, 218–227.
Toya H., Skidmore M. (2007). Economic development and the impacts of natural disasters. Economic Letters, 94 (1), pp. 20-25.
USGS (2012). A Climate Trend Analysis of Niger. USGS Fact Sheet 2012-3080.
Wani S. P., Sreedevi T. K., Rockstrom J., Ramakrishna Y. S. (2009). Rainfed agriculture – Past trends and future prospects. In “Rainfed agriculture. Unlocking the potential.”, edited by Wani S. P., ., Rockstrom J. and Oweis T. CAB International, Wallingford (UK).
Whitehead A., Kabeer N. (2001). Living with uncertainty: gender, livelihood and pro-poor growth in rural sub-Saharan Africa. IDS Working Paper 134, Brighton, Sussex.
40
Williams, J.W., Jackson, S.T., et al., (2007). Projected distributions of novel and disappearing climates by 2100 AD. Proceedings of the National Academy of Sciences of United States of America 104 (14), 5738.
World Bank (2013). Turn Up the Heat. Climate Extremes, Regional Impacts, and the Case for Resilience World Bank, Washington, DC
World Bank (2013). Turn Up the Heat. Climate Extremes, Regional Impacts, and the Case for Resilience World Bank, Washington, DC.
World Meteorological Organization (WMO) (2012). Standardized Precipitation Index, User Guide. WMO No. 1090.
Yohe G., Tol R. (2002). Indicators for social and economic coping capacity – moving toward a working definition of adaptive capacity. Global Environ. Change 12 (1), 25–40.
Zellner A. (1962). An efficient method of estimating seemingly unrelated regression equations and tests for aggregation bias. Journal of the American Statistical Association, Vol. 57, pp. 348–368.
Zellner A. (1963). Estimators for seemingly unrelated regression equations: some exact finite sample results. Journal of the American Statistical Association, Vol. 58, pp. 977-992.
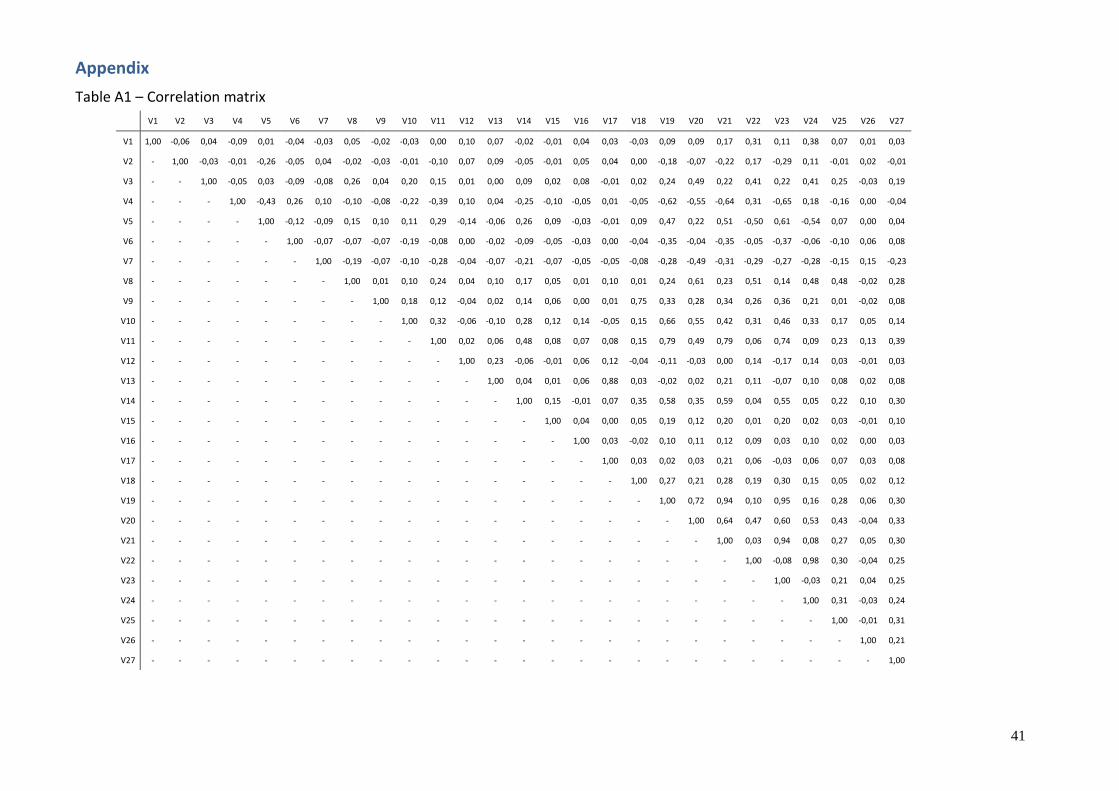
41
Appendix
Table A1 – Correlation matrix
V1 V2 V3 V4 V5 V6 V7 V8 V9 V10 V11 V12 V13 V14 V15 V16 V17 V18 V19 V20 V21 V22 V23 V24 V25 V26 V27
V1 1,00 -0,06 0,04 -0,09 0,01 -0,04 -0,03 0,05 -0,02 -0,03 0,00 0,10 0,07 -0,02 -0,01 0,04 0,03 -0,03 0,09 0,09 0,17 0,31 0,11 0,38 0,07 0,01 0,03
V2 - 1,00 -0,03 -0,01 -0,26 -0,05 0,04 -0,02 -0,03 -0,01 -0,10 0,07 0,09 -0,05 -0,01 0,05 0,04 0,00 -0,18 -0,07 -0,22 0,17 -0,29 0,11 -0,01 0,02 -0,01
V3 - - 1,00 -0,05 0,03 -0,09 -0,08 0,26 0,04 0,20 0,15 0,01 0,00 0,09 0,02 0,08 -0,01 0,02 0,24 0,49 0,22 0,41 0,22 0,41 0,25 -0,03 0,19
V4 - - - 1,00 -0,43 0,26 0,10 -0,10 -0,08 -0,22 -0,39 0,10 0,04 -0,25 -0,10 -0,05 0,01 -0,05 -0,62 -0,55 -0,64 0,31 -0,65 0,18 -0,16 0,00 -0,04
V5 - - - - 1,00 -0,12 -0,09 0,15 0,10 0,11 0,29 -0,14 -0,06 0,26 0,09 -0,03 -0,01 0,09 0,47 0,22 0,51 -0,50 0,61 -0,54 0,07 0,00 0,04
V6 - - - - - 1,00 -0,07 -0,07 -0,07 -0,19 -0,08 0,00 -0,02 -0,09 -0,05 -0,03 0,00 -0,04 -0,35 -0,04 -0,35 -0,05 -0,37 -0,06 -0,10 0,06 0,08
V7 - - - - - - 1,00 -0,19 -0,07 -0,10 -0,28 -0,04 -0,07 -0,21 -0,07 -0,05 -0,05 -0,08 -0,28 -0,49 -0,31 -0,29 -0,27 -0,28 -0,15 0,15 -0,23
V8 - - - - - - - 1,00 0,01 0,10 0,24 0,04 0,10 0,17 0,05 0,01 0,10 0,01 0,24 0,61 0,23 0,51 0,14 0,48 0,48 -0,02 0,28
V9 - - - - - - - - 1,00 0,18 0,12 -0,04 0,02 0,14 0,06 0,00 0,01 0,75 0,33 0,28 0,34 0,26 0,36 0,21 0,01 -0,02 0,08
V10 - - - - - - - - - 1,00 0,32 -0,06 -0,10 0,28 0,12 0,14 -0,05 0,15 0,66 0,55 0,42 0,31 0,46 0,33 0,17 0,05 0,14
V11 - - - - - - - - - - 1,00 0,02 0,06 0,48 0,08 0,07 0,08 0,15 0,79 0,49 0,79 0,06 0,74 0,09 0,23 0,13 0,39
V12 - - - - - - - - - - - 1,00 0,23 -0,06 -0,01 0,06 0,12 -0,04 -0,11 -0,03 0,00 0,14 -0,17 0,14 0,03 -0,01 0,03
V13 - - - - - - - - - - - - 1,00 0,04 0,01 0,06 0,88 0,03 -0,02 0,02 0,21 0,11 -0,07 0,10 0,08 0,02 0,08
V14 - - - - - - - - - - - - - 1,00 0,15 -0,01 0,07 0,35 0,58 0,35 0,59 0,04 0,55 0,05 0,22 0,10 0,30
V15 - - - - - - - - - - - - - - 1,00 0,04 0,00 0,05 0,19 0,12 0,20 0,01 0,20 0,02 0,03 -0,01 0,10
V16 - - - - - - - - - - - - - - - 1,00 0,03 -0,02 0,10 0,11 0,12 0,09 0,03 0,10 0,02 0,00 0,03
V17 - - - - - - - - - - - - - - - - 1,00 0,03 0,02 0,03 0,21 0,06 -0,03 0,06 0,07 0,03 0,08
V18 - - - - - - - - - - - - - - - - - 1,00 0,27 0,21 0,28 0,19 0,30 0,15 0,05 0,02 0,12
V19 - - - - - - - - - - - - - - - - - - 1,00 0,72 0,94 0,10 0,95 0,16 0,28 0,06 0,30
V20 - - - - - - - - - - - - - - - - - - - 1,00 0,64 0,47 0,60 0,53 0,43 -0,04 0,33
V21 - - - - - - - - - - - - - - - - - - - - 1,00 0,03 0,94 0,08 0,27 0,05 0,30
V22 - - - - - - - - - - - - - - - - - - - - - 1,00 -0,08 0,98 0,30 -0,04 0,25
V23 - - - - - - - - - - - - - - - - - - - - - - 1,00 -0,03 0,21 0,04 0,25
V24 - - - - - - - - - - - - - - - - - - - - - - - 1,00 0,31 -0,03 0,24
V25 - - - - - - - - - - - - - - - - - - - - - - - - 1,00 -0,01 0,31
V26 - - - - - - - - - - - - - - - - - - - - - - - - - 1,00 0,21
V27 - - - - - - - - - - - - - - - - - - - - - - - - - - 1,00
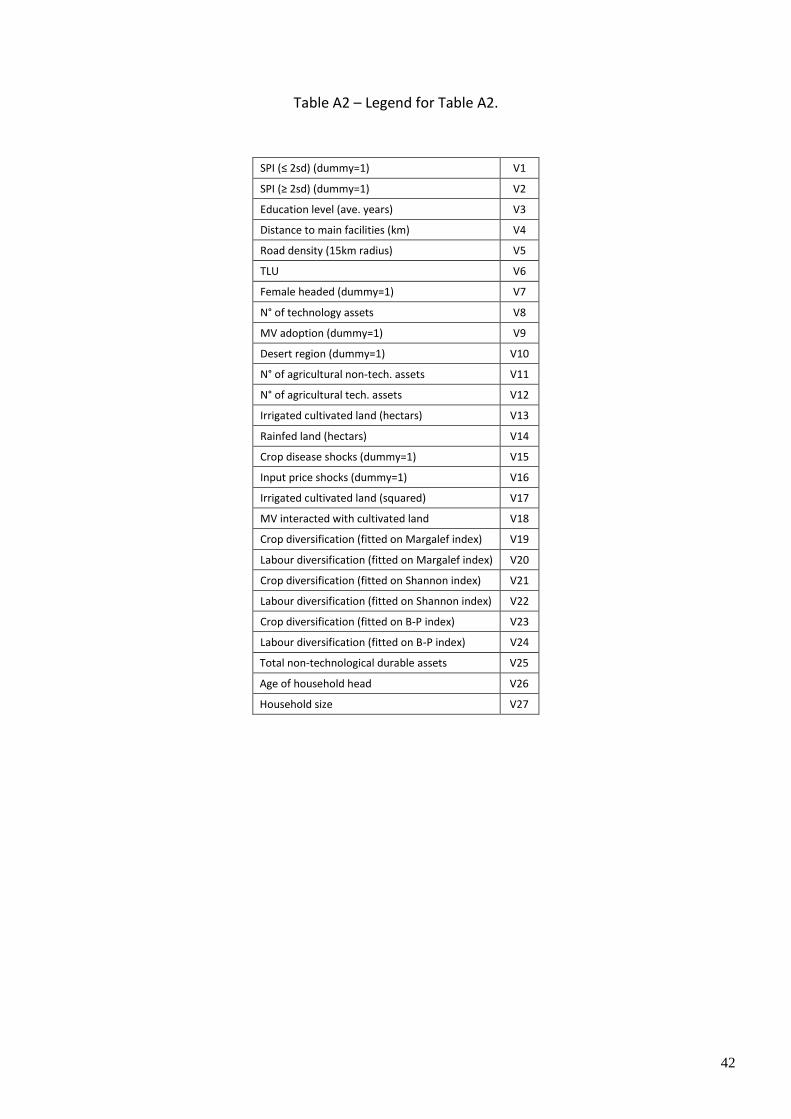
42
Table A2 – Legend for Table A2.
SPI (≤ 2sd) (dummy=1) V1
SPI (≥ 2sd) (dummy=1) V2
Education level (ave. years) V3
Distance to main facilities (km) V4
Road density (15km radius) V5
TLU V6
Female headed (dummy=1) V7
N° of technology assets V8
MV adoption (dummy=1) V9
Desert region (dummy=1) V10
N° of agricultural non-tech. assets V11
N° of agricultural tech. assets V12
Irrigated cultivated land (hectars) V13
Rainfed land (hectars) V14
Crop disease shocks (dummy=1) V15
Input price shocks (dummy=1) V16
Irrigated cultivated land (squared) V17
MV interacted with cultivated land V18
Crop diversification (fitted on Margalef index) V19
Labour diversification (fitted on Margalef index) V20
Crop diversification (fitted on Shannon index) V21
Labour diversification (fitted on Shannon index) V22
Crop diversification (fitted on B-P index) V23
Labour diversification (fitted on B-P index) V24
Total non-technological durable assets V25
Age of household head V26
Household size V27

43

ESA Working Papers
WORKING PAPERS
The ESA Working Papers are produced by the Agricultural Development Economics
Division (ESA) of the Economic and Social Development Department of the Food
and Agriculture Organization of the United Nations (FAO). The series presents ESA’s
ongoing research. Working papers are circulated to stimulate discussion
and comments. They are made available to the public through the Division’s website.
The analysis and c onclusions are those of the authors and do not indicate
concurrence by FAO.
AGRICULTURAL DEVELOPMENT ECONOMICS
Agricultural Development Economics (ESA) is FAO’s focal point for economic research
and policy analysis on issues relating to world food security and sustainable
development. ESA contributes to the generation of knowledge and evolution of scientific
thought on hunger and poverty alleviation through its economic studies publications
which include this working paper series as well as periodic and occasional publications.
Agricultural Development Economics (ESA) The Food and Agriculture Organization of the United Nations
Viale delle Terme di Caracalla 00153 Rome, Italy
Contact: Office of the Director
Telephone: +39 06 57054368 Facsimile: + 39 06 57055522
Website: http://www.fao.org/economic/esa/esa-home/en e-mail: [email protected]
I5533E/1/03.16