Embed Size (px)
Citation preview
Journal of Economics and Sustainable Development www.iiste.org
ISSN 2222-1700 (Paper) ISSN 2222-2855 (Online)
Vol.6, No.19, 2015
111
Diversification and performance of Ethiopian export: Based on
Extensive and Intensive margin measures1
Chalachew Abinet Asires
Research department, National Bank of Ethiopia, Sudan Street, Addis Ababa, Ethiopia
Abstract
Export is the main determinant of economic growth as well as achieving sustainable development in developing
countries like Ethiopia. Countries with good export performance can achieve economic growth by importing
capital goods. To identify whether Ethiopia’s export was well diversified or not both in market destination and
product diversification in this study Gini Hirschman Index was used. The result shows Ethiopia’s export had
increasing when we compare export as a percentage of GDP before and after regime change of 1992. But still it
is not good due to its volatility both international price and export volume over time and even decreasing for the
year 2011/12, 2012/13 and 2013/14. The Gini Hirschman Index result shows that there was export destination
countries diversification and still it shows improvement. There was moderate concentration on commodity
export between 2005/06 and 2007/08 but no concentration between the interval 2008/09 and 2013/14. But
service export was undiversified most of it was concentrated to transportation service export. Even if export
destination countries diversified it was undiversified on the continent level due to our export is still concentrated
to Europe and Asia even if there is development on export to Africa.
Key Words: Ethiopian export performance, Diversification, Gini Hirschman Index
1. INTRODUCTION
1.1. Background of the study
Growth of an economy is directly related to exports because if it increases at a faster pace as compared to
imports, nothing can stop an economy from being a developed one. On the other hand, the instability in exports
can adversely affects the process of economic development since if the export is stable investors invest on export
sectors which increase total economic development if the export sector is unstable investors are not willing to
invest of those sectors. Lower exports mean low foreign exchange availability and lower foreign exchange
availability in turn means a small purchasing capacity of a nation in the international market to import capital
goods which leads to decline the growth of a country.
Export also plays a great role for the stability and income distribution of a country by increasing employment
both directly from the exporting sector and indirectly to those sectors which produce inputs to the exporting
sector. The export sectors pay more than 18 percent as compared to other sectors, in addition to this; it increases
and improves productivity by increasing competition and technology transfer as stated by Riker David (2010).
Even though Ethiopia tries to diversify its export products and increasing its export volume still it is impossible
to minimize the current account balance deficit. Therefore, perceiving the Ethiopia’s export performance is
important since the development of export performance is crucial in supporting to import those machineries and
capital goods in order to increase the productivity of a country. Therefore this paper studies the performance of
Ethiopia’s export which increases the foreign exchange availability.
The main objective of this paper was to study the performance of Ethiopia’s export sector. While the specific
objectives are: To perceive export incentives given by the government, to identify the diversification of
Ethiopia’s export destinations and export products, to observe the developments Ethiopia’s export sector.
1 The views expressed in this document are those of the authors and do not necessarily reflect the views of the Organization.
Journal of Economics and Sustainable Development www.iiste.org
ISSN 2222-1700 (Paper) ISSN 2222-2855 (Online)
Vol.6, No.19, 2015
112
Export performance is the relative success or failure of the efforts of a country to sell domestically-produced
goods and services in other countries. Export diversification (extensive margin) is the changing of a country's
export structure (by diversifying either vertically or horizontally) and growth rate of export (intensive margin)
measures the improvement of export
2. LITERATURE
2.1. INCENTIVES PROVIDED BY GOVERNMENT TO ENCOURAGE EXPORT
There are various structural adjustments that have done by government on Ethiopia’s export sector to encourage
exporters. The following are some of the structural adjustments that have been done.
Devaluation of national currency increases competitiveness of exporters by exporting commodities abroad and
earning foreign exchange which has high value as compared to domestic currency. Therefore government
depreciates the exchange rate by five percent rate annually to encourage export sector by increasing
competitiveness of exporters in the international market. The Ethiopia’s exchange rate devaluation of year 2010
is one of the policy measure done by the government to encourage export sector and increase competitiveness of
exporters in the international market.
Abolishing of all export taxes (except coffee) and subsidies the government encourages exporters by providing
more incentives and subsidies which leads them to be more profitable and competent in the international market.
Exporting goods and services are a source of foreign exchange for those private and government sectors to
facilitate more growth. The Ethiopia’s government provides the following duty incentive schemes were
established by Proclamation 39/2001: Duty Draw-Back Scheme, Voucher Scheme and Bonded Manufacturing
Warehouse Scheme. The above incentives were revised again by proclamation no. 768/2012 on export trade duty
incentive schemes.
2.2. Empirical literature
Export is variously defined as the change in the composition of a country’s existing export product mix or export
destination (Salomon Samen, 2010; Ali, Alwang and Siegel, 1991). Many developing countries follow export led
growth strategy; export diversification is conceived as the progression from traditional to non-traditional exports.
By providing a broader base of exports diversification which enables to lower instability in export earnings and
enhance growth through improved technological capabilities via broad scientific and technical training as well as
learning by doing, facilitation of forward and backward linkages. Developing countries have been struggling
with the challenge of expanding and diversifying their export baskets for a long time. When export is
concentrated in a few primary commodities, there can be serious economic and political risks by reducing
foreign exchange earning which are relevant to those developing which leads scarcity of machineries. Due to that
unemployment increases and the country may become politically unstable therefore export diversification aims
at mitigating these economic and political risks.
Hossain M. and Chowdhury A. (2012) studied on the pattern and determinants of export diversification in
Bangladesh. To measure export diversification three indexes were used Hirschman index, Ogive index and
entropy coefficient. The Analyses, robust evidence has been found across the specifications and Indicators that
the export basket of Bangladesh has continued to remain relatively undiversified. They reveals in their study that
the export growth and overall economic growth are highly correlated and a robust restructuring in trade policy is
needed for gaining momentum in diversification of export in Bangladesh. The analyses show that exports at the
intensive margin account for the most important share of overall trade growth. At the extensive margin,
geographic diversification is more important than product diversification, especially for developing countries
because geographic diversification increases export growth by 18 percent but product diversification only
increases by one percent Evenett and Venables (2002).
Erkan B. (2014) studied on turkey’s product and market diversification using different concentration ratio
measures Gini Hirschman index was the one which are mostly used to measure market (geographical
destination) and product diversification. The difference from other Authors is that Birol multiplied the Gini
Hirschman index by 100 to change it in to percentage and compares the diversification of product and market
within the interval between zero and one hundred but others (like Michael L. Wyzan (1999), James Love (2005))
do not multiplied by one hundred rather compare its diversification between the specified interval above. The

Journal of Economics and Sustainable Development www.iiste.org
ISSN 2222-1700 (Paper) ISSN 2222-2855 (Online)
Vol.6, No.19, 2015
113
value approach to zero refers low concentration (diversified) and approach to one hundred refers to high
concentration (undiversified). Finally using Gini Hirschman index Erkan found that there was a successful
market diversification and no product diversification.
Michael L. Wyzan (1999) studied on Macedonian and Slovenian Trade after the Break-up of Former
Yugoslavia: Focus on the European Union using Gini Hirschman show that Macedonian trade was more
concentrated on both the export and import sides than Slovenian trade. Both countries have more concentrated
exports than the Czech Republic (perhaps due to their smaller size), while Slovenia’s trade concentration was
similar to Slovakia’s. Macedonia’s concentration was high by any standard and has risen substantially during the
1990s. Slovenia (along with the two Czechoslovak successor states) falls between Germany and Greece in export
concentration. On the import side, the tendency for seemingly less developed countries to exhibit greater
concentration is present but much weaker.
James Love (2005) studied on the concentration and export instability using Gini Hirschman index. James Love
uses Gini Hirschman index to measure export concentration for 52 developing countries. The final finding shows
that countries with high concentration are unstable and those low concentrations are more stable with this result
James argue that there is a relationship between concentration and instability of export earnings.
3. METHODOLOGY
There are various ways to measure export performance. Among those measures export diversification (extensive
margin) and export sales growth rate measures the common measures. The most commonly used measure of
export diversification is the Concentration Ratio (Product or geographic concentration) was used. Several
measures have been developed to estimate concentration ratios (Attaran, M and Zwick, M, 1987; ECA, 2006).
These include: the Hirschman index, Gini Hirschman index, the Ogive index, the entropy index, the Herfindahl
index and the Aggregate Specialization Index. These measures are conceptually quite similar, and their
approaches, which compare actual distributions to a hypothetical uniform distribution, have been proven to
provide quite comparable ranking.
The Gini Hirschman Index (GHI) method is a type of concentration ratio method which is the most widely
used to measure export diversification (concentration). It is the index that would result if a country’s export
receipts were divided evenly among different commodities or different destinations. Its formula written as
follows:
∑=
=
N
i
i
X
xGHI
1
2)(
Where xi is the export value of a specific commodity i, X the country’s total export and N represents the number
of commodities exported. A higher GHI indicates greater concentration of exports on a few commodities. The
values of the concentration ratio (GHI) 0< GHI <1 determines how export of a country is diversified. An index
value greater than 0.5 represents extreme concentration, value between 0.4 and 0.5 represents moderate
concentration and the value less than 0.4 represents that the export is less concentrated (diversified). When
export diversification in the case of destination the only difference is that the export value of a specific
commodity represents a specific export destination country and N represents the number of export destination
countries but X represents the same that is the total export earning value. In addition to Gini Hirschman index in
this research trend analysis, measure of central tendency (Average), percentiles and charts were used.
There are various ways to measure export performance on intensive margin among those measures the most two
common measures ratio of aggregated export sales to total sales and export sales growth which is calculated
from the growth rate of export over the time period included Luis Filipe L. (2000). In this paper the export sales
growth was used to examine the export performance of Ethiopia
4. RESULT AND ANALYSIS
4.1. Development of Ethiopia’s export
There are factors that determine the export performance of a country. These factors are level of development of
the economy, policies, strategies pursued, export structure resource endowments and others.

Journal of Economics and Sustainable Development www.iiste.org
ISSN 2222-1700 (Paper) ISSN 2222-2855 (Online)
Vol.6, No.19, 2015
114
Ethiopia’s total export proceeds during FY2012/13 amounted to USD 3.1 billion, down by 2.5 percent vis-à-vis
the previous fiscal year. This export performance is attributed largely to the decreased earnings from export
owing to the fall in global commodity prices and/decreased volume of exports. Total export proceeds during
2013/14 amounted to USD 3.3 billion showing a 5.6 percent moderate growth vis-à-vis the previous fiscal year.
This export growth was achieved through increased earnings from owing to higher global commodity prices
and/or increased in volume of exports (NBE annual report 2012/13, 2013/14 ). In order to see Ethiopia’s export
development total export (total good export + total service export) as a percentage of total income was discussed.
Figure 2 Ethiopia’s export developments as a percentage of GDPM (tx/GDPM)
The above figure 1 shows that the ratio of export to gross domestic product at market price was lowest at year
1992 which indicates regime change. In addition to 1992 Ethiopia’s export development total export as ratio of
gross domestic product at market price shows minimum value at year 2000 and year 2009. This was due to
Ethiopia and Eritrean war and financial crisis which affects export from supply side and demand side
respectively. That is at the time of war between Ethiopia and Eritrea there was no confidence on exporters to
export more and increase foreign earning due to their expectation that they think they may lose their export
earnings due to bedlam. While on the other hand at the time of world financial crisis world demand declines for
export of goods abroad since their income is not certain at the time. To generalize Ethiopia’s export development
over its income which expressed as a ratio of export to gross domestic product was taken but the result shows
that Ethiopia’s export of goods and services does not have well done rather it shows volatility over the time
horizon included. The researcher also understands that Ethiopia’s export (tx) to gross domestic product at market
price (GDPM) shows declining for recent years for year 2012, 2013 and 2014. This result is not in line with
Ethiopia’s government plan which follows export lead growth strategy by increasing export as ratio of GDPM.
Figure 3 Ethiopia’s export growth rates in percent for major groups
The above figure shows that the growth rate of export for real export of coffee (RXCOF), real export of non
factor service (RXNFBOP) and real export of non coffee (RXNCOF) was volatile which shows on some years it
were negative and on the other years it were positive. This instability of export has impacts on economic
development. From figure two we conclude the performance of Ethiopian export is not good due to its volatility.

Journal of Economics and Sustainable Development www.iiste.org
ISSN 2222-1700 (Paper) ISSN 2222-2855 (Online)
Vol.6, No.19, 2015
115
4.2. Comparison of Ethiopia’s export performance with growth and transformation plan (GTP)
When we compare the performance of Ethiopia’s export of goods with its GTP target from table 1 below it
shows poor performance. That is the target value from export of goods is not achieved which is very far from the
targeted value. When we see one by one for major selected commodities: coffee export was achieved 122
percent which is greater by 22 percent than the targeted value for year 2010/11. But for the consecutive years it
is beneath than the target value which accounts 92, 63, and 27 percent respectively. The result of achievement
for the three years shows declines as compared to the targeted value. For oilseeds also there is a gap between the
targets of volume export as well value earned. The value earned from export was 73,85,62 and 73 percent for
year 2010/11 to the next three consecutive years respectively achieved as compared to the GTP target.
For pulses also there is a gap between the targeted of volume export as well value earned. The value earned from
export was 73, 57, 57 and 42 percent for 2010/11 and the three consecutive years respectively achieved as
compared to the GTP target.
Table 1 Comparison of GTP target and achievement of value earning from export
earn
ing
fro
m i
nd
icat
ors
in
mln
US
D
Year 2010/11 2011/12
Target achieved %achieved Target achieved %achieved
Coffee 692 845 122 906 836 92
Oilseeds 450 328 73 565 478 85
Pulses 190 139 73 279 160 57
live animals and meat 189 212 112 287 285 99
flowers 214 177 83 269 197 73
vegetable and fruits 63 32 51 123 45 37
Spices 20 35 175 22 36 164
sugar export 41 0 0
leather and leather
product industry
191 105 55 296 118 40
Textile 100 62 62 200 85 43
gold, tantalum 146 497 340 158 664 420
earn
ing
fro
m i
nd
icat
ors
in
mln
US
D
Year 2012/13 2013/14
Target achieved %achieved Target achieved %achieved
Coffee 1187 746 63 1555 418 27
Oilseeds 710 439 62 892 654 73
Pulses 410 233 57 601 251 42
live animals and meat 435 240 55 660 261 40
flowers 338 186 55 425 200 47
vegetable and fruits 244 44 18 480 48 10
Spices 25 30 120 27 29 107
sugar export 116 0 0 245 0 0
leather and leather
product industry
352 136 39 417 154 37
Textile 450 97 22 700 110 16
gold, tantalum 165 666 404 202 664 329
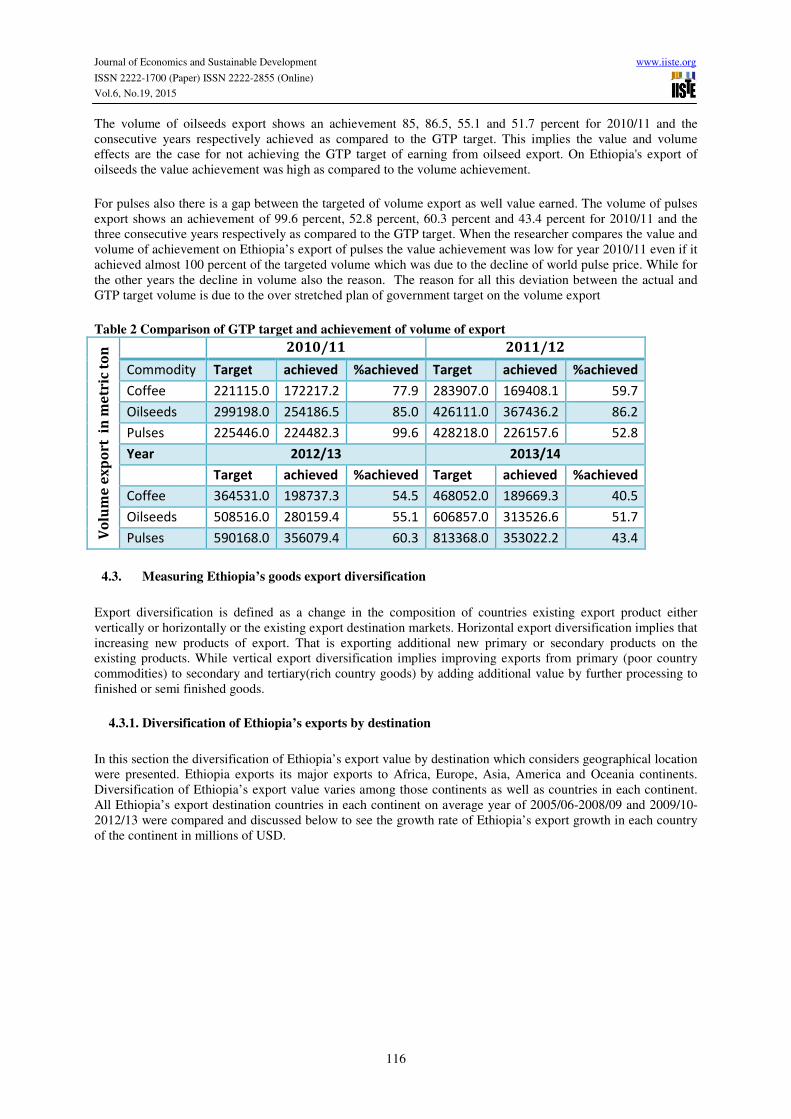
To be more elite the researcher perceives whether it is a price effect or the decline volume of export. The table 2
below shows that the volume of coffee export was declines from year to year as compared to the GTP target. The
achievement of volume of coffee export on year 2010/11 was 77.9 percent which was below than the target value
but the value earned was 122 percent which is a great achievement due to increasing the world coffee price but
not because of its good performance. The volume of coffee export for the next consecutive years also declines to
59.7 percent, 54.5 percent and 40.5 percent respectively from its target value which shows a great deviation as
compared to the target volume of coffee export.
Journal of Economics and Sustainable Development www.iiste.org
ISSN 2222-1700 (Paper) ISSN 2222-2855 (Online)
Vol.6, No.19, 2015
116
The volume of oilseeds export shows an achievement 85, 86.5, 55.1 and 51.7 percent for 2010/11 and the
consecutive years respectively achieved as compared to the GTP target. This implies the value and volume
effects are the case for not achieving the GTP target of earning from oilseed export. On Ethiopia's export of
oilseeds the value achievement was high as compared to the volume achievement.
For pulses also there is a gap between the targeted of volume export as well value earned. The volume of pulses
export shows an achievement of 99.6 percent, 52.8 percent, 60.3 percent and 43.4 percent for 2010/11 and the
three consecutive years respectively as compared to the GTP target. When the researcher compares the value and
volume of achievement on Ethiopia’s export of pulses the value achievement was low for year 2010/11 even if it
achieved almost 100 percent of the targeted volume which was due to the decline of world pulse price. While for
the other years the decline in volume also the reason. The reason for all this deviation between the actual and
GTP target volume is due to the over stretched plan of government target on the volume export
Table 2 Comparison of GTP target and achievement of volume of export
Vo
lum
e e
xp
ort
in
me
tric
to
n 2010/11 2011/12
Commodity Target achieved %achieved Target achieved %achieved
Coffee 221115.0 172217.2 77.9 283907.0 169408.1 59.7
Oilseeds 299198.0 254186.5 85.0 426111.0 367436.2 86.2
Pulses 225446.0 224482.3 99.6 428218.0 226157.6 52.8
Year 2012/13 2013/14
Target achieved %achieved Target achieved %achieved
Coffee 364531.0 198737.3 54.5 468052.0 189669.3 40.5
Oilseeds 508516.0 280159.4 55.1 606857.0 313526.6 51.7
Pulses 590168.0 356079.4 60.3 813368.0 353022.2 43.4
4.3. Measuring Ethiopia’s goods export diversification
Export diversification is defined as a change in the composition of countries existing export product either
vertically or horizontally or the existing export destination markets. Horizontal export diversification implies that
increasing new products of export. That is exporting additional new primary or secondary products on the
existing products. While vertical export diversification implies improving exports from primary (poor country
commodities) to secondary and tertiary(rich country goods) by adding additional value by further processing to
finished or semi finished goods.
4.3.1. Diversification of Ethiopia’s exports by destination
In this section the diversification of Ethiopia’s export value by destination which considers geographical location
were presented. Ethiopia exports its major exports to Africa, Europe, Asia, America and Oceania continents.
Diversification of Ethiopia’s export value varies among those continents as well as countries in each continent.
All Ethiopia’s export destination countries in each continent on average year of 2005/06-2008/09 and 2009/10-
2012/13 were compared and discussed below to see the growth rate of Ethiopia’s export growth in each country
of the continent in millions of USD.

Journal of Economics and Sustainable Development www.iiste.org
ISSN 2222-1700 (Paper) ISSN 2222-2855 (Online)
Vol.6, No.19, 2015
117
51.33
11.060.04
3.24
0.02
0.82
0.13
0.02
19.92
53.29 4.22
50.92
0.25
0.12
0.10
0.03
4.56
80.17
40.670.23
8.24
1.03
0.00
0.25
0.16
0.00
251.24 25.10
130.97
0.23
0.78
0.01
0.18
10.49
average(2005/06-2008/09) average(2009/10-2012/13)
Figure 4 Diversification of Ethiopia’s export value by destination for African countries
The above figure 3 shows that the value of earning from exporting in millions of USD increases for most
countries on average between 2005/06-2008/09 and 2009/10-2012/13 specially for Somalia from 53.29 million
USD to 251.24 USD which shows more than fourth fold growth, for Djibouti it rises from 51.33 million USD to
80.17 million USD, for Egypt from 11.06 million to 40.67 million USD and for Sudan from 50.92 million to
130.97 million USD. These indicate the value of export earning highly increased from Somalia, Djibouti, Egypt
and Sudan. There are also other countries like Ghana, Kenya, Libya, Nigeria, Rwanda, South Africa, Uganda and
Zimbabwe shows an increment of Ethiopia’s earning from export. But on the other hand there are countries that
show Ethiopia’s value earning from export declines these are Somaliland, Zambia, Morocco and Tanzania. As
we see the overall effect between the two horizons export earnings increases on average from 2005/06-2008/09
to 2009/10-2012/13 in African countries.
0.06
39.03
0.61
0.27
0.55
0.93 2.52
20.33
128.41
10.62
0.45
0.17
66.46
79.65
1.49
0.98
10.19
1.78
3.67
5.9893.62
28.73
0.24
37.99
3.57
0.05
2.44
0.17
59.88
1.81
0.06
0.42
1.394.83
39.42
262.72
7.88
0.88
0.12
74.40
176.51
6.65
0.61
1.59
3.29
10.45
24.70
460.59
47.60
0.11
51.34
9.86
0.00
7.06
average(2005/06-2008/09) average(2009/10-2012/13)
Figure 5 Diversification of Ethiopia’s export value by destination for Europe countries

Journal of Economics and Sustainable Development www.iiste.org
ISSN 2222-1700 (Paper) ISSN 2222-2855 (Online)
Vol.6, No.19, 2015
118
From the above figure 4 the researcher could understand that the value of Ethiopia export earnings from some
European countries increase and on the other hand on some it decreases in millions of USD on average for year
2005/06 to 2008/09 and 2009/10 to 2012/13. The value earning from export increases for Switzerland from
93.62 million USD to 460.59 millions of USD, for Netherlands 79.65 million to 176.51 million USD, for
Belgium from 39.03 million to 59.88 million USD, for Germany from 128.41 million to 262.72 million USD
which shows the largest share of export in European countries. In addition to above four countries there were
other countries which show an increase of Ethiopia’s value earning from export to those countries. There are
other countries which show the decline of Ethiopia’s export value earning. These were Cyprus, Czechoslovakia,
Greece, Ireland, Poland, Yugoslavia, Ukraine and Portugal but the decline was small as compared to those
countries which increases the value of earning from export from European countries in millions of USD.
Figure 6 Diversification of Ethiopia’s export value by destination for American countries
The above figure 5 shows that the value of export earnings gain from the American continent both from North
and South America was dominated by united states which shows the largest share both for an average value of
(2005/06 to 2008/09) and (2009/10 to 2012/13). The average values for these periods were 68.35 and 99.61
millions of USD respectively. Next to United States of America the value of earning also increases for Canada
and Mexico which shows an increment from 7.45 million to 9.13 million USD and from 0.9 million to 1.6
million USD respectively. But on the other hand the export value earning declines for Brazil and Cuba but as
compared to the increase United States of America, Canada and Mexico it is less significant.
112.17
1.22 4.06 13.28 1.9733.40
62.04
1.44 4.62 0.27 1.38 3.70 9.79
90.57
9.2427.16
1.73
43.5223.62
261.93
7.0820.1832.83
12.10
64.15
49.39
1.5214.29 1.87 2.24 1.11
28.72
154.30
3.73
20.81
6.35
77.06
50.21
average(2005/06-2008/09) average(2009/10-2012/13)
Figure 7 Diversification of Ethiopia’s export value by destination for Asian countries
The above figure 6 shows that the value of earnings from export increases for most Asian countries except some.
The value export gained from China, Mainland increases from 112.17 to 261.93 million US dollar, from Saudi
Arabia it increases from 90.57 to 154.3 millions of USD, from United Arab Emirates from 43.5 million to 77.05

Journal of Economics and Sustainable Development www.iiste.org
ISSN 2222-1700 (Paper) ISSN 2222-2855 (Online)
Vol.6, No.19, 2015
119
million USD. It also increases from 33.4 million to 64.15 million, from 4.06 to 20.18 million, 13.28 to 32.83
million, 1.22 to 7.08 million USD, from 4.62 to 14.29 million USD, from 9.79 to 28.72 million USD for Israel,
Hong Kong, India, China, Taiwan, South Korea and Pakistan respectively. There are also countries Ethiopia’s
exports earning declines on average for the two time periods these are Japan from 62 to 49.4 million USD for
Yemen from 27.26 to 20.81 million USD and for Singapore from 9.24 to 3.73 million USD dollars.
Figure 8 Diversification of Ethiopia’s export value by destination for Oceania countries
The above figure 7 shows that Australia has the largest value share of Ethiopia’s export earnings from the
Oceania continent. The export earnings increase from 4.46 million USD to 12.6 million USD. The value of
earning increases for other countries from 1.01 to 2.83 million USD.
Figure 9 Trends of Ethiopia’s export share by destination of continents
The above figure 8 shows the trends of Ethiopia’s export diversification by destination of the continents. Its
largest export destination continent for the previous nine years starting from 2005/06 to 2013/14 was Europe.
The trend shows that Ethiopia exports more goods to Europe on year 2010/11 and 2006/07 which account 49.94
percent and 47.75 percent respectively. Asia is the second export destination continent following Europe. Export
to Europe declines staring from year 2010/11 to 2013/14 but on the reverse side the African and Asian trade
share increases on these years. Specifically it seems there is an inverses relationship between Europe and Asia
continents share of Ethiopia’s export. We can conclude Ethiopia export high to Asia by decline its export to
Europe and vice versa. The Ethiopia’s export to American declines starting from the recession period (2008/9)
up to 2013/14. The least export destination continent was Oceania which accounts less than one percent for the
previous nine years.

Journal of Economics and Sustainable Development www.iiste.org
ISSN 2222-1700 (Paper) ISSN 2222-2855 (Online)
Vol.6, No.19, 2015
120
Figure 10 Export diversifications by countries and continents using Gini Hirschman Index
The result from the above figure 9 shows that the GHI index of the export destination countries less than
0.4(U.S. Department of Justice and the Federal Trade Commission (2010)) for all countries starting from
2005/06 to 2013/14 which shows that the GHI values are close to zero indicates that Ethiopia’s export earnings
are diversified among countries in the world. While the result of GHI by the continent is greater than 0.5
indicates that the Ethiopia’s export was undiversified to the continents in the world. This implies Ethiopia’s
export is skeweed more to two continents Europe and Asia. As the researcher compares from year to year there
was an improvement (decline of Gini Hirschman index) on Ethiopia’s export destination countries but an
increase of Gini Hirschman index on the continent indicates that export diversification declines when the
researcher compares year 2005/06 to year 2013/14.
4.3.2. Diversification of Ethiopia’s export commodities
Currently Ethiopia is increasing its exports even if it does not finance the import bills by diversifying the export
commodities. The diversification of Ethiopia’s export commodities is from both sides from vertical and
horizontal export diversification. Vertical export diversification includes textile and textile products and leather
and leather products, beverages etc. while on the horizontal; flower, cotton and other primary commodities.
Table 3 Ethiopia’s export earnings from Major Commodity groups (millions of birr)
Major Commodity
Groups
average year
1980/81-
1984/5
1985/6-
1989/90
1990/91-
1994/5
1995/6-
1999/0
2000/01-
2004/05
2005/6-
2009/10
2010/11-
2013/14
Coffee 511.4 532.0 698.2 2233.5 1832.0 4512.2 13830.2
Oil Seeds 21.4 11.8 19.9 191.5 547.8 2803.5 8478.8
Leather and
Leather products
91.5 123.7 172.5 311.8 503.4 770.9 2063.8
Pulses 24.2 17.9 30.2 89.9 205.3 979.7 3505.6
Meat & Meat
Prodts.
6.3 3.5 1.6 26.0 47.5 241.0 1288.8
Fruits &
Vegetables
4.6 8.7 9.2 36.6 91.3 182.4 750.7
Sugar 9.3 17.1 10.2 7.5 80.2 39.3 0.0
Gold 217.2 366.0 1381.1 9330.1
Live Animals 13.7 20.3 5.1 8.5 28.0 531.2 3130.4
Chat 25.1 17.5 74.3 342.0 610.5 1349.8 4633.5
Petrol. & Pet.
Prdts
67.7 30.5 48.8 31.0 0.0 0.0 0.0
Bees Wax 3.1 4.4 3.1 8.6 7.0 16.6 41.4
Tantalum 37.4 74.9 232.3
Cotton 72.3 113.1 47.2
Text. & Text. Prdts 47.7 157.3 1582.9

Journal of Economics and Sustainable Development www.iiste.org
ISSN 2222-1700 (Paper) ISSN 2222-2855 (Online)
Vol.6, No.19, 2015
121
Cereals and Flour 99.6 47.4 229.6
Natural Gum 32.8 84.5 211.4
Animal Fodder 9.7 22.5 0.6
Natural Honey 0.2 9.5 45.7
Flower 29.2 1073.4 3364.0
Beverage 3.0 9.6 65.6
Spices 63.6 132.2 573.1
Other 34.2 38.8 45.0 180.0 671.9 2310.6 8,179.8
The above table shows that export earnings increase from year to year due to an increase both vertical and
horizontal export diversification. Ethiopia diversifies its export commodities by exporting Gold, Tantalum,
Cotton, Text. & Text. Prdts, Cereals and Flour, Natural Gum, Animal Fodder, Natural Honey, Flower, Beverage,
Spices and others started from 2002/2003. Among those diversified Ethiopia’s exports Ethiopia earn the largest
value from Gold next to coffee on five year average in recent years starting from year 2005/06. Even if we
understand that Ethiopia’s export of goods were diversified the share of high value earning is still concentrated
only on few commodities which is supported by the table presented below which shows the share of major
commodities.
Table: 4. Share of Ethiopia’s export commodities
Major Commodity
Groups
Average(2009/10-2013/14) 2013/14
Value(million birr) Share (%) value(million birr) Share (%)
Coffee 12,446.8 25.6 13708.1 19.4
Oil Seeds 7,717.2 15.9 12477.2 17.6
Leather and Leather
products
1,797.6 3.7 2474.7 3.5
Pulses 3,140.0 6.5 4790.4 6.8
Meat & Meat Prodts. 1,119.2 2.3 1424.0 2.0
Fruits & Vegetables 683.0 1.4 919.2 1.3
Gold 8,206.0 16.9 8722.2 12.3
Live Animals 2,739.8 5.6 3553.3 5.0
Chat 4,248.9 8.7 5628.7 8.0
Bees Wax 37.2 0.1 52.0 0.1
Tantalum 216.6 0.4 86.4 0.1
Cotton 65.4 0.1 20.1 0.0
Text. & Text. Prdts 1,325.8 2.7 2100.9 3.0
Cereals and Flour 198.6 0.4 213.1 0.3
Natural Gum 201.9 0.4 231.5 0.3
Natural Honey 41.5 0.1 47.2 0.1
Flower 3,132.1 6.4 3817.4 5.4
Beverage 56.9 0.1 59.9 0.1
Spices 507.0 1.0 561.2 0.8
Others 784.19 1.6 9848.7 13.9
The above table shows that on the average (2009/10-2013/14) years coffee export was the first by accounting the
lion share of 25.6 percent from total Ethiopia’s export revenue. The other commodities such as gold, oilseeds,

Journal of Economics and Sustainable Development www.iiste.org
ISSN 2222-1700 (Paper) ISSN 2222-2855 (Online)
Vol.6, No.19, 2015
122
chat, pulse, flower and live animals 16.9 percent, 15.9 percent, 8.7 percent, and 6.5 percent, 6.4 percent and 5.4
percent respectively.
The above table also shows that coffee still has the largest share which accounts 19.4 percent on Ethiopia’s
export earning in year 2013/14 but it declines as compared to its lion share for the previous decades of years.
Next to coffee oil seeds enable Ethiopia to got 17.6 percent of its export value. The rest gold, chat, pulse, flower
and live animals also contributes 12.3 percent, 8 percent, 6.8 percent, 5.4 percent and 5 percent respectively.
When we compare the share of major exports for the average share of (2009/10-2013/14) and 2013/14 the share
of coffee export declines from 25.6 percent to 19.4 percent, the share of oilseeds and pulses increase from 15.9
percent to 17.6 percent and from 6.5 percent to 6.8 percent respectively, the share of gold, chat, flower and live
animals decreases from 16.9 percent to 12.3 percent, from 8.7 percent to 8 percent, from 6.4 percent to 5.4
percent and from 5.6 percent to 5 percent respectively. The decline of these shares may be due to the increases of
the share of other commodities. That there are other commodities (diversified export commodities) assigned to
other commodities groups which increase the share of other exports from 1.6 percent to 13.9 percent.
Figure 11 Export diversification by commodities using Gini Hirschman Index (GHI)
The result from the above figure 4.1.2 shows that the GHI of the export commodities moderately concentrated
between years 2005/06 to 2007/08 since the value is in between 0.4 and 0.5 and diversified from year 2008/09 to
2013/14 since the GHI values are less than 0.4. As the researcher compares from year to year there was an
improvement (decline of Gini Hirschman index) on Ethiopia’s export commodities diversification that is there
was an increase export diversification of commodities when the researcher compares between year 2005/06 and
2013/14.
4.4. Diversification of service export
Using the same procedure and method of measuring goods export diversification of service export was
discussed. First the composition and share of service export had discussed for the previous sixteen years. Service
export includes travel, transportation, government, investment income and other service exports. Other service
exports include communication, construction, insurance, financial, computer and information, other business,
personal, cultural and recreational services.

Journal of Economics and Sustainable Development www.iiste.org
ISSN 2222-1700 (Paper) ISSN 2222-2855 (Online)
Vol.6, No.19, 2015
123
Figure 12 Composition of service export (in millions of birr)
The above figure shows the composition of service export over the previous sixteen years. The largest
contribution for the service export sector was transportation sector which have largest shares for the previous
sixteen years. Even though the share of other service export and government export were account the second and
third share contribution for the service export it shows declining from year to year while transportation share
increases from year to year. On the other hand travel share shows a little improvement but investment income
declines over all periods.
Figure 13 Service export diversification using Gini Hirschman Index (GHI)
The Gini Hirschman Index from figure 12 above shows that all values of GHI are greater than 0.5 which implies
that service export is highly concentrated. This is due to the fact that the largest share of service export was
skewed to transportation service export which accounts more than 50 percent of service export.

Journal of Economics and Sustainable Development www.iiste.org
ISSN 2222-1700 (Paper) ISSN 2222-2855 (Online)
Vol.6, No.19, 2015
124
5. CONCLUSION AND RECOMMENDATION
5.1. Conclusion
To summarize this research export of goods and services are very important for developing countries which
follow export lead growth strategy due to its importance for economic growth by importing of capital and
intermediated goods. Export of goods and service affects economic growth through forward and backward
linkage that is the output of one industry is used as an input of the other industry.
The development of Ethiopia’s export was expressed export as a percentage of gross domestic products at
market price. Ethiopia’s export of goods and services is not stable rather it shows volatility over the time horizon
included in this research. It is also observed that, Ethiopia’s export (tx) to gross domestic product at market price
(GDPM) shows declining for recent years specifically for year 2012, 2013 and 2014. This result challenge
Ethiopia’s government plan which follows export lead growth strategy and introducing a lot of incentives to the
export sector.
Export diversification is important for a country whose objective is to have a stable macroeconomic
environment. Export diversification both in geographical location and product are very important to have a stable
foreign exchange rate earning which are very imperative for a country to be competent in the international
market and import those capital goods which are very important for one country to achieve sustainable economic
development.
The finding of this research using Gini Hirschman index shows Ethiopia's export of goods were diversified
between year 2008/09 to 2013/14 even most of exports were primary agricultural products. Even if the
diversification by country is good but when we see it on the continent it was not diversified rather it was skewed
to some continent to Europe, Asia and Africa with respective trade share. The result of service export
diversification also shows that the service export sector was not diversified rather it concentrated on too few
products the main was transportation service. To generalize the Ethiopia’s export performance was going on
good way since it shows an improvement on diversification of goods export by product and destination of
countries, but still there is no diversification on service export and export of goods by continent as well as
growth rate total export is impulsive.
5.2. Policy implication
Based on the finding of this paper the researcher recommends the following to the concern body
� The export of goods was moderately concentrated before year 2007/08 and diversified after
this year but still it is close to the above boundary of un-concentrated interval so policy makers
should take additional measures to increase export diversification.
� Even though the government planned to increase export diversification to different countries
and continent destinations it only have good performance on countries but not at continent level so
it is important to take additional policy measures to increase export diversification to all
continents which are very important to reduce instability of foreign exchange earnings.
� The service export is concentrated to few sectors it is more skewed to transportation. So the
government should take various measures to diversify the type of service export in order to reduce
foreign exchange earnings volatility in the service sector.
� Even if the development of export share on income on average was good, when we see export
growth rate by component it shows unstable and needs policy measures to increase exports which
are important for sustainable economic development by importing capital goods.
REFERENCE
Alwang A. and Siegel (1991): ' Is export Diversification the best way to achieve export growth and Stability? A
look at three African Countries' World Bank Working Papers No. 729
Attaran M. and Zwick M. (1987): “ Entropy and Other measures of Industrial diversification” Quarterly Journal
of Business and Economics 26, pp 17-34, 1987
Economic Commission for Africa-ECA (2006): Diversification: Towards a New Paradigm for Africa’s
Development, Work in progress No. 35, African Trade Policy Centre

Journal of Economics and Sustainable Development www.iiste.org
ISSN 2222-1700 (Paper) ISSN 2222-2855 (Online)
Vol.6, No.19, 2015
125
Erkan B. (2014) product and market diversification in turkey’s foreign trade, international journal of advances
in management and economics Vol. 3 P. 1-15.
Hossain M. and Chowdhury A. (2012), pattern and determinants of export diversification in Bangladesh: an
empirical assessment, D.U. Journal of Marketing, Vol. No. 15, P.110-126
Kamuganga N. (2012) What Drives Africa’s Export Diversification? Graduate Institute of International and
Development Studies Working Paper No: 15
Love J. (2005) trade concentration and export instability, special issues on trade and poor economies of the
journal of development studies, Vol. 15, No.3, P 57-66
Luis Filipe L. (2000) A conceptual framework of the determinants of export performance: recognizing key
variables and shifting contingencies in export marketing, journal of global marketing, Vol. 13. No.3
PP.29-51
Michael L. Wyzan (1999) Macedonian and Slovenian Trade after the Break-up of Former Yugoslavia: Focus on
the European Union, International Institute for Applied Systems Analysis, Interim Report IR-99-018, P.
1-29.
National Bank of Ethiopia, Annual Report 2012/13 and 2013/14
Proclamation No. 768(2012), a proclamation on export trade duty incentive schemes, Federal Negarit Gazeta of
the Federal Democratic Republic of Ethiopia, Year No. 62, Page 6555
Proclamation no. 249(2001) a proclamation to establish export trade duty incentive scheme
Federal Negarit Gazeta of the Federal Democratic Republic of Ethiopia, Year No. 39, Page 1591
Samen S. (2010) a primer on export diversification: key concepts, theoretical underpinnings and empirical
evidence, Growth and Crisis Unit World Bank Institute
Siope V.(2012) Export Diversification and Intra-Industry Trade in Africa, United Nations Economic
Commission for Africa, Expert Group Meeting on ‗Export Diversification and Intra-Industry‘, Lusaka,
Zambia
U.S. Department of Justice and the Federal Trade Commission (2010) Horizontal Merger Guidelines