Embed Size (px)
Citation preview
Divergent trajectories of antiviral memory afterSARS-Cov-2 infectionAdriana Tomic* ( [email protected] )
Oxford Vaccine Group, Department of Paediatrics, University of Oxford, Oxford, UKhttps://orcid.org/0000-0001-9885-3535
Donal T. Skelly* Peter Medawar Building for Pathogen Research, Nu�eld Department of Medicine, University of Oxford,
UK https://orcid.org/0000-0002-2426-3097Ane Ogbe*
Peter Medawar Building for Pathogen Research, Nu�eld Department of Medicine, University of Oxford,UK https://orcid.org/0000-0001-7774-7215Daniel O'Connor*
Oxford Vaccine Group, Department of Paediatrics, University of Oxford, Oxford, UKhttps://orcid.org/0000-0002-6902-9886
Matthew Pace Peter Medawar Building for Pathogen Research, Nu�eld Department of Medicine, University of Oxford,
UK https://orcid.org/0000-0002-5703-3984Emily Adland
Peter Medawar Building for Pathogen Research, Nu�eld Department of Medicine, University of Oxford,UKFrances Alexander
Public Health England, Porton Down, UKMohammad Ali
Peter Medawar Building for Pathogen Research, Nu�eld Dept. of Clinical Medicine, University of Oxford,UK https://orcid.org/0000-0003-0170-7182Kirk Allott
Department of Clinical Biochemistry, Oxford University Hospitals NHS Foundation Trust, Oxford, UKM. Azim Ansari
Peter Medawar Building for Pathogen Research, Nu�eld Department of Medicine, University of Oxford,UK https://orcid.org/0000-0003-2790-8353Sandra Belij-Rammerstorfer
Jenner Institute, Nu�eld Department of Medicine, University of Oxford, Oxford, UKhttps://orcid.org/0000-0002-8637-3785
Sagida Bibi
Oxford Vaccine Group, Department of Paediatrics, University of Oxford, Oxford, UKhttps://orcid.org/0000-0002-0855-2737
Luke Blackwell Oxford Vaccine Group, Department of Paediatrics, University of Oxford, Oxford, UK
Anthony Brown Peter Medawar Building for Pathogen Research, Nu�eld Department of Medicine, University of Oxford,
UKHelen Brown
Peter Medawar Building for Pathogen Research, Nu�eld Department of Medicine, University of Oxford,UKBreeze Cavell
Public Health England, Porton Down, UK https://orcid.org/0000-0001-9897-1590Elizabeth A. Clutterbuck
Oxford Vaccine Group, Department of Paediatrics, University of Oxford, Oxford, UKhttps://orcid.org/0000-0003-1701-1390
Thushan I de Silva The Florey Institute for Host-Pathogen Interactions and Department of Infection, Immunity and
Cardiovascular Disease, Medical School, University of She�eld, UKDavid Eyre
Oxford University Hospitals NHS Foundation Trust, Oxford, UKAmy Flaxman
Jenner Institute, Nu�eld Department of Medicine, University of Oxford, Oxford, UKhttps://orcid.org/0000-0001-6460-1372
James Grist Department of Physiology, Anatomy and Genetics, University of Oxford, Oxford, UK
Carl-Philipp Hackstein Peter Medawar Building for Pathogen Research, Nu�eld Dept. of Clinical Medicine, University of Oxford,
UK https://orcid.org/0000-0002-0821-5204Rachel Halkerston
Public Health England, Porton Down, UK https://orcid.org/0000-0001-6420-3331Adam C. Harding
James & Lillian Martin Centre, Sir William Dunn School of Pathology, University of Oxford, Oxford, UKhttps://orcid.org/0000-0003-1479-959X
Jennifer Hill Oxford Vaccine Group, Department of Paediatrics, University of Oxford, Oxford, UKhttps://orcid.org/0000-0001-6205-7764
Tim James Department of Clinical Biochemistry, Oxford University Hospitals NHS Foundation Trust, Oxford, UK
Cecilia Jay
Peter Medawar Building for Pathogen Research, Nu�eld Dept. of Clinical Medicine, University of Oxford,UKSíle A. Johnson
Peter Medawar Building for Pathogen Research, Nu�eld Dept. of Clinical Medicine, University of Oxford,UK https://orcid.org/0000-0002-4100-8522Barbara Kronsteiner
Peter Medawar Building for Pathogen Research, Nu�eld Dept. of Clinical Medicine, University of Oxford,UKYolanda Lie
Monogram Biosciences LabCorp, San Francisco, CA, USAAline Linder
Oxford Vaccine Group, Department of Paediatrics, University of Oxford, Oxford, UKStephanie Longet
Public Health England, Porton Down, UK https://orcid.org/0000-0001-5026-431XSpyridoula Marinou
Oxford Vaccine Group, Department of Paediatrics, University of Oxford, Oxford, UKPhilippa C. Matthews
Oxford University Hospitals NHS Foundation Trust, Oxford, UKJack Mellors
Public Health England, Porton Down, UKChristos Petropoulos
Monogram Biosciences LabCorp, San Francisco, CA, USAPatpong Rongkard
Peter Medawar Building for Pathogen Research, Nu�eld Dept. of Clinical Medicine, University of Oxford,UKCynthia Sedik
Monogram Biosciences LabCorp, San Francisco, CA, USALaura Silva-Reyes
Oxford Vaccine Group, Department of Paediatrics, University of Oxford, Oxford, UKHolly Smith
Jenner Institute, Nu�eld Department of Medicine, University of Oxford, Oxford, UKLisa Stockdale
Oxford Vaccine Group, Department of Paediatrics, University of Oxford, Oxford, UKStephen Taylor
Public Health England, Porton Down, UK https://orcid.org/0000-0002-9936-8539Stephen Thomas
Public Health England, Porton Down, UK https://orcid.org/0000-0003-2368-8058Timothy Tipoe
Peter Medawar Building for Pathogen Research, Nu�eld Dept. of Clinical Medicine, University of Oxford,UKLance Turtle
HPRU in Emerging and Zoonotic Infections, Institute of Infection, Veterinary and Ecological Sciences,University of Liverpool, Liverpool, UKVinicius Adriano Vieira
Peter Medawar Building for Pathogen Research, Department of Paediatrics, University of Oxford, Oxford,UK https://orcid.org/0000-0002-4901-0424Terri Wrin
Monogram Biosciences LabCorp, San Francisco, CA, USAOPTIC Clinical Group PITCH Study Group C-MORE Group Andrew J. Pollard
Oxford Vaccine Group, Department of Paediatrics, University of Oxford, Oxford, UKhttps://orcid.org/0000-0001-7361-719X
Teresa Lambe Jenner Institute, Nu�eld Department of Medicine, University of Oxford, Oxford, UK
Christopher P. Conlon Nu�eld Department of Medicine, University of Oxford, Oxford, UK
Katie Jeffery Oxford University Hospitals NHS Foundation Trust, Oxford, UK https://orcid.org/0000-0002-6506-2689
Simon Travis Oxford University Hospitals NHS Foundation Trust, Oxford, UK
Philip J. Goulder Peter Medawar Building for Pathogen Research, Department of Paediatrics, University of Oxford, Oxford,
UKJohn Frater
Peter Medawar Building for Pathogen Research, Nu�eld Department of Medicine, University of Oxford,UKAlexander J. Mentzer
Oxford University Hospitals NHS Foundation Trust, Oxford, UK https://orcid.org/0000-0002-4502-2209Lizzie Stafford
Nu�eld Department of Medicine, University of Oxford, Oxford, UK https://orcid.org/0000-0002-1610-5136Miles W. Carroll
Public Health England, Porton Down, UKWilliam S. James
11. James & Lillian Martin Centre, Sir William Dunn School of Pathology, University of Oxford, Oxford,UK https://orcid.org/0000-0002-2506-1198Paul Klenerman#
Peter Medawar Building for Pathogen Research, Nu�eld Department of Medicine, University of Oxford,UK https://orcid.org/0000-0003-4307-9161Eleanor Barnes# ( [email protected] )
Peter Medawar Building for Pathogen Research, Nu�eld Department of Medicine, University of Oxford,UK https://orcid.org/0000-0002-0860-0831Christina Dold#
Oxford Vaccine Group, Department of Paediatrics, University of Oxford, Oxford, UKhttps://orcid.org/0000-0003-2314-507X
Susanna J. Dunachie# Peter Medawar Building for Pathogen Research, Nu�eld Department of Medicine, University of Oxford,
UK https://orcid.org/0000-0001-5665-6293
Research Article
Keywords: SARS-CoV-2, T cells, B cells, Antibodies, Durability, Healthcare workers, Longevity, variants ofconcern, COVID-19
Posted Date: June 15th, 2021
DOI: https://doi.org/10.21203/rs.3.rs-612205/v1
License: This work is licensed under a Creative Commons Attribution 4.0 International License. Read Full License
1
Divergent trajectories of antiviral memory after SARS-Cov-2 infection 1
2
Adriana Tomic1*, Donal T. Skelly2,3,4*, Ane Ogbe2*, Daniel O’Connor1*, Matthew Pace2, Emily Adland2, 3
Frances Alexander5, Mohammad Ali2, Kirk Allott6, M. Azim Ansari2, Sandra Belij-Rammerstorfer7, 4
Sagida Bibi1, Luke Blackwell1, Anthony Brown2, Helen Brown2, Breeze Cavell5, Elizabeth A. 5
Clutterbuck1, Thushan de Silva8, David Eyre3,9, Amy Flaxman7, James Grist10, Carl-Philipp Hackstein2, 6
Rachel Halkerston5, Adam C. Harding11, Jennifer Hill1,12, Tim James6, Cecilia Jay2, Síle A. Johnson2,3,13, 7
Barbara Kronsteiner2,14, Yolanda Lie15, Aline Linder1,12, Stephanie Longet5,16, Spyridoula Marinou1,12, 8
Philippa C. Matthews2,3,12, Jack Mellors5, Christos Petropoulos15, Patpong Rongkard2, Cynthia Sedik15, 9
Laura Silva-Reyes1,12, Holly Smith7, Lisa Stockdale1,12, Stephen Taylor5, Stephen Thomas5, Timothy 10
Tipoe2, Lance Turtle17,18, Vinicius Adriano Vieira19, Terri Wrin15, OPTIC Clinical Group, PITCH Study 11
Group, C-MORE Group, Andrew J. Pollard1,12, Teresa Lambe7, Chris P. Conlon20, Katie Jeffery3, Simon 12
Travis3,21, Philip Goulder19, John Frater2,3, Alex J. Mentzer3,16, Lizzie Stafford20, Miles W. Carroll5,16, 13
William S. James11, Paul Klenerman2,3,12#, Eleanor Barnes2,3,12#, Christina Dold1,12#, Susanna J. 14
Dunachie2,3,14,21# 15
16
* These authors contributed equally 17
# These authors jointly supervised this work and contributed equally 18
Corresponding authors: Eleanor Barnes, email: [email protected] and Adriana Tomic, email: 19
21
Affiliation 22
1. Oxford Vaccine Group, Department of Paediatrics, University of Oxford, UK 23
2. Peter Medawar Building for Pathogen Research, Nuffield Dept. of Clinical Medicine, University 24
of Oxford, UK 25
3. Oxford University Hospitals NHS Foundation Trust, Oxford, UK 26
4. Nuffield Dept of Clinical Neuroscience, University of Oxford, UK 27
5. Public Health England, Porton Down, England 28
6. Department of Clinical Biochemistry, Oxford University Hospitals NHS Foundation Trust, 29
Oxford, UK 30
7. Jenner Institute, University of Oxford, UK 31
8. The Florey Institute for Host-Pathogen Interactions and Department of Infection, Immunity and 32
Cardiovascular Disease, Medical School, University of Sheffield, UK 33
9. Big Data Institute, Nuffield Dept. of Population Health, University of Oxford, UK 34
10. Department of Physiology, Anatomy, and Genetics, University of Oxford, UK 35
11. James & Lillian Martin Centre, Sir William Dunn School of Pathology, University of Oxford, 36
Oxford, UK 37
12. NIHR Oxford Biomedical Research Centre, Oxford, UK 38
13. Oxford University Medical School, Medical Sciences Division, University of Oxford, Oxford, UK 39
14. Oxford Centre For Global Health Research, Nuffield Dept. of Clinical Medicine, University of 40
Oxford, UK 41
15. Monogram Biosciences LabCorp, San Francisco, CA, USA 42
16. Wellcome Centre for Human Genetics, University of Oxford, UK 43
17. HPRU in Emerging and Zoonotic Infections, Institute of Infection, Veterinary and Ecological 44
Sciences, University of Liverpool, UK 45
18. Tropical and Infectious Disease Unit, Liverpool University Hospitals NHS Foundation Trust (a 46
member of Liverpool Health Partners), Liverpool, UK 47
19. Peter Medawar Building for Pathogen Research, Department of Paediatrics, University of 48
Oxford, Oxford, UK 49
2
20. Nuffield Department of Medicine, University of Oxford, Oxford, UK 50
21. Translational Gastroenterology Unit, Nuffield Department of Medicine, University of Oxford, 51
Oxford, UK 52
22. Mahidol-Oxford Tropical Medicine Research Unit, Bangkok, Thailand 53
54
Acknowledgments: 55
The authors wish to thank all the healthcare worker volunteers who participated in this study, and Suki 56
Kenth for administrative support. 57
58
Funding statements 59
This work was funded by the UK Department of Health and Social Care as part of the PITCH (Protective 60
Immunity from T cells to Covid-19 in Health workers) Consortium, with contributions from UKRI/NIHR 61
through the UK Coronavirus Immunology Consortium (UK-CIC) and from the Huo Family Foundation. 62
63
AT is supported by the EU’s Horizon2020 Marie Sklodowska-Curie Fellowship (FluPRINT, grant 64
number 796636). DS is supported by the NIHR Academic Clinical Fellow programme in Oxford. MAA 65
is supported by a Wellcome Trust Sir Henry Dale Fellowship (220171/Z/20/Z). DWE is a Robertson 66
Foundation Fellow. PCM is funded by a Wellcome intermediate fellowship, ref. 110110/Z/15/Z. LT is 67
supported by the Wellcome Trust (grant number 205228/Z/16/Z) and the National Institute for Health 68
Research Health Protection Research Unit (NIHR HPRU) in Emerging and Zoonotic Infections 69
(NIHR200907) at University of Liverpool in partnership with Public Health England (PHE), in 70
collaboration with Liverpool School of Tropical Medicine and the University of Oxford. PK and EB 71
are NIHR Senior Investigators and PK is funded by WT109965MA. SJD is funded by an NIHR Global 72
Research Professorship (NIHR300791). 73
74
The views expressed are those of the author(s) and not necessarily those of the NHS, the NIHR, the 75
Department of Health and Social Care or Public Health England. 76
77
Contributions 78
EB, PK, CD and SJD conceptualised the study. SJD, PK, EB, CPC, DTS and LS designed and oversaw 79
the clinical study. LS, DE, KJ, PM, AJM, PG, SAJ, ST, the OPTIC Study Group and the C-MORE Group 80
contributed to the implementation of the clinical study. AO, AT, CD, DOC, DTS, MP, MWC, WSJ, EB, 81
PK, and SJD designed and oversaw the laboratory studies. AJP, AO, CD, EA, JF, PJG, MWC, WSJ, 82
EB, PK, SJD and TL were responsible for the implementation of the laboratory testing, while AB, ACH, 83
AF, AL, BC, BK, CH, CJ, CP, CS, EAC, FA, HB, HS, JG, JG-J, JH, JM, KA, LB, LS-R, LSt, LT, MAA, 84
MA, MLK, PR, RH, SB, SB-R, SL, SM, ST, STh, TJ, TT, TW, VAV, YL were responsible for laboratory 85
testing and assay development. AT and DOC undertook the advanced data analysis. AO, AT, CD, 86
DOC, DTS, EB, PK, and SJD prepared the manuscript, which was reviewed by all contributing authors. 87
All other authors contributed to the implementation of the study and data collection. 88
89
90
91
3
Competing Interests 92
DWE declares lecture fees from Gilead, outside the submitted work. No other competing interests 93
declared. 94
95
Key words: SARS-CoV-2, T cells, B cells, Antibodies, Durability, Healthcare workers, Longevity, 96
variants of concern, COVID-19 97
98
Abstract 99
Severe acute respiratory syndrome coronavirus 2 (SARS-CoV-2) infection is normally controlled by 100
effective host immunity including innate, humoral and cellular responses. However, the trajectories and 101
correlates of acquired immunity, and the capacity of memory responses months after infection to 102
neutralise variants of concern - which has important public health implications - is not fully understood. 103
To address this, we studied a cohort of 78 UK healthcare workers who presented in April to June 2020 104
with symptomatic PCR-confirmed infection or who tested positive during an asymptomatic screening 105
programme and tracked virus-specific B and T cell responses longitudinally at 5-6 time points each over 106
6 months, prior to vaccination. We observed a highly variable range of responses, some of which - T 107
cell interferon-gamma (IFN-γ) ELISpot, N-specific antibody waned over time across the cohort, while 108
others (spike-specific antibody, B cell memory ELISpot) were stable. In such cohorts, antiviral antibody 109
has been linked to protection against re-infection. We used integrative analysis and a machine-learning 110
approach (SIMON - Sequential Iterative Modeling Over Night) to explore this heterogeneity and to 111
identify predictors of sustained immune responses. Hierarchical clustering defined a group of high and 112
low antibody responders, which showed stability over time regardless of clinical presentation. These 113
antibody responses correlated with IFN-γ ELISpot measures of T cell immunity and represent a 114
subgroup of patients with a robust trajectory for longer term immunity. Importantly, this immune-115
phenotype associates with higher levels of neutralising antibodies not only against the infecting 116
(Victoria) strain but also against variants B.1.1.7 (alpha) and B.1.351 (beta). Overall memory responses 117
to SARS-CoV-2 show distinct trajectories following early priming, that may define subsequent protection 118
against infection and severe disease from novel variants. 119
4
Introduction 120
Severe acute respiratory syndrome coronavirus 2 (SARS-CoV-2), an RNA virus that causes 121
coronavirus disease 2019 (COVID-19), first emerged in humans in December 2019 and has since 122
spread globally, with more than 3.56 million deaths reported world-wide (June 2021 123
https://coronavirus.jhu.edu/map.html). Although the majority of infections cause asymptomatic or mild 124
disease, a significant minority develop a severe illness, requiring hospitalisation, oxygen support, and 125
invasive ventilation 1. Healthcare workers (HCW) have been at the forefront of caring for patients with 126
SARS-CoV-2 infection in community and hospital environments during the pandemic. High exposure 127
rates have meant that a significant proportion of HCW have become infected and HCW most commonly 128
infected are those working on the front line in patient facing roles, predominantly in acute medical 129
specialities 2. Older age, comorbidities and male sex remain the dominant factors that predispose to 130
severe outcomes 3 – since HCW are predominantly younger and female 2, most have developed mild 131
disease, although deaths are widely reported in this population. 132
133
Starting early in the pandemic, we and others have sought to characterise the immune responses during 134
SARS-CoV-2 infection that are associated with viral clearance and disease severity. SARS-CoV-2 135
infection has been associated with the generation of high magnitude, broad T cell responses and high 136
titres of immunoglobulin G (IgG) targeting SARS-CoV-2 spike and nucleoprotein (NP) antigens, 137
particularly in severe COVID-19 4. Asymptomatic infection, that appears more common in younger 138
people, may be associated with discordant T cell and humoral immunity with both the absence of IgG 139
seroconversion in the presence of detectable T cell responses 5, 6 or conversely the presence of IgG in 140
the absence of T cell immune responses 7. However, more recently critical questions have emerged 141
that include the durability of immune responses following initial infection, the quality of these responses, 142
immune correlates of protection from re-infection, and the capacity of these responses to neutralise 143
new variants of concern (VOC) that have emerged globally. These questions have become paramount 144
following the development of effective vaccines for COVID-19, since deployment of these has been 145
limited by vaccine supply, concerns around adverse events and vaccine hesitancy. Furthermore, to 146
manage limited vaccine resource, people with previous infection are now being offered a single vaccine 147
dose 6 months after infection in many European countries (France, Germany, Spain, and Italy) 8, on 148
the assumption that natural immunity will protect from re-infection. 149
150
An in depth understanding of immune responses after SARS-CoV-2 infection, and how these change 151
over time, will be critical to understanding who is susceptible to re-infection and to inform vaccine 152
strategies. Currently, the precise correlates of immune protection from subsequent infection after 153
primary disease, or after vaccination, are unknown. Previous reports suggest SARS-CoV-2 IgG 154
antibodies 9 and previous exposure to seasonal coronaviruses (CoV) 10 are protective against 155
subsequent SARS-CoV-2 infection. However, since the magnitude of T and B cell responses correlate 156
with each other 11, dissecting the role of these immune subsets in protection from re-infection or severe 157
disease on re-exposure is challenging. Several groups have now reported that SARS-CoV-2 specific T 158
and B cells decline after acute disease 12, 13, 14, 15, 16, but there is high heterogeneity between individuals 159
5
in the levels of measurable immunity in different compartments it is unclear how or if the kinetics of this 160
decline correlate with protection from subsequent infection. Concerns have been raised that SARS-161
CoV-2 re-infection associated with waning immunity is plausible, particularly since the seasonal 162
coronaviruses, closely related to SARS-CoV-2, commonly re-infect the same host 17, 18. However, 163
waning of immune responses following acute infection, or vaccination is well recognised as part of the 164
normal evolution of memory responses, and reports describing decline in immune responses have 165
focused on ex vivo responses that may not reflect the memory recall potential of viral specific T and B 166
cells responses. A particular concern is the identification of SARS-CoV-2 variants of concern (VOC) 167
(B.1.1.7 - alpha, B.1.351 - beta, P.1 - gamma and B.1.617.2 - delta), with mutations which are 168
associated with an increase in transmissibility, severity or escape from vaccine or SARS-CoV-2-induced 169
immunity 19, 20, 21, 22, 23, 24, 25, 26, 27. Immune escape, with a failure to neutralise the VOC, in live viral assays 170
in vitro, appear following vaccination and after SARS-CoV-2 infection, and is pronounced in the context 171
of lower antibody titres measured against the initial pandemic strain (B/Victoria). 172
173
Since April 2020, we have followed a cohort of SARS-CoV-2 infected HCW prospectively over time at 174
Oxford University Hospital NHS Foundation Trust. Seventy-eight HCW infected during the UK’s “first 175
wave” (defined by positive PCR and seropositive for anti-spike antibodies) were assessed at up to six 176
timepoints and followed for six months in 2020, pre-vaccination, with multiple immune parameters 177
evaluated in more than 430 blood draws. Our aims are to characterise memory T and B cell responses 178
following infection, and to determine the interactions between clinical presentation and the generation 179
and maintenance of T and B cell responses over time. We assess the association of exposure to 180
seasonal coronaviruses and symptomatic SARS-CoV-2 disease with the durability of SARS-CoV-2 181
specific responses. We evaluate the predictive value of clinical and immune parameters measured early 182
after infection on the durability of immune responses using an integrative analysis with a machine 183
learning platform (SIMON) 28, 29. Using this approach, we define a group of high and low antibody 184
responders with a differential capacity to neutralise the VOC. 185
186
6
Methods and materials 187
Detailed description of methods are included in the Appendix. 188
189
HCW volunteer recruitment and ethics 190
We sampled seventy-eight HCW at five or six time points each, over six months. HCWs were recruited 191
from Oxford University Hospitals NHS Foundation Trust after a positive SARS-CoV-2 PCR test 2 in 192
April-May 2020, including 66 volunteers with symptomatic disease (fever, shortness of breath, cough, 193
loss of taste or smell, sore throat, coryza or diarrhoea) and 12 asymptomatic HCW who did not report 194
any symptoms of COVID-19 in 2020 prior to staff screening or in the seven days following testing 195
positive. The age, sex and ethnicity of the HCW are shown in Supplementary Table 1. Blood samples 196
were acquired at multiple timepoints over 6 months (acute[range:1-20], 28 days [21-41], 56 days [42-197
73], 90 days [74-104], 120 days [110-140], and 180[160-200]) from onset of symptoms in the 198
symptomatic group and from the date of positive PCR test for asymptomatic people diagnosed on 199
screening. Nine hospitalised patients with severe disease were included for comparative analysis. All 200
subjects were seropositive for anti-spike IgG antibodies by ELISA. Mild and asymptomatic participants 201
were recruited under ethics approved by the research ethics committee (REC) at Yorkshire & The 202
Humber - Sheffield (GI Biobank Study 16/YH/0247). Participants with severe disease were recruited 203
after consenting into either the CMORE study protocol (research ethics committee (REC): Northwest – 204
Preston, REC reference 20/NW/0235) and / or Sepsis Immunomics protocol [Oxford Research Ethics 205
Committee C, reference 19/SC/0296]). The study was conducted according to the principles of the 206
Declaration of Helsinki (2008) and the International Conference on Harmonization (ICH) Good Clinical 207
Practice (GCP) guidelines. Written informed consent was obtained for all participants enrolled in the 208
study. 209
210
Isolation of peripheral blood mononuclear cells (PBMC), plasma and serum 211
PBMCs and plasma were isolated by density gradient centrifugation from blood collected in EDTA 212
tubes, and serum was collected in a serum-separating tube (SST, Becton Dickinson) as previously 213
described5 and detailed in the Appendix. 214
215
T cell assays 216
T cell assays including interferon-gamma (IFN-γ) Enzyme-Linked immunospot (ELISpot) assay, 7-day 217
proliferation assay and intracellular staining were performed 5. For IFN-γ ELISpot assay we used SARS-218
CoV-2 peptide pools panning Spike (S1 and S2), membrane (M), nucleocapsid protein (NP), the X-219
domain of non-structural protein 3 (NSP3B), open reading frames 3 and 8 (ORF3 and ORF8), and 220
cytomegalovirus, Epstein-Barr virus and Flu peptide pools (CEF) (2ug/ml per peptide) in a 16-18hour 221
incubation at 37⁰C. ELISpot plates were read using an AID ELISpot Reader (v.4.0) and results were 222
reported as spot-forming units (SFU)/106 PBMC. T cell proliferation assay was performed using fresh 223
or cryopreserved PBMC and CellTrace® Violet (CTV, Life Technologies) labelling and stimulated with 224
peptide pools from SARS-CoV-2 spanning Spike (S1 and S2), M, NP, ORF3 and ORF8, and FEC-T 225
(1μg/ml per peptide). On day 7, cells were stained with fluorochrome-conjugated primary human-226
7
specific antibodies for CD3, CD4 and CD8 for analysis on a MACSQuant 10 flow cytometer. For 227
Intracellular cytokine staining, PBMC were stained for CD3, CD4, CD8, CD154, IFN-γ, IL-2 and TNF-α 228
then analysed on a BD LSR II. 229
230
Antibody and B cell assays 231
Standardised total anti-spike IgG ELISA 30 and anti-spike subclass and isotype ELISAs 31, 32 were 232
performed. A multiplexed MSD immunoassay (MSD, Rockville, MD) was used to measure the IgG 233
responses to SARS-CoV-2, severe acute respiratory syndrome coronavirus-1 (SARS-CoV-1), MERS-234
CoV and seasonal CoVs (human coronavirus (HCoV)-OC43, HcoV-HKU1, HcoV-229E, HcoV-NL63). 235
For Microneutralisation Assay (MNA), the viral isolates used are described in the Appendix, and the 236
assay was performed to determine the concentration of antibody that produces a 50% reduction in 237
infectious focus-forming units of authentic SARS-CoV-2 in Vero CCL81 cells. Infectious foci were 238
enumerated by ELISpot reader and data were analysed using four-parameter logistic regression (Hill 239
equation) in GraphPad Prism 8.3. The Monogram Bioscience pseudotype neutralisation assay 240
(PseudoNA) was performed 30. 241
242
For the Spike-specific SARS-CoV-2, OC43, HKU1, 229E and NL63 IgG+ and IgA+ B cell memory 243
ELISpot assays, PBMCs were cultured for 3-3.5 days with polyclonal stimulation, and added to Mabtech 244
flurospot plates coated with the relevant spike glycoprotein (SARS-CoV-2 at 10µg/ml, OC43 at 10µg/ml, 245
NL63 at 15µg/ml, HKU1 at 5µg/ml and 229E at 10µg/ml, all diluted in PBS). All cells were incubated for 246
≥16 hours at 37°C, and following development Spot forming units were enumerated using AID ELISpot 247
8.0 software on the AID ELR08IFL reader. For antibody-dependent effector functions, the spike-specific 248
antibody-dependent effector functions, natural killer cell activity (ADNKA), neutrophil phagocytosis 249
(ADNP) and monocyte phagocytosis (ADMP) were performed 31, and are detailed in the Appendix 250
alongside the Antibody-dependent complement deposition (ADCD) assay. 251
252
Integrative analysis using unsupervised and supervised machine learning in SIMON 253
The integrative analysis was performed using SIMON (Sequential Iterative Modeling “Over Night”) 254
software 28, 29 as detailed in the Appendix. The integrated dataset was generated using the standard 255
extract-transform-load (ETL) procedure to merge total of 29 csv files across 14 assays and clinical data 256
via donor-specific variable (Donor ID) according to the SIMON method. The outcome of immune 257
response durability was calculated based on the titre of the anti-N specific antibodies measured 6 258
months post symptoms onset (pso), and individuals with anti-N antibody titre ≥ 1.4 were labelled as 259
high responders, while individuals having anti-N antibody titre below 1.4 were low responders. Before 260
integrative analyses, data was pre-processed (centre/scale), missing values were median imputed, 261
features with zero-variance, near-zero-variance and with correlation (cut-off 0.85) were removed using 262
SIMON software. The t-distributed stochastic neighbour embedding (t-SNE) (2,000 iterations, perplexity 263
30, and theta 0.5) followed by clustering (seed number 1337, number of clusters 3) was performed to 264
analyse the pre-processed integrated dataset (excluding disease severity and timepoint which are used 265
as grouping variables). Principal component analysis (PCA) was performed on multivariate 266
8
immunological parameters (continuous variables, excluding features with less than 10% of unique 267
values and grouping variable - disease severity). Pairwise correlations of immunological parameters in 268
the integrated dataset were visualized as a correlogram and Spearman’s rank correlation coefficient 269
was computed. Values shown on the correlogram were adjusted for multiple testing using Benjamini-270
Hochberg correction at the significance threshold (False discover rate, FDR < 0.05). Agglomerative 271
hierarchical clustering was performed on the samples with immunological parameters analysed on day 272
28 pso and visualized as the dendrogram on heatmap (tightest cluster ordered first). To identify early 273
immunological signature at day 28 pso that can predict if the individual will be high or low responder 6 274
months pso, we performed SIMON analysis on all immunological parameters (day 28 pso) using 172 275
ML algorithms . Missing values (29% missingness) were removed using multi-set interaction function 276
(‘mulset’, SIMON software), resulting in 30 resamples. Each resample was split into train/test partition 277
(75%/25%) preserving the balanced distribution of the outcome class (seed number 1337). The models 278
were evaluated using 10-fold cross-validation on training sets (train AUROC), and additionally on the 279
held-out test sets (test AUROC). The best performing model was built using the Sparse Partial Least 280
Squares (sPLS) algorithm (train AUROC: 0.95 (CI 0.5-1) and test AUROC: 1). In the final step, SIMON 281
calculated the contribution of each feature to the model as variable importance score (scaled to 282
maximum value of 100). 283
284
Statistical analyses 285
Statistical analysis was performed using R (https://www.r-project.org/), integrative analysis was 286
performed using SIMON software 28, 29, figures were made with R using R package ggplot2 33 and 287
GraphPad Prism 8. Kruskal-Wallis test —unless otherwise specified — was used for comparison of the 288
disease severity groups. Wilcoxon rank-sum test —unless otherwise specified — was employed to 289
compare between study time points. A generalised additive mixed model (GAMM) by restricted 290
maximum likelihood (REML) was used to fit the immunological measures (log10 transformed) using 291
Gaussian process smooth term (R package gamm4 34). ICS cytokine expression analyses was 292
performed using PESTEL v2.0 and SPICE v6.0. Statistical significance was set at P<0.05 and all tests 293
were 2-tailed. Machine learning analysis was performed using SIMON software (https://genular.org). 294
295
Data Availability 296
Data relating to the findings of this study are available from a research data repository Zenodo 297
(https://zenodo.org/record/4905965). 298
299
Results 300
Anti-N IgG decline over time and stratify by disease severity, whilst Anti Spike IgG and memory 301
responses are maintained 302
Anti-nucleocapsid (NP) and spike (S) total IgG (tIgG) responses were assessed by ELISA in both 303
symptomatic and asymptomatic individuals (Fig. 1A). The magnitude of the IgG response varied 304
markedly between people in both cohorts, with a proportion of individuals’ anti-nucleocapsid tIgG level 305
recorded in the negative or indeterminate range of the assay at all time-points. 306
9
307
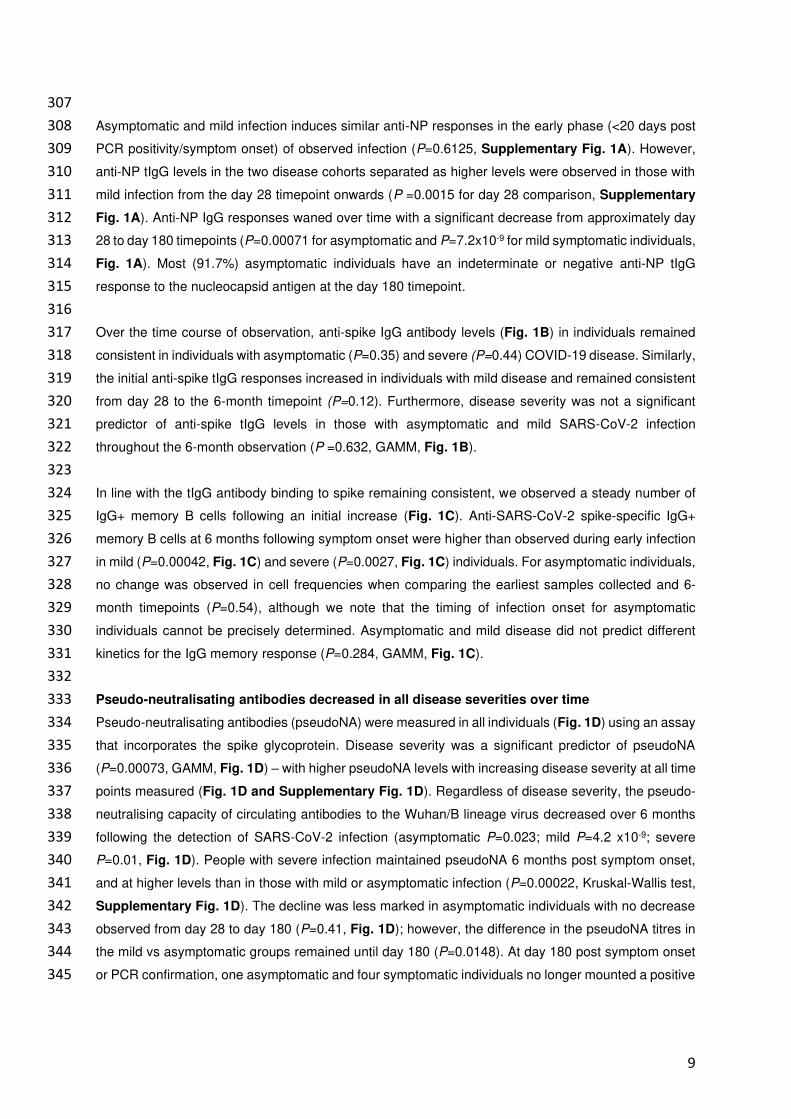
Asymptomatic and mild infection induces similar anti-NP responses in the early phase (<20 days post 308
PCR positivity/symptom onset) of observed infection (P=0.6125, Supplementary Fig. 1A). However, 309
anti-NP tIgG levels in the two disease cohorts separated as higher levels were observed in those with 310
mild infection from the day 28 timepoint onwards (P =0.0015 for day 28 comparison, Supplementary 311
Fig. 1A). Anti-NP IgG responses waned over time with a significant decrease from approximately day 312
28 to day 180 timepoints (P=0.00071 for asymptomatic and P=7.2x10⁻⁹ for mild symptomatic individuals, 313
Fig. 1A). Most (91.7%) asymptomatic individuals have an indeterminate or negative anti-NP tIgG 314
response to the nucleocapsid antigen at the day 180 timepoint. 315
316
Over the time course of observation, anti-spike IgG antibody levels (Fig. 1B) in individuals remained 317
consistent in individuals with asymptomatic (P=0.35) and severe (P=0.44) COVID-19 disease. Similarly, 318
the initial anti-spike tIgG responses increased in individuals with mild disease and remained consistent 319
from day 28 to the 6-month timepoint (P=0.12). Furthermore, disease severity was not a significant 320
predictor of anti-spike tIgG levels in those with asymptomatic and mild SARS-CoV-2 infection 321
throughout the 6-month observation (P =0.632, GAMM, Fig. 1B). 322
323
In line with the tIgG antibody binding to spike remaining consistent, we observed a steady number of 324
IgG+ memory B cells following an initial increase (Fig. 1C). Anti-SARS-CoV-2 spike-specific IgG+ 325
memory B cells at 6 months following symptom onset were higher than observed during early infection 326
in mild (P=0.00042, Fig. 1C) and severe (P=0.0027, Fig. 1C) individuals. For asymptomatic individuals, 327
no change was observed in cell frequencies when comparing the earliest samples collected and 6-328
month timepoints (P=0.54), although we note that the timing of infection onset for asymptomatic 329
individuals cannot be precisely determined. Asymptomatic and mild disease did not predict different 330
kinetics for the IgG memory response (P=0.284, GAMM, Fig. 1C). 331
332
Pseudo-neutralisating antibodies decreased in all disease severities over time 333
Pseudo-neutralisating antibodies (pseudoNA) were measured in all individuals (Fig. 1D) using an assay 334
that incorporates the spike glycoprotein. Disease severity was a significant predictor of pseudoNA 335
(P=0.00073, GAMM, Fig. 1D) – with higher pseudoNA levels with increasing disease severity at all time 336
points measured (Fig. 1D and Supplementary Fig. 1D). Regardless of disease severity, the pseudo-337
neutralising capacity of circulating antibodies to the Wuhan/B lineage virus decreased over 6 months 338
following the detection of SARS-CoV-2 infection (asymptomatic P=0.023; mild P=4.2 x10⁻⁹; severe 339
P=0.01, Fig. 1D). People with severe infection maintained pseudoNA 6 months post symptom onset, 340
and at higher levels than in those with mild or asymptomatic infection (P=0.00022, Kruskal-Wallis test, 341
Supplementary Fig. 1D). The decline was less marked in asymptomatic individuals with no decrease 342
observed from day 28 to day 180 (P=0.41, Fig. 1D); however, the difference in the pseudoNA titres in 343
the mild vs asymptomatic groups remained until day 180 (P=0.0148). At day 180 post symptom onset 344
or PCR confirmation, one asymptomatic and four symptomatic individuals no longer mounted a positive 345
10
result in the pseudoNA assay, one of whom consistently did not mount pseudoNA capacity at all time 346
points measured. 347
348
Mild infection induces a more multifunctional antibody profile 349
A cohort of 30 individuals with mild infection, along with the 9 and 12 participants with severe and 350
asymptomatic infection respectively were selected to comprehensively characterise antibody profiles. 351
352
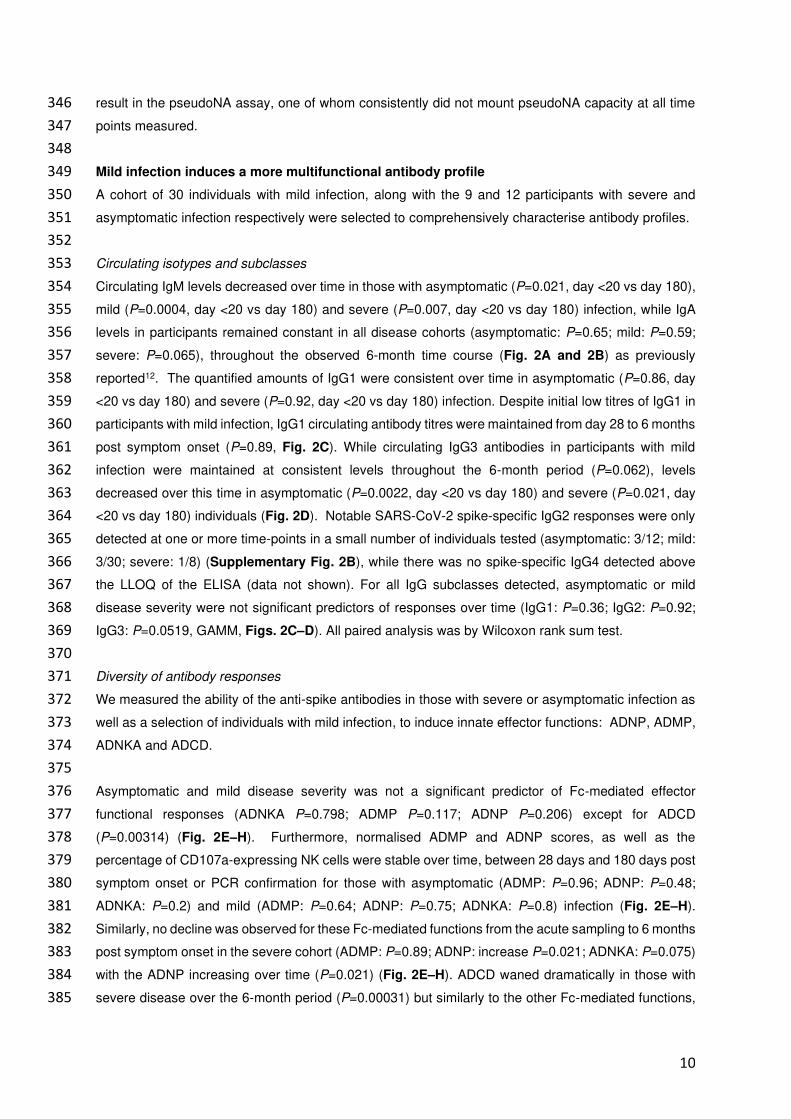
Circulating isotypes and subclasses 353
Circulating IgM levels decreased over time in those with asymptomatic (P=0.021, day <20 vs day 180), 354
mild (P=0.0004, day <20 vs day 180) and severe (P=0.007, day <20 vs day 180) infection, while IgA 355
levels in participants remained constant in all disease cohorts (asymptomatic: P=0.65; mild: P=0.59; 356
severe: P=0.065), throughout the observed 6-month time course (Fig. 2A and 2B) as previously 357
reported12. The quantified amounts of IgG1 were consistent over time in asymptomatic (P=0.86, day 358
<20 vs day 180) and severe (P=0.92, day <20 vs day 180) infection. Despite initial low titres of IgG1 in 359
participants with mild infection, IgG1 circulating antibody titres were maintained from day 28 to 6 months 360
post symptom onset (P=0.89, Fig. 2C). While circulating IgG3 antibodies in participants with mild 361
infection were maintained at consistent levels throughout the 6-month period (P=0.062), levels 362
decreased over this time in asymptomatic (P=0.0022, day <20 vs day 180) and severe (P=0.021, day 363
<20 vs day 180) individuals (Fig. 2D). Notable SARS-CoV-2 spike-specific IgG2 responses were only 364
detected at one or more time-points in a small number of individuals tested (asymptomatic: 3/12; mild: 365
3/30; severe: 1/8) (Supplementary Fig. 2B), while there was no spike-specific IgG4 detected above 366
the LLOQ of the ELISA (data not shown). For all IgG subclasses detected, asymptomatic or mild 367
disease severity were not significant predictors of responses over time (IgG1: P=0.36; IgG2: P=0.92; 368
IgG3: P=0.0519, GAMM, Figs. 2C–D). All paired analysis was by Wilcoxon rank sum test. 369
370
Diversity of antibody responses 371
We measured the ability of the anti-spike antibodies in those with severe or asymptomatic infection as 372
well as a selection of individuals with mild infection, to induce innate effector functions: ADNP, ADMP, 373
ADNKA and ADCD. 374
375
Asymptomatic and mild disease severity was not a significant predictor of Fc-mediated effector 376
functional responses (ADNKA P=0.798; ADMP P=0.117; ADNP P=0.206) except for ADCD 377
(P=0.00314) (Fig. 2E–H). Furthermore, normalised ADMP and ADNP scores, as well as the 378
percentage of CD107a-expressing NK cells were stable over time, between 28 days and 180 days post 379
symptom onset or PCR confirmation for those with asymptomatic (ADMP: P=0.96; ADNP: P=0.48; 380
ADNKA: P=0.2) and mild (ADMP: P=0.64; ADNP: P=0.75; ADNKA: P=0.8) infection (Fig. 2E–H). 381
Similarly, no decline was observed for these Fc-mediated functions from the acute sampling to 6 months 382
post symptom onset in the severe cohort (ADMP: P=0.89; ADNP: increase P=0.021; ADNKA: P=0.075) 383
with the ADNP increasing over time (P=0.021) (Fig. 2E–H). ADCD waned dramatically in those with 384
severe disease over the 6-month period (P=0.00031) but similarly to the other Fc-mediated functions, 385
11
ADCD remained consistent from day 28 to day 180 in asymptomatic (P=0.34) and mild (P=0.1) infection 386
(Fig. 2E–H). Despite waning over time, ADCD responses differed amongst the disease severity groups 387
out until day 180 (P=0.0032, Kruskal-Wallis test, Supplementary Fig. 1L). All paired analysis were by 388
Wilcoxon rank sum test. 389
390
We visualised the relative contribution of each of the anti-SARS-CoV-2 spike antibody feature in Fig. 391
2I. The polar plots demonstrate the diversity of asymptomatic and mild infection-induced antibody 392
characteristics and functions on day 28 and day 180. Each wedge represents an antibody feature, and 393
the size of each wedge is indicative of the magnitude of the response. The consistently high spike-394
specific IgG and spike-specific IgG+ memory B cells is clearly reflected in these plots for both mild and 395
asymptomatic individuals. For both day 28 and day 180, a more multifunctional response was observed 396
in individuals with mild infection, particularly for the antibody-dependent phagocytosis effector functions, 397
which contribute markedly less to the antibody profile of asymptomatic individuals. Over time, few 398
marked changes were observed in the relative contribution of the SARS-COV-2-specific antibody 399
features in asymptomatic individuals, apart from an increased contribution of IgG1 and ADNKA, and 400
decreased IgG3. Similarly, for individuals with mild infection, substantial relative decreases in IgM, 401
pseudo-neutralising antibodies, IgA and IgG3 were noted, as well as relative increases in ADNKA and 402
ADNP to the antibody profile. 403
404
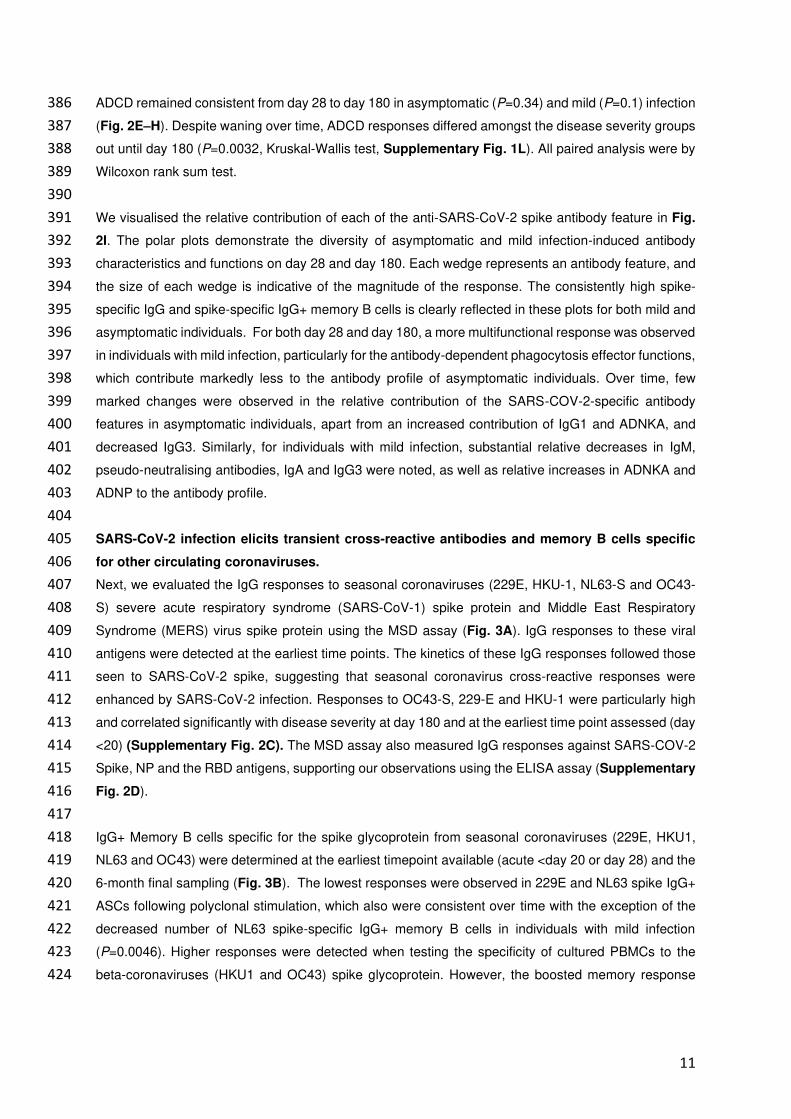
SARS-CoV-2 infection elicits transient cross-reactive antibodies and memory B cells specific 405
for other circulating coronaviruses. 406
Next, we evaluated the IgG responses to seasonal coronaviruses (229E, HKU-1, NL63-S and OC43-407
S) severe acute respiratory syndrome (SARS-CoV-1) spike protein and Middle East Respiratory 408
Syndrome (MERS) virus spike protein using the MSD assay (Fig. 3A). IgG responses to these viral 409
antigens were detected at the earliest time points. The kinetics of these IgG responses followed those 410
seen to SARS-CoV-2 spike, suggesting that seasonal coronavirus cross-reactive responses were 411
enhanced by SARS-CoV-2 infection. Responses to OC43-S, 229-E and HKU-1 were particularly high 412
and correlated significantly with disease severity at day 180 and at the earliest time point assessed (day 413
<20) (Supplementary Fig. 2C). The MSD assay also measured IgG responses against SARS-COV-2 414
Spike, NP and the RBD antigens, supporting our observations using the ELISA assay (Supplementary 415
Fig. 2D). 416
417
IgG+ Memory B cells specific for the spike glycoprotein from seasonal coronaviruses (229E, HKU1, 418
NL63 and OC43) were determined at the earliest timepoint available (acute <day 20 or day 28) and the 419
6-month final sampling (Fig. 3B). The lowest responses were observed in 229E and NL63 spike IgG+ 420
ASCs following polyclonal stimulation, which also were consistent over time with the exception of the 421
decreased number of NL63 spike-specific IgG+ memory B cells in individuals with mild infection 422
(P=0.0046). Higher responses were detected when testing the specificity of cultured PBMCs to the 423
beta-coronaviruses (HKU1 and OC43) spike glycoprotein. However, the boosted memory response 424
12
was transient, particularly in individuals with mild infection (HKU1: P=1x10⁻⁷; OC43: P=1.5x10⁻⁷) in 425
which the decrease was more marked, which may be due to a higher sample number. 426
427
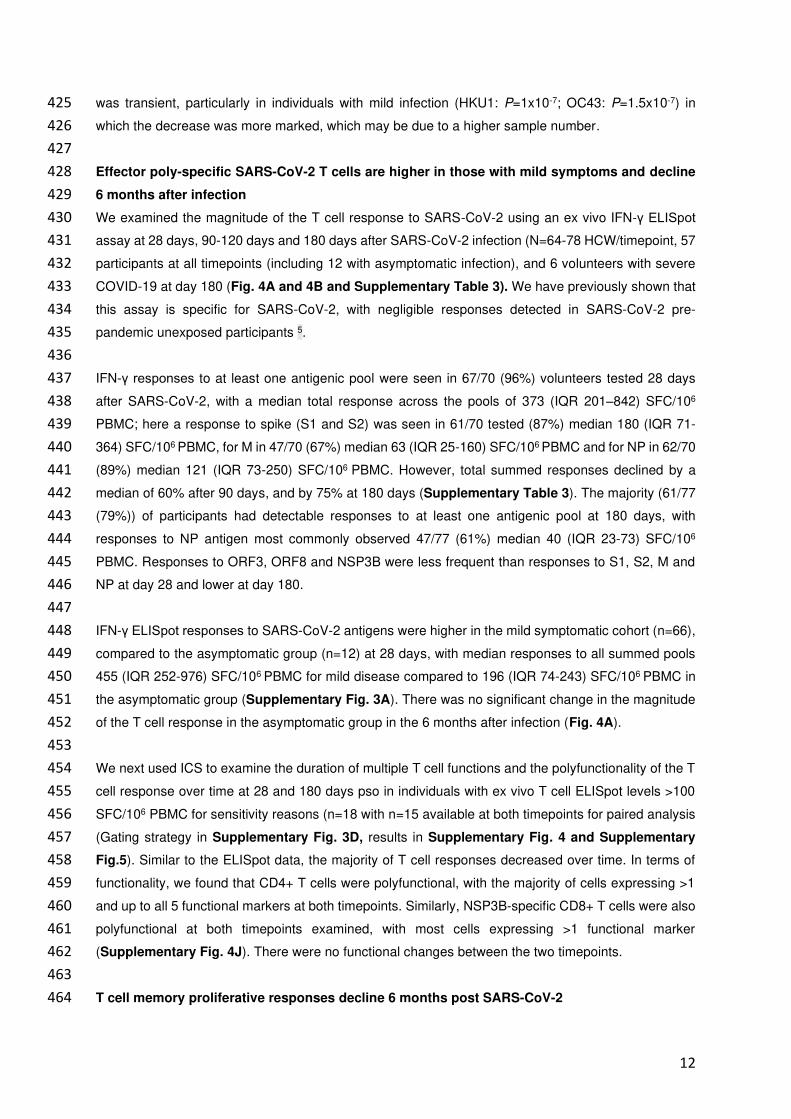
Effector poly-specific SARS-CoV-2 T cells are higher in those with mild symptoms and decline 428
6 months after infection 429
We examined the magnitude of the T cell response to SARS-CoV-2 using an ex vivo IFN-γ ELISpot 430
assay at 28 days, 90-120 days and 180 days after SARS-CoV-2 infection (N=64-78 HCW/timepoint, 57 431
participants at all timepoints (including 12 with asymptomatic infection), and 6 volunteers with severe 432
COVID-19 at day 180 (Fig. 4A and 4B and Supplementary Table 3). We have previously shown that 433
this assay is specific for SARS-CoV-2, with negligible responses detected in SARS-CoV-2 pre-434
pandemic unexposed participants 5. 435
436
IFN-γ responses to at least one antigenic pool were seen in 67/70 (96%) volunteers tested 28 days 437
after SARS-CoV-2, with a median total response across the pools of 373 (IQR 201–842) SFC/106 438
PBMC; here a response to spike (S1 and S2) was seen in 61/70 tested (87%) median 180 (IQR 71-439
364) SFC/106 PBMC, for M in 47/70 (67%) median 63 (IQR 25-160) SFC/106 PBMC and for NP in 62/70 440
(89%) median 121 (IQR 73-250) SFC/106 PBMC. However, total summed responses declined by a 441
median of 60% after 90 days, and by 75% at 180 days (Supplementary Table 3). The majority (61/77 442
(79%)) of participants had detectable responses to at least one antigenic pool at 180 days, with 443
responses to NP antigen most commonly observed 47/77 (61%) median 40 (IQR 23-73) SFC/106 444
PBMC. Responses to ORF3, ORF8 and NSP3B were less frequent than responses to S1, S2, M and 445
NP at day 28 and lower at day 180. 446
447
IFN-γ ELISpot responses to SARS-CoV-2 antigens were higher in the mild symptomatic cohort (n=66), 448
compared to the asymptomatic group (n=12) at 28 days, with median responses to all summed pools 449
455 (IQR 252-976) SFC/106 PBMC for mild disease compared to 196 (IQR 74-243) SFC/106 PBMC in 450
the asymptomatic group (Supplementary Fig. 3A). There was no significant change in the magnitude 451
of the T cell response in the asymptomatic group in the 6 months after infection (Fig. 4A). 452
453
We next used ICS to examine the duration of multiple T cell functions and the polyfunctionality of the T 454
cell response over time at 28 and 180 days pso in individuals with ex vivo T cell ELISpot levels >100 455
SFC/106 PBMC for sensitivity reasons (n=18 with n=15 available at both timepoints for paired analysis 456
(Gating strategy in Supplementary Fig. 3D, results in Supplementary Fig. 4 and Supplementary 457
Fig.5). Similar to the ELISpot data, the majority of T cell responses decreased over time. In terms of 458
functionality, we found that CD4+ T cells were polyfunctional, with the majority of cells expressing >1 459
and up to all 5 functional markers at both timepoints. Similarly, NSP3B-specific CD8+ T cells were also 460
polyfunctional at both timepoints examined, with most cells expressing >1 functional marker 461
(Supplementary Fig. 4J). There were no functional changes between the two timepoints. 462
463
T cell memory proliferative responses decline 6 months post SARS-CoV-2 464
13
We and others have found the assessment of T cell proliferation to be a sensitive method of detecting 465
antigen-specific recall responses. We used this assay to evaluate the frequency of circulating SARS-466
CoV-2-specific CD4+ and CD8+ T cell in our longitudinal cohort (n = 54 – 57; gating strategy presented 467
in Supplementary Fig. 3B). 468
469
We did not observe any differences in the magnitude of circulating FEC-specific (control) CD4+ or CD8+ 470
T cells within the 6 months period (Supplementary Fig. 3C). In the asymptomatic group, at 28 days 471
pso 7/8 (87.5%) made a CD4+ T cell response to at least one SARS-CoV-2 protein (excluding S1 and 472
S2 where have previously reported finding responses in the majority of unexposed volunteers 5) while 473
5/8 (62.5%) of them had CD8 T cell response to at least one of M, NP, ORF3 or ORF8 proteins (Fig. 474
5A-C Supplementary Table 4). Most of this response was targeted to M and NP (Fig. 5A-C and 475
Supplementary Table 4). At 180 days pso, 6/8 (75%) of recovered subjects had a CD4+ or CD8+ T 476
cell response which was mostly focused on M, NP and ORF3. We observed no difference in the 477
proliferative capacity of SARS-CoV-2-specific CD4 and CD8 T cells at 28- and 180-days post disease 478
onset in the group with asymptomatic disease (n = 8) (Fig. 5A-C and Supplementary table 4 and 5). 479
480
In the cohort with mild disease, at 28 days, T cell responses to at least one SARS-CoV-2 protein outside 481
of spike region were observed in 42/49 (86%) for CD4+ T cells and 45/49 (91%) for CD8+ T cells. 482
Similar to the asymptomatic cohort, these responses were focused on M, NP and ORF3 regions of 483
SARS-CoV-2 (Fig. 5A-C, Supplementary Table 4). At 180 days after symptom onset, this frequency 484
of people responding to at least one protein as above reduced to 37/49 (75%) within CD4+ T cells and 485
35/49 (71%) for CD8+ T cells with a focus on M, NP and ORF3 similar to CD4+ T cells (Fig. 5A-C and 486
supplementary Table 4 and 5). In the volunteers with mild disease, we found a significant reduction 487
in the circulating frequencies of SARS-CoV-2-specific CD4+ and CD8+ T cells to all proteins except NP 488
and ORF8 for CD4+ and ORF3 and ORF8 for CD8+ T cells by day 180 (Fig. 5A-C). 489
490
When we assessed the difference in the magnitude of the proliferative CD4+ and CD8+ T cell responses 491
at 28- and 180 days pso in both asymptomatic and mild cases (analysed together as one group), we 492
found significantly higher frequencies of SARS-CoV-2 specific CD4+ T cells compared to CD8+ 493
responses at both timepoints in all proteins except NP and ORF8 for 28- and 180-days post symptom 494
onset and ORF3 responses at 28 days post symptom onset only. Our data shows that the bias in 495
antigen-specific responses to SARS-CoV-2 towards CD4+ T cells is maintained in the T cell memory 496
compartment long after recovery from acute infection. Taken together, the results show that at 6 months 497
post infection with SARS-CoV-2, convalescent subjects show diminished but detectable anti-SARS-498
CoV-2-specific memory T cells in both the CD4 and CD8 T cell compartments, with only 8/56 (14%) 499
showing no proliferative response to any non-spike protein, suggesting durable immune response at 500
least up to 6 months post initial infection. 501
502
Integrative analysis to Identify immune and clinical parameters associated with disease severity 503
14
To further investigate the trajectory of cellular and humoral adaptive immune responses during SARS-504
CoV-2 infection and relationship with disease severity, we performed integrative analysis on aggregated 505
immunological and clinical data from 433 samples obtained from 86 donors (12 asymptomatic, 66 mild, 506
8 severe) on 6 different timepoints (Fig. 6A). We investigated the trajectory of immune responses after 507
SARS-CoV-2 infection and determined whether samples obtained from individuals with asymptomatic 508
infection are more similar to samples obtained at later timepoints after infection in the individuals with 509
mild, symptomatic disease. A t-distributed stochastic neighbour embedding (t-SNE) representation of 510
integrated data revealed heterogeneity of immune responses in infected individuals, irrespective of days 511
post symptom onset when these samples were collected (Fig. 6B, left panel). Majority of samples were 512
separated between asymptomatic and mild individuals, while there was an overlap in similarity between 513
individuals with mild and more severe disease (Fig. 6B, right panel). To further delineate differences in 514
clinical and immunological parameters of SARS-CoV-2 infected individuals, we performed clustering 515
analysis on the resulting t-SNE representations (Fig. 6C) and compared expression of 16 clinical and 516
49 immunological parameters to identify each of three clusters (Fig. 6D). This approach identified 517
heterogeneity within the SARS-CoV-2 positive individuals with mild disease clustered in two groups 518
(Fig. 6C and 6D, clusters 1 and 2). In cluster 1, the majority of samples displayed increased antibody 519
and T cell responses in comparison to other clusters, and some individuals with mild infection that 520
showed clinical and immunological similarity to severe COVID-19 patients (Fig. 6C and 6D, cluster 1). 521
In contrast, cluster 2 contained individuals with lower overall antibody and T cell responses and all were 522
from individuals with mild disease (Fig. 6C and 6D, cluster 2). Clinical parameters were driving a major 523
separation between asymptomatic SARS-CoV-2 positive individuals from those with mild or sever 524
disease (Fig. 6D, cluster 3). 525
526
To gain an insight into immunological differences between individuals with asymptomatic and mild 527
infection, we performed principal component analysis (PCA) on dataset containing only immunological 528
parameters. The immunological parameters alone could explain 38.6% of variance between SARS-529
CoV-2 positive individuals, while separation was not driven by the disease severity (Fig. 6E). 530
Comparable to t-SNE analysis, samples from individuals with mild disease were separated into three 531
major groups having distinct immunophenotype (immunophenotypic group 1) (Fig. 6E, lower right 532
quadrant) or sharing immunological similarity with samples from individuals with severe 533
(immunophenotypic group 2) (Fig. 6E, upper right quadrant) or asymptomatic disease 534
(immunophenotypic group 3) (Fig. 6E, center). To reveal which parameters are driving the separation, 535
we visualized relationship between variables using correlation plot (Fig. 6F). T cell parameters were 536
driving the separation of immunophenotypic group 1, while antibody responses separated 537
immunophenotypic group 2 (Fig. 6F). The most important variables in explaining the variability between 538
SARS-CoV-2 positive individuals in immunophenotypic group 1 were total IFN-γ ELISpot T cells, S1 539
and S2-stimulated IFN-γ ELISpot T cells, and anti-S IgG, anti-RBD IgG, ADCD, S-IgG from OC43 and 540
HcoV-HKU1 in immunophenotypic group 2 that were correlated with principal components 1 and 2 541
(PC1-PC2) (Fig. 6G and 6H). The correlation plot revealed positive correlation between antibody 542
responses, and negative correlation between T cell responses with the time when samples were 543
15
obtained (Fig. 6F). To further examine these associations between immunological parameters, we 544
performed correlation analysis, which confirmed strong positive correlation between antibody and T 545
cells responses (Fig. 6I). The antibodies directed against N, S and RBD from SARS-CoV-2, were 546
positively correlated with antibody functionality, such as pseudoneutralising capacity and ADCD, ADNP 547
and ADMP, and positively correlated with IFN-γ ELISpot T cell responses against S1, S2 and N (Fig. 548
6I). The antibody responses to S protein from other circulating coronaviruses, such as SARS-CoV-1, 549
MERS, HcoV-HKU1, 229e and OC43 were also contained in this cluster being positively correlated with 550
antibody and T cell responses (Fig. 6I). This cluster was negatively correlated with time, confirming the 551
observations from primary analysis (Fig. 6I). Notably, there was a negative correlation between NL63 552
S antibodies and S and RBD SARS-CoV-2 specific antibodies (Fig. 6I). There were other apparent 553
relationships in two other clusters identified, that were not associated with time, including positive 554
correlation between proliferating T cells stimulated with different SARS-CoV-2-specific peptides, and 555
positive correlation between ADNKA and S-IgA and S-IgG1, while negative correlation with S-IgM (Fig. 556
6I). 557
The integrative analysis revealed three distinct immunophenotypic groups of SARS-CoV-2 infected 558
individuals strongly connected to cellular and humoral immune profiling beyond the disease severity 559
and clinical parameters. 560
561
Identifying an early immunological signature associated with a durable immune response to 562
SARS-CoV-2 563
To elucidate an early immunological signature that could predict whether an individual will mount a 564
durable and protective immunity against SARS-CoV-2 6 months after infection, we stratified SARS-565
CoV-2 infected individuals into high and low responders, based on the seropositivity status (N IgG titres 566
>=1.4), which has recently been identified as a correlate of protection 35. We then asked whether the 567
components of cellular or humoral immunity within one month of infection (28 days pso) were predictive 568
of the ability of individuals to develop protective immunity against SARS-CoV-2 (6 months pso). First, 569
using an unsupervised machine learning approach, i.e., hierarchical clustering of integrated 570
immunological data on day 28 pso, we identified two groups of SARS-CoV-2 infected individuals based 571
on the response status 6 months pso (Fig. 7A). While the majority of SARS-CoV-2 infected individuals 572
with mild disease would mount protective immunity 6 months pso and become high responders, there 573
was a proportion of individuals with mild disease that failed to mount durable and protective immunity 574
(low responders) (Fig. 7A). The majority of individuals with asymptomatic infection were low 575
responders. High responders mounted stronger antibody responses, in particular N-IgG and pseudo-576
neutralising antibodies, and overall, stronger T cell responses, including IFN-γ-positive and proliferating 577
T cells, than low responders 28 days pso (Fig. 7A). Antibody responses to spike protein from 229e and 578
NL63, B cell ELISpot and ADNKA were increased in low responders early after SARS-CoV-2 infection 579
in comparison to high responders (Fig. 7A). 580
581
To further define the immunological features that can distinguish individuals with durable and protective 582
immunity and predict if the individual is on the trajectory to become a high or low responder, we used 583
16
the SIMON supervised machine learning approach 28, 29. We generated 30 resamples and tested 3,565 584
models using 172 machine learning algorithms (Materials and methods). The best performing model 585
built using Sparse Partial Least Squares (sPLS) algorithm (train AUROC: 0.95 (CI 0.5-1) and test 586
AUROC: 1) used only 8 out of 49 measured parameters on day 28 pso to predict if the individual will 587
become high or low responder 6 months pso (Fig. 7B). The features that were contributing the most to 588
this model included antibody responses to N and S, ADCD and pseudo-neutralising antibodies to 589
SARS-CoV-2, and T cell IFN-γ ELISpot (S1/S2, M and total positive T cells) which were significantly 590
increased in high responders 28 days pso compared to low responders (Fig. 7C and 7D). Together, 591
these data indicate that early generation of antibodies with high binding, neutralising and effector 592
function, and functional T cell responses following infection can predict the responsiveness potential, 593
i.e., protection and duration of SARS-CoV-2 immunity of the individual. Additionally, these findings 594
suggest that a coordinated action of both T and B cells early after infection is required for establishment 595
of durable and protective immunity. 596
597
The generation of durable and functional humoral and cellular immunity in a proportion of SARS-CoV-598
2 infected individuals (high responders) may provide protection against re-infection, including also 599
against variants of concern (VOCs). Thus, we assessed the neutralising antibody responses in high 600
and low responders against the infecting (Victoria) strain and against variants B.1.1.7 and B.1.351 (Fig. 601
7E). Individuals with durable and protective SARS-CoV2 immunity shown high neutralisation antibody 602
titres against wild-type circulating SARS-CoV-2 (Victoria) strain, and against two novel variants, 603
including B.1.1.7 (alpha) and B.1.351 (beta) (Fig. 7E). High responders had significantly higher 604
neutralising antibody titres against B.1.1.7 alpha variant one-month pso, and these higher neutralising 605
antibodies were preserved 6 months pso (Fig. 7E). 606
607
Altogether, these data suggest that generation of immunity to SARS-COV-2 shows distinct trajectories 608
following early priming, and early antibody responses are important to mediate protective and durable 609
immunity that can also provide protection against novel variants. 610
611
Discussion 612
Key questions on the trajectory of the SARS-CoV-2 specific immune response to natural infection, and 613
the maintenance of immune memory remain highly relevant even as highly effective vaccines are being 614
rolled out worldwide. Firstly, even with high availability of vaccines there will always be a pool of 615
unvaccinated people due to vaccine hesitancy or access difficulties, and this will include people who 616
have had natural infection. Secondly, as of June 2021 only 12% of the world’s population is estimated 617
to have received at least one dose of vaccine 36, so for much of the immunity globally is from natural 618
infection, which remains a cornerstone of population-level immunity. Thirdly, measuring immune 619
responses to antigens not included in spike-containing vaccines are used as biomarkers of previous 620
SARS-CoV-2 infection and as such are widely used to stratify immune responses to vaccination, since 621
prior SARS-CoV-2 is known to enhance vaccine responsiveness 37, 38. Finally, understanding how the 622
early immune response translates into lasting immunity towards emerging variants of concern is crucial 623
17
to accelerate predictions of population risk and to drive policy. In this manuscript, we characterise the 624
magnitude, function and maintenance of humoral and cellular T and B cell immunity, and the 625
relationship between clinical and multi parametric immune data. We then evaluate the ability of 626
antibodies to neutralise live SARS-CoV-2 virus 6 months after primary infection to variants of concern 627
and provide insight into the early predictors of durable neutralising antibody after natural infection. 628
629
Compatible with other studies 12, 39, 40, 41, our data shows a peak of anti-NP and anti-S binding antibody 630
(IgG) magnitude 28 days after onset of symptoms, with anti-NP responses declining over the next five 631
months, although these responses remain above the threshold of detection in the majority. In contrast, 632
anti-S IgG responses were well maintained, in keeping with the reported longer half-life for decay of 633
anti-S IgG responses compared with anti-NP IgG responses 12, along with maintenance of B cell 634
memory. Neutralisation measured by a pseudo-neutralisation assay showed a decline over time but 635
was generally maintained six months following infection. High levels of neutralisation were seen earlier 636
post symptom onset (from 7 days) compared with the IgG binding assays, which may represent 637
contributions from IgM 42 and IgA 43. Some of the observed decline in neutralising antibodies over time 638
may represent a threshold effect – NAb are a subset of total IgG such that gradual declines over time 639
are first measurable in NAb, but biologically important neutralisation may still occur below the detection 640
threshold. Fc-mediated functionality including antibody dependent NK activation, phagocytosis and 641
complement deposition was maintained over the 6 months duration which may make an important 642
contribution to protective immunity and was significantly associated with increasing disease severity. 643
644
Taken together, B cell polyfunctionality was lower in those with asymptomatic infection, compared with 645
those with mild disease early after infection (day 28), though by 6 months the profiles between the 646
cohorts looked similar. The most notable changes were a reduction in IgM spike responses but a relative 647
maintenance of IgG3 spike responses in the mild cohort that was not seen in the asymptomatic cohort. 648
649
Previous studies have shown that early distinct antigenic targets and qualitative features of SARS-CoV-650
2-specific antibodies are associated with disease trajectory 44, 45, whilst multifunctional antibody 651
responses, and particularly ADCD and ADNP, following adoptive transfer of IgG from convalescent 652
rhesus macaques have been shown to contribute to protection from SARS-CoV-2 challenge 46. 653
Furthermore, vaccine-induced Fc-mediated polyfunctionality has been observed following 654
administration of efficacious vaccines in both macaque and human studies 31, 47. While the capacity of 655
Fc receptor binding appears to be lower in convalescent individuals against VOCs, evidence is 656
emerging of maintenance of vaccine-induced Fc-functional antibody properties against VOCs 657
supporting resilience of humoral immunity against VOCs independent of neutralisation 48. 658
659
In evaluating SARS-CoV-2 specific effector T cell responses over six months in an IFN-γ ELISpot assay, 660
we showed that there was significant heterogeneity in the magnitude of responses between individuals 661
as previously reported 12, 49, 50. The majority of people showed robust T cell responses in the first 28 662
days after infection, though these were significantly lower in the asymptomatic cohort. Within 3 months 663
18
of infection there was a marked decline in T cell responses and by 6 months, these were reduced by 664
75% and were undetectable in approximately 20%. We used a flow cytometry based 7-day proliferation 665
assay to assess memory T responses of both CD4+ and CD8+ T cell subsets to show a dominant CD4+ 666
T cell subset response. Although memory proliferative responses have been shown to “mature” over 667
time, particularly following vaccination 51, 52, we show that proliferative responses (both CD4 and CD8), 668
targeting Spike, M, and NP decline markedly between day 28 and day 180. ICS analysis showed that 669
CD4+ T cells were the dominant subset targeting S1, S2 and M antigens, whilst NP were targeted by 670
both CD4+ and CD8+ T cells, and NSP3B was targeted by CD8+ T cells. Polyfunctional T cells, 671
producing multiple cytokines, were generated at day 28, and although the magnitude of the response 672
declined, polyfunctionality was generally retained out to 6 months. 673
674
In our study we show that symptomatic infection is associated with more robust cellular and humoral 675
immune responses compared to the asymptomatic group early after PCR+ confirmed infection. An 676
association between asymptomatic infection and lower antibody responses has been previously 677
reported 53, and we and others have shown a correlation between disease severity and higher levels of 678
antibody and T cell responses in early disease 4, 54. Similar results have been reported in other disease 679
settings including robust immune responses associated with disease severity in H1N1/09 influenza A 680
55. In contrast, a previous prospective SARS-CoV-2 screening study has observed that asymptomatic 681
infection is associated with highly functional cellular immune responses 56. Either way, humoral and 682
cellular immune responses measured months after primary infection is found at low magnitude following 683
asymptomatic infection. These findings raise the possibility that people with asymptomatic SARS-CoV-684
2 infection may have less protective immunity months after primary infection. A limitation to our study, 685
is that the timing of infection onset in asymptomatic HCW, (even though PCR+) is not precisely defined. 686
As such, it is theoretically possible that the asymptomatic individuals in our study are later in their 687
disease course at detection, which was further explored by integrative analysis. 688
689
To elucidate the trajectory of the immune response of SARS-CoV-2 infected individuals over time and 690
identify signatures associated with the maintenance of protective immunity, we performed an integrative 691
analysis in the cohort of 86 individuals on all 433 samples. The results of the integrative analysis led to 692
several key findings. First is the identification of immunophenotypic groups of SARS-CoV-2 infected 693
individuals beyond disease time course and disease severity. By integrating over 70 immune 694
parameters with clinical data, disease severity and temporal changes, we generated a computational 695
model using t-SNE embedding algorithm that coupled immunological phenotypes of each individual 696
with the disease severity and other clinical parameters. The t-SNE representation of integrated data 697
revealed minimal clustering by time point, suggesting that heterogeneity of the immune response during 698
the SARS-CoV-2 infection is independent of the time course during the infection. While some of the 699
individuals with asymptomatic infection may be later in their disease course at detection, the majority 700
did not cluster with the samples obtained from individuals with mild or severe infection at later timepoints 701
after the infection. The major separation of individuals with asymptomatic disease was driven by clinical 702
parameters, while the mild cohort clustered into 2 immunophenotypic groups (not driven by clinical 703
19
parameters), one of which shared phenotype with the severe disease cohort. The PCA analysis 704
provided further support for the heterogeneity of the immune responses in the SARS-CoV-2 infected 705
individuals with mild disease and separation into three immunophenotypic groups, confirming that 706
38.6% of variance between individuals was explained by the immunological data. The results suggested 707
that immunophenotypic group 1, exhibiting robust binding (anti-N and anti-S) and functional 708
(pseudoneutralising and ADCD/ADMP) antibody responses and memory B cell involvement, shared 709
similarity with individuals with severe disease, while immunophenotypic group 2 composed of functional 710
IFN-γ T cell responses represented an unique proportion of individuals with mild disease, early in the 711
course of the disease (as indicated by negative correlation with time when samples were acquired). 712
The third immunophenotypic group – defined by the lower overall antibody and T cell responses - 713
shared similarities with the asymptomatic cohort, suggesting that some individuals may fail to develop 714
robust antibody and T cell responses despite having mild infection. These results support the magnitude 715
of the immune response being determined by factors beyond disease severity, including viral factors 716
and the individual’s immunocompetence. Using correlation analyses, we observed a positive 717
association between spike and nucleocapsid T cell and antibody responses (both decreased with time, 718
confirming the primary analysis) and cross-reactivity to other coronaviruses which correlated with spike 719
and nucleocapsid T cell and antibody responses (NL63 is negatively correlated and OC43 is positively 720
correlated), substantiating the findings that immunity may be defined by immunocompetence and 721
previous exposure to circulating coronaviruses. 722
723
To further delineate this observation, we performed integrative analysis using baseline parameters only 724
(measured on day 28 after infection), and this led to the second key finding – identification of an early 725
immunological signature that is associated with durable and protective SARS-CoV-2 immunity. Using 726
hierarchical clustering approach and integrated baseline cellular and humoral immune parameters, we 727
observed distinct clustering of high and low responders at this early time point. High anti-N IgG, along 728
with more robust overall T cell responses (including IFN-γ ELISpot and proliferation) at baseline with a 729
low response to seasonal coronaviruses (NL63 and 229e) dominated in the high responder group, 730
whilst low responders had lower anti-N IgG and overall T cell responses and had more pronounced 731
cross-reactive seasonal CoV responses (NL63 and 229e) at baseline. The final major finding was the 732
ability to predict if the individual will generate durable and protective SARS-CoV-2 immunity 6 months 733
post infection based on the early immunological signature one month after infection. With the use of 734
SIMON data mining tool and generation of more than 3,500 predictive machine learning models, we 735
identified upregulation of antibody responses (spike and NP, with pseudoneutralising and ADCD 736
functions) combined with the more robust T cell responses as predictors of individuals who will generate 737
durable and protective immunity 6 months post infection (high responders). The predictive model built 738
by SIMON suggests a link between both arms of the immune response - cellular and humoral immunity 739
– with the durability of the SARS-CoV-2 protective immunity. Thus, this early immunological signature 740
may determine essential differences of the trajectory that each individual will take after SARS-CoV-2 741
infection. Importantly, the sera of the individuals who will go on to generate durable and protective 742
SARS-CoV-2 immunity (high responders) 6 months post infection, were better able to neutralise both 743
20
the Victoria strain (the likely infection strain), and also the VOCs (B.1.1.7 - alpha and B.1.351 - beta) 744
one month after infection, and such protective neutralising antibody responses were durable (as 745
measured 6 months post infection). In contrast, those who were low responders 6 months after infection 746
showed a reduction in the capacity to neutralise the Victoria strain, with a severe loss of neutralisation 747
against both VOC - particularly B1.351. 748
749
Overall, our data reveal the highly variable range of immunity after SARS-CoV-2 infection and suggest 750
that immune events primed during early SARS-CoV-2 infection may define the subsequent trajectories 751
leading to the effective maintenance or loss of long-term SARS-CoV-2 protective immunity as measured 752
by neutralising antibodies. Importantly, previous infection may not give ongoing protection against VOC 753
months later, and people with asymptomatic infection had lower responses at all time points across 754
many of the immune parameters we measured. Maintenance of immune memory over time is critically 755
required for the effective neutralisation of VOC that is most likely to confer sterilising immunity, whilst 756
other immune mechanisms including non-neutralising antibodies and T cells may account for the 757
protection against severe disease, including for VOC 57, 58, 59, 60. This study provides a basis for more 758
targeted vaccination programme of previously infected individuals based on early immunological 759
signature 28 days after infection. 760
761
Figure Legends 762
763
Figure 1: Longitudinal humoral immune responses in individuals with PCR confirmed SARS-764
CoV-2 asymptomatic, mild or severe infection. 765
Humoral immune responses were assessed in acute and convalescent by binding antibody ELISA for 766
total IgG specific to the (A) Nucleopcapsid and (B) Spike glycoprotein, quantification of (C) IgG 767
memory B cells specific to the spike glycoprotein, and (D) pseudoneutralisation antibody titres. Boxplots 768
represent the median with interquartile range, a Wilcoxon rank-sum test was used to compare between 769
study time points. A generalised additive mixed model (GAMM) by restricted maximum likelihood — 770
right-hand plots — was used to fit the immunological measures (log10 transformed) taken at multiple 771
study time points, using Gaussian process smooth term. Disease severity group was included in the 772
GAMM as a linear predictor and a participant identifier was included as a random effect. See Table S1 773
for number of individuals evaluated per assay. 774
775
Figure 2: Antibody isotype, subclass and function in individuals with PCR confirmed SARS-776
CoV-2 asymptomatic, mild or severe infection. 777
SARS-CoV-2 spike-specific antibody isotype and subclasses measured post-infection: (A) IgM, (B) IgA, 778
(C) IgG1 and (D) IgG3. Antibody function measure post-SARS-CoV-2 infection: (E) antibody-dependent 779
NK cell activation (ADNKA), (F) antibody-dependent neutrophil phagocytosis (ADNP), (G) antibody-780
dependent monocyte phagocytosis (ADMP) and (H) antibody-dependent complement deposition 781
(ADCD). (I) Polar plot of various antibody isotype, subclass and function data, minimum-maximum 782
normalised. Boxplots represent the median with interquartile range, a Wilcoxon rank-sum test was 783
used to compare between study time points. A generalised additive mixed model (GAMM) by restricted 784
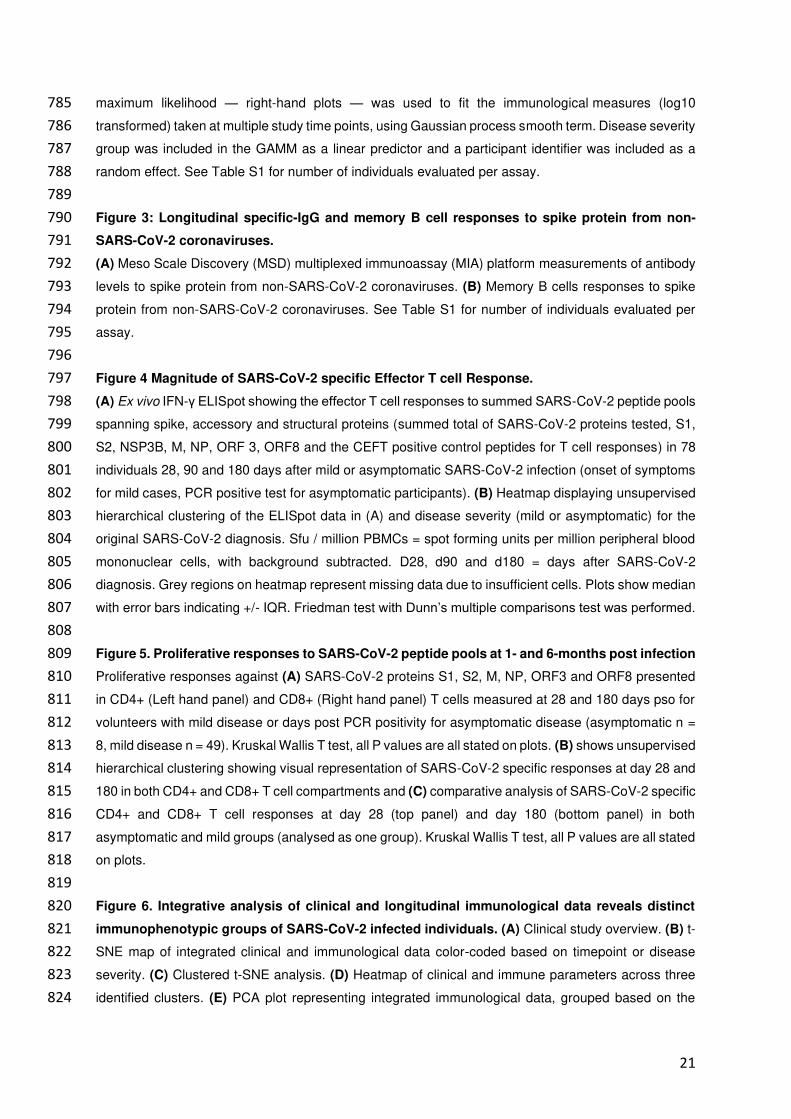
21
maximum likelihood — right-hand plots — was used to fit the immunological measures (log10 785
transformed) taken at multiple study time points, using Gaussian process smooth term. Disease severity 786
group was included in the GAMM as a linear predictor and a participant identifier was included as a 787
random effect. See Table S1 for number of individuals evaluated per assay. 788
789
Figure 3: Longitudinal specific-IgG and memory B cell responses to spike protein from non-790
SARS-CoV-2 coronaviruses. 791
(A) Meso Scale Discovery (MSD) multiplexed immunoassay (MIA) platform measurements of antibody 792
levels to spike protein from non-SARS-CoV-2 coronaviruses. (B) Memory B cells responses to spike 793
protein from non-SARS-CoV-2 coronaviruses. See Table S1 for number of individuals evaluated per 794
assay. 795
796
Figure 4 Magnitude of SARS-CoV-2 specific Effector T cell Response. 797
(A) Ex vivo IFN-γ ELISpot showing the effector T cell responses to summed SARS-CoV-2 peptide pools 798
spanning spike, accessory and structural proteins (summed total of SARS-CoV-2 proteins tested, S1, 799
S2, NSP3B, M, NP, ORF 3, ORF8 and the CEFT positive control peptides for T cell responses) in 78 800
individuals 28, 90 and 180 days after mild or asymptomatic SARS-CoV-2 infection (onset of symptoms 801
for mild cases, PCR positive test for asymptomatic participants). (B) Heatmap displaying unsupervised 802
hierarchical clustering of the ELISpot data in (A) and disease severity (mild or asymptomatic) for the 803
original SARS-CoV-2 diagnosis. Sfu / million PBMCs = spot forming units per million peripheral blood 804
mononuclear cells, with background subtracted. D28, d90 and d180 = days after SARS-CoV-2 805
diagnosis. Grey regions on heatmap represent missing data due to insufficient cells. Plots show median 806
with error bars indicating +/- IQR. Friedman test with Dunn’s multiple comparisons test was performed. 807
808
Figure 5. Proliferative responses to SARS-CoV-2 peptide pools at 1- and 6-months post infection 809
Proliferative responses against (A) SARS-CoV-2 proteins S1, S2, M, NP, ORF3 and ORF8 presented 810
in CD4+ (Left hand panel) and CD8+ (Right hand panel) T cells measured at 28 and 180 days pso for 811
volunteers with mild disease or days post PCR positivity for asymptomatic disease (asymptomatic n = 812
8, mild disease n = 49). Kruskal Wallis T test, all P values are all stated on plots. (B) shows unsupervised 813
hierarchical clustering showing visual representation of SARS-CoV-2 specific responses at day 28 and 814
180 in both CD4+ and CD8+ T cell compartments and (C) comparative analysis of SARS-CoV-2 specific 815
CD4+ and CD8+ T cell responses at day 28 (top panel) and day 180 (bottom panel) in both 816
asymptomatic and mild groups (analysed as one group). Kruskal Wallis T test, all P values are all stated 817
on plots. 818
819
Figure 6. Integrative analysis of clinical and longitudinal immunological data reveals distinct 820
immunophenotypic groups of SARS-CoV-2 infected individuals. (A) Clinical study overview. (B) t-821
SNE map of integrated clinical and immunological data color-coded based on timepoint or disease 822
severity. (C) Clustered t-SNE analysis. (D) Heatmap of clinical and immune parameters across three 823
identified clusters. (E) PCA plot representing integrated immunological data, grouped based on the 824
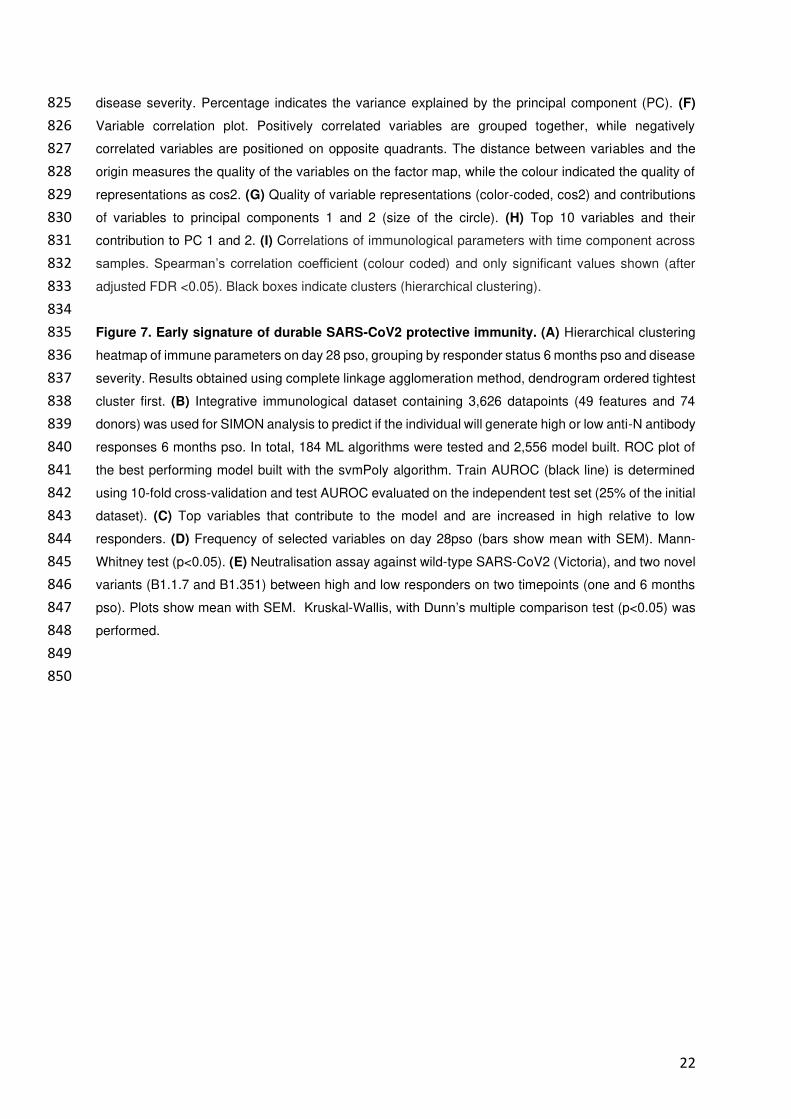
22
disease severity. Percentage indicates the variance explained by the principal component (PC). (F) 825
Variable correlation plot. Positively correlated variables are grouped together, while negatively 826
correlated variables are positioned on opposite quadrants. The distance between variables and the 827
origin measures the quality of the variables on the factor map, while the colour indicated the quality of 828
representations as cos2. (G) Quality of variable representations (color-coded, cos2) and contributions 829
of variables to principal components 1 and 2 (size of the circle). (H) Top 10 variables and their 830
contribution to PC 1 and 2. (I) Correlations of immunological parameters with time component across 831
samples. Spearman’s correlation coefficient (colour coded) and only significant values shown (after 832
adjusted FDR <0.05). Black boxes indicate clusters (hierarchical clustering). 833
834
Figure 7. Early signature of durable SARS-CoV2 protective immunity. (A) Hierarchical clustering 835
heatmap of immune parameters on day 28 pso, grouping by responder status 6 months pso and disease 836
severity. Results obtained using complete linkage agglomeration method, dendrogram ordered tightest 837
cluster first. (B) Integrative immunological dataset containing 3,626 datapoints (49 features and 74 838
donors) was used for SIMON analysis to predict if the individual will generate high or low anti-N antibody 839
responses 6 months pso. In total, 184 ML algorithms were tested and 2,556 model built. ROC plot of 840
the best performing model built with the svmPoly algorithm. Train AUROC (black line) is determined 841
using 10-fold cross-validation and test AUROC evaluated on the independent test set (25% of the initial 842
dataset). (C) Top variables that contribute to the model and are increased in high relative to low 843
responders. (D) Frequency of selected variables on day 28pso (bars show mean with SEM). Mann-844
Whitney test (p<0.05). (E) Neutralisation assay against wild-type SARS-CoV2 (Victoria), and two novel 845
variants (B1.1.7 and B1.351) between high and low responders on two timepoints (one and 6 months 846
pso). Plots show mean with SEM. Kruskal-Wallis, with Dunn’s multiple comparison test (p<0.05) was 847
performed. 848
849
850
23
References 851
1. Berlin DA, Gulick RM, Martinez FJ. Severe Covid-19. N Engl J Med, (2020). 852
853
2. Eyre DW, Lumley SF, O'Donnell D, Campbell M, Sims E, Lawson E, . . . Walker TM. 854
Differential occupational risks to healthcare workers from SARS-CoV-2 observed during a 855
prospective observational study. eLife 9, e60675 (2020). 856
857
3. Fan VS, Dominitz JA, Eastment MC, Locke E, Green P, Berry K, . . . Ioannou GN. Risk 858
Factors for testing positive for SARS-CoV-2 in a national US healthcare system. Clin Infect 859
Dis, (2020). 860
861
4. Peng Y, Mentzer AJ, Liu G, Yao X, Yin Z, Dong D, . . . Investigators IC. Broad and strong 862
memory CD4+ and CD8+ T cells induced by SARS-CoV-2 in UK convalescent individuals 863
following COVID-19. Nat Immunol 21, 1336-1345 (2020). 864
865
5. Ogbe A, Kronsteiner B, Skelly DT, Pace M, Brown A, Adland E, . . . Oxford Protective TCIfC-866
CT. T cell assays differentiate clinical and subclinical SARS-CoV-2 infections from cross-867
reactive antiviral responses. Nature Communications 12, 2055 (2021). 868
869
6. Wang Z, Yang X, Zhong J, Zhou Y, Tang Z, Zhou H, . . . Ran P. Exposure to SARS-CoV-2 870
generates T-cell memory in the absence of a detectable viral infection. Nat Commun 12, 1724 871
(2021). 872
873
7. Reynolds CJ, Swadling L, Gibbons JM, Pade C, Jensen MP, Diniz MO, . . . Boyton RJ. 874
Discordant neutralizing antibody and T cell responses in asymptomatic and mild SARS-CoV-2 875
infection. Sci Immunol 5, (2020). 876
877
8. Reuters. https://www.reuters.com/business/healthcare-pharmaceuticals/italy-give-just-one-878
covid-shot-some-patients-eu-struggles-with-inoculations-2021-03-04/ Accessed 13 June 879
2021. 880
881
9. Lumley SF, Wei J, O'Donnell D, Stoesser NE, Matthews PC, Howarth A, . . . Oxford 882
University Hospitals Staff Testing G. The duration, dynamics and determinants of SARS-CoV-883
2 antibody responses in individual healthcare workers. Clin Infect Dis, (2021). 884
885
10. Sagar M, Reifler K, Rossi M, Miller NS, Sinha P, White LF, Mizgerd JP. Recent endemic 886
coronavirus infection is associated with less-severe COVID-19. J Clin Invest 131, (2021). 887
888
11. Grifoni A, Weiskopf D, Ramirez SI, Mateus J, Dan JM, Moderbacher CR, . . . Sette A. Targets 889
of T Cell Responses to SARS-CoV-2 Coronavirus in Humans with COVID-19 Disease and 890
Unexposed Individuals. Cell 181, 1489-1501 e1415 (2020). 891
892
12. Dan JM, Mateus J, Kato Y, Hastie KM, Yu ED, Faliti CE, . . . Crotty S. Immunological memory 893
to SARS-CoV-2 assessed for up to 8 months after infection. Science, (2021). 894
895
13. Ansari A, Arya R, Sachan S, Jha SN, Kalia A, Lall A, . . . Gupta N. Immune Memory in Mild 896
COVID-19 Patients and Unexposed Donors Reveals Persistent T Cell Responses After 897
SARS-CoV-2 Infection. Front Immunol 12, 636768-636768 (2021). 898
899
14. Cromer D, Juno JA, Khoury D, Reynaldi A, Wheatley AK, Kent SJ, Davenport MP. Prospects 900
for durable immune control of SARS-CoV-2 and prevention of reinfection. Nature reviews 901
Immunology 21, 395-404 (2021). 902
903
15. Wheatley AK, Juno JA, Wang JJ, Selva KJ, Reynaldi A, Tan H-X, . . . Kent SJ. Evolution of 904
immune responses to SARS-CoV-2 in mild-moderate COVID-19. Nature communications 12, 905
1162-1162 (2021). 906
907
16. Zuo J, Dowell AC, Pearce H, Verma K, Long HM, Begum J, . . . Moss P. Robust SARS-CoV-908
2-specific T cell immunity is maintained at 6 months following primary infection. Nat Immunol 909
22, 620-626 (2021). 910
24
911
17. Galanti M, Shaman J. Direct observation of repeated infections with endemic coronaviruses. 912
The Journal of Infectious Diseases, (2020). 913
914
18. Kiyuka PK, Agoti CN, Munywoki PK, Njeru R, Bett A, Otieno JR, . . . Cotten M. Human 915
Coronavirus NL63 Molecular Epidemiology and Evolutionary Patterns in Rural Coastal Kenya. 916
The Journal of infectious diseases 217, 1728-1739 (2018). 917
918
19. Davies NG, Abbott S, Barnard RC, Jarvis CI, Kucharski AJ, Munday JD, . . . Edmunds WJ. 919
Estimated transmissibility and impact of SARS-CoV-2 lineage B.1.1.7 in England. Science 920
372, (2021). 921
922
20. Supasa P, Zhou D, Dejnirattisai W, Liu C, Mentzer AJ, Ginn HM, . . . Screaton GR. Reduced 923
neutralization of SARS-CoV-2 B.1.1.7 variant by convalescent and vaccine sera. Cell, 924
(2021). 925
926
21. Davies NG, Jarvis CI, Group CC-W, Edmunds WJ, Jewell NP, Diaz-Ordaz K, Keogh RH. 927
Increased mortality in community-tested cases of SARS-CoV-2 lineage B.1.1.7. Nature 593, 928
270-274 (2021). 929
930
22. Zhou D, Dejnirattisai W, Supasa P, Liu C, Mentzer AJ, Ginn HM, . . . Screaton GR. Evidence 931
of escape of SARS-CoV-2 variant B.1.351 from natural and vaccine-induced sera. Cell 184, 932
2348-2361 e2346 (2021). 933
934
23. Tegally H, Wilkinson E, Giovanetti M, Iranzadeh A, Fonseca V, Giandhari J, . . . de Oliveira T. 935
Detection of a SARS-CoV-2 variant of concern in South Africa. Nature 592, 438-443 (2021). 936
937
24. Faria NR, Mellan TA, Whittaker C, Claro IM, Candido DDS, Mishra S, . . . Sabino EC. 938
Genomics and epidemiology of the P.1 SARS-CoV-2 lineage in Manaus, Brazil. Science 372, 939
815-821 (2021). 940
941
25. Dejnirattisai W, Zhou D, Supasa P, Liu C, Mentzer AJ, Ginn HM, . . . Screaton GR. Antibody 942
evasion by the P.1 strain of SARS-CoV-2. Cell. 943
944
26. Planas D, Veyer D, Baidaliuk A, Staropoli I, Guivel-Benhassine F, Rajah MM, . . . Schwartz O. 945
Reduced sensitivity of infectious SARS-CoV-2 variant B.1.617.2 to monoclonal antibodies 946
and sera from convalescent and vaccinated individuals. bioRxiv, 2021.2005.2026.445838 947
(2021). 948
949
27. Skelly DT, Harding AC, Gilbert-Jaramillo J, Knight ML, Longet S, Brown A, . . . James W, S,. 950
Two doses of SARS-CoV-2 vaccination induce more robust immune responses to emerging 951
SARS-CoV-2 variants of concern than does natural infection. Research Square, (2021). 952
953
28. Tomic A, Tomic I, Rosenberg-Hasson Y, Dekker CL, Maecker HT, Davis MM. SIMON, an 954
Automated Machine Learning System, Reveals Immune Signatures of Influenza Vaccine 955
Responses. Journal of immunology (Baltimore, Md : 1950) 203, 749-759 (2019). 956
957
29. Tomic A, Tomic I, Waldron L, Geistlinger L, Kuhn M, Spreng RL, . . . Davis MM. SIMON: 958
Open-Source Knowledge Discovery Platform. Patterns (New York, NY) 2, 100178-100178 959
(2021). 960
961
30. Folegatti PM, Ewer KJ, Aley PK, Angus B, Becker S, Belij-Rammerstorfer S, . . . Oxford 962
CVTG. Safety and immunogenicity of the ChAdOx1 nCoV-19 vaccine against SARS-CoV-2: a 963
preliminary report of a phase 1/2, single-blind, randomised controlled trial. Lancet 396, 467-964
478 (2020). 965
966
31. Barrett JR, Belij-Rammerstorfer S, Dold C, Ewer KJ, Folegatti PM, Gilbride C, . . . Oxford 967
CVTG. Phase 1/2 trial of SARS-CoV-2 vaccine ChAdOx1 nCoV-19 with a booster dose 968
induces multifunctional antibody responses. Nat Med 27, 279-288 (2021). 969
970
25
32. Frey A, Di Canzio J, Zurakowski D. A statistically defined endpoint titer determination method 971
for immunoassays. J Immunol Methods 221, 35-41 (1998). 972
973
33. Wickham H. ggplot2: Elegant Graphics for Data Analysis. Springer-Verlag New York (2016). 974
975
34. Wood S, Scheipl F. gamm4: Generalized Additive Mixed Models using 'mgcv' and 'lme4'. R 976
package version 0.2-6.) (2020). 977
978
35. Lumley SF, O'Donnell D, Stoesser NE, Matthews PC, Howarth A, Hatch SB, . . . Oxford 979
University Hospitals Staff Testing G. Antibody Status and Incidence of SARS-CoV-2 Infection 980
in Health Care Workers. N Engl J Med, (2020). 981
982
36. Mathieu E, Ritchie H, Ortiz-Ospina E, Roser M, Hasell J, Appel C, . . . Rodés-Guirao L. A 983
global database of COVID-19 vaccinations. Nature Human Behaviour, (2021). 984
985
37. Krammer F, Srivastava K, Alshammary H, Amoako AA, Awawda MH, Beach KF, . . . Simon 986
V. Antibody Responses in Seropositive Persons after a Single Dose of SARS-CoV-2 mRNA 987
Vaccine. N Engl J Med 384, 1372-1374 (2021). 988
989
38. Prendecki M, Clarke C, Brown J, Cox A, Gleeson S, Guckian M, . . . Willicombe M. Effect of 990
previous SARS-CoV-2 infection on humoral and T-cell responses to single-dose BNT162b2 991
vaccine. Lancet 397, 1178-1181 (2021). 992
993
39. Röltgen K, Powell AE, Wirz OF, Stevens BA, Hogan CA, Najeeb J, . . . Boyd SD. Defining the 994
features and duration of antibody responses to SARS-CoV-2 infection associated with 995
disease severity and outcome. Science Immunology 5, eabe0240 (2020). 996
997
40. Wajnberg A, Amanat F, Firpo A, Altman DR, Bailey MJ, Mansour M, . . . Cordon-Cardo C. 998
Robust neutralizing antibodies to SARS-CoV-2 infection persist for months. Science 370, 999
1227 (2020). 1000
1001
41. Lumley SF, Wei J, O'Donnell D, Stoesser NE, Matthews PC, Howarth A, . . . Oxford 1002
University Hospitals Staff Testing G. The duration, dynamics and determinants of SARS-CoV-1003
2 antibody responses in individual healthcare workers. Clinical infectious diseases : an official 1004
publication of the Infectious Diseases Society of America, ciab004 (2021). 1005
1006
42. Klingler J, Weiss S, Itri V, Liu X, Oguntuyo KY, Stevens C, . . . Hioe CE. Role of 1007
Immunoglobulin M and A Antibodies in the Neutralization of Severe Acute Respiratory 1008
Syndrome Coronavirus 2. The Journal of infectious diseases 223, 957-970 (2021). 1009
1010
43. Sterlin D, Mathian A, Miyara M, Mohr A, Anna F, Claër L, . . . Gorochov G. IgA dominates the 1011
early neutralizing antibody response to SARS-CoV-2. Sci Transl Med 13, eabd2223 (2021). 1012
1013
44. Atyeo C, Fischinger S, Zohar T, Slein MD, Burke J, Loos C, . . . Alter G. Distinct Early 1014
Serological Signatures Track with SARS-CoV-2 Survival. Immunity 53, 524-532 e524 (2020). 1015
1016
45. Zohar T, Loos C, Fischinger S, Atyeo C, Wang C, Slein MD, . . . Alter G. Compromised 1017
Humoral Functional Evolution Tracks with SARS-CoV-2 Mortality. Cell 183, 1508-1519 e1512 1018
(2020). 1019
1020
46. McMahan K, Yu J, Mercado NB, Loos C, Tostanoski LH, Chandrashekar A, . . . Barouch DH. 1021
Correlates of protection against SARS-CoV-2 in rhesus macaques. Nature 590, 630-634 1022
(2021). 1023
1024
47. Gorman MJ, Patel N, Guebre-Xabier M, Zhu A, Atyeo C, Pullen KM, . . . Alter G. 1025
Collaboration between the Fab and Fc contribute to maximal protection against SARS-CoV-2 1026
in nonhuman primates following NVX-CoV2373 subunit vaccine with Matrix-M vaccination. 1027
bioRxiv, (2021). 1028
1029

26
48. Kaplonek P, Fischinger S, Cizmeci D, Bartsch Y, Kang J, Burke J, . . . Alter G. Resilient Fc-1030
Effector Functions Across SARS-CoV-2 Variants of Concern Following mRNA-1273 1031
Vaccination.). SSRN 10.2139/ssrn.3832979 (2021). 1032
1033
49. Reynolds CJ, Swadling L, Gibbons JM, Pade C, Jensen MP, Diniz MO, . . . Boyton RJ. 1034
Discordant neutralizing antibody and T cell responses in asymptomatic and mild SARS-CoV-2 1035
infection. Science Immunology 5, eabf3698 (2020). 1036
1037
50. Zuo J, Dowell AC, Pearce H, Verma K, Long HM, Begum J, . . . Moss P. Robust SARS-CoV-1038
2-specific T cell immunity is maintained at 6 months following primary infection. Nature 1039
Immunology, (2021). 1040
1041
51. Ahlers JD, Belyakov IM. Memories that last forever: strategies for optimizing vaccine T-cell 1042
memory. Blood 115, 1678-1689 (2010). 1043
1044
52. Sallusto F, Lanzavecchia A, Araki K, Ahmed R. From vaccines to memory and back. 1045
Immunity 33, 451-463 (2010). 1046
1047
53. Wellinghausen N, Plonné D, Voss M, Ivanova R, Frodl R, Deininger S. SARS-CoV-2-IgG 1048
response is different in COVID-19 outpatients and asymptomatic contact persons. J Clin Virol 1049
130, 104542 (2020). 1050
1051
54. Lynch KL, Whitman JD, Lacanienta NP, Beckerdite EW, Kastner SA, Shy BR, . . . Wu AHB. 1052
Magnitude and Kinetics of Anti-Severe Acute Respiratory Syndrome Coronavirus 2 Antibody 1053
Responses and Their Relationship to Disease Severity. Clinical infectious diseases : an 1054
official publication of the Infectious Diseases Society of America 72, 301-308 (2021). 1055
1056
55. Zhao Y, Zhang YH, Denney L, Young D, Powell TJ, Peng YC, . . . Dong T. High levels of 1057
virus-specific CD4+ T cells predict severe pandemic influenza A virus infection. Am J Respir 1058
Crit Care Med 186, 1292-1297 (2012). 1059
1060
56. Le Bert N, Clapham HE, Tan AT, Chia WN, Tham CYL, Lim JM, . . . Tam CC. Highly 1061
functional virus-specific cellular immune response in asymptomatic SARS-CoV-2 infection. J 1062
Exp Med 218, (2021). 1063
1064
57. Vasileiou E, Simpson CR, Shi T, Kerr S, Agrawal U, Akbari A, . . . Sheikh A. Interim findings 1065
from first-dose mass COVID-19 vaccination roll-out and COVID-19 hospital admissions in 1066
Scotland: a national prospective cohort study. Lancet (London, England) 397, 1646-1657 1067
(2021). 1068
1069
58. Lopez Bernal J, Andrews N, Gower C, Robertson C, Stowe J, Tessier E, . . . Ramsay M. 1070
Effectiveness of the Pfizer-BioNTech and Oxford-AstraZeneca vaccines on covid-19 related 1071
symptoms, hospital admissions, and mortality in older adults in England: test negative case-1072
control study. BMJ 373, n1088 (2021). 1073
1074
59. Sadoff J, Gray G, Vandebosch A, Cárdenas V, Shukarev G, Grinsztejn B, . . . Douoguih M. 1075
Safety and Efficacy of Single-Dose Ad26.COV2.S Vaccine against Covid-19. N Engl J Med 1076
384, 2187-2201 (2021). 1077
1078
60. Fischer RJ, van Doremalen N, Adney DR, Yinda CK, Port JR, Holbrook MG, . . . Munster VJ. 1079
ChAdOx1 nCoV-19 (AZD1222) protects hamsters against SARS-CoV-2 B.1.351 and B.1.1.7 1080
disease. Preprint at https://doi.org/10.1101/2021.03.11.435000 (2021). 1081
1082
1083
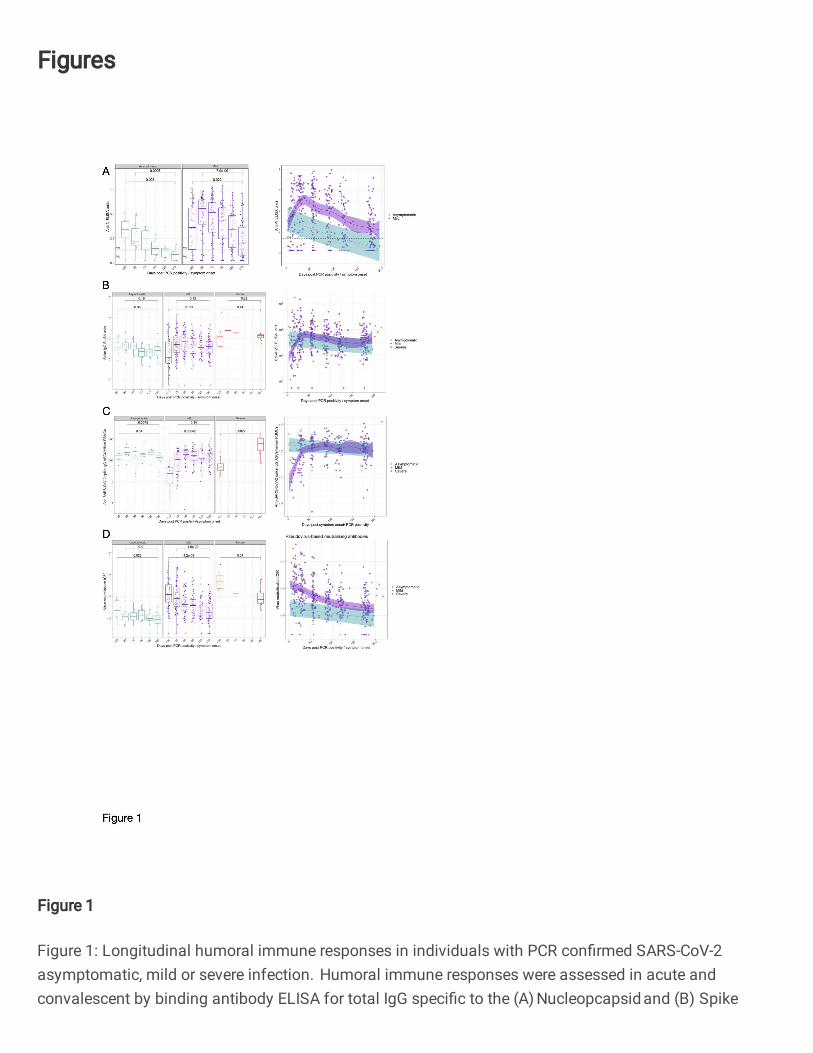
Figures
Figure 1
Figure 1: Longitudinal humoral immune responses in individuals with PCR con�rmed SARS-CoV-2asymptomatic, mild or severe infection. Humoral immune responses were assessed in acute andconvalescent by binding antibody ELISA for total IgG speci�c to the (A) Nucleopcapsid and (B) Spike
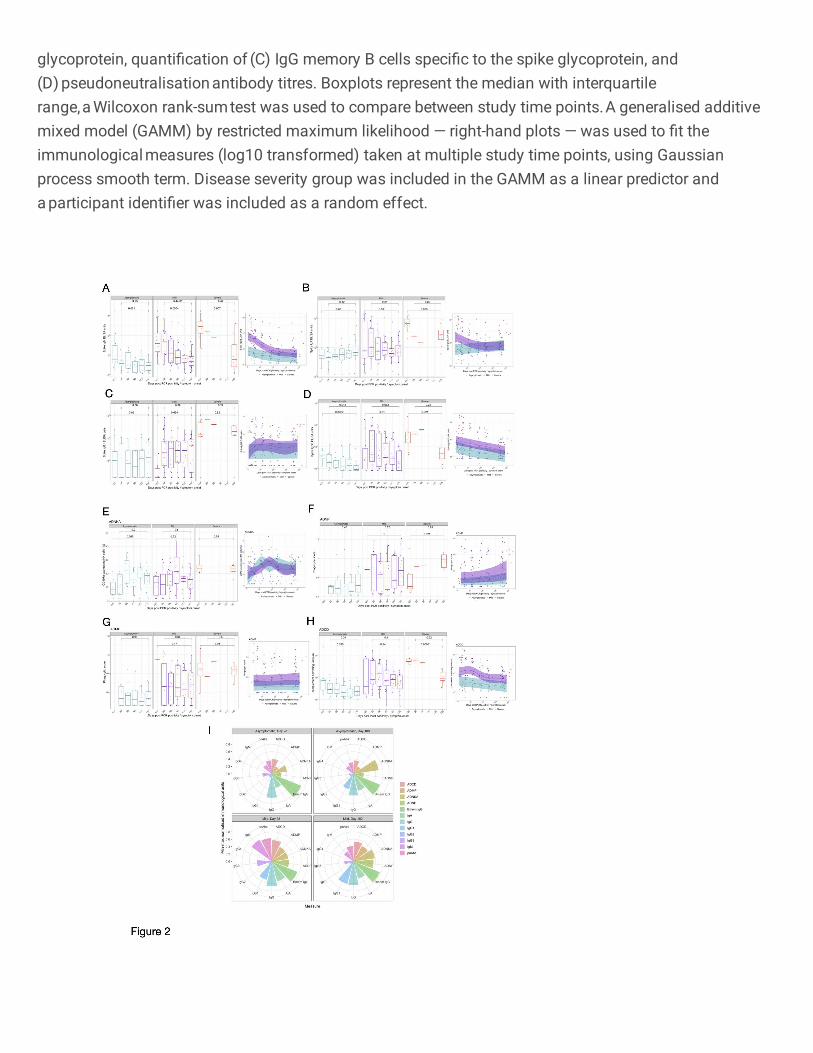
glycoprotein, quanti�cation of (C) IgG memory B cells speci�c to the spike glycoprotein, and(D) pseudoneutralisation antibody titres. Boxplots represent the median with interquartilerange, a Wilcoxon rank-sum test was used to compare between study time points. A generalised additivemixed model (GAMM) by restricted maximum likelihood — right-hand plots — was used to �t theimmunological measures (log10 transformed) taken at multiple study time points, using Gaussianprocess smooth term. Disease severity group was included in the GAMM as a linear predictor anda participant identi�er was included as a random effect.
Figure 2
Figure 2: Antibody isotype, subclass and function in individuals with PCR con�rmed SARS-CoV-2asymptomatic, mild or severe infection. SARS-CoV-2 spike-speci�c antibody isotype and subclassesmeasured post-infection: (A) IgM, (B) IgA, (C) IgG1 and (D) IgG3. Antibody function measure post-SARS-CoV-2 infection: (E) antibody-dependent NK cell activation (ADNKA), (F) antibody-dependent neutrophilphagocytosis (ADNP), (G) antibody-dependent monocyte phagocytosis (ADMP) and (H) antibody-dependent complement deposition (ADCD). (I) Polar plot of various antibody isotype, subclass andfunction data, minimum-maximum normalised. Boxplots represent the median with interquartile range, a Wilcoxon rank-sum test was used to compare between study time points. A generalised additive mixedmodel (GAMM) by restricted maximum likelihood — right-hand plots — was used to �t theimmunological measures (log10 transformed) taken at multiple study time points, using Gaussianprocess smooth term. Disease severity group was included in the GAMM as a linear predictor anda participant identi�er was included as a random effect.
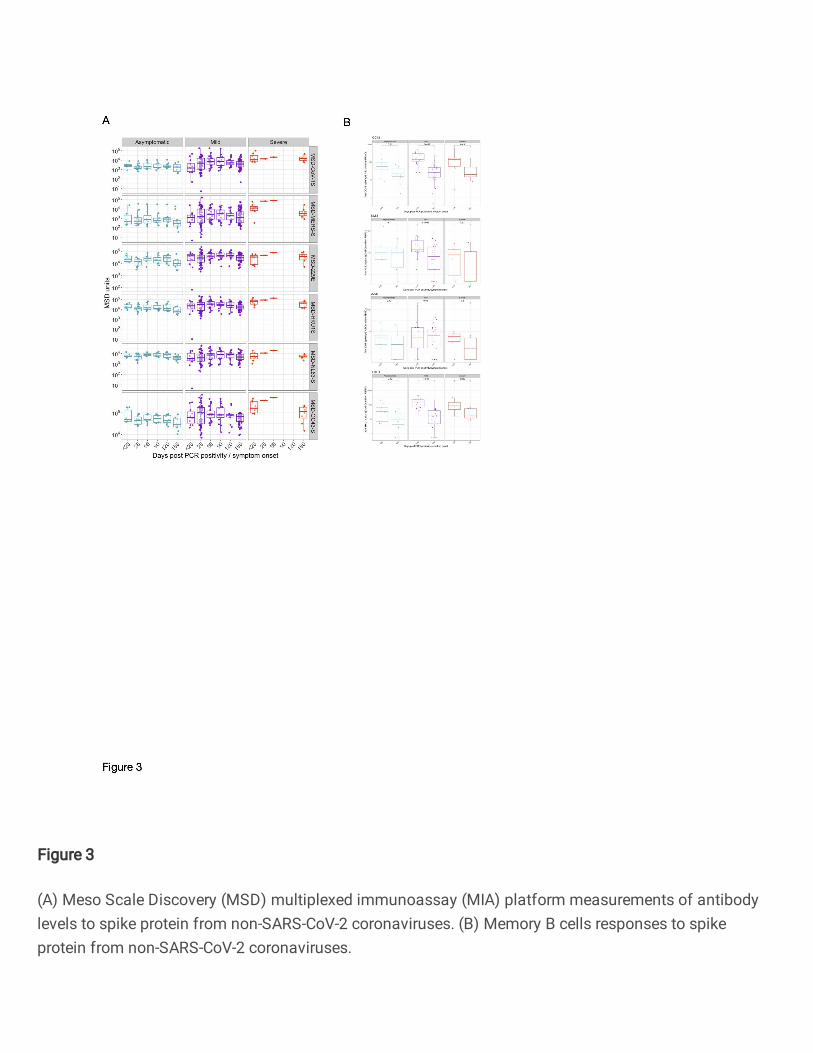
Figure 3
(A) Meso Scale Discovery (MSD) multiplexed immunoassay (MIA) platform measurements of antibodylevels to spike protein from non-SARS-CoV-2 coronaviruses. (B) Memory B cells responses to spikeprotein from non-SARS-CoV-2 coronaviruses.
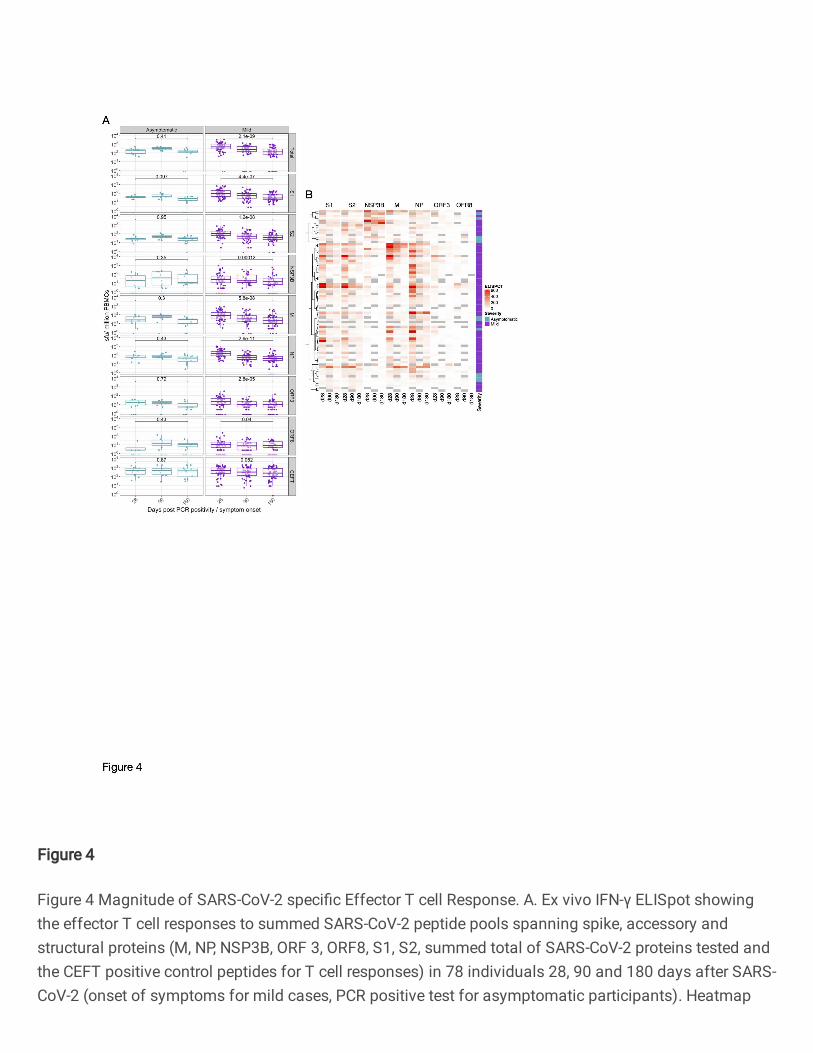
Figure 4
Figure 4 Magnitude of SARS-CoV-2 speci�c Effector T cell Response. A. Ex vivo IFN-γ ELISpot showingthe effector T cell responses to summed SARS-CoV-2 peptide pools spanning spike, accessory andstructural proteins (M, NP, NSP3B, ORF 3, ORF8, S1, S2, summed total of SARS-CoV-2 proteins tested andthe CEFT positive control peptides for T cell responses) in 78 individuals 28, 90 and 180 days after SARS-CoV-2 (onset of symptoms for mild cases, PCR positive test for asymptomatic participants). Heatmap
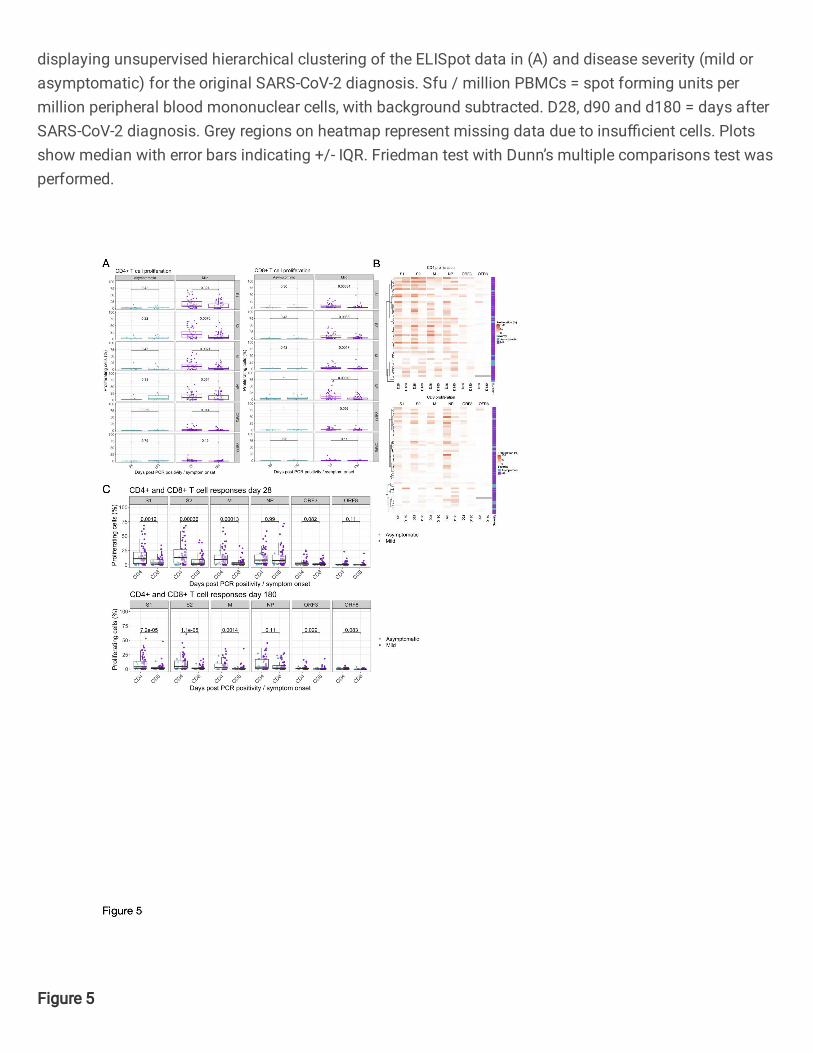
displaying unsupervised hierarchical clustering of the ELISpot data in (A) and disease severity (mild orasymptomatic) for the original SARS-CoV-2 diagnosis. Sfu / million PBMCs = spot forming units permillion peripheral blood mononuclear cells, with background subtracted. D28, d90 and d180 = days afterSARS-CoV-2 diagnosis. Grey regions on heatmap represent missing data due to insu�cient cells. Plotsshow median with error bars indicating +/- IQR. Friedman test with Dunn’s multiple comparisons test wasperformed.
Figure 5
Figure 5. Proliferative responses to SARS-CoV-2 peptide pools at 1- and 6-months post infectionProliferative responses against (A) SARS-CoV-2 proteins S1, S2, M, NP, ORF3 and ORF8 presented in CD4+(Left hand panel) and CD8+ (Right hand panel) T cells measured at 28 and 180 days pso for volunteerswith mild disease or days post PCR positivity for asymptomatic disease (asymptomatic n = 8, milddisease n = 49). Kruskal Wallis T test, all P values are all stated on plots. (B) shows unsupervisedhierarchical clustering showing visual representation of SARS-CoV-2 speci�c responses at day 28 and180 in both CD4+ and CD8+ T cell compartments and (C) comparative analysis of SARS-CoV-2 speci�cCD4+ and CD8+ T cell responses at day 28 (top panel) and day 180 (bottom panel) in both asymptomaticand mild groups (analysed as one group). Kruskal Wallis T test, all P values are all stated on plots.
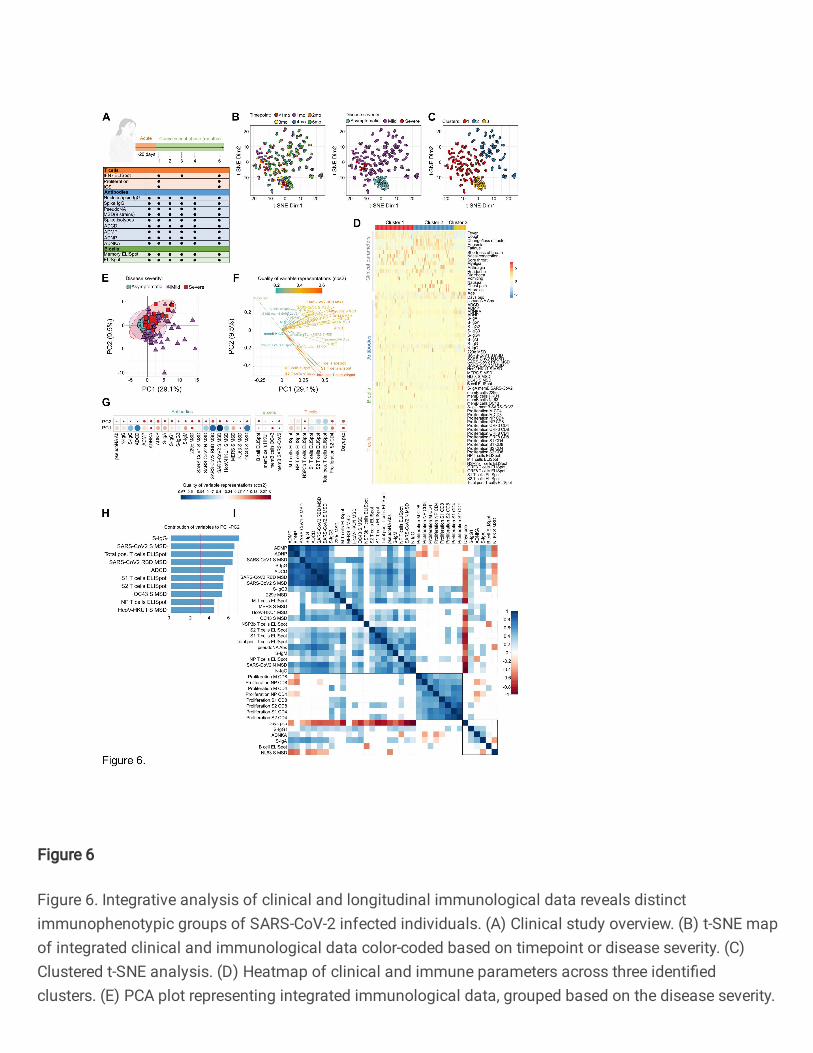
Figure 6
Figure 6. Integrative analysis of clinical and longitudinal immunological data reveals distinctimmunophenotypic groups of SARS-CoV-2 infected individuals. (A) Clinical study overview. (B) t-SNE mapof integrated clinical and immunological data color-coded based on timepoint or disease severity. (C)Clustered t-SNE analysis. (D) Heatmap of clinical and immune parameters across three identi�edclusters. (E) PCA plot representing integrated immunological data, grouped based on the disease severity.
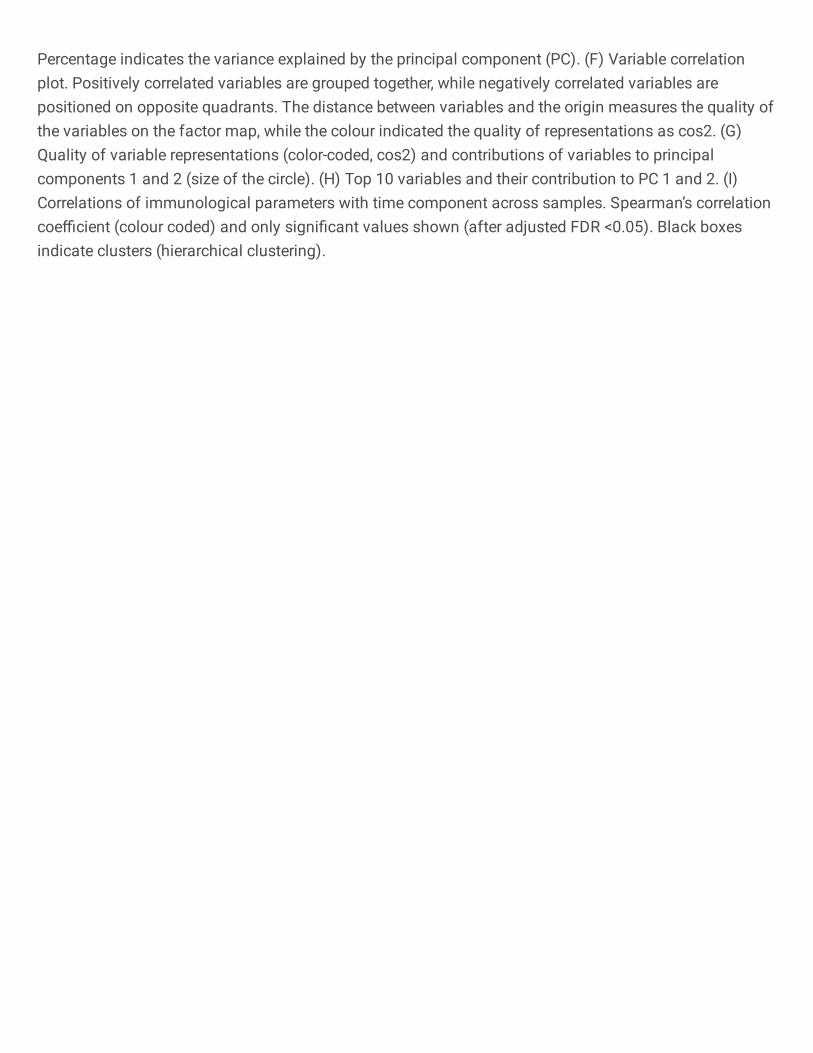
Percentage indicates the variance explained by the principal component (PC). (F) Variable correlationplot. Positively correlated variables are grouped together, while negatively correlated variables arepositioned on opposite quadrants. The distance between variables and the origin measures the quality ofthe variables on the factor map, while the colour indicated the quality of representations as cos2. (G)Quality of variable representations (color-coded, cos2) and contributions of variables to principalcomponents 1 and 2 (size of the circle). (H) Top 10 variables and their contribution to PC 1 and 2. (I)Correlations of immunological parameters with time component across samples. Spearman’s correlationcoe�cient (colour coded) and only signi�cant values shown (after adjusted FDR <0.05). Black boxesindicate clusters (hierarchical clustering).
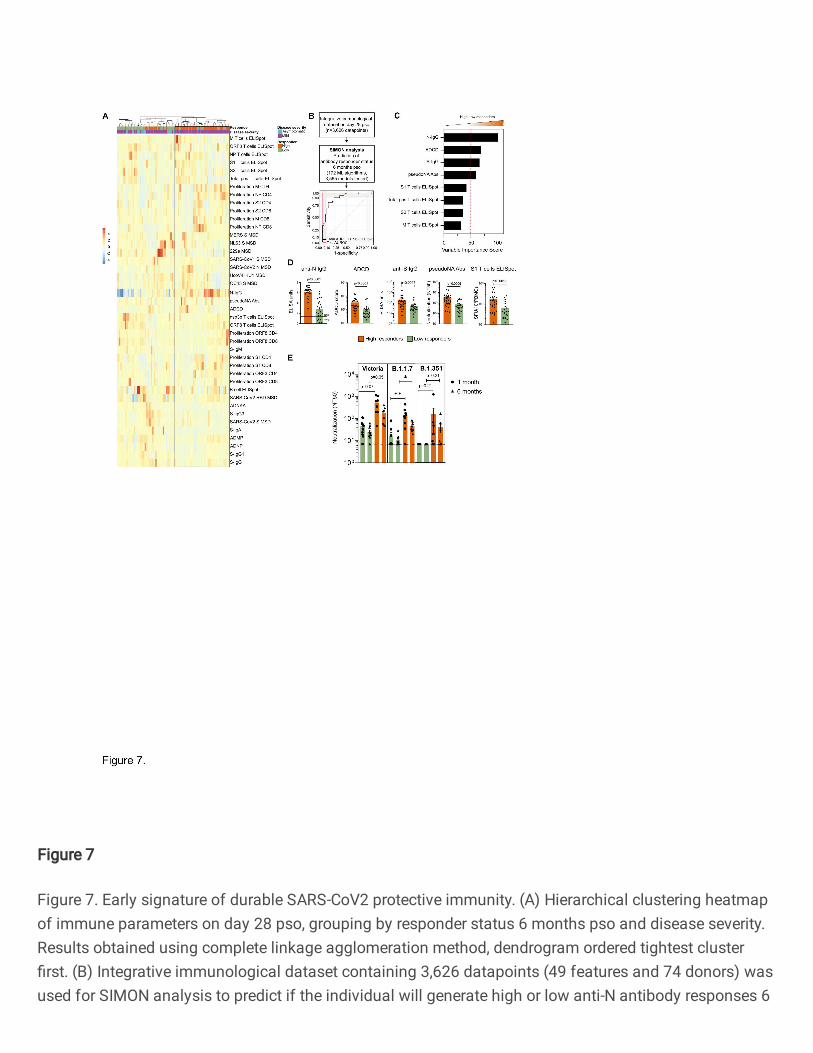
Figure 7
Figure 7. Early signature of durable SARS-CoV2 protective immunity. (A) Hierarchical clustering heatmapof immune parameters on day 28 pso, grouping by responder status 6 months pso and disease severity.Results obtained using complete linkage agglomeration method, dendrogram ordered tightest cluster�rst. (B) Integrative immunological dataset containing 3,626 datapoints (49 features and 74 donors) wasused for SIMON analysis to predict if the individual will generate high or low anti-N antibody responses 6
months pso. In total, 184 ML algorithms were tested and 2,556 model built. ROC plot of the bestperforming model built with the svmPoly algorithm. Train AUROC (black line) is determined using 10-foldcross-validation and test AUROC evaluated on the independent test set (25% of the initial dataset). (C)Top variables that contribute to the model and are increased in high relative to low responders. (D)Frequency of selected variables on day 28pso (bars show mean with SEM). Mann-Whitney test (p<0.05).(E) Neutralisation assay against wild-type SARS-CoV2 (Victoria), and two novel variants (B1.1.7 andB1.351) between high and low responders on two timepoints (one and 6 months pso). Plots show meanwith SEM. Kruskal-Wallis, with Dunn’s multiple comparison test (p<0.05) was performed.
Supplementary Files
This is a list of supplementary �les associated with this preprint. Click to download.
Supp�g1.tiff
Supp�g2.tiff
Supp�g3.tiff
Supp�g4.tiff
Supp�g5.tiff
AppendixSupplementaryFiguresandAdditionalMethods.pdf